Efficient Boiler Operations Sourcebook - The Best Friend International
Efficient Boiler Operations Sourcebook - The Best Friend International
Efficient Boiler Operations Sourcebook - The Best Friend International

Create successful ePaper yourself
Turn your PDF publications into a flip-book with our unique Google optimized e-Paper software.
cover next page ><br />
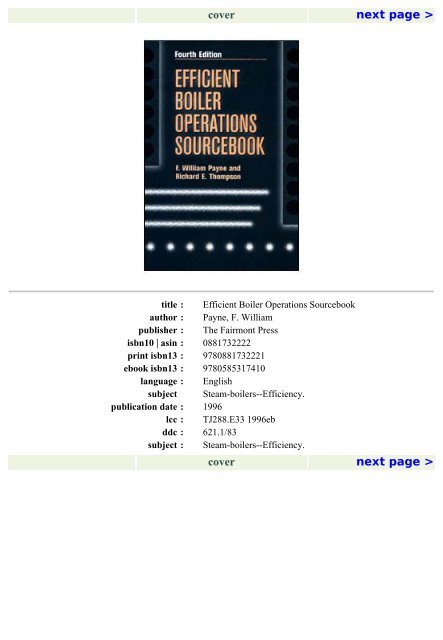
title : <strong>Efficient</strong> <strong>Boiler</strong> <strong>Operations</strong> <strong>Sourcebook</strong><br />
author : Payne, F. William<br />
publisher : <strong>The</strong> Fairmont Press<br />
isbn10 | asin : 0881732222<br />
print isbn13 : 9780881732221<br />
ebook isbn13 : 9780585317410<br />
language : English<br />
subject Steam-boilers--Efficiency.<br />
publication date : 1996<br />
lcc : TJ288.E33 1996eb<br />
ddc : 621.1/83<br />
subject : Steam-boilers--Efficiency.<br />
cover next page >
previous page page_vii next page ><br />
Contents<br />
Introduction xi<br />
Chapter 1<br />
<strong>Boiler</strong> Combustion Fundamentals<br />
Fuel Characteristics<br />
<strong>Boiler</strong> Configurations and Components<br />
Fuel Handling and Firing Systems<br />
Combustion Control Systems<br />
Chapter 2<br />
<strong>Boiler</strong> Efficiency Goals<br />
Chapter 3<br />
Major Factors Controlling <strong>Boiler</strong> Efficiency<br />
Waste Heat Losses in Stack Gases<br />
Losses Due to Incomplete Combustion<br />
<strong>Boiler</strong> Firing Rate<br />
Chapter 4<br />
<strong>Boiler</strong> Efficiency Calculations<br />
Calculation Methods<br />
Input-Output Methods<br />
Heat Loss Method<br />
ASME Computational Procedures<br />
Chapter 5<br />
Heat Loss Graphical Solutions<br />
Abbreviated Efficiency Improvement Determinations<br />
Chapter 6<br />
Preparation for <strong>Boiler</strong> Testing<br />
1<br />
3<br />
4<br />
12<br />
13<br />
20<br />
29<br />
30<br />
32<br />
39<br />
45<br />
45<br />
48<br />
48<br />
49<br />
55<br />
62<br />
67<br />
Page vii
Stack Instrumentation<br />
Stack Sampling Techniques<br />
Flame Appearance<br />
Chapter 7<br />
An Update and Overview of Flue Gas Measurement<br />
< previous page page_vii next page ><br />
67<br />
70<br />
70<br />
73
previous page page_viii next page ><br />
Chapter 8<br />
<strong>Boiler</strong> Test Procedures<br />
Burner Adjustments<br />
Chapter 9<br />
Efficiency-Related <strong>Boiler</strong> Maintenance Procedures<br />
Efficiency Spotcheck<br />
Establishing Performance<br />
Goals<br />
Performance Monitoring (<strong>Boiler</strong> Log)<br />
Periodic Equipment Inspection<br />
Performance<br />
Troubleshooting<br />
Performance Deficiency Costs<br />
Chapter 10<br />
<strong>Boiler</strong> Tune-Up<br />
<strong>Boiler</strong> Tube Cleanliness<br />
Determining Maintenance Requirements<br />
Special Maintenance Items<br />
Chapter 11<br />
<strong>Boiler</strong> Operational Modifications<br />
Reduced <strong>Boiler</strong> Steam Pressures<br />
Water Quality<br />
ControlBlowdown<br />
Chapter 12<br />
Effect of Water Side and Gas Side Scale Deposits<br />
Water Side Scale<br />
Gas Side Scale<br />
87<br />
92<br />
93<br />
94<br />
94<br />
95<br />
98<br />
98<br />
101<br />
105<br />
108<br />
109<br />
110<br />
113<br />
113<br />
114<br />
117<br />
118<br />
120<br />
Page viii
Chapter 13<br />
Load<br />
Management<br />
Fuel Conversions<br />
Chapter 14<br />
Auxiliary Equipment to Increase <strong>Boiler</strong> EfficiencyAir Preheaters and Economizers<br />
Air PreheatersOperating Principles<br />
Types of Air<br />
Preheaters<br />
Economizers<br />
Chapter 15<br />
Other Types of Auxiliary Equipment<br />
Firetube Turbulators<br />
< previous page page_viii next page ><br />
121<br />
123<br />
125<br />
125<br />
129<br />
137<br />
143<br />
143
previous page page_ix next page ><br />
Oil and Gas Burners and Supply Systems<br />
Water Side Waste Heat Recovery<br />
Wall and Soot Blowers<br />
Insulation<br />
Chapter 16<br />
Combustion Control Systems and Instrumentation<br />
M.J. Slevin<br />
Chapter 17<br />
<strong>Boiler</strong> O2 Trim Controls<br />
M.J. Slevin<br />
Chapter 18<br />
Steam Distribution System Efficiencies<br />
Harry Taplin, P.E.<br />
Chapter 19<br />
Should You Purchase a New <strong>Boiler</strong>?<br />
Chapter 20<br />
Financial Evaluation<br />
Procedures<br />
Performance Deficiency Costs<br />
First- and Second-Level Measures of Performance<br />
Marginal Analysis<br />
Chapter 21<br />
A Comprehensive "<strong>Boiler</strong> Tune-Up" (BTU) Program<br />
Steven A. Parker, P.E., CEM<br />
Chapter 22<br />
Case<br />
Studies<br />
Natural Gas Fuel<br />
Oil Fuel<br />
Pulverized Coal<br />
Stoker-Fired<br />
Coal<br />
145<br />
149<br />
155<br />
157<br />
165<br />
175<br />
187<br />
195<br />
199<br />
199<br />
200<br />
204<br />
207<br />
229<br />
229<br />
237<br />
237<br />
245<br />
Page ix
Chapter 23<br />
Tuning Large Industrial <strong>Boiler</strong>s<br />
Large <strong>Boiler</strong> Characteristics<br />
Importance of Diagnostic Testing<br />
Fuel Storage, Handling and<br />
Preparation<br />
< previous page page_ix next page ><br />
251<br />
251<br />
252<br />
254
previous page page_x next page ><br />
Non-Optimum Excess Air Levels<br />
Combustion Uniformity<br />
Synopsis of Diagnostic Techniques<br />
Chapter 24<br />
Large Industrial <strong>Boiler</strong> NOx Control<br />
Regulatory Driving Forces<br />
NOx Control Options<br />
Appendix A<br />
Combustion-Generated Air Pollutants<br />
Appendix B<br />
Conversion Factors<br />
Index 305<br />
258<br />
263<br />
270<br />
275<br />
275<br />
276<br />
293<br />
301<br />
Page x<br />
< previous page page_x next page >
previous page page_xi next page ><br />
Introduction<br />
<strong>The</strong> fourth edition of <strong>Efficient</strong> <strong>Boiler</strong> <strong>Operations</strong> <strong>Sourcebook</strong> includes two new chaptersTuning Large<br />
Industrial <strong>Boiler</strong>s and Large Industrial <strong>Boiler</strong> NOx Control. <strong>The</strong>se two chapters were added to<br />
address the complexities of tuning large boilers with multiple burners and more sophisticated<br />
combustion controls. Because NOx emissions control is a significant concern on large industrial<br />
boilers, a chapter was included summarizing the latest in NOx control options available for these<br />
boilers. See Chapters 23 and 24.<br />
Page xi<br />
<strong>The</strong> fourth edition of the <strong>Efficient</strong> <strong>Boiler</strong> <strong>Operations</strong> <strong>Sourcebook</strong> remains an applications-oriented book,<br />
written to help boiler operators and supervisory personnel improve boiler efficiencies in their plants.<br />
<strong>The</strong>oretical material has been kept to a minimum. <strong>The</strong> book concentrates on the three principal<br />
fuelsnatural gas, oil, and coal.<br />
One set of parameters should be noted. An "Industrial boiler," as defined in this book, includes all<br />
boilers with 10,000 to 500,000 lb/hr steam flow capacity (107 to 5 × 10⁸ heat output capacity) used in<br />
either commercial or industrial applications to generate process steam. Utility boilers and marine<br />
boilers are excluded.<br />
Several other contributors warrant special recognition for their help in developing this book:<br />
Harry Taplin, P.E., president of Crystal Energy Corporation in Thousand Oaks, California, authored<br />
Chapter 18Steam Distribution System Efficiencies.<br />
Chapter 21 discusses a comprehensive "<strong>Boiler</strong> Tune-Up" (BTU) program developed at Oklahoma<br />
State University, and directed by Wayne C. Turner, Ph.D., P.E., CEM and Steven A. Parker, P.E.,<br />
CEM. <strong>The</strong> BTU program covers boilers and related management programs including steam<br />
management. Emphasis in this chapter, as throughout the book, is on proven technologies with<br />
economic feasibility.<br />
< previous page page_xi next page >
previous page page_xii next page ><br />
Timothy Jones, product manager for <strong>The</strong>rmox Instruments Division of Ametek, Inc., contributed<br />
Chapter 7 updating flue gas measurement techniques.<br />
Mike Slevin, president of the Energy Technology and Control Corporation in Reston, Virginia,<br />
authored Chapter 16, "Combustion Control Systems and Instrumentation," and the chapter which<br />
follows it, "<strong>Boiler</strong> O2 Trim Controls."<br />
Page xii<br />
<strong>Efficient</strong> <strong>Boiler</strong> <strong>Operations</strong> <strong>Sourcebook</strong>, fourth edition, includes material originally prepared for the U.S.<br />
Department of Energy under D.O.E. contracts C-04-50085 and EC-77-C-01-8675.<br />
RICHARD E. THOMPSON<br />
< previous page page_xii next page >
previous page page_1 next page ><br />
1<br />
<strong>Boiler</strong> Combustion Fundamentals<br />
Page 1<br />
Combustion is the complex process of releasing chemically bound heat energy in the fuel through the<br />
exothermic reaction of carbon and hydrogen with oxygen to produce carbon dioxide (CO2) and water<br />
vapor (H2O). In real combustion systems, secondary combustion products such as NOx, SOx, CO and<br />
solid particles as well as unburned fuel are released due to the complex make-up of the fuel and<br />
incomplete combustion.<br />
While certain gaseous constituents such as NOx and SOx exist only in trace quantities (parts per<br />
million, ppm) and are considered important only as air pollutants, other exhaust products such as CO<br />
and unburned fuel represent a waste of available heat and are important from an efficiency standpoint.<br />
Combustion Air<br />
Air consists of 21% oxygen (O2) and 78% nitrogen (N) and traces of argon and carbon dioxide. For all<br />
fuels under ideal burning conditions, there exists a ''theoretical amount" of air that will completely<br />
burn the fuel with no excess air remaining.<br />
For conventional burners, a quantity of "excess air" above the theoretical amount is required. <strong>The</strong><br />
quantity of excess air is dependent on several parameters including boiler type, fuel properties and<br />
burner characteristics. <strong>The</strong> quantity of excess air is generally determined by measurements of specific<br />
gases (CO2 and O2) in the stack and their relation to percent excess air for a particular fuel. <strong>The</strong>se<br />
relationships are shown in Figure 1-1.<br />
< previous page page_1 next page >
previous page page_2 next page ><br />
Figure 1-1<br />
Relationship between boiler excess air and stack gas concentrations of excess<br />
oxygen (O2) and carbon dioxide (CO2) for typical fuel compositions.<br />
<strong>The</strong> measurement of excess O2 is generally preferred over CO2 for the following reasons:<br />
• <strong>The</strong> relation of O2 to excess air is relatively invarient with fuel composition whereas CO2 relations<br />
are fuel dependent.<br />
• CO2 measurements require more precision than excess O2 measures to obtain the same accuracy.<br />
• Excess O2 is more associated with excess air, i.e., as excess air goes to zero, excess O2 follows.<br />
Page 2<br />
< previous page page_2 next page >
previous page page_3 next page ><br />
• Excess O2 instrumentation is generally less expensive and more reliable.<br />
Stack gas excess air need not reflect combustion conditions at the burners due to air or fuel<br />
maldistribution in multiburner systems or air introduction at other portions of the unit.<br />
Fuel Characteristics<br />
<strong>The</strong>re are significant differences between the firing system and burning characteristics of the<br />
conventional fuels currently in use. Natural gas requires little fuel preparation, mixes readily with the<br />
combustion air supply and burns with a low luminous flame. Its simple handling and firing<br />
characteristics, and maintenance characteristics have made natural gas the primary industrial fuel in<br />
many sections of the country.<br />
Oil fuels require atomization prior to vaporization and mixing with the combustion air supply. <strong>The</strong><br />
grade of oil (#2 through #6) determines the extent of pretreatment (heating and screening) to achieve<br />
proper conditions at the burner atomizer. Mechanical steam and air atomizer systems are used. Oil<br />
burns with a bright, luminous flame.<br />
Coal combustion is the most complex of the conventional fuels. Coal firing can be separated into two<br />
broad classes: suspension firing and grate firing. <strong>The</strong> grate properties of coal significantly influence<br />
the burner and furnace design, coal handling and preparation equipment, ash disposal methods and<br />
the type of precipitator or dust collector installed.<br />
Majority of smaller units (less than 200,000 lbs per hour) are stoker (or grate) fired. Properties of the<br />
coal that influence grate design and bed burning include coal fineness, moisture and friability. Larger<br />
units utilize suspension firing of pulverized coal with coal grindability and moisture content as<br />
important indicators of fuel-bed clinkering and furnace wall slagging.<br />
Page 3<br />
Fuel analyses of various conventional industrial fuels are given in Table 1-1. <strong>The</strong>se will be used in later<br />
efficiency calculations.<br />
< previous page page_3 next page >
previous page page_4 next page ><br />
<strong>Boiler</strong> Configurations and Components<br />
Industrial boiler designs are influenced by fuel characteristics and firing method, steam demand,<br />
steam pressures, firing characteristics and the individual manufacturers. Industrial boilers can be<br />
classified as either firetube or watertube indicating the relative position of the hot combustion gases<br />
with respect to the fluid being heated.<br />
Firetube <strong>Boiler</strong>s<br />
Firetube units pass the hot products of combustion through tubes submerged in the boiler water. A<br />
typical firetube arrangement is illustrated in Figure 1-2.<br />
Conventional units generally employ from 2 to 4 passes as shown in Figure 1-3 to increase the surface<br />
area exposed to the hot gases and thereby increase efficiency. Multiple passes, however, require<br />
greater fan power, increased boiler complexity and larger shell dimensions.<br />
Maximum capacity of firetube units has been extended to 69,000 lbs of steam per hour (2,000 boiler<br />
hp) with operating pressures up to 300 psig design pressure.<br />
Advantages of firetube units include:<br />
ability to meet wide and sudden load fluctuations with only slight pressure changes<br />
low initial costs and maintenance<br />
simple foundation and installation procedures.<br />
Watertube <strong>Boiler</strong>s<br />
Page 4<br />
Watertube units circulate the boiler water inside the tubes and the flue gases outside. Typical boiler<br />
configurations and general flue gas flow patterns through these units are given in Figures 1-4 and 1-5.<br />
Water circulation is generally provided by the density variation between cold feed water and the hot<br />
water/steam mixture in the riser as illustrated in Figure 1-6.<br />
< previous page page_4 next page >
previous page page_5 next page ><br />
Bituminous Coal<br />
TABLE 1-1. Fuel Analyses<br />
% by Wt As Fired Ult. Analys. Heating Value <strong>The</strong>oretical Air<br />
Fuel (Source) Carbon Hydrogen Oxygen Nitrogen Sulfur Ash Moisture Btu/lb lb/10,000 Btu<br />
(Western Kentucky)<br />
(West Virginia)<br />
Subbituminous Coal<br />
(Wyoming)<br />
(Colorado)<br />
71.4<br />
76.2<br />
56.8<br />
57.6<br />
#2 Oil 87.0<br />
#6 Oil 86.6<br />
Natural Gas (So. Calif.) 74.7<br />
Natural Gas (Pittsburgh) 75.3<br />
5.0 7.8<br />
4.7 3.8<br />
4.1 11.9<br />
3.2 11.2<br />
11.9 0.6<br />
10.8 0.7<br />
23.3 1.2<br />
23.5<br />
1.3 2.8 7.3<br />
1.5 1.2 9.0<br />
0.9 0.8 3.9<br />
1.2 0.6 5.4<br />
4.5<br />
3.0<br />
21.5<br />
20.8<br />
12,975 7.51<br />
13,550 7.58<br />
9,901 7.56<br />
9,670 7.53<br />
0.5 19,410 7.27<br />
1.5 18,560 7.40<br />
0.8 22,904 7.18<br />
1.2 23,170 7.18<br />
< previous page page_5 next page ><br />
Page 5
previous page page_6 next page ><br />
Figure 1-2<br />
Sectional sketch of a horizontal-return tubular boiler.<br />
Figure 1-3<br />
Typical firetube boiler gas flow patterns.<br />
Page 6<br />
< previous page page_6 next page >
previous page page_7 next page ><br />
Page 7<br />
Watertube boilers may be subclassified into different groups by tube shape, by drum number and<br />
location and by capacity. Classifications are also made by tube configuration as illustrated in Figure 1-<br />
7. Another important determination is "field" versus "shop" erected units. Many engineers feel that<br />
shop assembled boilers can meet closer tolerance than field assembled units and therefore may be<br />
more efficient; however, this has not been fully substantiated.<br />
Watertube units range in size from as small as 1000 lbs of steam per hour to the giant utility boilers in<br />
the 1000 MW class. <strong>The</strong> largest industrial boilers are generally taken to be about 500,000 lbs of steam<br />
per hour.<br />
Important elements of a steam generator as illustrated in Figure 1-8 include the firing mechanism, the<br />
furnace water walls, the superheaters, convective regions, the economizer and air preheater and the<br />
associated ash and dust collectors.<br />
Figure 1-4<br />
Small inclined watertube boiler.<br />
< previous page page_7 next page >
previous page page_8 next page ><br />
Figure 1-5<br />
Bent tube watertube unit typical of industrial applications.<br />
Page 8<br />
< previous page page_8 next page >
previous page page_9 next page ><br />
Figure 1-6<br />
Water circulation pattern in a watertube boiler.<br />
Page 9<br />
< previous page page_9 next page >
previous page page_10 next page ><br />
Figure 1-7<br />
Classification of watertube boilers by basic tube arrangement.<br />
Page 10<br />
< previous page page_10 next page >
previous page page_11 next page ><br />
Figure 1.8<br />
Layout of the combustion system of an industrial boiler.<br />
Page 11<br />
< previous page page_11 next page >
previous page page_12 next page ><br />
Fuel Handling and Firing Systems<br />
Gas Fired<br />
Page 12<br />
Natural gas fuel is the simplest fuel to burn in that it requires little preparation and mixes readily with<br />
the combustion air supply.<br />
Industrial boilers generally use low-pressure burners operating at a pressure of 1/8 to 4 psi. Gas is<br />
generally introduced at the burner through several orifices that generate gaseous jets that mix rapidly<br />
with the incoming combustion air supply. <strong>The</strong>re are many designs in use that differ primarily in the<br />
orientation of the burner orifices and their locations in the burner housing.<br />
Oil Fired<br />
Oil fuels generally require some type of pretreatment prior to delivery to the burner including the use<br />
of strainers to remove solid foreign material and tank and flow line preheaters to assure the proper<br />
viscosity. Oil must be atomized prior to vaporization and mixing with the combustion air supply. This<br />
generally requires the use of either air, steam or mechanical atomizers.<br />
<strong>The</strong> oil is introduced into the furnace through a gun fitted with a tip that distributes the oil into a fine<br />
spray that allows mixing between the oil droplets and the combustion air supply. Oil cups that spin the<br />
oil into a fine mist are also employed on small units. An oil burner may be equipped with diffusers that<br />
act as flame holders by inducing strong recirculation patterns near the burner. In some burners,<br />
primary air nozzles are employed.<br />
Pulverized Coal Fired<br />
<strong>The</strong> pulverized system provides four functions: pulverizing, drying, classifying to the required fineness<br />
and transporting the coal to the burner's main air stream. <strong>The</strong> furnace may be designed for dry ash<br />
removal in the hopper bottom or for molten ash removal as in a slag tap furnace.<br />
<strong>The</strong> furnace size is dependent on the burning and ash characteristics of the coal as well as the firing<br />
system and type of furnace bottom. <strong>The</strong> primary objectives are to control furnace ash deposits and<br />
provide sufficient cooling of the gases leaving the furnace to reduce the buildup of slag in the<br />
convective regions.<br />
< previous page page_12 next page >
previous page page_13 next page ><br />
Pulverized coal fired systems are generally considered to be economical for units with capacities in<br />
excess of 200,000 lbs of steam per hour.<br />
Stoker Fired<br />
Coal stoker units are characterized by bed combustion on the boiler grate with the bulk of the<br />
combustion air supplied through the grate.<br />
Page 13<br />
Several stoker firing methods currently in use on industrialsized boilers include underfed, overfed and<br />
spreader. In underfed and overfed stokers, the coal is transferred directly on to the burning bed. In a<br />
spreader stoker the coal is hurled into the furnace when it is partially burned in suspension before<br />
lighting on the grate.<br />
Several grate configurations can be used with overfed and spreader stokers including stationary,<br />
chain, traveling, dumping and vibrating grates. Each grate configuration has its own requirements as<br />
to coal fineness and ash characteristics for optimum operation. Examples of several stoker/grate<br />
combinations are given in Figures 1-9, 1-10 and 1-11.<br />
Spreader stoker units have the advantage that they can burn a wide variety of fuels including waste<br />
products. Underfed and overfed units have the disadvantage that they are relatively slow to respond to<br />
load variations.<br />
Stoker units can be designed for a wide range of capacities from 2,000 to 350,000 lbs of steam per hour.<br />
Spreader stoker units are generally equipped with overfire air jets to induce turbulence for improved<br />
mixing and combustible burnout as shown in Figure 1-1 1. Stoker units are also equipped with ash<br />
reinjection systems that allow the ash collected that contains a significant portion of unburned carbon<br />
to be reintroduced into the furnace for burning.<br />
Combustion Control Systems<br />
Combustion controls have two purposes: (1) maintain constant steam conditions under varying loads<br />
by adjusting fuel flow,<br />
< previous page page_13 next page >
previous page page_14 next page ><br />
Figure 1-9<br />
Single retort stoker (underfed).<br />
and (2) maintain an appropriate combustion air-to-fuel flow. Combustion control systems can be<br />
classified as series, parallel and series/parallel as illustrated in Figure 1-12.<br />
Page 14<br />
In series control, either the fuel or air is monitored and the other is adjusted accordingly. For parallel<br />
control systems, changes in steam conditions result in a change in both air and fuel flow. In series/<br />
parallel systems, variations in steam pressure affect the rate of fuel input and simultaneously the<br />
combustion air flow is controlled by the steam flow.<br />
Combustion controls can be also classified as positioning and metering controls. Positioning controls<br />
respond to system demands by moving to a present position. In metering systems, the response is<br />
controlled by actual measurements of the fuel and/or air flows.<br />
< previous page page_14 next page >
previous page page_15 next page ><br />
Application<br />
Figure 1-10<br />
Steam Generating Unit Equipped with<br />
Traveling-Grate Stoker and Rear-Arch Furnace.<br />
Page 15<br />
<strong>The</strong> application and degree of combustion controls varies with the boiler size and is dictated by system<br />
costs.<br />
<strong>The</strong> parallel positioning jackshaft system illustrated in Figure 1-13 has been extensively applied to<br />
industrial boilers based on minimum system costs. <strong>The</strong> combustion control responds to changes in<br />
steam pressure and can be controlled by a manual override. <strong>The</strong> control linkage and cam positions for<br />
the fuel and air flow are generally calibrated on startup.<br />
< previous page page_15 next page >
previous page page_16 next page ><br />
Figure 1-11<br />
Steam generating unit equipped with continuous-discharge type<br />
of spreader stoker. Rows of overfire air jets are installed in front<br />
and rear walls. Cinders are reinjected from boiler hoppers.<br />
Page 16<br />
< previous page page_16 next page >
previous page page_17 next page ><br />
Figure 1-12<br />
Basic combustion control systems.<br />
Page 17<br />
< previous page page_17 next page >
previous page page_18 next page ><br />
Figure 1-13<br />
Typical parallel positioning type combustion control system using mechanical jackshaft.<br />
Page 18<br />
< previous page page_18 next page >
previous page page_19 next page ><br />
Page 19<br />
Improved control of excess air can be obtained by substituting electric or pneumatic systems for the<br />
mechanical linkages. In addition, relative position of fuel control and combustion air dampers can be<br />
modified.<br />
More advanced systems are pressure ratio control of the fuel and air pressure, direct air and fuel<br />
metering and excess air correction systems using flue gas O2 monitoring. Factors that have limited the<br />
application of the most sophisticated control systems to industrial boilers include cost, reliability and<br />
maintenance.<br />
< previous page page_19 next page >
previous page page_21 next page ><br />
2<br />
<strong>Boiler</strong> Efficiency Goals<br />
<strong>The</strong>re are several ways of defining ''boiler efficiency":<br />
As-Found Efficiency is the efficiency measured in the field for boilers existing in a state of repair or<br />
maintenance. It is used as the baseline for any subsequent efficiency improvements.<br />
Tuned-Up Efficiency is the efficiency after operating adjustments (low excess air) and minor repairs<br />
have been made.<br />
Maximum Attainable Efficiency is the result of adding currently available efficiency improvement<br />
equipment, regardless of the cost considerations.<br />
Page 21<br />
Maximum Economically Achievable Efficiency differs from that above in that it accounts for realistic cost<br />
considerations with efficiency improvement equipment added only if it is economically justifiable.<br />
As-Found Efficiencies<br />
As illustrated in Figure 2-1, there is a significant range of operating efficiencies dependent on the fuel<br />
fired and the existence of stack gas heat recovery equipment. <strong>The</strong> average efficiency ranges from 76%<br />
to 83% on gas, 78% to 89% on oil and 85% to 88% on coal. Note that the operating efficiency also<br />
varies with load.<br />
Table 2-1 presents average "as-found" industrial boiler operating efficiency based on both field test<br />
measurements conducted by KVB and calculated values based on DOE data of industrial boilers.<br />
Good agreement is shown between the measured and calculated values.<br />
< previous page page_21 next page >
previous page page_22 next page ><br />
Typical Performance of Gas-Fired Watertube <strong>Boiler</strong>.<br />
Typical Performance of Oil-Fired Watertube <strong>Boiler</strong>.<br />
Figure 2-1<br />
Ranges of <strong>Boiler</strong> Operating Efficiencies.<br />
(continued)<br />
Page 22<br />
< previous page page_22 next page >
previous page page_23 next page ><br />
Typical Performance of Pulverized Coal-Fired Watertube <strong>Boiler</strong>.<br />
(end)<br />
TABLE 2-1. Average "As-Found" Industrial <strong>Boiler</strong> Operating Efficiencies Field Test Measurements and Calculations (Percent)<br />
Rated Capacity Range (MBtu/hr)<br />
10-16 16-100 100-250 250-500<br />
Category/Fuel Measured Calculated Measured Calculated Measured Calculated Measured Calculated<br />
Watertube<br />
Gas<br />
Oil<br />
Coal -Stoker<br />
Firetube<br />
Gas<br />
Oil<br />
Pulverized<br />
*No data available<br />
NA - Not Applicable<br />
Parentheses indicate small boiler populations tested<br />
(78.0) 79.9 79.5 79.9 81.2 80.9 (82.8) 81.2<br />
(81.5) 83.7 82.8 83.7 (83.4) 84.6 (82.7) 85.3<br />
* 81.0 76.6 81.2 82.2 81.8 * 82.5<br />
* 83.2 * 83.3 (86.6) 86.1 (85.3) 86.3<br />
(81.0) 79.9 79.5 79.9 NA NA<br />
(86.3) 83.7 (85.8) 83.7 NA NA<br />
Page 23<br />
< previous page page_23 next page >
previous page page_24 next page ><br />
Tuned-Up Efficiencies<br />
Page 24<br />
Data from several programs conducted by KVB have been used to determine tuned-up efficiency levels<br />
using low excess air operation. In addition, boiler design efficiency is sometimes used as a reference<br />
point for establishing tuned-up efficiency.<br />
Calculations of tuned-up boiler efficiency levels have also been made using typical tuned-up excess air<br />
levels as per manufacturers and data from the DOE. <strong>The</strong> results of these analyses are presented in<br />
Table 2-2. Again, reasonable agreement between the three methods are evident.<br />
Maximum Economically Achievable Efficiencies<br />
Several factors (as discussed in Chapter 18) are involved in the determination of the cost effectiveness<br />
of auxiliary equipment addition. Any estimate of the economic benefits that determine the economic<br />
feasibility of installing efficiency improvement equipment must be highly qualified due to the<br />
individual economic situation of each unit.<br />
An analysis was conducted by KVB that showed that the addition of stack gas heat recovery<br />
equipment is the most cost-effective means of improving boiler efficiency. Table 2-3 presents the<br />
calculated maximum economically achievable efficiency levels based on the addition of stack gas heat<br />
recovery on units with sufficient potential to justify their addition.<br />
Maximum Attainable Efficiency<br />
<strong>The</strong> maximum attainable efficiency was calculated by KVB for each boiler category on the basis of<br />
applying all required auxiliary equipment to achieve minimum practical operating excess air levels<br />
and stack gas temperatures (see Chapter 3). <strong>The</strong>se results are presented in Table 2-4 which show the<br />
expected trend of larger units having the highest efficiencies for each fuel and firing group due to<br />
lower radiation losses. Also, pulverized coal<br />
< previous page page_24 next page >
previous page page_25 next page ><br />
TABLE 2-2. Average Measured, Design and Calculated Tuned-Up Industrial <strong>Boiler</strong> Operating Efficiencies<br />
(Percent)<br />
Rated Capacity Range, (106 Btu/hr)<br />
10-16 16-100 100-250 250-500<br />
Category/Fuel Measured Design Calculated Measured Design Calculated Measured Design Calculated Measured Design Calculated<br />
Watertube<br />
Gas<br />
Oil<br />
Coal - Stoker<br />
Pulverized<br />
Firetube<br />
Gas<br />
Oil<br />
(78.4) * 80.1 81.2 80.2 80.2 81.2 82.0 81.7 (83.7) (83.4) 82.0<br />
* * 84.1 83.7 82.5 84.2 82.8 85.1 85.5 (81.5) * 86.2<br />
* * 81.3 80.9 (86.6) 81.0 83.6 (82.9) 82.0 * * 82.7<br />
* * 83.8 * * 83.9 (86.1) (86.3) 86.5 (85.4) (88.0) 86.7<br />
(81.2) (82.0) 80.1 (81.9) (83.0) 80.2 NA NA NA NA NA NA<br />
(86.2) (85.0) 84.1 (87.4) (85.0) 84.2 NA NA NA NA NA NA<br />
* Insufficient data available<br />
NA - Not Applicable<br />
Numbers in parentheses represent small boiler population group.<br />
< previous page page_25 next page ><br />
Page 25
previous page page_26 next page ><br />
TABLE 2-3. Calculated Maximum Economically Achievable Efficiency Levels<br />
(Percent)<br />
Rated Capacity Range (106 Btu/hr)<br />
Category/Fuel 10-16 16-100 100-250 250-500<br />
Gas 80.1 81.7 84.0 85.2<br />
Oil 84.1 86.7 88.3 88.7<br />
Coal<br />
Stoker<br />
Pulverized<br />
81.0 83.9 85.5 85.8<br />
83.3 86.8 88.8 89.1<br />
TABLE 2-4. Calculated Maximum Attainable Efficiency Levels<br />
(Percent)<br />
10-16 16-100 100-250 250-500<br />
Klb/hr Klb/hr Klb/hr Klb/hr<br />
Gas 85.6 86.2 86.5 86.6<br />
Oil 88.8 89.4 89.7 89.8<br />
Coal<br />
Stoker<br />
Pulverized<br />
86.4 87.0 87.3 87.4<br />
89.5 90.1 90.4 90.5<br />
has the highest efficiency with oil and gas following. This ranking follows the fuel properties as discussed in Chapter 3.<br />
Page 26<br />
A summary of the efficiency levels and potential improvements from normal operating conditions is presented in Table 2-5.<br />
<strong>The</strong>re exists a 0.2 to 0.9% efficiency improvement potential between "as-found" and tuned-up conditions. This<br />
corresponds very favorably with the demonstrated efficiency improvements from field test programs conducted by KVB.<br />
In addition 1.5 to 3.0% improvement potential is available using economically justified auxiliary equipment.<br />
< previous page page_26 next page >
previous page page_27 next page ><br />
TABLE 2-5. Industrial <strong>Boiler</strong> Energy Conservation Potential<br />
Page 27<br />
< previous page page_27 next page >
previous page page_28 next page ><br />
<strong>The</strong> maximum attainable efficiency improvements range from 2.04.0%. Note that this potential<br />
generally increases for all fuel categories with decreasing unit capacity with the exception of the<br />
smallest size category. This indicates the absence of stack gas heat recovery equipment.<br />
Page 28<br />
< previous page page_28 next page >
previous page page_29 next page ><br />
3<br />
Major Factors Controlling <strong>Boiler</strong> Efficiency<br />
Page 29<br />
<strong>Boiler</strong> efficiency can be summarized as the measure of the efficiency with which the heat input to the<br />
boiler (principally the higher heating value of the fuel) is converted to useful output (in the form of<br />
process steam). Improvements in steam generator efficiency result primarily from reductions in waste<br />
heat energy losses in the stack gases and expelled waste water. Procedures that reduce the mass flow<br />
and energy content of these flow streams directly benefit unit performance. Other losses occur from<br />
surface heat transfer to the atmosphere and incomplete combustion of the fuel.<br />
<strong>The</strong> proper calculation of boiler efficiency requires a definition of the boiler "envelope" which isolates<br />
the components to be considered part of the boiler from those that are excluded. Figure 4-1 from the<br />
next chapter, taken from the ASME Power Test Code, shows equipment included within the envelope<br />
boundary designating the steam generating unit. Heat inputs and outputs crossing the envelope<br />
boundary are involved in the efficiency calculations. Apparatus is generally considered outside the<br />
envelope boundary when it requires an outside source of heat or where the heat exchanged is not<br />
returned to the steam generating unit.<br />
<strong>The</strong> direct approach to improving boiler efficiency is to identify the losses, their relative magnitude,<br />
and then concentrate first on the dominant losses that are controlling degraded efficiency. Some of the<br />
more important losses are listed below followed by a discussion of their origin.<br />
< previous page page_29 next page >
previous page page_30 next page ><br />
1. Waste heat energy losses in the stack gases consist of the dry flue gas loss (heat carried away by the<br />
dry flue gases) and the moisture loss (latent and sensible heat in water vapor). Water vapor results<br />
from the combustion of hydrogen in the fuel, the humidity of the combustion air, and the water<br />
content of the fuel.<br />
Most industrial boilers have very large flue gas losses because they operate with high stack gas<br />
temperatures (400ºF600ºF+) resulting from not being equipped with waste heat recovery equipment<br />
(air preheater or economizers).<br />
Page 30<br />
Traditionally, these boilers have not had the sophisticated combustion controls common on large<br />
utility boilers and as a result also operate with high dry flue gas losses due to the high excess air levels<br />
(20%60%) necessary to insure complete combustion and safe operation. <strong>The</strong> latent heat of water<br />
vapor usually comprises a large fraction (610%) of the total efficiency losses and could be reduced if a<br />
practical means were developed to permit the water vapor to condense out before the flue gases leave<br />
the boiler.<br />
In examining these stack gas efficiency losses, it is apparent that any reduction in the exit flue gas<br />
temperature and excess air level will help optimize the overall unit efficiency. A 100°F reduction in<br />
stack gas temperature will increase efficiency by 2.1% or more depending on the actual excess air<br />
levels (see Figure 8-2 in Chapter 8).<br />
Minimum flue gas temperatures are limited by corrosion and sulfuric acid condensation in the cold<br />
end regions of the unit and are therefore a function of the sulfur content of the fuel and the moisture of<br />
the flue gas. One manufacturer of heat recovery equipment suggests a minimum average cold end<br />
temperature of 150°F for natural gas, 175°F for oil fuel and 155185ºF for coal, depending on the sulfur<br />
level of the fuel.<br />
For boilers without heat recovery equipment, the minimum exit gas temperature is fixed by the boiler<br />
operating pressure since this determines the steam temperature. Usual design practices result in an<br />
outlet gas temperature ~150ºF above saturation temperature. Figure 3-1 illustrates the fact that it<br />
becomes increasingly expensive to approach boiler saturation temperatures by simply adding<br />
convective surface area. As operating pressures<br />
< previous page page_30 next page >
previous page page_31 next page ><br />
Figure 3-1<br />
Gas temperature drop through boiler convection section.<br />
increase, the stack gas temperature increases making heat recovery equipment more desirable.<br />
Page 31<br />
<strong>The</strong> practical limit for the minimum excess air is determined by the combustion control system used to<br />
regulate the air and fuel supply in response to load demand.<br />
< previous page page_31 next page >
previous page page_32 next page ><br />
Economizers will permit a reduction in exit gas temperatures since the feedwater is at a lower<br />
temperature (220ºF) than the steam saturation temperature. Stack gas temperatures of 300ºF can be<br />
achieved with stack gas heat recovery equipment. Further reductions are achieved using air<br />
preheaters.<br />
Page 32<br />
Present design criteria limits the degree of cooling using stack gas heat recovery equipment to a level<br />
which will minimize condensation on heat transfer surfaces. <strong>The</strong> sulfur content of the fuel has a direct<br />
bearing on the minimum stack gas temperature as SO3 combines with condensed water to form<br />
sulfuric acid and also the S03 concentration in the flue gas determines the condensation temperature.<br />
Minimum air preheater metal surface temperatures are determined by averaging the exit gas and<br />
entering air temperature as given in Table 3-1. As shown, increased sulfur content in the fuel requires<br />
higher exit gas temperatures.<br />
Oil Fuel (>2.5% S)<br />
Oil Fuel (3.5% S)<br />
Bituminous Coal (
previous page page_33 next page ><br />
Fuel Firing Type Fuel H (%<br />
wt)<br />
Natural gas<br />
#2 Oil<br />
#6 Oil<br />
Bituminous coal Pulverized<br />
Stoker<br />
Subbituminous coal Pulverized<br />
Stoker<br />
TABLE 3-2. Influence of Fuel Properties on Stack Gas Losses<br />
Fuel H2O<br />
(% wt)<br />
Fuel S (%<br />
wt)<br />
Min. Stack<br />
Temp (ºF)<br />
Min Excess O2<br />
Level (%)<br />
Min. Dry Gas<br />
Losses<br />
Min.Moist<br />
Losses<br />
Min. Stack Gas<br />
Losses<br />
23.3 220 1 2.9 10.1 13.0%<br />
11.9 0.5 330 2 5.1 6.4 11.5%<br />
10.8 1.5 390 3 6.6 6.2 12.6%<br />
5.0 4.5 2.8 290 4 4.8 4.5 9.3%<br />
5.0 4.5 2.8 290 6 5.5 4.5 10.0%<br />
4.1 21.5 0.8 230 4 2.6 6.8 9.5%<br />
4.1 21.5 0.8 230 6 3.0 6.8 9.8%<br />
< previous page page_33 next page ><br />
Page 33
previous page page_34 next page ><br />
carryover, hydrocarbons, and smoke), and the loss due to unburned solid fuel and other combustible<br />
solids which become trapped in the refuse.<br />
Page 34<br />
As previously mentioned, the high excess air levels frequently used tend to minimize this loss unless the<br />
boiler is improperly maintained, is an older, poorly designed, coal unit, or is burning an uncommon<br />
fuel of inconsistent quality. High carbon monoxide (CO) emissions may be encountered on gas fuel<br />
because the boiler is operated at too low an excess air level and these poor combustion conditions are<br />
not visually apparent to the operator.<br />
While combustible losses at gas- and oil-fired boilers can be essentially eliminated with proper<br />
operating practices, combustible losses on coal burning units are to some extent unavoidable. For coal<br />
the magnitude of the loss is very dependent upon the firing type (i.e., pulverized, stoker, cyclone).<br />
<strong>The</strong>se losses are evident by the combustible content of the ash. <strong>The</strong> combustible loss on pulverized coal<br />
units is dependent upon a number of variables including: (1) furnace heat liberation, (2) type of<br />
furnace cooling, (3) slag tap or dry ash removal, (4) volatility and fineness of coal, (5) excess air, (6)<br />
burner type, (7) burner-to-burner combustion balance and others. <strong>The</strong> typical combustible loss for<br />
each firing type is presented in Table 3-3.<br />
TABLE 3-3. Typical Combustible Loss by Firing Type<br />
Firing Type Typical Combustible Losses (%)<br />
Pulverized Coal<br />
Stokers<br />
Slag tap furnace 0<br />
Cyclone combustor 0<br />
Dry ash furnace .8-1.2<br />
Underfed 2.0<br />
Overfed 2.0<br />
Spreader (70% ash recovery)<br />
Dumping grate 3.6<br />
Reciprocating grate 3.0<br />
Vibrating grate 3.0<br />
Traveling grate 2.4<br />
< previous page page_34 next page >
previous page page_35 next page ><br />
Page 35<br />
Figure 3-2 illustrates how the various efficiency losses are affected by changes in boiler excess O2.<br />
While these measurements were made on natural gas, the general trends are also representative of oil-<br />
and coal-fired boilers (actual values will differ with fuels, burner designs, operating conditions, etc.)<br />
Dry flue gases increase linearly with increased excess O2 due to both higher massflow rates and higher<br />
stack temperatures. Combustibles (carbon monoxide) increase dramatically as the excess O2 is<br />
decreased below an acceptable minimum point.<br />
Figure 3-2<br />
Variation in boiler efficiency losses with changes in excess O2.<br />
< previous page page_35 next page >
previous page page_36 next page ><br />
Flue moisture and radiation losses remain unchanged with variation in excess O2.<br />
Page 36<br />
<strong>The</strong> total efficiency loss (the sum of the four sources listed above) decreases with decreased excess O2<br />
to a point in which losses from the combustibles become predominant. <strong>The</strong> optimum operating<br />
condition is not necessarily the point of highest efficiency due to additional excess O2 margin required<br />
for safety control limitations or load changes.<br />
<strong>The</strong> optimum excess air level for the best boiler efficiency occurs when the sum of the loss due to<br />
incomplete combustion and the loss due to heat in the flue gases is a minimum. For the ideal case of<br />
rapid thorough mixing, the optimum air-fuel ratio is the stoichiometric air-fuel ratio.<br />
However, excess air is required in all practical cases to increase the completeness of combustion, allow<br />
for normal variations in the precision of combustion controls, and insure satisfactory stack conditions<br />
with some fuels (i.e., non-visible plume to comply with air pollution regulations). <strong>The</strong> optimum excess<br />
air level will vary with fuel, burner, and furnace design.<br />
3. Heat loss from the exterior boiler surfaces through the insulation is generally termed ''radiation loss" and<br />
includes heat radiated to the boiler room and the heat picked up by the ambient air in contact with the<br />
boiler surfaces. Approximate radiation losses from furnace walls as developed by the ABMA are<br />
presented in Figures 3-3 and 3-4.<br />
<strong>The</strong> quantity of heat lost in this manner in terms of Btu per hour is fairly constant at different boiler<br />
firing rates and as a result, becomes an increasingly higher percentage of the total heat losses at the<br />
lower firing rates.<br />
As seen in Figures 3-3 and 3-4, the radiation loss at high firing rates varies from a fraction of one<br />
percent up to two percent, depending on the capacity of the boiler. As the boiler load is reduced, the<br />
radiation loss increases in indirect proportion to the load fraction.<br />
For example, the radiation loss for a 10,000 lb/hr boiler operating at 20% load will be five times the<br />
loss at full load, or roughly 10 percent. To a large extent, these losses are unavoidable<br />
< previous page page_36 next page >
previous page page_37 next page ><br />
Page 37
Figure 3-3<br />
ABMA Standard Radiation Loss Chart.<br />
< previous page page_37 next page >
previous page page_38 next page ><br />
Page 38
Figure 3-4<br />
ABMA Standard Radiation Loss Chart.<br />
< previous page page_38 next page >
previous page page_39 next page ><br />
Page 39<br />
and will increase at all loads with deteriorated insulation and furnace wall refractory. Techniques for<br />
reducing surface heat losses are presented in Chapter 14.<br />
<strong>Boiler</strong> Firing Rate<br />
<strong>Boiler</strong> firing rate is another operating parameter which affects efficiency but this parameter is often<br />
viewed as an uncontrollable factor depending on steam demand. As discussed in Chapter 12, load<br />
management can be an effective tool in some situations to minimize fuel use by maintaining boiler<br />
loading near peak efficiency conditions for as long as possible. <strong>The</strong> importance of load is illustrated in<br />
Figure 3-5 which shows how the various efficiency losses change with variations in boiler firing rate.<br />
<strong>The</strong>se results on natural gas fuel are based on tests conducted on the same boiler where O2 variations<br />
were previously discussed.<br />
As indicated in the figure, the change in excess O2 with load has a strong influence on the eventual<br />
efficiency versus load profile. When the boiler is fired with constant excess O2 over the load range the<br />
actual peak efficiency may occur somewhat below peak load but the efficiency profile remains very<br />
"flat" over a large portion of the load range.<br />
On the other hand, when excess O2 increases as load is reduced (a common condition at many boilers),<br />
the efficiency tapers off more quickly with load. In this case it is advantageous to operate as close as<br />
possible to peak load for highest efficiencies when there is a choice between partially loading several<br />
boilers or operating fewer boilers at high loads.<br />
A sample output from the KVB boiler efficiency computer program (Figure 3-6) shows the various<br />
heat losses and boiler efficiency at several test conditions on a 13,000 lb/hr watertube boiler. <strong>The</strong><br />
radiation loss is based on the ABMA Standard Radiation Loss Chart mentioned previously. It should<br />
also be mentioned that no "unmeasured" or "unaccounted for" heat loss term has been applied to any<br />
efficiency values presented in this book. This additional loss term (generally ranging from 0.5 to 1.5<br />
percent) is sometimes added to attempt to account for minor heat credits and losses which are<br />
neglected in the "short form" calculation.<br />
< previous page page_39 next page >
previous page page_40 next page ><br />
Figure 3-5<br />
Variation in <strong>Boiler</strong> Efficiency Losses With Changes in <strong>Boiler</strong> Firing Rate.<br />
Effects of <strong>Boiler</strong> Operating Parameters<br />
Page 40<br />
It will be worthwhile to examine in more detail the relative importance of the various heat loss<br />
contributions and how they vary with changes in boiler operating parameters. Figure 3-7 presents the<br />
results from a series of efficiency tests conducted at a small watertube boiler while operating on<br />
natural gas fuel near 50 percent load capacity. To establish the optimum burner excess<br />
< previous page page_40 next page >
previous page page_41 next page ><br />
Page 41<br />
O2 condition for maximum efficiency, the combustion air flow was varied manually at a fixed fuel flow<br />
producing the range in excess O2.<br />
<strong>The</strong> lower plot shows the dependence of CO and flue gas temperature on excess O2 while the upper<br />
plot shows the major heat losses at corresponding test points. <strong>The</strong> total efficiency loss profile exhibits a<br />
minimum value near 0.8% excess O2 which corresponds to an efficiency peak of 78.8 percent. <strong>The</strong><br />
total efficiency loss profile is shaped mainly by the dry flue gas losses and carbon monoxide losses since<br />
the radiation and moisture losses are nearly constant.<br />
<strong>The</strong> point of maximum efficiency (minimum losses) occurs where the rate of change in CO and dry gas<br />
losses are equal and opposite. Since the dry gas loss continues to decrease very uniformly as the excess<br />
O2 is lowered, the CO loss (i.e., the boilers' CO versus O2 characteristics) is the primary factor in<br />
determining the point of maximum efficiency. In this particular example, the CO levels increase very<br />
rapidly below 1.0% excess O2 and the point of maximum efficiency corresponds to CO emission levels<br />
in the region of 500 to 1000 ppm.<br />
<strong>The</strong> importance of CO emissions in determining the point of peak efficiency is usually relevant to<br />
natural gas firing only. On oil and coal fuels the lowest excess O2 is usually limited by an unacceptable<br />
stack condition (i.e., smoking) or excessive combustibles in refuse or fly ash. <strong>The</strong>se conditions<br />
frequently precede high CO emissions but CO measurements are still made since CO can also result<br />
from malfunctioning burners, improper burner settings, etc.<br />
It should be mentioned that the data in Figure 3-7 do not correspond to totally constant boiler output<br />
since fuel flow (input) is fixed and actual steam flow (output) would vary in proportion to the boiler<br />
efficiency. However, the efficiency loss profiles would be virtually unchanged if corrected to a constant<br />
steam flow condition. <strong>The</strong>se curves illustrate the process of extracting heat from a given amount of fuel<br />
as opposed to the production of a constant quantity of steam.<br />
< previous page page_41 next page >
previous page page_42 next page ><br />
KVB Engineering Calculation of Efficiency Program: PEP3 Engineer: T. Sonnichsen <strong>Boiler</strong> Category 111<br />
Unit Description Fuel Analysis<br />
Natural Gas Oil or Coal<br />
Location No. ST JO CO2 .22 C 0.<br />
<strong>Boiler</strong> No. 2 CO 0. H 0.<br />
Furnace Type WT N2 1.48 O 0.<br />
Capacity H2S 0. N 0.<br />
KLB/HR 13.0 CH4 92.88 S 0.<br />
MBTU/HR 13.0 C2H6 4.17 H20 0.<br />
Installed UNK C3H8 .93 ASH 0.<br />
Erection Method SHOP C4H10 .19 HHV/(BTU/LB) 0<br />
Burner Type GUN C5H12 .08<br />
HHV(BTU/CUFT) 1055<br />
Natural Gas <strong>Boiler</strong> Conditions<br />
Test No. 5 6 7 8 X-6<br />
Test Load<br />
KLB/HR<br />
% of CAP<br />
6.5 6.5 6.5 6.5 6.5<br />
50.0 50.0<br />
50.0<br />
50.0 50.0<br />
(continued)<br />
Page 42<br />
< previous page page_42 next page >
previous page page_43 next page ><br />
(table continued from previous page)<br />
Stack O2 (% dry) 4.40 1.50 1.02 .55 .33<br />
Stack CO (ppm) 70.0 360.0 580.0 1100.0 5000.0<br />
Stack Temp (F) 476.0 460.0 455.0 458.0 457.0<br />
AMB Air Temp (F) 80.0 80.0 80.0 80.0 80.0<br />
Dry Gas<br />
Moist + H2<br />
<strong>Boiler</strong> Heat Balance Losses (%)<br />
8.07<br />
11.67<br />
6.62 6.38 6.28 6.15<br />
11.61 11.59 11.60 11.59<br />
Moisture in Air .21 .17 .17 .16 .16<br />
Unburned CO .02 .11 .17 .31 1.38<br />
Combustibles 0. 0. 0. 0. 0.<br />
Radiation 3.00 3.00 3.00 3.00 3.00<br />
<strong>Boiler</strong> Efficiency 77.02 78.49 78.70 78.65 77.72<br />
<strong>The</strong>rmodynamic Eff. 0. 0. 0. 0. 0.<br />
Figure 3-6<br />
Sample Computer Output from a <strong>Boiler</strong> Efficiency Program<br />
(end)<br />
Page 43<br />
< previous page page_43 next page >
previous page page_44 next page ><br />
Figure 3-7<br />
Variation in Stack Conditions and Heat<br />
Losses with Changes in Excess O2.<br />
Page 44<br />
< previous page page_44 next page >
previous page page_45 next page ><br />
4<br />
<strong>Boiler</strong> Efficiency Calculations<br />
A necessary part of an efficiency improvement program is the determination of the operating<br />
efficiency of the boiler and the corresponding increase from "as-found" conditions. This chapter<br />
discusses the various calculation methods and computational procedures available. All are based on<br />
conducting an energy balance on the boiler system as illustrated in Figure 4-1.<br />
A complete energy analysis would consider all such energy "credits" and "debits" (presented in<br />
Figure 4-2) to arrive at an overall efficiency. Generally, however, only the major factors are<br />
determined to arrive at an approximate value.<br />
Page 45<br />
This chapter includes a discussion of the calculational methods available and the procedures developed<br />
by the ASME to conduct performance tests.<br />
Calculation Methods<br />
<strong>The</strong> two basic procedures for determining the overall boiler efficiency are the input-output method<br />
and the heat loss method. Both methods are mathematically equivalent and would give identical<br />
results if all the required heat balance (or energy loss) factors were considered and the corresponding<br />
boiler measurements could be performed without error.<br />
Different boiler measurements are required for each method. <strong>The</strong> efficiencies determined by these<br />
methods are "gross" efficiencies as opposed to "net" values which would include as additional heat<br />
input the energy required to operate all the boiler auxiliary equipment (combustion air fans, fuel<br />
handling systems, stoker<br />
< previous page page_45 next page >
previous page page_46 next page ><br />
Figure 4-1<br />
Steam generating unit diagram.<br />
Page 46<br />
< previous page page_46 next page >
previous page page_47 next page ><br />
Figure 4-2<br />
Heat balance of steam generator.<br />
Page 47<br />
< previous page page_47 next page >
previous page page_48 next page ><br />
drives, etc.). <strong>The</strong>se ''gross" efficiencies can then be considered as essentially the effectiveness of the<br />
boiler in extracting the available heat energy of the fuel (i.e., transferring it to the working fluid).<br />
Input-Output Method<br />
This method requires the direct measurement of the fuel flow rate to determine the input rate of<br />
energy. <strong>The</strong> temperature, pressure and flow rate of the boiler feed water and generated steam must<br />
also be measured to determine the output rate of energy.<br />
Because of the large number of physical measurements required at the boiler and the potential for<br />
significant measurement errors, the Input-Output Method is not practical for field measurements at<br />
the majority of industrial boiler installations where precision instrumentation is not available.<br />
Heat Loss Method<br />
Page 48<br />
This method might also be termed the flue gas analysis approach since the major heat losses are based<br />
on the measured flue gas conditions at the boiler exit together with an analysis of the fuel composition<br />
as discussed in Chapter 3. Radiation loss, which is not associated with flue gas conditions, is routinely<br />
estimated from standard curves as given in Figures 3-3 and 3-4. Chapter 3.<br />
This method requires the determination of the stack gas excess O2 (or CO2), CO, combustibles,<br />
temperature and the combustion air temperature.<br />
<strong>The</strong> heat loss method is a much more accurate and more accepted method of determining boiler<br />
efficiencies in the field<br />
< previous page page_48 next page >
previous page page_49 next page ><br />
provided that the measurements of the stack gas conditions described above are accurate and not<br />
subject to air dilution or flue gas flow stratification (as discussed in Chapter 6).<br />
ASME Computational Procedures<br />
Page 49<br />
<strong>Boiler</strong> efficiency calculations using the calculation methods discussed previously are based on the<br />
ASME abbreviated efficiency tests or so-called "short form" computation from the ASME Power Test<br />
Code 4.1, Figure 4-3. This is a recognized standard approach for routine efficiency testing in the field,<br />
especially at industrial boiler installations where instrumentation quite often is very minimal.<br />
This computational procedure neglects minor efficiency losses and heat credits and considers only the<br />
chemical heat (higher heating value) in the fuel as energy input. <strong>The</strong> same test form is used for both<br />
the input-output and the heat loss methods. <strong>The</strong> data required for each of these methods as per the<br />
ASME is identified on the following test forms. Note that as complete data as possible should be taken<br />
to fully document the test results no matter which procedure is used.<br />
Input-Output Method<br />
<strong>The</strong> input-output efficiency is determined as Item 64. <strong>The</strong> total energy output (Item 31) equals the sum<br />
of (A) of the actual water evaporation (Item 26) times the net enthalpy increase (Item 16 - Item 17) and<br />
the heat output in blowdown water. Note that reheat is not used on industrial boilers. <strong>The</strong> total heat<br />
input (Item 29) equals the rate of fuel firing (Item 28) times the as fired higher heating value of the fuel<br />
(Item 41).<br />
ASME Heat Loss Method<br />
<strong>The</strong> heat loss efficiency is determined as Item 72 which equals 100 less the sum of the major heat losses<br />
as percent of total heat input listed as Items 65 to 70. Each of these heat losses is calculated by first<br />
determining the heat loss per pound of fuel, followed by conversion to a percent loss by the fuel<br />
heating value.<br />
< previous page page_49 next page >
previous page page_50 next page ><br />
Figure 4-3<br />
ASME Short Form.<br />
Page 50<br />
< previous page page_50 next page >
previous page page_51 next page ><br />
Figure 4-3<br />
Continued.<br />
Page 51<br />
< previous page page_51 next page >
previous page page_52 next page ><br />
Page 52<br />
<strong>The</strong> heat loss due to dry gas equals the pounds of dry gas per pound of fuel (Item 25) times the specific<br />
heat of the combustion gases (approximately 0.24 Btu/lb ºF) times the temperature difference between<br />
the exit gas (Item 13) and the inlet air for combustion (Item 11). Note that the exit gas temperature will<br />
depend on the stack gas heat recovery equipment (economizer and/or air preheater) on the unit. <strong>The</strong><br />
heat loss due to moisture in the fuel equals the pounds of water per pound of fuel times the enthalpy<br />
difference between the water vapor at exit gas temperature (Item 13) and water at ambient<br />
temperature (Item 11). <strong>The</strong> heat loss due to water vapor formed from hydrogen in the fuel equals the<br />
weight fraction of hydrogen in the fuel times 9 (there are approximately 9 pounds of water produced<br />
from burning one pound of hydrogen) times the enthalpy difference between the water vapor in the<br />
stack and the liquid at ambient temperature. <strong>The</strong> heat loss due to combustibles in the refuse equals the<br />
pounds of dry refuse per pound of fuel (Item 22) times the heating value of the refuse (Item 23)<br />
determined in a laboratory. <strong>The</strong> heat loss due to radiation is determined by the AMBA chart discussed<br />
previously. An unmeasured loss factor (generally ranging from 0.5 to 1.5 percent) is sometimes added<br />
to attempt to account for minor heat credits and losses which are neglected in the "short form"<br />
calculation.<br />
Comparison of the Input-Output and the Heat Loss Methods<br />
Given in Table 4-1 is a comparison between the input-output and heat loss methods discussed in the<br />
previous sections. As shown, there is reasonably good agreement between the two calculation<br />
procedures.<br />
However, for practical boiler tests with limited on-site instrumentation, comparisons between the two<br />
methods are generally poor, resulting primarily from the inaccuracies associated with the<br />
measurement of the flow and energy content of the input and output streams.<br />
< previous page page_52 next page >
previous page page_53 next page ><br />
TABLE 4-1. Efficiency Calculation Comparison #2 Oil<br />
Nominal <strong>Boiler</strong> Conditions ANL, Test #6<br />
Steam Flow (lb/hr)<br />
50,000<br />
Final Steam Pressure (psig)<br />
196<br />
<strong>Boiler</strong> Excess Air<br />
Input/Output Efficiency<br />
Input Factors:<br />
57%<br />
Fuel Flow (lb/hr)<br />
2,980<br />
High Heating Value (Btu/lb)<br />
Output Factors:<br />
19,400<br />
Feedwater (Steam) Flow (lb/hr)<br />
50,000<br />
Enthalpy of Steam (Btu/lb)<br />
1,198<br />
Enthalpy of Feedwater<br />
198<br />
Heat Input (Btu/hr)<br />
57,812<br />
Heat Output (Btu/hr)<br />
50,000<br />
Input/Output Efficiency<br />
Heat Loss Efficiency<br />
86.5<br />
O2 (%)<br />
8.0<br />
CO (ppm)<br />
0<br />
Temperature (ºF)<br />
275<br />
Dry Gas Loss (%)<br />
5.4<br />
Moisture Loss (%)<br />
6.2<br />
Combustible Loss (%)<br />
0<br />
Radiation Loss (%)<br />
0.9<br />
Total Heat Loss (%)<br />
12.9<br />
Heat Loss Efficiency (%)<br />
87.5<br />
Page 53<br />
< previous page page_53 next page >
previous page page_55 next page ><br />
5<br />
Heat Loss Graphical Solutions<br />
Relationships have been generated that can be used to estimate the percent of heat losses for<br />
conventional firing conditions that can be used in the heat loss computational procedures. <strong>The</strong>se<br />
graphical solutions were developed by KVB using the ASME computational procedures discussed in<br />
Chapter 3. Solutions are presented in this chapter for the stack gas losses (dry flue gas and moisture<br />
losses combined) and the combustible losses.<br />
Page 55<br />
Figures 5-1 through 5-5 can be used to estimate the stack gas losses for various operating conditions<br />
(flue gas excess O2 and stack temperature) for natural gas, #2 and #6 oils, and an eastern bituminous<br />
and western subbituminous coals. <strong>The</strong> fuel analysis used as the basis for these solutions is presented<br />
and is characteristic of the general fuel properties.<br />
Estimates of the total stack gas losses are made using the appropriate figure (based on fuel used) by<br />
determining both the flue gas excess O2 and stack gas temperature using the measurement procedures<br />
presented in Chapter 6. <strong>The</strong> stack gas heat loss is read off the left side.<br />
Figure 5-6 can be used to measure the heat loss from carbon monoxide present in the flue gas for<br />
natural gas firing. Required data are the CO emissions (in ppm) and the stack gas excess O2 level.<br />
To complete the heat loss estimate, Figure 4-3 is used to determine the heat loss due to radiation.<br />
< previous page page_55 next page >
previous page page_56 next page ><br />
Figure 5-1<br />
Stack gas losses (total of dry flue gas plus moisture in air plus<br />
moisture in flue gas due to the combustion of hydrogen in the fuel) as<br />
a function of stack temperature and excess O2 for natural gas fuel.<br />
KVB®<br />
Page 56<br />
< previous page page_56 next page >
previous page page_57 next page ><br />
Figure 5-2<br />
Stack gas losses (total of dry flue gas plus moisture in air plus<br />
moisture in flue gas due to the combustion of hydrogen in the fuel)<br />
as a function of temperature and excess O2 for #2 fuel oil.<br />
KVB®<br />
Page 57<br />
< previous page page_57 next page >
previous page page_58 next page ><br />
Figure 5-3<br />
Stack gas losses (total of dry flue gas plus moisture in air plus<br />
moisture in flue gas due to the combustion of hydrogen in the fuel) as<br />
a function of stack temperature and excess O2 for #5 and #6 fuel oils.<br />
KVB®<br />
Page 58<br />
< previous page page_58 next page >
previous page page_59 next page ><br />
Figure 5-4<br />
Stack gas losses (total of dry flue gas plus moisture in air plus moisture<br />
in flue gas due to the combustion of hydrogen in the fuel) as a function<br />
of stack temperature and excess O2 for eastern bituminous coal.<br />
KVB®<br />
Page 59<br />
< previous page page_59 next page >
previous page page_60 next page ><br />
Figure 5-5<br />
Stack gas losses (total of dry flue gas plus moisture in air plus moisture<br />
in the flue gas due to the combustion of hydrogen in the fuel) as a function<br />
of stack gas temperature and excess O2 for western subbituminous coal.<br />
KVB®<br />
Page 60<br />
< previous page page_60 next page >
previous page page_61 next page ><br />
Figure 5-6<br />
Unburned carbon monoxide loss as a function of excess O2<br />
and carbon monoxide emissions for natural gas fuel.<br />
KVB®<br />
Page 61<br />
< previous page page_61 next page >
previous page page_62 next page ><br />
Abbreviated Efficiency Improvement Determinations<br />
Page 62<br />
<strong>The</strong> efficiency improvement for a boiler at each firing rate will depend on both the reductions in excess<br />
air and the stack temperatures.<br />
Relationships giving the approximate efficiency improvements for reduction in these operating<br />
parameters are presented as Figures 5-8 and 5-9. <strong>The</strong>se relationships were developed by KVB by<br />
assuming that the specific heat of the flue gases was nearly constant for all fuels and exit gas<br />
temperatures (consistent with ASME procedures) and that the stack gas heat losses are a linear<br />
function of excess air within the normal range of boiler operation.<br />
<strong>The</strong>se relationships can be used together to estimate efficiency improvements achieved at constant<br />
firing rates on natural gas, #2 through #6 oils, and common bituminous and subbituminous coals. An<br />
example of its use it presented below.<br />
Reductions in Excess O2<br />
Figure 5-8 gives the approximate percent of efficiency improvement corresponding to each 1%<br />
reduction in excess air. Use Figure 1-1 to convert excess O2 to excess air, and then determine the<br />
efficiency improvement at the proper stack temperature. For example, if the excess O2 were reduced<br />
from 6% to 3.5% from Figure 1-1, it is determined that the excess air dropped from 40% to 20%, a<br />
20% total change. If the stack temperature were 360ºF, the efficiency improvement was 20 times 0.05<br />
or 1.0 percent.<br />
Reduction in Stack Gas Temperature<br />
Reductions in stack temperature will also generally occur as the excess O2 is lowered. To account for<br />
this effect, perform the previous calculation using the initial stack temperature and add to this<br />
improvement the efficiency improvement at the lower excess air level obtained from Figure 5-7.<br />
< previous page page_62 next page >
previous page page_63 next page ><br />
Figure 5-7<br />
Curve showing percent efficiency improvement per every 10ºF drop<br />
in stack temperature. Valid for estimating efficiency improvements<br />
on typical natural gas, #2 through #6 oils and coal fuels.<br />
Page 63<br />
< previous page page_63 next page >
previous page page_64 next page ><br />
Figure 5-8<br />
Curve showing percent efficiency improvement per every one<br />
percent reduction in excess air. Valid for estimating efficiency<br />
improvements on typical natural gas, #2 through #6 oils and coal fuels.<br />
Page 64<br />
< previous page page_64 next page >
previous page page_65 next page ><br />
Figure 5-9<br />
Curve showing percent efficiency improvement per every 10ºF drop<br />
in stack temperature. Valid for estimating efficiency improvements<br />
on typical natural gas, #2 through #6 oils and coal fuels.<br />
Page 65<br />
< previous page page_65 next page >
previous page page_66 next page ><br />
Example Use of the Abbreviated Method<br />
Page 66<br />
To illustrate, if in the previous example, the stack temperature dropped from 360ºF to 340ºF as the<br />
excess O2 was lowered from 6% to 3.5%, the effect due to the 20ºF lower stack temperature would be<br />
2 times 0.25, which equals 0.5 percent. <strong>The</strong> total improvement in efficiency is then 1.0 plus 0.5, for a<br />
total improvement of approximately 1.5 percent.<br />
< previous page page_66 next page >
previous page page_67 next page ><br />
6<br />
Preparation for <strong>Boiler</strong> Testing<br />
Page 67<br />
Efficiency improvements obtained under a deteriorated state of the boiler can be substantially less<br />
than the improvements achieved under proper working conditions. It is essential that the boiler be<br />
examined prior to testing and that necessary repairs or maintenance be completed. A partial summary<br />
of the items that should be included in the preliminary boiler inspection is given in Table 6-1.<br />
Essentially, any item that could ultimately affect the combustion process in the furnace should be<br />
included and repaired prior to implementing an efficiency improvement program.<br />
Stack Instrumentation<br />
Gaseous Constituents<br />
It is necessary to measure the concentration of either excess O2 or carbon dioxide to determine the<br />
operating excess air levels. (As discussed in Chapter 1, excess O2 is generally preferred due to fewer<br />
measurement errors.)<br />
Carbon monoxide is also measured. CO is the primary indicator of incomplete combustion on gas fuel.<br />
CO measurements on oil and coal fuel are generally not mandatory since smoking or excessive carbon<br />
carryover will usually precede high CO levels.<br />
Portable electronic analyzers are available for both O2 and CO2 measurements. Alternative<br />
measurement techniques include an Orsat analyzer or other hand-held chemical absorbing type<br />
analyzer and ''length of stain" detectors. Calibration procedures and verification are important<br />
criteria.<br />
A partial list of the available portable analyzers is given in Table 6-2.<br />
< previous page page_67 next page >
previous page page_68 next page ><br />
TABLE 6-1. Preliminary <strong>Boiler</strong> Inspection Checklist.<br />
BURNERS Combustion Controls Furnace<br />
Gas Firing Oil Firing Pulv. Coal Firing Stoker Firing<br />
Condition and<br />
cleanliness of gas<br />
injection orifices<br />
Cleanliness and<br />
operation of filter &<br />
moisture traps<br />
Condition and<br />
orientation of diffusers,<br />
spuds, gas canes, etc.<br />
Condition of burner<br />
refractory<br />
Condition and<br />
operation of air dampers<br />
Condition and cleanliness<br />
of oil tip passages<br />
Condition and operation<br />
of pulverizers, feeders<br />
and conveyors<br />
Wear on grates Cleanliness and proper<br />
movement of fuel valves<br />
Oil burning temperature Coal fineness Positioning and operations of<br />
stokers<br />
Atomizing steam pressure Condition of coal pipes Positioning of all air<br />
proportioning dampers<br />
Condition and orientation<br />
of burner diffusers<br />
For any signs of<br />
excessive erosion or<br />
burnoff<br />
Position of oil guns Condition and operation<br />
of air dampers<br />
Cleanliness of oil strainer<br />
Condition of burner<br />
throat refractory<br />
Condition and operation<br />
of air dampers<br />
Excessive "play" in control<br />
linkage or air dampers<br />
Adequate pressure to all<br />
pressure regulators<br />
Excessive deposits or<br />
fouling of gasside boiler<br />
tubes<br />
Proper operation of<br />
sootblowers<br />
Casing and duct leaks<br />
Coal sizing Unnecessary cycling of firing rate Clean and operable<br />
furnace inspection ports<br />
Operation of cinder<br />
reinjection system<br />
PROPER OPERATION 0F ALL<br />
SAFETY INTERLOCKS AND<br />
BOILER TRIP CIRCUITS<br />
< previous page page_68 next page ><br />
KVB®<br />
Page 68
previous page page_69 next page ><br />
TABLE 6-2. Portable Gaseous Stack Gas Analyzers Based on Manufacturer's Information (Incomplete).<br />
Manufacturer Model Capabilities Comments<br />
<strong>The</strong>rmox Division, WDG-P Oxygen Zirconium Oxide Measurement<br />
AMETEK, Inc. WDG-P-CA<br />
P-100<br />
Oxygen and Combustibles Zirconium Oxide and catalytic detector<br />
Beckman 715 Oxygen Auxiliary pump required<br />
Teledyne 320P Oxygen Fuel cell detector Built-in pump<br />
980 Oxygen and Combustibles Catalytic bed sensor, built-in pump,comb.<br />
calibration gas req.<br />
Mine Safety Appliances (MSA) 830P Oxygen Electrolyte fuel cell detector, built-in pump<br />
Bacharach Combustion Testing Kit Oxygen, Carbon Dioxide, Carbon Monoxide Gaseous absorption for O2 and CO2, length-ofstain<br />
for CO; various additional test equipment<br />
available<br />
Hays 621 A.31:30 Oxygen, Carbon Dioxide, Carbon Monoxide Orsat analyzer<br />
Dragger 31 Carbon Monoxide Length-of-stain analyzer<br />
< previous page page_69 next page ><br />
Page 69
previous page page_70 next page ><br />
Stack Opacity (Smoke Density)<br />
Page 70<br />
Smoking on oil or coal fuel is a certain indication of flue gas combustibles or unacceptable flame<br />
conditions and should always be avoided. Stack opacity is generally used as the criterion for<br />
determining minimum excess air levels for oil and coal firing (whereas excessive CO emissions are<br />
used on natural gas firing). Smoke measurements can be made using hand pump filter paper testers or<br />
visual observation to a Ringlemann scale.<br />
Stack Temperature<br />
Accurate stack gas temperature measurements can be obtained using a dial type temperature gage or<br />
thermocouples.<br />
Stack Sampling Techniques<br />
It is essential that the portion of the stack gas analyzed for temperature and gaseous constituents be a<br />
representative sample of the bulk of the stack gas flow. Examples of uniform stack gas conditions and<br />
severe maldistributions are given in Figures 6-1 and 6-2 respectively. Sample location should be<br />
selected so as to minimize the effects of air leakage and gaseous stratification in the exhaust duct.<br />
Flame Appearance<br />
<strong>The</strong> appearance of a boiler's flame can provide a good preliminary indication of combustion<br />
conditions. While the characteristics of a "good" flame are somewhat subjective, flames of a definite<br />
appearance have usually been sought. Oil and pulverized flames should be short, bright, crisp and<br />
highly turbulent. Gas flames should be blue, slightly streaked or nearly invisible.<br />
For stokers, an even bed and an absence of carbon streams are important criteria. Stability of the<br />
flame at the burner and minimum furnace vibration are also desired.<br />
Operation with reduced excess O2 levels may result in a different flame appearance. Flames may<br />
appear to grow in volume<br />
< previous page page_70 next page >
previous page page_71 next page ><br />
Figure 6-1<br />
Flue gas composition and temperature profiles at<br />
the outlet of a small D-type watertube boiler.<br />
Page 71<br />
< previous page page_71 next page >
previous page page_72 next page ><br />
Figure 6-2<br />
Flue gas composition and temperature profiles at the outlet of a large firetube boiler.<br />
Page 72<br />
and more completely "fill" the furnace. Low O2 flames sometimes exhibit a "lazy" rolling appearance.<br />
<strong>The</strong> overall color may change with natural gas fires becoming more visible or luminous and coal and<br />
oil flames becoming darker yellow or orange.<br />
< previous page page_72 next page >
previous page page_73 next page ><br />
7<br />
An Update and Overview of Flue Gas Measurement<br />
Timothy Jones, Product Manager<br />
AMETEK, Inc., <strong>The</strong>rmox Instruments Division<br />
Page 73<br />
Controlling the efficiency of combustion processes is as important today to the operators of large<br />
power boilers for an electrical utility as it is to the person who runs a small furnace or water heater in<br />
a residential dwelling. <strong>The</strong> steady increase of fossil fuel prices over the past two decades has made<br />
energy conservation an important way to control costs.<br />
One of the best ways to reduce wasted fuel is to monitorand increasecombustion efficiency. <strong>The</strong><br />
amounts of oxygen and combustibles that are being allowed to flow out of a smokestack can be<br />
measured in a number of different ways. <strong>The</strong>se measurements are facilitated by a new generation of<br />
microprocessor-based analyzers with self-diagnostic systems that are easier to calibrate and operate.<br />
To make sure that the right gas analyzer is used for the job, plant operators and engineers must<br />
understand both the mechanics of combustion and why the amounts of excess oxygen and fuel leaving<br />
a stack should be kept to a minimum.<br />
Combustion Efficiency<br />
Combustion efficiency is a measurement of the effectiveness of a boiler, furnace or process heater to<br />
convert the energy within a fuel into heat. This efficiency can be expressed in an equation as the total<br />
energy contained per unit of fuel minus the energy carried<br />
< previous page page_73 next page >
previous page page_74 next page ><br />
away by the hot flue gases exiting up the stack divided by the total energy contained per unit of fuel:<br />
Refer back to Chapter 4 for a more detailed method of calculating efficiency.<br />
Two key components of this efficiency equation are the stoichiometric air/fuel ratio and the heat of<br />
combustion value for the fuel being burned. <strong>The</strong> stoichiometric ratio shows the exact amounts of air<br />
and fuel needed for a combustible to be completely consumed. <strong>The</strong> heat of combustion shows the<br />
amount of energy that would be released in such a perfect reaction.<br />
Page 74<br />
As an example, methane has a stoichiometric ratio of one cubic foot of methane to 9.53 cubic feet of<br />
air. (This is assuming the standard sample of air contains about 21 percent oxygen and 79 percent<br />
nitrogen.) At this ratio, the methane would be fully burned and would release 1013 Btu per cubic feet.<br />
<strong>The</strong>refore, any combustible that is burned at an air/fuel ratio which is higher or lower than its<br />
predetermined stoichiometric figure will result in either wasted fuel or wasted energy.<br />
Burning with Excess Oxygen<br />
Before energy efficiency was a concern, it was common to run a burner with large amounts of air to<br />
ensure that a fuel burned completely. Today, that is seen as a highly wasteful practice.<br />
When there is too much airor too little fuelpresent during a burning process, only the amount of<br />
oxygen needed for stoichiometric combustion is used. <strong>The</strong> rest of the air simply flows up the flue,<br />
carrying with it useful heat from the process. This is because the air enters the burner at ambient<br />
temperature, but leaves at the increased temperature of the flue gas.<br />
Energy loss from excess oxygen increases with temperature, meaning that the higher the temperature<br />
of the exit gas, the greater the loss of energy from unnecessary air escaping through the flue.<br />
< previous page page_74 next page >
previous page page_75 next page ><br />
Burning with Excess Fuel<br />
Page 75<br />
On the other hand, it is more wasteful to burn with excess fuel, or not enough air. Only the amount of<br />
fuel needed to reach a stoichiometric balance with the available oxygen will burn, sending unused fuel<br />
up and out the stack. Energy, as well as fuel, is wasted in this situation since the fuel is not burning as<br />
efficiently as it potentially could. This also can result in high levels of carbon monoxide in the flue gas.<br />
Carbon monoxide in the flue gas can result in soot formation and lower heat transfer effectiveness. For<br />
example, if a burner is operated with excess amounts of methane, carbon monoxide and hydrogen will<br />
appear as byproducts of the reaction. <strong>The</strong>se combustibles will escape from the process instead of being<br />
consumed as they would be if sufficient air with proper mixing had been available. In high-enough<br />
concentrations, these combustibles also could create a potentially explosive environment.<br />
Controlling Air/Fuel Ratio<br />
<strong>The</strong> best way to achieve complete fuel consumption with low energy waste is to measure the<br />
byproducts of the combustion process. <strong>The</strong> availability of reliable, inexpensive flue gas analyzers<br />
insures that combustion may now be controlled with precision. Both excess oxygen and excess fuel can<br />
be measured as they leave the burner and stack. Analyzers provide either exact amounts of these<br />
elements or percentages of the whole. With these numbers, air dampers can be opened or closed and<br />
fuel flows can be adjusted.<br />
Measuring Oxygen in Flue Gases<br />
<strong>The</strong>re are four methods currently in use to measure oxygen in flue gases. <strong>The</strong>y are the Orsat test,<br />
paramagnetic oxygen sensors, wet electrochemical cells and zirconium oxide cells.<br />
Orsat test. One of the earliest methods of measurement, the manually performed Orsat test is still used<br />
today. A sample of flue gas, which has been conditioned (cleaned, dried and cooled), is passed through<br />
a series of pipets each of which contains a separate chemical reagent. <strong>The</strong> reagents each absorb a<br />
different chemical in the gasusually oxygen, carbon monoxide and carbon dioxide.<br />
< previous page page_75 next page >
previous page page_76 next page ><br />
As the gas passes through each pipet, its volume is measured. Any change in measurements indicates<br />
the amount of a particular gas that was absorbed.<br />
Page 76<br />
<strong>The</strong>re are several disadvantages to the Orsat test. It is slow, repetitive work and its accuracy depends<br />
on the purity of the reagents and the skill of the operator. Also, there is no way to provide an<br />
automatic signal for a recorder or control system.<br />
Paramagnetic oxygen sensor. This sensor takes advantage of the fact that oxygen molecules are<br />
strongly influenced by a magnetic field. One common design uses two diamagnetic nitrogenfilled<br />
quartz spheres connected by a quartz rod in a dumbbell shape. <strong>The</strong> dumbbell is supported and<br />
suspended in a nonuniform magnetic field. Since the spheres are diamagnetic, they will swing away<br />
from the magnetic field.<br />
When a gas containing oxygen is introduced into the spheres, the dumbbell will swing toward the<br />
magnetic field across a distance that is proportional to the amount of oxygen in the gas. This<br />
movement can be detected either optically or electronically.<br />
Since it is a delicate process, paramagnetic sensors work best in a laboratory and not in an industrial<br />
setting. Any sample of flue gas used must be cleaned, dried and cooled before being put into the<br />
mechanism. Flue gas constiuents, such as nitrous oxide and some hydrocarbons, have paramagnetic<br />
properties that interfere with the test results.<br />
Wet electrochemical cells. <strong>The</strong>se cells use two electrodes in contact with an aqueous electrolyte<br />
through which gases containing oxygen are passed. <strong>The</strong> oxygen in the gas enters into a chemical<br />
reaction in which four electrons from each oxygen molecule release hydroxyl ions into the electrolyte<br />
at a cathode. <strong>The</strong>se hydroxyl ions in turn react with a lead or cadmium anode with the subsequent<br />
release of four electrons to an external circuit. <strong>The</strong> net flow of electrons creates an electrical current<br />
which is proportional to the amount of oxygen passing through the cell.<br />
Wet cells require sample conditioning of flue gas before it can be released into the cell. Without such<br />
cooling and cleaning, the cell membrane quickly becomes coated and ceases to function. <strong>The</strong> cells also<br />
must be stored in air-tight containers since any oxygen, not just that from a flue gas sample, will cause<br />
the anode to oxidize.<br />
< previous page page_76 next page >
previous page page_77 next page ><br />
Zirconium oxide cell. Zirconium oxide testing was developed as a byproduct of the U.S. space<br />
program. Because of its ability to measure oxygen in hot dirty gases without sample conditioning, it<br />
quickly became an industry standard.<br />
Page 77<br />
<strong>The</strong> heart of the sensing element is a closed-end tube made of ceramic zirconium oxide stabilized with<br />
an oxide of yttrium or calcium. Porous coatings of platinum on the inside and outside serve as<br />
electrodes. At high temperatures (normally above 1200 degrees F), oxygen molecules coming in contact<br />
with the platinum pick up four electrons and become highly mobile oxygen ions. As long as the<br />
concentration of oxygen is equal on each side of the cell, there is no movement of ions through the<br />
zirconium.<br />
When the two electrodes are in contract with gases having different oxygen partial pressures, ions<br />
move from the area of higher pressure to that of lower pressure, creating a difference in voltage<br />
between the electrodes.<br />
When the partial pressure of one gas (usually air) is known, the electrical current created is a measure<br />
of the pressure and oxygen content of the other gas. In equation form, the voltage shift is equal to a<br />
predetermined constant multiplied by the logarithm of the ratio of two different oxygen partial<br />
pressures.<br />
<strong>The</strong> constant is based on the temperature of the zirconium cell, standard gas laws and free electron<br />
values. <strong>The</strong> cell produces zero voltage when air is on both sides. Under other conditions, this voltage<br />
increases as the oxygen concentration of the sample decreases.<br />
One of the key advantages of the zirconium oxide cell is that it operates at high temperatures, which<br />
means there is no need to cool or dry the flue gas before it is analyzed. Most zirconium cells make<br />
direct measurements in or near the stack with the only protection being a filter to keep ash out of the<br />
sampling chamber. Unlike the wet electrochemical cell, the zirconium oxide cell has a virtually<br />
unlimited shelf life.<br />
Types of Oxygen Analyzers<br />
Both the paramagnetic and the wet electrochemical cell analysis requires sample conditioning to clean,<br />
cool, and dry the flue gas before measurement can be made. <strong>The</strong> Orsat test cannot<br />
< previous page page_77 next page >
previous page page_78 next page ><br />
be used for a continuous on-line analysis of flue gas. <strong>The</strong> zirconium oxide cell is the only continuous analyzing method that can be<br />
performed directly on the stack without the need for sample conditioning.<br />
Just as there are different methods of determining the amount of oxygen in a flue gas sample, there also are three different arrangements<br />
by which the sensor units are brought into contact with gases on the stack to measure oxygen. <strong>The</strong>se types of analyzers are: (1) in situ, (2)<br />
convective, (3) close-coupled extractive. While a fourth type, the extractive analyzer, will work off a long line from the stack, the samples<br />
need to be cooled, cleaned and dried before they can be tested.<br />
Figure 7-1<br />
Cutaway View of an In Situ Oxygen Analyzer<br />
In situ analyzer. As its name implies, the in situ analyzer is placed directly in the flow of the flue gas. <strong>The</strong> zirconium oxide cell is located at<br />
the end of a stainless-steel probe nine inches to nine feet in length, depending on the application. (See Fig. 7-1)<br />
A heating element, in conjunction with a thermocouple, controls the cell temperature to ensure proper operation. A flame arrestor can be<br />
placed ahead of the cell to prevent the hot zirconium oxide from igniting any combustibles in the stack. Flue gas diffuses into the probe<br />
opening and comes in contact with the zirconium oxide. <strong>The</strong> voltage created by the difference in oxygen pressure is carried by a cable to<br />
the control unit where it is changed to an output signal suitable for an automatic controller or recorder.<br />
Page 78<br />
< previous page page_78 next page >
previous page page_79 next page ><br />
Page 79<br />
<strong>The</strong> compact design of an in situ analyzer makes it suitable for many industrial applications. With the<br />
addition of a filter element, in situ sensors can be used in such dirty testing environments as cement<br />
kilns and recovery boilers.<br />
<strong>The</strong>re are some drawbacks in its applications. Since its analyzing units are located directly in the<br />
stack, the in situ unit cannot be used in applications where temperatures are more than 1250 degrees<br />
F. A convective or close-coupled unit would be more applicable in such circumstances. One other<br />
drawback to older in situ models has been difficulty of servicing them. When an in situ probe stopped<br />
functioning, it had to be taken completely off line and shipped back to its manufacturer for repairs.<br />
Newer in situ units, however, employ a modular construction and the internal unit, which includes the<br />
cell, furnace and thermocouple, can be removed for on-site inspection and repair. Parts can be<br />
unscrewed and replaced in minutes, instead of the weeks or months needed for a factory repair.<br />
<strong>The</strong>se newer models also have microprocessor-based controls which make calibration, maintenance<br />
and repair easier. (See Fig. 7-2.) An electronic in situ probe can be calibrated with the push of one<br />
button, in contrast to the tedious task of hand-adjusting the older analog systems which remain<br />
susceptible to fading and drifting.<br />
Maintenance and repair of these newer systems is made even easier by a self-diagnostic system which,<br />
through the use of digital codes, indicates what is wrong and what needs to be fixed or replaced.<br />
Convective analyzer (hybrid model). This type of analyzer uses the physical property of convection to<br />
move sample flue gas to the zirconium oxide cell located just outside the process wall. Since hot air<br />
rises, the oxygen-sensing cell is placed above the level of the gas inlet pipe. As gas in the vicinity of the<br />
cell is heated, it rises up and out of the cell housing and is replaced by gas being drawn out of the filter<br />
chamber and into the inlet pipe. <strong>The</strong> gas that has left then cools off on its way back into the filter<br />
chamber through a continuous loop. (See Fig. 7-3.) Process gas is constantly diffusing in and out of the<br />
filter chamber.<br />
< previous page page_79 next page >
previous page page_80 next page ><br />
Figure 7-2<br />
Microprocessor-based Control Unit<br />
<strong>The</strong> temperature between the gases can differ by as much as 1300 degrees F inside the cell housing<br />
when passing the zirconium cell and 400 degrees F on the return loop outside it, where the<br />
temperature differential sets up the convection flow.<br />
Page 80<br />
<strong>The</strong> intake area of the convective analyzer is surrounded by a filter. This makes it ideal for use in such<br />
high particulate applications as coal, cement and waste incinerators, and recovery boilers.<br />
< previous page page_80 next page >
previous page page_81 next page ><br />
Figure 7-3<br />
Cutaway View of a Convective Analyzer<br />
Since gases diffuse through the filter and are drawn into the analyzer by convection, the force on the<br />
process gas is not great enough to pull unwanted particles through the filter and into the cell.<br />
Page 81<br />
<strong>The</strong> convective probe can be used in temperatures of up to 2800 degrees F. Its only limitation is the<br />
length of the inlet probe, which is a maximum of 48 inches. Like the in situ, newer models of convective<br />
units are av.ailable with microprocessor-based controllers to help with calibration and maintenance.<br />
All working parts are located outside the stack, so most repairs can be done on site.<br />
Close-coupled extractive analyzer. Unlike the in situ and convective probes, a close-coupled extractive<br />
probe uses the force of an air-driven aspirator to pull flue gas samples into the analyzer. <strong>The</strong> sensor is<br />
located just outside the process wall and is connected to a probe that protrudes into the flue gas<br />
stream. (See Fig. 7-4.)<br />
< previous page page_81 next page >
previous page page_82 next page ><br />
Figure 7-4<br />
Cutaway of a Close-coupled Extractive Analyzer<br />
Page 82<br />
Flue gas is pulled into the heated sampling area by the aspirator, which creates a vacuum by forcing<br />
air out the other end of the loop. <strong>The</strong> flue gas enters the pipe to fill the vacuum and about 5 percent of<br />
it is lifted into the furnace and cell through the same convection process used in the convective<br />
analyzer.<br />
Since the sensor is located so close to the stack and is heated, no sample conditioning is needed. As a<br />
trade-off for using force to pull samples into the analyzing loop, the close-coupled extractive unit must<br />
be used in relatively clean burning applications, such as natural gas and some lighter grades of oil.<br />
This type of sensor yields the fastest response to process changes.<br />
<strong>The</strong>re is no practical limit on the length of the probe and the analyzer can be used at temperatures of<br />
up to 3200 degrees F. As<br />
< previous page page_82 next page >
previous page page_83 next page ><br />
Page 83<br />
with the other two analyzers already described, newer models of the close-coupled extractive unit are<br />
available with microprocessor-based controllers.<br />
Extractive analyzers. Extractive analyzers are not usually considered to be stack-mounted sensor<br />
units. This is because, in a number of units, the gas is being extracted as far as 50 to 100 feet away<br />
from the stack for analysis. Once the sample gas reaches the analyzer, it must be conditioned (cooled,<br />
cleaned and dried) before being tested by an Orsat, paramagnetic oxygen, wet electrochemical or<br />
zirconium oxide sensor.<br />
Measuring Combustibles in Flue Gases<br />
<strong>The</strong>re are three methods currently in use to measure such flue gas combustibles as carbon monoxide<br />
and hydrogen. <strong>The</strong>y are wet electrochemical cells, catalytic combustibles detectors and nondispersive<br />
infrared absorption.<br />
Wet electrochemical cells. This method for measuring carbon monoxide is very similar to that of<br />
electrochemical oxygen detection cells. Carbon monoxide is passed through a membrane, comes into<br />
contact with an anode and cathode, and become ionized, creating a voltage difference. This change in<br />
voltage is directly proportional to the amount of carbon monoxide that is flowing through the cell.<br />
However, only carbon monoxide, and not hydrogen, can be measured with this type of cell. <strong>The</strong> cells<br />
can become clogged by dirty flue gas, making it necessary to condition samples before analysis.<br />
Catalytic combustibles detector. Catalytic detectors are in wide use to detect combustible gases in the<br />
air of such closed areas as mines and parking garages. Recently, versions of these detectors have been<br />
put to use in flue gas applications.<br />
In a catalytic sensor, oxygen and combustibles are brought together to bum at temperatures below<br />
their normal reaction point of more than 1000 degrees F. This is done by bringing them in contact with<br />
a catalyst element. In the case of flue gas, this catalyst usually is platinum, which is maintained at a<br />
temperature of about 400 degrees F.<br />
<strong>The</strong> detector itself consists of two resistance elements protrud-<br />
< previous page page_83 next page >
previous page page_84 next page ><br />
ing into the sample stream of flue gas. One of the elements, the active element, is coated with the<br />
platinum catalyst while the other element, the reference element, is coated with an inert binder.<br />
Page 84<br />
When it is heated to more than 400 degrees F, the sensor causes any oxygen and combustibles in the<br />
flue gas to burn when they come in contact with the platinum. This adds heat to the active element and<br />
changes its electrical resistance. <strong>The</strong> difference between the resistance of the two elements is directly<br />
proportional to the amount of combustibles in the flue gas sample passing through the sensor.<br />
Quality flue gas combustibles analyzers with full-scale ranges, as sensitive as 0 to 2000 parts per<br />
million, use thin film resistance elements that are laser trimmed and computer matched for high<br />
accuracy. Certain models also are available with microprocessors for added accuarcy and convenience.<br />
Several models of convective and close-coupled extractive oxygen analyzers incorporate catalytic<br />
combustible sensors, providing both oxygen and combustible measurements from the same unit.<br />
Non-dispersive infrared absorption. Carbon monoxide is one of many gases known to absorb infrared<br />
energy of specific wavelengths. Use of this principle allows the presence of carbon monoxide to be<br />
measured using light waves. If a beam of infrared light is passed through a gas sample containing<br />
carbon monoxide and if the emerging energy is measured with a spectrophotomer, significantly less<br />
energy will be detected for wavelengths between 4.5 and 4.7 microns than if the carbon monoxide were<br />
not present.<br />
<strong>The</strong> amount of energy absorbed is a measure of the concentration of carbon monoxide in the sample<br />
through the use of Beer's Law. If the length the infrared energy travels is kept constant, the amount of<br />
carbon monoxide present is directly proportional to the ratio of the infra-red intensity before passing<br />
through the gas and its intensity after passing through it.<br />
This infrared absorption method can be used to identify carbon monoxide in two types of analyzersoffstack<br />
and across-the stack.<br />
As its name imples, an off-stack absorption analyzer tests flue gas for carbon monoxide after it is<br />
extracted from the stream in<br />
< previous page page_84 next page >
previous page page_85 next page ><br />
the stack. <strong>The</strong> gas is cooled, cleaned, dried and placed in a sample cell. Bursts of infrared energy are<br />
shot through the cell and through a reference cell containing air. <strong>The</strong>se bursts then pass through an<br />
optical filter that removes all wavelengths but those between 4.5 and 4.7 microns. <strong>The</strong> difference<br />
between the energy in the two paths indicates how much carbon monoxide is in the flue gas sample.<br />
Figure 7-5<br />
Typical Across-the stack CO Analyzer<br />
Page 85<br />
Unlike the off-stack sensor, which reads the carbon monoxide concentration at the point the sample<br />
was taken, an in situ across-the-stack unit measures the amount of carbon monoxide in a cross-section<br />
of the entire flue gas stream.<br />
An across-the-stack analyzer shoots its bursts of infrared energy directly through the flue. (See Figure<br />
7-5.) Instead of passing through a reference tube of air after reaching the other side, the bursts pass<br />
through two rotating cells. One of these cells contains pure carbon monoxide, which blocks out all the<br />
4.5-4.7 micron radiation. <strong>The</strong> other one contains pure nitrogen, which allows all the waves to pass<br />
through. <strong>The</strong> difference in these signals is inversely proportional to the carbon monoxide present in<br />
the stack.<br />
Besides providing full-stream readings, the across-the-stack analyzer offers an instantaneous response<br />
to changes in carbon monoxide concentrations. Newer models are lightweight, much more compact,<br />
and can be purchased with microprocessor controls.<br />
Choosing the Right Analyzing System<br />
<strong>The</strong> choice of a flue gas analyzing system must be based on the specific needs of the application. For<br />
example, the operator of a<br />
< previous page page_85 next page >
previous page page_86 next page ><br />
Page 86<br />
resource recovery burner does not need to be as concerned about fuel efficiencysince the fuel is sludge<br />
or garbageas about the amount of carbon monoxide being released into the air. On the other hand, the<br />
operator of an electric utility, which burns pulverized coal, must be concerned with measuring both<br />
oxygen and combustibles in a dirty stack environment.<br />
Deciding the exact needs of a process is the first step in choosing a system of sensors. Once that is done,<br />
there are a number of analyzers that could work for specific situations. Combination oxygencombustible<br />
analyzers, with microprocessor controls, are among the best in design, but the lowest in<br />
cost. (See Fig. 7-6.) <strong>The</strong>re are systems made of a combination of in situ oxygen analyzers and infrared<br />
carbon monoxide analyzers for special applications.<br />
Figure 7-6<br />
Oxygen and Combustibles Control Unit<br />
When shopping for analyzers, though, it is important to make comparisons on the basis of the same<br />
specifications. Some systems which at first glance seem to meet all expectations, may upon closer<br />
inspection not be based in a true application. So before making the final selection, know the<br />
application, consult with the manufacturers and study the specifications to make sure that the right<br />
analyzer is being purchased for the job.<br />
< previous page page_86 next page >
previous page page_87 next page ><br />
8<br />
<strong>Boiler</strong> Test Procedures<br />
Page 87<br />
<strong>The</strong> principal method used for improving boiler efficiency involves operating the boiler at the lowest<br />
practical excess O2 level with an adequate margin for fuel variations in fuel properties and ambient<br />
conditions and the repeatability and response characteristics of the combustion control system. <strong>The</strong>se<br />
tests should only be conducted with a thorough understanding of the test objectives.<br />
<strong>Boiler</strong> Test Procedures<br />
Cautions<br />
• Extremely low excess O2 operation can result in catastrophic results.<br />
• Know at all times the impact of the modification on fuel flow, air flow and the control system.<br />
• Observe boiler instrumentation, stack and flame conditions while making any changes.<br />
• When in doubt, consult the boiler manufacturer.<br />
• Consult the boiler operation and maintenance manual supplied with the unit for details on the<br />
combustion control system or methods of varying burner excess air.<br />
Test Description<br />
<strong>The</strong> test series begins with baseline tests that document existing ''as-found conditions" for several<br />
firing rates over the boiler's normal operating range. At each of these firing rates, variations in excess<br />
O2 level from 1 to 2% above the normal operating point to the "minimum O2" level are made. Typical<br />
ranges of minimum excess O2's are given on Table 8-1.<br />
< previous page page_87 next page >
previous page page_88 next page ><br />
Coal<br />
TABLE 8-1. Typical Excess Air Requirements and Resultant O2 In Flue Gas at Furnace Outlet<br />
Cyclone furnace<br />
Pulverized firing<br />
Stoker firing<br />
Excess Air(%) O2 in Flue Gas (%)<br />
715 1.53<br />
2030 45<br />
2540 4.56.5<br />
Oil 315
previous page page_89 next page ><br />
Figure 8-1<br />
Typical smoke-O2 characteristic curves for coal- or oil-fired industrial boilers.<br />
Page 89<br />
< previous page page_89 next page >
previous page page_90 next page ><br />
Figure 8-2<br />
Typical CO-O characteristic curve for gas-fired industrial boilers.<br />
Page 90<br />
< previous page page_90 next page >
previous page page_91 next page ><br />
TABLE 8-2. Maximum Desirable Smoke Spot Number<br />
Fuel Grade Maximum Desirable SSN<br />
No. 2 less than 1<br />
No. 4 2<br />
No. 5 (light and heavy), and low-sulfur resid 3<br />
No. 6 4<br />
Step-by-Step <strong>Boiler</strong> Adjustment Procedure for Low Excess O2 Operation<br />
1. Bring the boiler to the test firing rate and put the combustion controls on manual.<br />
2. After stabilizing, observe flame conditions and take complete set of readings.<br />
3. Raise excess O2 12%, allowing time to stabilize and take readings.<br />
4. Reduce excess O2 in small steps while observing stack and flame conditions. Allow the unit to<br />
stabilize following each change and record data.<br />
5. Continue to reduce excess air until a minimum excess O2 condition is reached.<br />
6. Plot data similar to Figures 8-1 and 8-2.<br />
Page 91<br />
7. Compare the minimum excess O2 value to the expected value provided by the boiler manufacturers.<br />
High excess O2 levels should be investigated.<br />
8. Establish the margin in excess O2 above the minimum and reset the burner controls to maintain this<br />
level.<br />
9. Repeat Steps 1-8 for each firing rate to be considered. Some compromise in optimum O2 settings<br />
may be necessary since control adjustments at one firing rate may affect conditions at other firing<br />
rates.<br />
< previous page page_91 next page >
previous page page_92 next page ><br />
10. After these adjustments have been completed, verify the operation of these settings by making<br />
rapid load pick-ups and drops. If undesirable conditions are encountered, reset controls.<br />
11. Low fire conditions may require special consideration.<br />
12. Perform tests on any alternate fuel used. Again, some discretion will be required to resolve<br />
differences in control settings for optimum conditions on the two fuels.<br />
Evaluation of the New Low O2 Settings<br />
Page 92<br />
Extra attention should be paid to furnace and flame patterns for the first month or two following<br />
implementation of the new operating modes. Thoroughly inspect the boiler during the next shutdown.<br />
To assure high boiler efficiency, periodically make performance evaluations and compare with the<br />
results obtained during the test program.<br />
Burner Adjustments<br />
Adjustments to burner and fuel systems can also be made in addition to the low excess O2 test<br />
program previously described. <strong>The</strong> approach in testing these adjustments is a "trial-and-error"<br />
procedure with sufficient organization to allow meaningful comparisons with established data.<br />
Items that may result in lower minimum excess O2 levels include changes in:<br />
burner register settings fuel oil temperature<br />
oil gun tip position fuel and atomizing pressure<br />
oil gun diffuser position coal particle size<br />
coal spreader position<br />
Evaluation of each of these items involves the same general procedures, precautions and data<br />
evaluation as outlined previously. <strong>The</strong> effect of these adjustments on minimum O2 are variable from<br />
boiler to boiler and difficult to predict.<br />
< previous page page_92 next page >
previous page page_93 next page ><br />
9<br />
Efficiency-Related <strong>Boiler</strong> Maintenance Procedures<br />
This chapter can assist the purchasers and operators of industrial and commercial boilers in<br />
establishing maintenance programs specifically aimed at maintaining high efficiency levels for gas-,<br />
oilor coal-fired units in sizes ranging from 10,000 to 500,000 lb/hr steam flow.<br />
Efficiency-related boiler maintenance aims to correct any condition, other than a fuel change, which<br />
results in increased energy consumption to generate a given amount of steam.<br />
Thus, at constant boiler load any condition is considered efficiency-related if the component<br />
malfunction or performance degradation resulted in an increase in:<br />
1. stack gas temperature<br />
2. excess air requirements<br />
3. carbon monoxide, smoke or unburned carbon in ash<br />
4. convection or radiation losses from the boiler exterior, ductwork and piping<br />
5. blowdown above that required to maintain permissible boiler water concentration<br />
6. auxiliary power consumption by fans, pumps or pulverizers.<br />
This definition distinguishes efficiency-related maintenance items from maintenance normally<br />
performed for personnel or equipment protection. <strong>The</strong> maintenance procedures discussed in this<br />
chapter are directed to maintaining efficient operations and are not intended to replace any<br />
procedures which are required for safety reasons or recommended by the manufacturer to extend<br />
equipment life.<br />
Page 93<br />
< previous page page_93 next page >
previous page page_94 next page ><br />
Page 94<br />
In fact, efficiency-related boiler maintenance might be looked upon simply as a more intensive<br />
application of preventive maintenance procedures in areas where efficiency is affected before the<br />
equipment has deteriorated to the point where reliability, safety or capacity is threatened. For<br />
example, ash or soot deposits on heating surfaces may reduce heat transfer and increase exit flue gas<br />
temperature but would not affect plant safety or load carrying capability unless the deposits restricted<br />
gas passages to the extent that insufficient air could be supplied to the unit.<br />
Efficiency Spotcheck<br />
A spotcheck of combustion conditions using stack measurements of O2, CO, smoke and temperature<br />
as well as flame appearance is an effective maintenance tool. <strong>The</strong>se tests should be conducted at<br />
operating conditions corresponding to those used in establishing performance goals.<br />
Again, test data should be recorded so that deterioration in operating efficiency can be readily<br />
identified. <strong>The</strong> frequency of these spotchecks will depend on the complexity of the system and<br />
manpower available but should be on at least a weekly basis.<br />
Establishing Performance Goals<br />
<strong>The</strong> initial requirement of an efficiency-related boiler maintenance program is to establish best<br />
achievable performance of the unit over the operating load range.<br />
For new units, data taken during initial startup should be compared to manufacturer's predicted<br />
performance to establish that the unit is operating as designed. Every effort should be made to resolve<br />
performance discrepancies while the manufacturer's service representative is on the job. Some<br />
increase in gas temperatures can be expected in the first few months of operation on oilor coal-fired<br />
units as gas side deposits stabilize.<br />
On older units, baseline data should be taken over the load range after the boiler has had an extensive<br />
outage for cleaning,<br />
< previous page page_94 next page >
previous page page_95 next page ><br />
Page 95<br />
inspection and repair followed by a control system and burner system tune-up. With effective cleaning,<br />
repair and tune-up it should be possible to operate at full load with 15% or lower excess air at the<br />
boiler outlet on gas firing, 20% or lower excess air on oil firing, 20 to 30% excess air on pulverized<br />
coal firing and 30 to 40% excess air on stoker firing.<br />
<strong>The</strong> exit gas temperature on firetube or watertube boilers without economizers or air heaters should<br />
not be greater than 200ºF above saturated steam temperature at full load for the majority of designs.<br />
Less favorable excess air or exit gas temperature would indicate the potential for further improvement<br />
in operation.<br />
When air heaters and/or economizers are installed, variations in design make generalization on exit<br />
gas temperature impossible. Gas and air side pressure drops are also extremely design dependent and<br />
defy generalization. Design data is therefore necessary to establish expected performance. <strong>The</strong> boiler<br />
manufacturer should be able to supply this information if plant records are incomplete.<br />
Performance Monitoring (<strong>Boiler</strong> Log)<br />
<strong>The</strong> objective of performance monitoring is to document deviations from desired performance as a<br />
function of time. This information should be obtained on a regular basis by the operator under steady<br />
load conditions. Data taken during load changes or under fluctuating load conditions will be<br />
inconsistent and of little value in assessing unit efficiency; however, control response should be noted<br />
during transient conditions.<br />
If widely fluctuating load is the normal condition, it may be necessary to make special arrangements to<br />
achieve steady boiler load for efficiency monitoring either through curtailing intermittent steam<br />
demands or taking load swings on other boilers. If the boiler master control is placed on manual<br />
operation the fuel/air ratio should be as established by the control system.<br />
<strong>The</strong> performance recorded under these conditions will indicate deviation from desired fuel/air ratio<br />
and other performance deviations. By manually adjusting fuel/air ratio to the desired level a<br />
< previous page page_95 next page >
previous page page_96 next page ><br />
second set of data can be obtained which represents performance deviations attributable to sources<br />
other than the fuel/air ratio such as surface cleanliness, boiler baffles, etc.<br />
Page 96<br />
<strong>The</strong> actual readings to be taken and the frequency are determined by the size and complexity of the<br />
equipment and the manpower which can be justified in collecting and analyzing data. Usual practice is<br />
to record data hourly to check general performance. <strong>The</strong>se hourly readings are to assure that the unit<br />
is operating normally and includes checking of safety and mechanical devices.<br />
Efficiency-related items which should be included in the boiler operator's log are:<br />
1. General data to establish unit output<br />
steam flow, pressure<br />
superheated steam temperature (if applicable)<br />
feedwater temperature<br />
2. Firing system data<br />
fuel type (in multi-fuel boilers)<br />
fuel flow rate<br />
oil or gas supply pressure<br />
pressure at burners<br />
fuel temperature<br />
burner damper settings<br />
windbox to furnace air-pressure differential<br />
other special system data unique to particular installation<br />
3. Air flow indication<br />
air preheater inlet gas O2<br />
stack gas O2<br />
optional - air flow pen, forced draft<br />
fan damper position, forced draft<br />
fan amperes<br />
4. Flue gas and air temperatures<br />
boiler outlet gas<br />
economizer or air heater outlet gas<br />
air temperature to air heater<br />
5. Unburned combustible indication<br />
CO measurement<br />
stack appearance<br />
flame appearance<br />
< previous page page_96 next page >
previous page page_97 next page ><br />
6. Air and flue gas pressures<br />
forced draft fan discharge<br />
furnace<br />
boiler outlet<br />
economizer differential<br />
air heater air and gas side differencial<br />
7. Unusual conditions<br />
steam leaks<br />
abnormal vibration or noise<br />
equipment malfunctions<br />
excessive makeup water<br />
8. Blowdown operation<br />
9. Sootblower operation.<br />
Page 97<br />
While this list may look extensive and time consuming the operator of a firetube or comparably sized<br />
watertube boiler (10,00024,000 lb steam per hour) will find that the data list will reduce to:<br />
steam pressure<br />
feedwater temperature<br />
steam, feedwater or fuel flow<br />
fuel supply pressure<br />
fuel supply temperature<br />
boiler outlet gas temperature<br />
boiler outlet O2<br />
F.D. fan inlet temperature<br />
stack appearance<br />
flame appearance<br />
windbox air pressure<br />
windbox to furnace air-pressure differential<br />
boiler outlet flue gas pressure<br />
blowdown operation<br />
unusual conditions or equipment malfunctions.<br />
< previous page page_97 next page >
previous page page_98 next page ><br />
If the unit is too small to justify a continuous O2 analyzer, the excess air should be checked by Orsat<br />
analysis weekly. If the burner is serviced by an outside organization the frequency should be at least<br />
monthly, and include an excess air determination. Carbon monoxide determination is particularly<br />
important on gas firing since high CO levels can develop without smoke formation, unlike oil or coal<br />
firing.<br />
Page 98<br />
If steady load conditions are difficult to obtain, less emphasis should be placed on the boiler operator's<br />
log for efficiency-related maintenance items and regularly scheduled performance checks should be<br />
made under steady conditions on a monthly basis for smaller units and on a bi-weekly basis for larger<br />
units. On coal-fired units monthly checks on ash combustible content should be made. On pulverized<br />
coal-fired units coal fineness should also be checked monthly.<br />
Periodic Equipment Inspection<br />
Items included in the Preliminary <strong>Boiler</strong> Inspection Checklist (Table 6-1) should be used as a basis for<br />
the periodic equipment inspection. Note that several of these items are included in the performance<br />
monitoring log and will therefore be inspected on a frequent basis. Other conditions should be checked<br />
during annual outages or more frequently if possible.<br />
Performance Troubleshooting<br />
Specific deviations from expected performance can be of considerable value in determining the cause<br />
of performance deficiency. Table 9-1 presents a summary of frequent problems encountered in boiler<br />
systems and the possible causes.<br />
< previous page page_98 next page >
previous page page_99 next page ><br />
TABLE 9-1. <strong>Boiler</strong> Performance Troubleshooting<br />
System Problem Possible Cause<br />
Heat Transfer Related High exit gas temperatures Buildup of gas-or water-side deposits<br />
Improper water treatment procedures<br />
Improper sootblower operation<br />
Combustion Related High Excess air Improper control system operation<br />
Low fuel supply pressure<br />
Change in fuel heating value<br />
Change in oil fuel viscosity<br />
Low excess air Improper control system operation<br />
Fan limitations<br />
Increased ambient air temperature<br />
High CO and combustible emissions Plugged gas burners<br />
Unbalanced fuel/air distribution in multiburner furnaces<br />
Improper air register settings<br />
Deterioration of burner throat refractory<br />
Stoker grate condition<br />
Stoker fuel distribution orientation<br />
Improper overfire air systems<br />
Low fineness on pulverized systems<br />
(continued)<br />
Page 99<br />
< previous page page_99 next page >
previous page page_100 next page ><br />
(table continued from previous page)<br />
System Problem Possible Cause<br />
Miscellaneous Casing leakage Damaged casing and insulation<br />
Air heater leakage Worn or improperly adjusted seals on rotary heaters<br />
Tube corrosion<br />
Coal pulverizing power Pulverizer in poor repair<br />
Too low classifier setting<br />
Excessive blowdown Improper operation<br />
Steam leaks Holes in waterwall tubes<br />
Valve packing<br />
Missing or loose insulation Overheating<br />
Weathering<br />
Excessive sootblower operation Arbitrary operation schedule that is in excess of requirements<br />
(end)<br />
Page 100<br />
< previous page page_100 next page >
previous page page_101 next page ><br />
Performance Deficiency Costs<br />
<strong>The</strong> benefits by maintaining high boiler efficiency are readily calculated knowing boiler fuel usage<br />
(Wf), efficiency achievable (EA), efficiency differential between achievable and actual performance<br />
(ΔE), and fuel cost, (C).<br />
Page 101<br />
<strong>The</strong> units selected must be consistent, that is, if Wf equals million Btu/year, and C equals dollars per<br />
million Btu, the fuel saving will be in dollars per year.<br />
Usually, achievable efficiency and ΔE will vary with boiler load. To evaluate annual fuel savings under<br />
varying load conditions the fraction of operating time spent at each load must be estimated and<br />
multiplied by the fuel consumption rate and the ratio of ΔE/EA for each load condition. <strong>The</strong> sum of the<br />
individual load calculations multiplied by fuel cost will then equal the annual fuel dollar saving.<br />
To provide some estimate as to the value of a one percent efficiency change, consider a boiler operating<br />
at 10,000 lb per hour steam flow for 6,000 hours per year. <strong>The</strong> heat required to generate one pound of<br />
steam is approximately 1000 Btu divided by boiler efficiency as a decimal fraction. If efficiency is 80%<br />
the annual fuel consumption would be<br />
With fuel costs at $6 per million Btu, the annual fuel bill would be $450,000.<br />
If efficiency decreased to 79% the fuel bill would be $455,696 or $5,696 higher.<br />
If the boiler steam flow were 100,000 lb/hr and the efficiency decrease was 2% the increase in annual<br />
fuel cost would be $114,000. Obviously, more effort can be justified in maintaining efficiency as boiler<br />
output increases and performance deterioration becomes greater.<br />
< previous page page_101 next page >
previous page page_102 next page ><br />
Page 102<br />
Efficiency gains through reducing excess air or stack temperature are shown in Figures 9-1 and 9-2. A<br />
reduction in excess air is usually accompanied by a reduction in stack temperature. <strong>The</strong> actual<br />
temperature reduction is dependent on the initial stack temperature and the excess air reduction. A<br />
20% excess air reduction will produce approximately a 30ºF reduction if exit gas temperature is in the<br />
500600ºF range, but only a 15°F reduction if exit gas temperature is in the vicinity of 300ºF.<br />
<strong>The</strong> combined effect can be determined by first evaluating the efficiency improvement for reduced<br />
excess air from Figure 8-1 and then adding the efficiency improvement for reduced stack gas<br />
temperature from Figure 9-2 evaluated at the lower excess air.<br />
Figure 9-1<br />
Percent efficiency improvement for every one percent reduction in<br />
excess air. Valid for estimating efficiency improvements on typical<br />
natural gas, #2 through #6 oils and coal fuels.<br />
< previous page page_102 next page >
previous page page_103 next page ><br />
Page 103<br />
Solid combustible losses are of concern principally with coal firing as discussed in Chapter 3.<br />
Objectionable smoke will occur with oil or gas firing before unburned carbon losses become<br />
significant. In a given coal-fired installation, solid combustible losses are strongly influenced by excess<br />
air, tending to increase as excess air is decreased. <strong>Best</strong> operation involves determining the excess air at<br />
which total heat losses are minimized.<br />
Carbon monoxide heat losses can become significant with gas or oil firing. Carbon monoxide in the<br />
flue gas at a level of 1000 ppm or 0.1% represents a heat loss of approximately 0.35%. Higher CO<br />
levels will produce correspondingly higher heat losses.<br />
Figure 9-2<br />
Percent efficiency improvement for every 10ºF drop in stack<br />
temperature. Valid for estimating efficiency improvements on<br />
typical natural gas, #2 through #6 oils and coal fuels.<br />
< previous page page_103 next page >
previous page page_105 next page ><br />
10<br />
<strong>Boiler</strong> Tune-Up<br />
Page 105<br />
One of the more effective means of improving and maintaining boiler operating efficiency is a boiler<br />
''tune-up." This preventive maintenance item is one of the most direct approaches to fuel conservation<br />
through efficiency improvements.<br />
<strong>The</strong> primary objective in a "tune-up" is to achieve efficient combustion with a controlled amount of<br />
excess air. Operating with the lowest practical excess air will minimize efficiency losses by reducing the<br />
quantity of unneeded air which is heated to the stack temperature then not utilized. <strong>The</strong> associated<br />
reduction in stack gas temperature and power consumption by forced draft and induced draft fans are<br />
additional benefits.<br />
<strong>The</strong> actual improvement in boiler efficiency with lower excess air depends on the initial stack<br />
temperature and excess air at the boiler exit. A given change in excess air will have a greater effect<br />
when stack temperatures are high. For example, a reduction in excess air of 10% (i.e., from 20 to 10%<br />
or 100 to 90% excess air) will produce a 0.9% improvement in efficiency when stack temperatures are<br />
on the order of 600ºF.<br />
However, the same change in excess air when stack temperatures are near 200ºF will improve boiler<br />
efficiency by only 0.2%. <strong>The</strong>se values are not appreciably affected by the type of fuel (natural gas, oils<br />
or coal). Cases have been documented where reductions in excess air by much more than 10% were<br />
possible leading to efficiency improvement of several percent.<br />
Proper operation of the boiler combustion control system is essential for maintaining high boiler<br />
operating efficiencies and satisfactory excess air levels. Its main purpose is to provide the correct<br />
quantities of fuel and air at the burner to satisfy a varying demand for steam generation.<br />
< previous page page_105 next page >
previous page page_106 next page ><br />
Page 106<br />
Although it is important that the excess air delivered to the burner be kept to a minimum over the<br />
boiler operating range, it generally is not practical to operate precisely at the point of maximum<br />
efficiency. This optimum typically occurs at the "threshold" of combustible or smoke formation and<br />
may result in unacceptable stack conditions.<br />
For the majority of boilers, it is necessary to maintain a margin of excess air above the minimum or<br />
threshold level to accommodate variations in fuel properties and ambient conditions, nonrepeatability<br />
of control settings, normal deterioration of control parts and rapid changes in firing rate.<br />
Proper adjustment and maintenance of the burning equipment are essential to good combustion<br />
control. Burner parameters such as air register position, location of the diffuser or position of coal<br />
spreaders can affect the excess air requirements. Fuel oil temperature and atomizing pressures,<br />
pulverizer performance (coal fineness), primary air temperature, and other operating factors also<br />
have an impact.<br />
To assure reliable, safe, and efficient boiler performance, manufacturers of boiler and burner<br />
equipment recommend periodic inspections and tune-ups. Thorough tune-ups are commonly<br />
recommended to be performed on an annual basis but many operators also prefer to conduct quick<br />
boiler efficiency checks much more often, sometimes on a daily or weekly basis. In this way, efficiency<br />
problems can be detected early, before large fuel wastage occurs or expensive maintenance is required.<br />
<strong>Boiler</strong> tune-up services are available from most major manufacturers of boiler and burner systems,<br />
some local utilities, and engineering consulting firms. Since tune-up crews usually charge an hourly or<br />
daily rate plus expenses, costs for these services will depend on the extent of the tune-up work required.<br />
A minimal tune-up should include a verification of automatic fuel and air control operation over their<br />
operating range. Visual furnace observation and stack measurements of excess O2, CO, CO2 and<br />
temperature are essential elements in this type of tuneup. A typical tune-up performed on a 13,000 lb/<br />
hr watertube boiler during a field testing program could be done in one day.<br />
< previous page page_106 next page >
previous page page_107 next page ><br />
Page 107<br />
A more extensive tune-up might also involve a boiler shutdown and a thorough inspection of burner<br />
parts, dampers, fuel valves and regulators, refractory, furnace tubes and instrumentation. In many<br />
cases the more critical maintenance, instrument calibration and repairs can be made on-site during a<br />
brief shutdown.<br />
Major repairs may require an extended shutdown at a later, more convenient date. A list of additional<br />
items requiring attention at that time should be furnished. For boiler operators desiring a basic<br />
efficiency check of their boiler, the local natural gas supply company may provide this service at little<br />
or no charge to customers and may also offer some assistance in adjusting burner controls for peak<br />
efficiency.<br />
For a complete combustion control tune-up and inspection, the tune-up crew will prefer to have total<br />
control of boiler firing rate to verify control settings over the full turn-down range. Be prepared to<br />
accomodate the fluctuations in steam flow and/or pressure. In some cases it may be necessary to install<br />
a baffled steam discharge stack when these fluctuations cannot be tolerated in the steam supply system<br />
or plant processes.<br />
When stack measurements are being made (O2, CO, CO2 and temperature), it is important to request<br />
a verification of stack gas uniformity (i.e., a traverse) to assure representative readings. Flue gas<br />
samples are usually extracted by means of a single point probe and any stratifications or gradients in<br />
the flue gas ducting can lead to erroneous measurements.<br />
It is important that excess air not be reduced at the expense of excessive combustibles (unburned fuel,<br />
carbon carryover, CO, etc.) since these can represent significant efficiency losses. More than 400 ppm<br />
carbon monoxide (CO) in the stack gases is generally not acceptable.<br />
Finally, it may be worthwhile for future reference to inquire about the margin in excess air used by the<br />
tune-up crew to accommodate the various uncontrollable factors mentioned previously.<br />
For specialized combustion or operating problems not routinely solved by plant operating or<br />
engineering personnel, assistance from outside consulting or engineering firms should also be<br />
considered. Some firms have extensive experience in specific problem areas such as tube corrosion and<br />
wastage, excessive car-<br />
< previous page page_107 next page >
previous page page_108 next page ><br />
Page 108<br />
bon carryover, precipitator and mill fires, water quality control, instrumentation malfunctions, and<br />
air pollution restrictions.<br />
<strong>Boiler</strong> Tube Cleanliness<br />
Tube deposits and fouling on the external tube surfaces of a watertube boiler or similar gas side<br />
conditions in the gas tubes of a firetube boiler will inhibit the absorption of heat in the boiler and lead<br />
to lower efficiencies. This condition will be reflected in high flue gas temperatures when compared to<br />
"clean" conditions at a similar firing rate and boiler excess air. <strong>The</strong> resulting loss in boiler efficiency<br />
can be closely estimated on the basis that a 1% efficiency loss occurs with every 40ºF increase in stack<br />
temperature.<br />
It should be mentioned that water side deposits resulting from inadequate water treatment would also<br />
eventually lead to higher stack temperatures and lower efficiencies. However, tube failures due to<br />
overheating would generally occur before any substantial efficiency losses are evident.<br />
Poor firing conditions at the burner can be the major cause of gas side tube deposit problems.<br />
Insufficient burner excess air or improper burner adjustment and maintenance can lead to excessive<br />
carbon and soot formation in the furnace which builds up on furnace wall tubes and convective tube<br />
banks.<br />
Other factors to be considered might be fuel oil burning temperature, coal ash fouling properties,<br />
pulverizer performance and primary air temperature. A boiler inspection will generally indicate<br />
whether soot blowers are performing as designed and are properly located for effective tube cleaning.<br />
If existing soot blowers are functioning properly but are inadequate for present fuels, repositioning of<br />
soot blowers and/or the installation of new soot blower designs might be considered (see Chapter 14).<br />
Stack temperature measurements are an easy and effective means for monitoring boiler tube<br />
cleanliness conditions. Stack temperatures sould be periodically compared to values obtained during<br />
start-up or following a boiler tube wash to determine any deviations from "clean" baseline<br />
temperatures.<br />
< previous page page_108 next page >
previous page page_109 next page ><br />
Page 109<br />
Since stack temperature usually increases with firing rate and excess air, these comparisons should be<br />
performed at similar boiler operating conditions. In the absence of any reference temperatures, it is<br />
normally expected that stack temperatures will be about 150 to 200ºF above the saturated steam<br />
temperature at high firing rates in a saturated steam boiler.<br />
Naturally, this does not apply to boilers equipped with economizers or air preheaters. <strong>The</strong> boiler<br />
manufacturer should be able to supply a normal range of stack temperatures for the particular boiler<br />
design. When higher stack temperatures are measured, a boiler tube cleaning may be warranted.<br />
Some boiler operators perform tube washes in-house but cleaning services are also available from<br />
commercial boiler repair and service companies. <strong>The</strong>se companies also perform water side inspection<br />
and cleaning. Various cleaning methods are used including high pressure water, air and steam jets to<br />
remove gas side deposits.<br />
Mechanical "shakers" and "knockers" are also used which vibrate off or dislodge the tube deposits<br />
for easy removal. <strong>The</strong> appropriate type of cleaning device will be dictated by the severity and<br />
composition of deposits, available access to tube surfaces, boiler construction (firetubes versus<br />
watertubes), age of the boiler, and other factors.<br />
<strong>The</strong> cost of an extensive tube cleaning will typically range from a few hundred dollars for a 10,000 lb/<br />
hr boiler to several thousand dollars for larger units. This expense is usually very easy to justify due to<br />
the quickly realized savings in fuel costs.<br />
Determining Efficiency-Related Maintenance Requirements<br />
<strong>The</strong> implementation of an efficiency-related maintenance program requires that performance<br />
deviations from optimum conditions be monitored and corrected either by operating or maintenance<br />
procedures. Many industrial boilers will require additional instrumentation for this purpose. A<br />
minimum instrumentation list for monitoring unit performance is given in Table 16-2, Chapter 16.<br />
< previous page page_109 next page >
previous page page_110 next page ><br />
Page 110<br />
A basic tool for determining the need for maintenance to restore efficiency is the boiler operator's log<br />
shown in Chapter 8. Daily trends in unit performance can be used to determine the deviation from<br />
design or optimum performance and establish the frequency for maintenance procedures.<br />
Comparison of daily boiler log data to data obtained with the unit in good operating condition may<br />
disclose the need for specific maintenance procedures. <strong>The</strong>se observations should be made under very<br />
steady firing conditions. A burner and control system tune-up would be indicated if the unit smokes at<br />
previously acceptable O2 levels. Higher than normal O2 levels may indicate the need for control<br />
system adjustment or in the case of balanced draft units, may indicate excessive boiler setting leakage.<br />
A deficiency in air flow capacity may indicate excessive air heater seal leakage, plugged air heaters or<br />
other boiler and damper problems. <strong>The</strong> boiler operator's log will assist in assessing the problem.<br />
Annual outages are also necessary for inspection of areas not accessible during operation to determine<br />
condition of boiler baffles, boiler cleanliness, air heater corrosion or seal condition, fan blade condition<br />
and damper operation.<br />
<strong>The</strong> major areas of concern are burner-control system maintenance and boiler cleanliness, as<br />
discussed above. Some less common, but significant maintenance items from an efficiency standpoint<br />
are discussed next.<br />
Special Maintenance ItemsCoal-Fired Units<br />
Many spreader stoker fired units incorporate fly ash re-injection from boiler hoppers or mechanical<br />
collectors to reduce carbon losses by reburning. Efficiency improvements of up to 5% are obtained by<br />
re-injection. Maintenance on this system is required to assure that the mechanical collector tubes are<br />
operating efficiently (no holes worn through collecting devices), the hoppers are being emptied and the<br />
conveying pipes are not eroded to the point of failure.<br />
< previous page page_110 next page >
previous page page_111 next page ><br />
Page 111<br />
Stoker grate surfaces must be maintained to provide good air distribution and minimize sifting losses.<br />
Feeder devices must be kept in good repair to provide uniform fuel distribution.<br />
In pulverized coal units the coal fineness should be checked regularly and the mills adjusted to provide<br />
the correct fineness. High carbon losses will result with poor grinding. Fans or exhausters handling<br />
pulverized coal/air mixtures are subject to erosion which can lead to reduced air flow which reduces<br />
mill capacity and can lead to fuel line plugging. Fan blades and grinding elements should be replaced<br />
as required to maintain performance. <strong>The</strong> frequency of replacement will depend on the abrasiveness<br />
of the coal being pulverized.<br />
< previous page page_111 next page >
previous page page_113 next page ><br />
11<br />
<strong>Boiler</strong> Operational Modifications<br />
Page 113<br />
This chapter outlines the more promising changes in boiler operating practices that can be employed<br />
to reduce fuel consumption. <strong>The</strong>se include not only techniques that improve boiler efficiency but also<br />
fuel saving practices such as load management and reduced continuous blowdown practices.<br />
Reduced <strong>Boiler</strong> Steam Pressures<br />
Reducing the boiler steam pressure is not generally viewed as an efficiency improvement technique but<br />
at those boiler installations where reductions in steam pressure are practical, this can be an effective<br />
means for saving up to 1 or 2 percent on the fuel bill. A portion of this savings results from lower stack<br />
temperatures and the accompanying increase in boiler efficiency.<br />
Lower steam pressures give lower saturated steam temperatures and in cases without stack heat<br />
recovery, a similar reduction in final flue gas temperature will result. <strong>The</strong> actual reduction in<br />
temperature for a given drop in steam pressure will depend on the particular pressure levels involved,<br />
since the relationship between saturated steam pressure and steam temperature is not linear (consult<br />
the steam tables).<br />
For example, a 50 psi drop from 150 psig to 100 psig will lower the steam temperature (and stack<br />
temperature) by 28ºF. By comparison, a 50 psi drop from 400 psig will reduce the stack temperature<br />
by 12ºF. <strong>The</strong> corresponding boiler efficiency improvements would be approximately .7% and .3%<br />
respectively.<br />
<strong>The</strong>re can be other immediate benefits from operating at reduced pressures which lead to lower fuel<br />
consumption. <strong>The</strong>se can<br />
< previous page page_113 next page >
previous page page_114 next page ><br />
Page 114<br />
include lower radiated heat loss from steam mains, less leakage at flanges and packing glands, reduced<br />
boiler-feed-pump energy consumption and less energy dissipation at pressure reducing stations.<br />
To successfully operate at reduced pressures, the primary pressure must still be sufficiently high to<br />
deliver adequate steam to the various points of end use. Lower pressures may also result in<br />
undesirable moisture carryover from the steam drum. <strong>The</strong> boiler manufacturer may be able to supply<br />
improved drum intervals if carryover is a problem.<br />
While these are usually the primary concerns, there may be other important considerations. For<br />
example, operating with lower main steam pressure might place tighter limits on acceptable steam<br />
pressure fluctuations. Since pressure drops across regulators are less, smaller transients in input<br />
pressure are acceptable to assure uniform output. Flow metering devices may also have to be<br />
recalibrated or corrected for the lower pressures.<br />
Water Quality ControlBlowdown<br />
Water treatment is an important aspect of boiler operation which can affect efficiency or result in<br />
plant damage if neglected. <strong>Boiler</strong> feedwater contains impurities in solution and suspension.<br />
<strong>The</strong>se impurities concentrate in the boiler water since the steam generated is essentially pure. Proper<br />
internal boiler water treatment removes all or part of the scale-forming calcium and magnesium salts<br />
from solution.<br />
If these suspended solids are allowed to concentrate beyond certain limits, a deposit or "scale" will<br />
form on the boiler heating surfaces which will retard heat transfer and increase tube metal<br />
temperatures. This can lead to increased stack gas temperatures which reduces boiler efficiencies.<br />
Even more important may be the probability of furnace tube failures from overheating as a result of<br />
the insulating effect of water-side scale. High solids can also interfere with proper operation of the<br />
steam separating apparatus in the drum causing boiler water carryover with the steam. If a<br />
superheater is installed, the<br />
< previous page page_114 next page >
previous page page_115 next page ><br />
solids will either be deposited on the surface causing metal overheating or be carried along with the<br />
superheated steam. Particulates in the steam can cause further problems in erosion or deposits in<br />
turbines and valves.<br />
Page 115<br />
<strong>The</strong> concentration of suspended and dissolved solids in boiler water is controlled by removing some of<br />
the high-solids boiler water and replacing it with low-solids feedwater, effecting a general lowering of<br />
solids concentration in the boiler. This process, which is known as blowdown, can be either<br />
intermittent bottom blowdown or continuous blowdown.<br />
Bottom or sludge blowdown is necessary to remove any sludge accumulating in the lowest parts of the<br />
boiler system. Continuous blowdown is taken from the point of highest solids concentration usually<br />
from the upper drum.<br />
Intermittent bottom blowdown may be sufficient if the feedwater is exceptionally pure such as with a<br />
high percentage of returned condensate or evaporated makeup water. Intermittent blowdown is<br />
performed manually and therefore may result in wide fluctuations in blowdown patterns as shown in<br />
Figure 11-1. Use of frequent short blows as opposed to infrequent lengthy blows is preferred due to<br />
reduced treated water losses and lost sensible heat energy in the waste water. <strong>The</strong> expected fuel<br />
savings using this technique are dependent on the existing intermittent blowdown patterns.<br />
Continuous blowdown from the upper drum can reduce the required intermittent bottom blowdown<br />
and allow the use of heat recovery devices.<br />
Many applications involve a high percentage of makeup water with varying amounts of impurities.<br />
Blowdown rate, which is defined as the ratio of water blown from the boiler to the quantity of boiler<br />
feedwater, may range up to 10% depending on the ratio of impurities in the feedwater to allowable<br />
concentration in the boiler water.<br />
For instance, the permissible concentration of total solids in boiler water is 3500 ppm at 300 psi or<br />
lower operating pressure. If the feedwater contains 350 ppm of total solids, a blowdown rate of 10%<br />
would be required to maintain the solids level in the boiler at 3500 ppm. <strong>The</strong> heat loss associated with<br />
10% blowdown<br />
< previous page page_115 next page >
previous page page_116 next page ><br />
is roughly 3% if none of the sensible heat carried away in the blowdown water is recovered.<br />
Page 116<br />
Nearly all of this heat can be recovered in a continuous blowdown system incorporating heat<br />
exchangers which cool the blowdown to within 20º to 30ºF of incoming makeup water. <strong>The</strong> potential<br />
saving is proportional to the amount of blowdown required which further depends on the percentage<br />
and purity of makeup water.<br />
Pre-boiler treatment of water to reduce solids can also reduce blowdown requirements. A firm<br />
specializing in industrial water treatment would provide savings. <strong>The</strong> type of equipment and treatment<br />
costs vary widely with the specific impurities involved and are best handled on an individual basis.<br />
Figure 11-1<br />
Variation of boiler water concentration with infrequent lengthy blowdowns,<br />
frequent short blowdowns and continuous blowdowns.<br />
< previous page page_116 next page >
previous page page_117 next page ><br />
12<br />
Effect of Water Side and Gas Side Scale Deposits<br />
Page 117<br />
Scale provides resistance to the heat transfer between the hot flue gases and the boiler water. <strong>The</strong> heat<br />
transfer through the scale can be expressed as<br />
where L = scale thickness<br />
k = thermal conductivity<br />
ΔT = temperature differential<br />
<strong>The</strong>refore, the quantity of heat energy transferred is proportional to the thermal conductivity of the<br />
scale and inversely proportional to the scale thickness.<br />
<strong>The</strong> thermal conductivities of several substances characteristic of boiler scale deposits are presented in<br />
Table 12-1.<br />
TABLE 12-1. <strong>The</strong>rmal conductivities of various substances.<br />
Material <strong>The</strong>rmal Conductivity, Btu/Ft2 )(H)(°F)(In)<br />
Analcite (Na2 O•A12 O3•4SiO2 •2H2O) 8.8<br />
Calcium phosphate 25<br />
Calcium sulfate 16<br />
Magnesium phosphate 15<br />
Magnetic iron oxide 20<br />
Silicate scale, porous 0.6<br />
Fire brick 7<br />
Insulating brick 0.7<br />
<strong>Boiler</strong> steel 310<br />
< previous page page_117 next page >
previous page page_118 next page ><br />
Water Side Scale<br />
Page 118<br />
Scale material in the form of dissolved solids is deposited on the water side tube surfaces during the process of water<br />
evaporation. <strong>The</strong> steam forms as bubbles on the tube surfaces. Dissolved material may precipitate from these bubbles since their<br />
surfaces contain a higher concentration of solids than do the main body of water.<br />
<strong>The</strong> maximum allowable concentration of dissolved solids in the boiler water is determined by the operating pressure as given in<br />
Table 12-2.<br />
<strong>The</strong> concentration of dissolved solids is generally controlled by feedwater pretreatment procedures and by blowdown. Blowdown<br />
refers to removing a portion of the boiler drum water in excess of the recommended solids concentration and replacing it with<br />
makeup water of a lower concentration. <strong>The</strong> percent of blowdown required to maintain a given dissolved solids concentration is<br />
presented in Figure 12-1.<br />
Drum pressure<br />
psig<br />
0-300<br />
301-450<br />
451-600<br />
601-750<br />
751-900<br />
901-1000<br />
10011500<br />
15012000<br />
TABLE 12-2. Recommended maximum impurity concentrations.<br />
BOILER FEEDWATER BOILER WATER<br />
Iron<br />
ppm Fe<br />
0.100<br />
0.050<br />
0.030<br />
0.025<br />
0.020<br />
0.020<br />
0.010<br />
0.010<br />
Reprinted from Power magazine.<br />
Copper, ppm<br />
Cu<br />
Total hardness<br />
ppm CaCO3<br />
Silica,<br />
ppm SIO2<br />
Total alkalinity,1 Specific conductance,<br />
micromhos/cm<br />
0.050 0.300 150 7002 7002<br />
0.025 0.300 90 6002 6002<br />
0.020 0.200 40 5002 5002<br />
0.020 0.200 30 4002 4002<br />
0.015 0.100 20 3002 3002<br />
0.015 0.050 8 2002 2002<br />
0.010 ND4 2 03 150<br />
0.010 ND4 1 03 100<br />
Since water side scale deposits retard the transfer of heat energy to the boiler water, reduced operating efficiencies occur. <strong>The</strong><br />
approximate energy loss as a function of scale thickness is presented in Figure 12-2 for several scale materials.<br />
< previous page page_118 next page >
previous page page_119 next page ><br />
Figure 12-1<br />
Percent blowdown required to maintain predetermined<br />
boiler-water dissolved solids concentration.<br />
Figure 12-2<br />
Energy loss from scale deposits.<br />
Page 119<br />
< previous page page_119 next page >
previous page page_120 next page ><br />
Page 120<br />
Water side scale deposits also result in increased tube metal temperature often resulting in tube failure<br />
prior to a noticeable effect on boiler efficiency.<br />
Gas Side Scale<br />
Solid deposits on the gas side surfaces of boiler tubes also result in reduced heat transfer to the boiler<br />
water. <strong>The</strong>se solid deposits exist as either soot particles from the flyash or slagged ash particles.<br />
<strong>The</strong>se problems are generally related to oil- and coal-fired systems. <strong>The</strong> properties of the fuel, the<br />
characteristics of the firing system and the resulting temperature distribution in the boiler have an<br />
effect on the type and accumulation rates of the deposits.<br />
Soot deposits can form on the furnace walls of gas-fired boilers due to excessively low excess air levels<br />
and flame impingement on the water walls. Severe soot deposits can decrease operating stack gas<br />
temperatures. Generally, a gradual increase in stack temperature is an indication of soot buildup.<br />
Excessive gas side deposits can generate abnormal gas flow patterns in the boiler convective region<br />
and can even ''plug up" a unit completely. Wall blowers are used to remove slag deposits from the<br />
furnace walls of coal-fired units. Sootblowers are used to remove flyash from convective passes of the<br />
boiler.<br />
< previous page page_120 next page >
previous page page_121 next page ><br />
13<br />
Load Management<br />
Page 121<br />
Load management is an effective tool in minimizing fuel consumption in a plant with several boilers.<br />
Since boiler efficiency varies with load, boiler design, equipment age, fuel, and other factors, there is<br />
an advantage to distributing load to the most efficient boilers and to operating boilers at a load close to<br />
their efficiency.<br />
In general, a peak operating efficiency will occur at a load less than 100% due to the complex<br />
interaction between the stack gas temperature, excess air flow and surface radiation losses. Units with<br />
high excess air requirements or significant radiation losses at low loads will have peak efficiency at a<br />
high load. <strong>Boiler</strong>s with constant excess air levels and small radiation losses over the load range will<br />
exhibit a peak efficiency at a lower load.<br />
Several typical efficiency curves are presented in Figure 13-1. It is usually necessary to determine the<br />
efficiency variation with load for each individual unit by measurement.<br />
Proper load management would then require the use of the optimum operating range for each boiler<br />
in the system whenever practical and maintaining this load to minimize efficiency losses during load<br />
variations.<br />
Plants with several boilers should be managed to achieve optimum system performance. <strong>The</strong> most<br />
efficient boilers should be loaded first to the desired operating level and so on to the least efficient<br />
boiler. Conversely, the least efficient boilers should be removed from service first.<br />
<strong>The</strong>re also is merit to shutting some boilers down in swing seasons while operating process boilers at<br />
peak efficiency as opposed to operating all boilers at reduced load and performance. Another variation<br />
in multiple boiler plants would be to schedule one boiler for a specified process, another for space<br />
heating and so on.<br />
< previous page page_121 next page >
previous page page_122 next page ><br />
Figure 13-1<br />
Typical boiler efficiency vs. load dependence.<br />
Page 122<br />
A detailed cost analysis including additional operating personnel and maintenance must be conducted<br />
to determine the net overall cost savings in multiple boiler systems.<br />
Proper load management also involves the use of reduced operating levels or shutdown during nonproduction<br />
periods. <strong>The</strong> choice between maintaining the unit at idle position, allowing the unit to be at<br />
standby at a reduced firing rate or shutting the unit down is determined by the length of the<br />
interruption, the heating and cooling characteristics of the unit, and the effects of the thermal cycles on<br />
the life of the unit.<br />
< previous page page_122 next page >
previous page page_123 next page ><br />
Page 123<br />
Other considerations such as limited turndown range due to fuel firing characteristics or furnace<br />
dimensions can also dictate a preliminary shutdown rather than maintaining a low idle firing rate.<br />
Reduced operations are always justified from an efficiency standpoint if the energy saved by reduced<br />
operation is greater than the energy required to reheat the unit back up to operating conditions.<br />
Selection of new equipment such as quick steaming units that can come to operating temperature and<br />
pressures from reduced firing levels in minutes or boilers with maximum efficiency in the range of<br />
steam flow utilized may be considered to optimize the load management potential. Several small, more<br />
efficient units that meet the specific needs of the process could show a longterm economic benefit in<br />
terms of fuel savings over fewer larger units.<br />
A thorough engineering evaluation of the cost/benefits and potential effects on equipment life and<br />
maintenance must precede the initiation of any load management program.<br />
Fuel Conversions or Change of Fuel<br />
A fuel change or fuel conversion is generally not a common tool for fuel conservation since the decision<br />
usually is controlled by other factors such as fuel availability, cost, or process requirements. However,<br />
fuel changes can have a substantial impact on the total cost of steam production. Since different fuels<br />
do characteristically exhibit modest differences in boiler efficiency, this factor should be taken into<br />
account in addition to raw fuel cost (on a million Btu basis).<br />
<strong>The</strong>se differences result primarily from dissimilar hydrogen content in the fuels with resulting<br />
differences in moisture content of the flue gas (moisture losses), variations in heat release rate in the<br />
furnace causing differences in steaming rates and dissimilar slagging and fouling characteristics.<br />
Primary considerations in fuel selection are present and future trends in cost and availability. Other<br />
factors include:<br />
< previous page page_123 next page >
previous page page_124 next page ><br />
• existing fuel storage and handling equipment<br />
• existing combustion equipment and controls<br />
• boiler cleanliness problems and sootblowing provisions<br />
• air pollution emissions<br />
• maintenance<br />
• additional operating personnel and supervision.<br />
Page 124<br />
A complete evaluation including preliminary testing should be made prior to a long-term commitment<br />
to an alternate fuel supply.<br />
< previous page page_124 next page >
previous page page_125 next page ><br />
14<br />
Auxiliary Equipment to Increase <strong>Boiler</strong> Efficiency:<br />
Air Preheaters and Economizers<br />
Page 125<br />
This chapter reviews two important types of auxiliary equipment currently available to improve boiler<br />
efficiency. Most of this equipment can be retrofitted to existing units but in many cases it is<br />
economically more practical to purchase it with a new unit.<br />
<strong>The</strong> fuel savings presented are based on information provided by manufacturers and generally<br />
represent constant load conditions at a high operating load. A more thorough evaluation must include<br />
efficiency and usage factor variations with respect to load and the potential impact on fuel savings.<br />
Other economic factors such as depreciation and discount rates are treated in Chapter 19.<br />
Air Preheaters<br />
Principle of Operation<br />
Air preheaters are employed to transfer heat energy from the stack gas to the incoming combustion air<br />
supply. <strong>Boiler</strong> efficiency is improved at all loads as a result of reduced stack gas temperatures.<br />
Improved combustion conditions at the burner permitting operation with lower excess air can be an<br />
additional benefit.<br />
< previous page page_125 next page >
previous page page_126 next page ><br />
Page 126<br />
Air preheaters can be used economically on units with outputs as low as 25,000 pounds of steam per<br />
hour. <strong>The</strong> choice between an air preheater and an economizer for larger units is made on the basis of<br />
• stack gas temperature<br />
• installation and operating costs<br />
• draft losses<br />
• type and arrangement of the boiler<br />
• operating steam pressure that may limit the maximum feedwater temperature and thereby the<br />
application of an economizer<br />
• flue gas corrosive properties (i.e., fuel type) which may determine the lowest practical stack<br />
temperature<br />
• maintenance requirements<br />
A dual installation incorporating both an air preheater and economizer is often used on larger units<br />
with steam pressures above 400 psig.<br />
Performance<br />
Considering only the benefit of utilizing heat energy in the flue gas to heat the combustion air, the<br />
overall steam generator efficiency will increase approximately 2.5% for every 100ºF decrease in exit<br />
gas temperature or 2% for every 100ºF increase in combustion air temperature. Any accompanying<br />
improvements in burner excess air with preheated combustion air will enable additional efficiency<br />
gains. As an example, an air preheater providing combustion air of 300ºF can result in a fuel savings of<br />
up to 5%.<br />
<strong>The</strong> efficiency improvement for a given drop in flue gas temperature can be estimated using Figure 14-<br />
1. Using this value, an approximate gross annual fuel savings can then be estimated using the<br />
nomograph shown in Figure 14-2. <strong>The</strong> steam flow used in this nomograph should correspond to an<br />
average load based on 6000 hours/year operation. Subtracting fixed charges and increased operating<br />
costs will result in an approximate net annual savings.<br />
< previous page page_126 next page >
previous page page_127 next page ><br />
Cost<br />
Figure 14-1<br />
Approximate efficiency improvement with<br />
decreased flue gas temperatures<br />
Page 127<br />
<strong>The</strong> total cost of installing an air preheater will of course vary from boiler to boiler, depending on the<br />
pressure drop that can be tolerated, air heater design, materials and desired performance. Installed<br />
costs can be as much as 3 to 5 times the capital costs and are affected by<br />
• available space<br />
• required equipment repositioning<br />
• duct modifications<br />
• air fan changes if necessary to overcome increased pressure drops<br />
• piping and wiring changes<br />
• additional sootblower requirements.<br />
< previous page page_127 next page >
previous page page_128 next page ><br />
Figure 14-2<br />
Potential gross savings in annual fuel costs for a given<br />
efficiency improvement based on 6000 hr/yr operation.<br />
Page 128<br />
< previous page page_128 next page >
previous page page_129 next page ><br />
Page 129<br />
Significant annual costs must also be considered including fixed costs, operating and required<br />
maintenance costs. Fixed and operating costs may amount to 1020% of the installed costs. A cold end<br />
heating surface replacement can cost another 10% of the equipment costs.<br />
Types of Air Preheaters<br />
Air preheaters are classified as either recuperative or regenerative. In the recuperative type, the heat<br />
energy is transferred directly from the flue gas on one side of a stationary separating surface to air on<br />
the other side. This separating surface may be either a tubular or flat plate design. Typical<br />
arrangements for the more common tube types are shown in Figure 14-3. Also included in this class<br />
are recuperative steam coil heaters that are sometimes used to preheat the combustion air before<br />
entering the main air preheater. This is occasionally necessary to reduce "cold side" corrosion by<br />
increasing the minimum tube metal temperatures exposed to the flue gas. Advantages of recuperative<br />
air preheaters include<br />
• adaptable to a wide variety of physical arrangements<br />
• limited cross contamination between flow streams<br />
• no external power<br />
• no moving parts<br />
A disadvantage is the adverse effects of soot deposits on heat transfer efficiency. Use of the plate type is<br />
diminishing due to cleaning difficulties.<br />
<strong>The</strong> regenerative type preheater transfers the heat energy from the flue gas to the combustion air<br />
through an intermediate heat storage medium. Steam generating units most commonly use a rotary<br />
"wheel" design shown in Figure 14-4. Advantages of this type of unit include<br />
• adaptable to several duct arrangements<br />
• compact and lighter than comparable recuperative units<br />
• short flow passages reducing fouling<br />
< previous page page_129 next page >
previous page page_130 next page ><br />
Figure 14-3<br />
Typical recuperative air preheater arrangements.<br />
Page 130<br />
< previous page page_130 next page >
previous page page_131 next page ><br />
• heat transfer characteristics not affected by soot deposits<br />
• can operate at a lower exit gas temperature than recuperative units<br />
<strong>The</strong> disadvantages are<br />
• cross contamination around seals<br />
• external power required<br />
It is generally more common to use a regenerative rotary unit on retrofit installations.<br />
Figure 14-4.<br />
Regenerative air preheater.<br />
Page 131<br />
< previous page page_131 next page >
previous page page_132 next page ><br />
A third type of air preheater not currently in use on steam generating units is a heat exchanger<br />
employing heat pipes as shown in Figure 14-5. Heat pipes are a relatively new technological<br />
development and offer a promising alternative to conventional heat transfer devices. This type of<br />
system may be very adaptable to industrial boilers and offers the following advantages:<br />
• no cross contamination<br />
• no external power or moving parts<br />
• minimum maintenance<br />
Page 132<br />
<strong>The</strong> primary disadvantage is a 600ºF maximum operating temperature which would limit its<br />
application. Flue gas bypasses are recommended for protection from possible corrosion at low loads<br />
and overheating of the heat pipe element at high loads.<br />
Figure 14-5<br />
Heat pipe heat exchanger.<br />
< previous page page_132 next page >
previous page page_133 next page ><br />
Impact on Emissions<br />
Increased combustion air temperatures is known to have an adverse effect on emissions of oxides of<br />
nitrogen (NOx), particularly for natural gas fuel. For a range of industrial boiler designs, the NOx<br />
increased by 20 ppm to 100 ppm per 100ºF increase in combustion air temperature.<br />
Page 133<br />
This factor must be considered where existing or proposed air pollution regulations may be applicable.<br />
Improved combustion conditions in the furnace resulting in lower excess air requirements may tend to<br />
offset somewhat this increase in NOx levels since NOx usually decreases with lower excess air.<br />
Use of preheated combustion air also appears to affect other air pollutants. Lower SO3 emissions have<br />
been reported; however, this has not been fully substantiated. More complete combustion in the<br />
furnace may also reduce particulate and CO emission levels.<br />
Corrosion<br />
<strong>The</strong> lowest acceptable flue gas temperature at the exit of the air preheater is limited to prevent<br />
moisture condensation on heat transfer surfaces which would lead to sulfuric acid corrosion and<br />
expensive repairs. Factors affecting these minimum temperature limits include<br />
• sulfur content of the fuel<br />
• moisture content of the flue gas<br />
• type of fuel<br />
• ambient air temperature<br />
Recommended minimum average cold end temperatures developed by C-E Air Preheater are<br />
presented in Figure 14-6. Note that the minimum metal surface temperatures are determined by<br />
averaging the exit gas and entering air temperature of 80ºF, the exit gas temperatures corresponding<br />
to 235ºF and 175°F average cold end temperature would be 390ºF and 270ºF respectively.<br />
Average cold end temperature may be controlled by one or more of the following:<br />
< previous page page_133 next page >
previous page page_134 next page ><br />
• Bypass a portion of inlet air around heating surfaces<br />
• Recirculating a portion of the hot air from the air heater outlet into the air entering the heater<br />
• Use of a recuperative steam coil in the air duct upstream of the main air preheater.<br />
Corrosion may be further reduced by using acid-resistent metals such as cast iron and corrosionresistant<br />
steel or by coating metal surfaces with enamel.<br />
Page 134<br />
Ash deposits on the heat transfer surfaces also contribute to corrosion. <strong>The</strong> porous ash reduces<br />
underlying metal temperatures and allows the flue gas moisture to condense on the metal surface. <strong>The</strong><br />
moisture that results combines with the acid in the ash to promote rapid corrosion. Soot blowers<br />
employing steam or air as cleaning agents are used to remove the ash deposits (see Chapter 15).<br />
<strong>The</strong> life of the heat transfer surfaces in an air preheater is very dependent on the prevention of cold<br />
end corrosion and the sulfur content of the fuels used. <strong>The</strong> expected life ranges from 4 or 5 years with<br />
high sulfur fuels to 20 years on natural gas.<br />
Maximum Combustion Air Temperatures<br />
<strong>The</strong> temperature to which the combustion air can be preheated is limited by the entering gas<br />
temperature, the firing equipment and the type of duct, windbox and furnace construction. Maximum<br />
combustion air temperature is generally taken to be 250350ºF for stoker-fired units. Pulverized-coal<br />
firing may require preheated air up to 700ºF. Retrofit applications must consider these limitations<br />
along with required insulation of combustion air ducts.<br />
Air Preheater Size<br />
<strong>The</strong> physical dimensions of the air preheater are determined by<br />
• arrangement and dimensions of air and gas passages<br />
• space available for the air preheater<br />
• type of fuel fired<br />
• desired final combustion air and flue gas temperature<br />
• air and gas flow requirements<br />
• pressure drop requirements<br />
< previous page page_134 next page >
previous page page_135 next page ><br />
Figure 14-6<br />
Cold end temperature and material selection guide.<br />
Page 135<br />
< previous page page_135 next page >
previous page page_136 next page ><br />
Forced Draft and Induced Draft Fan Modifications<br />
Page 136<br />
An evaluation of the use of air preheaters in existing units must consider the added cost of revamping<br />
forced and induced draft fans to accommodate the added resistance to air and gas flow. Static<br />
pressures will also increase due to changes in air and gas temperatures throughout the unit. Additional<br />
fan power will be required to make up for leakage around seals on a rotary type unit. Typical design<br />
leakage can be as much as 1015% of the exit gas flow on this type of air heater while leakage on<br />
recuperative heaters can be eliminated entirely by replacing or repairing leaking elements.<br />
A complete engineering evaluation will be required to determine the feasibility of using existing or<br />
required new equipment and the added operational costs.<br />
Additional Desirable and Undesirable Aspects<br />
In addition to the improvements in overall boiler efficiency, and subsequent fuel savings, air<br />
preheaters offer the following desirable features:<br />
• Improves combustion efficiency resulting in reduced excess air requirements for complete<br />
combustion and total gas flow through the unit.<br />
• Aids in stabilizing fuel ignition which permits greater load flexibility including improved low load<br />
operation.<br />
• Increases furnace temperature and heat absorption rate resulting in greater steam producing<br />
capacity limited by drum steam separating capacity.<br />
• Results in more complete burning of the fuel producing cleaner gases passing through the unit, less<br />
fouling and fewer boiler outages for cleaning.<br />
<strong>The</strong> disadvantages of air preheaters include the following:<br />
• Increased stoker and furnace refractory maintenance costs.<br />
• Accumulation of deposits in the gas passages of the air heater may restrict gas flow and in extreme<br />
cases may ignite, causing serious damage (if poorly maintained).<br />
< previous page page_136 next page >
previous page page_137 next page ><br />
Economizers<br />
Principle of Operation<br />
Page 137<br />
An economizer is an arrangement of feedwater tubes located in the exhaust duct that absorb a portion<br />
of the heat energy that would otherwise be lost in the flue gas. This recovered energy provides<br />
additional heating of the feedwater thereby reducing the boiler firing rate necessary to generate steam,<br />
improving overall boiler efficiency. Economizers can also be employed to heat hot water for space<br />
heating or process requirements apart from the boiler water cycle.<br />
Economizers are generally preferred over air preheaters in retrofit additions to industrial-sized units<br />
for the following reasons:<br />
• lower initial capital costs<br />
• no impact on NOx emissions<br />
• lower draft losses<br />
• minimal auxiliary power requirements (slight increases in feedwater pumping and combustion air<br />
fan requirements)<br />
An economizer is more economical than an air preheater for small, low pressure boilers with outputs<br />
below 50,000 pounds of steam per hour. Air preheaters become competitive with economizers for<br />
larger units and the choice is made on the basis of the same factors itemized earlier in this chapter,<br />
under the Air Preheater ''Principles of Operation" heading.<br />
Performance<br />
An increase in feedwater temperature of 10ºF will result in a fuel savings of approximately 1.0%. <strong>The</strong><br />
practical extent to which the feedwater temperature can be increased using an economizer is limited<br />
by several factors including<br />
• flue gas temperature<br />
• steam pressure<br />
• economizer surface area<br />
• corrosion characteristics of flue gas.<br />
< previous page page_137 next page >
previous page page_138 next page ><br />
Page 138<br />
<strong>The</strong> efficiency improvement with an economizer is reflected in lower stack gas temperatures and can<br />
be estimated using the graph presented in Figure 14-1. <strong>The</strong> relationship between stack temperature<br />
reduction and feedwater temperature increase can be closely estimated on the basis that a three-degree<br />
decrease in flue gas temperature will raise the feedwater temperature by one degree. <strong>The</strong>re is a<br />
maximum feedwater temperature depending on the operating pressures of the boiler. This constraint<br />
is discussed later, under the heading "Economizer Outlet Temperature."<br />
<strong>The</strong> gross annual fuel savings can be estimated from the nomograph presented in Figure 14-2 using<br />
the projected efficiency improvement, average steam flow and fuel costs. Subtracting fixed charges<br />
and increased operating costs will result in an estimated net annual savings.<br />
Costs<br />
Equipment and installed costs of retrofitting an economizer into an existing steam generator will vary<br />
for each application. Capital costs are influenced by such factors as<br />
• arrangement of economizer tubes<br />
• desired performance<br />
• tube size and materials<br />
Installed costs will typically vary from 30 to 100% of the capital costs depending on:<br />
• available space<br />
• duct modifications<br />
• required feedwater preheaters (below, under heading "Economizer Outlet Temperature"<br />
• plumbing and pumping alterations<br />
• air fan changes due to increased draft loss<br />
Maintenance costs are generally limited to internal and external cleaning. Tube replacement costs can<br />
be minimized by proper selection of economizer tube materials for given flue gas conditions as<br />
outlined below.<br />
< previous page page_138 next page >
previous page page_139 next page ><br />
Size<br />
Page 139<br />
Heat transfer rates are highest when the temperature differential between the flue gas and the<br />
feedwater are greatest. Since the feedwater is at a lower temperature than the water in the convective<br />
pass tubes of the boiler, absorption of heat from the flue gas is potentially more effective in the<br />
economizer than in the convective surfaces of the boiler.<br />
Current boiler design trends have made use of this fact by increasing economizer surface with<br />
corresponding decreases in boiler surface. <strong>The</strong> economizer surface area is generally 25 to 30% and 40<br />
to 60% of the boiler heating surface for applications with and without air preheaters respectively.<br />
Economizer surface area is limited by increased draft losses and outlet temperature differential<br />
between the gas and feedwater.<br />
Arrangement<br />
Economizers can be classified as either integral or separate. Integral economizers are arranged in<br />
vertical or horizontal banks of tubes located within the boiler casing. Vertical tubes are similar to a<br />
bank of boiler tubes and are frequently connected at both ends with drums. Horizontal tubes are<br />
arranged in closely spaced, staggered rows.<br />
Spacing is limited to a minimum of 1 3/4-2 inches to prevent ash accumulation from plugging the<br />
economizer and to maintain draft losses to less than 4 inches of water. Horizontal tubes have a<br />
continuous loop arrangement.<br />
Separate economizers are located downstream of any convective region and outside the boiler casing.<br />
<strong>The</strong>y are generally arranged horizontally. Retrofit economizers usually employ separate economizers.<br />
Water flow in the economizer is normally from the bottom upward through the tubes allowing any<br />
steam that may be generated to be bled off the top. <strong>The</strong> flue gas passes either down along the tubes<br />
moving counter to the water flow or across the tubes in single or multiple passes. <strong>The</strong> counter flow<br />
arrangement is preferred as it reduces required surface area and results in lower draft losses. Baffles<br />
and bypass ducts are sometimes employed to control gas and feedwater temperatures.<br />
< previous page page_139 next page >
previous page page_140 next page ><br />
Tubes<br />
Economizer tubes are generally made of cast iron or steel and range from 1 3/4-2 inches O.D. Steel<br />
tubing is employed in high pressure applications and offers the following advantages<br />
• thinner tubing<br />
• closer spacing<br />
• higher conductivity<br />
• lower initial cost<br />
Page 140<br />
Cast iron is used in low pressure applications especially where corrosion is expected. A combined steel<br />
and cast iron design is sometimes used where maximum resistance to both internal and external<br />
corrosion is desired.<br />
Extended tube surfaces are often used to increase heat absorption. <strong>The</strong> type of extensions and spacing<br />
are determined by the fuel characteristics and provision for cleaning. Short, widely spaced fins are<br />
employed with coal and residual oil while tall, closely spaced fins are used with natural gas or other<br />
clean fuels. <strong>The</strong> advantages of this type over bare tube surfaces include<br />
• lower initial costs<br />
• strength against bending<br />
• reduced tubing requirements.<br />
Extended surface tubes are normally installed in horizontal banks in a staggered arrangement.<br />
Economizer Outlet Temperature<br />
<strong>The</strong> maximum economizer outlet temperature is usually maintained 35 to 75 degrees below the<br />
saturation temperature to prevent steaming, water hammer and thermal shock. In certain<br />
applications, steaming economizers are employed to produce part of the steam. <strong>The</strong>y are not normally<br />
employed in industrial boilers where a high feedwater makeup is necessary.<br />
In the case of retrofit economizers significant feedwater temperature alterations can have a<br />
detrimental effect on boiler water circulation. Industrial boilers generally use "natural" water<br />
circulation (i.e., circulation throughout the boiler is maintained by<br />
< previous page page_140 next page >
previous page page_141 next page ><br />
Page 141<br />
variations in water densities caused by heat absorption in various parts of the boiler circuit). Changes<br />
in feedwater temperature can result in a lower circulating head and some circuits may not maintain<br />
sufficient flow for proper cooling. This may require modifications to existing boiler heat transfer<br />
passes.<br />
Internal Corrosion<br />
Economizers are subject to internal corrosion from dissolved oxygen and low hydroxyl ion<br />
concentration. As the temperature of the feedwater increases, the oxygen is driven out of solution and<br />
attacks the tube interior surfaces. <strong>The</strong> feedwater is therefore preheated to 220ºF by the use of<br />
deaerator heaters to remove dissolved oxygen. A pH value of between 8 and 9 is normally maintained<br />
in the feedwater by recirculating boiler water into the inlet of the economizer.<br />
External Corrosion<br />
<strong>The</strong> same external corrosion considerations that were discussed in the Air Preheater section apply to<br />
the application of an economizer. Since the tube metal temperature is very close to the feedwater<br />
temperature, the inlet feedwater temperature is normally maintained at 220ºF or higher so that tube<br />
metal surfaces will be above the minimum cold end temperatures presented in Figure 14-6. Exit flue<br />
gas temperatures are at least 80ºF above this to provide sufficient heat transfer to the feedwater.<br />
Air Pollution Emissions<br />
Air pollution emissions are generally not affected by the use of an economizer. CO, particulate and<br />
combustible emissions may be reduced in applications where overfiring of the boiler was necessary to<br />
maintain peak load conditions prior to incorporation of an economizer.<br />
< previous page page_141 next page >
previous page page_143 next page ><br />
15<br />
Other Types of Auxiliary Equipment<br />
Firetube Turbulators<br />
Principle of Operation<br />
Page 143<br />
Firetube turbulators are small baffles inserted into individual firetubes in the upper passes of firetube<br />
boilers to induce turbulence in the hot gas stream and thereby increase the convective heat transfer to<br />
the tube surface. <strong>The</strong>se devices have also reportedly enabled installers to balance gas flow through the<br />
firetube to achieve more effective utilization of existing heat transfer surface. <strong>The</strong> corresponding<br />
efficiency improvement at a given boiler firing rate and excess air level are reflected in lower stack gas<br />
temperature and increased steam generation.<br />
Performance<br />
As described in the previous chapter, a reduction of 100°F in stack gas temperature will result in a 2<br />
1/2% efficiency improvement. Manufacturer claims range up to 10%, which would correspond to a<br />
400ºF reduction in flue gas temperature. <strong>The</strong>se very high improvements are probably a combined<br />
effect of reducing excess air levels, lower stack gas temperatures and tube cleaning which may be<br />
performed during installation of the turbulators.<br />
Physical Description and Application<br />
Turbulators may consist of angular metal strips inserted into the second or second and third flue gas<br />
passes or spiral metal blades and baffles installed at the tube inlet. A typical installation of the first<br />
type is depicted in Figure 15-1. <strong>The</strong>se are generally 2 to 8 feet in length and sized to fit the inside<br />
diameter of the tubes.<br />
< previous page page_143 next page >
previous page page_144 next page ><br />
Figure 15-1<br />
Two-pass Scotch Marine firetube<br />
boiler with and without turbulators.<br />
Page 144<br />
< previous page page_144 next page >
previous page page_145 next page ><br />
Page 145<br />
<strong>The</strong>se devices have been generally employed on firetube units with steam capacities less than 30,000<br />
pounds per hour as substitutes for more costly economizers or air preheaters. Turbulators can be<br />
employed in gas- and oil-fired boilers with two and three pass systems but are not recommended for<br />
coal-fired units.<br />
Turbulators increase convective heat transfer to the tube surface by increasing flue gas turbulence. By<br />
selectively altering the flow resistance through individual tubes, they can also be employed to balance<br />
gas flows through the tubes.<br />
Allowances must be made to overcome the increased pressure drop through the system and assure<br />
sufficient air flow for complete combustion. Often this will require readjustments of burner controls<br />
following installation of the turbulators. <strong>The</strong> need for these adjustments will be determined by a postinstallation<br />
efficiency check (O2, CO, stack temperature measurements) which should be performed to<br />
verify complete combustion.<br />
Air Pollution Emissions<br />
Manufacturers claim that the improved combustion conditions will result in reduced combustibles in<br />
the flue gas.<br />
Oil and Gas Burners and Supply Systems<br />
This section describes the available auxiliary equipment that can be employed to improve burner<br />
performance for oil- and gas-fired systems.<br />
Principle of Operation<br />
Excess air levels have a major impact on boiler efficiency. Too much excess air means higher NOx<br />
emission levels, increased mass flow, and energy losses up the stack. <strong>The</strong> additional air results<br />
primarily from excess air at the burner required to provide complete combustion of the fuel. Current<br />
design trends have employed modified fuel/air mixing and flow patterns to minimize excess air<br />
requirements. Associated reductions in NOx and particulate emissions have also been demonstrated.<br />
< previous page page_145 next page >
previous page page_146 next page ><br />
Page 146<br />
Low excess air (LEA) burners originally developed in Europe are currently being applied to industrial<br />
steam generating units in the United States. <strong>The</strong>se combustion systems employ improved oil fuel<br />
atomization and controlled air fuel mixing to achieve extremely low excess air (35%) operating levels.<br />
Many of these systems were initially developed to reduce air pollution levels and can therefore offer<br />
this additional benefit. Some restrictions, however, have been encountered in the application of LEA<br />
burners to industrial boilers especially on a retrofit basis.<br />
<strong>The</strong>se problems have been primarily associated with the compatibility of new flame shapes and heat<br />
release rates with existing furnace volume and design. A very sophisticated combustion control system<br />
employing automatic O2 correction is required with an LEA burner to fully utilize its low excess air<br />
capability and prevent small excursions in excess air which might lead to high combustibles and<br />
potentially unsafe conditions.<br />
Conventional packaged burner systems that come complete with fans and combustion controls are also<br />
available. While these systems are not as sophisticated as those described above, they can result in<br />
substantial reductions in required operating excess air levels where existing burners require high<br />
excess air due to outdated design, wear, deterioration, etc. <strong>The</strong>y also have the advantage of reduced<br />
maintenance, convenient replacement and are readily adaptable to nearly all industrial boiler<br />
configurations.<br />
Other equipment that can benefit boiler efficiency includes special oil fuel atomization and viscosity<br />
control systems. Proper pretreatment and atomization of the oil fuel are vital to reduced excess air<br />
operation.<br />
Performance<br />
<strong>The</strong> performance benefits using improved combustion equipment are determined by the resulting<br />
reduction in operating excess air levels.<br />
Several manufacturers of LEA burners have claimed operating excess air levels as low as 2%. It has<br />
been questioned, however, whether these excess air levels can be maintained throughout the<br />
< previous page page_146 next page >
previous page page_147 next page ><br />
entire load range and over prolonged operation especially on multiple burner systems.<br />
Page 147<br />
Combustion control systems use an average flue gas excess O2 level measured at the boiler outlet to<br />
adjust all the burners as a single unit. Variations in air or fuel flow between burners due to normal oil<br />
tip wear, gradual dissimilarities in air damper adjustments, etc. may result in the inability to maintain<br />
extremely low excess air levels without extensive maintenance requirements. More realistically<br />
attainable levels may prove to be approximately 5% excess air.<br />
Manufacturers of packaged burner systems guarantee an operating level of 10% excess air for both oil<br />
and gas fuels.<br />
LEA burners generally resemble conventional burners. Modifications in fuel injection and air flow<br />
patterns to achieve optimum mixing and flame patterns permit very low excess air while maintaining<br />
complete combustion. As with conventional burners, the minimum excess air levels are indicated by<br />
excessive levels of CO or hydrocarbons on gas fuel and smoke on oil fuel.<br />
Current design trends have emphasized the use of primary and secondary combustion zones within the<br />
flame to minimize NOx formation. <strong>The</strong> primary zone nearest the burner is maintained fuel rich with<br />
fuel and air mixing characteristics designed to provide stable flame holding. Swirl or rotation in the<br />
air stream or, in certain cases, turbulence from deflectors, provide the necessary flow pattern.<br />
Additional air required for complete combustion is provided in a secondary combustion zone<br />
surrounding the primary zone.<br />
<strong>The</strong> combustion of oil fuels involves an additional aspect not present in the combustion of gaseous<br />
fuels. Oil fuel must be atomized prior to mixing with the combustion air. This is accomplished by<br />
dispersing the oil into a fine droplet spray that evaporates from the heat of the flame. <strong>The</strong> fineness of<br />
the atomization determines the evaporation rate of the oil and will vary with the viscosity of the oil<br />
entering the atomizer.<br />
< previous page page_147 next page >
previous page page_148 next page ><br />
Page 148<br />
LEA burners develop the fuel spray and air flow patterns to achieve both complete mixing and a<br />
stable flame pattern while requiring less overall excess air than conventional burners. Fuel sprays are<br />
oriented or swirled in several fashions to direct the oil vapors into the air flow.<br />
Various air flow patterns are employed to provide a controlled mixing pattern for complete<br />
combustion with minimum excess air requirements. This flow pattern holds the mixture in proper<br />
position in front of the atomizer and provides for vaporization and ignition of the oil droplets by<br />
locally recirculating exhaust products and by radiation from the flame.<br />
Numerous factors must be considered in the selection of a new burner system. Flame shape and heat<br />
release rates must be compatible with furnace conditions. Use of a system that can employ existing fan<br />
and fuel handling capabilities will significantly reduce costs. Adequate turndown capabilities and<br />
firing rate response for load modulations are important.<br />
Flame scanners and other safety equipment and instrumentation may be useful to improve reliability.<br />
A comprehensive engineering evaluation and consultation with the boiler manufacturer is<br />
recommended prior to the selection of new burner equipment.<br />
Atomizing Systems<strong>Efficient</strong> combustion of a liquid fuel requires rapid vaporization of the fuel which is<br />
facilitated by atomizing the fuel to the smallest possible droplet size.<br />
Many new concepts for improved fuel oil atomization are currently available. One system employs<br />
sound waves to ''sonically atomize" the fuel to a fine liquid spray. Another system uses water emulsion<br />
in the oil that flashes to steam at the burner nozzle and shatters the oil into small particles. <strong>The</strong><br />
manufacturers of these techniques generally claim improved turndown ratios and as much as a 5%<br />
savings in fuel when compared to the conventional steam, air, mechanical or pressure atomizers<br />
currently utilized in industrial boiler burners.<br />
When evaluating new atomizing systems it should be recognized that these will impact boiler efficiency<br />
primarily by permitting operation at lower excess air levels thereby minimizing the "dry<br />
< previous page page_148 next page >
previous page page_149 next page ><br />
Page 149<br />
gas losses." For retrofit applications these systems are therefore directed to existing burners which are<br />
of inadequate design to operate with low excess air.<br />
Viscosity ControlViscosity is a measurement of the relative ease by which a liquid will flow when<br />
subjected to a pressure differential. Viscosity is important to burner performance in the direct<br />
relationship it has with atomization. Droplet size, spray cone angle, pressure drop, and soot formation<br />
in the burner are all affected by the viscosity of the oil. Proper atomization is basic to achieving<br />
complete combustion with low excess air.<br />
For optimum operation, all oil burners depend on an accurate control of the oil's viscosity. Common<br />
practice is to control oil temperature using a known relationship between temperature and viscosity.<br />
Recent viscometer developments have made direct viscosity control possible. Manufacturers of such<br />
instruments claim that direct viscosity control is now necessary due to the wide variations in oils<br />
currently on the market.<br />
Air Pollution EmissionsOne of the primary factors in the development of low excess air burners has<br />
been the desire to reduce NOx and particulate emission levels. Manufacturers claim that up to a 20%<br />
reduction in NOx emissions can be achieved using a LEA burner with corresponding reductions in<br />
particulate levels.<br />
Lower NOx emission levels can be expected with low excess air operation on any industrial burner.<br />
Typically, NOx levels are reduced 20100 ppm for every 1.0% decrease in excess O2.<br />
Water Side Waste Heat Recovery<br />
Principle of Operation<br />
Heat energy lost from the steam generating unit in the blowdown water and expelled condensate can<br />
represent a significant amount of wasted energy. While not contributing directly to boiler efficiency (i.<br />
e., extraction of heat energy from the fuel is not affected), recovering this lost energy can result in very<br />
substantial<br />
< previous page page_149 next page >
previous page page_150 next page ><br />
fuel savings. For this reason heat recovery from blowdown and condensate is included in this book.<br />
Page 150<br />
Blowdown is a customary procedure to remove boiler water impurities that can affect steam quality<br />
and result in tube scale deposits. As discussed below, the amount of hot drain water discarded during<br />
blowdown is dependent on boiler and make-up water quality and can be as much as 5 to 10% of total<br />
boiler steam flow. A large portion of blowdown heat energy can be reclaimed by continuous blowdown<br />
extraction. With this technique flashed steam from the blowdown water is recycled to the boiler<br />
feedwater and heat exchangers remove heat energy from the remaining blowdown water. This heat<br />
recovery is practical only with continuous blowdown. Reducing blowdown requirements by deionizing<br />
and other boiler water pretreatment procedures can also minimize blowdown losses.<br />
Recovering heat energy normally lost in steam condensate can also reduce fuel consumption. Similar<br />
to blowdown heat recovery this will not affect boiler efficiency as it is customarily defined but can lead<br />
to improved overall plant or system efficiency. Various systems are available as outlined below to<br />
collect and return the condensate to the boiler. Fuel savings will be realized by recycling as much<br />
condensate as possible at boiler operating temperature and pressure. Heat losses in the condensate<br />
system are encountered with discarded condensate, pressure drops through the system in traps and<br />
receivers, flashed steam in vented systems and cooling requirements for condensate pumps.<br />
Contamination and losses will limit the amount of condensate that can be recycled.<br />
Performance<br />
Typical energy savings that can be generated by recovering heat in blowdown water can be estimated<br />
using Figures 15-2 and 15-3. <strong>The</strong> percentage of blowdown will be fixed by the solids concentration of<br />
the make-up water and the maximum boiler water concentration.<br />
Use of continuous rather than intermittent blowdown alone saves treated boiler water and can result<br />
in significant energy savings as discussed in Chapter 11. Typical intermittent blowdown<br />
< previous page page_150 next page >
previous page page_151 next page ><br />
Figure 15-2<br />
Percent blowdown required to maintain predetermined<br />
boiler-water dissolved solids concentration.<br />
Page 151<br />
patterns shown in Figure 11-1 can result in periodic shifts in total solids concentration and require<br />
higher blowdown rates to avoid solids carryover with the steam. Actual fuel savings in changing over<br />
to continuous blowdown depends on the existing blowdown patterns. <strong>The</strong> use of continuous blowdown<br />
will also permit the recovery of blowdown heat energy described above.<br />
Manufacturer estimates of fuel savings using semi-pressurized and fully pressurized condensate return<br />
systems as compared to open systems are approximately 12% to 15% respectively. Actual savings will<br />
depend on boiler operating pressure, flash tank pressure and the eventual use of the flashed steam.<br />
Preheating boiler feedwater with waste heat can amount to a 1% savings for every 10ºF increase in<br />
feedwater temperature.<br />
< previous page page_151 next page >
previous page page_152 next page ><br />
Figure 15-3<br />
Waste heat energy recovery potential using continuous blowdown system,<br />
flash steam heat recovery and heat exchangers on expelled blowdown water.<br />
Page 152<br />
BlowdownTable 12-2 in Chapter 12 presents the recommended maximum concentration of impurities<br />
that can be tolerated in the boiler above which priming, foaming, and carryover occur, resulting in low<br />
quality steam. Excessive concentrations of dissolved and suspended solids also lead to internal scale<br />
formation, reduced heat transfer and, ultimately, tube failures. <strong>Boiler</strong>s are therefore equipped with<br />
blowdown systems that remove boiler water with high impurity concentrations and replace it with<br />
clean<br />
< previous page page_152 next page >
previous page page_153 next page ><br />
Page 153<br />
make-up water. Make-up water de-ionizers can also be employed to remove dissolved minerals, thus<br />
reducing blowdown requirements.<br />
Intermittent blowdown may result in wasted hot water and wide fluctuations in impurity<br />
concentrations. Improved operation is attained using continuous blowdown systems operating either<br />
manually or automatically that remove a small quantity of boiler water to maintain relatively constant<br />
dissolved solids concentration. Significant savings in hot water can be attained using continuous<br />
blowdown.<br />
In addition, continuous blowdown allows the use of heat recovery devices to preheat the incoming<br />
make-up water with waste heat from the blowdown water. It is common practice to recover as much of<br />
the heat in the expelled hot water as possible. Low pressure boilers with low blowdown rates usually<br />
employ heat exchangers to preheat the incoming make-up water. Higher capacity units operating at<br />
high pressures use a flash system in which a portion of the waste water is flashed to high purity steam<br />
at low pressures, condensed and recycled to the feedwater system. <strong>The</strong> remaining waste water having<br />
now an even higher concentration of impurities is passed through heat exchangers to preheat make-up<br />
water and discarded.<br />
Condensate Return SystemsCondensate recovered from process steam at boiler operating pressure<br />
and temperature represents a valuable quantity of clean water and usable energy. <strong>The</strong> amounts of<br />
condensate that can be recovered are dependent on the degree of contamination in the condensed<br />
water. In certain cases separators or filters can be employed to remove contaminants such as oil or<br />
rust material so that the water is suitable for use in the boiler. Water containing a high degree of<br />
contaminants is generally discarded.<br />
<strong>The</strong> recovery of condensate is also limited by the type of system utilized. <strong>The</strong> technique employed to<br />
recycle the condensate to the boiler can be divided into five categories:<br />
• Atmospheric (open) system<br />
• Semi-pressurized (semi-closed) system<br />
< previous page page_153 next page >
previous page page_154 next page ><br />
• Fully pressurized (closed) system<br />
• Vacuum type<br />
• Deaerators<br />
Page 154<br />
A study must be conducted in any retrofit application to assure that the system chosen is compatible<br />
with existing boilers and process requirements.<br />
<strong>The</strong> atmospheric system employs a vented tank downstream of a steam trap or drain in which the hot<br />
condensate is received. This is done to reduce condensate temperature to 212ºF to allow pumping<br />
without cavitation occurring. A portion of the condensate will flash to steam and vent to the<br />
atmosphere representing a loss of both energy and water. Treated make-up water is added as required<br />
to meet feedwater flow requirements.<br />
This is the most common type of return system with the least cost. It is generally compatible with all<br />
units especially when large amounts of condensate are returned. Losses may be reduced by proper<br />
sizing and application of steam traps and drains.<br />
<strong>The</strong> semi-pressurized system employs a condensate receiver that is at an intermediate pressure at least<br />
50 psi below the lowest anticipated steam pressure in the process system. <strong>The</strong> intermediate pressure<br />
permits use of conventional condensate (trap) return systems, while retaining a significantly higher<br />
condensate temperature. <strong>The</strong> receiver pressure is controlled by steam passing through a pressurereducing<br />
valve from the main steam header to the receiver.<br />
This steam, along with the steam flashed from the condensate, can be employed to heat make-up water<br />
or supply low-pressure process steam. A steam relief valve is provided with a set point 10 to 20 psi<br />
above the pressure reducing valve setting and prevents abnormal pressure surges. An air vent is<br />
provided on the receiving vessel to allow noncondensable gases to escape.<br />
<strong>The</strong> condensate is cooled by the make-up water to a temperature at least 20ºF below the saturation<br />
temperature to prevent vapor lock in the boiler feedwater pump. This system has the advantage of<br />
reduced water and energy losses. Pressure variations must be controlled to a minimum in the receiver<br />
in order to prevent boiler feed pump cavitation.<br />
< previous page page_154 next page >
previous page page_155 next page ><br />
Page 155<br />
Relatively stable pressure can be maintained by the steam pressure-reducing valve and the steam relief<br />
valve combinationeven in the face of irregular condensate flow and systems steam trap malfunctions.<br />
An attempt is made to return all the condensate to the boiler in the fully pressurized system. <strong>The</strong><br />
entire system is operated at the steam process pressure with flow losses overcome by specially designed<br />
water pumps.<br />
Operation of a fully pressurized system is restricted to units with nearly constant steam loads as<br />
sudden heat demands will cause pressure fluctuations resulting in the flashing of condensate and<br />
restricted flow through the system. Vents operating automatically are provided to allow trapped air to<br />
be released. <strong>The</strong>se severe operating restrictions often limit its application.<br />
<strong>The</strong> vacuum type system is normally only used on low-pressure heating systems where large pressure<br />
drops exist due to long condensate lines or steam traps.<br />
Deaerators preheat feedwater and remove non-condensible and corrosive gases using heat and<br />
agitation. Heat is supplied by returned condensate or low-pressure steam while agitation is provided<br />
by sprays or trays. Deaerators normally operate at approximately 15 psig. <strong>The</strong> small amount (1 to 2%)<br />
of flashed steam not condensed with the feedwater is vented with the non-condensible gases and later<br />
condensed in a vent condenser.<br />
Wall and Soot Blowers<br />
Principle of Operation<br />
Wall and soot blowers are employed to remove deposits from heat transfer surfaces in the boiler.<br />
Removal of slag deposits from the furnace walls of a coal-fired unit is done using wall blowers. Soot<br />
blowers are employed to remove fly ash and soot deposits from the convective passes of the boiler. If<br />
allowed to accumulate, these deposits would retard heat transfer and may eventually result in clogging<br />
the boiler.<br />
<strong>The</strong>se problems are related to oil- and coal-fired systems. <strong>The</strong> properties of the fuel, the characteristics<br />
of the firing system, and<br />
< previous page page_155 next page >
previous page page_156 next page ><br />
Page 156<br />
the resulting temperature distribution in the boiler have an effect on the type and accumulation rates<br />
of the deposits.<br />
Analyses of these factors are required prior to selection and installation of a soot-blowing system.<br />
Retrofit applications are often required with changes in fuel supply or when existing equipment is<br />
deemed inadequate due to excessive stack gas temperatures or tube failures.<br />
Performance<br />
Manufacturers claim that proper soot blowing can increase unit efficiency by up to 1%.<br />
Physical Description and Application<br />
Soot blowers can be either fixed or retractable and use either air or steam as the blowing media. Fixed<br />
position systems are employed in low temperature regions whereas retractable systems, known as<br />
lances, are generally used in high temperature regions.<br />
Special nozzles and arrangements are employed including rotating lance blowers as illustrated in<br />
Figure 15-4. Wall blowers are generally short retractable lances that penetrate the boiler furnace wall<br />
and rotate 360 degrees.<br />
<strong>The</strong> availability of steam and compressed air and the cost of installation and maintenance of the<br />
supply system will determine the selection of the cleaning medium. <strong>The</strong> choice of the cleaning medium<br />
will also depend to a degree on the characteristics of the deposits.<br />
Slags at the cold end of their "plastic" temperature range (liquid and solid mixture) can be chilled<br />
(solidified) and removed by air or steam blowers. Deposits that will remain plastic over a large range<br />
in temperature (greater than 50ºF) may require a water spray to solidify the deposits for easier<br />
removal.<br />
Air Pollution Emissions<br />
Particulate emissions may temporarily increase when soot blowers are operated.<br />
< previous page page_156 next page >
previous page page_157 next page ><br />
Insulation<br />
Principle of Operation<br />
Figure 15-4<br />
Soot blower arrangements. Reprinted from Power magazine.<br />
Page 157<br />
Insulation is any material that is employed to restrict the transfer of heat energy. It can generally be<br />
categorized as either mass or reflective type depending on whether it is aimed at reducing conductive<br />
or radiative heat transmission, respectively.<br />
< previous page page_157 next page >
previous page page_158 next page ><br />
Page 158<br />
<strong>The</strong> overall thermal resistance of the mass type insulation depends on both its composition and<br />
physical structure. Materials are effective that have a low thermal conductivity but more importantly<br />
contain numerous small voids filled with air or gas. <strong>The</strong>se voids provide the primary resistance to<br />
conductive heat transfer. <strong>The</strong> effectiveness of the insulation is also determined by the thickness or<br />
quantity of material used.<br />
Reflective type insulation, generally consisting of smooth metal surfaces, reduce the loss of heat energy<br />
by radiation. This type of insulation is often used as a covering for mass type insulation and can also<br />
be employed in layers separated by air pockets to replace mass insulation. This application offers<br />
several advantages, however, consideration must be given to heat loss by convection and conduction<br />
through and between the metal surfaces.<br />
Insulation provides other benefits besides reduced heat losses, including controlled surface<br />
temperatures for comfort and safety, structural strength, reduced noise, and fire protection.<br />
Performance<br />
Properly applied insulation can result in large savings in energy losses depending on type, thickness<br />
(mass type only), and condition of the existing insulation. Figure 15-5 presents the approximate total<br />
rate of heat energy loss by radiation and convection from a bare flat surface based on the temperature<br />
difference between the surface and still air.<br />
Bare surface temperature in steam generating units ranges from saturation temperature on exposed<br />
tube surfaces to air and gas temperatures on duct surfaces. Approximate radiation losses from furnace<br />
walls as developed by the ABMA were presented in Chapter 3, Figures 3-3 and 3-4.<br />
Radiation losses tend to increase with decreasing load and can be as high as 7% for small units or<br />
larger units operating at reduced loads. More precise determination of energy losses can be made<br />
based upon existing insulation operating temperature, air flow over the surface, surrounding<br />
conditions and surface orientation (horizontal or vertical). An engineering analysis of existing<br />
conditions and potential energy savings should be conducted prior to application of insulating material.<br />
< previous page page_158 next page >
previous page page_159 next page ><br />
Costs<br />
Figure 15-5<br />
Heat energy loss from bare surface. Reprinted from Power magazine.<br />
Page 159<br />
Procedures have been developed by the <strong>The</strong>rmal Insulation Manufacturers Association to determine<br />
the optimum insulation thickness for various applications based on<br />
• fuel costs<br />
• operating temperatures<br />
• insulation type<br />
• depreciation period of plant and insulation<br />
• capital investment<br />
Physical Description and Application<br />
Mass Type<strong>The</strong> selection of an insulating material is based on several factors other than composition.<br />
As mentioned, the numerous voids contained in the material structure provide the primary resistance<br />
to heat transmission by conduction. Mass type<br />
< previous page page_159 next page >
previous page page_160 next page ><br />
insulation must be protected from damage by moisture absorption or excessive compression as these will reduce the<br />
insulatory value of the material.<br />
Page 160<br />
Common insulating materials include calcium silicate, cellular glass and diatomaceous silica. Insulation made of 85%<br />
magnesia and asbestos that was once extensively used in high pressure steam generators is no longer made and has been<br />
replaced by glass fiber materials. Temperature limitations sometimes require the use of insulating materials for effective<br />
insulation of high temperature surfaces.<br />
Stiffeners, metal mesh, or protective jackets are employed to increase the strength and dimensional stability of the<br />
insulation. Protection against fire is an important consideration both with regard to the flammability of the insulating<br />
material and protection of the insulant from external fire.<br />
Reflective TypeReflective type insulation generally consists of smooth metal surfaces that have a low emissivity and<br />
retard the loss of heat energy by radiation to cooler surroundings. Table 15-1 presents the emissivity of various materials<br />
that represent the ratio of the metal's radiating power to the maximum radiation rate at that temperature. In<br />
comparison, ordinary paint or mass type insulation covering have emissivities of approximately 0.85 to 0.95.<br />
Metal<br />
Aluminum<br />
Copper<br />
Gold<br />
Iron, cast or wrought<br />
Monel metal<br />
Nickel<br />
Platinum<br />
Silver<br />
Steel<br />
Tin<br />
TABLE 15-1. Emissivity of metallic surfaces.<br />
Polished Metal Surfaces Oxidized Surfaces<br />
Temperatures Temperatures<br />
70ºF 1000ºF Below 1500°F<br />
0.05 0.075<br />
0.04 0.08<br />
0.03 0.05<br />
0.20 0.25<br />
0.07 0.10<br />
0.06 0.10<br />
0.036 0.10<br />
0.20 0.25<br />
0.20 0.25<br />
0.08<br />
0.10 0.20<br />
0.55 0.75<br />
0.60 0.90<br />
0.40 0.50<br />
0.40 0.60<br />
0.60 0.90<br />
< previous page page_160 next page >
previous page page_161 next page ><br />
Page 161<br />
Use of a single layer of reflective insulation does not impede the transfer of energy by convection or<br />
conduction; however, multiple layers separated by air pockets can be employed to form an insulating<br />
barrier that is more effective than mass type insulation in certain applications. Convection losses in the<br />
air separating the layers can be reduced by seals and transverse metal barriers that restrict air<br />
movement due to buoyancy forces. Conduction losses at contact points must also be considered.<br />
Reflective type insulation offers the following advantages over mass type insulation<br />
• lightweight<br />
• resists moisture damage<br />
• resists fire damage<br />
• easier to decontaminate<br />
• adaptable to several configurations<br />
<strong>The</strong> greater susceptibility to corrosive damage and heat energy losses by convection and conduction<br />
are the primary disadvantages of reflective type insulation.<br />
Table 15-2 summarizes the operating principles and potential for improvement in efficiencies for<br />
auxiliary boiler equipment.<br />
< previous page page_161 next page >
previous page page_162 next page ><br />
TABLE 15-2. Summary<strong>Boiler</strong> efficiency improvement equipment.<br />
Device Principle of Operation Efficiency Improvement Potential Special Considerations<br />
Air Preheaters Transfer energy from stack gases to<br />
incoming combustion air.<br />
Economizers Transfer energy from stack gases to<br />
incoming feedwater<br />
Firetube Tur-<br />
bulators<br />
Combustion Con-<br />
trol System<br />
(table continued on next page)<br />
Increases turbulence in the secondary<br />
passes of firetube units thereby<br />
increasing efficiency<br />
2.5% for each 100ºF decrease in stack gas<br />
temperature<br />
2.5% increase for each 100°F decrease in stack<br />
gas temperature (1% increase for each 10ºF<br />
increase in feedwater temperature<br />
2.5% increase for each 100ºF decrease in stack<br />
gas temperature<br />
Regulate the quantity of fuel and air flow 0.25% increase for each 1% decrease in excess<br />
O2 depending on the stack gas temperature<br />
• Results in improved combustion condition<br />
• Minimum flue gas temperatures limited by<br />
corrosion characteristics of the flue gas<br />
• Application limited by space, duct orientation and<br />
maximum combustion air temperatures<br />
• Minimum flue gas temperature limited by<br />
corrosion characteristics of the flue gas<br />
• Application limited on low pressure boilers<br />
• Generally preferred over air preheaters for small<br />
(50,000 lbs/hr) units<br />
• Limited to gas- and oil-fired units<br />
• Properly deployed, they can balance gas flows<br />
through the tubes<br />
• Increases pressure drop in the system<br />
• Vary in complexity from the simplest jackshaft<br />
system to cross limited oxygen correction system<br />
• Can operate either pneumatically or electrically<br />
• Retrofit applications must be compatible with<br />
existing burner hardware<br />
< previous page page_162 next page ><br />
Page 162
previous page page_163 next page ><br />
(table continued from previous page)<br />
Device Principle of Operation Efficiency Improvement Potential Special Considerations<br />
Instrumentation Provide operational data • Provide records so that efficiency comparisons can<br />
be made.<br />
Oil and Gas<br />
Burners<br />
Promote flame conditions that result in<br />
complete combustion at lower excess air<br />
levels.<br />
0.25% increase for each 1% decrease in excess<br />
O2 depending on the stack gas temperature<br />
• Operation with the most elaborate low excess air<br />
burners require the use of advanced combustion<br />
control systems.<br />
• Flame shape and heat release rate must be<br />
compatible with furnace characteristics<br />
• Flame scanners increase reliability<br />
• Advanced atomized systems are available<br />
• Close control of oil viscosity improves atomization<br />
Insulation Reduce external heat transfer Dependent on surface temperature • Mass type insulation has low thermal conductivity<br />
and release heat loss by conduction<br />
• Reflective insulation has smooth, metallic surfaces<br />
that reduce heat loss by radiation<br />
• Insulation provides several other advantages<br />
including structural strength, reduced noise and fire<br />
protection<br />
Sootblowers Remove boiler tube deposits that retard<br />
heat transfer<br />
Dependent on the gas temperature • Can use steam or air as the blowing media<br />
• Fixed position systems are used in low temperature<br />
regions whereas retractable lances are employed in<br />
high temperature areas<br />
• <strong>The</strong> choice of the cleaning media will depend on the<br />
characteristics of the deposits<br />
(continued)<br />
< previous page page_163 next page ><br />
Page 163
previous page page_164 next page ><br />
TABLE 15-2. Summary<strong>Boiler</strong> efficiency improvement equipment. (continued)<br />
Device Principle of Operation Efficiency Improvement Potential Special Considerations<br />
Blowdown<br />
Systems<br />
Condensate<br />
Return<br />
Systems<br />
Transfer energy from expelled blowdown,<br />
liquids to incoming feedwater<br />
Reduce hot water requirements by recovering<br />
condensate<br />
13% dependent on blow down quantities and<br />
operating pressures<br />
• Quantity of expelled blowdown water is dependent<br />
on the boiler and makeup water quality<br />
• Continuous blowdown operation not only decreases<br />
expelled liquids but also allows the incorporation of<br />
heat recovery equipment<br />
1215% • Quantity of condensate returned dependent on<br />
process and contamination<br />
• Several systems available range from atmospheric<br />
(open) to fully pressurized (closed) systems<br />
< previous page page_164 next page ><br />
(end)<br />
Page 164
previous page page_165 next page ><br />
16<br />
Combustion Control Systems and Instrumentation<br />
Coauthor. M.J. Slevin, President<br />
Energy Technology and Control Corp.<br />
Combustion controls regulate the quantity of fuel and air flows in a steam generating unit. <strong>The</strong><br />
primary objectives of these controls are to<br />
• Provide adequate heat input to meet steam demands automatically<br />
• Protect personnel and equipment<br />
• Minimize pollution<br />
• Minimize fuel usage<br />
<strong>The</strong> first of these objectives is met by sufficient fuel input while the latter three are dependent on<br />
maintaining the proper air flow with respect to fuel (i.e., fuel/air ratio).<br />
Page 165<br />
An optimum range of excess air exists for each combination of fuel, firing mode and furnace condition.<br />
Too little air flow results in combustible emissions which are hazardous, polluting and can contain<br />
considerable amounts of unused energy. <strong>The</strong> minimum safe excess air level for conventional burners is<br />
generally taken to be 10% for gas fuel and 15% for oil fuel; however, specific applications may require<br />
higher levels.<br />
Too much excess air results in higher NOx emission levels and increased mass flow and energy losses<br />
up the stack. Heat transfer within the unit is also reduced with high excess air levels culminating in<br />
higher stack gas temperatures, wasted fuel and further performance losses.<br />
< previous page page_165 next page >
previous page page_166 next page ><br />
Page 166<br />
All boilers have some type of combustion control arrangement from simple manual control to a highly<br />
sophisticated computerized set up. <strong>The</strong> choice of the type of control system is made on the basis of<br />
• steam generating unit capacity and turndown required<br />
• steam demands and expected fluctuations in steam flow<br />
• expected performance levels that will require more sophisticated systems for higher operating<br />
efficiency<br />
• costs<br />
• pollution regulations that may require low excess air operation to minimize NOx emissions<br />
• adequate safety interlocks.<br />
It has been shown with the utilization of microprocessor technology to be economical to equip units as<br />
small as 10,000 pounds of steam per hour with fuel saving control systems. Caution, however, must be<br />
exercised to avoid selecting a control specification that may be operationally impractical.<br />
Instrumentation, in contrast to combustion controls, are passive elements that present the boiler<br />
conditions as they exist but are unble to detect deviations from desired operation and make corrective<br />
action without control systems or operator involvement. Without this information, it is impossible to<br />
determine whether the equipment is operating to the best advantage or that corrective action is<br />
necessary to restore performance.<br />
Use of a continuous oxygen analyzer to determine excess air levels is highly desirable with regard to<br />
pollution control and energy conservation. <strong>The</strong>y may be used either to provide information to the<br />
operator on control system operation or as an integral part of the combustion control system. Totally<br />
automatic control is achieved with advanced forms of oxygen trim control, preferably of the true<br />
adaptive type.<br />
Performance<br />
<strong>The</strong> increase in boiler efficiency using a retrofit combustion control system will be dependent on the<br />
type and condition of the existing equipment. Table 16-1 presents the sources of errors<br />
< previous page page_166 next page >
previous page page_167 next page ><br />
Page 167<br />
and the expected excess air operating levels as per manufacturers for each of the six control systems<br />
described later in this chapter. With the simplified positioning control (jackshaft) system used as the<br />
basis for comparison, installation of a sophisticated control system that adjusts air flow in relation to<br />
fuel flow with excess O2 correction is shown to reduce air levels on gas fuel down to 10 percent excess<br />
air or less, dependant on type and condition of burner.<br />
<strong>The</strong> associated improvement in efficiency can be determined for gas, oil and coal fuels using Figure 16-<br />
1. <strong>The</strong> reduction in excess air described above will result in a 3 to 4% benefit in fuel savings for a unit<br />
with 600ºF exit gas temperature. <strong>The</strong>se values will be augmented by the reductions in stack gas<br />
temperature that accompany the lower excess air flows. For the example given above, an additional<br />
2% reduction in fuel savings will be realized. Units equipped with economizers and/or air preheaters<br />
providing lower stack gas temperatures will have less of a savings.<br />
Costs<br />
In the past, a fully computerized system employing direct digital control may have had an installation<br />
cost of $100,000 per boiler. However, adaptive oxygen trim controls can be installed today for as little<br />
as $11,000 per boiler.<br />
Oxygen analyzers employing zirconium or ceramic oxide cost approximately $3000. <strong>The</strong>se units have<br />
demonstrated very low maintenance requirements.<br />
Combustion Control Systems<br />
<strong>The</strong> six basic combustion systems employing a single fuel are described below.<br />
Fixed PositioningA simplified fixed positioning control (jackshaft) system has been extensively applied<br />
to industrial boilers based on minimum control system costs. A single actuator moves both the fuel and<br />
air control devices through a mechanical linkage to a preset position in response to a change in the<br />
steam pressure.<br />
< previous page page_167 next page >
previous page page_168 next page ><br />
Factors affecting accuracy<br />
of fuel/air ratio control<br />
Fuel valve and positioning<br />
linkage<br />
Upstream fuel pressure 1<br />
Air damper and linkage 2<br />
Fan performance 2<br />
Alignment of burner<br />
characteristic with air<br />
differential<br />
Burner wear and<br />
carbonization<br />
Fuel Btu, specific gravity,<br />
and temperature variation<br />
Temperature, pressure and<br />
humidity errors in air<br />
metering<br />
Air/fuel control response<br />
lag<br />
Unaccounted for errors 1/2<br />
Control system accuracy 1/2<br />
Potential cumulative error 20<br />
(table continued on next page)<br />
Fixed positioning Positioning with<br />
operator trim<br />
TABLE 16-1. Differences in performance of control systems.<br />
Potential control system error percent excess combustion air<br />
Pressure ratio Fuel and Air metering Cross-limited metering Oxygen correction Effective corrective<br />
action<br />
Min. Max. Min. Max. Min. Max. Min. Max. Min. Max. Min. Max.<br />
1<br />
4<br />
2<br />
7<br />
4 1 4<br />
3 1 3<br />
6 2 6<br />
5 2 5<br />
10 4 10<br />
4 2 4<br />
14 7 14<br />
1 1/2 1<br />
1 1/2 1<br />
48 20 48<br />
3<br />
4<br />
2<br />
4<br />
1/2<br />
2<br />
151/2<br />
10<br />
10<br />
4<br />
9<br />
1<br />
5<br />
39<br />
Fuel metering<br />
Fuel metering<br />
Air metering<br />
Air metering<br />
Fuel and air metering<br />
Fuel metering<br />
2 4 2 4 O2 Correction<br />
4 9 4 9 O2 Correction<br />
1 2 O2 Correction<br />
1/2 1 1/2 1 O2 Correction<br />
1/2 2 1/2 2 1/2 2<br />
8 18 7 16 1/2 2<br />
< previous page page_168 next page ><br />
Page 168
previous page page_169 next page ><br />
(table continued from previous page)<br />
Probable cumulative error or additional excess air 34 34 27 13 11 1<br />
Add for complete combustion (gas fuel) 43 43 36 22 20 9<br />
Probable excess air required with operator trim from combustion<br />
guide (gas fuel)<br />
43 37 31 17 15 10<br />
Add for complete combustion (oil fuel) 53 53 40 32 30 19<br />
Probable excess air required with operator trim from combustion<br />
guide (oil fuel)<br />
53 47 41 27 25 20<br />
Type of combustion guide Steam flow/airflow or oxygen analysis Steam flow/airflow or oxygen analysis oxygen analysis<br />
< previous page page_169 next page ><br />
(end)<br />
Page 169
previous page page_170 next page ><br />
Figure 16-1<br />
Curve showing percent efficiency improvement per every one percent<br />
reduction in excess air. Valid for estimating efficiency improvements<br />
on typical natural gas, #2 through #6 oils and coal fuels.<br />
Page 170<br />
<strong>The</strong> system is calibrated by adjusting the linkage for proper fan damper travel and the profile cam on<br />
the fuel valve to produce the desired fuel/air ratio over the load range. A manual control override of<br />
the main actuator is usually provided.<br />
Since the system merely positions fuel valve and air damper openings, it cannot compensate for<br />
changes in fuel or air density, fuel supply pressure or heating valve. Wear in the fuel valve orifice,<br />
burner tips and fan dampers will also alter fuel/air ratios. This type of control system results in<br />
considerable variations of excess air depending on the particular conditions existing at a given time.<br />
As a result, nominally high excess air levels must be preset to avoid going below the minimum excess<br />
air requirements. In<br />
< previous page page_170 next page >
previous page page_171 next page ><br />
actual operation, excess air will vary over a considerable range as indicated in Table 16-1.<br />
Parallel Positioning with Operator TrimA lower margin of operating excess air can be achieved by<br />
substituting a pneumatic or electronic positioning system which reduces the variations caused by<br />
mechanical linkages.<br />
Page 171<br />
Separate actuators for the fuel valve and fan damper acting in parallel from a single steam pressure<br />
controller can be added. In addition, individual manual bias control of the fuel or air input can be<br />
used to adjust the fuel/air ratio. This system requires a combustion guide in the form of a steam flow/<br />
air flow or oxygen analyzer to assist the operator in positioning the excess air flow.<br />
<strong>The</strong> parallel positioning control is the most widely used combustion control system for units below<br />
100,000 pounds per hour. By adjusting the fuel/air ratio, compensations for variations in fuel<br />
characteristics, combustion conditions or control system equipment can be made.<br />
Pressure RatioUse of the fuel pressure at the burner and the windbox to furnace pressure differential<br />
as indications of fuel and air flows are the most elementary of the metering type systems. A basic<br />
parallel pneumatic or electronic system is used with the windbox to furnace/burner pressure ratio<br />
employed to trim the fuel and air flows. Manual bias control to change the ratio of pressures and<br />
excess air flows is normally provided incorporating a combustion guide.<br />
This system eliminates inaccuracies due to fuel pressure and fan discharge variations but it requires<br />
that the pressure-flow relationships for the fuel and air have similar characteristics. Alignment<br />
problems often exist causing inaccuracies. Variations in fuel heating value and fuel or air densities<br />
cannot be reconciled.<br />
Fuel and Air MeteringIf the control system is further refined to include actual metering of fuel and<br />
air, additional error sources can be eliminated, further reducing the excess air levels. Several types of<br />
flow metering devices are available; how-<br />
< previous page page_171 next page >
previous page page_172 next page ><br />
ever, there are some limitations as to the types of fuels that can be accurately metered.<br />
Page 172<br />
Several combinations of components can be used in a metering control system. Feedback loops are<br />
employed to allow the fuel and air to seif correct flows to meet system demands. Additional air is<br />
normally required to allow for the differences in speed of response between the fuel and air flow loops.<br />
Cross-Limited MeteringAn additional refinement to the metered system is the cross-limited metering<br />
system that limits the change in fuel flow through control logic to available air flow at all times. <strong>The</strong><br />
quantity of air flow is also tied to the existing fuel flow and must be equal to or greater than fuel flow.<br />
Required excess air levels are thereby slightly reduced.<br />
A common form of the cross-limited metering system is a pneumatic or electric parallel system using<br />
the steam pressure as the master controller. A manual override of the fuel/air ratio is provided to trim<br />
excess air levels.<br />
Cross-Limited Metering with O2 Correction - <strong>The</strong> effects on excess air of variations in fuel heating<br />
value and combustion air conditions can be eliminated using a continuous monitored flue gas O2 level<br />
to trim the fuel/air ratio. <strong>The</strong> unit can thereby be operated at a set O2 level resulting in minimum fuel<br />
consumption.<br />
Combustion Control Equipment<br />
Control systems hardware and instrumentation are either pneumatic or electronic. Considerations<br />
that must be included in the selection of equipment are<br />
• capital costspneumatic systems cost 20% less than electric systems, especially final control elements<br />
• installation costselectric generally less expensive<br />
• instrument air costs on pneumatic systems<br />
• compatibility<br />
• maintenance factors<br />
• electronic controls are proven to be the most accurate.<br />
< previous page page_172 next page >
previous page page_173 next page ><br />
Page 173<br />
Electronic components may be either analog or direct digital systems. Analog components are springs,<br />
diaphrams, cams, etc. that simulate mathematical functions used to determine the response to an<br />
incoming signal. Direct digital systems employ a calculator or microprocessor to determine the desired<br />
response and position actuators. <strong>The</strong> same considerations mentioned above with respect to costs,<br />
compatibility and maintenance would again apply to the selection of a system.<br />
Oxygen Analyzers<br />
Oxygen analyzers are the accepted means of determining excess air levels. Recent developments have<br />
improved the old style sampling systems with analyzers using zirconium oxide sensors so that no<br />
pretreatment of the gas sample is required. Sensors can be located directly in the flue gas stream or on<br />
the flue gas ducts connected directly to sensing probes. <strong>The</strong>se systems have increased sensitivity<br />
especially in the lower excess O2 levels and significantly reduced sample cleanliness and maintenance<br />
requirements.<br />
Instrumentation<br />
Table 16-2 presents the minimum instrumentation requirements to allow safe control of the boiler and<br />
provide a sufficient record of operation. Many additions to this list are possible and are subject to<br />
costs, legal requirements and personal preference of the plant operators.<br />
Steam pressure, temperature, and flow, along with air and fuel flow, provide information on the<br />
operation of the control system in maintaining desired boiler operation at various loads. Necessary<br />
information of the boiler water supply is provided by drum level and feedwater flow indicators. Draft<br />
gauges can indicate plugging of the boiler, economizer, or air heater passages with fly ash. Gas and air<br />
temperature measurements also indicate the need for sootblower operation. Annunciators are<br />
required to warn the operator of hazardous operating conditions.<br />
< previous page page_173 next page >
previous page page_174 next page ><br />
Air Pollution Emissions<br />
Use of more sophisticated combustion controls to reduce excess air requirements will result in a<br />
reduction in NOx emission levels. Most NOx produced reacts ultimately with moisture in the<br />
atmosphere and forms nitric acid, and hence will contribute to the formation of acid rain.<br />
TABLE 16-2. Instrument recommendations.<br />
Indicator Recorder Integrator<br />
<strong>Boiler</strong> outlet pressure R R<br />
Superheater outlet steam temp R<br />
Steam flow R X<br />
Total fuel flow R<br />
Total air flow R<br />
Individual fuel flow X X<br />
O2 analyzer X<br />
Combustibles analyzer X<br />
Drum level R R<br />
Feedwater flow X X<br />
Draft gauges R<br />
Air and gas temp R X<br />
Feedwater temp R<br />
Annunciator R<br />
R Required<br />
X Optional<br />
Oxygen trim control data that is convenient to record will include:<br />
• percent efficiency<br />
• percent oxygen<br />
• percent fire-rate<br />
• flue gas temperature<br />
• percent carbon dioxide<br />
• percent oxygen error<br />
Page 174<br />
< previous page page_174 next page >
previous page page_175 next page ><br />
17<br />
<strong>Boiler</strong> O2 Trim Controls<br />
M.J. Slevin, President<br />
Energy Technology and Control Corp.<br />
For some years the market has seen a proliferation of Oxygen Trim Controls, and many have been<br />
fitted to a wide assortment of packaged boilers. Some have produced satisfactory performance and<br />
savings, but a significant number have failed to achieve anything like the salesmen's promises. In a<br />
number of cases they have totally failed to control the boiler, and have even been removed.<br />
Page 175<br />
Many users are not sure how effective their trim controls really are. In most cases this is due to lack of<br />
information as to what the control is doing. A common criticism is the lack of adequate and precise<br />
data output from the control systems. Considerable harm has been done to the overall reputation of<br />
trim controls due in part to inadequate design and due to misrepresentation and poor application<br />
where conventional trim controls have been fitted to boilers on which they had no chance of operating<br />
correctly.<br />
To understand why such failures have occurred, we must first understand the process that is being<br />
controlled and then determine the unique problems that manifest themselves when control is applied<br />
to the combustion process. <strong>The</strong> basis of all boilers is to transfer heat from the burning of fuel and air<br />
(combustion) into water or other liquids to produce hot water, steam, or other hot liquids.<br />
< previous page page_175 next page >
previous page page_176 next page ><br />
Page 176<br />
<strong>The</strong> combustion process itself is one that is usually inefficient because of poor control of the mixture of<br />
fuel and air, and in general is adjusted for excessive air-rich combustion because of safety and the<br />
basic instability of the fuel/air ratio control mechanism. Moderate and random variations in the<br />
combustion process also occur because changes in the basic ingredients and ambient conditions are<br />
taking place in the following area: Air Temperature, Humidity, Barometric Pressure, Wind Direction,<br />
Wind Velocity, Fuel Pressure, Fuel Temperature, Fuel Calorific Value, and BTU Value.<br />
To illustrate this, for example, natural gas will fluctuate by plus or minus 7% in terms of its calorific<br />
value, or a change of just 10ºF in the temperature of a fuel oil will significantly change the BTU output<br />
of the burner. <strong>The</strong>se numerous random variables make control of the boiler to fine limits very<br />
difficult. Oxygen trim controls applied to boilers have additional problems due to fundamental<br />
characteristics of the control and boiler configuration (see Figure 17-1).<br />
Figure 17-1 shows an example of a typical four-pass, fire-tube boiler with a conventional oxygen trim<br />
control. <strong>The</strong> point of control is at the intake to the burner where the trim control will make changes to<br />
the air flow with respect to fuel flow (i.e., adjust the fuel/air ratio) in an attempt to achieve a<br />
predetermined level of excess oxygen present in the exhaust flue gas. <strong>The</strong> function is further<br />
complicated because different amounts of excess oxygen are required at different fire-rates if close to<br />
optimum performance is to be achieved.<br />
Low fire control is particularly difficult for most conventional trim controls due to the non-linear<br />
characteristics of the air damper profile. To combat this, most trim controls have a low load cut-off<br />
which in practice results in no trim correction operation below about 25% boiler load, which for many<br />
boilers is the most critical working area, particularly during the summer months. This is also the most<br />
inefficient working range where precise trim control would be most beneficial.<br />
<strong>The</strong> detection and measurement of excess oxygen for economic and reliability reasons is made in the<br />
stack using various types of sensors, by far the most accurate and reliable device being the<br />
< previous page page_176 next page >
previous page page_177 next page ><br />
Figure 17-1<br />
Where the total system lag-time occurs.<br />
Page 177<br />
< previous page page_177 next page >
previous page page_178 next page ><br />
zirconium oxide cell located inside the stack within the flue gas stream.<br />
Page 178<br />
As combustion occurs at the burner the hot combusted gases travel through the passes of the boiler,<br />
transferring heat into the liquid contained within the body of the boiler, and finally the progressively<br />
cooling gases exit through the breach and pass up into the stack where they pass the oxygen sensor.<br />
<strong>The</strong> time taken for this transit of gas will vary considerably due to the fire-rate, and also due to the<br />
size, type, and design of the boiler. Typically it can be 10 to 60 seconds, and is sometimes referred to as<br />
the boiler lag-time.<br />
Gases passing the oxygen sensor in the stack will permit the sensor to detect the change in excess<br />
oxygen, but a second time delay will occur as the oxygen sensor requires time to respond to the change<br />
in oxygen level which can be 5 to 30 seconds dependent on type, design, and capacity of the sensor.<br />
Now we are faced with two additive delays that are in the control loop. <strong>The</strong>se two delays combined<br />
could cause times from 15 seconds to well over a minute following a change at the burner due to firerate<br />
movement, or any other factor, before the oxygen sensor will provide an output change to the<br />
control and then a trim correction function to the fuel/air ratio to correct the oxygen to the required<br />
setpoint value.<br />
In extreme cases of frequent fire-rate movement, the trim control never succeeds in catching up with<br />
the boiler movement and can in some situations literally make boiler performance worse than it would<br />
be without the trim control to control the operation.<br />
Now that we have defined the lag-time problem and how it is created, what is the effect in practice?<br />
Modulating boilers are designed to raise and lower the fire-rate automatically in order to maintain a<br />
fairly constant temperature of water or pressure of steam and to compensate for changes in the output<br />
load.<br />
<strong>The</strong>re is a misconception with many boiler users that because their load is almost constant, they<br />
believe the fire-rate remains constant when in fact it moves up and down many times an hour, even on<br />
a constant load, although the amount by which it changes may be as little as 5 or 10%. Statistics<br />
obtained from on-site sur-<br />
< previous page page_178 next page >
previous page page_179 next page ><br />
Page 179<br />
veys of hundreds of modulating packaged boilers show the average number of fire-rate control<br />
movements to be around 30 per hour, but in unstable load applications we have observed the highest<br />
to be 190 movements per hour.<br />
Each time the fire-rate moves, the conventional oxygen trim system will require a lag-time before it<br />
can make a trim correction, and in most cases it requires a second lag-time before it is likely to trim<br />
the oxygen exactly due to undershoot or overshoot on the first trim action. What this means in practice<br />
is that for an average boiler with a total trim system lag-time of 30 seconds and 30 fire-rate movements<br />
an hour, and 2 trims for each movement, that the total time the boiler is not trimmed to setpoint will<br />
be 30 × 30 × 2 = 1800 seconds or 30 minutes in each hour; or to put it another way, the conventional<br />
trim control will hold the boiler at the precise oxygen level required for maybe 50% of its operating<br />
time. Figure 17-2 shows graphically the profound effect of the lag-time problem against the frequency<br />
of the fire-rate movements.<br />
It can clearly be seen from Figure 17-2 that it is of vital importance to take into account the number of<br />
fire-rate movements before calculating the expected payback from an oxygen trim control, and having<br />
established the total lag-time for a specific boiler, only then can you approach reality in terms of<br />
estimated fuel savings. As an example, if you have a boiler with 30 movements per hour, a lag-time of<br />
20 seconds, and a proposed oxygen trim system with a sensor in-situ response time of 10 seconds, then<br />
your total lag-time is going to be 30 seconds, times an average of 2 trim lag-times required, times 30<br />
fire-rate movements, then the total operating time when the boiler will not be at optimum oxygen<br />
setpoint will be, for example:<br />
Now when you meet the salesman who is trying to sell an oxygen trim system, you can more<br />
realistically determine savings and payback. If he says that his control will save $34,000 in a year, you<br />
can see from the figures above that in reality it will only be about 50% or $17,000.<br />
< previous page page_179 next page >
previous page page_180 next page ><br />
Figure 17-2<br />
Optimum performance vs. fire-rate movements.<br />
Page 180<br />
< previous page page_180 next page >
previous page page_181 next page ><br />
Page 181<br />
<strong>The</strong> reason the discrepancy occurs is because most savings estimates are based on a constant fire-rate<br />
or constant load, which never occurs in real boiler operations, and fire-rate movements are not taken<br />
into account by most suppliers for obvious reasons. It is worthwhile discussing this issue with possible<br />
vendors, if only to determine their depth of understanding.<br />
<strong>The</strong> proven solution: If you have established that the conventional trim control will give you optimum<br />
setpoint performance for less than 90% of your operating time, then your savings can be increased<br />
and your boiler controlled to optimum for 95 to 99% of the time by specifying a true Adaptive Trim<br />
Control that automatically self-learns and feeds forward actual damper profile position for all firerates,<br />
without any manual or operator intervention whatsoever.<br />
Learning to Adapt<br />
<strong>The</strong> main causes of error in combustion control are: hysteresis (dead-band) and sloppiness through<br />
the mechanical profiler and linkages; worn, damaged or dirty burner; sooting up of the boiler tubes;<br />
change in viscosity, temperature, pressure, or calorific value of incoming fuel; warm-up effects in the<br />
burner and boiler.<br />
<strong>The</strong> addition of a trim adjustment to air-damper position (or to fuel valve) is normally the preferred<br />
means to effect combustion control in oil- or gas-fired boilers where a mechanical air/fuel ratio<br />
profiler exists: the trim-only action allows easy reversion to manual control, and because it has limited<br />
adjustment, allows the safety and security of the mechanical profiler to be largely retained.<br />
<strong>The</strong> mechanical profiler is set up during commissioning to give a margin of excess air in order to<br />
accommodate the expected changes in burn conditions, and the limitations of the mechanical profiler.<br />
<strong>The</strong> normal action of the trim control is thus to slightly close the air damper in order to achieve the<br />
optimal oxygen-control level: trim position will be required to vary as a function of changing fire rate.<br />
A conventional oxygen-control loop (Figure 17-3) controls trim position by feedback from the error<br />
between oxygen desired-<br />
< previous page page_181 next page >
previous page page_182 next page ><br />
Figure 17-3<br />
Page 182<br />
< previous page page_182 next page >
previous page page_183 next page ><br />
value (setpoint) and oxygen measured-value, the oxygen setpoint being profiled to be fire-rate<br />
dependent. Because changes in trim position must be provided as fire rate alters, therefore the<br />
erroractuated oxygen-control loop must be transiently in error to provide the necessary trim<br />
movement.<br />
Page 183<br />
Peak magnitude of this transient can be severe; the duration with the feedback loop optimally tuned<br />
will be in the order of twice the net response-delay of the oxygen-probe plus burnerto-probe lag-time.<br />
Typically the transient may be several percent O2 in magnitude, with duration between 15 seconds for<br />
a fast-responding probe or more than a minute with a slow-responding probe.<br />
With the adaptive control system it is possible to achieve immediate oxygen-trim response against<br />
varying fire rate, with no oxygen-error transient, so that probe response time becomes of secondary<br />
importance. <strong>The</strong> adaptive system (shown in simplified form in Figure 17-4) utilizes the same basic<br />
feedback-loop as does the conventional control of Figure 17-1, with loop-gain compensation from fire<br />
rate, and is thus as tightly tuned as possible under all firing conditions.<br />
<strong>The</strong> controller output corresponding to each narrow range of fire rate is retained in a number of<br />
(digital) stores, in which a ''trim profile" is thus built up as adaption proceeds with operation over the<br />
full range of fire rate. Once adapted, the trim setpoint requirement for each given fire rate is selected<br />
immediately, so that no oxygen-error transient is required or then exists.<br />
<strong>The</strong> effectiveness of the adaptive system as described so far is limited only by hysteresis (dead-band)<br />
present in the mechanical profiler and linkages. A transient error can occur, of magnitude dependent<br />
upon the extent of the hysteritic dead-band and with duration the same as for the conventional loop of<br />
Figure 17-3. <strong>The</strong> adaptive loop does not result in a worsening of the basic error-loop response time.<br />
<strong>The</strong> hysteresis effect is readily eliminated in a simple restructuring of the adaptive-trim technique,<br />
involving measurement of both fuel and damper position to create in effect an adaptive air/fuel profile<br />
rather than the adaptive trim/air (or trim/fuel) profile.<br />
< previous page page_183 next page >
previous page page_184 next page ><br />
Figure 17-4<br />
Page 184<br />
< previous page page_184 next page >
previous page page_185 next page ><br />
Page 185<br />
Remaining sources of error are mostly slow-varying, and can be followed by self-learning change in<br />
the adaptive-profile. To achieve control only requires about 2K-byte extra storage in the processor<br />
PROM, and this adds very little to the cost. <strong>The</strong> fast response time allows operation closer to the ideal<br />
oxygen profile, cutting fuel consumption significantly more than can be achieved by conventional trim<br />
systems.<br />
A final point of caution: In today's fast changing hi-tech world there are many new terms and buzz<br />
words in use. Due to ignorance and sometimes for other reasons, these new words are used incorrectly<br />
and it is easy for a potential customer to be confused or misled into thinking he is getting something he<br />
really is not. In the field of oxygen trim control, statements like "feed-forward," "learning," and<br />
"adaptive'' are being misused by some, and can cause misinterpretation by others.<br />
Here is a dictionary definition of adaptive: adaptive/a-'dap-tiv 1: the act or process of adapting; 2:<br />
having intelligence to sense conditions of environmental or other intensities or qualities or<br />
stimulations; 3: to determine actions or modifications of an organism or parts that make it more fit for<br />
existence under current conditions; 4: learning to adapt; 5: something that is adapted becomes more<br />
fitted to its function or current situation: 6: adapted to optimum situation; 7: to be in line with current<br />
requirements.<br />
According to our research, only three manufacturers in the world currently offer true adaptive trim<br />
control. Remember, all trim controls were not created equal and you will in general only get what you<br />
pay for. <strong>The</strong> bottom line is not "how much" but what will the savings and payback really be. If in<br />
doubt you should consult an expert!<br />
You should not delay your trim control project because of fears or uncertainties, for two reasons:<br />
1) Every day you delay is wasting more of our precious energy.<br />
2) <strong>The</strong> new technologies are now well proven; true adaptive oxygen trim is available now, and has been<br />
in use by some for more than 3 years with outstanding results.<br />
< previous page page_185 next page >
previous page page_186 next page ><br />
Page 186<br />
Conventional O2 trim controls have been lacking in ability to provide sufficient meaningful data. With<br />
the breakthrough in micro-technology, the more advanced true adaptive O2 trim controls are able to<br />
provide a wide range of meaningful data that is displayed and can also be fed to recorders, dataloggers,<br />
energy management systems.<br />
To be able to determine the effectiveness of performance most or all of the following data should be<br />
available from the control system:<br />
Oxygen Setpoint (fire-rate dependant)<br />
Oxygen<br />
Oxygen Error<br />
Excess Air<br />
Latent Heat Loss<br />
Radiated Heat Loss<br />
Sensible Heat Loss<br />
Stack Loss<br />
Efficiency (thermalincluding all losses)<br />
Fire Rate<br />
Rate of change of Cell Temperature<br />
Cell Setpoint Temperature<br />
Cell Temperature<br />
Flue Temperature<br />
Air Temperature<br />
Loop open during Cold Start sequence (= 1)<br />
Lithium Battery Voltage (data storage back-up)<br />
Drive to Neutral Logic<br />
Normal Fire Logic<br />
Gas Fuel Logic<br />
Auxiliary Fuel Logic<br />
Trim Velocity Drive signal<br />
Trim Position (Angular Displacement)<br />
Damper Position Setpoint<br />
Damper Position Measured Value<br />
Damper Position Error<br />
Fuel Valve Position Measured Value<br />
Dry Carbon Dioxide<br />
Adaptive Integrators 1 to 8<br />
Adaptive Integrators 9 to 16<br />
Burner Log-Run Time (totalized burner hours)<br />
Burner Log-Start Date<br />
(1 = on, 0 = off)<br />
(1 = on, 0 = off)<br />
(1 = on, 0 = off)<br />
(1 = on, 0 = off)<br />
< previous page page_186 next page >
previous page page_187 next page ><br />
18<br />
Steam Distribution System Efficiencies<br />
Harry Taplin, P.E., President<br />
Crystal Energy Corporation<br />
Page 187<br />
Many boiler systems use a steam distribution system to move energy through piping. No pumps are<br />
needed because when the latent energy in the steam is expended it condenses to approximately 1/700 of<br />
its original volume causing a significant pressure drop. Replacement steam flows to fill the volume of<br />
the steam which has condensed, often reaching velocities of 8,000 to 12,000 feet per minute on the way.<br />
<strong>The</strong> "pure" water from the condensed steam still contains valuable energy, and for efficient operation<br />
should be recovered and transported back to the boiler plant where it is reheated, turned back into<br />
steam, and sent out into the system once again.<br />
<strong>Boiler</strong>s and their distribution systems have a closely interrelated efficiency. <strong>The</strong> losses involved in<br />
distribution systems have a significant impact on boiler operations and efficiency. For example, if the<br />
hot condensate from the recovery system does not return to the boiler plant it must be replaced with<br />
cold makeup water which must also receive chemical treatment. Every Btu wasted in the distribution<br />
system must be replaced by the boiler which wastes additional energy producing steam. This cycle<br />
feeds on itself.<br />
When energy losses in the steam distribution system are corrected, boiler plant losses are reduced too.<br />
<strong>The</strong> steam distribution system moves the steam from the boiler to perform work at some distant<br />
location. <strong>The</strong>y do not usually exist separately and they work together to establish a combined<br />
efficiency.<br />
< previous page page_187 next page >
previous page page_188 next page ><br />
Page 188<br />
<strong>The</strong> distribution system discussed here is a typical onean 8,000-foot system with 2,000 feet of inactive<br />
piping. <strong>The</strong> system pressure is 250 psi. (See Figure 18-1.)<br />
<strong>The</strong> losses that will be investigated are:<br />
1. Insulation losses<br />
2. Condensate system losses<br />
3. Trap flash losses<br />
4. Steam trap leakage<br />
5. External steam leaks<br />
6. Intemal steam leaks<br />
7. Inactive steam piping<br />
<strong>The</strong> steam load on the system in this example is 17,900 pounds of steam per hour. (<strong>The</strong> system<br />
described is an actual installation.) Total energy being delivered to the distribution system is 17.9<br />
million Btu's per hour. <strong>The</strong> cost of steam is $8.38 per million Btu's.<br />
Each pound of steam lost from the distribution system has an enthalpy of 1140 Btu/lb. <strong>The</strong> makeup<br />
water for this system is 42ºF, containing 10 Btu's per pound. <strong>The</strong> energy value for the steam is actually<br />
1150 Btu/lb. When we subtract the heat value of our "heatsink," the 42ºF makeup water, the value is<br />
1140 Btu/lb.<br />
Insulation Losses<br />
Any section of hot pipe, valve bodies, unions, flanges, and mechanical steam traps such as float and<br />
thermostatic, inverted bucket and the bodies of disc traps should be insulated. Insulation will pay for<br />
itself quickly as well as prevent the overheating of working spaces and elimination of hot spots which<br />
can cause bums. Steam users are fully aware of the need to insulate hot surfaces but it takes constant<br />
vigilance to keep steam systems in good condition.<br />
Our typical system has 8,000 feet of 6-inch steam piping. How much energy is being lost through the<br />
steam piping and condensate return piping?<br />
1. <strong>The</strong> insulation heat loss averages 100 Btu per square foot per hour.<br />
2. Pipe size 6 inches, 1.6 square foot per foot of length.<br />
< previous page page_188 next page >
previous page page_189 next page ><br />
Figure 18-1<br />
Page 189<br />
< previous page page_189 next page >
previous page page_190 next page ><br />
3. Condensate piping 1-3/4 inch average, 0.5 square foot per foot length.<br />
Steam piping loss:<br />
100 Btu/sq ft × 8,000 ft × 1.6 sq ft/ft = 1,280,000 Btu/hr<br />
Condensate piping loss:<br />
100 Btu/sq ft × 8,000 ft × 0.5 sq ft/ft = 400,000 Btu/hr<br />
Total Loss: 1,680,000 Btu/hror 6.7%<br />
Condensate System Losses<br />
Page 190<br />
Recovering hot condensate for reuse as boiler feed water is an important way to improve the efficiency<br />
of the system. <strong>The</strong> energy used to heat cold makeup water is a major part of the heat delivered for use<br />
by the steam system. For example heating a pound of cold makeup water requires an additional 15%<br />
to 18% energy.<br />
Measuring the weight of condensate being recovered from various points in the steam system is a<br />
direct index of the energy being used in a particular section of piping or equipment.<br />
For example, weighing the weight of water coming from a heat exchanger indicates its heat transfer<br />
rate, considering that each pound of water came from 1,000 Btu's of steam.<br />
<strong>The</strong>re are two problems here to explore. First, 60% of the steam is not returning to the boiler plant as<br />
condensate and must be replaced with 42°F makeup water. <strong>The</strong> second problem is the returning water<br />
is 160°F rather than a theoretical 212°F. How much is this costing in terms of energy loss?<br />
(Note: A return temperature of 212°F is used for illustration. Actually the condensate normally<br />
returns at a somewhat lower temperature.)<br />
1. <strong>The</strong> condensate return temperature is 160°F with a lost of 52 Btu/lb. How much will this loss be with<br />
a 40% return?<br />
17,900 lb/hr × 52 Btu/lb × .4 - 372,320 Btu/hr<br />
2. <strong>The</strong> makeup water temperature is 42°F with a loss of 170 Btu/lb. How much will this loss be with<br />
60% makeup water being used?<br />
< previous page page_190 next page >
previous page page_191 next page ><br />
17,900 lb/hr × 170 Btu/lb × .6 = 1,825,800 Btu/hr<br />
Condensate recovery system energy loss:<br />
Total Loss 2,198,120 Btu/hror 8.8%<br />
Page 191<br />
An alternate way to measure insulation losses is to weigh the condensate draining from the section of<br />
piping under study. If this piping is typical of the entire system, then an overall estimate of system<br />
performance is possible. <strong>The</strong> effectiveness of insulation under different conditions can be observed by<br />
noting the change in condensate formed when the piping is exposed to variable conditions such as<br />
changing temperatures, humidity, rain and wind conditions.<br />
Trap Flash Losses<br />
When the hot condensate passes through a trap from the high pressure to the low pressure side, the<br />
water flashes off a percentage of steam because at the lower pressure the water can hold less energy.<br />
This energy difference is converted to flash steam. This steam which forms on the outlet side of the<br />
trap, like steam from the boiler, contains latent heat that can be put back to work in the system. Uses<br />
for this flash steam are heating coils or makeup water or process water heating.<br />
In our example of a 250 psi steam system, the steam and water temperature entering each steam trap<br />
is 401°F. As the condensate passes through the trap to atmospheric pressure it must give up some heat.<br />
This excess heat forms steam because water at 250 psi and 401°F contains more energy than water at<br />
atmospheric pressure and 212°F. In this case the flash rate is 21%.<br />
In an atmospheric return system, when the flash steam vents to atmosphere and is lost, how much<br />
energy is involved?<br />
1. <strong>The</strong> steam flashed at atmospheric pressure contains 970 Btu/lb.<br />
2. <strong>The</strong> condensate at 250 psi contains 376 Btu/lb. At atmospheric pressure this value is 170 Btu/lb with<br />
a makeup water temperature of 42ºF.<br />
< previous page page_191 next page >
previous page page_192 next page ><br />
Flash steam = (376 Btu/lb 170 Btu/lb)/970 Btu/lb = 21%<br />
Flash Loss = 17,900 lb/hr × 1140 Btu/lb × 20%<br />
Loss = 4.78 Million Btu/hror 19.1%<br />
Page 192<br />
This estimate does not include steam losses caused by steam leaks in piping or steam blowing through<br />
traps which may be venting to atmosphere.<br />
Also, actual steam trap flash steam losses may be less where pressure reducing valves and other system<br />
conditions lower the pressure at the trap. This example illustrates the potential energy loss caused by<br />
flashing due to system pressure.<br />
Enclosed, pressurized condensate recovery systems are also effective in reducing trap flash losses by<br />
reducing the pressure across the traps and by collecting the flash steam at some central point to<br />
recover its energy.<br />
Trap Leakage<br />
Assuming that this system has 200 steam traps, it would not be unusual to find that 40% had<br />
problems. For the sake of illustration, let's assume a 20% trap failure rate with 10% of the traps<br />
blowing 50 pounds of steam per hour. (Based on published information, this rate is conservative.)<br />
Trap leakage can be caused by:<br />
1. <strong>The</strong> slow closing of traps.<br />
2. Partial closing.<br />
3. A total failure of the trap to close at all.<br />
<strong>The</strong>se conditions blow steam into the condensate piping system which is open to the atmosphere.<br />
Loss = 200 traps × 10% failed × 50 lb/hr × 970 Btu/lb<br />
Loss = 970,000 Btu/hror 3.9%<br />
< previous page page_192 next page >
previous page page_193 next page ><br />
External Steam Leaks<br />
Page 193<br />
Almost every system has some steam leaks. In this case there are four 4-foot plumes which are losing<br />
about 50 pounds of steam per hour each for a total of 200 pounds per hour and an 8-foot plume losing<br />
about 500 pounds per hour. How much is this costing?<br />
Loss = 700 lb/hr × 970 Btu/hr = 679,000 Btu/hr<br />
Loss = 679,000 Btu/hror 2.7%<br />
Only the latent heat of steam at atmospheric pressure of 970 Btu/lb is used for the heat loss value as<br />
the earlier calculation of condensate losses takes into account the sensible heat loss of the makeup<br />
water to replace the steam.<br />
Internal Steam Leaks<br />
Valves in bypasses around steam traps are a prime source of internal system leakage. Leaks inside the<br />
steam service system are invisible and hidden in the flash steam making it very difficult to detect them.<br />
This steam leakage appears to be part of the system steam load even though it is venting to atmosphere<br />
through the open system.<br />
In this case there are several bypass leaks amounting to 500 pounds of steam per hour.<br />
Loss = 500 lb/hr × 970 Btu/lb<br />
Loss = 485,000 Btu/hror 1.9%<br />
Inactive Steam Piping<br />
Inactive steam piping, although not doing any work, is experiencing the same losses as the rest of the<br />
system. In this example 2,000 ft of an 8,000-ft system are inactive. Twenty-five percent of the system<br />
losses are in this section which is out of service or costing about $130,000 a year.<br />
< previous page page_193 next page >
previous page page_194 next page ><br />
Loss Summary<br />
<strong>Boiler</strong> Losses Percent Loss Annual Btu Loss (Millions) Annual Dollar Loss<br />
Stack Losses<br />
Blowdown Losses<br />
Surface Losses<br />
22.8% 49,932 $273,600<br />
4.6% 10,074 $55,200<br />
1.0% 2,190 $12,000<br />
Total 28.4% 62,196 $340,800<br />
Distribution System Losses<br />
Insulation Losses<br />
Condensate System Loss<br />
Trap Flash Loss<br />
Trap Leakage Loss<br />
External Steam Leaks<br />
Internal Steam Leaks<br />
6.7% 14,717 $80,640<br />
8.8% 19,272 $105,600<br />
19.1% 41,873 $229,440<br />
3.9% 8,497 $46,560<br />
2.7% 5,948 $32,592<br />
1.9% 4,249 $23,280<br />
Total 43.2% 94,555 $518,112<br />
Combined Losses 71.6% 156,751 $858,912<br />
System Efficiency 28.4%<br />
1. <strong>The</strong> combined as-found efficiency for the boiler and distribution system is 28.4%.<br />
2. <strong>The</strong> wasted energy is worth $858,912 a year.<br />
3. <strong>The</strong> cost of fuel is $6.00 per million Btu's and the cost of steam at the point of use is $21.12.<br />
Page 194<br />
4. With a boiler input of 25 million Btu's per hour, only 7.1 million Btu's per hour is reaching a point of use for productive work.<br />
5. <strong>The</strong> inactive piping section is wasting about $130,000 a year of 25% of the total system loss.<br />
As you can see in the Loss Summary above, when you add up steam distribution system losses they are often considerably larger<br />
than boiler losses.<br />
Correcting steam system losses in a plant is just as important as improving boiler efficiencies. While a full discussion of how this<br />
should be done must be left for another book, you should know about distribution system losses that may have developed over<br />
time, so you can plan to reduce them.<br />
< previous page page_194 next page >
previous page page_195 next page ><br />
19<br />
Should You Purchase a New <strong>Boiler</strong>?<br />
Page 195<br />
As previously mentioned, the cost of adding auxiliary equipment to improve unit performance on an<br />
existing boiler may justify the purchase of an entirely new system. This is especially true of an older<br />
unit with a limited expected useful lifetime or a unit with severe space or operating constraints that<br />
require additional expensive modifications. Other factors may prohibit the use of various equipment<br />
or techniques and limit the boiler's efficiency improvement potential.<br />
Once the purchase of a new system has shown to be cost effective, the selection of the most efficient<br />
unit incorporating the optimum use of the auxiliary equipment discussed in the previous sections<br />
becomes all important. Several manufacturers representing various boiler configurations should be<br />
consulted to select the best system on the basis of initial, operating, and maintenance costs. It is<br />
generally advised to select standard units available commercially as special design specifications will<br />
add significant costs to the purchase of the unit.<br />
When purchasing a new boiler it is very advisable to compare boiler efficiencies of prospective units<br />
since even a few tenths percent efficiency advantage can lead to substantial savings in fuel over the life<br />
of the boiler. It is common for boiler manufacturers to offer a performance guarantee which will<br />
contain at least the guaranteed minimum boiler efficiency at maximum boiler capacity. Predicted<br />
performance at intermediate loads may also be provided, especially for larger boilers.<br />
Ideally, the complete efficiency versus load characteristics of the boiler would be available to enable<br />
efficiency comparisons at the particular range of loads anticipated for the boiler. Un-<br />
< previous page page_195 next page >
previous page page_196 next page ><br />
fortunately, this information is very seldom available and the efficiency characteristics of the boiler<br />
are determined only after installation and start-up.<br />
Page 196<br />
<strong>The</strong> excess air characteristics of the burner (i.e., excess O2 versus load profile) are very important in<br />
determining the efficiency vs. load curve of the boiler. This is especially true for boilers without waste<br />
heat recovery where stack temperatures are higher and the efficiency is consequently more sensitive to<br />
the quantity of excess air used. <strong>The</strong>refore it may be desirable to avoid burner or furnace designs which<br />
require high excess air.<br />
Increased excess air requirements at lower loads is quite common but some combustion control<br />
systems and burner designs are available which permit very low excess air levels over the entire<br />
turndown range of the boiler. Choosing this type of system would be very attractive especially when<br />
the boiler will be operated at lower loads a large fraction of the time.<br />
Other factors not directly connected to boiler costs and efficiency must be considered. Changes in<br />
steam requirements or operating conditions may warrant a completely different type, size or firing<br />
mode than previously employed in the existing system. Space limitations or steam demand flexibility<br />
can make the use of several smaller units more desirable than one large unit.<br />
Consideration should also be given to the ''quick steaming" boilers that can come to operating<br />
temperature and pressure in a few minutes. <strong>The</strong>se units are very compact based on a once-through<br />
design that eliminates the large water jackets of comparable capacity firetube designs.<br />
<strong>The</strong> steady state operating efficiency of these units is comparable to a conventional boiler at rated<br />
loads but they can produce significant fuel savings in applications where the boiler is used for only one<br />
shift a day. A conventional firetube boiler radiates a considerable quantity of heat as the water jacket<br />
cools after shutdown. This heat is wasted and must be replaced when the boiler is refired for the next<br />
day of use. Since the once-through units have a very small water volume, they can produce steam in<br />
minutes and save the extra fuel a conventional boiler would use for startup.<br />
< previous page page_196 next page >
previous page page_197 next page ><br />
Page 197<br />
Using the boiler manufacturer's example of a 10-hour day and a 40-minute startup period at 81%<br />
efficiency for the conventional drum boiler, the once-through steam generator would use 17% less fuel.<br />
Some quick steaming boilers also have smaller casing surface area (compared to conventional boilers<br />
with equivalent capacity) which reduces radiation heat losses and leads to higher boiler efficiencies,<br />
especially at reduced firing rates.<br />
Numerous other options are available to the boiler purchaser. New air pollution constraints and<br />
changing fuel supplies may alter the fuels employed.This will strongly influence the method of firing<br />
and to a certain extent the configuration of the unit. In all cases, a complete engineering and financial<br />
evaluation of possible retrofit applications to the present system and the purchase of a new system is<br />
justified prior to the selection and installation of a new steam generating unit.<br />
< previous page page_197 next page >
previous page page_199 next page ><br />
20<br />
Financial Evaluation Procedures<br />
Performance Deficiency Costs<br />
Procedure<br />
<strong>The</strong> financial benefits obtained with improved boiler efficiency are readily calculated using<br />
Where:<br />
Wf = fuel usage at lower efficiency<br />
Δ∈ = efficiency improvement differential<br />
∈ = achievable efficiency level<br />
C = fuel costs<br />
<strong>The</strong> units selected must be consistent, that is, if Wf is in millions of Btu/years and C is in dollars per<br />
million Btu, the fuel savings will be in dollars per year.<br />
Page 199<br />
Since the efficiency improvement differential and achievable efficiency level will vary with load, this<br />
calculation should be conducted at each major operating load condition. <strong>The</strong> annual fuel dollar<br />
savings will then be the sum of each load condition multiplied by the fraction of operating time spent<br />
at each load.<br />
< previous page page_199 next page >
previous page page_200 next page ><br />
Example<br />
Basis: Wf = 75,000 × 106 Btu/yr<br />
Δ∈ = 1%<br />
∈ = 80%<br />
C = $6/106 Btu<br />
= 5625/year<br />
First and Second Level Measures of Performance<br />
Definitions<br />
First Cost (FC)cost of labor and materials to implement scheme<br />
Page 200<br />
Annual Operating Costs (AOC)all costs (if any) associated with maintaining and operating the scheme<br />
Annual Fuel Savings (AFS) quantity of fuel saved by use of the installed scheme<br />
Projected Fuel Prices (PFP) estimated average fuel price over the lifetime of the investment<br />
Estimated Lifetime (EL) length of time the scheme is expected to be in use<br />
Net Annual Savings (S) annual fuel savings less operating costs<br />
Depreciation Charge (DC) annual depreciation of the investment. For a straight line depreciation,<br />
Discount Rate (DR) best return on investment<br />
Present Worth Factor (PWF) factor applied to determine present worth of future savings.<br />
Present Value (PV) worth of future savings for a given discount rate.<br />
< previous page page_200 next page >
previous page page_201 next page ><br />
First Level Measure of Performance<br />
This is a short analysis used to screen non-profitable energy conservation opportunities and is not<br />
intended to be a complete economic evaluation.<br />
• <strong>The</strong> Payback Period (PP) allows a rough estimate of the period required to recoup the investment.<br />
• PP = FC/S<br />
• A payback period less than half the expected life is considered potentially profitable.<br />
• <strong>The</strong> Return on Investment (ROI) accounts for the depletion of the investment over lifetime by<br />
providing for a renewal through depreciation charge.<br />
•<br />
• If the ROI is less than 20%, a second order level of analysis is required.<br />
Second Level Measure of Performance<br />
Page 201<br />
<strong>The</strong>se analyses incorporate an allowance for the time value of money, generally as a discount factor.<br />
• <strong>The</strong> discount is the best available rate of return for the investment dollars which will vary between<br />
industries but will usually run 1020%.<br />
• An investment for energy improvements must yield a return greater than the discount rate.<br />
• <strong>The</strong> Benefit Cost Analysis provides a direct comparison of the present savings (properly discounted<br />
and summed over the expected lifetime) with the initial costs.<br />
• <strong>The</strong> present savings is determined using the tabulated present worth factors given in Table 20-1<br />
times the net annual savings.<br />
• A benefit/cost ratio greater than unity shows a profitable investment.<br />
< previous page page_201 next page >
previous page page_202 next page ><br />
TABLE 20-1. Present Worth Factors (PWF)<br />
Lifetime (EL) Discount Rate (D)<br />
1<br />
2<br />
3<br />
4<br />
5<br />
6<br />
7<br />
8<br />
9<br />
10<br />
11<br />
12<br />
13<br />
14<br />
15<br />
16<br />
17<br />
18<br />
19<br />
20<br />
21<br />
22<br />
23<br />
24<br />
25<br />
<strong>The</strong> above table is calculated from the following equation:<br />
5% 10% 15% 20% 25%<br />
0.952 0.909 0.870 0.833 0.800<br />
1.859 1.736 1.626 1.528 1.440<br />
2.723 2.487 2.283 2.106 1.952<br />
3.546 3.170 2.855 2.589 2.362<br />
4.329 3.791 3.352 2.991 2.689<br />
5.076 4.355 3.784 3.326 2.951<br />
5.786 4.868 4.160 3.605 3.161<br />
6.463 5.335 4.487 3.837 3.329<br />
7.108 5.759 4.772 4.031 3.463<br />
7.722 6.145 5.019 4.192 3.571<br />
8.306 6.495 5.234 4.327 3.656<br />
8.863 6.814 5.421 4.439 3.725<br />
9.394 7.103 5.583 4.533 3.780<br />
9.899 7.367 5.724 4.611 3.824<br />
10.380 7.606 5.847 4.675 3.859<br />
10.838 7.824 5.954 4.730 3.887<br />
11.274 8.022 6.047 4.775 3.910<br />
11.690 8.201 6.128 4.812 3.928<br />
12.085 8.365 6.198 4.843 3.942<br />
12.462 8.514 6.259 4.870 3.954<br />
12.821 8.649 6.312 4.891 3.963<br />
13.163 8.772 6.359 4.909 3.970<br />
13.489 8.883 6.399 4.925 3.976<br />
13.799 8.985 6.434 4.937 3.981<br />
14.094 9.077 6.464 4.948 3.985<br />
Page 202
where D is discount rate expressed as a fraction and EL is the expected lifetime of the project in years.<br />
< previous page page_202 next page >
previous page page_203 next page ><br />
• This procedure is considered to be superior to all other measures of profitability.<br />
• <strong>The</strong> Time to Recoup Investment is similar to payback period but takes into account the discount rate.<br />
Page 203<br />
• Locate the payback period in the tabulated values of present worth factors (Table 20-1) for the appropriate<br />
discount rate and read the break-even period from the estimated life column.<br />
Example of First and Second Level Measures of Performance<br />
Basis:<br />
• First Cost (FC) = S400,000<br />
• Annual Fuel Savings (AFS) = 27,500 MBtu/hr<br />
• Projected Fuel Price (PFP) = S4.00/MBtu<br />
• Net Annual Savings (S) = (AFS × PFP) - AOC<br />
• Discount Rate (D) = 20%<br />
= 27,500 MBtu/hr × 4.00 S/MBtu - 0<br />
= 110,000 per year<br />
• Expected Lifetime (EL) = 10 years<br />
• Present Worth Factor (PWF) = 4.192 (Table 18-1)<br />
• Payback period (No discounting)<br />
• Return on Investment<br />
< previous page page_203 next page >
previous page page_204 next page ><br />
• Benefit/Cost Analysis<br />
PV = S × PWF = $110,000 × 4.192 = $461,120<br />
Page 204<br />
Time to recoup investment can be quickly approximated by using Table 20-1 and the payback period<br />
(PP) estimated earlier as 3.6 years. In the 20% discount rate column one can find that the present<br />
worth factor closest to 3.6 is 3.605 which indicates that the investment will be entirely recouped in<br />
about 7 years when taking the time value of money into consideration.<br />
Marginal Analysis<br />
Marginal analysis is useful in determining the extent of investment for opportunities whose rates of<br />
return decrease as the level of investment increases, i.e., to determine the optimum level of application<br />
(for example, the application of insulation).<br />
Definition<br />
• Total Costs (TC)costs over lifetime<br />
• Total Savings (TS)savings over lifetime<br />
• Marginal Savings (MS)present value savings generated by last increment of the project<br />
• Marginal Cost (MC)present value cost of the last increment of the project<br />
Example (Referring to Figure 20-1)<br />
• All investments up to Q1 are profitable since (TS>TC).<br />
• Most profitable level is at Q0, where the distance between TS and TC is maximized. As illustrated,<br />
this corresponds to MS = MC.<br />
• This can also be used to indicate a reducing level of investment for a proposed investment that would<br />
first appear unprofitable.<br />
< previous page page_204 next page >
previous page page_205 next page ><br />
Figure 20-1<br />
Determination of optimal investment size based on<br />
the marginal savingsmarginal cost relationship.<br />
Page 205<br />
< previous page page_205 next page >
previous page page_207 next page ><br />
21<br />
A Comprehensive "<strong>Boiler</strong> Tune-Up" (BTU) Program<br />
Steven A. Parker, P.E., CEM<br />
Oklahoma State University<br />
Page 207<br />
A broad-scale "<strong>Boiler</strong> Tune-Up" program (BTU), developed recently at Oklahoma State University,<br />
provides boiler operators with an overall evaluation of their boiler plant operations. <strong>The</strong> program is<br />
directed by Wayne C. Turner, Ph.D., P.E., CEM and Steven A. Parker, P.E., CEM, and makes<br />
detailed analyses of boiler plants for energy engineers and managers who are looking for ways to<br />
increase efficiencies and reduce operating costs.<br />
<strong>The</strong> emphasis is on proven technologies with economic feasibility. Technical audits made to date have<br />
averaged over 18.5% reductions in energy costs with projects yielding a simple payback of under 3<br />
years.<br />
This chapter describes how the BTU program works, and shows what should be looked for in boiler<br />
roomsand what should be done to correct system shortcomings.<br />
Several Energy and Cost Reduction Opportunities (ECROs) to increase boiler efficiency, reduce boiler<br />
load, and improve insulation, are described. Advances in waste heat recovery and other technologies<br />
are also reviewed.<br />
<strong>The</strong> BTU Survey<br />
A BTU survey typically consists of a one-day site visit where the survey team interviews the facility<br />
manager and necessary staff about the boiler plant operation. <strong>The</strong> team also compiles and analyzes<br />
related utility bills.<br />
< previous page page_207 next page >
previous page page_208 next page ><br />
Next, the team performs field measurements and physical inspection of the boiler and auxiliary<br />
equipment. Soon after, a report is prepared and sent to the client outlining the survey findings<br />
including a list of economically feasible recommendations. <strong>The</strong>se recommendations are practical<br />
applications of current energy management technology as they relate specifically to each client.<br />
Each recommended ECRO includes a description and explanation of what situation was found and<br />
what the staff recommends should be changed. All data collected pertinent to evaluating the<br />
opportunity are identified, including any assumptions. This is followed by all the engineering<br />
calculations necessary to estimate the potential energy and dollar savings.<br />
Page 208<br />
In order to be complete, an implementation cost is estimated for each recommendation. <strong>The</strong>se<br />
estimates are generated through contacts with equipment manufacturers, sales engineers and standard<br />
estimating guides. With this, a simple payback analysis is made.<br />
However, enough information is provided that a more thorough engineering economic analysis, such<br />
as net present value, could be determined. <strong>The</strong> report attempts to be complete enough that clients may<br />
proceed with implementation themselves or, for more complex recommendations, have enough<br />
information to work with an engineering design firm toward implementation.<br />
<strong>The</strong> potential client list in Oklahoma is large. Previous clients have included schools, universities,<br />
hospitals, government agencies, commercial businesses and industrial manufacturers. Working from<br />
the Oklahoma Department of Labor's list of boilers registered with the Chief <strong>Boiler</strong> Inspector's Office,<br />
potential clients are contacted by mail using a pamphlet and cover letter introducing ourselves and the<br />
BTU Program. Follow-up telephone calls are made to those companies who send in a response card in<br />
order to schedule an appointment for the actual site visit.<br />
<strong>The</strong> survey team typically consists of three degreed engineers with training in energy engineering and<br />
management. Previous staff members have included industrial, mechanical, electrical and chemical<br />
engineers working toward master's or doctoral degrees. <strong>The</strong> program results in educating owners,<br />
managers and operating staff in optimizing boiler operations. <strong>The</strong> program also provides ''hands on"<br />
training and field experience to engineering students at Oklahoma State University.<br />
< previous page page_208 next page >
previous page page_209 next page ><br />
Things to Look for<br />
Page 209<br />
Every boiler room is different. However, in our surveys we have identified a few common items for which to look. During<br />
the surveys, we have developed a checklist of common items to evaluate (see Table 21-1). No checklist is ever complete and<br />
most items do not apply.<br />
We do, however, use it as a starting point in our surveys. After the survey staff has completed the checklist, we get<br />
creativefollowing the boiler, steam and hot water system from end to end looking for additional energy and cost reduction<br />
opportunities (ECRO's). If anything else is found, it goes to expand and update our checklist for use in future surveys.<br />
You can utilize this checklist and re-examine your own systems with a fresh new look.<br />
Increase <strong>Boiler</strong> Efficiency<br />
1.<br />
2.<br />
3.<br />
4.<br />
5.<br />
6.<br />
7.<br />
8.<br />
9.<br />
10.<br />
11.<br />
12.<br />
13.<br />
Reduce Excess Air to <strong>Boiler</strong> (s)<br />
Table 21-1. <strong>Boiler</strong> and Steam Plant ECRO Checklist<br />
Provide Sufficient Air to <strong>Boiler</strong> (s) for Complete Combustion<br />
Install Low Excess Air Burner(s)<br />
Repair or Replace Faulty Burner(s)<br />
Replace Natural Draft Burner(s) with Forced Draft Burner(s)<br />
Install Turbulators in Firetube <strong>Boiler</strong>(s)<br />
Replace Existing <strong>Boiler</strong> (s) with New More <strong>Efficient</strong> <strong>Boiler</strong>(s)<br />
Install Condensing <strong>Boiler</strong>/Water Heater<br />
Install Pulse Combustion <strong>Boiler</strong>/Water Heater<br />
Install Small <strong>Boiler</strong> for Summer Operation<br />
Clean <strong>Boiler</strong>(s) to Eliminate Fouling & Scale<br />
Improve Feedwater Chemical Treatment to Reduce Scaling<br />
Optimize <strong>Boiler</strong> Loading when Using Multiple <strong>Boiler</strong>s<br />
Waste Heat Recovery<br />
14.<br />
15.<br />
16.<br />
17.<br />
18.<br />
19.<br />
20.<br />
21.<br />
Install Economizer to Preheat Feedwater<br />
Install Heat Exchanger to Preheat Feedwater<br />
Install Heat Exchanger to Preheat <strong>Boiler</strong> Makeup Water<br />
Install Heat Exchanger to Recover Blowdown Heat<br />
Preheat Combustion Air with Recuperator<br />
Recover Waste Heat to Supplement (Domestic) Hot Water Demand<br />
Recover Heat from <strong>Boiler</strong> Flue Gas to Supplement Building Heat<br />
Install Heat Recovery Steam Generator on Incinerator or Furnace<br />
(table continued on next page)
previous page page_209 next page >
previous page page_210 next page ><br />
(table continued from previous page)<br />
22.<br />
23.<br />
Direct Contact Condensation Heat Recovery<br />
Indirect Contact Condensation Heat Recovery<br />
Reduce <strong>Boiler</strong> Load<br />
24.<br />
25.<br />
26.<br />
27.<br />
28.<br />
29.<br />
30.<br />
31.<br />
32.<br />
33.<br />
34.<br />
35.<br />
36.<br />
Repair Steam and Condensate Leak(s)<br />
Repair Failed Steam Trap(s)<br />
Reduce <strong>Boiler</strong> Blowdown<br />
Return Condensate to <strong>Boiler</strong>(s)<br />
Shut Off Steam Tracer(s) During Summer<br />
Vary (Domestic or Heating) Hot Water Temperature Based on Demand<br />
Reduce Pressure or Shut Off <strong>Boiler</strong>(s) During Long Periods of No Use<br />
Lower <strong>Boiler</strong> Steam Pressure<br />
Pressurized Condensate Return System<br />
Reduce or Utilize Flash Steam<br />
Replace On/Off Control System with Variable Firing Rate Control System<br />
Install Stack Damper(s) to Reduce Natural Draft Heat Loss<br />
Reduce <strong>Boiler</strong> Load and/or Steam Requirement<br />
Other Opportunities<br />
37.<br />
38.<br />
39.<br />
40.<br />
41.<br />
42.<br />
43.<br />
44.<br />
45.<br />
Install Back Pressure Steam Turbine for Cogeneration<br />
Switch to a "Self-Help" Natural Gas Source<br />
Request Change to a Different Utility Rate Schedule<br />
Switch to a More Economical Fuel Source<br />
Install a Heat Pump to Supplement (Domestic) Hot Water Demand<br />
Replace Electric <strong>Boiler</strong>(s) with Natural Gas Fired <strong>Boiler</strong>(s)<br />
Install a Satellite <strong>Boiler</strong><br />
Install Variable Frequency Drives on Feedwater Pump(s) and Combustion Air Fan(s)<br />
Replace Continuous Gas Pilot(s) with Electronic Ignition Pilot(s)<br />
Combustion Control<br />
Page 210
This is the foundation of boiler energy management as it is the major factor in determining the efficiency of the system. It<br />
is important to periodically check the combustion efficiency of a boiler with a combustion gas analyzer. In the surveys<br />
performed through the BTU<br />
< previous page page_210 next page >
previous page page_211 next page ><br />
Program, several boilers were identified as having over 100% excess air. Figure 21-1 identifies the<br />
potential fuel savings that can be achieved by reducing excess air to 10% (2% excess oxygen). In<br />
addition, a significant number of boilers were identified as being air starvednot enough air for<br />
complete combustion.<br />
Figure 21-1<br />
Natural Gas Savings by Reducing Oxygen to 2%<br />
Page 211<br />
Combustion analysis should be performed more than once a year. We recommend continuous<br />
monitoring and automatic trim control for larger boilers with the economic justification. For smaller<br />
boilers, we recommend weekly checks (monthly at a minimum) with a portable combustion analyzer,<br />
again for those with the economic justification.<br />
Why check so often? <strong>The</strong> density of air varies with temperature. <strong>The</strong>refore the volumetric air/fuel<br />
ratio will change with the seasons. A proper air/fuel ratio in the summer will lead to excess air in the<br />
winter. Conversely, a proper air/fuel ratio in the winter will lead to incomplete combustion in the<br />
summer.<br />
<strong>The</strong>re are also dramatic effects between high-fire and low-fire conditions on package boilers. Air flow<br />
through dampers is not directly proportionate to the damper position. A damper 50% open allows<br />
about<br />
< previous page page_211 next page >
previous page page_212 next page ><br />
Page 212<br />
80% of the air to pass. This means that a boiler set for a correct air-to-fuel ratio while on high-fire will<br />
have excess air on low-fire.<br />
Conversely, a boiler set for a correct air-to-fuel ratio while on low-fire will have incomplete<br />
combustion on high-fire. Similar situations can occur with any variable firing rate system, not just<br />
high-fire, low-fire type boilers. This is the purpose of the eccentric cam on the fuel and air control<br />
linkage. <strong>The</strong> problem can be corrected by properly adjusting the set screws on the cam for optimum<br />
air-to-fuel ratio at all firing rates.<br />
<strong>The</strong> analyzer should check not only excess air (or percent O2) but also carbon monoxide (ppm CO).<br />
Even with a good air/fuel ratio, burners may become fouled causing incomplete combustion. This will<br />
show up as a high carbon monoxide content long before unburned fuel starts going up the stack. Over<br />
5% of the natural gas boilers we surveyed had excess air and unburned fuel exhausting up the stack.<br />
Install Turbulators in Fire Tube <strong>Boiler</strong>s<br />
Fuel savings can be realized by installing turbulators in the tubes of firetube boilers. Turbulators are<br />
small baffles inserted into each individual tube in the upper passes of firetube boilers to induce<br />
turbulence in the hot gas stream, thereby increasing the rate of convective heat transfer to the tube<br />
surface (see Figure 21-2). <strong>The</strong> corresponding efficiency improvement at a given boiler firing rate and<br />
excess air level are reflected in lower exhaust stack gas temperature and increased stream generation.<br />
Studies have shown that as much as a 28% reduction in stack temperature can be achieved with the<br />
installation of turbulators in the boiler tubes. Remembering that a 40ºF decrease in stack temperature<br />
results in about a 1% increase in combustion efficiency, the results can be rewarding. Typical savings<br />
are between 3 and 5%.<br />
Allowances must be made to overcome the increased pressure drop through the system and assure<br />
sufficient air flow for complete combustion. Often this will require a readjustment of burner controls<br />
following the installation of turbulators. <strong>The</strong> need for these adjustments should be determined by a<br />
post-installation efficiency check (oxygen, carbon monoxide, and stack temperature measurements)<br />
which should be performed to verify complete combustion.<br />
< previous page page_212 next page >
previous page page_213 next page ><br />
Figure 21-2<br />
Turbulators in 2-Pass Firetube <strong>Boiler</strong><br />
Clean Heat Transfer Surfaces to Reduce Fouling and Scale<br />
Page 213<br />
A boiler will generally have an exhaust stack temperature 50º to 150ºF above the saturated steam<br />
temperature (prior to an economizer or other heat recovery device) depending on the type of boiler. A<br />
higher stack temperature is generally a sign that indicates fouling or scale on the boiler heat transfer<br />
surfaces. <strong>The</strong> accumulation of fouling or scale acts as a thermal insulator which reduces the overall<br />
boiler efficiency.<br />
Poor firing conditions at the burner can be a major cause of gas side tube deposits. Insufficient burner<br />
excess air or improper burner adjustment and maintenance can lead to excessive fouling on the gas<br />
side of the boiler tube walls.<br />
Stack temperatures should be periodically compared to values obtained following a boiler tube wash<br />
to determine any deviations from "clean" baseline temperatures. Since stack temperatures usually<br />
increase<br />
< previous page page_213 next page >
previous page page_214 next page ><br />
with firing rate and excess air, these comparisons should be performed at similar boiler operating<br />
conditions.<br />
Page 214<br />
<strong>The</strong> loss in boiler efficiency can be closely estimated on the basis that a 1% efficiency loss occurs with<br />
every 40ºF increase in stack temperature.<br />
In addition, poor feedwater quality can cause the formation of scale on the waterside of the heat<br />
transfer surfaces. A buildup of only 1/32 of an inch of "normal" scale composed of Ca and Mg salts<br />
will decrease boiler efficiency by 2%. If the scale is composed of iron and silica, boiler efficiency is<br />
reduced by 7% with the same 1/32 of an inch. Figure 21-3 demonstrates the negative effects of scale.<br />
Figure 21-3<br />
Energy Loss Caused by Scale<br />
For this reason, it is important to keep heat transfer surfaces clean, both gas-side and water-side. Since<br />
most boilers are inspected annually either by the state or by insurance inspectors, we recommend<br />
operators use this downtime to thoroughly clean heat transfer surfaces. This will not only increase<br />
boiler efficiency, but will also prolong the life of the boiler.<br />
< previous page page_214 next page >
previous page page_215 next page ><br />
Insulation<br />
Insulation is an old subject and is well understood. Suffice it to say that the first inch of insulation<br />
generally reduces heat loss by about 90%. Since insulation is an inexpensive item, it generally has a<br />
quick return. Our general policy: "If the surface temperature is over 120ºF, then we must find a<br />
reason not to insulate," otherwise insulate.<br />
Page 215<br />
One point that should be emphasized is this includes fittings. Valves, flanges, PRV's, steam traps and<br />
other fittings are frequently found uninsulated. <strong>The</strong>se fittings, in the past, have been left uninsulated<br />
because they require frequent access or maintenance. With permanently installed insulation, this is a<br />
problem. However, these fittings should be insulated even more so than regular pipe lengths because of<br />
the extended surface area on fittings.<br />
For example a 6-inch gate valve has a surface area of over 6 square feet. Today, removeable insulation<br />
jackets are commercially available for almost any fitting and, if not, anything can be customized.<br />
Although these durable jackets are more expensive than standard insulation, they still yield quick<br />
paybacks.<br />
Steam Leaks<br />
Steam leaks are a major threat to the overall efficiency of a boiler system. Innocent as it may seem, a<br />
small leak can waste big money. <strong>The</strong>re are actually several factors to consider when analyzing a team<br />
leak. One is the amount of steam lost to the atmosphere. As shown in Figure 21-4, this can be<br />
significant on its own and easily justifies the cost of repair. However, there are other consequences<br />
associated with steam leaks. <strong>The</strong> steam not only has a high heat content, it also has mass. This loss<br />
must be compensated for with makeup water.<br />
<strong>The</strong>refore, there are additional water costs incurred. This makeup water also requires treatment, both<br />
mechanical and chemical. Furthermore, more makeup water requires more blowdown and once again<br />
this wastes more water, chemicals and energy.<br />
Steam leaks should not be considered a necessary fact of operating a boiler system. <strong>The</strong>y should be<br />
considered pure wastea sign that<br />
< previous page page_215 next page >
previous page page_216 next page ><br />
something is in need of repairand should be actively sought out and corrected.<br />
Steam Traps<br />
Figure 21-4<br />
Steam Loss Through Leaks<br />
Page 216<br />
Steam traps historically have been seen as a necessary evil, serving to remove condensate and<br />
uncondensable gases while holding back steam. With a steam trap, it is not a matter of "Will it Fail?"<br />
It is a matter of "When will it fail?"<br />
<strong>The</strong>re is little doubt all steam traps will fail; it is only a matter of time. Even in the best maintained<br />
steam systems, the percentage of failed steam traps is in the range of 5 to 10%.<br />
Unfortunately, steam traps are frequently "out of sight and out of mind." Unless you regularly check<br />
steam traps, you have no idea how many have failed. Failed traps on the order of 50% are not<br />
uncommon.<br />
Traps can (and do) malfunction in two ways. <strong>The</strong>y may stick open or closed. Traps that fail closed are<br />
usually found by way of trouble calls. As condensate builds up backing into the coil, the system quickly<br />
identifies itself by not providing the required heat.<br />
< previous page page_216 next page >
previous page page_217 next page ><br />
Page 217<br />
Traps that fail open do not identify themselves. As the steam jettisons through the coil unstopped by<br />
the failed trap, the temperature control valve or steam flow control will simply open more allowing<br />
additional steam to pass through to the condensate system. Unfortunately from the energy managers'<br />
perspective, most traps are designed to fail open rather than closed.<br />
One sign that can be used to identify failed traps is an unusually high amount of flash steam exiting<br />
through vent lines of condensate and feedwater tanks. However, with long runs of condensate return<br />
piping, especially poorly insulated piping, this is not a good indicator. It is recommended that all steam<br />
traps be identified and examined on a routine schedule in an active preventative maintenance program.<br />
Different types of traps can be monitored accurately by different methods. Sound, temperature and<br />
sight cover all the alternatives. Failed steam traps are similar to plain steam leaks and should be<br />
corrected with the same tenacity.<br />
Condensate Management<br />
Some boiler operators believe that once the steam becomes condensate it is no longer valuable and thus<br />
unimportant. This is extremely untrue. Condensate management dramatically affects the operation of<br />
the boiler. Collecting and returning the condensate back to the boiler should be an important priority.<br />
Returning condensate can save a significant amount of energy. Returned condensate is usually hotter<br />
than makeup water. <strong>The</strong>refore, condensate requires less energy to return to steam. Makeup water also<br />
has a higher conductivity and concentration of total dissolved solids. <strong>The</strong>refore, makeup water must be<br />
mechanically and chemically treated prior to use as feedwater, yet still requires more blowdown than<br />
returned condensate.<br />
This additional blowdown wastes additional energy, water and chemicals by dumping hot boiler drum<br />
water. Even with the additional treatment and blowdown required by makeup water, a boiler remains<br />
cleaner with reduced makeup water.<br />
A cleaner boiler, meaning better heat transfer surfaces, results in a more efficient boiler. All in all, a<br />
boiler manager should consider very<br />
< previous page page_217 next page >
previous page page_218 next page ><br />
carefully the option to waste hot condensate rather than pipe it back to the boiler.<br />
Page 218<br />
Another method of capturing condensate and returning it to the boiler room is through utilizing flash<br />
steam. Flash steam occurs anytime condensate at one pressure is dropped to a lower pressure.<br />
Whenever this occurs, a percentage of the mass ''flashes" back into steam. This flash steam, unless<br />
captured, is typically vented to the atmosphere and lost, carrying away a significant amount of energy.<br />
Whenever a high pressure steam system has a lower pressure condensate return system, there are<br />
significant amounts of flash steam. For example, in a 150 psig steam system where the steam trap<br />
returns condensate to a vented condensate receiver tank, 16.4% of the condensate mass will flash to<br />
steam carrying away 46.9% of the condensate's remaining energy. If this flash steam were collected<br />
and utilized, it would save a significant amount of energy in addition to being recondensed and<br />
returned for use as feedwater.<br />
Flash steam need not be at atmospheric pressure. Condensate systems may be pressurized to near the<br />
steam operating pressure or anywhere between such that the flash steam is minimized and that which<br />
does occur is at a pressure that may be utilized productively.<br />
Blowdown Management<br />
Like steam management and condensate management, blowdown management is also important. If<br />
the steam and condensate were perfectly managed and returned, then theoretically there would be no<br />
need for blowdown, even in the largest systems. Unfortunately, we live in the real world and blowdown<br />
is required to reduce the buildup of impurities in the boiler drum water.<br />
Blowdown requires makeup water and makeup water requires blowdown. It is a never ending cycle,<br />
but it can be balanced. <strong>The</strong>re are two methods of blowing down a boiler and each has a different<br />
purpose. <strong>The</strong> first method is bottom blowdown. As the name implies, this is a drain line in the base of<br />
the lower boiler drum. This method is for removing the buildup of settled particles sometimes referred<br />
to as "mud" or "sludge." Bottom blowdown should only be done periodically and several short<br />
blowdowns are better than one long one.<br />
< previous page page_218 next page >
previous page page_219 next page ><br />
Page 219<br />
<strong>The</strong> second method is skimming blowdown. Again as the name implies, this method is for removing the top layer of water at the<br />
steam/water interface. Light particulates, dissolved solids, particles that cause foaming and high conductivity tend to concentrate<br />
here. Skimming blowdown systems are most effective as continuous blowdown.<br />
As a boiler energy manager, the first point to understand is that blowdown (for those systems that do not return 100% of their<br />
condensate) is a necessary evil. Too little blowdown leads to a buildup of impurities. If these impurities are allowed to<br />
concentrate beyond certain limits, deposits and scale will form on the boiler heat transfer surfaces. This reduces boiler efficiency<br />
as discussed earlier.<br />
In addition, concentrations at the water surface will build up which will cause foaming. <strong>The</strong> foaming will cause carryover of<br />
moisture into the steam system and more problems occur. On the other hand, too much blowdown wastes water, chemicals,<br />
energy and money. <strong>The</strong> management part is to strike a balance. Table 21-2 provides recommended boiler water impurity levels.<br />
TABLE 21-2. Recommended Limits for <strong>Boiler</strong> Water Concentrations<br />
Total Dissolved Solids Conductivity Alkalinity Suspended Solids<br />
Drum Pressure ABMA Possible ABMA Possible ABMA Possible ABMA Possible<br />
0300 3500 6000 3500 6000 700 1000 300 300<br />
301450 3000 5000 3000 5000 600 900 250 250<br />
451600 2500 4000 2500 4000 500 500 150 150<br />
601 750 2000 2500 2000 2500 400 400 100 100<br />
751-900 1500 1500 300 300 60<br />
9011000 1250 1250 250 250 40<br />
10011500 100 100 200 200 20<br />
<strong>The</strong> use of frequent short blowdowns is better than infrequent long blowdowns. Less water, chemicals and energy are wasted<br />
without exceeding impurity levels. Continuous blowdown is even better as it further reduces the need for blowdown, even<br />
intermittent bottom blowdown, and allows for the use of heat recovery devices.<br />
< previous page page_219 next page >
previous page page_220 next page ><br />
Page 220<br />
Figure 21-5 shows how different blowdown strategies can result in reduced blowdown requirements as<br />
higher average concentrations are allowed without exceeding maximum recommended concentrations.<br />
As can be seen, continuous blowdown allows the highest average level without exceeding the upper<br />
limit. Thus, continuous blowdown results in the least amount of blowdown being wasted.<br />
Figure 21-5<br />
Drum Water Concentrations with<br />
Various Blowdown Strategies<br />
Continuous blowdown also allows the economic use of heat recovery devices. Figure 21-6 shows two<br />
such methods combined. Blowdown, being at a higher pressure, flashes when blown down to a lower<br />
pressure.<br />
As the impurities do not evaporate, this clean steam can be collected in an expansion tank and piped to<br />
the feedwater tank as a feedwater preheating system. <strong>The</strong> remaining blowdown which does not flash is<br />
still significantly hot and can be routed through a simple coaxial or shell and tube heat exchanger in<br />
order to preheat the corresponding makeup water.<br />
< previous page page_220 next page >
previous page page_221 next page ><br />
Economizers<br />
Figure 21-6<br />
Blowdown Heat Recovery Schematic<br />
Economizers have long been used in larger process boilers as a means of waste heat recovery. An<br />
economizer is a finned tube (gas to liquid) coil type heat exchanger placed in the base of a boiler's<br />
exhaust stack. Feedwater is then routed from the feedwater pump through the economizer prior to<br />
entering the boiler drum.<br />
Page 221<br />
<strong>The</strong> purpose is to recover additional heat from the boiler's hot exhaust gases to preheat the feedwater<br />
thus reducing the fuel requirement of the boiler to change the boiler water to steam. A typical<br />
feedwater economizer system is shown in Figure 21-7.<br />
< previous page page_221 next page >
previous page page_222 next page ><br />
Figure 21-7<br />
Feedwater Economizer Schematic<br />
Page 222<br />
Economizers are simple devices and are often cost effective for even smaller steam boilers. Variations<br />
of economizers are also possible. For example, when feedwater temperatures are high, economizers<br />
become very large and expensive as more heat transfer surface is required to overcome the reduced<br />
temperature difference between the feedwater and the exhaust gases.<br />
To overcome this, the economizer can be designed to preheat makeup water rather than feedwater.<br />
This type of system is shown in Figure 21-8. This method can significantly reduce the size and cost of<br />
the economizer required as the makeup water flow rate is less than the feedwater flow rate and the<br />
temperature difference is greater.<br />
Economizers are generally not recommended for smaller boilers in which the feedwater pump cycles<br />
on and off, as the feedwater in the economizer frequently is not flowing and may steam. In these<br />
situations, a separate recirculation system may be installed as shown in Figure 21-9 to keep the<br />
feedwater flowing through the heat recovery coil. In cases where the boiler also cycles on and off, the<br />
recirculation<br />
< previous page page_222 next page >
previous page page_223 next page ><br />
Figure 21-8<br />
Makeup Water Economizer Schematic<br />
Figure 21-9<br />
Recirculating Economizer System Schematic<br />
Page 223<br />
< previous page page_223 next page >
previous page page_224 next page ><br />
pump may be controlled with the combustion air fan such that the pump only operates when the<br />
burner is firing.<br />
Refrigerant Superheat Recovery<br />
Page 224<br />
Another waste heat recovery technique for supplementing process or domestic hot water requirements<br />
is refrigerant desuperheating. Refrigerant gases discharged out of the compressor prior to the<br />
condenser carry a significant amount of superheated energy. For a typical R-22 system, the<br />
temperature can range between 160 and 250°F depending on the system's head pressure.<br />
This hot gas can be routed through a coaxial (tube within a tube) heat exchanger prior to the existing<br />
condenser. Water, either process or domestic, is then circulated thru the heat exchanger in a counter<br />
flow direction. (See schematic of typical recirculation system Figure 21-10.)<br />
Figure 21-10<br />
Refrigeration Desuperheating Heat Recovery<br />
<strong>The</strong>re are actually two sources of energy savings in this opportunity. First, the load on the water<br />
heating system (boiler, heat exchanger, or other water heating device) is significantly reduced. For an<br />
R-22 refrigerant system, heat recovery ranges between 3,000 and 6,000 Btu's per ton-hour depending<br />
on the design factors.<br />
< previous page page_224 next page >
previous page page_225 next page ><br />
<strong>The</strong> second source of energy savings is in the refrigeration system itself. This method of waste heat<br />
recovery reduces the load on the existing condenser. Reducing the condenser load promotes<br />
subcooling, reducing the head pressure and compressor power requirements.<br />
Direct Contact Condensation Heat Recovery<br />
Page 225<br />
Direct Contact Condensation Heat Recovery (DCCHR) is a special method of waste heat recovery.<br />
Typically when recovering waste heat from a boiler's exhaust gases, the stack temperature is cooled to<br />
a minimum of 250ºF, to prevent any moisture in the exhaust gases from condensing as this moisture<br />
can become quite corrosive. This moisture, however, contains a great deal of energy. In natural gas,<br />
around 15% of the total fuel's heat content is retained by the moisture vapor.<br />
DCCHR is designed specifically to encourage water vapor in exhaust gases to condense. Shown in Fig.<br />
21-11, exhaust gases (after any standard waste heat recovery device) enter the primary heat<br />
exchanger. As the exhaust gases flow up, they flow through a cool water spray.<br />
Figure 21-11<br />
Direct Contact Condensation Heat Recovery<br />
< previous page page_225 next page >
previous page page_226 next page ><br />
Page 226<br />
Through this direct contact, heat transfer is accelerated and the exhaust gases can be cooled to around<br />
100ºF, thus condensing most of the water vapor into a hot water condensate that falls to the bottom of<br />
the heat exchanger.<br />
<strong>The</strong> hot condensate is acidic and typically not used directly as hot water. <strong>The</strong>refore, it is pumped to a<br />
secondary heat exchanger and used to preheat makeup or process water. This secondary heat<br />
exchanger cools the condensate to a low enough temperature that it may be re-used as the water spray<br />
at the top of the primary heat exchanger. Since water is continually being condensed from the exhaust<br />
gases, some condensate must be drained to keep the level constant.<br />
For DCCHR to be applicable, there are two main requirements: a need for high quantity and low<br />
quality. To explain, DCCHR recovers around 10 to 15% of a boiler's fuel input. This is a substantial<br />
amount of energy for a waste heat recovery device.<br />
<strong>The</strong>refore, there must be a need for this much energy. Secondly, this energy is of a low quality,<br />
meaning a low temperature. Most systems produce hot water around 130ºF; however, special designs<br />
and configurations can produce water up to 180ºF.<br />
As you might have guessed, these systems are not inexpensive. Due to the corrosive nature of the<br />
condensate, most components are stainless steel. In addition, the system requires as much floor space<br />
as the boiler itself. However, with long operating hours and fuel costs over $2 per million Btu, a simple<br />
payback of 3 years can be achieved.<br />
Results<br />
<strong>The</strong> results of the <strong>Boiler</strong> Tune Up Program have been quite impressive. After 80 surveys, 355<br />
recommendations were made identifying approximately $2 million per year in potential savings. Table<br />
21-3 lists the types of recommendations that have been made with their estimated savings. Figure 21-<br />
12 shows the distribution of savings the program has achieved. <strong>The</strong>se potential savings emphasize the<br />
need for basic boiler energy management.<br />
Hopefully, this chapter has given you some new ideas and re-emphasized some old ideas. But all ideas,<br />
and a little creativity, should be taken back to the boiler room and examined for economic feasibility.<br />
< previous page page_226 next page >
previous page page_227 next page ><br />
Document<br />
Page 227<br />
Even small boilers can reap significant savings by taking advantage of a few key opportunities.<br />
TABLE 21-3. Summary of Recommendations<br />
ENERGY SAVINGS DOLLAR SAVINGS<br />
ENERGY AND COST REDUCTION OPPORTUNITY QTY TOTAL AVERAGE TOTAL AVERAGE<br />
A. INCREASE BOILER EFFICIENCY<br />
(10º3TU/YR) (10ºBTU/YR) ($/YR) ($/YR)<br />
1. Minimize Excess Combustion Air 39 316,597.7 8,120.9 534,292 13,700<br />
2. Provide Sufficient Air for Complete Combustion 7 41,237.8 5,891.1 74,697 10,671<br />
3. Install Turbulators 10 3,457.9 345.8 7,929 793<br />
4. Clean <strong>Boiler</strong> Tubes 5 657.9 131.6 1,921 384<br />
5. Replace <strong>Boiler</strong> with More <strong>Efficient</strong> <strong>Boiler</strong> 5 8,446.6 1,689.3 25,768 5,154<br />
6. Repair or Replace Burners 6 2002. 3,347.1 39,611 6,602<br />
SUB TOTAL 72 390,597.7 5,425.0 $684,218 $9,503<br />
B. INSULATION<br />
7. Insulate Pipes and Lines 54 23,704.7 439.0 65,019 1,204<br />
8. Insulate Condensate, Feedwater Tanks 33 4,018.9 121.8 10,486 318<br />
9. Insulate <strong>Boiler</strong> Surface 21 4,683.6 223.0 15,049 684<br />
10. Insulate Heat Exchangers 8 380.9 47.6 1,122 140<br />
11. Insulate Hot Water Tanks 8 247.2 30.9 920 115<br />
12. Insulate Valves and other special fittings 13 2,639.7 203.1 8,369 644<br />
13. Insulate Autoclaves 2 61.0 30.5 247 124<br />
14. Insulate Other Equipment 11 46,338.3 4,212.6 85,.68 8.587<br />
SUB TOTAL 150 82,074.3 547.2 $187,080 $1,247
C. REDUCE BOILER LOAD<br />
15. Reduce or Utilize Flash Steam 2 13,957.2 6,978.6 30,705 15,353<br />
16. Repair Steam Leaks 5 35,008.8 7,001.8 61,084 12,217<br />
17. Recover and Return Condensate 8 5,091.4 636.4 12,479 1,560<br />
18. Reset <strong>The</strong>rmostats at Night 1 792.0 792.0 3,928 3,928<br />
19. Repair or Replace Faulty Steam Traps 4 1,721.9 430.5 4,625 1,156<br />
20. Vary Hot Water Temperature Based on Demand 3 1,685.9 562.0 4,820 1,607<br />
21. Remove Dead Steam Lines 2 51.5 25.8 185 93<br />
22. Reduce <strong>Boiler</strong> Blowdown to ABMA Recommended Limits 2 460.7 230.4 1,256 628<br />
23. Install Damper to Reduce Natural Draft Losses 10 2,014.3 201.4 6,073 607<br />
SUB TOTAL 37 60,783.7 1,642.8 $125,155 $3,383<br />
WASTE HEAT RECOVERY<br />
24. Condensation Heat Recovery of Exhaust Gases 3 210,814.8 70,271.6 376,150 125,383<br />
25. Recover Heat from Superheated Refrigeration Gases 17 18,472.7 1,086.6 69,904 4,112<br />
26. Install an Economizer in the <strong>Boiler</strong> Exhaust Stack 26 40,756.1 1,567.5 120,126 4,620<br />
27. Recover Heat from <strong>Boiler</strong> Blow down 11 17,457.2 1,587.0 37,257 3,387<br />
28. Preheat Combustion Air with Recuperator 3 5,762.3 1,920.8 12,016 4,005<br />
29. Other Waste Heat Recovery 4 5,871.6 1 467.9 14,656 3,664<br />
SUB TOTAL 64 299,134.7 4,674.0 $630,109 $9,845<br />
OTHER<br />
30. Install Variable Frequency Drive on Pumps and Fans 12 32,769.9 2,730.8 282,890 23,574<br />
31. Replace Electric <strong>Boiler</strong> with Natural Gas <strong>Boiler</strong> 2 (427.0) (213.5) 17,275 8,638<br />
32. Change Utility Rate Schedule 2 0.0 0.0 4,652 2,326<br />
33. Turn Off or Lower <strong>Boiler</strong> Pressure, when not in use 2 357.7 178.9 1,072 536<br />
34. Replace Continuous Pilots with Electronic Ignition 9 334.0 37.1 930 103<br />
35. Reduce <strong>Boiler</strong> Infiltration 2 158.4 79.2 407 204
36. Turn off Recirculation Pumps, when not required 1 76.4 76.4 866 866<br />
37. Modify Building Envelope, to reduce heat loss 1 6,165.0 6,165.0 18,184 18,184<br />
38. Replace Control Valves, for improved control 1 611.0 611.0 1,803 1,803<br />
SUB TOTAL 32 40,045.4 1,251.4 $328,079 $10,252<br />
TOTAL 355 872,635.8 2,458.1 $1,954,641 $5,506<br />
< previous page page_227 next page >
previous page page_228 next page ><br />
Figure 21-12<br />
<strong>Boiler</strong> Tune Up Program Distribution of Savings<br />
Page 228<br />
< previous page page_228 next page >
previous page page_229 next page ><br />
22<br />
Case Studies<br />
Natural Gas Fuel<br />
<strong>Boiler</strong> No. 1<br />
Page 229<br />
13,000 lbs/hr, D-type water tube boiler with automatic parallel position combustion controls using a singledrive<br />
mechanical jackshaft system.<br />
Figure 22-1 shows the dependence of stack parameters on excess O2 at 80% capacity. Note that CO<br />
emissions increase while stack temperatures decrease continuously as excess O2 is decreased.<br />
<strong>Boiler</strong> efficiency increases to a maximum, then drops off as CO emissions become excessive (>2000<br />
ppm). NO emissions remain relatively constant during the O2 variation.<br />
This same dependence is illustrated in Figure 22-2 for operation at 20% of capacity. Overall boiler<br />
efficiency decreases due to the radiation losses at this load being more significant even though stack<br />
gas temperatures have decreased.<br />
<strong>The</strong> importance of burner design parameters on these variables at 80% capacity is illustrated in<br />
Figure 22-3 <strong>The</strong> combustion air swirl (effectively the fuel/air mixing and resulting flame patterns) was<br />
altered by manually adjusting the burner air register position. Increased air swirl with the air<br />
registers closed down one notch from normal setting resulted in a ''steep" CO dependence on excess<br />
O2. (A further closing caused excessive flame impingement.) Higher CO emissions resulted from<br />
opening the air register position and decreasing the air swirl.<br />
< previous page page_229 next page >
previous page page_230 next page ><br />
Figure 22-1<br />
<strong>Boiler</strong> No. 1, Natural Gas<strong>Boiler</strong> efficiency and stack<br />
condition versus excess oxygen at 80 percent load.<br />
Page 230<br />
< previous page page_230 next page >
previous page page_231 next page ><br />
Figure 22-2<br />
<strong>Boiler</strong> No. 1, Natural Gas <strong>Boiler</strong> efficiency and stack<br />
conditions versus excess oxygen at 20 percent load.<br />
Page 231<br />
< previous page page_231 next page >
previous page page_232 next page ><br />
Figure 22-3<br />
<strong>Boiler</strong> No. 1, Natural Gas <strong>The</strong> effects of air register position on<br />
boiler efficiency and stack conditions at 80 percent load.<br />
Page 232<br />
< previous page page_232 next page >
previous page page_233 next page ><br />
<strong>Boiler</strong> No. 2<br />
15,000 lbs/hr, D-type watertube boiler with automatic parallel positioning combustion controls using a<br />
single-drive mechanical jackshaft system.<br />
<strong>The</strong> dependence of stack parameters on excess O2 level is illustrated in Figure 22-4.<br />
<strong>The</strong> "as found" efficiency tests at 60% load indicated very poor combustion efficiency from the<br />
presence of up to 50,000 ppm CO and 10,000 ppm unburned hydrocarbon (as CH4).<br />
Page 233<br />
<strong>The</strong> excessively low excess O2 level at this load was ultimately traced to a loose adjustment screw on<br />
the air/fuel control cam. This problem was only encountered at this load.<br />
<strong>Boiler</strong> No. 3<br />
42,000 lbs/hr watertube boiler with automatic parallel positioning combustion control using a single-driven<br />
mechanical jackshaft system.<br />
<strong>The</strong> "as found" efficiency results for automatic operation are plotted versus load in Figure 22-5 for the<br />
entire turndown range of the boiler.<br />
<strong>The</strong>se reveal a rapid decline in boiler efficiency at reduced loads due to exceptionally high excess O2<br />
levels.<br />
Efficiency also declines at full load due to increased excess O2 levels caused by restricted natural gas<br />
flow.<br />
To determine potential efficiency improvement with lower excess O2, the air flow was manually<br />
reduced while maintaining constant firing rate near 90% capacity as shown in Figure 22-6. A 1%<br />
improvement was achieved although the optimum O2 level of 5.0 was high for natural gas combustion.<br />
Burner air register adjustments to reduce CO could not be attempted.<br />
It was difficult to define a normal operating excess O2 point for each load due to the considerable play<br />
in the control shafts and linkages and therefore the excess O2 was very non-repeatable.<br />
< previous page page_233 next page >
previous page page_234 next page ><br />
Figure 22-4<br />
<strong>Boiler</strong> No. 2, Natural Gas<strong>Boiler</strong> efficiency and stack<br />
conditions versus excess O2 at 65 percent load.<br />
Page 234<br />
< previous page page_234 next page >
previous page page_235 next page ><br />
Figure 22-5<br />
<strong>Boiler</strong> No. 3, Natural Gas<strong>Boiler</strong> efficiency and stack<br />
conditions versus percent of maximum load. (1250 hp, CE).<br />
KVB®<br />
Page 235<br />
< previous page page_235 next page >
previous page page_236 next page ><br />
Figure 22-6<br />
<strong>Boiler</strong> No. 3, Natural Gas<strong>Boiler</strong> efficiency<br />
and stack conditions versus excess oxygen<br />
at 90 percent boiler load (1250 hp, CE).<br />
Page 236<br />
< previous page page_236 next page >
previous page page_237 next page ><br />
Oil Fuel<br />
<strong>Boiler</strong> No. 4, No. 2 Diesel Fuel<br />
B&W saturated steam boiler, capacity 58,000 lbs/hr., 230 psig. Single circular burner; Bailey automatic<br />
combustion controls (parallel positioning).<br />
Figure 22-7 shows the dependence of efficiency and stack emissions on excess O2 at constant load.<br />
Page 237<br />
<strong>The</strong> lower excess O2 level (4%) was close to the smoke threshold and probably represents the lowest<br />
practical minimum excess O2 level.<br />
<strong>Boiler</strong> efficiency was improved by over 1.5% from the normal operating point.<br />
<strong>Boiler</strong> No. 5, Diesel Fuel<br />
13,000 lbs/hr, D-type watertube boiler with automatic parallel positioning combustion control using a singledrive<br />
mechanical jackshaft system.<br />
Figure 22-8 illustrates the dependence of efficiency and stack emissions on excess O2 over the normal<br />
operating load range of the unit.<br />
Pulverized Coal<br />
<strong>Boiler</strong> No. 6<br />
160,000 lbs/hr with four B&W burners arranged in a two-by-two matrix burning Colorado subbituminous<br />
coal.<br />
Figure 22-9 illustrates the effects of varied excess O2 level on stack gas parameters and operating<br />
efficiency. As shown, stack gas temperatures were relatively unaffected by excess O2 variations.<br />
Operating efficiency increased by 0.5% with a 1.5% reduction in excess O2 .<br />
Stack gas parameters and efficiency were not significantly affected by variations in operating load as<br />
shown in Figure 22-10.<br />
Excess O2 levels increased with increasing load due to the CO emissions profiles given in Figure 22-11.<br />
Unburned CO and carbon in the ash did not play a significant part in efficiency losses.<br />
< previous page page_237 next page >
previous page page_238 next page ><br />
Figure 22-7<br />
<strong>Boiler</strong> No. 4, No. 2 Diesel Fuel<strong>Boiler</strong> efficiency and stack<br />
conditions versus excess oxygen at half load (24 K lb/hr).<br />
Page 238<br />
< previous page page_238 next page >
previous page page_239 next page ><br />
Figure 22-8<br />
<strong>Boiler</strong> No. 5, Diesel Fuel<strong>Boiler</strong> efficiency and stack<br />
conditions versus excess oxygen at various boiler loads.<br />
Page 239<br />
< previous page page_239 next page >
previous page page_240 next page ><br />
Figure 22-9<br />
<strong>Boiler</strong> No. 6, Pulverized Coal <strong>Boiler</strong> efficiency and stack<br />
conditions versus excess O2 at 70 percent of maximum capacity.<br />
KVB®<br />
Page 240<br />
< previous page page_240 next page >
previous page page_241 next page ><br />
Figure 22-10<br />
<strong>Boiler</strong> No. 6, Pulverized Coal <strong>Boiler</strong> efficiency and<br />
stack conditions versus percent of maximum capacity.<br />
KVB®<br />
Page 241<br />
< previous page page_241 next page >
previous page page_242 next page ><br />
<strong>Boiler</strong> No. 7<br />
Figure 22-11<br />
<strong>Boiler</strong> No. 6, Pulverized Coal Carbon monoxide emissions<br />
as a function of excess oxygen at three boiler loads,<br />
Walden Colorado coal, Fremont Department of Utilities.<br />
225,000 lbs/hr, corner-fired watertube unit fired with eight pulverized coal burners burning high sulfur<br />
bituminous coal.<br />
At constant load conditions, variations in excess air had little effect on stack gas temperatures as<br />
shown in Figure 22-12. A 0.5 percent increase in efficiency with a 1.5% drop in excess O2.<br />
NO emissions increased with increasing excess O2.<br />
Page 242<br />
Efficiency decreased with increased load due to increased stack gas temperatures, illustrated in Figure<br />
22-13.<br />
< previous page page_242 next page >
previous page page_243 next page ><br />
Figure 22-12<br />
<strong>Boiler</strong> No. 7, Pulverized Coal <strong>Boiler</strong> efficiency and stack<br />
conditions versus excess O2 at 100 percent capacity.<br />
KVB®<br />
Page 243<br />
< previous page page_243 next page >
previous page page_244 next page ><br />
Figure 22-13<br />
<strong>Boiler</strong> No. 7, Pulverized Coal <strong>Boiler</strong> efficiency and<br />
stack conditions versus percent of maximum capacity.<br />
KVB®<br />
Page 244<br />
< previous page page_244 next page >
previous page page_245 next page ><br />
Stoker-Fired Coal<br />
<strong>Boiler</strong> No. 8<br />
100,000 lbs/hr Westinghouse centerfire spreader stoker with traveling grate firing high sulfur bituminous<br />
coal.<br />
Page 245<br />
<strong>The</strong> relationship of stack gas parameters with excess O2 is presented in Figure 22-14. CO and<br />
combustible losses increase sharply as excess O2 is lowered below 7.5% O2. Efficiency, however, has<br />
not yet peaked since the stack gas temperatures are decreasing.<br />
As given in Figure 22-15, efficiency also decreases with decreasing load due to increase in excess O2<br />
levels and combustible emissions.<br />
<strong>Boiler</strong> No. 9<br />
160,000 lbs/hr watertube B&W boiler fired by six spreader stokers supplied by the Detroit Stoker Company.<br />
Low sulfur subbituminous coal.<br />
As illustrated in Figure 22-16, stack gas parameters and boiler efficiency are significantly affected by<br />
variations in excess O2. Note the sharp increase of CO and combustible emissions and decrease in exit<br />
gas temperature as excess O2 is lowered below 7.0% O2.<br />
An analysis of these parameters as load is varied (Figure 22-17) would indicate that the operating<br />
efficiency over the load range would be relatively constant if the excess O2 were increased at higher<br />
loads to reduce CO and combustible emissions.<br />
< previous page page_245 next page >
previous page page_246 next page ><br />
Figure 22-14<br />
<strong>Boiler</strong> No. 8, Stoker-Fired Coal <strong>Boiler</strong> efficiency and stack<br />
conditions versus excess at 98 percent maximum capacity.<br />
KVB®<br />
Page 246<br />
< previous page page_246 next page >
previous page page_247 next page ><br />
Figure 22-15<br />
<strong>Boiler</strong> No. 8, Stoker-Fired Coal<strong>Boiler</strong> efficiency and<br />
stack condition versus percent maximum capacity.<br />
KVB®<br />
Page 247<br />
< previous page page_247 next page >
previous page page_248 next page ><br />
Figure 22-16<br />
<strong>Boiler</strong> No. 9, Stoker-Fired Coal<strong>Boiler</strong> efficiency and stack<br />
condition versus excess O2 at 60 percent capacity.<br />
Page 248<br />
< previous page page_248 next page >
previous page page_249 next page ><br />
Figure 22-17<br />
<strong>Boiler</strong> No. 9, Stoker-Fired Coal <strong>Boiler</strong> efficiency and<br />
stack conditions versus percent of maximum capacity.<br />
KVB®<br />
Page 249<br />
< previous page page_249 next page >
previous page page_251 next page ><br />
23<br />
Tuning Large Industrial <strong>Boiler</strong>s<br />
Page 251<br />
<strong>The</strong> general principles of boiler efficiency improvement and boiler tuning presented in previous<br />
chapters apply to almost all industrial boilers, but there are other special considerations that apply<br />
primarily to large industrial boilers. As defined in the Introduction and Chapter 2 of this book, an<br />
''industrial boiler," includes all boilers with 10,000 to 500,000 lb/hr steam flow capacity. <strong>The</strong> focus of<br />
this chapter is on specific diagnostic and tune-up procedures that would apply to larger industrial<br />
boilers in the 100,000 to 500,000 lb/hr steam flow range. Since many large industrial boilers tend to be<br />
coal-fired because of their significant fuel use, the discussion will also address those issues specific to<br />
coal-fired units that have not been addressed in previous chapters.<br />
Large <strong>Boiler</strong> Characteristics<br />
Industrial boilers in the 100,000 to 500,000 lb/hr steam flow size range tend to have particular design<br />
and operating characteristics that distinguish them from firetube and smaller industrial boilers. Some<br />
common characteristics and tuning considerations are listed below:<br />
• many boilers have multiple burners (non-stoker units)<br />
• air preheaters and economizers are quite common<br />
• larger field erected units lack a standardized design<br />
< previous page page_251 next page >
previous page page_252 next page ><br />
• combustion controls are more complex<br />
• heavy residual oil and coal are common fuels; pulverized coal is used in the largest boiler sizes<br />
• carbon burnout and carbon utilization is an important concern on coal-fired units<br />
• control of ash deposition and ash removal by sootblowing are also key performance concerns<br />
• older balanced draft units may have significant air in-leakage<br />
Page 252<br />
• efficient operation is critical since boiler efficiency losses may be measured in thousands of dollars<br />
per year.<br />
Although many fire tube and smaller water tube boilers are fabricated to a standard design in the<br />
boiler manufacturer's shop and then shipped to the site, large industrial water tube boilers may be<br />
field erected to a more customized design specification. <strong>The</strong> choice of combustion controls,<br />
instrumentation, and other auxiliary equipment may have been specified by the owner or architect<br />
and engineering firm for the specific process application. <strong>The</strong>refore, the tuning and optimization of<br />
these integrated equipment systems may require more expertise and diagnostic instrumentation than a<br />
smaller unit. A typical large industrial boiler equipped with multiple burners is shown in Figure 23-1.<br />
Importance of Diagnostic Testing<br />
<strong>The</strong> tune-up of a firetube or smaller industrial boiler can usually be performed following the<br />
procedures outlined in Chapters 8 through 10, with only minimal advanced preparation or diagnostic<br />
testing. However, the complexities of the design and operation of a large industrial boiler often<br />
warrant some prior diagnostic testing in advance of the formal tune-up activities. <strong>The</strong> primary<br />
objective of this diagnostic testing is to identify off-design equipment performance or site-specific<br />
operating practices/constraints that would preclude establishing the most efficient boiler firing<br />
practice. If equipment maintenance, adjustment, calibration or modification to operating practices are<br />
necessary, these should be completed before attempting to optimize boiler performance.<br />
< previous page page_252 next page >
previous page page_253 next page ><br />
(Source: Babcock & Wilcox)<br />
(Permission granted by ABB<br />
Combustion Engineering)<br />
Figure 23-1<br />
Large Industrial <strong>Boiler</strong>s with Multiple Burners<br />
Page 253<br />
< previous page page_253 next page >
previous page page_254 next page ><br />
Common <strong>Boiler</strong> Operational Problems<br />
Page 254<br />
Diagnostic testing has identified a number of common operational problems that can adversely affect<br />
boiler efficiency and performance. In some cases, they can be quickly resolved with routine<br />
maintenance or adjustments. In other cases, they may require retrofit equipment modifications that<br />
involve temporarily taking the boiler out of service.<br />
<strong>The</strong> most common boiler operational problems often fall into one of four major categories:<br />
• improper fuel storage, handling and preparation<br />
• operation at non-optimum excess air levels<br />
• combustion controls/instrumentation placement issues<br />
• lack of combustion uniformity<br />
Some examples of these types of problems are presented in the remainder of this section to aid in<br />
identifying them during future diagnostic tests and boiler tune-up efforts.<br />
Fuel Storage, Handling and Preparation<br />
Large industrial boilers frequently bum either heavy residual oils (No. 6) or coal, as opposed to<br />
premium fuels like natural gas and distillate oil that are typically burned in smaller industrial boilers.<br />
Although heavy residual oil and coal are lower cost fuels, they both present special storage, handling,<br />
and preparation problems that can adversely affect boiler efficiency. Many of these problems can be<br />
reflected in off-design combustion performance or combustible losses.<br />
No. 6 Residual Oil<br />
One of the most common residual oil storage problems that can lead to poor combustion performance<br />
and potential coking is the mixing and blending of incompatible fuels in the storage tank. This can<br />
occur in cases where low and high sulfur oils of dissimilar properties are blended to achieve a target<br />
compliance sulfur level in air quality regions where SO2 emissions are restricted. This blending may<br />
occur off-site at the refinery before delivery, leading to stratification if the fuel is stored for extended<br />
periods. This can occur during seasonal use of an alternative fuel (e.g., during summertime natural gas<br />
usage).<br />
One way to identify possible fuel storage stratification problems is<br />
< previous page page_254 next page >
previous page page_255 next page ><br />
Page 255<br />
to use a sample thief to collect individual samples at different levels in the storage tank. A thermo<br />
gravimetric analysis (TGA) of the samples may indicate different combustion characteristics of the<br />
fuels. Occasionally, a very heavy residual oil will be "cut" with a light oil to improve the viscosity and<br />
handling characteristics of the heavier oil. However, these more volatile lighter components may<br />
vaporize very early in the flame zone leaving the heavy ends to bum incompletely at the edge of the<br />
flame zone. Fuels of this type will exhibit unusual flame and combustion characteristics that make<br />
boiler efficiency optimization very difficult.<br />
It should be noted that some unblended residual oils may have poor combustion characteristics that<br />
lead to coke formation and poor carbon utilization even under otherwise optimum firing conditions.<br />
Considerable research has been conducted to develop techniques to identify these fuels in advance and<br />
to define a coking index (CI) to rank their coking properties. <strong>The</strong> coking index is defined as the mass<br />
of coke formed during combustion divided by the mass of oil burned. Since heavy residual oils are<br />
used in utility boilers as well as large industrial boilers, the Electric Power Research Institute has<br />
sponsored research work in this area. This research led to the recent development of a HOT FOIL®<br />
COKING INDEX (HFCI) instrument to quickly test heavy residual oils for their coking properties[23-<br />
1]. Some test results obtained using the HFCI instrument on various oils with a wide range of<br />
asphaltene content are shown in Figure 23-2.<br />
Some of the most common residual oil handling and preparation problems are associated with<br />
inadequate viscosity control and incomplete or improper atomization. Many residual oils must be<br />
preheated to raise the oil temperature to a point where the viscosity of the oil meets the required<br />
viscosity specified for the atomizer tip being used. <strong>The</strong> viscosity temperature relationship for a typical<br />
No. 6 residual oil relative to other oils is shown in Figure 23-3. In the case of steam atomized tips,<br />
atomization problems can occur if the proper steam and oil pressures are not maintained at the tip.<br />
Poor atomization can also occur if steam lines are not properly insulated and steam traps utilized to<br />
effectively prevent condensation in the atomizing steam. Even with the best oil storage, handling, and<br />
preparation activities, incomplete combustion and efficiency losses can occur with worn or partially<br />
plugged atomizers.<br />
< previous page page_255 next page >
previous page page_256 next page ><br />
Figure 23-2<br />
Comparison of Coking Index and Asphaltene Content (ASTM D-3279)<br />
(Source: ASTM)<br />
Figure 23-3<br />
Viscosity versus Oil Temperature Characteristics for Various Fuel Oils<br />
(Source: ASTM)<br />
Page 256<br />
< previous page page_256 next page >
previous page page_257 next page ><br />
Coal Fuel<br />
Page 257<br />
Large industrial boilers are often coal-fired because of their large fuel use and the generally lower cost<br />
of coal on a Btu basis. Stokers and pulverized coal-fired units are the most common designs, but<br />
fluidized bed units have been purchased in recent years in response to growing environmental<br />
pressures. Problems associated with coal storage, handling, and preparation that can adversely affect<br />
boiler efficiency are often associated with:<br />
• wet coal<br />
• extended long-term storage and inadequate coal inventory control<br />
• inadequate crushing or size control<br />
• poor pulverization or classifier performance<br />
Coal yard operations should be organized in a manner that coal pile drainage of excess water is<br />
effectively accomplished, particularly in rainy seasons. Wet coal can present coal feeding and<br />
combustion problems that can result in high ash carbon levels and unsteady boiler operation.<br />
Operation at high excess air levels to insure complete combustion of wet coal can also result in boiler<br />
efficiency losses.<br />
Poor coal yard inventory management practices can occasionally result in the burning of a coal that<br />
has been in storage at the bottom of the pile for an extended time period. This coal may have lost some<br />
of its volatile content and may have been exposed to numerous rain and dry cycles. Once the coal is<br />
finally burned, it may exhibit undesirable combustion characteristics, particularly with regard to<br />
delayed ignition on pulverized coal (PC) fired units. Although these characteristics are often<br />
insignificant or unnoticeable during normal-full load, maximum steam flow operation, they can range<br />
from a nuisance to a significant combustion problem at reduced or minimum firing rates. Operation<br />
with igniters continuously in service or supplementary gas/oil fuel support may be needed to insure<br />
stable operation and to aid in carbon burnout. High ash carbon levels and reduced boiler efficiency<br />
may occur at minimum firing rates.<br />
High ash carbon levels and poor combustion efficiency can occur if the coal has not been properly<br />
prepared to the size range originally specified in the combustion equipment design. Poorly crushed<br />
coal or coal with excessive fines can affect the performance of stoker units.<br />
< previous page page_257 next page >
previous page page_258 next page ><br />
Page 258<br />
Pulverized coal may exhibit carbon burnout problems if the coal fineness is not at least 70 percent<br />
passing 200 mesh, and less than 1 percent retained on 50 mesh, depending upon the coal type. Worn<br />
pulverizer internals or improperly adjusted classifiers can be the cause of coarse coal and poor<br />
combustion efficiency on large PC-fired industrial boilers.<br />
Pulverized coal samples should be collected from the burner pipe in accordance with the procedures in<br />
ASME Power Test Code 3.2 or the <strong>International</strong> Standards Organization (ISO/TC 27/SC 4 N 119).<br />
<strong>The</strong> ISO test procedure involves the use of a sample probe with a rotating head, shown in Figure 23-4,<br />
that allows samples to be collected at several different pipe radii, where normal access on 90º center<br />
may not be possible. A more representative sample is obtained in pipes where coal roping may be<br />
present. It should be noted that pulverized coal sampling ideally should be performed near the end of<br />
a straight vertical run of pipe where uniform flow is more likely. <strong>The</strong> practice of sampling at the<br />
pulverizer exit or in horizontal runs of burner pipe should be discouraged.<br />
An improvement in coal fineness can result in a significant improvement in coal carbon burnout and<br />
boiler efficiency. Pulverizer repairs and classifier adjustments at one PC-fired unit reduced the<br />
percentage of pulverized coal retained on 50 mesh from approximately 1.7 percent to 0.4 percent. This<br />
led to a reduction in ash carbon content from 11 percent to 6 percent at the normal operating O2.<br />
From another perspective, the coal fineness improvement allowed a two percent reduction in operating<br />
O2 level when the unit was operated at the same ash carbon level that existed before the pulverizer/<br />
classifier tune-up. It should be emphasized that the very coarse particles remaining on a 50 mesh<br />
screen are the ones that are the primary cause of carbon burnout problems. In the example noted<br />
above, the percentage of coal passing through a 200 mesh screen only decreased one percent from 75 to<br />
74 percent as the result of the pulverizer work.<br />
Non-Optimum Excess Air Levels<br />
Operating a boiler at its optimum efficiency is strongly dependent upon defining an optimum excess<br />
air or O2 level as discussed in prior chapters. Unfortunately, many boilers are operated at nonoptimum<br />
< previous page page_258 next page >
previous page page_259 next page ><br />
Page 259
Figure 23-4<br />
Rotating Head Pulverized Coal Sample System<br />
< previous page page_259 next page >
previous page page_260 next page ><br />
excess air levels for reasons that may not be initially apparent to the boiler owner/operator. Some<br />
common reasons include:<br />
• air in-leakage upstream of the plant O2 analyzer<br />
• infrequent or incorrect O2 analyzer calibration<br />
• insufficient combustion air supply at full load<br />
• placement of the O2 analyzer at a non-representative location in the flue gas duct<br />
Page 260<br />
Large industrial boilers are often a balanced draft design (i.e., the operation of the forced draft fan<br />
and the induced draft fan are balanced in a manner that it creates a slight negative pressure in the<br />
furnace). One of the benefits of this type of design is that any leaks in the boiler or duct work (to the<br />
induced draft fan) result in air in-leakage to the flue gas steam as opposed to hot flue gas leaking into<br />
the boiler house creating a safety hazard. One of the disadvantages is that air infiltration through<br />
casing leaks upstream of the plant O2 analyzer(s), causing it to read much higher than the actual<br />
furnace combustion conditions. As a result, the boiler operator may think he is operating the boiler at<br />
4-5 percent O2 when in fact the furnace may be at 2-3 percent O2, or less.<br />
This can lead to significant combustible losses in the form of CO or high ash carbon content. An<br />
example of air in-leakage between the furnace exit and the economizer exit is shown in Figure 23-5.<br />
<strong>The</strong> high O2 region along the North wall at the economizer exit is due to leakage. <strong>The</strong>se data were<br />
obtained by diagnostic tests where a water cooled probe was inserted into the hot gas stream at the<br />
furnace exit, and O2 readings were compared to O2 measurements at a grid of 12 sample probes at the<br />
economizer exit. By comparing the difference in O2 along a hypothetical streamline between the two<br />
sample locations, the air inleakage can be calculated as shown in Figure 23-6. Using these data,<br />
correction factors can be applied to economizer exit data to predict the actual furnace exit O2 based<br />
on future economizer exit O2 readings.<br />
Another common cause of operation at a non-optimum O2 level is infrequent or incorrect O2 analyzer<br />
calibration. Routine scheduled O2 analyzer calibration is critical. Unfortunately, some industrial units<br />
are not recalibrated until the operator suspects the readings may be in error. Another important<br />
practice is to cross-check calibration gases against each other when a new bottle is delivered. Although<br />
it occurs infre-<br />
< previous page page_260 next page >
previous page page_261 next page ><br />
Figure 23-5<br />
Comparison of Economizer Exit and Furnace Exit<br />
O2 Contours to Assess Air In-leakage Profile<br />
quently, errors in blending calibration gases have been encountered by the author at several plants.<br />
Other O2 analyzer calibration problems are related to the design of the system.<br />
Page 261<br />
Some O2 analyzers on coal-fired units are equipped with a dust filter to keep fly ash out of the sensor<br />
cavity. Diagnostic testing at two different test sites in the past indicated the O2 analyzer was in error<br />
by several percent because the dust filter around the Zirconium oxide sensor had become plugged with<br />
fly ash. <strong>The</strong> analyzer was unintentionally biased during the calibration process even though standard<br />
calibration procedures were followed. As the calibration gas was passed down the probe to the sensor,<br />
a back pressure developed because the gas could not escape rapidly through the plugged dust filler.<br />
Since the analyzer is sensitive to changes in O2 partial pressure, a bias to the calibration occurred once<br />
the analyzer was put back in service at the<br />
< previous page page_261 next page >
previous page page_262 next page ><br />
Figure 23-6<br />
Calculated Furnace In-leakage Profile<br />
standard duct pressure that was less than during calibration. <strong>The</strong> manufacturer's calibration<br />
procedure did not warn the user of this potential problem with a plugged filter.<br />
Page 262<br />
<strong>Boiler</strong> owner/operators have also experienced problems with plugged or corroded sample lines causing<br />
extractive O2 analyzer systems to read higher than normal. Because maintaining efficient boiler<br />
operation after completing of a boiler tune-up is so strongly dependent upon accurately measuring and<br />
maintaining the optimum excess air level, a high priority should be given to the calibration and<br />
maintenance of the O2 analyzer(s).<br />
Occasionally, diagnostic testing will reveal that a boiler is operating at below normal excess air levels<br />
because there is insufficient<br />
< previous page page_262 next page >
previous page page_263 next page ><br />
Page 263<br />
combustion air supply at full load. High CO emissions or ash carbon levels can result. This problem<br />
can occur on large industrial boilers equipped with air heaters if they become partially plugged with<br />
ash deposits and corrosion. Some large industrial boilers may be equipped with rotary air heaters that<br />
have seals that develop leaks over time, if not properly maintained. If these leaks become large, a<br />
portion of the combustion air that was intended to reach the burners will bypass the boiler completely<br />
and pass up the stack, starving the burners for air. A similar problem can develop even with tubular<br />
air heaters that have no moving parts, if corrosion develops causing leakage from the higher pressure<br />
air side to the flue gas side of the heat exchanger. For these reasons, diagnostic testing prior to a boiler<br />
tune-up should include an air heater leakage and efficiency test for comparison to design data and/ or<br />
prior test data.<br />
Occasionally, O2 analyzers are placed at a non-representative location in the flue gas duct. This can be<br />
identified by diagnostic tests where the O2 analyzer sample plane is traversed with a probe connected<br />
to a portable O2 analyzer. Another approach is to install a grid of sample probes in the duct to obtain<br />
a composite average gas sample. This instrumentation can be valuable in evaluating combustion<br />
uniformity in a large unit with multiple burners, as will be discussed in a later section.<br />
Combustion Uniformity<br />
<strong>The</strong> complete combustion of gas, oil, or coal fuel at efficient excess air levels requires the fuel and air<br />
to be well mixed in a uniform manner throughout the primary combustion zone. Typically, this is<br />
much more easy to achieve on a small single burner industrial boiler than a large industrial boiler with<br />
multiple burners or a large traveling grate stoker. Non-uniform combustion can result if (1) the fuel<br />
and air are not evenly distributed to each burner, or (2) the fuel bed and combustion air<br />
compartments are not even on stoker units. If some portion of the combustion zone receives above<br />
normal levels of excess air, that air will be wasted and will contribute to a sensible heat loss and an<br />
adverse impact on boiler efficiency. If other portions of the combustion zone receive inadequate<br />
combustion air (or disproportionately high fuel flow), then significant combustibles could occur, also<br />
adversely im-<br />
< previous page page_263 next page >
previous page page_264 next page ><br />
Page 264<br />
pacting boiler efficiency. In essence, the same principles of optimizing boiler efficiency by minimizing<br />
losses still apply (see Chapters 3 and 8), but at a local level associated with an individual burner.<br />
<strong>The</strong>refore, the goal is to achieve the same air/fuel ratio at each burner. Unfortunately, it only takes one<br />
misadjusted or malfunctioning burner to spoil the boiler efficiency effort. If one burner is starved for<br />
air to the point of producing noticeable CO or ash carbon levels, the natural tendency is to raise the<br />
overall excess air level for the whole boiler until complete combustion is achieved, thereby causing the<br />
other burners to operate at unnecessarily high O2 levels.<br />
Diagnostic testing to identify and eliminate non-uniform combustion requires a very disciplined<br />
approach plus the proper test equipment since a non-optimum air/fuel ratio can occur on either the<br />
fuel or air supply side of the combustion equipment system.<br />
Some potential causes of non-uniform combustion include:<br />
• maladjusted air registers or dampers<br />
• binding or broken air register drives<br />
• partially plugged air heater<br />
• poor windbox design<br />
• uneven coal flow from the pulverizer(s)<br />
• broken or poorly positioned burner coal spreader<br />
• partially plugged or cracked oil gun atomizer tip<br />
• broken or poorly positioned oil gun diffuser<br />
Two of the most common causes of non-uniform combustion on multiple burner pulverized coal (PC)<br />
fired units are incorrect air register settings and unbalanced coal flow to individual burner pipes.<br />
Coke deposits can build in the oil gun or tip on residual oil-fired boilers, if the gun is not properly<br />
cooled when it is temporarily out of service. Even gas-fired units can suffer from an unbalanced<br />
distribution of fuel to individual burners, although it is quite rare. At one boiler, the natural gas<br />
distribution manifold was undersized, leading to large pressure drops to some burners and an uneven<br />
fuel distribution.<br />
A typical diagnostic test series, as a prelude to a boiler tune-up, should investigate sources of<br />
combustion non-uniformity. A preliminary evaluation of the degree of combustion uniformity can be<br />
made by making gaseous emissions measurements (O2, CO, NOx) at the boiler<br />
< previous page page_264 next page >
previous page page_265 next page ><br />
Page 265<br />
exit plane. On large industrial boilers, a traverse of the economizer exit plane with a sample probe is<br />
one option for short term temporary tests. However, some boiler owner/operators prefer the<br />
installation of a grid of sample probes, evenly spaced across the sample plane, for convenient retesting<br />
or troubleshooting in the future. A typical installation is shown in Figure 23-7. Valves control the flow<br />
from each sample probe so that individual gaseous measurements can be quickly made at each point in<br />
the duct as well as a composite average gaseous composition (with all valves open). Quite often, locally<br />
high or low O2 and CO readings can be traced back to an individual burner or combustion region<br />
where the air/fuel ratio is not optimum.<br />
Uniform combustion can quite often be achieved by simple adjustments (e.g., to the air register or<br />
damper settings). In other cases, further diagnostic testing is required. A common cause of nonuniform<br />
combustion or pulverized coal fired units is uneven coal flow from the pulverizer(s) to<br />
individual burners. This can be evaluated by collecting pulverized coal samples from each burner pipe<br />
over a timed interval. Samples are collected following procedures specified in ASME Power Test Code<br />
3.2 or (ISO/TC 27/SC 4 N 119). <strong>The</strong> use of a rotating head sample probe, shown previously in Figure<br />
23-4, typically provides more accurate measurements because it covers more of the pipe cross section.<br />
A pipe-to-pipe deviation in coal flow of as much as ± 20 percent has been measured in some cases. A<br />
more typical example is shown in Figure 23-8. <strong>The</strong> final coal flow deviations were measured after coal<br />
pipe orifice changes. In some cases, changes in coal pipe orifice or riffle box settings may be necessary<br />
to correct maldistribution problems. Pulverizer-to-pulverizer variations in coal flow on very large<br />
industrial boilers can often be resolved by recalibration of the coal feeders or by eliminating a bias in<br />
controller settings.<br />
Occasionally, a combustion uniformity problem is traced to the design of the windbox, the ductwork<br />
from the FD fan to the windbox, or even the placement of the FD fan relative to the windbox. It is<br />
important to observe equipment operation and boiler firing practices carefully since field<br />
modifications or improper maintenance may have changed the original function of the equipment. At<br />
one boiler, a problem was traced to an air register drive that operated backwards. Unfortunately, it<br />
can sometimes be difficult to identify the cause of non-uniform combustion since it can originate in the<br />
air supply system, fuel supply<br />
< previous page page_265 next page >
previous page page_266 next page ><br />
Page 266<br />
system, or quite often is the product of both. Overlay this situation with the possibility that the<br />
problem can be either related to operational practices, deteriorated equipment performance, or<br />
equipment design and it becomes apparent that the potential causes and interactions can become very<br />
complex. For these reasons, some large industrial boiler owner/operators choose to utilize specialized<br />
engineering test contractors that have custom test equipment designed specifically for boiler tune-up<br />
and performance testing.<br />
Since combustion uniformity is a primary concern, considerable insight can be obtained by evaluating<br />
the O2 profile at the economizer exit (or other duct location in close proximity to the boiler O2<br />
analyzer probe). An example of a typical O2 profile is shown in Figure 23-9. Regions of high O2 near<br />
the edges of the duct on balanced draft units typically indicate upstream leaks that should be repaired<br />
before they grow to the point of affecting the boiler O2 analyzer readings. High or low O2 readings in<br />
the center two-thirds of the duct are typically related to combustion conditions back at the burners (or<br />
stoker bed) and should be traced back conceptually to the problem burner(s). <strong>The</strong> O2 profiles shown<br />
in Figure 23-9 can be generated by manually traversing the duct with a probe or with a grid of probes<br />
where individual O2 measure-<br />
Figure 23-7<br />
Typical Gaseous Emissions Probe Sample Grid and Sample System, above and opposite.<br />
< previous page page_266 next page >
previous page page_267 next page ><br />
Page 267<br />
ments are made at each probe location and then interpolated to generate contours. However, a custom<br />
real time multi-point O2 analyzer system has recently been developed to simultaneously measure the<br />
O2 at up to 12 points in the duct and then automatically generate an O2 profile similar to the one<br />
shown previously. This system makes combustion diagnostic testing and boiler tune-ups very<br />
convenient in that adjustments to burner air registers or pulverizers can be made and the results can<br />
be immediately seen in O2 contour which is updated every 10 seconds. This interactive mode of testing<br />
has cut test times by a factor of four, while obtaining more detailed combustion diagnostic informa-<br />
< previous page page_267 next page >
previous page page_268 next page ><br />
Figure 23-8<br />
As-Found and Final Coal Flow Deviations<br />
tion than previously available. <strong>The</strong> system has also been used for NOx emissions and boiler<br />
performance optimization as discussed in the next chapter.<br />
Page 268<br />
Although O2 profiles at the boiler exit are valuable for an assessment of combustion uniformity, a<br />
complete assessment typically involves an evaluation of combustibles and NOx emissions.<br />
Measurements of CO and fly ash carbon content, particularly in low O2 regions of the duct, frequently<br />
provide insight into which burners are limiting the further reduction of the O2 level when optimizing<br />
boiler efficiency. CO emissions measurement can be made with the same gaseous emissions sample<br />
system used for O2, with a portion of the gas sample routed to a CO analyzer. Fly ash samples should<br />
be collected isokinetically on coal fired units in the same sample plane as the gaseous emissions<br />
measurements. However, individual samples from low O2 zones should be kept segregated for<br />
separate ash carbon analysis to correlate and confirm the O2 and/or CO data.<br />
< previous page page_268 next page >
previous page page_269 next page ><br />
Figure 23-9<br />
Typical Economizer Exit O2 Profile Generated with Real Time Multi-Point O2 Analyzer System<br />
Page 269<br />
< previous page page_269 next page >
previous page page_270 next page ><br />
Page 270<br />
Although most boiler owner/operators are primarily concerned about NOx emissions from a<br />
regulatory and air quality standpoint, the value of NOx emissions data as a combustion diagnostic tool<br />
should not be overlooked. Low NOx emissions frequently correlate with low O2 regions and significant<br />
CO or ash carbon levels. High NOx regions typically have little or no combustibles and frequently<br />
correlate well with high O2 regions. <strong>The</strong>refore, NOx emissions data can often be effectively used as<br />
another tool to evaluate combustion uniformity. However, NOx data can only be used in this manner<br />
once the NOx analyzer readings have been corrected to a standard 3 percent O2 basis for comparison.<br />
Synopsis of Diagnostic Techniques<br />
<strong>The</strong> primary objective of these concluding paragraphs is to summarize in one convenient tabulation<br />
the recommended diagnostic techniques highlighted previously. <strong>The</strong> intent is to provide the reader<br />
with an organized listing of diagnostic techniques by problem area that can be used as a guide to<br />
future testing of large industrial boilers.<br />
It is very difficult, almost impossible, to prescribe a pre-packaged diagnostic test program to identify<br />
necessary adjustments, repairs, or changes in boiler firing practice to properly prepare a boiler for<br />
efficiency optimization. However, the diagnostic techniques outlined in this chapter and summarized<br />
in Table 23-1 should serve as a good beginning point. Failure to properly address these issues will<br />
result in a boiler tune-up and recommended operating excess O2 level that is not optimum and does<br />
not reflect the true potential of the original boiler design.<br />
Assuming the diagnostic testing outlined in this chapter has been successfully performed, the next step<br />
is to conduct a boiler efficiency improvement test(s) as outlined in Chapters 8, 9, and 10. If NOx<br />
emissions are a concern as well as boiler efficiency, some of the testing techniques discussed in the next<br />
chapter should also be considered.<br />
References<br />
23-1 McElroy, M., Muzio, L.J., Hack, R.L., <strong>The</strong> New Coking Index Method for Characterizing Fuel<br />
Oil, EPRI Fuel Oil Users Group Meeting, San Antonio, Texas, 1991.<br />
< previous page page_270 next page >
previous page page_271 next page ><br />
TABLE 23-1. Synopsis of Diagnostic Techniques<br />
Problem Area/Problem Technique<br />
FUEL STORAGE, HANDLING, AND PREPARATION<br />
• Residual Oil<br />
Incomplete burnout, coke formation - Inspect atomizer for worn, or plugged passages<br />
Stratification/Separation in storage tank<br />
(table continued on next page)<br />
- Evaluate oil preheat temperature relative to required viscosity<br />
- Check atomizer pressures and possibility of steam condensation (if<br />
steam atomized)<br />
- Determine residual oil coking index (CI)<br />
- Determine Conradson Carbon, Ramsbottom Carbon and Asphaltene<br />
content<br />
- Collect oil samples at different levels in tank<br />
- Perform TGA analysis on samples<br />
- Review delivery receipts and oil transfer records for blending history<br />
- Determine if oil was blended at refinery or in storage tank<br />
- Evaluate oil property data for potential incompatibilities<br />
Page 271<br />
< previous page page_271 next page >
previous page page_272 next page ><br />
TABLE 23-1. Synopsis of Diagnostic Techniques (Continued)<br />
Problem Area/Problem Technique<br />
FUEL STORAGE, HANDLING, AND PREPARATION<br />
• Coal Fuel<br />
Wet coal, poor combustion, unsteady operation - Review coal yard operations and provisions for coal<br />
pile drainage<br />
Delayed ignition, high ash carbon levels - Review coal yard inventory management practices<br />
and possible extended storage<br />
NON-OPTIMUM EXCESS AIR LEVEL<br />
• Air in-leakage upstream of O2 analyzer (balanced draft<br />
units); combustible losses<br />
(table continued on next page)<br />
- Analyze fresh raw coal sample for properties,<br />
particularly volatile content<br />
- Evaluate prepared coal size and fineness<br />
- Inspect, repair pulverizers; adjust classifiers (PC<br />
units)<br />
- Measure flue gas O2 between burner zone and O2<br />
analyzer with water cooled probe<br />
- Inspect casing and ductwork for leaks<br />
Page 272<br />
< previous page page_272 next page >
previous page page_273 next page ><br />
(table continued from previous page)<br />
Problem Area/Problem Technique<br />
NON-OPTIMUM EXCESS AIR LEVEL<br />
- Evaluate O2 profile in exhaust duct at analyzer location<br />
• Incorrect O2 analyzer reading - Recalibrate, inspect dust filters (insitu)<br />
• Insufficient combustion air supply, low O2,<br />
combustibles<br />
NON-UNIFORM COMBUSTION<br />
• Evidence of off-design air/fuel ratio operation in<br />
burner zone; local CO, ash carbon or high O2 levels<br />
at boiler exit<br />
(table continued on next page)<br />
- Inspect sample lines for pluggages, corrosion, leaks<br />
(extractive systems)<br />
- Cross check calibration gases<br />
- Schedule frequent routine calibration<br />
- Check placement of O2 analyzer sensor in duct for<br />
representative location<br />
- Measure O2, CO, and fly ash carbon content at boiler<br />
exit<br />
- Perform air heater leakage and efficiency test<br />
- Measure FD fan performance<br />
- Inspect individual burner air register/damper settings<br />
- Evaluate air register drive operation<br />
Page 273<br />
< previous page page_273 next page >
previous page page_274 next page ><br />
TABLE 23-1. Synopsis of Diagnostic Techniques (Continued)<br />
Problem Area/Problem Technique<br />
NON-UNIFORM COMBUSTION<br />
- Measure O2, CO, and ash carbon profiles at boiler exit near O2 analyzer probe<br />
- Evaluate air heater pressure drop and inspect for local pluggage<br />
- Inspect oil gun and atomizer tip for evidence of coke deposits or pluggage (oil-fired units)<br />
- Measure coal flow distribution between individual burner pipes (pc-fired units)<br />
- Evaluate the windbox design, duct work, and FD fan placement for indications of potential<br />
uneven air flow to individual burners<br />
- Evaluate and correlate O2, CO, ash carbon and NOx profiles at the boiler exit with fuel<br />
flow distribution to individual burners and air register/damper settings<br />
- Adjust fuel and air flows interactively using available instrumentation to achieve uniform<br />
combustion<br />
Page 274<br />
< previous page page_274 next page >
previous page page_275 next page ><br />
24<br />
Large Industrial <strong>Boiler</strong> NOx Control<br />
Regulatory Driving Forces<br />
Page 275<br />
<strong>The</strong> Clean Air Act (CAA) Amendments of 1990 had a major impact on NOx emissions control<br />
primarily for existing utility boilers. <strong>The</strong>se regulations applied to ''major sources" emitting 100 tons<br />
per year or more of any regulated air pollutant. However, many urban areas do not currently comply<br />
with federal air quality standards for ozone and have been classified by EPA as "non-attainment"<br />
areas where more stringent Title I CAA provisions apply. EPA has required states to submit a State<br />
Implementation Plan (SIP) that defines major emission sources, NOx emission limits, and a schedule<br />
for achieving compliance. Although these plans vary widely from state to state, depending upon the<br />
amount of NOx reduction required, they affect industrial boilers in many urban areas. <strong>The</strong> states most<br />
directly affected include California, the Northeast Transportation Corridor states (e.g., New Jersey,<br />
New York, Connecticut, Massachusetts, etc.), Texas, and Illinois.<br />
California currently has some of the most restrictive and complex NOx emission regulations because<br />
the state has thirty-seven separate air quality control districts with different compliance plans. <strong>The</strong><br />
South Coast Air Quality Management District (SCAQMD) in Southern California adopted Rule 1146<br />
which set NOx emission limits at levels that are among the lowest in the country. <strong>The</strong> emission limits<br />
are summarized in Table 24-1. Although the NOx emission limit of 3040 ppm applies to both gas and<br />
oil fuels, it essentially eliminates the possibility of any oil firing except for very low nitrogen special<br />
fuel oils. Several California air quality districts are expected to adopt NOx emission<br />
< previous page page_275 next page >
previous page page_276 next page ><br />
TABLE 24-1. SCAQMD Rule 1146<br />
MMBtu/hr NOx CO<br />
2.5 - 5.0 30 ppm 400 ppm<br />
5.0 - 40 40 ppm 400 ppm<br />
≥ 40 30 ppm 400 ppm<br />
limits similar to Rule 1146. For example, Rule 7 adopted by the Bay Area Air Quality Management<br />
District (BAAQMD) limits NOx emissions to 30 ppm and CO emissions to 400 ppm for firing rates<br />
greater or equal to 10 MMBtu/hr. For these reasons, most industrial boiler/burner equipment<br />
manufacturers have developed low NOx emission burners specifically for the California market.<br />
NOx Control Options<br />
Page 276<br />
<strong>The</strong> NOx control technology being applied to industrial boilers to meet NOx regulations is very similar<br />
to utility boiler technology, except for certain size and fuel type considerations. For example, the<br />
relatively small compact furnace dimensions of an industrial boiler require that low NOx combustion<br />
not substantially increase flame length, causing flame impingement at the walls. <strong>The</strong> reduced furnace<br />
residence time compared to most utility boilers makes it more difficult to apply overfire air, which is<br />
better suited for large industrial boilers. Since many industrial boilers bum more gas and oil fuel than<br />
coal, the NOx control options often used include techniques such as flue gas recirculation to limit<br />
thermal NOx formation. By contrast, this technique is generally ineffective on large coal-fired utility<br />
boilers where NOx emissions are often dominated by conversion of fuel-bound nitrogen to NOx.<br />
<strong>The</strong>rmal NOx formation occurs in the combustion zone at peak flame temperatures where Nitrogen<br />
and Oxygen are fused together. <strong>The</strong> conversion of fuel-bond nitrogen to NOx (i.e., fuel NOx) occurs as<br />
nitrogen contained in the fuel is driven off in the volatilization process and comes in contact with<br />
oxygen in the combustion air.<br />
< previous page page_276 next page >
previous page page_277 next page ><br />
<strong>The</strong> NOx control options most frequently considered for industrial boiler applications include:<br />
• Combustion tuning<br />
• Combustion modifications/staged combustion<br />
• Flue gas recirculation<br />
• Low NOx burners<br />
• Post-Combustion processes<br />
Selective non-catalytic reduction (SNCR)<br />
Selective catalytic reduction (SCR)<br />
Combustion Tuning<br />
Page 277<br />
<strong>The</strong> most cost-effective means of NOx control is combustion tuning and low excess air (LEA) firing.<br />
Although the NOx reductions from combustion tuning may not be large (typically 10 to 20 percent),<br />
they often result in an associated improvement in boiler efficiency and should be the first step in any<br />
NOx control strategy. Every effort should be made to achieve uniform combustion at optimum excess<br />
air levels as outlined previously in Chapters 8 through 10 and Chapter 23. Fuel flow to individual<br />
burners should be balanced to within 5 to 10 percent and air flow should be adjusted to achieve a<br />
uniform air/fuel ratio at each burner before evaluating other combustion modification strategies. Any<br />
equipment malfunction, burner component misalignment or distortion that adversely affects the<br />
combustion process can also impact NOx emissions.<br />
NOx emissions formation is strongly dependent upon the availability of surplus O2 in the flame zone<br />
and therefore low excess air (LEA) firing can result in lower overall NOx emissions. Operation at a<br />
low O2 level minimizes the formation of both thermal NOx and fuel NOx. LEA firing reduces the flue<br />
gas sensible heat loss, resulting in an improvement in boiler efficiency, provided the O2 is not so low<br />
that it has been offset by an increase in combustible losses.<br />
One of the primary attractions of LEA firing is its case of implementation since no physical boiler<br />
modifications are required. In most cases, adjustments to the combustion controls are all that are<br />
required to ensure safe operation over the load range, allowing for possible varia-<br />
< previous page page_277 next page >
previous page page_278 next page ><br />
Page 278<br />
tions in fuel quality. Combustion tuning and LEA firing are recommended prior to considering other<br />
NOx control options because it is important to establish a representative baseline from which to<br />
estimate what additional NOx reductions may be required to meet emission limits. Using NOx<br />
emissions measured under "as-found" boiler operating conditions may result in an artificially high<br />
baseline NOx level. This could result in selecting a NOx control technology with a higher NOx<br />
reduction capability (and cost) than is actually required.<br />
Combustion Modifications/Staged Combustion<br />
Uniform combustion is particularly important to minimize NOx emissions with LEA firing, but<br />
additional NOx reductions can often be achieved by intentionally modifying the combustion to<br />
establish fuelrich and fuel-lean zones. <strong>The</strong>se techniques include biased firing, burners out-of-service<br />
(BOOS) and overfire air (OFA). <strong>The</strong>se techniques are more appropriate for large industrial boilers<br />
with multiple burners on several elevations.<br />
Biased firing involves adjustments to the fuel distribution to direct more fuel to the bottom row(s) of<br />
burners to create a fuel-rich zone where NOx formation is minimized. It may also involve biasing the<br />
air registers on dampers to limit combustion air flow to the lower burners row(s). Biased firing may be<br />
easily implemented on some pulverized coal-fired units by adjustments to the coal feeders, while minor<br />
equipment modifications such as replacement atomizer tips may be required on oil-fired units.<br />
Operation with burners out-of-service (BOOS) is a technique used to establish a form of staged<br />
combustion. Typically, the fuel flow to the one or more burners in the top row is terminated, but the<br />
air registers or dampers are left open passing the normal amount of combustion air. Depending upon<br />
the number of burners remaining in service, the fuel flow to these burners is increased to meet the<br />
total thermal demand. If the remaining burners cannot provide the additional heat input, the boiler<br />
may be derated which can be a major disadvantage. Generally, it is not practical to operate with more<br />
than 25 to 30 percent of the burners out-of-service. <strong>The</strong>refore, this technique is used more often on<br />
large industrial boilers with multiple burners, typically with three or more burner elevations.<br />
NOxformation is limited by fuel-rich operation of the in-service burners with the necessary<br />
combustion air provided by<br />
< previous page page_278 next page >
previous page page_279 next page ><br />
Page 279<br />
the air only burners to reach the desired overall O2 level at the boiler exit. Burners out-of-service<br />
operation on oil fired units may require atomizer tip modifications to pass the additional oil flow. It<br />
may be necessary to drill out the orifices or add additional holes on gas burners. Burners out-ofservice<br />
operation may be difficult on some pulverized coal-fired units depending upon the number of<br />
pulverizers and the burner pattern.<br />
Many of the limitations of burners out-of-service firing can be avoided by implementing overfire air<br />
(OFA) operation. However, it does require the installation of separate OFA ports that pass combustion<br />
air that otherwise would pass through burners. <strong>The</strong> same principles apply as in BOOS except that the<br />
burners operate fuel rich in this case because combustion air has been diverted to the OFA ports<br />
instead of air only burners. All the burners operate with their normal fuel flow which avoids minor<br />
burner tip modifications, but at the expense of OFA port installation. <strong>The</strong> OFA ports are typically<br />
designed to carry 15 to 25 percent of the total combustion air flow and can provide NOx reductions of<br />
25 to 35 percent. <strong>The</strong> OFA ports are generally installed immediately above the top row of burners<br />
because of the convenience in routing duct work from the adjacent windbox. In other cases, the<br />
windbox may be extended to reach the OFA ports. However, the injection of OFA through ports on<br />
the same wall as the burners may not provide good overfire air penetration and mixing with the fuelrich<br />
flow from the burners below. Improved OFA penetration and mixing can often be achieved by<br />
installing OFA ports on the sidewalls (or back wall) depending upon the boiler configuration. This<br />
approach should be considered where high combustion efficiency and very little or no combustible<br />
losses are imperative with heavy oil or solid fuels. <strong>The</strong> retrofit installation of OFA ports usually<br />
requires new furnace wall penetrations, as well as duct work and damper controls, and should not be<br />
attempted without a detailed site specific analysis by a qualified engineering firm.<br />
Flue Gas Recirculation<br />
Flue gas recirculation is a method for controlling NOx formation by injecting combustion products<br />
into the burner flame zone to reduce peak flame temperatures and thermal NOx. It is often premixed<br />
with the combustion air directly upstream of the windbox, but can be injected<br />
< previous page page_279 next page >
previous page page_280 next page ><br />
within the burner. Conventional installations require the installation of a high temperature booster<br />
fan to raise the flue gas from the exhaust duct pressure to the higher windbox pressure.<br />
<strong>The</strong> effect of flue gas recirculation on peak flame temperature is shown in Figure 24-1.<br />
Page 280<br />
<strong>The</strong> use of 20 percent FGR can reduce the flame temperature from 3400ºF to 2900ºF. Since thermal<br />
NOx formation is an exponential function of temperature, the NOx reduction can be dramatic. <strong>The</strong> use<br />
of FGR is most effective with natural gas combustion (which is all thermal NOx) and less effective with<br />
oil fuel combustion where the fuel NOx component can be significant depending upon the fuel nitrogen<br />
content. FGR is relatively ineffective on coal-fired units because the fuel NOx is<br />
Figure 24-1<br />
Effect of Flue Gas Recirculation Rate (FGR) on Flame Temperature<br />
Source: Coen Company, Inc.<br />
< previous page page_280 next page >
previous page page_281 next page ><br />
a major function of the total NOx from industrial boilers.<br />
Page 281<br />
Although FGR is an attractive NOx control option, particularly for natural gas-fired boilers, the<br />
impact on annual operating costs can be significant for industrial boilers. One cost increase is due to<br />
the auxiliary power required by the FGR fan to pump the flue gas from the boiler exhaust duct back<br />
to the burner or combustion air duct. <strong>The</strong> second cost increase is the result of an increase in stack<br />
temperature with FGR and an associated reduction in boiler efficiency as the result of these increased<br />
thermal losses.<br />
An analysis of the impact of FGR on annual operating costs was performed by the Coen Company, Inc.<br />
[24-1] for industrial boilers ranging in size from 50,000 to 200,000 PPH, operating with up to 20<br />
percent induced FGR. <strong>The</strong> increased annual operating costs due to the FGR fan are shown in Figure<br />
24-2. For a typical 100,000 PPH boiler operating with 20 percent FGR, the additional operating cost to<br />
power the fan is<br />
Figure 24-2<br />
Increased Annual Operating Costs Due to FGR Fan<br />
Source: Coen Company, Inc.<br />
< previous page page_281 next page >
previous page page_282 next page ><br />
Page 282<br />
$62,000 per year. <strong>The</strong> additional costs due to boiler stack losses are shown in Figure 24-3 from the<br />
same study. <strong>The</strong>se additional operating costs for the same 100,000 PPH boiler with 20 percent FGR<br />
are $22,000 per year for an annual total cost of $84,000.<br />
<strong>The</strong> increased operating costs summarized above must be combined with equipment capital cost and<br />
installation cost to determine the total cost impact of FGR. Table 24-2 summarizes the total first year<br />
and five year cumulative additional costs of FGR for a 100,000 PPH boiler with a NOx emissions goal<br />
of 30 ppm. Achieving NOx emissions of 30 ppm or less may require FGR rates of up to 20 percent with<br />
current burner technology depending upon the heat release rate of the boiler. Many industrial boilers<br />
are built with high heat release rates in small furnace volumes designed to meet shipping and<br />
installation space constraints. <strong>The</strong> cost analysis summarized in Table 24-2 indicates that the costs of<br />
FGR can become very large for boilers requiring 20 percent FGR or more.<br />
Figure 24-3<br />
Increased Annual Operating Costs Due to FGR Stack Losses<br />
Source: Coen Company, Inc.<br />
< previous page page_282 next page >
previous page page_283 next page ><br />
TABLE 24-2. FGR Additional Costs for a Typical 100,000 PPH <strong>Boiler</strong><br />
Source: Coen Company, Inc.<br />
Expense Item 10% FGR 20% FGR QLN 0% FGR<br />
FGR System & Ductwork $12,500 $12,500 None<br />
Installation Cost $10,000 $10,000 None<br />
Additional BHP Cost for FGR $32,000 $62,000 None<br />
Stack Losses due to FGR $11,000 $22,000 None<br />
Cost for FGR Maintenance $1,000 $1,000 None<br />
Total 1st Year Cost $66,500 $107,500 None<br />
Total Cumulative 5 Year Cost $242,500 $447,500 None<br />
<strong>Boiler</strong>: Typical 100,000 PPH Packaged <strong>Boiler</strong> Emissions Goal: NOx Limits of 30 ppm<br />
Operating Assumptions:<br />
1 Total fan and motor efficiency of 60%.<br />
2. 8400 operating hours/year.<br />
3. Average power cost of $0. 1/HP-hr.<br />
4. Average steam cost of $4.5/1000#.<br />
5. Fuel used is natural gas.<br />
6. Stack temperature is 350ºF.<br />
Page 283<br />
< previous page page_283 next page >
previous page page_284 next page ><br />
Low-NOx Burners<br />
Page 284<br />
<strong>The</strong> trend towards significantly lower NOx emission limits in Southern California, in combination<br />
with the substantial costs of FGR at rates of 20 percent or greater, forced many burner/boiler<br />
manufacturers to develop new burner designs that did not require an FGR system. Some burner<br />
designs were developed that incorporated a form of induced FGR that drew flue gas from the furnace<br />
into the burner without requiring an external FGR fan system. Other Low-NOx burner designs<br />
involve advanced aerodynamic designs that control the initial segregation and eventual controlled<br />
mixing of fuel-rich and air-rich zones.<br />
Due to the wide variety of Low-NOx burner designs and the rapid pace of development, it is<br />
impractical to try to review even the major burner manufacturer's designs, considering the<br />
combination of fuel types, burner ratings, and target NOx emission limits. For these reasons, only a<br />
few selected Low-NOx burner designs will be discussed to provide an introduction to some of the<br />
design concepts currently employed. For those readers interested in more detailed information or<br />
continually monitoring burner development activities, several additional information sources should<br />
be considered:<br />
• Council of Industrial <strong>Boiler</strong> Owners (CIBO) - NOx Control Conference Proceedings [24-2].<br />
• Proceedings of the EPRI/EPA Joint Symposium on Stationary Combustion NOx Control (Utility<br />
<strong>Boiler</strong>s) [24-3].<br />
• Periodic trade magazine articles on industrial <strong>Boiler</strong> NOx control [24-4].<br />
• Industry publications and newsletters on emissions control [24-5 and 24-6].<br />
This list is far from complete and many other excellent publications are available.<br />
Many Low-NOx burners involve some form of staged or stratified combustion. One example is the<br />
QLN burner developed by Coen Company, Inc., shown schematically in Figure 24-4. NOx formation is<br />
initially controlled in a premixed gas/air core zone, which is maintained<br />
< previous page page_284 next page >
previous page page_285 next page ><br />
Page 285<br />
at lean stoichiometric ratios. <strong>The</strong> lean mix zone must be separated from the staged fuel secondary<br />
combustion zone until sufficient heat has been radiated, thereby reducing the gas temperature before<br />
the secondary fuel is introduced. This helps control thermal NOx formation without resorting to the<br />
use of flue gas recirculation. NOx emissions from 12 ppm to 30 ppm have been demonstrated on many<br />
package boilers across the entire turndown range without the use of FGR. NOx emissions of 9 ppm or<br />
less on natural gas are possible with the QLN burner when combined with FGR.<br />
Figure 24-4<br />
Staged Combustion Zones of QLN Burner<br />
Source: Coen Company, Inc.<br />
< previous page page_285 next page >
previous page page_286 next page ><br />
Page 286<br />
Many Low-NOx burners divide the combustion air flow through the burner into separate inner and<br />
outer zones with individual flow control. An example is shown in Figure 24-5. <strong>The</strong> inner primary air<br />
stream passes over a proprietary ''isokinetic" spinner that creates a strong central recirculation zone<br />
immediately downstream that aids in burner stability across the burner firing range. <strong>The</strong> outer<br />
secondary air zone is controlled by a proportioning damper, and a fixed spinner, for flame shaping<br />
and optimization of the air distribution and mixing.<br />
Although many Low-NOx burners involve air staging with carefully controlled mixing, one burner<br />
designer has developed a rapid mixing design that uses induced FGR to achieve NOx levels of less than<br />
10 ppm on natural gas fuel. <strong>The</strong> Radian R-RMB burner shown in Figure 24-6 regulates the<br />
combustion air, FGR, and fuel flow rates with exterior control valves eliminating the need for moving<br />
parts within the burner. <strong>The</strong> natural gas fuel, combustion air and recirculated flue gas are mixed very<br />
rapidly by swirl vanes and gas injectors immediately upstream of the burner throat. This rapid mixing<br />
provides a very stable and compact flame that avoids impingement at the walls. Typical FGR rates<br />
range between 25 and 35 percent. A 5 MMBtu/hr burner had a flame length of approximately three<br />
feet and a 26 MMBtu/hr burner had a flame length of six feet during two different performance<br />
verification tests. <strong>The</strong> burners remain extremely stable across the five to one turndown range<br />
operating on five psig gas pressure with a 6.5 inch draft loss.<br />
<strong>The</strong> California regulations have stimulated the design of a novel natural gas burner concept employing<br />
the use of a porous metal fiber that is formed into a tubular shape. Natural gas and combustion air are<br />
premixed and burn outside the porous surface. NOx emissions of 20 ppm and CO emissions of 50 ppm<br />
have been demonstrated with the Alzeta Corp. Pyromat CSB burner on a 50,000 lb/hr oil field steamer<br />
used in tertiary oil recovery. No FGR or staged combustion are used to achieve these emission levels,<br />
which were less than the applicable regulations of 30 ppm NOx and 400 ppm CO.<br />
<strong>The</strong> preceding discussion of Low-NOx burner designs focused on natural gas or gas/oil designs to<br />
illustrate the design concepts used to meet the low California NOx emission limits. Pulverized coal<br />
combustion Low-NOx burner designs often involve a dual air register design concept similar to Figure<br />
24-5, but operate at higher NOx levels (250 to<br />
< previous page page_286 next page >
previous page page_287 next page ><br />
Figure 24-5<br />
Multi-Staged -Low-NOx Burner with Isokinetic Spinner<br />
Source Coen Company, Inc.<br />
Page 287<br />
< previous page page_287 next page >
previous page page_288 next page ><br />
Figure 24-6<br />
Radian Rapid-Mix Burner (R-RMB)<br />
Source Coen Company, Inc.<br />
Page 288<br />
< previous page page_288 next page >
previous page page_289 next page ><br />
Page 289<br />
330 ppm) due to the difficulty in controlling fuel nitrogen conversion to NOx. <strong>The</strong> Combustion<br />
Engineering RO-II(tm) burner shown in Figure 24-7 is typical of this design. <strong>The</strong> dual air register<br />
design controls the flow of combustion air to the inner pilot air zone and the outer main air zone. <strong>The</strong><br />
air enters these zones through a tangential inlet that performs a swirling action that is further<br />
enhanced by stationary vertical flow vanes. A forced vortex air flow pattern is created around the<br />
circumference of the coal jet that controls the gradual coal/air entrainment necessary to create local<br />
staged combustion. Flame shaping is accomplished<br />
Figure 24-7<br />
Combustion Engineering RO-II(tm) Low-NOx Pulverized Coal Burner<br />
< previous page page_289 next page >
previous page page_290 next page ><br />
Page 290<br />
by proportioning air flow between the pilot and main air zones. Pilot air is directed along the outside<br />
perimeter of the coal nozzle close to the root of the flame. <strong>The</strong> main air represents the largest fraction<br />
of the total secondary air and it exits the burner along the outside perimeter of the burner near the<br />
burner quarl.<br />
<strong>The</strong> primary objective of the preceding discussion was to provide a brief overview of Low-NOx burner<br />
design concepts and typical NOx emission levels. Direct contact with the boiler and burner<br />
manufacturer is recommended to investigate the retrofit potential of individual burner designs before<br />
developing a NOx control strategy or compliance plan.<br />
Post-Combustion NOx Control Options<br />
Post-combustion NOx control options generally involve:<br />
• Selective non-catalytic reduction (SNCR) or<br />
• Selective catalytic reduction (SCR)<br />
SNCR typically involves the injection of ammonia, urea, or similar compounds that react with NOx in<br />
an appropriate temperature range to form nitrogen and water. For ammonia and urea, this<br />
temperature "window" is roughly 1800ºF. At higher temperatures, the injected reagent can be<br />
converted to NOx and at lower temperatures, the reagent may not completely react, leading to<br />
undesirable ammonia emissions. <strong>The</strong> NOx reduction potential of SNCR is very sensitive to the flue gas<br />
temperature at the point of injection and the effectiveness of the mixing with the flue gas. Although the<br />
dimensions of industrial boilers are typically less than utility boilers, making injection design and<br />
mixing easier, access to the desired temperature region for injection may be difficult. <strong>The</strong>refore, NOx<br />
reduction efficiencies can vary from 20 to 70 percent, depending upon site-specific constraints.<br />
SCR is a flue gas treatment process involving the injection of ammonia upstream of a catalyst bed<br />
where ammonia reacts with NOx to form nitrogen and water. NOx reductions of 90 percent or more<br />
are possible with SCR at much lower flue gas temperatures than SNCR. SCR systems are quite<br />
expensive commensurate with the higher NOx reduction, although catalyst prices have been<br />
continuing to decrease.<br />
< previous page page_290 next page >
previous page page_291 next page ><br />
Page 291<br />
SCR systems may find increased use in ozone non-attainment areas as NOx regulations continue to be<br />
lowered to levels where other technologies have difficulty competing.<br />
References<br />
24-1 DeHaan, Thomas E., <strong>The</strong> New QLNTM - A Quantum Leap in Low NOx Technology, Coen Company,<br />
Inc., 1510 Rollins Road, Burlingame, CA 94010.<br />
24-2 Proceedings of the Council of Industrial <strong>Boiler</strong> Owners (CIBO) Annual NOx Control Conferences<br />
19881995, Published by CIBO, 6035 Burne Center Parkway, Burne, VA 22015.<br />
24-3 Proceedings of the EPRI/EPA Semi-Annual Joint Symposium on Stationary Combustion NOx Control,<br />
Published by the Electric Power Research Institute, 3412 Hillview Avenue, Palo Alto, CA 94304.<br />
24-4 NOEmissions Control: Small <strong>Boiler</strong>s Pose Great Challenges, Power Magazine, McGraw-Hill, NY,<br />
December 1994.<br />
24-5 FGD and DeNOx Newsletter, Published by the McIlvaine Co., 2970 Maria Ave., Northbrook, IL<br />
60062.<br />
24-6 <strong>The</strong> NOx Report, Published by Fieldston Publications, Inc., 1920 "N" Street, N.W., Washington,<br />
DC 20036-1613.<br />
< previous page page_291 next page >
previous page page_293 next page ><br />
Appendix A<br />
Combustion-Generated Air Pollutants<br />
Page 293<br />
<strong>The</strong> exhaust gases from all combustion devices contain a variety of byproducts, some of which are<br />
considered environmental pollutants. Some of these pollutants are immediately toxic in themselves<br />
while others pose indirect health hazards by virtue of their ability to react with other pollutants in the<br />
air to form more hazardous compounds. Furthermore, these pollutants also differ by the way they<br />
originate in the combustion processes. Some are more related to the composition of the fuel itself<br />
whereas others are dependent on the characteristics of the actual fuel-burning process and as such are<br />
sensitive to the design and operating variables of the combustion device.<br />
<strong>The</strong> United States Environmental Protection Agency (EPA) has presently identified six major<br />
pollutants and has established emission standards to protect the public health and welfare. <strong>The</strong>se six<br />
"criteria" pollutants are:<br />
1. Particulate matter 4. Carbon monoxide<br />
2. Sulfur dioxide 5. Hydrocarbons<br />
3. Nitrogen oxides 6. Oxidants<br />
Below are brief descriptions of these substances including the principal health effects, their formation<br />
in boiler combustion systems and methods currently used to limit their emissions from boiler stacks.<br />
This information is included in the manual to familiarize boiler operators and others with the major<br />
aspects of combustion pollutants which have prompted action by the EPA and some state and local air<br />
quality agencies to limit these emissions from many sources. Frequently, emission regulations or<br />
pollutant-related operating criteria are imposed but the operators of the combustion devices are not<br />
acquainted with the underlying health and environmental concerns.<br />
< previous page page_293 next page >
previous page page_294 next page ><br />
Particulate Matter<br />
Page 294<br />
Particulate matter is the non-gaseous portion of the combustion exhaust. consisting of all solid and<br />
liquid material (except water droplets) suspended in the exhaust gases. <strong>The</strong>y can be generally defined<br />
as any material that would not pass through a very fine filter. Particulates originating in the<br />
combustion process can range in size from submicron in diameter (less than one millionth of a meter)<br />
to diameters larger than a millimeter (thousandth of a meter). <strong>The</strong> larger particulates do not carry far<br />
in the atmosphere and usually fall to the ground near the source. <strong>The</strong> small particles, which may make<br />
up the bulk of particulate matter. can remain in the atmosphere for long periods of time and<br />
contribute to haze and obscured long-range visibility. <strong>The</strong>se "fine particles" are potentially the most<br />
hazardous to health since they are easily carried into the small passages of the respiratory tract during<br />
normal breathing.<br />
Particulate matter can be composed of a wide variety of materials including unburned fuel. sulfur<br />
compounds, carbon. ash constituents in the fuel (including many toxic metals), and even noncombustible<br />
airborne dust that enters the combustion system with the combustion air. Many of these<br />
materials by themselves are indentified as health hazards and when dispersed in the air in fine<br />
particles. can be inhaled and subsequently absorbed into the body. High concentrations of particulate<br />
matter in the inhaled air can have more direct health effects by irritating or blocking the surfaces of<br />
the respiratory tract leading to temporary or permanent breathing impairments and physical damage.<br />
Oral ingestion of particulate matter is also possible from particulate fall-out onto vegetation and food<br />
crops.<br />
<strong>The</strong> quantity and composition of particulates generated in boilers are influenced by several factors<br />
including the type of fuel being burned, the boiler operating mode, and combustion characteristics of<br />
the burners and furnace. Burner designs and operating modes that tend to promote thorough, efficient<br />
combustion generally will reduce the fraction of combustible material in the particulates. From a<br />
boiler operating standpoint, it is desired to minimize these fuel-derived materials since they represent<br />
wasted<br />
< previous page page_294 next page >
previous page page_295 next page ><br />
Page 295<br />
available fuel energy and can lead to troublesome internal furnace deposits or objectionable smoke at<br />
the stack. Burner and/fuel ratio is one of the more important operating parameters that can influence<br />
the quantity of combustible particulate material generated.<br />
Natural gas and most oil fuels are referred to as "clean burning" fuels primarily due to their lower<br />
tendency to form solid combustibles (smoke, soot, carbon, etc.) and their low ash content. By<br />
comparison, some heavy oils and most coal fuels contain substantial quantities of ash which<br />
subsequently form the bulk of the non-combustible particulate matter generated in the furnace. For<br />
the case of coal, ash can compose up to 20 percent or more of the total weight of fuel burned.<br />
Preventing its accumulation on internal boiler surfaces is a major consideration in the design of the<br />
boiler.<br />
In some boiler designs, most of the coal ash remains in the exhaust gases leaving the boiler, but the use<br />
of various particulate control devices allows low concentrations to be emitted from the stack. Current<br />
devices employ various techniques to remove particulates from the stack gases. <strong>The</strong>se include<br />
filtration, mechanical separation and electrostatic precipitation. Many designs have proven to be<br />
capable of removing more than 99% of the particulates and are also applicable to oil-fired boilers<br />
where particulate controls are required.<br />
Sulfur Dioxide<br />
SO2 is a non-flammable, colorless gas that can be "tasted" in concentrations of less than 1 part per<br />
million in the air. In higher concentrations, it has a pungent, irritating odor.<br />
Sulfur dioxide (chemical symbol, SO2) is formed during the combustion process when sulfur (S)<br />
contained in the fuel combines with oxygen (O2) from the combustion air. Sulfur trioxide (SO3), is<br />
another oxide of sulfur which is also formed in this manner. SO2 together with SO3 comprise the total<br />
oxides of sulfur, generally referred to as "SOx." SO3 is usually no more than 3 to 5 percent of the total<br />
SOx generated in the boiler.<br />
Except for sulfur compounds present in particulate matter, all of the sulfur initially contained in the<br />
fuel is converted to SO2<br />
< previous page page_295 next page >
previous page page_296 next page ><br />
Page 296<br />
and SO3. Before leaving the stack, SO3 can combine with moisture in the exhaust gases to form<br />
sulfuric acid which condenses onto particulates or remains suspended in the stack gases in the form of<br />
an acid mist. In the atmosphere, a portion of the SO2 is converted to SO3 which similarly forms<br />
sulfuric acid by combining with moisture in the air. <strong>The</strong> SO3 can also form other sulfur compounds<br />
such as sulfates.<br />
<strong>The</strong> sulfates and acid mists can contribute significantly to reduced visibility in the atmosphere.<br />
Corrosion of materials exposed to the air and damage to vegetation are other major environmental<br />
effects. <strong>The</strong> health effects of sulfur oxides, sulfuric acids and some of the sulfates are primarily related<br />
to irritation of the respiratory tract. <strong>The</strong>se effects may be temporary or permanent and include<br />
constriction of lung passages and damage to lung surfaces.<br />
<strong>The</strong> quantity of SOx generated in the boiler is primarily dependent on the amount of sulfur in the fuel<br />
and is not highly affected by boiler operating conditions or design. Regulating the quantity of sulfur<br />
allowed in the fuel is a primary method of controlling SOx emissions. Stack gas "scrubbers" which<br />
remove SO2 from the combustion exhaust gases can also be effective where "high sulfur" fuels are<br />
used.<br />
Nitrogen Oxides<br />
Nitric oxide (NO) and nitrogen dioxide (NO2) are the two forms of nitrogen oxides generated by boiler<br />
combustion processes. Together, these compounds are customarily referred to as total oxides of<br />
nitrogen or simply "NOx." NO is a colorless, odorless gas and is not considered a direct threat to<br />
health at concentrations found in the atmosphere. NO2 is a considerably more harmful substance.<br />
Although NO2 comprises typically 5% or less of the NOx emitted from boiler stacks, a large fraction<br />
of the NO is converted to NO2 in the atmosphere.<br />
NO2 is a yellow-brown colored gas which can affect atmospheric visibility. It also has a pungent,<br />
sweetish odor that can be detected at concentrations sometimes reached in polluted air. In much<br />
higher concentrations (100 ppm) NO2 can be fatal when<br />
< previous page page_296 next page >
previous page page_297 next page ><br />
inhaled. Prolonged exposures at much lower concentrations can cause cumulative lung damage and<br />
respiratory disease.<br />
Page 297<br />
NOx is formed spontaneously during the combustion process when oxygen and nitrogen are present at<br />
high temperatures. All three ingredients (oxygen, nitrogen and high temperature) are essential<br />
elements of the combustion process and it would therefore be very difficult to prevent the formation of<br />
NOx altogether. Nitrogen is present in the combustion air and in the fuel itself. Minimizing the fuel<br />
nitrogen content has been shown to reduce NOx but this is not currently a practical NOx control<br />
approach. Most NOx reduction techniques currently applied to boilers are effective as a result of lower<br />
peak flame temperatures in the furnace, reduced availability of oxygen in the flame or a combination<br />
of both. <strong>The</strong>se techniques include low excess air operation, fuel-rich (''staged") firing and flue gas<br />
recirculation. While these approaches limit the formation of NOx in the furnace, future techniques<br />
may be developed that "scrub" the NOx from the exhaust gases before entering the stack. Fuel<br />
desulfurization processes and other fuel "cleaning" treatments may have some associated benefits in<br />
reduced fuel nitrogen content.<br />
Carbon Monoxide<br />
Carbon monoxide (CO) is a product of incomplete combustion and its concentration in boiler exhaust<br />
gas is usually sensitive to boiler operating conditions. For example, improper burner settings,<br />
deteriorated burner parts and insufficient air for combustion can lead to high CO emissions. CO<br />
measurements at the stack are often used as an indicator of poor combustion conditions.<br />
CO is an invisible, odorless, tasteless gas. Exposure to CO-containing exhaust gases produces a well<br />
known "CO poisoning" which can be fatal. CO emitted from boiler stacks are dispersed in the<br />
atmosphere and together with CO from other sources are generally not in high enough concentrations<br />
to produce any immediate health effects (an exception might be in the vicinity of high density<br />
automobile traffic). However, there is concern that long-term exposures to these concentrations may<br />
cause eventual health problems.<br />
< previous page page_297 next page >
previous page page_298 next page ><br />
Hydrocarbons<br />
Page 298<br />
Like carbon monoxide, hydrocarbons are indicative of incomplete or inefficient combustion and can<br />
be essentially eliminated from the boiler stack gases by proper operation of the fuel-burning<br />
equipment. However, this may be misleading since, strictly speaking, hydrocarbons cannot be entirely<br />
eliminated and trace quantities of hydrocarbon compounds will nearly always be present, regardless of<br />
how the boiler is operated.<br />
Due to the tremendous variety of hydrocarbon compounds involved and the unknown health effects of<br />
some of these even in much larger quantities, it is difficult to assess their environmental impact. Some<br />
of these hydrocarbons resemble actual components in the fuel and are rightfully called "unburned<br />
fuel," while others are entirely modified forms generated in complex chemical reactions during the<br />
combustion process.<br />
It is known that hydrocarbon air pollutants are important ingredients in the formation of<br />
photochemical smog. Under certain atmospheric conditions, they can also be transformed into other<br />
derivatives which are potentially more hazardous. Some of the manifestations of smog such as<br />
irritation of the eyes and respiratory tract are in part directly associated with hydrocarbons and their<br />
derivatives.<br />
Oxidants<br />
<strong>The</strong> term "oxidant" is generally applied to oxygen-bearing substances that take part in complex<br />
chemical reactions in polluted atmospheres. <strong>The</strong>se so-called photochemical reactions, which are often<br />
intensified in the presence of sunlight, involve nitrogen oxides and reactive organic substances<br />
(including hydrocarbons and their derivatives) as the principal chemical ingredients. <strong>The</strong>se react to<br />
form new compounds including ozone and PAN (peroxyacyl nitrates) which are usually considered to<br />
be the major oxidants in photo-chemical air pollution ("smog"). <strong>The</strong> term oxidant is also sometimes<br />
used to include the original chemical reactants NOx, hydrocarbons, and others.<br />
While ozone and PAN are not generated directly in the boiler, the principal ingredients (especially<br />
NOx) are supplied in part by<br />
< previous page page_298 next page >
previous page page_299 next page ><br />
Page 299<br />
exhaust gases from the boiler. By reducing the emission of these compounds from boilers and all the<br />
other combustion sources (automobiles, airplanes, etc.), their photochemical byproductsthe<br />
oxidantswill be reduced.<br />
Photochemical oxidants produce adverse effects on vegetable matter which can affect growth, and the<br />
quantity and quality of agricultural yields and other plant products. Deterioration of various materials<br />
(especially rubber) is also a well known occurrence in polluted atmosphere which is attributed mainly<br />
to the presence of ozone.<br />
A major effect on humans is irritation of the eyes. In quantities higher than typically found in polluted<br />
atmospheres, oxidants have an irritating effect on the respiratory tract, producing coughing and<br />
choking. Headache and severe fatigue may be other side-effects. In lower concentrations found in<br />
polluted air, the effects appear less well defined. Aggravation of existing respiratory ailments such as<br />
asthma has sometimes been attributed to oxidants.<br />
< previous page page_299 next page >
previous page page_301 next page ><br />
Appendix B<br />
Conversion Factors<br />
SI Units to Metric or English Units<br />
To Obtain From Multiply By To Obtain ppm at 3% O2<br />
of<br />
g/Mcal ng/J 0.004186<br />
106 Btu GJ 0.948 Natural Gas Fuel<br />
MBH/ft2 GJ ·hr1 ·m2 0.08806<br />
CO<br />
MBH/ft3 GJ ·hr1 ·m-3 0.02684<br />
Btu gm cal 3.9685 × 10³<br />
103 lb/hr* or MBH GJ/hr 0.948<br />
lb/MBtu ng/J 0.00233<br />
ft m 3.281 Oil Fuel<br />
in cm 0.3937<br />
CO<br />
ft2 m2 10.764<br />
ft3 m3 35.314<br />
lb Kg 2.205<br />
HC<br />
NO or NOx<br />
SO2 or SOx<br />
HC<br />
NO or NOx<br />
SO2 or SOx<br />
Fahrenheit Celsius tF = 9/5(tc) + 32<br />
Kelvin tF = 1.8K 460 Coal Fuel<br />
psig Pa Ppsig=(Ppa)(1.450 × 10⁴)<br />
14.7<br />
CO<br />
MultiplyConcentration in ng/J by<br />
3.23<br />
5.65<br />
1.96<br />
1.41<br />
2.93<br />
5.13<br />
1.78<br />
1.28<br />
2.69<br />
(continued)<br />
Page 301<br />
< previous page page_301 next page >
previous page page_302 next page ><br />
(table continued from previous page)<br />
To Obtain From Multiply By To Obtain ppm at 3% O2 of Multiply Concentration in ng/J by<br />
psia Pa Ppsia = (Ppa)(1.450 × 10⁴) HC 4.69<br />
iwg (39.2 F) Pa Piwg = (Ppa)(4.014 × l03) NO or NOx 1.64<br />
*lb/hr of equivalent saturated steam<br />
SO2 or SOx 1.18<br />
Refinery Gas Fuel (Location 33)<br />
CO 3.27<br />
HC 5.71<br />
NO or NOx 1.99<br />
SO2 or SOx<br />
Refinery Gas Fuel (Location 39)<br />
1.43<br />
CO 3.25<br />
HC 5.68<br />
NO or NOx 1.98<br />
SO2 or SOx 1.42<br />
(end)<br />
Page 302<br />
< previous page page_302 next page >
previous page page_303 next page ><br />
English and Metric Units to SI Units<br />
To Obtain From Multiply By To Obtain ng/J of Multiply Concentration in ppm at<br />
3% O2 by<br />
ng/J lb/MBtu 430 0.310<br />
ng/J g/Mcal 239 Natural Gas Fuel 0.177<br />
GJ ·hrl ·m 2 MBH/ft2 11.356<br />
GJ ·hr1 ·m3 MBH/ft3 37.257<br />
GH/hr 103 lb/hr* 1.055 NO or NOx (as equivalent NO2)<br />
or 106 Btu/hr<br />
m ft 0.3048<br />
cm in 2.54<br />
CO<br />
HC<br />
m2 ft2 0.0929 Oil Fuel<br />
m3 ft3 0.02832<br />
Kg lb 0.4536<br />
Celsius Fahrenheit tc=5/9 (tF32)<br />
Kelvin tK=5/9 (tF32) + 273<br />
Pa psig Ppa(Ppsig + 14.7)<br />
(6.895 × 10³)<br />
Pa psia Ppa=(Ppsia)(6.895 ×<br />
103)<br />
Pa iwg (39.2°F) Ppa=(Piwg)(249.1)<br />
*lb/hr of equivalent saturated steam<br />
SO2 or SOx<br />
CO<br />
HC<br />
NO or NOx (as equivalent<br />
NO2)<br />
SO2 or SOx<br />
Coal Fuel<br />
CO<br />
HC<br />
NO or NOx (as equivalent<br />
NO2)<br />
SO2 or SOx<br />
0.510<br />
0.709<br />
0.341<br />
0.195<br />
0.561<br />
0.780<br />
0.372<br />
0.213<br />
0.611<br />
0.850<br />
(continued)<br />
Page 303<br />
< previous page page_303 next page >
previous page page_304 next page ><br />
(table continued from previous page)<br />
To Obtain From Multiply By To Obtain ng/J of Multiply Concentration in ppm at 3% O2 by<br />
Refinery Gas Fuel (Location 33)<br />
CO<br />
HC<br />
NO or NOx (as equivalent NO2)<br />
SO2 or SOx<br />
Refinery Gas Fuel (location 39)<br />
CO<br />
HC<br />
NO or NOx (as equivalent NO2)<br />
SO2 or SOx<br />
0.306<br />
0.175<br />
0.503<br />
0.700<br />
0.308<br />
0.176<br />
0.506<br />
0.703<br />
Page 304<br />
< previous page page_304 next page >
previous page page_305 next page ><br />
Index<br />
A<br />
Adaptive trim control 167, 169, 171<br />
Air:<br />
air-fuel ratio 36, 75<br />
Excess 1-3, 19, 24, 93, 95, 102, 105-106, 121, 125, 146-148, 170-171, 196<br />
non-optimum excess levels 258<br />
pollutants 133, 141, 145, 149, 156, 174, 221-232<br />
preheater 32, 95, 109, 125, 129<br />
American <strong>Boiler</strong> Manufacturers Association (ABMA) 36-39, 158<br />
Annunciators 173<br />
Ash combustible content 98<br />
ASME:<br />
abbreviated efficiency tests 49<br />
calculation methods 45, 62<br />
heat loss calculation method<br />
(see heat loss method)<br />
short form 50-51<br />
test code 29, 49<br />
Atomizing systems 148-149<br />
Auxiliary equipment 24, 45, 52<br />
B<br />
Bay Area Air Quality Management District (BAAQMD) 276<br />
Beers law 84<br />
Biased firing 278<br />
Blowdown 114-115, 150-153, 218-221<br />
<strong>Boiler</strong> characteristics (large) 251<br />
<strong>Boiler</strong> operation:<br />
Page 305
common problems 254<br />
Burner adjustments 78, 106<br />
Burner control system maintenance 110<br />
Burners 145-149<br />
Burners, low NOx, 277, 284, 286, 290<br />
Burners, out-or-service (BOOS) 278-279<br />
C<br />
Carbon monoxide 1, 34-35, 41, 55, 67, 88, 103, 225<br />
Catalytic detector 83<br />
C-E Air Preheater 133<br />
Clean Air Act (CAA) Amendments 275<br />
Coal:<br />
boiler efficiencies 21, 23, 42-43, 59-60, 62, 64-65<br />
fineness 258<br />
flow, unbalanced 264<br />
flow, deviations 265<br />
fuel 257<br />
pulverized 3, 12, 24-25, 32, 34, 257-258<br />
pulverizer/classifier tune-up 258<br />
stoker units 13<br />
Cold end temperatures 133, 135<br />
Combustion:<br />
air temperatures 134<br />
modifications/staged combustion 277-278<br />
< previous page page_305 next page >
previous page page_306 next page ><br />
tuning 277, 278<br />
uniformity 263, 265-266<br />
Combustion Engineering RO-II(tm) burner 289<br />
Condensate return systems 151, 153-155, 217-218<br />
Control:<br />
incomplete 32, 34, 211-212<br />
master 81<br />
systems 13-15, 17-19, 31, 88, 105, 145-146, 165-174<br />
trim 167<br />
Conservation 27<br />
Convective analyzer 79-81<br />
Corrosion 133, 141<br />
Cross-limited metering 172<br />
D<br />
Data recording 96<br />
Deaerators 155<br />
Department of Energy (DOE) 24<br />
Diagnostic testing 261-264<br />
importance of, 252<br />
synopsis of techniques 271<br />
techniques 270<br />
Direct contact condensation heat recovery 225-226<br />
Draft gauges 173<br />
Dry gas losses 41<br />
E<br />
Economizers 32, 95, 109, 137-139, 145, 221-223<br />
Economizer outlet temperatures 138, 140<br />
Efficiencies, boiler 21-25, 29, 36<br />
Efficiency calculations 45-53, 64, 66, 73-74<br />
Page 306
Efficiency computer program 39, 42-43<br />
Electronic:<br />
analyzers 67, 69<br />
control systems 171-178, 185<br />
Emission levels 41<br />
Energy and Cost Efficiency Opportunities (ECRO) 207-210<br />
Envelope, boiler 29<br />
Environmental Protection Agency (EPA) 221<br />
Excess oxygen 1-3, 30, 35-36, 39-41, 44, 48, 55-64, 66-67, 70, 74, 88, 91-92, 110, 165, 167, 173<br />
Exit gas temperatures 133<br />
Extractive analyzer 81-83<br />
F<br />
Fans, blade erosion of 111<br />
Feed water 48, 115, 150<br />
Feed water tubes 137<br />
Firetube boilers 4, 6, 72, 95, 97, 108, 143, 144, 176-177, 196<br />
Firing rate 39-40<br />
Flame appearance 70, 87, 92, 94, 108, 148<br />
Flame scanners 148<br />
Flash steam 191-192, 218<br />
Flow metering 171-172<br />
Flue gas:<br />
analysis 48, 85-86<br />
bypasses 130<br />
recirculation 277<br />
Fly ash reinjection 110<br />
Forced draft fans 136<br />
Fuel:<br />
analysis 5<br />
characteristics of 3, 33<br />
coal 257
previous page page_306 next page >
previous page page_307 next page ><br />
conversions 123<br />
firing systems 12, 148<br />
flow rate 48<br />
handling systems 45<br />
ignition stabilization 136<br />
No. 6 residual oil 254<br />
Nox 276<br />
storage, handling and preparation 254<br />
Flue gas recirculation 279-284<br />
G<br />
Gas:<br />
H<br />
company 93<br />
natural 12, 21, 23, 26, 32, 39-43, 56, 61-62, 64-65, 90, 98, 133<br />
-side deposits 94, 117, 120<br />
stack 1-4, 30-33, 36, 55-62, 70, 71-72, 102, 105, 108-109, 143, 165<br />
Heat exchangers 150<br />
Heat pipe heat exchanger 132<br />
Heat loss 36, 43-44, 55, 62<br />
Heat loss calculation method 45, 48-49, 52<br />
Heat loss graphical solutions 55-66<br />
Heat recovery equipment 21, 24, 30, 32, 116, 149, 224-226<br />
HOT FOIL® COKING INDEX (HFCI) instrument 255<br />
Hydro carbons 226<br />
Hysteresis 183<br />
I<br />
Impurity concentrations 118<br />
Infrared absorption 84-85<br />
Input-output efficiency calculations 45, 48-49, 52<br />
Page 307
Inspection, boiler 67-68<br />
Instrumentation 73, 165-166, 173<br />
Insulation 36, 157-158, 188-190, 215<br />
J<br />
Jackstaff system 15, 18, 167<br />
K<br />
KVB 24-26, 39, 55-62, 68<br />
L<br />
Lag-time 177-179, 183<br />
LEA:<br />
burners 146<br />
firing 278<br />
Limited turndown range 123<br />
Load:<br />
demand 31<br />
management 39, 121-124<br />
peak 39<br />
Log, boiler 95, 98<br />
Low excess air (LEA) firing 277<br />
M<br />
Maintenance, boiler:<br />
improper 34<br />
procedures 93-100<br />
Mechanical profiler 181<br />
Microprocessors 79, 166<br />
Multiple boiler systems 121, 122<br />
N<br />
Nitrogen oxides 224-225<br />
NOx:<br />
control options 276-277
emission levels 133, 137, 145, 147, 149, 165, 174<br />
thermal 276<br />
< previous page page_307 next page >
previous page page_308 next page ><br />
O<br />
O2 profile 266-268<br />
Oil:<br />
fuel 12, 21, 23, 26, 32, 42-43, 57-58, 64-65, 106<br />
fuel atomization 146-147<br />
No. 6 residual 254<br />
Orsat analyzer 67, 75, 98<br />
Outlet temperatures 30-32<br />
Overfire air (OFA) 278-279<br />
Oxidants 256-257<br />
Oxygen:<br />
P<br />
analyzers 77-79, 166-167, 173<br />
control loop 181<br />
excess 2, 3, 35-36, 39-41, 44, 48, 55-67, 70, 87-89, 91, 106, 149, 176<br />
sensors 76, 178<br />
trim control 174-186<br />
Packaged boilers 179<br />
Packaged burner systems 146-147<br />
Paramagnetic oxygen sensor 76<br />
Particulate matter 252<br />
Performance:<br />
deficiency costs 101<br />
goals 94<br />
monitoring 94<br />
Pressure drops 95<br />
Pressure ratio system 171<br />
Pyromat CSB burner 286<br />
Q<br />
Page 308
QLN burner 284-285<br />
Quick steaming boilers 183, 196-197<br />
R<br />
Radian R-RMB 286<br />
Radiation loss 36-38, 48<br />
Recuperative air preheaters 129-130<br />
Recuperative steam coil 134<br />
Refractory maintenance costs 136<br />
Refrigerant desuperheating 224<br />
Regenerative air preheaters 129, 131<br />
Ringlemann scale 70<br />
RotorProbe Sampler 259<br />
Rule 1146 275-276<br />
S<br />
Saturation temperatures 30<br />
Scale formation 153, 154, 214<br />
Selective catalytic reduction (SCR) 277, 290-291<br />
Selective non-catalytic reduction (SNCR) 277, 290<br />
Sensors 176, 178<br />
Smoke density 70, 899, 103, 110, 147<br />
Smoke Spot Number 88, 91<br />
Soot blowers 108, 155-157<br />
Soot formation 108, 120, 129<br />
South Coast Air Quality Management District (SCAQMD)<br />
Rule 1146 275-276<br />
Stack conditions 36, 70<br />
Stack instrumentation 67<br />
State Implementation Plan (SIP) 275<br />
Steam leaks 193, 215-216<br />
Steam pressure, reduction of 113-114<br />
Steam traps 216-217
Stoichiometric ratio 74<br />
< previous page page_308 next page >
previous page page_309<br />
Stokers 13, 16, 34, 45, 48, 110-111, 134<br />
Sulphuric acid concentration 30, 32, 133<br />
Surface radiation losses 121<br />
Superheat recovery 224-225<br />
Survey, BTU 207-210<br />
System lag-time 177-178<br />
T<br />
Temperature, flue gas 41, 55, 62, 65-66, 94, 102, 167<br />
Test precautions 87<br />
Test procedures 67, 87-93<br />
<strong>The</strong>rmal conductivity 117<br />
<strong>The</strong>rmal Insulation Manufacturers Association 159<br />
<strong>The</strong>rmal NOx 276<br />
Threshold level 160<br />
Transient errors 183<br />
Trap flash losses 191-192<br />
Trap leakage<br />
Trim profile 183<br />
Trouble shooting, boiler performance 99-100<br />
Tubes 140<br />
Tube deposits 108<br />
Tube washes 109<br />
Tune-up, boiler 105-111, 207-228<br />
Turbulators, firetube 143, 145, 212-213<br />
V<br />
Viscosity control systems 146, 149<br />
W<br />
Wall blowers 120, 155<br />
Water side deposits 114-115, 118, 120<br />
Page 309
Water treatment 114<br />
Watertube boilers 4, 7, 8-10, 22, 40, 71, 95, 97, 108<br />
Wet electrochemical cells 76, 83<br />
Z<br />
Zirconium oxide cell 77<br />
< previous page page_309