Coefficients of Equilibrium Sorption %IOWY Power Function - Digital ...
Coefficients of Equilibrium Sorption %IOWY Power Function - Digital ...
Coefficients of Equilibrium Sorption %IOWY Power Function - Digital ...

You also want an ePaper? Increase the reach of your titles
YUMPU automatically turns print PDFs into web optimized ePapers that Google loves.
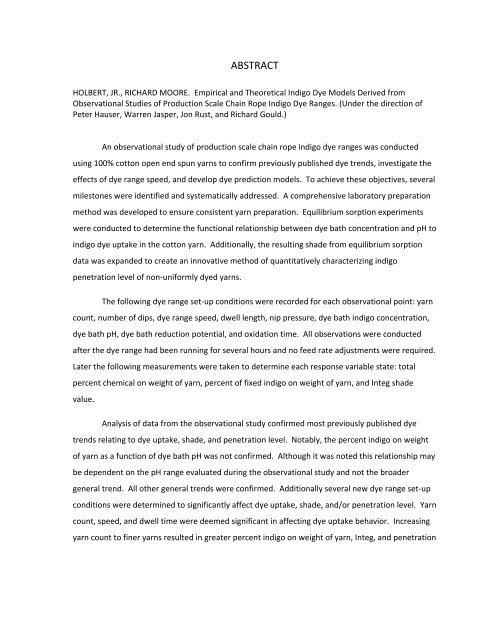
ABSTRACT<br />
HOLBERT, JR., RICHARD MOORE. Empirical and Theoretical Indigo Dye Models Derived from<br />
Observational Studies <strong>of</strong> Production Scale Chain Rope Indigo Dye Ranges. (Under the direction <strong>of</strong><br />
Peter Hauser, Warren Jasper, Jon Rust, and Richard Gould.)<br />
An observational study <strong>of</strong> production scale chain rope indigo dye ranges was conducted<br />
using 100% cotton open end spun yarns to confirm previously published dye trends, investigate the<br />
effects <strong>of</strong> dye range speed, and develop dye prediction models. To achieve these objectives, several<br />
milestones were identified and systematically addressed. A comprehensive laboratory preparation<br />
method was developed to ensure consistent yarn preparation. <strong>Equilibrium</strong> sorption experiments<br />
were conducted to determine the functional relationship between dye bath concentration and pH to<br />
indigo dye uptake in the cotton yarn. Additionally, the resulting shade from equilibrium sorption<br />
data was expanded to create an innovative method <strong>of</strong> quantitatively characterizing indigo<br />
penetration level <strong>of</strong> non-uniformly dyed yarns.<br />
The following dye range set-up conditions were recorded for each observational point: yarn<br />
count, number <strong>of</strong> dips, dye range speed, dwell length, nip pressure, dye bath indigo concentration,<br />
dye bath pH, dye bath reduction potential, and oxidation time. All observations were conducted<br />
after the dye range had been running for several hours and no feed rate adjustments were required.<br />
Later the following measurements were taken to determine each response variable state: total<br />
percent chemical on weight <strong>of</strong> yarn, percent <strong>of</strong> fixed indigo on weight <strong>of</strong> yarn, and Integ shade<br />
value.<br />
Analysis <strong>of</strong> data from the observational study confirmed most previously published dye<br />
trends relating to dye uptake, shade, and penetration level. Notably, the percent indigo on weight<br />
<strong>of</strong> yarn as a function <strong>of</strong> dye bath pH was not confirmed. Although it was noted this relationship may<br />
be dependent on the pH range evaluated during the observational study and not the broader<br />
general trend. All other general trends were confirmed. Additionally several new dye range set-up<br />
conditions were determined to significantly affect dye uptake, shade, and/or penetration level. Yarn<br />
count, speed, and dwell time were deemed significant in affecting dye uptake behavior. Increasing<br />
yarn count to finer yarns resulted in greater percent indigo on weight <strong>of</strong> yarn, Integ, and penetration
level. Increasing dye range speed resulted in less percent indigo on weight <strong>of</strong> yarn, lighter Integ<br />
shade, and lower penetration level or more ring dyeing. And, increasing dwell time resulted in<br />
lighter Integ shade.<br />
Using the dye range set-up conditions and measured response variables from the<br />
observational study data, empirical and dye theory models were constructed to predict percent<br />
indigo on weight <strong>of</strong> yarn, Integ shade, and the resulting penetration level. An independent<br />
production scale indigo dye range, which was not included in dye model creation, was used to<br />
validate <strong>of</strong> each model for accurate prediction <strong>of</strong> percent indigo on weight <strong>of</strong> yarn, Integ shade, and<br />
corresponding penetration level. The dye model predictions were compared to actual production<br />
scale indigo dyed cotton yarns. By making adjustments in yarn porosity values the dye theory model<br />
outperformed the empirical model in predicting final Integ shade although both models accurately<br />
predicted the total percent indigo on weight <strong>of</strong> yarn.
© Copyright 2011 by Richard Moore Holbert, Jr.<br />
All Rights Reserved
Empirical and Theoretical Indigo Dye Models Derived from Observational Studies <strong>of</strong> Production Scale<br />
Chain Rope Indigo Dye Ranges<br />
Warren Jasper<br />
Jon Rust<br />
by<br />
Richard Moore Holbert, Jr.<br />
A dissertation submitted to the Graduate Faculty <strong>of</strong><br />
North Carolina State University<br />
in partial fulfillment <strong>of</strong> the<br />
requirements for the Degree <strong>of</strong><br />
Doctor <strong>of</strong> Philosophy<br />
Fiber and Polymer Science<br />
Raleigh, North Carolina<br />
2011<br />
APPROVED BY:<br />
Richard Gould<br />
Peter Hauser<br />
Chair <strong>of</strong> Advisory Committee
BIOGRAPHY<br />
Richard Moore Holbert, Jr. was born on March 18, 1971 in Charlotte, NC. He graduated with a high<br />
school diploma from North Mecklenburg High School in 1989. He received a Bachelor <strong>of</strong> Science<br />
degree in Mechanical Engineering and Master <strong>of</strong> Science in Textile Engineering and Mechanical<br />
Engineering from North Carolina State University in 1994 and 1997 respectively.<br />
In 1997 he married Avian Kay and began working at Swift Denim in Erwin, NC denim facility. He<br />
started working as a process engineer in the finishing and indigo dye house departments. After 8<br />
years with the company he transferred to the Society Hill, SC piece dye plant in 2005. There he<br />
assumed the role <strong>of</strong> director <strong>of</strong> global product development. In December 2010, Avian and he were<br />
blessed with the arrival <strong>of</strong> Aleaha Louise Holbert.<br />
ii
ACKNOWLEDGEMENTS<br />
I would like to whole heartily thank my loving wife. After so many years <strong>of</strong> missed family weekends,<br />
outings, birthdays, and occasional holiday gatherings; it is a wonder she has stayed by my side.<br />
Without my laboratory assistant I doubt I would have ever finished this research.<br />
To Ge<strong>of</strong>f Gettilife and all the technicians at Swift Denim's Boland plant, I would like to thank you.<br />
I'd like to thank my research committee. I know this process has taken longer than I (or you)<br />
envisioned, but I believe this work is a perfect example <strong>of</strong> the "ends justifying the means".<br />
iii
TABLE OF CONTENTS<br />
List <strong>of</strong> Tables vi<br />
List <strong>of</strong> Figures ix<br />
List <strong>of</strong> Equations xv<br />
1. Indigo Dyeing Principles: Review <strong>of</strong> Current Knowledge 1<br />
1.1 Commercial Indigo Dyeing 2<br />
1.2 Indigo Chemistry 7<br />
1.2.1 Indigo Reduction or Vatting 7<br />
1.2.2 Classification <strong>of</strong> Indigo Dye Species 10<br />
1.2.3 Indigo dyeing Measurement Methods 14<br />
1.3 Characteristics <strong>of</strong> Indigo Dyed Yarns 19<br />
1.4 Dye Theory 32<br />
1.4.1. Fundamental Sequence <strong>of</strong> Events during Dyeing 32<br />
1.4.2 Fick's Law <strong>of</strong> Diffusion 34<br />
1.4.3. Diffusional boundary Layer 41<br />
1.4.4. Empirical Simplifications <strong>of</strong> Diffusion 44<br />
1.5 Indigo Dyeing Experiments 49<br />
1.5.1. Previous Investigations and Methods on Indigo Dyeing 49<br />
1.5.2. Discussion <strong>of</strong> Previously Published Experimental Results 58<br />
1.6 Summary <strong>of</strong> Key Developments and Identification <strong>of</strong> Deficiencies 83<br />
2. Objectives <strong>of</strong> the Present Investigation 86<br />
3. Experimental Methods and Procedures 89<br />
3.1 Response Variables Definition, Collection Methods, and Evaluation Methods 89<br />
3.1.1 Yarn Skein Definition and Creation 89<br />
3.1.2 Running Yarn Skeins on Production Indigo Dye Range Equipment 89<br />
3.1.3 Yarn Skein Evaluations 90<br />
3.2 Determining Optimum Method for Laboratory Preparation 97<br />
3.2.1 Analysis <strong>of</strong> Laboratory Preparation Time, Temperature, and Sodium Hydroxide<br />
Concentration Affect on %Boil-<strong>of</strong>f Loss 101<br />
3.2.2 Analysis <strong>of</strong> Laboratory Preparation Time, Temperature, and Sodium Hydroxide<br />
Concentration Affect on <strong>%IOWY</strong> after One and Six Dip Indigo Dyeing Conditions 106<br />
3.2.3 Analysis <strong>of</strong> Laboratory Preparation Time, Temperature, and Sodium Hydroxide<br />
Concentration Affect on Integ Shade Value after One and Six Dip Indigo Dyeing<br />
Conditions 114<br />
3.2.4 Analysis <strong>of</strong> Laboratory Preparation Time, Temperature, and Sodium Hydroxide<br />
Concentration Affect on Penetration Factor after One and Six Dip Indigo Dyeing<br />
Conditions 119<br />
3.2.5 Determine Optimum Settings for Laboratory Preparation Procedure 126<br />
iv
3.3 <strong>Equilibrium</strong> <strong>Sorption</strong> Experiment to Determine <strong>%IOWY</strong> and Shade Relationship for<br />
Uniformly Dyed Skeins 130<br />
3.4 Observational Indigo Study: Establishing Breadth <strong>of</strong> Dye Conditions and<br />
Convergence Test to Determine Conclusion <strong>of</strong> Study 141<br />
4. Data Analysis from the Observational Study 146<br />
4.1 Review <strong>of</strong> Main Parameter Affects on Response Variables Obtained from<br />
Observational Study 146<br />
4.2 Empirical Dye Models Based on Dye Range Parameters and the Resulting<br />
Affect on Indigo Dye Response Variables 170<br />
4.2.1 %COWY Empirical Model Generation 170<br />
4.2.2 <strong>%IOWY</strong> Empirical Model Generation 176<br />
4.2.3 Integ Empirical Model Generation 183<br />
4.2.4 Penetration Level Empirical Model Generation 188<br />
4.3 Theoretical Model for Indigo Dye Process 196<br />
4.3.1 Derivation <strong>of</strong> Theoretical Dye Model 196<br />
4.3.2 Algorithm to Calculate the Dye <strong>Coefficients</strong> 218<br />
4.3.3 Spatial and Time Step Optimization 219<br />
4.3.4 Determination <strong>of</strong> Indigo Dyeing Coefficient Models 219<br />
4.3.5 Algorithm to Calculate the %COWY, <strong>%IOWY</strong>, and Integ Shade 237<br />
5. Empirical and Theoretical Dye Model simulation and validation 239<br />
5.1 Simulation <strong>of</strong> Empirical and Dye Theory models on Third Independent Dye Range 239<br />
5.1.1 Actual Versus Predicted %COWY 240<br />
5.1.2 Actual Versus Predicted <strong>%IOWY</strong> 243<br />
5.1.3 Actual Versus Predicted Integ Shade Value 246<br />
5.1.4 Actual Versus Predicted Penetration Level 249<br />
5.1.5 Summary <strong>of</strong> Dye Theory Model Compared with Empirical Model 252<br />
5.2 Simulation <strong>of</strong> Empirical and Dye Theory Models to Actual Production Yarn 256<br />
6. Summary <strong>of</strong> Results, Discussions, and Recommendations 267<br />
References 274<br />
Appendix 279<br />
v
LIST OF TABLES<br />
1. Indigo Dyeing Principles: Review <strong>of</strong> Current Knowledge<br />
Table 1-1: Typical Stock Mix. 9<br />
Table 1-2: A typical indigo stock mix formula. 9<br />
Table 1-3: Additional indigo stock mix recipes. 10<br />
Table 1-4: Estimated diffusion coefficients for disperse Red 11 (D, cm 2 /sec x 10 -10 ). 43<br />
Table 1-5: Regression values for three parameter emphirical solution. 48<br />
Table 1-6: Concentration <strong>of</strong> alkali system. 49<br />
Table 1-7: Etters 1989 data set. 51<br />
Table 1-8: Annis and Etters 1991 data set. 52<br />
Table 1-9: Etters 1991 <strong>Equilibrium</strong> sorption <strong>of</strong> indigo on cotton obtained from different<br />
pHs in grams <strong>of</strong> dye per 100 grams <strong>of</strong> water(bath) or fiber. 54<br />
Table 1-10: Dye concentrations required to yield equivalent shade at different pHs. 55<br />
Table 1-11: % reflectance and corrected K/S values for different dyebath concentrations<br />
and pH. 56<br />
2. Objectives <strong>of</strong> the Present Investigation<br />
3. Experimental Methods and Procedures<br />
Table 3-1: Target dyed yarn sample weight for Methyl Pyrrolidinone extraction. 93<br />
Table 3-2: Time, temperature, and sodium hydroxide concentration levels plus<br />
response variable for one dip <strong>of</strong> indigo. 99<br />
Table 3-3: Time, temperature, and sodium hydroxide concentration levels plus<br />
response variable for six dips <strong>of</strong> indigo. 100<br />
Table 3-4: ANOVA analysis results for laboratory preparation parameters on %Boil-<strong>of</strong>f loss. 105<br />
Table 3-5: ANOVA analysis results for laboratory preparation parameters on<br />
<strong>%IOWY</strong> for one dip <strong>of</strong> indigo. 111<br />
Table 3-6: ANOVA analysis results for laboratory preparation parameters on<br />
<strong>%IOWY</strong> for six dips <strong>of</strong> indigo. 113<br />
Table 3-7: ANOVA analysis results for laboratory preparation parameters on<br />
Integ for one dip <strong>of</strong> indigo. 118<br />
Table 3-8: ANOVA analysis results for laboratory preparation parameters on<br />
Integ for six dips <strong>of</strong> indigo. 119<br />
Table 3-9: ANOVA analysis results for laboratory preparation parameters on<br />
penetration factor from one dip <strong>of</strong> indigo. 123<br />
Table 3-10: ANOVA analysis results for laboratory preparation parameters on<br />
penetration factor from six dips <strong>of</strong> indigo. 125<br />
Table 3-11: <strong>%IOWY</strong> and Integ shade data from equilibrium sorption experiment. 132<br />
Table 3-12: Observational study parameters and potential range <strong>of</strong> values. 141<br />
Table 3-13: Prime data set in the observational study. 142<br />
vi
4. Data Analysis from the Observational Study<br />
Table 4-1: ANOVA analysis results from the prime data set on %COWY. 171<br />
Table 4-2: ANOVA analysis for %COWY from the entire data set. 173<br />
Table 4-3: ANOVA analysis from the prime data set on <strong>%IOWY</strong>. 177<br />
Table 4-4: Effects test from <strong>%IOWY</strong> ANOVA analysis for the entire data set<br />
with pH component. 179<br />
Table 4-5: ANOVA analysis for the <strong>%IOWY</strong> from the entire data set. 180<br />
Table 4-6: ANOVA analysis <strong>of</strong> Integ shade from the prime data set. 183<br />
Table 4-7: ANOVA analysis for Integ from the entire data set. 185<br />
Table 4-8: ANOVA analysis results from the prime data set and penetration level. 189<br />
Table 4-9: Effect tests for all data points with speed and pH interaction. 191<br />
Table 4-10: Final empirical model ANOVA analysis for all data sets. 192<br />
Table 4-11: ANOVA analysis results for fiber diffusion coefficient. 221<br />
Table 4-12: ANOVA analysis results for yarn diffusion coefficient. 225<br />
Table 4-13: ANOVA analysis for wet pick-up coefficient. 229<br />
Table 4-14: ANOVA analysis results for wash reduction coefficient. 232<br />
Table 4-15: ANOVA analysis results for oxidation rate coefficient. 235<br />
5. Empirical and Theoretical Dye Model simulation and validation<br />
Table 5-1: Canadian dye range set-up conditions used for simulation. 239<br />
Table 5-2: ANOVA analysis results <strong>of</strong> empirical model to actual measured %COWY. 241<br />
Table 5-3: ANOVA analysis results <strong>of</strong> dye theory model to actual measured %COWY. 242<br />
Table 5-4: ANOVA analysis results <strong>of</strong> empirical model to actual measured <strong>%IOWY</strong>. 244<br />
Table 5-5: ANOVA analysis results <strong>of</strong> dye theory model to actual measured <strong>%IOWY</strong>. 245<br />
Table 5-6: ANOVA analysis results <strong>of</strong> empirical model to actual measured Integ. 247<br />
Table 5-7: ANOVA analysis results <strong>of</strong> dye theory model to actual measured Integ. 248<br />
Table 5-8: ANOVA analysis results <strong>of</strong> empirical model to actual measured<br />
penetration level. 250<br />
Table 5-9: ANOVA analysis results <strong>of</strong> dye theory model to actual measured<br />
penetration level. 251<br />
Table 5-10: ANOVA analysis results <strong>of</strong> empirical model indirect penetration<br />
level to actual measured penetration level. 256<br />
Table 5-11: Production Yarn Dye Range Set-up Conditions. 257<br />
Table 5-12: Measured, Empirical Model, and Dye Theory Model <strong>%IOWY</strong> and Integ values. 257<br />
Table 5-13: ANOVA analysis results <strong>of</strong> empirical model to actual measured<br />
production yarn <strong>%IOWY</strong>. 259<br />
Table 5-14: Calculated porosity value to fit Dye theory model <strong>%IOWY</strong> to<br />
production yarn results. 259<br />
Table 5-15: ANOVA analysis results <strong>of</strong> dye theory model to actual measured<br />
production yarn <strong>%IOWY</strong>. 261<br />
Table 5-16: ANOVA analysis results <strong>of</strong> empirical model to actual measured<br />
production yarn Integ. 262<br />
vii
Table 5-17: ANOVA analysis results <strong>of</strong> dye theory model to actual measured<br />
production yarn Integ. 264<br />
Table 5-18: ANOVA analysis results <strong>of</strong> dye theory model calculated porosity<br />
value to dye range speed. 265<br />
6. Summary <strong>of</strong> Results, Discussions, and Recommendations<br />
Table 6-1: Empirical model performance review. 271<br />
Table 6-2: Dye theory model performance review. 271<br />
Appendix<br />
Table A-3-1: % Reflectance <strong>of</strong> mock dyed 100% cotton yarns used to calculate K/S. 282<br />
Table A-3-3: <strong>%IOWY</strong> and Integ shade data from equilibrium sorption experiment. 283<br />
Table A-4-1: Prime and replica raw data set. 284<br />
Table A-4-2a: Convergence test - standard errors from empirical model %COWY parameter. 370<br />
Table A-4-2b: Convergence test - standard errors from empirical model <strong>%IOWY</strong> parameter. 370<br />
Table A-4-2c: Convergence test - standard errors from empirical model Integ parameter. 371<br />
Table A-4-2d: Convergence test - standard errors from empirical model penetration level<br />
parameter. 371<br />
Table A-5-1: Independent dye range raw data set. 396<br />
viii
LIST OF FIGURES<br />
1. Indigo Dyeing Principles: Review <strong>of</strong> Current Knowledge<br />
Figure 1-1: Typical dye range equipment to apply indigo dye. 2<br />
Figure 1-2: Pre-scour section on long chain indigo dye range. 3<br />
Figure 1-3: Indigo dye boxes on long chain dye range. 4<br />
Figure 1-4: Wash and dry section <strong>of</strong> long chain indigo dye range. 5<br />
Figure 1-5: Re-circulation system on long chain indigo dye range to maintain dye<br />
box uniformity. 6<br />
Figure 1-6: Oxidized and reduced form <strong>of</strong> indigo dye. 8<br />
Figure 1-7: Various forms <strong>of</strong> indigo: I - Oxidized, II - Reduced acid leuco,<br />
III - Monophenolate, and IV - Biphenolate. 11<br />
Figure 1-8: Fraction <strong>of</strong> leuco reduced indigo as a function <strong>of</strong> pH. 14<br />
Figure 1-9: Specific Absorptivity <strong>of</strong> oxidized and reduced indigo as a function <strong>of</strong> wavelength. 15<br />
Figure 1-10: Redox potential curve <strong>of</strong> reduced indigo undergoing oxidation<br />
by sodium hypochlorite. 16<br />
Figure 1-11: Calibration curve <strong>of</strong> Sahin laser diode spectrometer. 17<br />
Figure 1-12: Kubelka-Munk analysis <strong>of</strong> downward and upward components <strong>of</strong> light flux. 19<br />
Figure 1-13: Calculated R-square values for blue, red, and yellow dyes at various<br />
surface reflectances. 24<br />
Figure 1-14: Calculated y intercepts for blue, red, and yellow dyes. 25<br />
Figure 1-15: Comparison <strong>of</strong> original K/S and corrected K/S for blue, red, and yellow dyes. 26<br />
Figure 1-16: Examples <strong>of</strong> limited ring dyeing on the left, medium in the middle,<br />
and high degree <strong>of</strong> ring dyeing on the right picture. 27<br />
Figure 1-17: Pre-scour caustic concentration effect <strong>of</strong> dye uptake. 28<br />
Figure 1-18: Typical reflectance values for indigo dyed denim yarn - 6.3/1 open end<br />
yarn at 31 m/min, 2.3 g/l, 11.9 pH, and 6 dips. 29<br />
Figure 1-19: Typical corrected K/S values for indigo dyed denim yarn - 6.3/1 open end<br />
yarn at 31 m/min, 2.3 g/l, 11.9 pH, and 6 dips. 29<br />
Figure 1-20: Distribution <strong>of</strong> indigo dye and penetration level in denim yarn. 30<br />
Figure 1-21: Basic sequence <strong>of</strong> events in dyeing fibers. 33<br />
Figure 1-22: Graphical solution <strong>of</strong> Fick's 2nd Law for Diffusion in long cylinders. 38<br />
Figure 1-23: Predicted fractional dye uptake as a functin <strong>of</strong> dimensionless time at<br />
various flow rates. 42<br />
Figure 1-24: Red 11 dye desorption at various oscillating speeds. 44<br />
Figure 1-25: Mt / M∞ as a function <strong>of</strong> Dt/r 2 for various values <strong>of</strong> E∞. 47<br />
Figure 1-26: Effect <strong>of</strong> oxidation time on color. 58<br />
Figure 1-27: Effect <strong>of</strong> reduction agent concentration on shade. 59<br />
Figure 1-28: Effect <strong>of</strong> immersion time on shade. 60<br />
Figure 1-29: Chong's effect <strong>of</strong> immersion time on uncorrected K/S. 61<br />
Figure 1-30: Relationship between number <strong>of</strong> dips and shade. 62<br />
Figure 1-31: Chong's relationship between number <strong>of</strong> dips and uncorrected K/S. 63<br />
Figure 1-32: Relationship between dye bath concentration and shade. 64<br />
Figure 1-33: Chong's relationship between dye bath concentration and uncorrected K/S. 65<br />
ix
Figure 1-34: pH effect <strong>of</strong> shade with other parameters held constant. 66<br />
Figure 1-35: K/S shade vs % indigo on weight <strong>of</strong> yarn at various pH’s. 67<br />
Figure 1-36: Non-equilibrium Concentration <strong>of</strong> dye in fiber (g/100g) vs concentration<br />
<strong>of</strong> dye in bath (g/100g). 68<br />
Figure 1-37: <strong>Equilibrium</strong> isotherm for dye concentration in dye bath and fiber (g/100g). 69<br />
Figure 1-38: Logarithmic plot <strong>of</strong> equilibrium isotherms for dye concentration. 70<br />
Figure 1-39: Mean technical distribution as a function <strong>of</strong> dyebath pH. 71<br />
Figure 1-40: Apparent reflectance absorptivity coefficient vs pH. 72<br />
Figure 1-41: Reflectance absorptivity coefficient as a function <strong>of</strong> mean technical<br />
distribution coefficient. 73<br />
Figure 1-42: Relationship <strong>of</strong> Mono-ionic species <strong>of</strong> indigo and pH. 74<br />
Figure 1-43: Relationship between mean technical distribution coefficient and<br />
fraction <strong>of</strong> indigo existing as mono-ionic form. 75<br />
Figure 1-44: Correlation <strong>of</strong> fractional distribution <strong>of</strong> apparent absorptivity<br />
coefficient and mono-ionic form <strong>of</strong> indigo as a function <strong>of</strong> pH. 76<br />
Figure 1-45: Indigo concentration in dye bath required to produce a given shade<br />
depth at various pH’s from a 5 dip laboratory dyeing. 77<br />
Figure 1-46: Effect <strong>of</strong> dye bath concentration and pH on dye uptake. 78<br />
Figure 1-47: Yarn dye uptake as a function <strong>of</strong> dye bath concentration and pH. 79<br />
Figure 1-48: Corrected depth <strong>of</strong> shade as a linear function <strong>of</strong> indigo concentration<br />
in yarn and dyebath pH. 80<br />
Figure 1-49: Estimated concentration <strong>of</strong> unfixed indigo on yarn at corresponding<br />
dye bath concentration and pH. 81<br />
2. Objectives <strong>of</strong> the Present Investigation<br />
3. Experimental Methods and Procedures<br />
Figure 3-1: Relationship <strong>of</strong> maximum K/S shade shift as depth increases. 95<br />
Figure 3-2: Relationship <strong>of</strong> K/S by wavelength as a function <strong>of</strong> <strong>%IOWY</strong>. 96<br />
Figure 3-3: Relationship <strong>of</strong> time on %boil-<strong>of</strong>f loss during laboratory preparation. 101<br />
Figure 3-4: Relationship <strong>of</strong> sodium hydroxide concentration on %Boil-<strong>of</strong>f loss<br />
during laboratory preparation. 102<br />
Figure 3-5: Relationship <strong>of</strong> temperature on %Boil-<strong>of</strong>f loss during the laboratory preparation. 103<br />
Figure 3-6: Interaction pr<strong>of</strong>ile for time, temperature, and sodium hydroxide concentration<br />
on %boil-<strong>of</strong>f loss during laboratory preparation process. 104<br />
Figure 3-7: %Boil-<strong>of</strong>f loss model as a function <strong>of</strong> time (seconds), temperature (C),<br />
and sodium hydroxide concentration (g/l) in laboratory preparation process. 106<br />
Figure 3-8: Relationship <strong>of</strong> laboratory preparation time on <strong>%IOWY</strong> after one<br />
and six dips <strong>of</strong> indigo dye. 107<br />
Figure 3-9: Relationship <strong>of</strong> sodium hydroxide concentration during laboratory<br />
preparation on <strong>%IOWY</strong> from one and six dips <strong>of</strong> indigo dye. 108<br />
Figure 3-10: Relationship <strong>of</strong> temperature during laboratory preparation on <strong>%IOWY</strong><br />
from one and six dips <strong>of</strong> indigo dye. 109<br />
Figure 3-11: Interaction pr<strong>of</strong>ile for time, temperature, and sodium hydroxide concentration<br />
on <strong>%IOWY</strong> after one and six dips <strong>of</strong> indigo dye. 110<br />
x
Figure 3-12: <strong>%IOWY</strong> for one dip <strong>of</strong> indigo model as a function <strong>of</strong> time, temperature,<br />
and sodium hydroxide concentration in laboratory preparation process. 112<br />
Figure 3-13: <strong>%IOWY</strong> for six dips <strong>of</strong> indigo model as a function <strong>of</strong> time, temperature,<br />
and sodium hydroxide concentration in laboratory preparation process. 114<br />
Figure 3-14: Relationship <strong>of</strong> laboratory preparation time on Integ shade value from<br />
one and six dips <strong>of</strong> indigo dye. 115<br />
Figure 3-15: Relationship <strong>of</strong> sodium hydroxide concentration during laboratory preparation<br />
on Integ shade value after one and six dips <strong>of</strong> indigo dye. 116<br />
Figure 3-16: Relationship <strong>of</strong> temperature during laboratory preparation on Integ shade<br />
value after one and six dips <strong>of</strong> indigo dye. 117<br />
Figure 3-17: Relationship <strong>of</strong> time during laboratory preparation on penetration factor<br />
after one and six dips <strong>of</strong> indigo dye. 120<br />
Figure 3-18: Relationship <strong>of</strong> sodium hydroxide concentration during laboratory preparation<br />
on penetration factor after one and six dips <strong>of</strong> indigo dye. 121<br />
Figure 3-19: Relationship <strong>of</strong> temperature during laboratory preparation on penetration<br />
factor after one and six dips <strong>of</strong> indigo dye. 122<br />
Figure 3-20: Interaction pr<strong>of</strong>ile for time, temperature, and sodium hydroxide concentration<br />
on penetration factor after one and six dips <strong>of</strong> indigo dye. 123<br />
Figure 3-21: Penetration factor for one dip <strong>of</strong> indigo model as a function <strong>of</strong> time, temperature,<br />
and sodium hydroxide concentration in laboratory preparation process. 124<br />
Figure 3-22: Penetration factor for six dips <strong>of</strong> indigo model as a function <strong>of</strong> time, temperature,<br />
and sodium hydroxide concentration in laboratory preparation process. 126<br />
Figure 3-23: Optimized laboratory preparation parameters incorporating prediction pr<strong>of</strong>iles<br />
from %Boil-<strong>of</strong>f loss and <strong>%IOWY</strong> from one dip <strong>of</strong> indigo dye. 128<br />
Figure 3-24: Optimized laboratory preparation parameters incorporating prediction pr<strong>of</strong>iles<br />
from %Boil-<strong>of</strong>f loss and <strong>%IOWY</strong> from six dips <strong>of</strong> indigo dye. 129<br />
Figure 3-25: <strong>%IOWY</strong> from 6.3/1, 7.1/1, 8.0/1, and 12.0/1 OE yarns compared to Etters 20 data<br />
under equilibrium sorption at pH 13 range. 133<br />
Figure 3-26: <strong>%IOWY</strong> on 6.3/1, 7.1/1, 8.0/1, and 12.0/1 OE yarns compared to Etters 20 data<br />
under equilibrium sorption at pH 11 range. 134<br />
Figure 3-27: <strong>Power</strong> function coefficients A and B as a function <strong>of</strong> dye bath pH. 135<br />
Figure 3-28: <strong>Equilibrium</strong> sorption power function coefficients as a function <strong>of</strong><br />
monophenolate ionic form <strong>of</strong> indigo. 136<br />
Figure 3-29: Comparison <strong>of</strong> calculated and measured <strong>%IOWY</strong> under equilibrium sorption<br />
laboratory dyeing conditions as the dye bath concentration and pH were varied. 137<br />
Figure 3-30: Relationship <strong>of</strong> Integ shade value for various yarn counts as <strong>%IOWY</strong> from<br />
equilibrium sorption. 138<br />
Figure 3-31: Relationship <strong>of</strong> <strong>%IOWY</strong> on the outside surface for various yarn counts as Integ<br />
from equilibrium sorption. 139<br />
Figure 3-32: Shape <strong>of</strong> K/S at 660 nm as a function <strong>of</strong> <strong>%IOWY</strong> from equilibrium sorption<br />
experiments. 140<br />
Figure 3-33: Range <strong>of</strong> observational study dye range set-up conditions and interactions. 143<br />
Figure 3-34: Affect <strong>of</strong> additional replicated data sets on standard error <strong>of</strong> indigo dye bath<br />
concentration parameter and four response variables after one dip <strong>of</strong> indigo. 145<br />
xi
4. Data Analysis from the Observational Study<br />
Figure 4-1: Number <strong>of</strong> dips affect on %COWY and <strong>%IOWY</strong> for all data points. 146<br />
Figure 4-2: Build curve relationship for %COWY as a function <strong>of</strong> number <strong>of</strong> dips on<br />
6.3/1 yarn count at similar speed, pH, and reduction potential. 147<br />
Figure 4-3: Build curve relationship for <strong>%IOWY</strong> as a function <strong>of</strong> number <strong>of</strong> dips on<br />
6.3/1 yarn count at similar speed, pH, and reduction potential. 148<br />
Figure 4-4: Integ shade value as a function <strong>of</strong> number <strong>of</strong> indigo dye box dips for<br />
all data points. 149<br />
Figure 4-5: Integ shade value as a function <strong>of</strong> number <strong>of</strong> dips on 6.3/1 yarn count at<br />
similar speed, pH, and reduction potential. 150<br />
Figure 4-6: Penetration level for all data points as a function <strong>of</strong> the number <strong>of</strong> dips. 151<br />
Figure 4-7: Penetration level as a function <strong>of</strong> number <strong>of</strong> dips on 6.3/1 yarn count at<br />
similar speed, pH, and reduction potential. 152<br />
Figure 4-8: %COWY for all data points as a function <strong>of</strong> dye bath concentration after<br />
one, three, and six dips. 153<br />
Figure 4-9: <strong>%IOWY</strong> for all data points as a function <strong>of</strong> dye bath concentration after<br />
one, three, and six dips. 154<br />
Figure 4-10: Integ shade value as a function <strong>of</strong> dye bath concentration at various<br />
numbers <strong>of</strong> dips. 155<br />
Figure 4-11: Penetration level for all data points as a function <strong>of</strong> dye bath concentration<br />
within each dip. 156<br />
Figure 4-12: Illustrates %COWY, <strong>%IOWY</strong>, Integ, and penetration level varies with<br />
yarn count and dye concentration after six dips. 158<br />
Figure 4-13: Speed affect on %COWY, <strong>%IOWY</strong>, Integ, penetration level at various<br />
dye bath concentrations after six dips <strong>of</strong> indigo on 6.3/1 yarn. 160<br />
Figure 4-14: pH affect on %COWY, <strong>%IOWY</strong>, Integ, penetration level at various<br />
dye bath concentrations after six dips <strong>of</strong> indigo on 6.3/1 yarn. 162<br />
Figure 4-15: Reduction potential affect on %COWY, <strong>%IOWY</strong>, Integ, and penetration level<br />
at various dye bath concentrations after six dips <strong>of</strong> indigo on 6.3/1 yarn. 164<br />
Figure 4-16: Dwell length affect on %COWY, <strong>%IOWY</strong>, Integ, and penetration level at<br />
various dye bath concentrations after six dips <strong>of</strong> indigo on 6.3/1 yarn. 166<br />
Figure 4-17: Dwell time affect on %COWY, <strong>%IOWY</strong>, Integ, and penetration level at<br />
various dye bath concentrations after six dips <strong>of</strong> indigo on 6.3/1 yarn. 168<br />
Figure 4-18: Nip pressure affect on %COWY, <strong>%IOWY</strong>, Integ, and penetration level at<br />
various dye bath concentrations after six dips <strong>of</strong> indigo on 6.3/1 yarn. 169<br />
Figure 4-19: Convergence test for empirical %COWY model. 172<br />
Figure 4-20: Comparison <strong>of</strong> actual versus predicted %COWY for the entire data set. 175<br />
Figure 4-21: %COWY prediction pr<strong>of</strong>ile for dye range set-up condition affect on %COWY<br />
from the empirical model. 176<br />
Figure 4-22: Convergence test for the empirical <strong>%IOWY</strong> model. 178<br />
Figure 4-23: Comparison <strong>of</strong> actual and predicted <strong>%IOWY</strong> from the final empirical model. 181<br />
Figure 4-24: Prediction pr<strong>of</strong>ile for <strong>%IOWY</strong> and dye range set-up parameters. 182<br />
Figure 4-25: Convergence test for empirical model Integ. 184<br />
Figure 4-26: Comparison <strong>of</strong> actual and empirical model predicted Integ shade values. 186<br />
xii
Figure 4-27: Prediction pr<strong>of</strong>ile for Integ shade values as a function <strong>of</strong> each dye<br />
range set-up conditions. 187<br />
Figure 4-28: Convergence test for empirical model penetration level. 190<br />
Figure 4-29: Comparison between actual and predicted penetration level. 194<br />
Figure 4-30: Prediction pr<strong>of</strong>ile <strong>of</strong> empirical model penetration level as a function <strong>of</strong><br />
dye range set-up parameters. 195<br />
Figure 4-31: Nodal mesh arrangement and nomenclature for finite difference<br />
method implementation. 205<br />
Figure 4-32: Fiber diffusion coefficients for each yarn count as the oxidation rate changes. 215<br />
Figure 4-33: Yarn diffusion coefficients for each yarn count as a function <strong>of</strong> oxidation rate. 216<br />
Figure 4-34: Wet pick-up variation within yarn counts as a function <strong>of</strong> oxidation rate. 217<br />
Figure 4-35: Standard deviations as a function <strong>of</strong> oxidation rate. 218<br />
Figure 4-36: Comparison <strong>of</strong> model predicted and actual fiber diffusion coefficient. 222<br />
Figure 4-37: Effective fiber diffusion functional relationship to dye range set-up conditions. 223<br />
Figure 4-38: Comparison <strong>of</strong> model predicted and actual yarn diffusion coefficient. 226<br />
Figure 4-39: Effective yarn diffusion functional relationship to dye range set-up conditions. 227<br />
Figure 4-40: Comparison <strong>of</strong> model predicted and actual wet pick-up coefficient. 230<br />
Figure 4-41: Dye theory model wet pick-up functional relationship to dye range<br />
set-up conditions. 231<br />
Figure 4-42: Comparison <strong>of</strong> model predicted and actual wash reduction. 233<br />
Figure 4-43: Dye theory model wash reduction functional relationship to dye range<br />
set-up conditions. 234<br />
Figure 4-44: Comparison <strong>of</strong> model predicted and actual oxidation rate. 236<br />
Figure 4-45: Dye theory model oxidation rate functional relationship to dye range<br />
set-up conditions. 237<br />
5. Empirical and Theoretical Dye Model simulation and validation<br />
Figure 5-1: Empirical model predicted %COWY compared to actual measured values. 240<br />
Figure 5-2: Dye theory model predicted %COWY compared to actual measured values. 242<br />
Figure 5-3: Empirical model predicted <strong>%IOWY</strong> compared to actual measured values. 243<br />
Figure 5-4: Dye theory model predicted <strong>%IOWY</strong> compared to actual measured values. 245<br />
Figure 5-5: Empirical model predicted Integ compared to actual measured values. 246<br />
Figure 5-6: Dye theory model predicted Integ compared to actual measured values. 248<br />
Figure 5-7: Empirical model predicted penetration level compared to actual measured values. 249<br />
Figure 5-8: Dye theory model predicted penetration level compared to actual measured<br />
values. 251<br />
Figure 5-9: Indigo build pr<strong>of</strong>ile for Canadian dye range set-up on 443 shade<br />
with 29 m/min, 1.26 g/l dye bath concentration and 12.2 pH. 253<br />
Figure 5-10: Indigo build pr<strong>of</strong>ile for Canadian dye range set-up on 418 shade with<br />
32 m/min, 1.66 g/l dye bath concentration and 11.8 pH. 254<br />
Figure 5-11: Indigo build pr<strong>of</strong>ile for Canadian dye range set-up on 471 shade with<br />
32 m/min, 2.09 g/l dye bath concentration and 12.1 pH. 254<br />
Figure 5-12: Empirical model predicted indirect penetration level compared to<br />
actual measured values. 255<br />
xiii
Figure 5-13: Empirical model predicted <strong>%IOWY</strong> compared to actual measured values<br />
from production yarns. 258<br />
Figure 5-14: Dye theory model predicted <strong>%IOWY</strong> compared to actual measured values<br />
from production yarns. 260<br />
Figure 5-15: Empirical model predicted Integ compared to actual measured values<br />
from production yarns. 262<br />
Figure 5-16: Dye theory model predicted Integ compared to actual measured values<br />
from production yarns. 263<br />
Figure 5-17: <strong>Function</strong>al relationship between theoretical porosity value and<br />
dye range speed. 265<br />
6. Summary <strong>of</strong> Results, Discussions, and Recommendations<br />
xiv
LIST OF EQUATIONS<br />
1. Indigo Dyeing Principles: Review <strong>of</strong> Current Knowledge<br />
Equation 1-1: First law <strong>of</strong> thermodynamics. 6<br />
Equation 1-2: Example calculation <strong>of</strong> percent indigo shade. 7<br />
Equation 1-3: Reaction <strong>of</strong> sodium dithionite and sodium hydroxide. 8<br />
Equation 1-4: First ionization <strong>of</strong> indigo dye. 11<br />
Equation 1-5: First associated equilibrium ionization constant. 12<br />
Equation 1-6: Second ionization <strong>of</strong> indigo dye. 12<br />
Equation 1-7: Second associated equilibrium ionization constant. 12<br />
Equation 1-8: Indigo fractional form calculation based on pH and respective pka values. 13<br />
Equation 1-9: Change in downward flux by Kubelka-Munk. 20<br />
Equation 1-10: Change in upward flux by Kubelka-Munk. 20<br />
Equation 1-11: Kubelka-Munk reflectance equation. 20<br />
Equation 1-12: Kubelka-Munk equation for light absorbance and scattering. 21<br />
Equation 1-13: Correction to Kubelka-Munk for light reflectance properties <strong>of</strong> mock dyed<br />
substrate. 21<br />
Equation 1-14: Corrected Kubelka-Munk to account for surface reflectance. 22<br />
Equation 1-15: Relationship <strong>of</strong> K/S corrected to dye bath concentration. 22<br />
Equation 1-16: L*, a*, and b* equations based on the tristimulus values as defined by CIELAB. 23<br />
Equation 1-17: Calculation <strong>of</strong> Integ as a function <strong>of</strong> K/S values, average observer, and<br />
standard light source. 23<br />
Equation 1-18: Adjusting K/Scorr for non-uniformly distributed dye. 31<br />
Equation 1-19: Fick's first law <strong>of</strong> diffusion. 35<br />
Equation 1-20: Fick's second law <strong>of</strong> diffusion. 36<br />
Equation 1-21: Expansion <strong>of</strong> Fick's second law <strong>of</strong> diffusion into cylindrical coordinate system. 36<br />
Equation 1-22: Reduction <strong>of</strong> Fick's second law <strong>of</strong> diffusion to radial component only. 36<br />
Equation 1-23: Non-steady state solution to equation 1-21. 37<br />
Equation 1-24: Solution <strong>of</strong> diffusion from constant initial concentration. 37<br />
Equation 1-25: Hill's solution <strong>of</strong> dye concentration under infinite dye bath conditions. 39<br />
Equation 1-26: Newman's solution <strong>of</strong> dye concentration under infinite dye bath conditions that<br />
contain surface barrier effects. 40<br />
Equation 1-27: Definition <strong>of</strong> L term utilized in Newman's dye concentration solution. 40<br />
Equation 1-28: Othmer-Thakar relationship for diffusion coefficient in dilute aqueous solutions. 41<br />
Equation 1-29: Vickerstaff one parameter approximate solution for dye distribution. 44<br />
Equation 1-30: Urbanik two parameter approximate solution for dye distribution. 45<br />
Equation 1-31: Etters three parameter approximate solution for dye distribution. 45<br />
Equation 1-32: Etters empirical fit equation to calculate parameters in three parameter<br />
approximate solution <strong>of</strong> dye distribution when L is 20 to infinity. 46<br />
Equation 1-33: Etters empirical fit equation to calculate parameters a in three parameter<br />
approximate solution <strong>of</strong> dye distribution when L is 1 to 20. 46<br />
Equation 1-34: Etters empirical fit equation to calculate parameters b in three parameter<br />
approximate solution <strong>of</strong> dye distribution when L is 1 to 20. 46<br />
xv
Equation 1-35: Etters empirical fit equation to calculate parameters c in three parameter<br />
approximate solution <strong>of</strong> dye distribution when L is 1 to 20. 47<br />
Equation 1-36: Etters relationship for apparent diffusion coefficient and three parameter<br />
estimates. 48<br />
Equation 1-37: Calculation <strong>of</strong> Integ as a function <strong>of</strong> K/S values, average observer, and<br />
standard light source. 57<br />
Equation 1-38: Mono-ionic fraction form <strong>of</strong> indigo dye as function <strong>of</strong> pH. 73<br />
Equation 1-39: Definition <strong>of</strong> technical distribution coefficient. 82<br />
Equation 1-40: Approximation for technical distribution coefficient as a function <strong>of</strong> dye bath pH. 82<br />
Equation 1-41: Empirical model <strong>of</strong> apparent reflectance absorptivity coefficient. 82<br />
2. Objectives <strong>of</strong> the Present Investigation<br />
3. Experimental Methods and Procedures<br />
Equation 3-1: Calculation <strong>of</strong> %Boil <strong>of</strong>f loss. 91<br />
Equation 3-2: Calculation <strong>of</strong> %COWY. 91<br />
Equation 3-3: Calculation <strong>of</strong> <strong>%IOWY</strong>wash. 91<br />
Equation 3-4: Calculation <strong>of</strong> <strong>%IOWY</strong> by Methyl Pyrrolidinone extraction. 92<br />
Equation 3-5: Calculation <strong>of</strong> <strong>%IOWY</strong> in terms <strong>of</strong> 100% indigo paste from Methyl Pyrrolidinone<br />
extracts. 93<br />
Equation 3-6: Calculation <strong>of</strong> K/S from Kubelka-Munk. 94<br />
Equation 3-7: Calculation <strong>of</strong> Integ shade value from K/S values. 94<br />
Equation 3-8: Calculation <strong>of</strong> penetration factor from Integ and <strong>%IOWY</strong>. 97<br />
Equation 3-9: %Boil-<strong>of</strong>f loss as a function <strong>of</strong> time, temperature, and sodium hydroxide<br />
concentration. 105<br />
Equation 3-10: <strong>%IOWY</strong> as a function <strong>of</strong> time, temperature, and sodium hydroxide<br />
concentration after one dip <strong>of</strong> indigo. 111<br />
Equation 3-11: <strong>%IOWY</strong> as a function <strong>of</strong> time, temperature, and sodium hydroxide<br />
concentration after six dips <strong>of</strong> indigo. 113<br />
Equation 3-12: Calculation <strong>of</strong> penetration level as a function <strong>of</strong> measured <strong>%IOWY</strong> and<br />
converted surface <strong>%IOWY</strong> from Integ shade reading. 130<br />
Equation 3-13: <strong>Power</strong> function relationship <strong>of</strong> indigo dye bath concentration to <strong>%IOWY</strong> under<br />
equilibrium sorption. 134<br />
Equation 3-14: General relationships between indigo dye bath concentration and pH to<br />
resulting <strong>%IOWY</strong> under equilibrium sorption. 136<br />
Equation 3-15: Calculation <strong>of</strong> Integ shade based on <strong>%IOWY</strong> under equilibrium sorption. 139<br />
Equation 3-16: Calculation <strong>of</strong> surface <strong>%IOWY</strong> from Integ shade values. 139<br />
4. Data Analysis from the Observational Study<br />
Equation 4-1: Empirical model %COWY as a function <strong>of</strong> dye range set-up conditions. 174<br />
Equation 4-2: Empirical model <strong>%IOWY</strong> as a function <strong>of</strong> dye range set-up conditions. 181<br />
Equation 4-3: Empirical model Integ as a function <strong>of</strong> dye range set-up conditions. 186<br />
Equation 4-4: Empirical model penetration level as a function <strong>of</strong> dye range set-up conditions. 193<br />
Equation 4-5: Ozisik diffusion coefficient calculation in external medium. 197<br />
Equation 4-6: Fick's first and second law <strong>of</strong> diffusion. 200<br />
Equation 4-7: Transient second order partial differential <strong>of</strong> mass diffusion in radial direction. 200<br />
xvi
Equation 4-8: Crank-Nicholson explicit finite difference model for mass diffusion. 201<br />
Equation 4-9: Actual <strong>%IOWY</strong> based on maximum possible <strong>%IOWY</strong> and fractional relationship. 202<br />
Equation 4-10: Crank's expression for the fractional relationship <strong>of</strong> dye pick-up. 202<br />
Equation 4-11: Maximum <strong>%IOWY</strong> from equilibrium sorption experiments. 202<br />
Equation 4-12: Fractional relationship between indigo leaving the dye bath stream and dye<br />
diffused into the cotton fiber. 203<br />
Equation 4-13: Initial dye distribution at t
Appendix<br />
Equation A-1-1: oz/gal <strong>of</strong> 20% indigo related by %T by spectrophotometric method. 280<br />
Equation A-1-2: Calculation <strong>of</strong> total alkalinity by titration method. 281<br />
xviii
1 Indigo Dyeing Principles: Review <strong>of</strong> Current Knowledge<br />
Indigo is a vat dye which was probably one <strong>of</strong> the oldest known coloring agents and has<br />
been used to dye fabric for thousands <strong>of</strong> years. In fact, it is thought that this ancient dye was the<br />
first naturally occurring blue colorant discovered by primitive man. The origin <strong>of</strong> the name “indigo”<br />
can be traced back to the word “Indic” which means <strong>of</strong> India. Indigo has also been greatly valued by<br />
the Chinese. Egyptian Mummy cloths have been discovered that were dyed with the “ntinkon”, a<br />
blue dye having all the properties <strong>of</strong> indigo.<br />
Today, the indigo used in commercial dyeing <strong>of</strong> denim yarn is no longer <strong>of</strong> natural origin.<br />
After 12 years <strong>of</strong> research by Adolf von Baeyer, a method <strong>of</strong> laboratory synthesis <strong>of</strong> indigo was<br />
discovered in 1880. By 1897 the first commercial form <strong>of</strong> indigo based on Baeyer’s method<br />
appeared on the market. After the turn <strong>of</strong> the 20 th century, synthetic indigo gradually replaced<br />
natural dye worldwide. Over the last hundred plus years more indigo dye has been produced than<br />
any other single dye.<br />
Even though indigo is classified as a vat dye, it does not perform like other vat dyes because<br />
it has little affinity for cotton. Compared to other vat dyes, indigo has inferior fastness properties.<br />
But these poor performance properties are indeed the very nature <strong>of</strong> the dye which makes it so<br />
popular. Due to the poor fastness properties, a desirable blue shade develops when indigo dyed<br />
denim is laundered repeatedly.<br />
If indigo was introduced today, not many dyers or chemists would be interested. In fact, it<br />
might not even leave the lab compared to today’s requirements for commercializing a new dye.<br />
Zollinger noted in 1988 19 , “Were it not for the persistence <strong>of</strong> the denim fashion, indigo would hardly<br />
be produced or used at all today.” This statement still rings true today. Given the extensive use <strong>of</strong><br />
indigo in commercial dyeing applications, one would speculate the literature would be filled with<br />
fundamental experiments and knowledge <strong>of</strong> the use and driving properties <strong>of</strong> this important dye. At<br />
last, until recently this is not the case. It wasn’t until the end <strong>of</strong> the 1980’s when the Southeastern<br />
Section <strong>of</strong> the AATCC committee lead by investigations <strong>of</strong> J.N. Etters that significant research<br />
revealed the physico-chemical mechanisms <strong>of</strong> the sorption <strong>of</strong> indigo by cellulosic materials.<br />
1
1.1 Commercial Indigo Dyeing<br />
Indigo dye (C.I. Vat Blue 1) is insoluble in water. In order to effectively be used it must be<br />
reduced to the leuco-soluble form using a suitable reducing agent with an alkali such as sodium<br />
hydroxide. There are three main types <strong>of</strong> dye ranges used in traditional indigo dyeing which are<br />
summarized below and shown in figure 1-1.<br />
1. The long chain or rope type dye range which is characterized by multiple dye boxes that<br />
allows great production rate and flexibility.<br />
2. The sheet or slasher dye range which can have multiple boxes but with reduced<br />
production capability.<br />
3. The looptex dye range which has a common dye box. This machine has limited number <strong>of</strong><br />
dip capability. Figure 1-1 graphically illustrates the three types <strong>of</strong> machines.<br />
Figure 1-1: Typical dye range equipment to apply indigo dye. 1<br />
2
The majority <strong>of</strong> denim yarns dyed with indigo utilizes the 6-dip (or more) continuous rope<br />
dye range. A typical rope dye range will process 20 to 40 ropes <strong>of</strong> yarns at a time. The exact<br />
number will be predetermined by machine layout and subsequent slasher restrictions. 300-400<br />
individual yarns make up a single rope. The final number <strong>of</strong> ropes will equate to 2 to 4 slasher sets.<br />
This characteristic allows the continuous rope dye range to produce uniformly dyed yarn at great<br />
production rates in a variety <strong>of</strong> shades.<br />
Before the cotton yarns can be dyed with indigo, the cotton must be prepared. The prescouring<br />
process shown in figure 1-2 involves two main objectives. First the cotton is chemically<br />
cleaned with a penetrant, sequestering agent, and sodium hydroxide solution. Typical sodium<br />
hydroxide concentrations range from 10-25 g/l although higher levels (mercerization strength) are<br />
used to create unique dye characteristics. The main purpose is to remove natural waxes and oils<br />
from the cotton fibers. During this stage sulfur dyes are commonly added to enhance the final<br />
indigo dye shade. Multiple wash boxes follow the scour box to rinse contaminants from the yarns.<br />
The last benefit <strong>of</strong> the pre-scour section is to remove all excess air trapped in the yarns. Excess air in<br />
the yarns will prematurely oxidize the reducing agent and possibly indigo in the dye boxes causing<br />
the entire system to fall out <strong>of</strong> reduction.<br />
Figure 1-2: Pre-scour section on long chain indigo dye range. 1<br />
3
After the last wash box in the pre-scouring section, the yarns are immediately immersed<br />
into the first indigo dye box. There are two main ways to “build” the amount <strong>of</strong> indigo on weight <strong>of</strong><br />
yarn. 1. Indigo concentration in the dye boxes. 2. The total number <strong>of</strong> dips. Each “dip” is<br />
characterized by submerging the yarn into the dye liquor for 15-60 seconds with a “W” type thread-<br />
up. Then excess dye liquor is squeezed from the yarns by using 4-5 ton nip which typically produces<br />
70 – 90% wet pick-up. “Skying” after each nip allows natural air oxidation <strong>of</strong> the leuco indigo.<br />
Typical sky times are 1+ minute. By chaining multiple dips together as shown in figure 1-3, the<br />
indigo shade can be built to the final desired depth. Most commercial dye ranges have 4 to 8<br />
successive dye boxes although some extreme new machines are being manufactured with 12 indigo<br />
dye boxes. The maximum amount <strong>of</strong> indigo applied in any one dye box is approximately 2% <strong>of</strong> 20%<br />
indigo paste. Therefore, approximately 6 dips are required to produce a “12%” indigo shade.<br />
Figure 1-3: Indigo dye boxes on long chain dye range. 1<br />
Following the dye boxes, the yarns are washed to remove excess alkali and any unfixed<br />
surface dye. During this stage sulfur dye “tops” can be applied to further enhance the indigo shade.<br />
Figure 1-4 shows washing begins with cool water around 80°F in the first wash box and the<br />
temperature is gradually increased by 20 degrees in each subsequent box. The final wash box is<br />
4
usually around 140°F. Just before drying begins, typically a beaming aid is applied to improve<br />
beaming efficiency.<br />
Figure 1-4: Wash and dry section <strong>of</strong> long chain indigo dye range. 1<br />
Of course the main purpose <strong>of</strong> indigo dyeing is to apply indigo to the yarn. Indigo dyeing<br />
occurs in an infinite bath condition because uniform dye concentration is maintained throughout<br />
the dyeing process by the addition <strong>of</strong> make-up dye. Uniform dye concentration throughout all the<br />
dye boxes is therefore paramount. Uniformity is achieved by re-circulating the dye liquor while<br />
additional dye is metered into the range. Typical circulation system is shown in figure 1-5. Each dye<br />
box is cross connected by 4 inch pipes located at the bottom <strong>of</strong> each box. Dye liquor is pulled from<br />
the bottom <strong>of</strong> the vats by a circulation pump. The circulated liquor plus indigo and chemical feed<br />
make-up is returned to each box near the top. Dye overflow is typically on the top <strong>of</strong> the first dye<br />
box. This overflow is typically captured and re-used later.<br />
5
Figure 1-5: Re-circulation<br />
system on loong<br />
chain indigoo<br />
dye range to mmaintain<br />
dye boox<br />
uniformity. 1<br />
Since dye liquor l is circuulated<br />
through<br />
the dye boxxes<br />
to maintaain<br />
uniform cooncentrationss,<br />
the<br />
indigoo<br />
dye boxes can c be modeleed<br />
as one giant<br />
dye box. TThe<br />
conservattion<br />
<strong>of</strong> mass principle for a<br />
controol<br />
volume undergoing<br />
a prrocess<br />
can bee<br />
expressed as<br />
equation 1--1.
The purpose <strong>of</strong> measuring the indigo concentration in the dye liquor is to maintain a<br />
constant dye concentration so the net change in mass within the control volume equals zero.<br />
Therefore the total mass entering equals total mass leaving the dye box. Total mass entering the<br />
dye box is generally known. The concentration <strong>of</strong> indigo stock mix is predetermined and the feed<br />
rate is measured by flow meters. The total mass leaving the system is divided into two components.<br />
1. Indigo pick-up in the cotton yarns. 2. Indigo in the overflow from indigo dye box. Typical indigo<br />
shades are expressed in terms <strong>of</strong> % indigo shades. This is calculated by dividing the pounds <strong>of</strong> indigo<br />
per hour by the pounds <strong>of</strong> cotton per hour. For example:<br />
3.75 pound/gallon indigo stock mix<br />
78.3 gallons/hour indigo stock mix feed rate<br />
293.6 pounds <strong>of</strong> indigo/hour feed rate<br />
3673 pounds cotton/hour<br />
293.6/3673=8.0% indigo shade<br />
Equation 1-2: Example calculation <strong>of</strong> % indigo shade<br />
The approach shown in equation 1-2 neglects the indigo mass component in the overflow.<br />
For a more accurate % indigo shade calculation, the mass <strong>of</strong> the discharged indigo must be<br />
considered. Additionally, unfixed indigo removed from the dye bath on the yarn but later removed<br />
during the washing process must be accounted for. Due to the complexity <strong>of</strong> measuring these<br />
discrepancies, many indigo dyers refer to equation 1-2 for its simplicity.<br />
1.2 Indigo Chemistry<br />
1.2.1 Indigo Reduction or Vatting<br />
Reduced indigo is called leuco indigo and is yellow in color. Leuco indigo can dye cellulose<br />
materials and will later be oxidized back to blue color. The traditional reducing agent is sodium<br />
dithionite also called sodium hydrosulphite or simply hydro. Other reducing agents fill special<br />
demands and have not gained large practical acceptance. Hydro is extremely sensitive to<br />
7
atmospheric oxygen. Oxidation <strong>of</strong> hydro is accompanied by consuming sodium hydroxide, NaOH,<br />
when atmospheric oxygen is present in the alkaline medium.<br />
The reduction <strong>of</strong> indigo dye requires two chemical processes as shown in equation 1-3 and<br />
figure 1-6. Caustic and sodium hydrosulfite react to liberate two hydrogen atoms which react with<br />
the two carbonyl groups (C = O) on the indigo molecule. Additional sodium hydroxide reacts with C<br />
– OH group to form C – ONa group which solubilizes the dye into leuco indigo.
hydrosulphite are used to reduce indigo. An example <strong>of</strong> a typical indigo stock mix formula is given in<br />
table 1-1.<br />
Table 1-1: Typical Stock Mix.<br />
As is As is % OWI 100% Total Theory Excess Excess<br />
#/Gal g/l<br />
g/l Moles Moles Moles g/l<br />
Indigo 3.75 450 -- 90 0.343 0.343 -- --<br />
Caustic 1.50 180 40 112.5* 2.813 1.372 1.441 57.6<br />
Hydro 0.60 72 16 64.8 0.372 0.343 0.029 5.1<br />
* Includes the caustic present in the Indigo paste (5.2%).<br />
The excess caustic and hydro are present to ensure complete reduction is reached and<br />
maintained for the life <strong>of</strong> the mix. Additionally the excess chemicals will reduce the required<br />
auxiliary chemical feed rates to maintain the desired pH during the dyeing process. In order to<br />
maintain proper reduction <strong>of</strong> the indigo in the dye boxes, a total hydro consumption factor based on<br />
the weight <strong>of</strong> the Indigo (OWI) would be approximately 32%.<br />
Other typical indigo stock mixes follow formulas in table 1-2 and 1-3. Table 1-2 formula will<br />
produce a 3.75 lb/gal or 450 g/l indigo concentration. Vatting or reducing the indigo usually occurs<br />
at 50° C in approximately 30 minutes. Properly vatted indigo is yellow or amber in color. The liquor<br />
turns green in 12-15 seconds on clean glass as air oxidation begins.<br />
Table 1-2: A typical indigo stock mix formula. 1<br />
Stock Mix concentration<br />
Gallons Lbs Lbs/Gal oz/gal g/l<br />
Indigo 20% Paste 320 3000 3.75 60 450<br />
Sodium Hydroxide 50% 94 1200 1.50 24 180<br />
Liq. Hydro 170g/l 340 3250 4.06 65 490<br />
Water 46 382 - - -<br />
Total Volume 800<br />
9
Table 1-3: Additional indigo stock mix recipes. 13<br />
Plant 20% Indigo 50% Caustic Hydro (g/l) 50% Caustic Hydro (%I)<br />
Paste (g/l) Soda (g/l)<br />
Soda (%I)<br />
1 450 143 68 31.77 15.11<br />
2 414 140 54 33.77 13.09<br />
3 382 140 71 36.79 18.55<br />
4 400 118 60 29.5 15<br />
5 450 136 69 30.02 15.33<br />
6 420 121 64 28.17 15.33<br />
7 450 150 75 33.33 16.67<br />
8 381 120 63 31.49 16.54<br />
9 400 270 64 67.5 16.5<br />
1.2.2 Classification <strong>of</strong> Indigo Dye Species<br />
Indigo dye can exist as four species as shown in figure 1-7:<br />
I. oxidized or keto indigo.<br />
II. Reduced nonionic acid leuco indigo.<br />
III. Monophenolate ion <strong>of</strong> reduced indigo.<br />
IV. Biphenolate ion <strong>of</strong> reduced indigo.<br />
Both forms I and II are highly insoluble compounds <strong>of</strong> unknown solubility and virtually no<br />
substantivity for cotton. The solubility <strong>of</strong> the other species III and IV can be calculated when given<br />
the pKa’s <strong>of</strong> the reduced forms. These two ionic forms vary greatly with di-ionic form having the<br />
higher solubility but lower substantivity. The mono-ionic form <strong>of</strong> indigo predominates in the lower<br />
pH ranges <strong>of</strong> 11.<br />
10
Figure 1-7: Various forms <strong>of</strong> indigo: I - Oxidized, II - Reduced acid leuco, III - Monophenolate, and IV - Biphenolate. 17<br />
Indigo can undergo a two-step ionization to produce the two ionic species: mono-ionic and<br />
di-ionic or the monophenolate and biphenolate forms respectively. The relative amount <strong>of</strong> each<br />
species is governed by the pH <strong>of</strong> the dye bath. The poorly water-soluble nonionic or ‘acid leuco’<br />
form <strong>of</strong> reduced indigo can be abbreviated as H2I where H is hydrogen and I represents indigo. The<br />
first ionization step produces the more soluble mono-ionic form <strong>of</strong> indigo, HI - as shown in equation<br />
1-4.
The associated equilibrium ionization constant k1 is given by equation 1-5.
The associated equilibrium ionization constant k1 is given by equation 1-5.
Figure 1-8: Fraction <strong>of</strong> leuco reduced indigo as a function <strong>of</strong> pH. 15<br />
1.2.3 Indigo dyeing Measurement Methods<br />
Indigo concentrations in the dye box are measured by three different methods: visual versus<br />
standard, Spectrophotometric analysis, or gravimetric analysis. All <strong>of</strong> the above methods are<br />
affected to some degree by sulfur contamination in the indigo boxes when a sulfur bottom is<br />
applied. However, results should be relative to previous measurements, therefore comparative.<br />
By far the most widely accepted indigo measurement system in commercial operations is<br />
the %T measurement. This technique is based on the transmittance values <strong>of</strong> a spectrophotometer<br />
reading a diluted and oxidized dye sample. A known aliquot <strong>of</strong> dye is diluted to a fixed volume with<br />
water and allowed to oxidize. Usually the resulting measurement is compared to a predetermined<br />
standard. By using Beer’s Law: A=ebc; where A is absorbance, c is concentration g/l, b is cell<br />
thickness cm, and e is specific absorptivity L/gcm; the indigo dye concentration can be calculated.<br />
14
The specific procedure is outlined in appendix A-1-2a. Since oxidized indigo is not water soluable,<br />
the mixature must be constantly stirred to maintain uniform distribution.<br />
Figure 1-9 graphically depicts the specific absorptivity <strong>of</strong> oxidized and reduced indigo. The<br />
specific absorptivity is independent <strong>of</strong> concentration and cell thickness.<br />
Figure 1-9: Specific Absorptivity <strong>of</strong> oxidized and reduced indigo as a function <strong>of</strong> wavelength. 53<br />
Caustic is necessary to dissolve the reduced indigo into the leuco-indigo form. Caustic is also<br />
the regulator <strong>of</strong> the dyeing process. Excess caustic results in increase penetration making the shade<br />
appear weaker. Not enough caustic results in poor crocking properties, increased ring dyeing,<br />
streaked dyeing, and/or a precipitation in the vat. The total alkalinity caustic level can be measured<br />
by titration method. The specific method is given in appendix A-1-2b.<br />
Sodium hydrosulfite is required to reduce the indigo and keep the indigo dye boxes in the<br />
proper dyeing condition. Excess hydro results in increased penetration, greener and brighter<br />
shades, weaker dyeing, potential streaking, higher cost, and slower wash down. Too little hydro<br />
results in increased surface dyeing, redder and duller shades, color <strong>of</strong> the dye liquor changing from<br />
15
amber to green, and/or dyeings which are not fast to washing. Sodium hydrosulfite concentrations<br />
can be determined by volumetric titration with iodine or with K3 [Fe(CN)6]. The end point is<br />
determined either visually or potentiometrically.<br />
The hydro level can be measured by four different methods: 1. Iodine titration. 2.<br />
Potassium Ferricyanide titration. 3. Vatometer. 4. MV measurement <strong>of</strong> the oxidation reduction<br />
potential (ORP) which is a composite value based on indigo, caustic and hydro concentrations.<br />
Reduced indigo dye bath can be titrated with sodium hypochlorite to produce the following<br />
potential curve, figure 1-10. Starting from -890 mV to point A on the curve (-850 mV), the potential<br />
depends on the concentration <strong>of</strong> sodium hydrosulphite in the dye bath. When all the hydro is<br />
consumed, the potential undergoes a sudden increase to point B which is about -695 mV. As indigo<br />
is insoluble in the aqueous dye bath, the potential <strong>of</strong> the solution is therefore the potential <strong>of</strong> leuco<br />
indigo. At point C the leuco indigo molecules are oxidized and the potential quickly rises.<br />
Electrochemical titration methods to measure Indigo and hydro use potassium hexacyan<strong>of</strong>errate (III)<br />
as the titrant.<br />
Figure 1-10: Redox potential curve <strong>of</strong> reduced indigo undergoing oxidation by sodium hypochlorite. 46<br />
16
Several alternative methods have been developed over the years to measure and monitor<br />
indigo and sodium hydrosulfite concentrations. Westbroek 51 used an electrochemical method using<br />
multistep chronoamperometry. Photometric and spectrophotometric reflectance can be used to<br />
determine indigo concentrations by potentiometric titration. However the system doesn’t<br />
differentiate between unreduced indigo and leuco indigo in the dye bath. This is due to the<br />
oscillation <strong>of</strong> potential used to remove indigo particles from the electrode. By applying a -0.90 mV<br />
potential across the electrode, all indigo in the sample vessel is completely reduced to leuco indigo.<br />
Sahin 53 describes a laser diode spectrometer for monitoring indigo concentrations. A laser<br />
diode absorption spectrometer with monochromatic radiaton emmited at 635 nm to measure<br />
oxidized indigo absorption at the shoulder <strong>of</strong> a broad absorption peak. A linear calibration curve<br />
between 10 and 150 mg/l is shown in figure 1-11 which corresponds to indigo concentrations in the<br />
dye bath from 0.8 to 12 g/l (diluted with aerated water by a factor <strong>of</strong> 80). Typical dye bath indigo<br />
concentrations ranges are 1 to 3 g/l. Sahin claims no interference due to sulfur compounds present<br />
in dye bath which is a problem with electrochemical titration methods but no supporting evidence is<br />
provided.<br />
Figure 1-11: Calibration curve <strong>of</strong> Sahin laser diode spectrometer. 53<br />
17
Another method for monitoring indigo is the Flow Injection analysis (FIA) 61 . FIA is a Real-<br />
time analytical technique for determining leuco indigo dye concentration in batch dye bath. 20 uL<br />
sample was introduced in FIA and diluted with 5 different reducing agents. Absorbance<br />
measurements are made at 406 nm (maximum absorption <strong>of</strong> leuco indigo) by fiber optic coupled<br />
spectrometer. To prevent premature oxidation, nitrogen gas was continuously bubbled in.<br />
While many automatic systems have been developed over the years, few have gained wide<br />
acceptance. Most automatic methods have limited success due to poisoning <strong>of</strong> the system, either<br />
build-up on potentiometric electrodes, blocking <strong>of</strong> valves, and/or peristaltic pumps failures.<br />
Extraction <strong>of</strong> indigo on yarns and fabrics was historically carried out by pyridine reflux. A<br />
given dyed sample <strong>of</strong> approximately 0.5 grams would have the indigo dye removed until the solution<br />
siphoning from the fabric was colorless. The pyridine solution extract was then brought up to 250<br />
ml in a volumetric flask. Absorbance <strong>of</strong> the solutions at 608 nm is measured on either a single beam<br />
spectrophotometer or a dual-beam diode array spectrophotometer. This particular method <strong>of</strong><br />
indigo on weight <strong>of</strong> yarn measurement is no longer utilized.<br />
Recently Hauser and Merritt 29 demonstrated the effective use <strong>of</strong> ferrous<br />
sulfate/triethanolamine/sodium hydroxide or Fe/TEA/OH as the extraction solvent. Approximately<br />
0.5 gram dyed sample is placed in flask then 100 ml <strong>of</strong> pre-prepared Fe/TEA/OH solution is added.<br />
(Fe/TEA/OH is prepared by adding 5 g/l ferrous sulfate, 50 g/l triethanolamine, and 10 g/l sodium<br />
hydroxide (pellets) to distilled water.) The extraction is carried out at 45° C for 90 minutes on a<br />
stirring hot plate. After 90 minutes the solution is cooled to room temperature, volume topped <strong>of</strong>f<br />
to 100 ml, and absorbance measured at 406 nm. The solutions once again follow Beer’s law with<br />
dilutions made by additional reducing solution if needed.<br />
18
1.3 Characteristics <strong>of</strong> Indigo Dyed Yarns<br />
To accurately describe and discuss the characteristics <strong>of</strong> indigo dyed yarn, a back ground<br />
understanding <strong>of</strong> color measurement, shade, and ring dyeing is required. Color measurement and<br />
shade are physical measurements one can make to qualify the amount <strong>of</strong> dye on a textile substrate.<br />
1.3.1 Color Measurement and Representation<br />
1.3.1.a Kubelka-Munk Color Evaluation<br />
Most opaque colored objects illuminated by white light produce diffusely reflected colored<br />
radiation by light absorption and scattering. A function based on this fact was developed by Kubelka<br />
and Munk in 1931. These researchers theorized that the ratio <strong>of</strong> the coefficient <strong>of</strong> light absorption,<br />
K, to the coefficient <strong>of</strong> light scattering, S, is related to the fractional reflectance <strong>of</strong> light Rd <strong>of</strong> a given<br />
wavelength from the opaque substrate.<br />
Consider the simple case <strong>of</strong> a light beam passing vertically through a very thin pigmented<br />
layer <strong>of</strong> thickness dx in a paint film, figure 1-12. The downward (incident) and upward (reflected)<br />
components can be considered separately by the absorption coefficient K and the scattering<br />
coefficient S.<br />
X dx<br />
Surface <strong>of</strong> paint film<br />
I J<br />
Substrate<br />
Figure 1-12: Kubelka-Munk analysis <strong>of</strong> downward and upward components <strong>of</strong> light flux. 9<br />
19
The downward flux (intensity I) is:<br />
- decreased by absorption = -KIdx<br />
- decreased by scattering = -SIdx<br />
- increased by backscatter = +SJdx<br />
To yield the change in downward flux, equation 1-9 is utilized. 9
This equation can be solved for K/S and the widely used form <strong>of</strong> K/S results in equation 1-12. 9<br />
<br />
<br />
= () <br />
<br />
Equation 1-12: Kubelka-Munk equation for light absorbance and scattering<br />
This is the most widely known form <strong>of</strong> the equation and most used by textile pr<strong>of</strong>essionals<br />
directly or indirectly through specialty s<strong>of</strong>tware programs. For the equation to be <strong>of</strong> practical value<br />
it is necessary for the equation to be corrected to take into account light reflectance properties <strong>of</strong><br />
the textile substrate. One correction to this equation accounts for the light reflectance (Rm) from a<br />
mock-dyed substrate, i.e., a substrate that has been subjected to a dyeing process containing all the<br />
chemicals other then dye. 9<br />
<br />
<br />
=()<br />
<br />
−<br />
() <br />
<br />
<br />
Equation 1-13: Correction to Kubelka-Munk for light reflectance properties <strong>of</strong> mock dyed substrate<br />
The range <strong>of</strong> applicability <strong>of</strong> the mock dyed corrected formula can be extended by<br />
accounting for surface reflectance <strong>of</strong> the fabric. It is easily shown that as the dye content <strong>of</strong> a textile<br />
substrate increases, less and less light is reflected from the substrate. However zero reflectance is<br />
never achieved. Instead a low limiting value <strong>of</strong> reflectance is encountered that is insensitive to<br />
further increases in concentration <strong>of</strong> dye in the substrate. This limiting value <strong>of</strong> reflectance is the<br />
“surface reflectance”, Rs. By including Rs, the range <strong>of</strong> linearity is extended to higher concentrations<br />
<strong>of</strong> dye. The final corrected K/S formula is given in equation 1-14. 9<br />
21
=() −()<br />
() () <br />
Equation 1-14: Corrected Kubelka-Munk to account for surface reflectance.<br />
Where Rd is the reflectance <strong>of</strong> light from the substrate containing a given concentration <strong>of</strong> dye, Rm is<br />
the light reflectance from a mock-dyed substrate, and Rs is the so-called “surface reflectance”.<br />
It is found that the resulting corrected K/S can be shown to be a linear function <strong>of</strong> dye<br />
concentration in the textile substrate. 9 In equation 1-15, "C" is the concentration <strong>of</strong> dye in the<br />
substrate and “a” is the reflectance absorptivity coefficient. Since the reflectance absorptivity<br />
coefficient is equal to the value <strong>of</strong> K/S that is obtained per unit concentration <strong>of</strong> dye in the<br />
substrate, the reflectance absorptivity coefficient is a measure <strong>of</strong> the “color yield” that is obtained<br />
for a given system 25 . As the value <strong>of</strong> “a” increases, the greater the depth <strong>of</strong> shade for a given unit <strong>of</strong><br />
fixed dye.<br />
<br />
=
ed to green color shift, and the b* term describes the yellow to blue relationship. These values are<br />
calculated using the equations in 1-16 that involve the tristimulus values which relate the measured<br />
reflectance wavelength values, average observer, and the standard light source. All calculations<br />
presented in this paper use a 10° observer and D65 standard light source. For more detailed review<br />
please reference book 9 in the bibliography section: Colour Physics for Industry.
1.3.1.b Determination <strong>of</strong> Surface Reflectance, Rs<br />
Etters summarized a method for the determination <strong>of</strong> Rs in 1991. 18 To determine the Rs<br />
value, make successive linear regression analyses <strong>of</strong> K/Scorr versus concentration for various values<br />
<strong>of</strong> Rs until both a high value <strong>of</strong> R 2 and a statistically optimum zero value for the intercept are found.<br />
Etters plotted the R 2 versus Rs values for blue, red, and yellow reactive dye on velour cotton in figure<br />
1-13. It is revealed the R 2 value for the blue dye is insensitive to surface reflectance with all the<br />
values being greater than 0.99. On the other hand, R 2 for the red dye exhibits much greater<br />
sensitivity to surface reflectance, with the maximum R 2 occurring at an Rs <strong>of</strong> about 0.01. R 2 for the<br />
yellow dye has only limited sensitivity to surface reflectance, with the R 2 value reaching a maximum<br />
between 0.020 and 0.025. The most important point made in figure 1-13 is that, for the present<br />
series <strong>of</strong> dyes on the given velour substrate, the R 2 value that results from the use <strong>of</strong> an optimum<br />
value <strong>of</strong> Rs is only slightly improved over that which is obtained with an Rs <strong>of</strong> zero.<br />
Figure 1-13: Calculated R-square values for blue, red, and yellow dyes at various surface reflectances. 18<br />
24
The intercepts <strong>of</strong> the linear regression lines obtained in the analysis <strong>of</strong> K/Scorr versus<br />
concentration are given as a function <strong>of</strong> surface reflectance in figure 1-14. The zero intercept for<br />
the red and yellow dyes occur at about the same value <strong>of</strong> surface reflectance: 0.0166 and 0.0163.<br />
However the zero intercept for the blue dye occurs at a surface reflectance <strong>of</strong> 0.0128. Yellow dye is<br />
most sensitive to surface reflectance while the blue dye is the least.<br />
Figure 1-14: Calculated y intercepts for blue, red, and yellow dyes. 18<br />
From the R 2 and intercept analysis, Etters determined he could use a surface reflectance <strong>of</strong><br />
1.5% for each dye. Plots <strong>of</strong> K/Scorr versus concentration in which both zero surface reflectance and<br />
the common value <strong>of</strong> 0.015 are given in figure 1-15. In each case the linearity is significantly<br />
improved by accounting for surface reflectance. The reflectance absorptivity coefficient (line slope)<br />
is increased in each case. Recall the R 2 analysis indicated only small improvement by accounting for<br />
Rs would be expected. Yet, the surface reflectance had a dramatic visual impact on the correlation<br />
<strong>of</strong> K/S versus concentration.<br />
25
Corrected<br />
Corrected<br />
Corrected<br />
Original<br />
Original<br />
Original<br />
Figure 1-15: Comparison <strong>of</strong> original K/S and corrected K/S for blue, red, and yellow dyes. 18<br />
26
1.3.1.c Investigating the Ring Dyeing Property <strong>of</strong> Indigo Dyed Yarn<br />
Ring dyeing is characterized by the inner layer <strong>of</strong> fibers containing little to no dye while the<br />
outer layer is highly pigmented. During indigo dyeing, the degree <strong>of</strong> ring dyeing can be regulated by<br />
pH <strong>of</strong> the dye bath or pretreatments used during pre-scour section. Typically pH 11 displays better<br />
ring dyeing, while pH 13 exhibits much greater penetration. Figure 1-16 illustrates the difference in<br />
degree <strong>of</strong> ring dyeing between normal pre-scour and causticization as well as pH 13.3 vs pH 12.3.<br />
Adsorption and absorption <strong>of</strong> dyestuff by textiles is strongly dependent on the nature, source, and<br />
properties <strong>of</strong> the fibers and their surface activity.<br />
Figure 1-16: Examples <strong>of</strong> limited ring dyeing on the left, medium in the middle, and high degree <strong>of</strong> ring dyeing on the<br />
right picture. 19<br />
Indigo dyeing naturally produces a “ring dyed” effect where the dye concentration is greater<br />
on the surface <strong>of</strong> the yarn then the interior or core <strong>of</strong> the yarn. This characteristic is a desirable part<br />
<strong>of</strong> the indigo dyeing and produces the aesthetic high and low or uneven shade on the final product<br />
after garment wet processing. As mentioned earlier, the ring dye effect can be further enhanced by<br />
causticizing or even mercerization during the pre-scouring process. The figure 1-16 illustrates the<br />
ring dye effect from a pre-scour and causticized warp yarn. The amount <strong>of</strong> caustic used during pre-<br />
scouring also affects the %indigo pick-up on the cotton yarns. Figure 1-17 documents the change in<br />
indigo pick-up or uptake given constant dye range parameters with only changes in the scour box.<br />
27
% Indigo Pick-up<br />
14<br />
12<br />
10<br />
8<br />
6<br />
4<br />
2<br />
0<br />
Figure 1-17: Pre-scour caustic concentration effect <strong>of</strong> dye uptake. 1<br />
Typical % reflectance values for a 6 dip indigo shade are shown in figure 1-18. These were<br />
measured from production dyeing on 6.3/1 open end 100% cotton yarn dyed at 31 m/min, 2.3 g/l,<br />
11.9 pH, and 6 dips <strong>of</strong> indigo. When these % reflectance values are corrected for the mock<br />
substrate, the K/S values as a function <strong>of</strong> wavelength can be calculated as demonstrated in figure 1-<br />
19. Typically the wavelength <strong>of</strong> the minimum reflectance or the corresponding maximum K/S is<br />
used for calculations. Color yield can be expressed as the depth <strong>of</strong> shade obtained for a given<br />
amount <strong>of</strong> fixed dye. Color depth is usually expressed as K/S at the wavelength <strong>of</strong> minimum<br />
reflectance.<br />
Indigo Pick-up vs. Caustic Concentration in the Scour Box<br />
1.5 5 10 20 30 45.5 61.2 80 88.2<br />
50% NaOH Concentration (opg)<br />
Mild Alkali Causticizing Mercerizing<br />
28
% Reflectance<br />
3.5<br />
3<br />
2.5<br />
2<br />
1.5<br />
1<br />
0.5<br />
% Reflectance Values <strong>of</strong> Typical 6 Dip Indigo Dye Shade<br />
0<br />
400 450 500 550 600 650 700<br />
Figure 1-18: Typical reflectance values for indigo dyed denim yarn - 6.3/1 open end yarn at 31 m/min, 2.3 g/l, 11.9 pH,<br />
and 6 dips.<br />
K/S Corrected<br />
60<br />
50<br />
40<br />
30<br />
20<br />
10<br />
0<br />
Wavelength (nm)<br />
K/S Corrected Values <strong>of</strong> Typical 6 Dip Indigo Dye Shade<br />
400 450 500 550 600 650 700<br />
Wavelength (nm)<br />
Figure 1-19: Typical corrected K/S values for indigo dyed denim yarn - 6.3/1 open end yarn at 31 m/min, 2.3 g/l, 11.9 pH,<br />
and 6 dips.<br />
29
As previously illustrated in figure 1-16, microscopy has revealed that for indigo dye baths<br />
having the same level <strong>of</strong> alkalinity, but buffered to different pH’s; the resulting distribution <strong>of</strong> dye<br />
exhibits more or less ring dyeing. When the buffered dye bath pH decreases from 13.0 to 11.0 the<br />
denim yarn progressively becomes more and more ring dyed. Associated with the increased ring<br />
dyeing is more color yield. When a given concentration <strong>of</strong> dye (expressed as percent on the weight<br />
<strong>of</strong> the yarn) is located in progressively fewer and fewer fibers, the concentration <strong>of</strong> dye in each dyed<br />
fiber increases. Reflected light from the surface <strong>of</strong> the dyed yarn is therefore lower. Etters<br />
proposed the relationship between depth <strong>of</strong> shade (K/S) and ring dyeing for a given concentration <strong>of</strong><br />
dye may be approximated by accounting for dye distribution within the yarn. 22<br />
Figure 1-20: Distribution <strong>of</strong> indigo dye and penetration level in denim yarn. 22<br />
r<br />
p<br />
30
The volume <strong>of</strong> a yarn can be defined as Vm =πr 2 1, where the r is the yarn radius and using 1<br />
as a unit length. The volume <strong>of</strong> yarn not occurred by dye when penetration is not complete (indigo<br />
dyeing) can be expressed as Vi = π (r – pr) 2 1, where p is the penetration <strong>of</strong> the yarn expressed as a<br />
fraction <strong>of</strong> the yarn radius, r. The volume <strong>of</strong> yarn that is occupied by dye then becomes Vd = Vm - Vi.<br />
For a yarn <strong>of</strong> unit radius and length this equation reduces to Vd = π p (2 – p) and the fractional<br />
volume <strong>of</strong> yarn occupied by dye can be expressed as Vf = p(2 – p).<br />
The effective concentration <strong>of</strong> dye in the yarn is related to the actual concentration from a<br />
shade stand point by Ce = Ca / Vf , where Ce is the effective concentration <strong>of</strong> dye in the yarn and Ca is<br />
the actual concentration <strong>of</strong> dye in the yarn. When the fractional penetration <strong>of</strong> the yarn is 1.0, i.e.<br />
uniform dye distribution in the cross section, Ce = Ca. But as penetration becomes less the effective<br />
concentration <strong>of</strong> dye becomes greater.<br />
When dealing with indigo dyed yarn the shade values or K/S are related to the effective dye<br />
concentration not the actual, the previously discussed K/Scorr = a C can be adjusted for non-<br />
uniformly distributed dye concentrations by substituting Ce.<br />
<br />
=
1.4 Dye Theory<br />
Numerous books and articles have been published on the topic <strong>of</strong> dye theory. This review is<br />
intended to provide a fundamental background on key topics that are relevant to indigo-cotton dye<br />
system. This discussion will start with basic sequence <strong>of</strong> events during dyeing, then Fick’s laws <strong>of</strong><br />
diffusion, next diffusional boundary layer, and ending with empirical simplifications. More in-depth<br />
discussion can be found in Weisz 3 and McGregor 4 .<br />
1.4.1. Fundamental Sequence <strong>of</strong> Events during Dyeing<br />
Etters 28 defined four fundamental steps which outline the path <strong>of</strong> dye molecules from the<br />
bath to the fiber as illustrated in figure 1-21.<br />
1. Diffusion <strong>of</strong> the dye in the external medium (usually water) toward the diffusional boundary<br />
layer at the fiber surface.<br />
2. Diffusion <strong>of</strong> dye through the diffusional boundary layer that exists at the fiber surface.<br />
3. Adsorption <strong>of</strong> the dye onto the fiber surface.<br />
4. Diffusion <strong>of</strong> dye into the fiber interior by absorption.<br />
32
Figure 1-21: Basic sequ uence <strong>of</strong> eventss<br />
in dyeing fibers<br />
The rate <strong>of</strong><br />
sorption <strong>of</strong> dye by textilee<br />
materials is controlled byy<br />
several funddamental<br />
phyysico<br />
chemical<br />
paramete ers.<br />
s. 28<br />
1.<br />
Denier <strong>of</strong> fiber, f which iss<br />
proportionaal<br />
to radius <strong>of</strong>f<br />
the cylinder fiber.<br />
2.<br />
Liquor ratio,<br />
the ratio o<strong>of</strong><br />
volume <strong>of</strong> ddye<br />
bath to thhe<br />
volume <strong>of</strong> fiber mass.<br />
3.<br />
Distributio on coefficient or ratio <strong>of</strong> thhe<br />
equilibriumm<br />
concentration<br />
<strong>of</strong> dye in bboth<br />
the<br />
application n medium and<br />
the fiber.<br />
4.<br />
Diffusion coefficient c <strong>of</strong> the dye in booth<br />
the appliccation<br />
mediumm<br />
and the fibber.<br />
5.<br />
Fundamen ntal nature <strong>of</strong>f<br />
the dyeing syystem:<br />
infinitte<br />
or finite baath<br />
condition. .<br />
6.<br />
Thickness <strong>of</strong> the diffusional<br />
boundarry<br />
layer at thee<br />
fiber surfacee.<br />
Rate <strong>of</strong> dyeing<br />
for a given<br />
system is inversely proportional<br />
to tthe<br />
denier <strong>of</strong> the fiber. Ass<br />
the<br />
denieer<br />
<strong>of</strong> a given fi iber increasess,<br />
the surfacee<br />
area decreases<br />
for a giveen<br />
mass <strong>of</strong> fiber<br />
available ffor<br />
33
dye sorption. Accompanying the increased surface area that is associated with decreasing fiber<br />
radius is a decreased distance that the dye on the exterior fiber surface must diffuse to “fill” the<br />
fiber to an equilibrium fixation level. Lengths to diameter ratios for useful fibers are usually greater<br />
then 1000, so the surface area contributions from the ends <strong>of</strong> the individual fibers are relatively<br />
small and usually ignored.<br />
Since dyeing on a continuous rope dye range is conducted under constant dye bath<br />
concentrations, the process is defined as an infinite dye bath. Since the liquor ratio is infinitely high,<br />
the exhaustion is zero. 28 Under infinite dye bath conditions, since dye that is absorbed at the fiber<br />
surface is in equilibrium with dye in the dye bath, diffusion <strong>of</strong> dye into the fiber interior will occur<br />
from a constant surface concentration. 28 From a mathematical standpoint, Etters has stated<br />
“<strong>Sorption</strong> <strong>of</strong> dye from a constant surface concentration is a much simpler system from an<br />
experimental and analytical point <strong>of</strong> view”. 31 Some argue diffusion coefficient <strong>of</strong> dye in a fiber is<br />
really the same as it is in the surrounding aqueous medium. 28<br />
“Rate <strong>of</strong> dyeing” is controlled by the rate <strong>of</strong> diffusion <strong>of</strong> dye “in fiber” unless a significantly<br />
thick diffusional boundary layer exists at the fiber surface. If a diffusional boundary layer exists,<br />
then rate <strong>of</strong> dyeing is influenced by rate <strong>of</strong> diffusion <strong>of</strong> dye in dyeing medium and fiber which may<br />
possess different diffusion coefficients. 28<br />
One problem related to indigo dyeing is when dye becomes immobilized as diffusion<br />
proceeds. When diffusion is accompanied by absorption, conventional equation <strong>of</strong> diffusion in one<br />
dimension has to be modified to allow for immobilization. 48<br />
1.4.2 Fick's Law <strong>of</strong> Diffusion<br />
Any discussion involving diffusion should begin with the some basic definitions.<br />
1. Absorption: the process <strong>of</strong> absorbing. Absorb: to take up and make part <strong>of</strong> an existent whole.<br />
2. Adsorption: the adhesion in extremely thin layer <strong>of</strong> molecules to the surface <strong>of</strong> solid bodies or<br />
liquids with which they are in contact.<br />
3. Desorption: the reverse <strong>of</strong> absorption or adsorption.<br />
4. <strong>Sorption</strong>: the process <strong>of</strong> sorbing. Sorb: to take up and hold by either absorption or adsorption.<br />
34
During the the indigo-cotton dyeing process, the following steps are assumed to occur. The<br />
indigo dye molecules form a thin layer surrounding each cotton fiber. This process is adsorption <strong>of</strong><br />
dye to the fiber surface. Once the indigo dye molecules adhere to the fiber surface, indigo dye can<br />
absorb into the fiber interior by absorption. This entire process can also be referred to as sorption<br />
<strong>of</strong> indigo dye into the cotton fibers. If indigo dye is removed from the cotton fiber either from the<br />
interior to the surface or from the surface to the surrounding bath, the process is referred to as<br />
desorption.<br />
Crank defines diffusion as the process by which matter is transported from one part <strong>of</strong> a<br />
system to another as a result <strong>of</strong> random molecular motions. 2 Etters defines the diffusion coefficient<br />
as a measure <strong>of</strong> the rapidity <strong>of</strong> movement <strong>of</strong> a molecule through a given medium. As the value <strong>of</strong><br />
diffusion coefficient increases, the speed <strong>of</strong> movement <strong>of</strong> a molecule through the medium also<br />
increases. 28<br />
The complicated process <strong>of</strong> dyeing is modeled on the diffusion principles outlined by Fick.<br />
Fick recognized the relationship between diffusion and heat transfer by conduction. He adopted the<br />
mathematical equations derived by Fourier to quantify diffusion. Fick’s first law <strong>of</strong> diffusion for one<br />
dimensional isotropic medium is written in equation 1-19.
equation 1-20.<br />
<br />
=
This equation is one dimensional since diffusion progresses radially into the yarn and is constant<br />
around the yarn. No diffusion occurs along the axis <strong>of</strong> the yarn. The non-steady state solution for<br />
solid cylinder with constant surface concentration and uniform initial internal concentration that<br />
possesses the boundary conditions: C=f(r), at 0
Figure 1-22: Graphical solution <strong>of</strong> Fick's 2nd Law for Diffusion in long cylinders. 2<br />
38
The sorption curves on figure 1-22 are defined by the dimensionless parameter Dt/a 2 .<br />
Other formal solutions to the partial differential equation have been developed. However<br />
there are certain limiting assumptions that must exist for the mathematical solutions to be valid.<br />
1. It is assumed the diffusion coefficient is constant and not dependent on concentrations.<br />
2. <strong>Equilibrium</strong> distribution coefficient <strong>of</strong> dye between fiber and dye bath is linear for a wide<br />
range <strong>of</strong> concentrations, i.e. linear sorption isotherms.<br />
3. All fibers are morphologically stable, homogenous, and uniformly accessible endless<br />
cylinders.<br />
4. No diffusional boundary layer exists in the dye bath and no “skin-core” effect exists in the<br />
fiber. This results in instantaneous equilibrium between dye on fiber surface and dye in the<br />
bath.<br />
Given these assumptions Hill 31 has developed a solution for infinite dye bath conditions in the<br />
absence <strong>of</strong> surface barrier effects, equation 1-25.<br />
<br />
<br />
=1−∑
=1−∑ ∗ <br />
<br />
( <br />
)<br />
Equation 1-26: Newman's solution <strong>of</strong> dye concentration under infinite dye bath conditions that contain surface barrier<br />
effects. 31<br />
Here the βn’s are the roots <strong>of</strong> the transcendental equation: βnJ1(βn) - LJ0(βn) = 0 in which J0 and J1<br />
again are zero and first order Bessel functions, and the dimensionless parameter, L is defined by<br />
equation 1-27.
every dip <strong>of</strong> indigo. In fact it may be a function <strong>of</strong> the dye concentration within the yarn.<br />
Furthermore, the “skin” <strong>of</strong> oxidized indigo dye on each yarn after the first dip may have a different<br />
diffusion coefficient then the partially dyed cotton yarn.<br />
In the absence <strong>of</strong> experimental data, the Othmer-Thakar 31 correlation can be used to<br />
estimate the diffusion coefficient, Ds, <strong>of</strong> various substances in dilute aqueous solutions. The<br />
Othmer-Thakar correlation was defined in equation 1-28.
Figure 1-23: Predicted fractional dye uptake as a function <strong>of</strong> dimensionless time at various flow rates. 28<br />
Etters evaluated Newman’s equation on Disperse Red 11 in stabilized, 40 denier, 13 filament<br />
nylon 66 tricot using desorption experiments. The results are presented in table 1-4. There was<br />
variation in the desorption data leading to uncertainty in the computation <strong>of</strong> not only the diffusion<br />
coefficient but also the L value. In response, the approximate L values and apparent diffusion<br />
coefficients were determined by utilizing the % CV minimization technique.<br />
42
Table 1-4: Estimated diffusion coefficients for disperse Red 11 (D, cm 2 /sec x 10 -10 ). 31<br />
Time (min) 15 opm (L=2) 30 opm (L=80) 90 opm (L=∞)<br />
0.50 4.72 5.38 4.81<br />
1.00 4.17 4.89 4.38<br />
2.00 5.06 3.84 5.03<br />
3.00 4.29 4.11 4.56<br />
4.00 3.04 4.75 4.50<br />
5.00 5.31 4.39 4.89<br />
10.0 5.06 4.63 4.34<br />
15.0 5.14 5.08 4.20<br />
Mean 4.60 4.63 4.59<br />
%CV 16.33 10.94 6.38<br />
The experimental data was plotted according to Newman’s equation using the mean value<br />
<strong>of</strong> the diffusion coefficient for each value <strong>of</strong> L. When 1- was plotted versus the square root <strong>of</strong><br />
time, an intercept on the root time axis was detected for lowest value <strong>of</strong> L, see figure 1-24. This<br />
behavior is typical for systems in which a surface barrier exists in either the bath or the fiber. It is<br />
also important to note, since an L value <strong>of</strong> infinity is found for the highest oscillation rate, no skin-<br />
core effect is detected for the nylon fiber. If the value <strong>of</strong> L had not increased very much as the<br />
oscillation rate <strong>of</strong> the bath increased, an argument could be made that the effect was caused by a<br />
barrier that existed in the fiber surface rather than in the bath itself.<br />
43
Figure 1-24: Red 11 dye desorption at various oscillating speeds.<br />
1.4.4. Empirical Simplifications <strong>of</strong> Diffusion<br />
The formal solution to Fick’s 2 nd law <strong>of</strong> diffusion is a grueling task even for a superior<br />
mathematician. To simply the equations many empirical equations have been proposed over the<br />
years. Three such exponential equations were compared for the efficacy in simulating the<br />
functional relationship between <br />
<br />
, Dt/r 2 , and L that is found by formal use <strong>of</strong> Newman’s equation<br />
1-26. 31 The equations that were examined are one, two, and three parameter exponential<br />
equations. Vickerstaff suggested an empirical approximation using one parameter as shown in<br />
equation 1-29. 31<br />
=1−
Urbanik was the among the first to use the two parameter equation to describe dye uptake which is<br />
provided in equation 1-30. 31<br />
<br />
<br />
=1−
Urbanik was the among the first to use the two parameter equation to describe dye uptake which is<br />
provided in equation 1-30. 31<br />
<br />
<br />
=1−
Urbanik was the among the first to use the two parameter equation to describe dye uptake which is<br />
provided in equation 1-30. 31<br />
<br />
<br />
=1−
As shown in Figure 1-25, the above technique results in a series <strong>of</strong> nearly straight lines<br />
corresponding to various values <strong>of</strong> equilibrium bath exhaustion, E∞. The slope <strong>of</strong> each line defines<br />
the parameter b and the line intercept I (at Dt/r 2 =1) gives the parameter a, a=e I . Table 1-5<br />
summarizes the regression values for a, b, and c for various E∞. For infinite dye bath conditions,<br />
E∞= 0, table 1-5 gives the following values: a=5.3454, b=1.1299, and 1/c=2.3.<br />
Table 1-5: Regression values for three parameter emphirical solution. 10<br />
E∞ a b 1/c<br />
0.995 13.4067 0.1150 0.0625<br />
0.98 10.6394 0.1619 0.17<br />
0.95 9.0635 0.2177 0.32<br />
0.90 8.1074 0.2904 0.52<br />
0.75 7.2074 0.4742 1.00<br />
0.50 6.5849 0.7373 1.60<br />
0.30 6.1410 0.9319 2.00<br />
0.00 5.3454 1.1299 2.30<br />
Rearranging Etter’s three parameter equation permits the direct calculation <strong>of</strong> the apparent<br />
diffusion coefficient D as shown in equation 1-36.
1.5 Indigo Dyeing Experiments<br />
The methods and procedures used by various experimenters will be presented in one<br />
section for direct comparison. The cotton yarn and fabric substrate from each experiment should be<br />
noted as well as the dye procedure. Later the actual results from all experiments have been<br />
grouped together. This will facilitate discussion <strong>of</strong> a particular topic based on all available analysis.<br />
1.5.1. Previous Investigations and Methods on Indigo Dyeing<br />
Southeastern Section <strong>of</strong> AATCC 1989 Experiment 15<br />
The Southeastern Section Research Committee published a paper in 1989 investigating the<br />
effect <strong>of</strong> dye bath pH on color yield. This study used 8/1’s yarn knitted into tube form having a<br />
flattened width <strong>of</strong> about 2 inches. The dye baths used 20% indigo paste, sodium hydrosulfite power,<br />
sodium hydroxide pellets, and potassium phosphate buffered alkalis.<br />
The dye baths were prepared by mixing the required amount <strong>of</strong> dye, 150 ml <strong>of</strong> the selected<br />
type <strong>of</strong> stock alkali solution, and 15 grams <strong>of</strong> sodium hydrosulfite with 500 ml <strong>of</strong> water at 90° C for 2<br />
minutes. The dye baths were then diluted to a volume <strong>of</strong> 3 liters with room temperature water and<br />
cooled to room temperature <strong>of</strong> 25° C.<br />
For each group <strong>of</strong> dyeings made at a measured dye bath pH, the indigo dye bath<br />
concentrations consisted <strong>of</strong> 2.0, 1.5, 1.0, 0.5, and 0.2 g/l (based on 100% indigo). The concentration<br />
<strong>of</strong> alkali (hydrated form) in stock solution is outlined in table 1-6.<br />
Table 1-6: Concentration <strong>of</strong> alkali system.<br />
Group A 60.1% Sodium hydroxide<br />
Group B 37.0% Sodium hydroxide<br />
Group C 37.5% Potassium Phosphate Buffer 1<br />
Group D 36.0% Potassium Phosphate Buffer 2<br />
Group E 39.3% Potassium Phosphate Buffer 3<br />
Group F 39.2% Potassium Phosphate Buffer 4<br />
Group G 37.7% Potassium Phosphate Buffer 5<br />
49
Lengths <strong>of</strong> tubing weighing 7.5 grams each were wet out in room temperature baths<br />
containing 5 g/l <strong>of</strong> wetting agent and squeezed to 71% wet pick-up. These were then placed into a<br />
three liter dye bath containing a specified dye concentration at a given pH. The dwell time in the<br />
dye bath was 15 seconds, followed by a squeeze and skying time <strong>of</strong> 45 seconds. Each dyeing<br />
consisted <strong>of</strong> five, 15 second dips in the dye bath followed by squeezing and 45 second aeration.<br />
After all dyeings had been completed, the knitted tubes were rinsed together three times in a 90° C<br />
water bath, squeezed by a padder after each rinse, and finally air dried. Since the liquor ratio from<br />
which the dyeings were made was 400/1, dye uptake can be considered to be occurring from<br />
essentially an infinite bath. Following this assumption, the concentration <strong>of</strong> dye at the fiber surface<br />
does not change during the course <strong>of</strong> dyeing.<br />
The dye on the knitted tubes was determined by hot pyridine extractions. The pyridine<br />
extractions were diluted to 25 ml in a volumetric flask. The absorbance was measured on a<br />
spectrophotometer at a wavelength <strong>of</strong> 612 nm. Using known absorbance versus concentration<br />
data, the calculated dye content on the denim yarn was determined.<br />
Reflectance values from 400 to 700 nm at 20 nm intervals were measured on all dyeings and<br />
a mock dyed sample by a spectrophotometer with ultraviolet and specular reflectance contributions<br />
using C2 illuminant.<br />
The following was assumed for the analysis and results summarized in table 1-7.<br />
1. There was sufficient reducing agent in the dye bath at all times to completely reduce all <strong>of</strong> the<br />
indigo.<br />
2. Ionic strength is approximately constant over all dye bath conditions.<br />
3. Solubility does not limit the concentration <strong>of</strong> any salt in the bath.<br />
50
Table 1-7: Etters 1989 data set. 15<br />
Dyebath Dye in Fiber<br />
Group pH (g/L) (g/100g) Reflectance Crock<br />
A 13.3 0.2 0.03 17.79 4<br />
A 13.3 0.5 0.06 12.73 3<br />
A 13.3 1 0.15 8.81 4<br />
A 13.3 1.5 0.26 6.04 3<br />
A 13.2 2 0.42 3.94 3<br />
B 13.2 0.2 0.02 17.69 4<br />
B 13.1 0.5 0.1 9.34 4<br />
B 13.1 1 0.28 4.76 3<br />
B 13.1 1.5 0.39 3.63 3<br />
B 13.1 2 0.61 2.97 3<br />
C 12.3 0.2 0.06 7.37 4<br />
C 12.3 0.5 0.24 3.39 3<br />
C 12.3 1 0.51 2.33 3<br />
C 12.2 1.5 0.66 2.11 2<br />
C 12.1 2 0.81 2.02 2<br />
D 11.4 0.2 0.09 4.68 4<br />
D 11.4 0.5 0.28 2.46 3<br />
D 11.3 1 0.53 1.98 2<br />
D 11.3 1.5 0.77 1.88 2<br />
D 11.2 2 1.01 1.95 2<br />
E 11.2 0.2 0.08 4.67 4<br />
E 11.2 0.5 0.26 2.47 2<br />
E 11.1 1 0.54 1.96 2<br />
E 11 1.5 0.77 1.89 2<br />
E 10.9 2 1.1 2.01 2<br />
F 10.4 0.2 0.13 4.09 4<br />
F 10.3 0.5 0.34 2.24 3<br />
F 10 1 0.62 2.1 2<br />
F 9.8 1.5 0.92 1.89 1<br />
F 9.4 2 1.15 2.32 1<br />
G 7.7 0.2 0.04 11.87 4<br />
G 7.7 0.5 0.08 9.84 3<br />
G 7.7 1 0.13 9.04 3<br />
G 7.8 1.5 0.15 7.75 2<br />
G 7.8 2 0.22 6.61 2<br />
51
Annis and Etter 1991 Experiment 19<br />
In May 1991 Annis and Etters published results from an experiment designed to investigate<br />
dye uptake and resulting color yield as influenced by dye bath pH. The same material, laboratory<br />
simulations <strong>of</strong> indigo dyeing, and analytical techniques used by the Southeastern Section <strong>of</strong> AATCC<br />
were used in this experiment except 0.25 g/l indigo concentration was used instead <strong>of</strong> 0.20 g/l. The<br />
experimental results are summarized in table 1-8.<br />
Table 1-8: Annis and Etters 1991 data set. 19<br />
pH Cb Cf Rd pH Cb Cf Rd<br />
9.3 1 0.63 0.02 12.8 1.5 0.27 0.034<br />
8.5 0.25 0.05 0.12 9 0.5 0.15 0.04<br />
12.1 0.25 0.08 0.063 11.9 2 0.6 0.022<br />
13.1 2 0.62 0.03 11.2 2 1.06 0.017<br />
10.5 2 1.18 0.017 13 2 0.52 0.028<br />
11 1 0.53 0.021 12.5 0.5 0.13 0.056<br />
11.2 0.25 0.11 0.038 13.3 1.5 0.285 0.044<br />
13.1 1.5 0.405 0.036 13.3 1 0.15 0.088<br />
11.3 0.5 0.265 0.026 7.8 1.5 0.18 0.076<br />
11.8 2 0.8 0.019 7.8 2 0.22 0.06<br />
12.3 2 0.84 0.02 12.2 0.5 0.24 0.031<br />
12.3 1 0.47 0.024 13.3 2 0.44 0.031<br />
12.8 1 0.2 0.046 11.1 1.5 0.78 0.018<br />
7.7 0.25 0.048 0.18 9.8 2 1.18 0.018<br />
10.3 1 0.64 0.02 10 0.25 0.165 0.037<br />
10.8 0.5 0.27 0.025 11.4 1.5 0.76 0.019<br />
10.8 0.25 0.108 0.04 10.4 1.5 0.885 0.019<br />
7.7 1 0.15 0.048 12.3 1.5 0.63 0.022<br />
13.1 0.5 0.09 0.1 11.3 1 0.52 0.02<br />
7.7 0.5 0.08 0.099 10.3 0.5 0.335 0.023<br />
13.3 0.5 0.065 0.159 9.5 1.5 0.9 0.019<br />
13.1 1 0.26 0.046 7.7 0.25 0.044 0.191<br />
52
Etters 1991 Experiment 20<br />
In December 1991, Etters published results from an experiment investigating the effect <strong>of</strong><br />
pH and dye concentrations on fiber dye uptake under equilibrium conditions. 8/1’s cotton yarn<br />
knitted into tubes was dyed with indigo, sodium hydrosulfite, and sodium hydroxide or proprietary<br />
buffered alkali solution. Dye baths were prepared by mixing the required amount <strong>of</strong> dye with either<br />
20 grams <strong>of</strong> NaOH to obtain dye bath pH <strong>of</strong> 13.1-13.3 or with 100 ml <strong>of</strong> buffered alkali solution to<br />
obtain dye bath pH <strong>of</strong> 11.1-11.3. 10 grams <strong>of</strong> sodium hydrosulfite and 600 ml <strong>of</strong> de-ionized water at<br />
80° C were then added to each mixture and stirred for 30 seconds to facilitate dye reduction to<br />
leuco form. The total volume was then increased to 2 liters with de-ionized water at room<br />
temperature. The following indigo dye concentrations were prepared (expressed as 100% pure<br />
indigo): 0.05, 0.10, 0.175, 0.25, 0.375, 0.50, 0.625, 0.75, 1.00, 1.125, 1.25, 1.5, 2.00, and 2.50 g/l.<br />
To perform the dyeings, the knitted tubes were wet out at room temperature in baths<br />
containing 5 g/l wetting agent. The tubes were then rinsed three times in warm de-ionized water<br />
and squeezed to 71% pick-up. A 1 g sample <strong>of</strong> the rinsed knit tube was attached to the sample<br />
holder <strong>of</strong> the dyeing machine and placed into an 850 ml dye bath which contained the specified dye<br />
amount and pH. Since the liquor ratio was 850/1, infinite dye bath conditions were in effect.<br />
Preliminary experiments revealed that the mean relative dye uptakes for 0.1 and 1.0 g/l dye bath<br />
concentrations at dyeing times <strong>of</strong> 2, 4, and 8 hours at 25° C were 0.978, 0.933, and 0.930<br />
respectively. Eight hours appeared to be more than sufficient to achieve a close approximation to<br />
equilibrium. Cross sections <strong>of</strong> yarn and fibers were examined to confirm complete penetration after<br />
8 hours. So all dyeing was conducted over 8 hours with agitation at 25° C in covered cylinders. After<br />
dyeing, the samples were exposed to air for 30 seconds to promote dye oxidation, rinsed with warm<br />
de-ionized water, and squeezed to about 71% pickup. The samples were then dried overnight at 65°<br />
C in an oven.<br />
Fiber dye content was determined by using pyridine extraction technique. 20 to 60 mg<br />
dried sample from each dye condition was weighed, stored in a desiccator with anhydrous CaSO4 for<br />
24 hours, and weighed again. Dye was extracted using pyridine at about 80° C. The resulting dye<br />
solutions were built to 25 ml in a volumetric flask and the absorbance <strong>of</strong> each solution was<br />
measured at a wavelength <strong>of</strong> 610 nm using a spectronic colorimeter. Using known absorbance<br />
53
versus concentration data, the dye content was calculated. The results <strong>of</strong> the equilibrium sorption<br />
experiment were summarized in table 1-9.<br />
Table 1-9: Etters 1991 <strong>Equilibrium</strong> sorption <strong>of</strong> indigo on cotton obtained from different pHs in grams <strong>of</strong> dye per 100<br />
grams <strong>of</strong> water(bath) or fiber. 20<br />
Cb Cf(pH=13.2) Cf(pH=11.2) Cb Cf(pH=13.2) Cf(pH=11.2)<br />
0.005 0.075 0.316 0.075 0.635 1.557<br />
0.005 0.077 0.314 0.0875 0.649 1.679<br />
0.01 0.139 0.553 0.0875 0.652 1.727<br />
0.01 0.14 0.561 0.1 0.753 1.742<br />
0.0175 0.195 0.69 0.1 0.729 1.837<br />
0.0175 0.189 0.7 0.1125 0.81 2.098<br />
0.025 0.296 0.933 0.1125 0.767 1.971<br />
0.025 0.3 0.917 0.125 0.872 2.111<br />
0.0375 0.361 1.047 0.125 0.838 2.147<br />
0.0375 0.342 0.999 0.15 0.907 2.34<br />
0.05 0.472 1.239 0.15 0.927 2.517<br />
0.05 0.444 1.296 0.2 1.251 3.181<br />
0.0625 0.513 1.409 0.2 1.191 3.024<br />
0.0625 0.525 1.459 0.25 1.44 3.518<br />
0.075 0.547 1.535 0.25 1.465 3.418<br />
Etters 1994 Experiment 27<br />
To investigate shade sensitivity as a function <strong>of</strong> pH, Etters designed an experiment at two<br />
different pH levels and small permutations <strong>of</strong> pH were introduced. The experiment utilized 8/1’s<br />
denim yarn knitted into tubes with a flattened width <strong>of</strong> 4.5 cm and weight <strong>of</strong> 7.2 grams per 30 cm<br />
length.<br />
The dye baths were three liters in total volume to ensure infinite dye bath conditions. Table<br />
1-10 outlines the dye concentrations utilized in the experiment.<br />
54
Table 1-10: Dye concentrations required to yield equivalent shade at different pHs. 27<br />
K/S pH 11.0 pH 12.5<br />
50 0.5 g/l 1.7 g/l<br />
100 1.0 g/l 3.2 g/l<br />
200 2.1 g/l 6.5 g/l<br />
In addition to the indigo dye concentration, 2.0 g/l <strong>of</strong> sodium hydrosulfite was maintained in all dye<br />
baths. pH <strong>of</strong> 11.0 was obtained by using 50 g/l <strong>of</strong> commercial buffered alkali, Virco Buffer ID. A<br />
nearly equivalent total alkalinity amount <strong>of</strong> sodium hydroxide was used to obtain 12.5 pH. The dye<br />
bath pH was then adjusted downward with the addition <strong>of</strong> sodium bisulfite and upward with sodium<br />
hydroxide.<br />
The knitted tubes were wet out at room temperature in a solution containing 1.5 g/l sodium<br />
dioctyl sulfosuccinate, wetting agent, and passed through a pad. The tubes were then rinsed with<br />
de-ionized water and squeezed again. Finally the tubes placed into a fresh bath <strong>of</strong> de-ionized water<br />
until needed.<br />
To dye each tube, the excess de-ionized water was squeezed from the tube prior to<br />
immersion into the dye bath at room temperature for 15 seconds. The excess dye liquor was then<br />
squeezed from the tube to 70% pick-up and air oxidized for 45 seconds. This process was repeated<br />
4 times on each tube to simulate a 5 dip dye range. After all dyeings were completed, the tubes<br />
were rinsed together with warm water until the rinse water appeared to be colorless. After drying<br />
all the tubes, reflectance measurements were collected using a LabScan 6000 spectrophotometer.<br />
Corrected K/S values were calculated based on the 660 nm wavelength reflectance. The results are<br />
summarized in table 1-11.<br />
55
Table 1-11: % reflectance and corrected K/S values for different dyebath concentrations and pH. 27<br />
Cb (g/l) pH %Rc K/S Cb (g/l) pH %Rc K/S<br />
0.5 10.6 2.52 48 1.7 12.1 2.29 62.2<br />
0.5 10.8 2.5 48.9 1.7 12.3 2.38 55.8<br />
0.5 11 2.48 50 1.7 12.5 2.47 50.5<br />
0.5 11.2 2.51 48.4 1.7 12.7 2.59 44.8<br />
0.5 11.4 2.53 47.5 1.7 12.9 2.74 39.3<br />
1 10.6 2.01 97 3.2 12.1 1.9 123.9<br />
1 10.8 2 98.9 3.2 12.3 1.95 110.1<br />
1 11 1.99 101 3.2 12.5 1.99 101<br />
1 11.2 2 98.9 3.2 12.7 2.05 89.8<br />
1 11.4 2.01 97 3.2 12.9 2.12 79.6<br />
2.1 10.6 1.77 184.1 6.5 12.1 1.7 248.9<br />
2.1 10.8 1.75 198.9 6.5 12.3 1.72 226.2<br />
2.1 11 1.75 198.9 6.5 12.5 1.75 198.9<br />
2.1 11.2 1.76 191.2 6.5 12.7 1.78 177.5<br />
2.1 11.4 1.77 184.1 6.5 12.9 1.81 160.2<br />
Chong 1995 Experiment 29<br />
The material used in the experiment was 16/1’s yarn woven in a 2x1 twill with 78x50<br />
construction. One standard dipping consisted <strong>of</strong> immersing the material into a leuco indigo dye<br />
bath for 1 minute followed by immediate air oxidation for 3 minutes. 5 successive dips were chosen<br />
as the standard procedure. After dyeing, the material was thoroughly rinsed and soaped at boil for<br />
10 minutes in a soaping bath containing 1.5 g/l <strong>of</strong> Lissapol NX. The standard dye bath consisted <strong>of</strong><br />
the following formula.<br />
Indigo dye – 2 g/l<br />
Sodium dithionite – 6 g/l<br />
Caustic soda – 5 g/l<br />
Sandozin NI – 0.2 g/l<br />
The reduction <strong>of</strong> indigo dye was carried out at 80° C for 10 minutes.<br />
calculated.<br />
After each dyeing the color yield as expressed by Kubelka-Munk K/S at 660 nm was<br />
56
Xin 2000 Experiment 46<br />
In 2000 Xin, Chong, and Tu studied the effects <strong>of</strong> indigo, caustic, and hydro concentrations,<br />
immersion time, and number <strong>of</strong> indigo dips on the depth <strong>of</strong> shade. They used a 100% cotton 7/1’s<br />
open end yarn loosely knitted into fabric as the dyeing substrate. The fabric was boiled for 30<br />
minutes in a solution <strong>of</strong> Sandopan DTC (1 g/l, wetting agent) and caustic soda (1.5 g/l) with a liquor<br />
ratio <strong>of</strong> 30:1. The fabric was then air dried.<br />
The basic dye bath formula utilized 2 g/l <strong>of</strong> 100% indigo, 4 g/l <strong>of</strong> sodium hydrosulphite<br />
(85%), and 4 g/l sodium hydroxide. The fabric was dyed at room temperature with each dip<br />
immersed for 30 seconds. The excess liquor was removed by squeezing to 80% wet pick-up and air<br />
oxidized for 2 minutes. Five dips were simulated for all experiments except on the effect <strong>of</strong> dips.<br />
After dyeing each fabric was thoroughly rinsed with warm water.<br />
To evaluate the dyed samples spectrophotometric analysis was conducted. The K/S value at<br />
660 nm and an Integ value, expressed in equation 1-37, were used.
1.5.2. Discussion <strong>of</strong> Previously Published Experimental Results<br />
1.5.2.a Oxidation Time Effect on Indigo Dye Uptake<br />
To achieve the progressive build-up <strong>of</strong> indigo dye it is important to ensure adequate<br />
oxidation time after each immersion. If complete oxidation is not allowed to occur, desorption <strong>of</strong><br />
indigo dye from the cotton yarn will result in weaker dye build-up. As part <strong>of</strong> Chong’s 1995<br />
experiment the effect <strong>of</strong> oxidation time was evaluated. While the K/S values have not been<br />
corrected, the results are still relative. Figure 1-26 shows the effect <strong>of</strong> oxidation time on the color<br />
depth. Complete oxidation is achieved after 60 seconds. Oxidation times in excess <strong>of</strong> 60 seconds<br />
are not required to completely develop the indigo shade.<br />
K/S<br />
30<br />
25<br />
20<br />
15<br />
10<br />
Effect <strong>of</strong> Oxidization Time on Depth <strong>of</strong> Shade<br />
30 60 90 120 150 180<br />
Figure 1-26: Effect <strong>of</strong> oxidation time on color. 29<br />
Oxidization Time (sec)<br />
58
1.5.2.b Amount <strong>of</strong> Reduction Agent Effect <strong>of</strong> Indigo Dye Uptake<br />
The effect <strong>of</strong> excess hydro was investigated by Xin and the results displayed in figure 1-27.<br />
Only a minor change in dye yield was observed between 0 g/l to 0.25 g/l (excess). Greater excess<br />
hydro concentrations beyond 0.25 g/l had no appreciable impact on dye yield. There is <strong>of</strong> course<br />
the limiting case, when excessive hydro actually doesn’t permit complete oxidation during the<br />
skying phase. In this case, reduced indigo can be stripped from the yarn and the depth <strong>of</strong> shade<br />
reduced.<br />
Figure 1-27: Effect <strong>of</strong> reduction agent concentration on shade. 46<br />
59
1.5.2.c Immersion Time Effect <strong>of</strong> Indigo Dye Uptake<br />
Xin's investigation into immersion time effects on indigo dye uptake is shown in figure 1-28.<br />
Any immersion time greater than 20 seconds does not affect the dye yield significantly. Dye yield<br />
had slight changes between 0 to 20 seconds. Typical indigo dye ranges have 20 to 30 seconds <strong>of</strong><br />
immersion time.<br />
Figure 1-28: Effect <strong>of</strong> immersion time on shade. 46<br />
Chong 29 also investigated the effect <strong>of</strong> increasing immersion time on color depth. In figure<br />
1-29, an immersion time <strong>of</strong> 30 seconds appears to be adequate. Prolonged immersion time does<br />
not increase the color depth because the oxidized indigo on the material may be re-reduced by the<br />
reducing agents present and causes desorption <strong>of</strong> the indigo. These two separate experiments<br />
support each other’s conclusions.<br />
60
K/S<br />
30<br />
25<br />
20<br />
15<br />
10<br />
Effect <strong>of</strong> Immersion Time on Depth <strong>of</strong> Shade<br />
15 30 45 60 75 90<br />
Immersion Time (sec)<br />
Figure 1-29: Chong's effect <strong>of</strong> immersion time on uncorrected K/S. 29<br />
1.5.2.d Number <strong>of</strong> Dips Effect <strong>of</strong> Indigo Dye Uptake<br />
As previously stated indigo dye has a low affinity for cotton. To increase the depth <strong>of</strong> shade<br />
multiple dips are widely utilized. Xin explored the impact <strong>of</strong> multiple dips on the resulting shade<br />
with results shown in figure 1-30. The effect <strong>of</strong> number <strong>of</strong> dye dips produced results as expected.<br />
As the number <strong>of</strong> dips increased, the shade darkened. After the 8 th dip the change in depth <strong>of</strong> shade<br />
significantly decreases but does continue to darken. Also notice the cast shifts from greenish dark<br />
blue to redder less blue shade as the number <strong>of</strong> dips increase.<br />
61
Figure 1-30: Relationship between number <strong>of</strong> dips and shade. 46<br />
Since the color depth <strong>of</strong> indigo dyed yarns relies on the progressive build-up <strong>of</strong> color<br />
through successive dipping and oxidation, the number <strong>of</strong> dips is the prime factor determining the<br />
final color yield. As shown in figure 1-31, the optimum color yield is achieved after about 10 dips.<br />
Chong 29 and Xin 46 independently confirm the results.<br />
62
Figure 1-31: Chong's relationship between number <strong>of</strong> dips and uncorrected K/S. 29<br />
1.5.2.e Dye Bath Concentration Effect <strong>of</strong> Indigo Dye Uptake<br />
The effect <strong>of</strong> dye concentration was studied by immersing knitted fabric into the simulated 5<br />
dip method with varying dye bath concentrations by Xin 46 . The first graph in figure 1-32 illustrates a<br />
rapidly decreasing L* value with increasing dye concentrations until ~2 g/l, after which the level <strong>of</strong><br />
decrease lightness slows down and tends to level <strong>of</strong>f. The cast shift is displayed in the second graph<br />
<strong>of</strong> figure 1-32 with the shade shifting more red and yellow as dye concentration was increased. The<br />
final graph in figure 1-32 confirms the increasing depth <strong>of</strong> shade trend as indigo dye bath<br />
concentration was increased.<br />
63
Figure 1-32: Relationship between dye bath concentration and shade. 46<br />
Chong 29 examined the effect <strong>of</strong> indigo dye bath concentration on color yield as shown in<br />
figure 1-33. The affinity <strong>of</strong> indigo dye is very low, as is its build-up property. Hence increased color<br />
depth cannot be achieved solely by increasing the dye concentration. In fact the color yield remains<br />
fairly flat after 3 g/l.<br />
64
Figure 1-33: Chong's relationship between dye bath concentration and uncorrected K/S. 29<br />
1.5.2.f The Affect <strong>of</strong> pH on Indigo Dye Uptake<br />
Since leuco indigo is a weak acid, the pH <strong>of</strong> the dye liquor will have a significant effect on<br />
dye yield. This can be explained by ionization which changes the substantivity <strong>of</strong> the dye to cotton<br />
fiber. The highest substantivity <strong>of</strong> dye for the cotton fiber can be achieved at about pH 10.0. Thus<br />
the degree <strong>of</strong> ring dyeing would be higher at pH 11.0 then more conventional pH region <strong>of</strong> 12.0-<br />
13.0. The effect <strong>of</strong> pH on depth <strong>of</strong> shade and the corresponding cast shift is illustrated in figure 1-<br />
34.<br />
65
Figure 1-34: pH effect <strong>of</strong> shade with other parameters held constant. 46<br />
Although the maximum Integ shade in graph 3 <strong>of</strong> figure 1-34 reveal that color yield is much<br />
greater for a dyeing conducted at pH 11 then it is for a dyeing conducted at pH 13, a more detailed<br />
picture is given in figure 1-35. At a given indigo on weight <strong>of</strong> yarn concentration, the color yield will<br />
be greater at lower pH. Maximum color yield occurs in pH range <strong>of</strong> 10.5 to 11.5 and decreases as<br />
the dye bath pH is increased. It was suggested that it is owing to the higher affinity and lower<br />
solubility <strong>of</strong> the monophenolate form <strong>of</strong> indigo present at this pH range.<br />
66
Figure 1-35: K/S shade e vs % indigo on weight <strong>of</strong> yarn at various pH’s 3<br />
Etters & Hou<br />
have noteed<br />
ring dyeingg<br />
<strong>of</strong> cotton yaarn<br />
can be cauused<br />
by a high<br />
strike rate o<strong>of</strong><br />
the<br />
dye foor<br />
the cotton fiber in the yyarn<br />
surface, i.e. the dye exhausts<br />
rapiddly<br />
onto the fibers<br />
in the oouter<br />
zoness<br />
<strong>of</strong> the yarn at a the expensse<br />
<strong>of</strong> fibers in the yarn inteerior.<br />
Vickersstaff<br />
has obseerved<br />
that "… the<br />
diffussion<br />
rate cann not indicate thhe<br />
actual proogress<br />
<strong>of</strong> dyeing<br />
in the initiial<br />
stages, as tthis<br />
is determmined<br />
by thee<br />
affinity <strong>of</strong> th he dye. If twoo<br />
dyes are present<br />
in a binnary<br />
mixture, the dye whicch<br />
is first adsoorbed<br />
by thee<br />
fiber is that having the higher<br />
affinityy,<br />
irrespectivee<br />
<strong>of</strong> their relattive<br />
diffusion rates."<br />
Affinity or substantivityy<br />
<strong>of</strong> a dye for a fiber can bee<br />
expressed in<br />
terms <strong>of</strong> ann<br />
equilibrium<br />
distribbution<br />
coeffic cient or K, thee<br />
ratio <strong>of</strong> concentrations<br />
o<strong>of</strong><br />
dye in fiberr<br />
to dye in dyee<br />
bath at<br />
equilibrium.<br />
Relat tively high values<br />
<strong>of</strong> distribbution<br />
coefficient<br />
indicate relatively higgh<br />
substantiviity<br />
or<br />
affinitty<br />
<strong>of</strong> the dye for the fiber. Figure 1-36 illustrates thee<br />
ratio <strong>of</strong> dyee<br />
in denim yarrn<br />
to dye in an<br />
infinitte<br />
indigo dye bath as givenn<br />
from 5 dip laboratory<br />
dyeings<br />
conduccted<br />
at pH 11 and 13. Thesse<br />
values<br />
may be rega arded as techhnical<br />
quantitties<br />
since theyy<br />
were not obbtained<br />
under<br />
equilibrium<br />
conditions.<br />
Both pH p ranges exhhibit<br />
a linear rrelationship,<br />
but the slopee<br />
<strong>of</strong> the lowerr<br />
pH line is muuch<br />
steeper.<br />
This data suggest thatt<br />
either the “aaffinity”<br />
<strong>of</strong> the<br />
dye for the fiber is muchh<br />
higher at the<br />
30 .<br />
67
lowerr<br />
pH or the dif ffusion <strong>of</strong> thee<br />
dye into thee<br />
fiber is muchh<br />
more rapid at the lower pH. Either wway<br />
the diistribution<br />
co oefficients aree<br />
much higher<br />
at lower pH values than at higher pH values.<br />
Figure 1-36: Non-equilibrium<br />
Concenttration<br />
<strong>of</strong> dye inn<br />
fiber (g/100g) vvs<br />
concentration<br />
<strong>of</strong> dye in bathh<br />
(g/100g). 20<br />
<strong>Equilibrium</strong> m sorption isootherms<br />
for inndigo<br />
on cottton<br />
fiber weree<br />
obtained att<br />
two dye bath<br />
pH<br />
rangees<br />
(11.1-11.3) and (13.1-133.3)<br />
from 8 hoour<br />
dyeings. TThese<br />
isotherrms<br />
show a laarge<br />
differencce<br />
in<br />
technnical<br />
paramete ers such as dyye<br />
uptake, yaarn<br />
penetratioon,<br />
and color yield. To clarify<br />
this pointt,<br />
the<br />
equilibrium<br />
sorptio on data are plotted<br />
in figure<br />
1-37. The indigo uptakke<br />
is significanntly<br />
higher forr<br />
the<br />
dyeings<br />
at the lower<br />
pH. Furtheermore,<br />
the isotherms<br />
aree<br />
not linear ass<br />
were the noon-equilibriumm<br />
isotheerms<br />
given in figure 1-36. For the expeerimental<br />
conditions<br />
used, no obvious aapproach<br />
to a<br />
limitinng<br />
fiber satur ration value iss<br />
evident for ddyeings<br />
at eitther<br />
pH rangee.<br />
The previoously<br />
observed<br />
pH<br />
effectt<br />
on dye uptake<br />
appears too<br />
be caused bby<br />
a real difference<br />
in appaarent<br />
affinity.<br />
68
Figure 1-37: <strong>Equilibrium</strong><br />
isotherm for dye concentration<br />
in dye bath and fiber (g/100<br />
When figure<br />
1-37 is recconfigured<br />
onn<br />
a logarithmic<br />
scale, an exxcellent<br />
linearr<br />
correlation<br />
betweeen<br />
equilibriu um concentraation<br />
<strong>of</strong> dye inn<br />
the fiber annd<br />
dye in the ddye<br />
bath is obbtained<br />
as shown<br />
in figuure<br />
1-38. This s indicates thhat<br />
equilibriumm<br />
sorption in both pH’s arre<br />
effectively described by the<br />
Freunndlich<br />
isotherm<br />
20 . A Freundlich<br />
isothermm<br />
is characteerized<br />
by the ppower<br />
functioon<br />
or linear<br />
relatioonship<br />
on log g by log scale. .<br />
0g). 20<br />
69
Figure 1-38: Logarithm mic plot <strong>of</strong> equiliibrium<br />
isothermms<br />
for dye conce<br />
The mean technical disttribution<br />
coefficient<br />
is calcculated<br />
by divviding<br />
the inddigo<br />
concentrration<br />
in yarrn<br />
by indigo concentration<br />
in dye bath. In figure 1-39<br />
the relationnship<br />
betweeen<br />
dye bath pH<br />
and teechnical<br />
distr ribution coeffficient,<br />
K, andd<br />
the coefficieent<br />
<strong>of</strong> variatioon<br />
<strong>of</strong> %CV aree<br />
given. The<br />
technnical<br />
distributi ion coefficiennt<br />
decreases wwith<br />
increasinng<br />
pH and thee<br />
%CV increasses.<br />
This meaans<br />
substantivity<br />
assoc ciated with ring<br />
dyeing andd<br />
color yield bbecome<br />
moree<br />
variable witth<br />
increasing pH.<br />
Although<br />
this infor rmation is bassed<br />
on laboraatory<br />
dyeings according too<br />
Etters 30 , the results from<br />
commmercial<br />
dyeing gs tend to connfirm<br />
the connstancy<br />
<strong>of</strong> subbstantivity<br />
<strong>of</strong> indigo for deenim<br />
yarn wheen<br />
dye bath<br />
pH is mai intained within<br />
the range <strong>of</strong> 10.8 to 11.2.<br />
entration. 20<br />
70
Figure 1-39: Mean technical distribution as a function <strong>of</strong> dyebath pH. 30<br />
Ring dyeing <strong>of</strong> yarns can be increased by dyeing conditions that promote a very fast initial<br />
strike <strong>of</strong> the dye for the fiber surface. The rapid exhaustion <strong>of</strong> the dye onto the fibers in the exterior<br />
regions <strong>of</strong> the yarn will lead to decreased dyeing <strong>of</strong> the fibers in the yarn interior. Recall the<br />
expression derived by Etters, K/S = at[Cf/(2p – p 2 )]; where at is the true value <strong>of</strong> the reflectance<br />
absorptivity coefficient, i.e., the value for uniform distribution <strong>of</strong> dye in the yarn cross-section, Cf is<br />
the concentration <strong>of</strong> dye in the yarn, and p is the fractional penetration <strong>of</strong> fixed dye in the yarn<br />
cross-section. This equation will hold approximately unless a severe concentration gradient exists<br />
within the dyed ring or colorant layer becomes translucent. The values <strong>of</strong> p have been roughly<br />
estimated by microscopy to be 0.65, 0.33, 0.20, and 0.20 for pH ranges 13, 12, 11, and 10<br />
respectively 33 .<br />
71
Etters' equ uation makes use <strong>of</strong> the true<br />
reflectancce<br />
absorptivity<br />
coefficient. However in<br />
practiical<br />
indigo dyeing<br />
processees<br />
true reflectance<br />
absorpptivity<br />
coefficiients<br />
must bee<br />
replaced by<br />
apparrent<br />
coefficients.<br />
The relationship<br />
betwween<br />
apparennt<br />
reflectancee<br />
absorptivityy<br />
coefficient aand<br />
dye bath<br />
pH is illus strated in figuure<br />
1-40. As tthe<br />
dye bath pH decreasess<br />
from 13 to 111<br />
there is moore<br />
ring ddyeing<br />
and an increasing appparent<br />
refleectance<br />
absorrptivity<br />
coefficcient.<br />
It has bbeen<br />
found thhat<br />
betweeen<br />
pH 10.8 and a 11.2, the greatest coloor<br />
yield is achieved.<br />
Figure 1-40: Apparent reflectance abssorptivity<br />
coefficcient<br />
vs pH. 30<br />
Figure 1-41<br />
illustrates the<br />
apparent reflectance aabsorptivity<br />
cooefficients<br />
<strong>of</strong>f<br />
figure 1-40<br />
plotteed<br />
as a functio on <strong>of</strong> the techhnical<br />
distribution<br />
coefficients<br />
with addditional<br />
data points addedd<br />
from other dye bat th pH’s. As thhe<br />
distributioon<br />
coefficient increases, thhe<br />
color yield also increasees.<br />
It<br />
may bbe<br />
concluded from figure 11-41<br />
that the yarn ring dyeeing<br />
phenomeenon<br />
is highlyy<br />
correlated wwith<br />
increaasing<br />
substan ntivity and strike<br />
<strong>of</strong> indigo for cotton fibber<br />
that is asssociated<br />
with lower pH dyee<br />
bathss.<br />
The fact tha at the appareent<br />
reflectancce<br />
absorptivitty<br />
coefficientss<br />
found in theese<br />
experiments<br />
72
are pH dependent can be explained by the effect <strong>of</strong> pH on the distribution <strong>of</strong> dye in the cross-<br />
section <strong>of</strong> yarn. As the degree <strong>of</strong> ring dyeing increases so does the apparent absorptivity coefficient.<br />
Figure 1-41: Reflectance absorptivity coefficient as a function <strong>of</strong> mean technical distribution coefficient. 30<br />
Etters 15 proposed the effect <strong>of</strong> pH on distribution coefficient and apparent absorptivity<br />
coefficient is due to the ionized form <strong>of</strong> the dye molecule in the dye bath. The fraction <strong>of</strong> reduced<br />
indigo that exists as the mono-ionic form is given by equation 1-38.
Here pK1 and pK2 are a the pKa vaalues<br />
associated<br />
with the two step ioniization<br />
<strong>of</strong> reduced<br />
indigo 15<br />
Meann<br />
values <strong>of</strong> mo ono-ionic formm<br />
are plottedd<br />
in figure 1-442<br />
as a functioon<br />
<strong>of</strong> dye bath<br />
pH. It is nooted<br />
abovee<br />
pH 11.5 the fraction <strong>of</strong> inndigo<br />
that exiists<br />
as a monoo-anion<br />
beginns<br />
to drop <strong>of</strong>ff<br />
rather severrely<br />
and continues<br />
to decrease d as pH<br />
increases. This is due too<br />
more <strong>of</strong> thee<br />
mono-ionic fform<br />
ionizingg<br />
furtheer<br />
to produce e the more sooluble<br />
di-ionicc<br />
form. At dyee<br />
bath pH <strong>of</strong> 12.7 about haalf<br />
<strong>of</strong> the indiigo<br />
existss<br />
as mono-ion nic and half haas<br />
di-ionic forrm.<br />
Figure 1-42: Relationship<br />
<strong>of</strong> Mono-ionnic<br />
species <strong>of</strong> inddigo<br />
and pH. 30<br />
The mean technical disttribution<br />
coefficients<br />
are pplotted<br />
as a function<br />
<strong>of</strong> the<br />
mean fractiion<br />
<strong>of</strong><br />
reducce<br />
indigo that t exists as a mmono-ionic<br />
forrm<br />
at various dye bath pH’s,<br />
figure 1-433.<br />
There is ann<br />
excepptionally<br />
high linear correlaation<br />
betweeen<br />
the substanntivity<br />
<strong>of</strong> indigo<br />
for cottonn<br />
fiber and thee<br />
fractioon<br />
<strong>of</strong> indigo that t exists in mono-ionic foorm.<br />
Etters 155<br />
concluded that<br />
the monoo-ionic<br />
form o<strong>of</strong><br />
indigoo<br />
has a much higher substaantivity<br />
for cootton<br />
fiber thhen<br />
does the ddi-ionic<br />
form. .<br />
5 .<br />
74
Figure 1-43: Relationship<br />
between meean<br />
technical distribution<br />
coeffficient<br />
and fraction<br />
<strong>of</strong> indigo existing<br />
as mono- ionic<br />
form. 300<br />
Recall redu uced indigo can<br />
exist in twwo<br />
forms: monophenolate<br />
ion or biphennolate<br />
ion. Shade<br />
depthh<br />
for a given amount a <strong>of</strong> fixed<br />
dye is shown<br />
to be highhly<br />
correlatedd<br />
with the fractional<br />
amouunt<br />
<strong>of</strong><br />
indigoo<br />
that exists as a a monopheenolate<br />
ion inn<br />
dye bath. Thhe<br />
correlationn<br />
is explainedd<br />
as an increaased<br />
apparrent<br />
affinity <strong>of</strong> o the mono aanion<br />
form. AAs<br />
the affinityy<br />
increases, thhe<br />
strike rate <strong>of</strong> the dye foor<br />
the<br />
yarn ssurfaces<br />
incre eases, leadingg<br />
to a more ring<br />
dyed yarnn.<br />
It is readily y seen that thhe<br />
fractional aamount<br />
<strong>of</strong> the<br />
mono-ionicc<br />
form is maxiimum<br />
near thhe<br />
regionn<br />
<strong>of</strong> maximum m reflectancee<br />
absorptivity.<br />
By converting<br />
the apparent<br />
reflectance<br />
absorptivity<br />
into a fractional fo orm and superimposing<br />
on top <strong>of</strong> the fractional<br />
amoount<br />
<strong>of</strong> mono-ionic<br />
form ass<br />
a<br />
functiion<br />
<strong>of</strong> pH, the e relationshipp<br />
becomes cleearer,<br />
figure 11-44.<br />
Only at low pH valuees<br />
does this<br />
75
elationship break down. This can be explained by the superficial staining <strong>of</strong> the yarn by the acid<br />
leuco form (II). Based on these results, it is reasonable to postulate that the mono-ionic form is the<br />
principal species absorbed by the cotton. Or at least mono-ionic form has the highest apparent<br />
affinity for cotton.<br />
Figure 1-44: Correlation <strong>of</strong> fractional distribution <strong>of</strong> apparent absorptivity coefficient and mono-ionic form <strong>of</strong> indigo as a<br />
function <strong>of</strong> pH. 15<br />
76
1.5.2. g Interrelatio onship <strong>of</strong> Dye Concentratioon<br />
and pH on Shade<br />
Given the strong effect dye bath conncentration<br />
and<br />
pH indepeendently<br />
havee<br />
on the resulting<br />
dye uptake,<br />
penetration,<br />
and shhade;<br />
a more in-depth disccussion<br />
is warranted.<br />
Figuure<br />
1-45<br />
demoonstrates<br />
the mean indigo concentratioon<br />
in the dye bbath<br />
needed to produce a given shade<br />
depthh<br />
(K/S) at various<br />
dye bath pH values. FFor<br />
example tthe<br />
indigo conncentration<br />
reequired<br />
to<br />
produuce<br />
a rather dark d shade (K/ /S = 100) is about<br />
3 g/l at pH 12.5. But only 1 g/l <strong>of</strong> indigo in dyee<br />
bath<br />
is required<br />
to prod duce the samee<br />
shade depth<br />
at pH 11.0. This is the reesult<br />
<strong>of</strong> dye ddistribution<br />
wwithin<br />
the crross<br />
section <strong>of</strong> o yarn.<br />
Figure 1-45: Indigo con<br />
laborattory<br />
dyeing 30 ncentration in ddye<br />
bath requireed<br />
to produce a given shade deppth<br />
at various pH’s<br />
from a 5 dipp<br />
.<br />
When the dye uptake ddata<br />
is plottedd<br />
vs. dye bathh<br />
pH, the folloowing<br />
relationnship<br />
developps,<br />
figuree<br />
1-46. It is sh hown the maxximum<br />
uptakke<br />
at a particuular<br />
pH depennds<br />
on the concentration<br />
o<strong>of</strong><br />
dye inn<br />
the dye bath h. Maximum uptake occurs<br />
between ppH<br />
9.25 – 10.55.<br />
As the concentration<br />
<strong>of</strong>f<br />
dye<br />
in thee<br />
dye bath inc creases the mmaximum<br />
uptaake<br />
occurs at lower and lower<br />
pH valuees<br />
within the<br />
speciffied<br />
range. It t could be thaat<br />
all <strong>of</strong> the dyye<br />
extracted ffrom<br />
the knitted<br />
yarn tubee<br />
was not in ffact<br />
77
“taken up” by the fiber. Some <strong>of</strong> the dye may have been merely precipitated within the knitted yarn<br />
bundle.<br />
Figure 1-46: Effect <strong>of</strong> dye bath concentration and pH on dye uptake. 15<br />
In figure 1-47 dye uptake is shown to increase linearly with increasing concentration <strong>of</strong> dye<br />
in the dye bath. The linear relationship holds for all dye bath pH values but the slopes <strong>of</strong> the lines<br />
are shown to increase as dye bath pH decreases from 13.3 to ~10 range. As pH continues to<br />
decrease to the 7.7 range, the dye uptake slopes drop sharply.<br />
78
Figure 1-47: Yarn dye uptake as a function <strong>of</strong> dye bath concentration and pH. 15<br />
The linear relationship between K/S and concentration <strong>of</strong> dye in the substrate is illustrated<br />
in figure 1-48. The slope <strong>of</strong> each pH range corresponds to the various apparent reflectance<br />
absorptivity coefficients. The apparent absorptivity coefficients increase as the pH is decreased<br />
from 13.3 to ~ 11.0 pH. As the pH is further decreased to 10.0 the absorptivity coefficients<br />
decrease. And as the pH is reduced to 7.7 the line slope decreases to the extent that is<br />
superimposed on the line slope obtained at pH 13.3.<br />
79
Figure 1-48: Corrected depth <strong>of</strong> shade as a linear function <strong>of</strong> indigo concentration in yarn and dyebath pH. 15<br />
Since less indigo dye bath concentration is required at lower pH values to achieve a desired<br />
shade, less indigo is washed <strong>of</strong>f <strong>of</strong> the yarn at the conclusion <strong>of</strong> dyeing. In figure 1-49 the<br />
concentration <strong>of</strong> unfixed indigo has been estimated by Etters 30 as a function <strong>of</strong> both concentrations<br />
<strong>of</strong> dye in the dye bath and dye bath pH. As the dye bath pH decreases, the amount <strong>of</strong> oxidized<br />
indigo that is trapped between the fibers in the denim yarn is decreased. Therefore, less dye is<br />
available to be washed <strong>of</strong>f <strong>of</strong> the yarn.<br />
80
Figure 1-49: Estimated d concentration <strong>of</strong> unfixed indiggo<br />
on yarn at coorresponding<br />
dye<br />
bath concentrration<br />
and pH. 300<br />
1.5.2. h Empirical in ndigo dye moodel<br />
The Holy Grail G for indigo<br />
dyers worlddwide<br />
would be a dye moddel<br />
relating inndigo<br />
on weigght<br />
<strong>of</strong><br />
yarn aand<br />
shade to various contrrollable<br />
dye rrange<br />
parameeters.<br />
This onne<br />
equation hhas<br />
not yet beeen<br />
deriveed.<br />
But an em mpirical modeel<br />
based on a 5 dip laborattory<br />
experimeent<br />
has been proposed byy<br />
Etterss<br />
21 . In this mo odel the dye bath indigo concentration<br />
and pH is used<br />
to predict the distributtion<br />
coeffiicient,<br />
indigo on weight <strong>of</strong>f<br />
yarn, and subsequently<br />
thhe<br />
final yarn sshade.<br />
The empirical<br />
model is based on thee<br />
Southeasterrn<br />
Section 15 and<br />
Annis reseearch<br />
19 . The ddata<br />
obtainned<br />
from bot th investigatioons<br />
is based oon<br />
5 dip, 15 seecond<br />
immerrsions<br />
<strong>of</strong> knittted<br />
denim yarn<br />
tubess<br />
as previously y outlined. By<br />
analyzing thhese<br />
two dataa<br />
sets, Etters 2<br />
matheematical<br />
mod del.<br />
21 developed<br />
The techni ical distribution<br />
coefficient,<br />
K, is defined<br />
in equationn<br />
1-39 to equaal<br />
the<br />
conceentration<br />
<strong>of</strong> dye d in the fibeer,<br />
Cf, divided by the conceentration<br />
<strong>of</strong> ddye<br />
in the dyee<br />
bath, Cb. Thhe<br />
conceentrations<br />
are e expressed inn<br />
terms <strong>of</strong> graams<br />
<strong>of</strong> dye peer<br />
100 grams <strong>of</strong> fiber or water.<br />
the followingg<br />
81
1.6 Summary <strong>of</strong> Key Developments and Identification <strong>of</strong> Deficiencies<br />
The head indigo dyer responsible for daily production quality is always relentlessly searching<br />
for new methods, procedures, and technology to reduce variability in the indigo dyeing process.<br />
Their shade control war chest includes some basic qualitative rules <strong>of</strong> thumb for indigo dyeing.<br />
1. If the shade drifts green and light, reduce the hydrosulfite.<br />
2. If shade drifts red, reduce caustic and/or slightly increase hydro.<br />
3. If changing green and dull, increase caustic.<br />
4. If drifting red and dull, increase hydro.<br />
5. A gradual increase or decrease in depth, if on cast, is corrected by changing the indigo feed rate.<br />
6. If increase in depth is accompanied by bronzing, increase hydro and/or decrease dye feed rate.<br />
While these qualitative measures can not be forgotten, further improvements in shade control and<br />
prediction can only be made with definitive quantitative measures.<br />
To the aim <strong>of</strong> reducing the art <strong>of</strong> dyeing and increasing the science <strong>of</strong> dyeing, much<br />
improvement has been made over the last 20+ years. Through many laboratory experiments we<br />
now have a much greater understanding <strong>of</strong> indigo dye uptake, penetration distribution, and<br />
corresponding shade as it relates to dye bath concentration, pH, and number <strong>of</strong> dips. Finally an<br />
empirical model has been proposed to relate the desired dye outcome to measurable and<br />
controllable dyeing parameters. Unfortunately the head indigo dyer cannot take these relationships<br />
directly to production environment due to the key underlying assumptions.<br />
Let’s begin the discussion with where all the indigo dye goes from a macroscopic scale. It<br />
may sound elementary, yet no model has been published to accurately account for all the indigo<br />
dye. We know how much indigo is fed to the range. But how much is removed during washing? At<br />
the overflow? Current indigo dye terminology expresses % indigo on weight <strong>of</strong> yarn as a function <strong>of</strong><br />
pounds per minute <strong>of</strong> indigo and pounds per minute <strong>of</strong> cotton. This relationship does not account<br />
for either. Attempts have been made to explain the amount <strong>of</strong> dye removed during washing yet<br />
these have not been substantiated with actual production data.<br />
83
No attempt has been made to relate classical diffusion theory to the experimental data for<br />
dyeing denim yarn with indigo. Many <strong>of</strong> the expressions and terms have been employed but not the<br />
actual diffusion solutions. In as such, the diffusion coefficient for the indigo-cotton dye system has<br />
not been completely explored or expressed. More specifically the potential dependence on dye<br />
bath pH, dye concentration in the dye bath, dye concentration in the yarn, boundary layer, and/or<br />
other yet unknown parameters is not fully understood.<br />
All <strong>of</strong> the experimental data presented in the literature are based on laboratory dyeings.<br />
While this research certainly explains the relationship <strong>of</strong> variable effects on measurable responses, it<br />
does not directly provide quantitative relationships on production dye equipment. There are four<br />
fundamental issues that may affect the results.<br />
The substrates used in the experiments have been some form <strong>of</strong> fabric either knitted tubes<br />
or woven twills. In either case, the interlacing or interloping <strong>of</strong> yarns may affect the amount <strong>of</strong> dye<br />
uptake. This is due to where the two yarns cross; dye is not allowed to contact the yarn surface. As<br />
a result, the measured dye concentration in fiber will probably be less than the results on actual<br />
production yarns. Furthermore, the fabric structure makes any measured shade values (K/S)<br />
depend on the substrate. While these are probably relative to each other, the shade values will not<br />
directly correlate to production dyed denim yarns.<br />
In all <strong>of</strong> Etters non-equilibrium experiments, a 15 second immersion time was used. While<br />
this is a viable dwell time for indigo dyeing, not every dye range matches this time exactly. Chong 29<br />
and Xin 46 have demonstrated the significant effect immersion times less than 30 seconds have on<br />
the resulting shade. Any indigo dyer with immersion times different than 15 seconds must proceed<br />
cautiously when applying Etters’ relationships.<br />
The vast majority <strong>of</strong> indigo dyed cotton experiments have been conducted with simulated 5<br />
dip dye range set-up. While 5 dip dyeing may represent a significant amount <strong>of</strong> the denim yarn<br />
dyed, it is certainly not the only set-up. In fact the majority <strong>of</strong> denim shade spectrum produced falls<br />
within the 2 to 8 dip range. Once again, Chong 29 and Xin 46 have demonstrated the significant affect<br />
number <strong>of</strong> dyes has on the resulting shade. Since indigo dye uptake and/or degree <strong>of</strong> penetration<br />
84
may be affected by previous dye applications (i.e. previous dip), relationships derived from 5 dip<br />
simulations may not translate to more or fewer dips.<br />
The movement <strong>of</strong> dye bath during the simulated laboratory experiments may affect the final<br />
dye uptake and penetration. More specifically, no discussion <strong>of</strong> agitation during dyeing experiments<br />
was mentioned. Dye bath agitation has been well documented to have a significant effect on<br />
disperse dye uptake on polyester. While the same relationship may not hold true for indigo-cotton<br />
system, the contrary has not be demonstrated. Furthermore, it may not be possible to recreate real<br />
world boundary layer development in the laboratory.<br />
Etters’ empirical indigo dye model appears to accurately predict yarn shade and dye uptake<br />
given certain dye range parameters, specifically dye bath concentration and pH. However this<br />
model is derived from very specific laboratory conditions involving: substrate, number <strong>of</strong> dips,<br />
immersion time, and agitation (boundary layer development). Furthermore, the indigo penetration<br />
is modeled as a step function. All <strong>of</strong> these issues may have some affect on Etters’ empirical indigo<br />
dye model. More importantly since no actual production data was given for comparison or<br />
compared to classical diffusion theory, at the very least it raises some doubt.<br />
85
2 Objectives <strong>of</strong> the Present Investigation<br />
Although there is a long history <strong>of</strong> dyeing denim yarn with indigo, the process <strong>of</strong> dyeing with indigo<br />
still remains largely an art and not a science. - Zhou 48<br />
In an ideal world to investigate the effect <strong>of</strong> yarn count, number <strong>of</strong> dips, immersion time,<br />
dye bath pH, speed, and dye bath concentration on yarn uptake <strong>of</strong> dye and the resulting shade; a<br />
systematic design <strong>of</strong> experiment would be conducted. At last, this researcher has yet to find a<br />
denim manufacture willing to “blindly” produce a million+ yards <strong>of</strong> denim fabric that would be<br />
required for such an experiment. As a result, an indigo-cotton dye observational study is proposed<br />
that would gather key processing parameters and yarn samples during "actual indigo dyeing”<br />
process. It is hoped the resulting data and relationships provide more refined insight into the<br />
indigo-cotton dye system.<br />
By processing yarn skeins through an actual indigo dye range it is put forth many <strong>of</strong> the<br />
issues surrounding laboratory experiments will be avoided. While certain dye parameters cannot be<br />
controlled by the experimenter, others can actually be more easily manipulated. Furthermore,<br />
careful selection <strong>of</strong> various production shades should yield adequate variation in the dyeing<br />
parameters to produce reliable results.<br />
For each set <strong>of</strong> skeins processed, the following dye range set-up conditions were monitored.<br />
1. Date and time skeins were processed.<br />
2. Production shade number, dye range, and location.<br />
3. Production yarn count and total number <strong>of</strong> ends per ball<br />
4. Production indigo, caustic, and hydro feed rates to the dye range.<br />
5. Dye range speed<br />
6. Immersion time (dye dwell time)<br />
7. Sky time (oxidation time)<br />
8. Chemical checks made by the technician (g/l <strong>of</strong> indigo, mV potential, vatometer, pH, and %<br />
alkalinity.<br />
9. Yarn count <strong>of</strong> skeins and the sequence <strong>of</strong> dye boxes that they were processed through.<br />
86
The following response variables were measured.<br />
1. Greige weight <strong>of</strong> skein and shade<br />
2. Laboratory prepared weight <strong>of</strong> skein and shade<br />
3. Dyed but unwashed weight <strong>of</strong> skein and shade<br />
4. Dyed and laboratory washed weight <strong>of</strong> skein and shade<br />
- All weight measurements will be conducted according to AATCC methods.<br />
5. Shade readings will include the CIELAB L*, a*, b* values using 10° observer and D65<br />
illuminant; and % reflectance from 400 to 700 nm at 20 nm intervals.<br />
6. <strong>%IOWY</strong> determination by 1-Methyl-2-Pyrrolidinone extraction<br />
Data analysis involved comparing chemical on weight <strong>of</strong> yarn measurements to actual<br />
production parameters. Determination <strong>of</strong> fixed versus unfixed indigo dye on yarn was calculated<br />
from before and after washed skeins.<br />
An empirical model based on analysis <strong>of</strong> indigo on weight <strong>of</strong> yarn and shade values was<br />
developed. This model was based on two different indigo dye ranges. This should yield a more<br />
reliable and transferable indigo-cotton dye model. Next the diffusion coefficients were calculated<br />
for various dyeing set-ups and analysis identified key influential parameters. To validate the<br />
empirical dye model, comparisons were evaluated to classical diffusion theory and previously<br />
published laboratory experiments.<br />
A reliable indigo model would improve quality control by removing the “art” <strong>of</strong> indigo<br />
dyeing and replacing with the “science” <strong>of</strong> indigo dyeing. At the very least a better understanding <strong>of</strong><br />
the indigo dye process would allow the production dyer to better control the process. Most<br />
optimistically an accurate indigo-cotton dye model would allow product development to design dye<br />
range set-ups to produce new and unique dye shades possessing shade and penetration<br />
characteristics never before imagined.<br />
While much research has been conducted in the field <strong>of</strong> chain rope indigo dyeing, many<br />
questions still remain unanswered. Specifically a rigorous math and science based model to explain<br />
dye pick-up, final shade, and dye penetration. Previous research has indicated dye bath<br />
concentration, immersion time, number <strong>of</strong> dips, pH, and reduction potential have a significant effect<br />
on the dye on weight <strong>of</strong> yarn and the resulting shade. Furthermore little research actually specifies<br />
87
quantitative changes and instead focuses on general trends and qualitative relationships. This<br />
researcher submits that dye range speed would also have a significant contribution to dye pick-up<br />
and shade. Furthermore, the specific quantity <strong>of</strong> indigo on weight <strong>of</strong> yarn and resulting shade was<br />
predicted given fundamental dye range parameters.<br />
Ideally, a design <strong>of</strong> experiment would be evaluated to determine the effect <strong>of</strong> each listed<br />
variable. Alas, laboratory dye equipment has restrictions on dwell length and immersion time over a<br />
range <strong>of</strong> typical dye range speeds. Not to mention limitations on dye bath volume and maintaining<br />
chemical equilibrium. Furthermore, such an experiment cannot be conducted on production dye<br />
equipment since strict and specific dye conditions must be maintained in order to ensure proper<br />
shade on bulk production orders. However, an observational study <strong>of</strong> indigo dyeing may be<br />
conducted on production bulk equipment without adversely affecting bulk orders. Specifically, dye<br />
pick-up or percent indigo on weight <strong>of</strong> yarn and shade can be measured on skeins while noting the<br />
various dye range parameters. While the researcher cannot change the dye range parameters to a<br />
specific value in a study, multiple evaluations over a range <strong>of</strong> production dyeings will allow<br />
determination <strong>of</strong> parameter affects on response variables.<br />
At the conclusion <strong>of</strong> the study, mechanical dye range parameters: speed, immersion thread-<br />
up length, oxidation time, and number <strong>of</strong> dips coupled with dye bath conditions: indigo dye bath<br />
concentration, pH, and reduction potential effects will be evaluated on response variables % indigo<br />
on weight <strong>of</strong> yarn, shade, and dye penetration. Insight will be gained regarding equilibrium sorption<br />
<strong>of</strong> indigo dyed cotton yarns by maximum dye up take and resulting shade. This information was<br />
presented to quantify the level <strong>of</strong> indigo penetration when ring dyeing conditions exist. Last the<br />
relationships will be viewed under Fick's laws <strong>of</strong> diffusion. The extension to diffusion equations will<br />
explain the cause and effect and allow a rigorous mathematical model to be developed. Specifically<br />
the diffusion coefficients for the cotton-indigo interface will be determined.<br />
88
3 Experimental Methods and Procedures<br />
To evaluate production indigo dyeing without influencing actual production orders, skeins <strong>of</strong><br />
cotton yarns were tied onto the production yarns during the dyeing process. By running skeins<br />
instead <strong>of</strong> looking at actual production yarns, effects <strong>of</strong> boil <strong>of</strong>f efficiency, washing after boil <strong>of</strong>f,<br />
washing after indigo dyeing, and sulfur dye bottom or top were eliminated. Additionally, yarn skeins<br />
were prepared in a laboratory to ensure consistent base for dyeing from skein to skein.<br />
Additionally, skeins were made from the same yarn package to remove inconsistencies from yarn<br />
package to package. These precautions provided consistent base from dye set-up to set-up since<br />
bulk production yarns will most certainly vary over the observational time frame.<br />
3.1 Response Variables Definition, Collection Methods, and Evaluation Methods<br />
3.1.1 Yarn Skein Definition and Creation<br />
A yarn skein consists <strong>of</strong> evenly wound yarns from the same yarn count to produce a uniform<br />
loop. The loop can then be tied at the top to maintain integrity while being handled. A yarn skein<br />
was made by winding a specific yarn count into a loop <strong>of</strong> approximately 80 centimeters in length,<br />
100 loops, and weighing roughly 4 to 8 grams. The specific length, number <strong>of</strong> loops and weight<br />
wasn't critical. The weight for each skein was later measured and documented. The specific yarn<br />
counts used for this study were 6.3/1, 7.1/1, 8.0/1, and 12.0/1 English cotton count formed on an<br />
open end Schlafhorst spinning frame.<br />
3.1.2 Running Yarn Skeins on Production Indigo Dye Range Equipment<br />
Laboratory prepared yarn skeins were tied onto a production dye range in multiple locations<br />
by the use <strong>of</strong> a 100% polyester spun thread. The polyester thread was strong enough to ensure the<br />
skein remained tied to the production rope while easily broken when pulled <strong>of</strong>f later. Also note the<br />
100% polyester thread will not be dyed by indigo and therefore will not interfere during the dyeing<br />
process. A simple loop knot was tied around the yarn skein with 8 inches extra thread on both sides<br />
<strong>of</strong> the knot. While the dye range was running, a simple, loose double knot was formed around the<br />
production rope. With one swift motion starting above the head, tighten the first knot followed by<br />
89
the second knot to secure the skein to the production rope. With practice, the procedure becomes<br />
effortless.<br />
Most indigo dye ranges have walkways and platforms around the wash boxes, after the boil-<br />
<strong>of</strong>f box, as well as the indigo dye boxes. These allow operators to access the production cotton<br />
ropes to repair lost or broken ends while the dye range remains operational. This researcher used<br />
these access points to tie on the yarn skeins. Following standard production procedures the skeins<br />
would be immersed in at least one wash box before entering the indigo dye boxes. The wash box<br />
would remove trapped air in and around the cotton fibers as well as provide uniform water pick up.<br />
To pull <strong>of</strong>f the yarn skeins a simple good grip and quick pull breaks the polyester thread.<br />
Ideally this process should be conducted while the polyester thread and production rope interface<br />
was in direct contact with a steel roller in the sky or oxidation section after each indigo box. The<br />
contact point provides stability to the production yarn thereby resisting the pulling motion. To avoid<br />
a dye range stop, pull down (perpendicular to the roller axis <strong>of</strong> rotation), never across (parallel to<br />
the roller axis)! Any parallel motion can pull the production rope out <strong>of</strong> track.<br />
3.1.3 Yarn Skein Evaluations<br />
Once the yarn skeins were processed, critical information was measured and recorded.<br />
These measured values will later be the response variables used to evaluate dye range parameter<br />
effects. The first group <strong>of</strong> response variables was dry weight measurements which were conducted<br />
on the yarn skeins in accordance to AATCC 20A section 8 (Moisture Content) method. All weights<br />
were measured on a Mettler AE100 scale. The weight was recorded before laboratory preparation<br />
and noted as "greige" weight. After the skeins had been laboratory prepared the weight was<br />
recorded as "boil-<strong>of</strong>f" weight. The weight was measured after processing through the dye range.<br />
This last weight measurement was recorded as "dyed" weight. Finally, the dyed yarn skeins were<br />
washed in the laboratory and identified as "washed" weight.<br />
The “%Boil-Off Loss” was defined as the difference in Greige weight and Boil-<strong>of</strong>f weight<br />
divided by the Greige weight as shown in equation 3-1.<br />
90
%
data analysis due to greater acceptance and use in literature. The following Methyl Pyrrolidinone<br />
method to measure the <strong>%IOWY</strong> was provided by Clariant Inc.<br />
1. Prepare the solvent solution as follows: (sufficient for one sample)<br />
To a 400 ml beaker, add:<br />
200 ml <strong>of</strong> distilled water<br />
7.2 grams <strong>of</strong> sodium hydroxide (50%)<br />
4.0 grams <strong>of</strong> sodium hydrosulfite (90%)<br />
After the sodium hydrosulfite was dissolved, add 120 ml <strong>of</strong> 1-Methyl-2-Pyrrolidinone<br />
Cool to ambient temperature and pour into a graduated cylinder. Then fill to the 400 ml mark with<br />
distilled water and mix well before use.<br />
2. Weigh out yarn per Table 3-1 and place in a 250 ml volumetric flask. Add the solvent solution<br />
prepared in step #1 to the mark. Add a 1.5 inch magnabar and stir for 15 minutes.<br />
Note: At the end <strong>of</strong> this time, the indigo on the yarn should be completely reduced. The yarn<br />
should be devoid <strong>of</strong> color unless sulfur dye was present on the yarn.<br />
3. Recheck the volume in the flask by removing the magnabar. If necessary, add solvent solution<br />
prepared in step #1 to bring back up to the 250 ml mark in the flask and mix well.<br />
4. To a 100 ml volumetric flask, add 80 - 90 mls <strong>of</strong> the solvent solution prepared from step #1.<br />
Pipette 5.0ml <strong>of</strong> the solution from step #3, being careful to wipe <strong>of</strong>f any excess from the outside <strong>of</strong><br />
the pipette.<br />
Note: Dip the point <strong>of</strong> the pipette into the solvent solution to prevent oxidation <strong>of</strong> the reduced<br />
indigo.<br />
5. Dilute to the 100 ml mark with the solvent solution prepared in step #1.<br />
6. On a suitable spectrophotometer, record the absorbance <strong>of</strong> the solvent solution prepared in step<br />
#1 at 406 nm using a 1cm cell. [Current study used a Thermo Spectronic 20D+.]<br />
7. Measure the maximum absorbance <strong>of</strong> the sample solution prepared in step #5 at 406nm. Adjust<br />
the sample absorbance by adding or subtracting the absorbance <strong>of</strong> the blank solution measure in<br />
step #6.<br />
8. Calculation by equation 3-4:<br />
%
Table 3-1: Target dyed yarn sample weight for Methyl Pyrrolidinone extraction<br />
Anticipated Indigo Concentration Amount <strong>of</strong> Yarn to Weigh<br />
5 - 7% 1.5 - 2.0 grams<br />
8 - 12% 1.0 - 1.5 grams<br />
13 - 17% 0.5 - 1.0 grams<br />
18 - 30% 0.4 - 0.7 grams<br />
The resulting <strong>%IOWY</strong> calculated from the Spectrophotometric Methyl Pyrrolidinone<br />
extractions were expressed in terms <strong>of</strong> 20% paste. This convention has its roots from the days when<br />
20% indigo paste was the only commercially available concentration. Today 20%, 40% and even<br />
42% indigo paste is commercially available. To express the indigo dye concentration more<br />
generically the above value was divided by 5 to make the units <strong>%IOWY</strong> in terms <strong>of</strong> 100% indigo as<br />
outlined in equation 3-5. This final form was used in all subsequent analysis and will here forth be<br />
known simply as <strong>%IOWY</strong>.<br />
%
K/S was given in equation 3-6. The %reflectance values were measured on a Hunterlab ColorQuest<br />
XE running on Gretag-Macbeth SLI-Form s<strong>of</strong>tware.<br />
<br />
<br />
= ( %) <br />
∗ %<br />
Equation 3-6: Calculation <strong>of</strong> K/S from Kubelka-Munk.<br />
−<br />
( %) <br />
∗ %<br />
To ensure accurate and repeatable shade measurements the yarn skeins were wrapped<br />
around a white plastic board 6 centimeters wide. By pulling the yarns tight during the wrapping<br />
process, the individual yarns were straight without any knots or twists and parallel to one another.<br />
The shade was measured with a 1 inch port on the spectrophotometer. The shade s<strong>of</strong>tware<br />
automatically averages three individual readings. By moving the yarn skein between individual<br />
readings the average % reflectance was calculated. Furthermore each dyed yarn skein was<br />
measured on three separate occasions. The three separate readings were later averaged in<br />
Micros<strong>of</strong>t's Excel spreadsheet which resulted in the % reflectance values at each wavelength<br />
representing nine different readings.<br />
To represent the total shade over many wavelengths in one number, the value <strong>of</strong> Integ has<br />
been developed. As pointed out by Xin 46 the Integ value has greater importance when evaluating<br />
shade over a wide range <strong>of</strong> depths as the maximum absorption wavelength tends to shift at greater<br />
depths <strong>of</strong> shade. In equation 3-7, Eλ equals the spectral power distribution <strong>of</strong> the illuminant. The xλ<br />
+ yλ + zλ function was the standard observer function. All shade evaluations were conducted using<br />
D65 illuminant with a 10° observer.
Graphical representation <strong>of</strong> the K/S by wavelengths further illustrates the shift Xin was<br />
referring. Figure 3-1 shows the K/S by wavelength from multiple dips <strong>of</strong> 6.3/1 OE yarn in 3.0 g/l<br />
indigo dye set-up at 31 meters per minute and 12.0 pH. The maximum K/S value shifts from 660 nm<br />
at one dip to 640 nm at 3 dips. By the time dip 6 and 7 occur, the maximum K/S value occurs at 580<br />
nm. Since the wavelength <strong>of</strong> maximum K/S shade shifts, no single wavelength will accurately<br />
describe the change in shade as a function <strong>of</strong> dye concentration or location. For reference the Integ<br />
shade value for the same dips <strong>of</strong> figure 3-1 was 24.2, 64.8, 95.1, and 103.9 respectively.<br />
K/S shade value<br />
50.0<br />
45.0<br />
40.0<br />
35.0<br />
30.0<br />
25.0<br />
20.0<br />
15.0<br />
10.0<br />
5.0<br />
0.0<br />
K/S Shade Values by Wavelength for Typical 3.0<br />
gm/lit Indigo Dye Set-up<br />
400 450 500 550 600 650 700<br />
Wavelength (nm)<br />
1 dip 3 dip 6 dip 7 dip<br />
Figure 3-1: Relationship <strong>of</strong> maximum K/S shade shift as depth increases<br />
In addition to the shifting maximum wavelength, the K/S shade value was non-linear as a<br />
function <strong>of</strong> <strong>%IOWY</strong>. In the past this had been corrected by Etters and others by adjusting the K/S<br />
value for higher <strong>%IOWY</strong>. This approach worked for relatively low <strong>%IOWY</strong> values. However as the<br />
<strong>%IOWY</strong> or degree <strong>of</strong> ring dyeing was increased the K/S value not only was non-linear but non-<br />
unique. In figure 3-2 at 580 nm the K/S shade becomes non-linear at approximately 1.25% IOWY. At<br />
95
660 nm the K/S shade value becomes non-linear at 0.75 <strong>%IOWY</strong>. Furthermore K/S660nm reached a<br />
maximum value at 1.25 <strong>%IOWY</strong>. With continued increase in <strong>%IOWY</strong> the K/S660nm shade value<br />
actually decreased in value. No amount <strong>of</strong> mathematical correction could compensate for this<br />
relationship. Figure 3-2 illustrates the relationship <strong>of</strong> Integ to <strong>%IOWY</strong>. While this function was<br />
certainly not linear, at least the values are unique over the entire <strong>%IOWY</strong> range and possessed<br />
greater change in value at higher <strong>%IOWY</strong> measurements. Therefore Integ shade value was used for<br />
all future calculations related to shade.<br />
Integ or K/S Shade Value<br />
120.0<br />
100.0<br />
80.0<br />
60.0<br />
40.0<br />
20.0<br />
0.0<br />
Integ and K/S Shade at 580nm and 660nm vs <strong>%IOWY</strong><br />
0.000% 0.500% 1.000% 1.500% 2.000% 2.500% 3.000% 3.500%<br />
Figure 3-2: Relationship <strong>of</strong> K/S by wavelength as a function <strong>of</strong> <strong>%IOWY</strong><br />
The final response variable was a calculation based on the shade <strong>of</strong> the yarn and <strong>%IOWY</strong>,<br />
equation 3-8. This response variable qualifies the “location” <strong>of</strong> the indigo in the cross section <strong>of</strong> the<br />
yarn. A relatively lower penetration factor value indicates more indigo penetration into the cross<br />
section <strong>of</strong> the yarn, while a higher value indicates less penetration. Of course this value is relative to<br />
other skeins dyed under similar conditions.<br />
<strong>%IOWY</strong><br />
580nm 660nm Integ<br />
96
Penetration Factor = <br />
%<br />
Equation 3-8: Calculation <strong>of</strong> penetration factor from Integ and <strong>%IOWY</strong>.<br />
3.2 Determining Optimum Method for Laboratory Preparation<br />
During the indigo dyeing process, 100% cotton yarn was run through the dye range to<br />
produce a specific desired shade. The cotton yarn was first exposed to the “Boil-Off” box, which<br />
contained chelate, wetter, sodium hydroxide, and water (and sometimes sulfurs dyes). The purpose<br />
<strong>of</strong> this box was to prepare the yarn for the subsequent indigo dye boxes. The experimenter wished<br />
to conduct an observational study <strong>of</strong> the various parameters that affect the indigo dye process. But<br />
one key parameter was the boil-<strong>of</strong>f box, which was not a desired part <strong>of</strong> the study. To overcome<br />
this obstacle, skeins were prepared in a laboratory thereby bypassing the boil <strong>of</strong>f box on the dye<br />
range. This would allow other factors <strong>of</strong> interest to be studied without the negative impact <strong>of</strong> boil-<br />
<strong>of</strong>f box variation and/or sulfur dye from regular production.<br />
Previously published articles on indigo dyeing have used a variety <strong>of</strong> preparation methods.<br />
Some researchers have used room temperature distilled water. Some have used water and wetters.<br />
Finally, a few have used water, wetters, and sodium hydroxide. What was the best laboratory<br />
preparation process? What characteristics does a good laboratory procedure possess?<br />
Some initial trials run and intuition from this experimenter indicated: the dwell time,<br />
temperature, and amount <strong>of</strong> sodium hydroxide played a major role in the laboratory preparation<br />
process. The use <strong>of</strong> chelates was ultimately only important in bulk production equipment designed<br />
to run continuously for hours. The experimenter wished to develop a laboratory preparation<br />
procedure, which was robust in design. Ideally, reasonably small changes in time, temperature,<br />
and/or sodium hydroxide concentration have little to no effect on the degree <strong>of</strong> dyeing. Or at the<br />
very least the experimenter needs to understand the amount <strong>of</strong> error the lab preparation procedure<br />
can impart on the research to be conducted.<br />
To understand the laboratory preparation procedure better, the experimenter conducted a<br />
design <strong>of</strong> experiment based on central composite design with axial components that were<br />
97
orthogonal and inscribed with 4 replicated center points under two blocks. The three factors <strong>of</strong><br />
interest were time the skeins were allowed to “cook”, temperature the skeins were “cooked”, and<br />
sodium hydroxide concentration <strong>of</strong> the bath used for "cooking". Time was measured with a<br />
stopwatch in minutes with a range <strong>of</strong> 20 to 40 minutes. Temperature was measured with a<br />
thermometer with a range <strong>of</strong> 76 °C to 100 °C. The sodium hydroxide concentration was measured<br />
on weight basis with a range from 0 to 15 grams per liter where a measured weight <strong>of</strong> sodium<br />
hydroxide was added to a measured volume <strong>of</strong> water. The sodium hydroxide used in this<br />
experiment was a 50% solution not dry weight and the units were actually X g/l <strong>of</strong> 50% sodium<br />
hydroxide.<br />
The two blocks <strong>of</strong> the design <strong>of</strong> experiment consisted <strong>of</strong> the actual indigo dyeing process.<br />
Block #1 was the skeins run through only one dip <strong>of</strong> indigo. Block #2 was the skeins run through six<br />
dips <strong>of</strong> indigo. While six dips <strong>of</strong> indigo represents typical indigo dyeing set-up, one dip <strong>of</strong> indigo<br />
produced the most extreme case with the yarn skein exposed to the least amount <strong>of</strong> indigo. This<br />
should accentuate any variation in the yarn skeins from the laboratory preparation procedure.<br />
Using SAS's JMP 8.0 statistical s<strong>of</strong>tware package, the central composite experimental design<br />
was laid out and the package automatically created a randomized run order. Following this run<br />
order each laboratory preparation recipe was mixed with 3.785 liters <strong>of</strong> water, brought to the<br />
correct temperature, and yarn skein added for the desired amount <strong>of</strong> time. After the required time,<br />
the yarn skein was removed from the boil-<strong>of</strong>f mixture and washed under hot water at 40°C for 5<br />
minutes. The washing process again mirrors actual indigo dye range set-up, which was to remove<br />
residual boil-<strong>of</strong>f mixture from the cotton yarn.<br />
Table 3-2 details the level <strong>of</strong> each variable and the order in which it was conducted in the<br />
laboratory. This run order list was used for block #1, one dip <strong>of</strong> indigo. There were 4 response<br />
variables that were measured at each level <strong>of</strong> the laboratory preparation procedure. These<br />
consisted <strong>of</strong> the %Boil-Off Loss, <strong>%IOWY</strong>, Integ shade, and penetration factor as defined in section<br />
3.1.<br />
98
Table 3-2: Time, temperature, and sodium hydroxide concentration levels plus response variable for one dip <strong>of</strong> indigo<br />
Pattern Time Temperature NaOH %Boil-Off <strong>%IOWY</strong> Integ Penetration Run<br />
(min) (°C)<br />
(g/l) Loss<br />
Factor Order<br />
a00 20 88 7.5 2.00% 0.307% 23.0 75.01 1<br />
+-- 37 79 2.25 1.34% 0.115% 23.3 201.47 2<br />
000 30 88 7.5 2.11% 0.270% 22.4 82.86 3<br />
A00 40 88 7.5 2.62% 0.283% 27.2 96.23 4<br />
+++ 37 96 12.7 2.62% 0.306% 23.3 75.98 5<br />
0A0 30 100 7.5 2.77% 0.310% 26.4 85.26 6<br />
000 30 88 7.5 2.34% 0.336% 23.2 69.10 7<br />
++- 37 96 2.25 2.26% 0.341% 25.4 74.54 8<br />
00A 30 88 15 2.26% 0.348% 21.6 62.07 9<br />
00a 30 88 0 1.46% 0.202% 23.4 115.78 10<br />
000 30 88 7.5 2.21% 0.312% 25.3 81.05 11<br />
-+- 23 96 2.25 2.37% 0.240% 23.1 96.06 12<br />
0a0 30 76 7.5 1.32% 0.155% 23.3 150.37 13<br />
+-+ 37 79 12.7 1.43% 0.085% 23.3 272.92 14<br />
--+ 23 79 12.7 1.71% 0.104% 23.3 223.49 15<br />
--- 23 79 2.25 1.27% 0.019% 23.2 1232.46 16<br />
-++ 23 96 12.7 2.94% 0.261% 22.7 86.77 17<br />
000 30 88 7.5 2.20% 0.296% 22.2 75.09 18<br />
Table 3-3 details the run order in the laboratory for block #2, six dips <strong>of</strong> indigo. This list was also<br />
randomized and the corresponding measured response variables were included.<br />
99
Table 3-3: Time, temperature, and sodium hydroxide concentration levels plus response variable for six dips <strong>of</strong> indigo<br />
Pattern Time Temperature NaOH %Boil-Off <strong>%IOWY</strong> Integ Penetration Run<br />
(min) (°C)<br />
(g/l) Loss<br />
Factor Order<br />
+-+ 37 79 12.7 1.47% 1.818% 98.4 54.13 1<br />
-++ 23 96 12.7 2.89% 2.190% 96.5 44.08 2<br />
a00 20 88 7.5 2.02% 2.043% 97.3 47.62 3<br />
-+- 23 96 2.25 2.19% 2.109% 96.0 45.50 4<br />
++- 37 96 2.25 2.63% 2.059% 93.9 45.60 5<br />
0A0 30 100 7.5 2.68% 2.158% 95.6 44.30 6<br />
--- 23 79 2.25 1.09% 1.869% 100.1 53.56 7<br />
+-- 37 79 2.25 1.30% 1.902% 91.0 47.86 8<br />
000 30 88 7.5 2.19% 2.224% 93.4 41.99 9<br />
000 30 88 7.5 2.41% 2.159% 100.9 46.73 10<br />
00a 30 88 0 1.26% 1.940% 93.5 48.21 11<br />
A00 40 88 7.5 2.79% 2.073% 97.0 46.80 12<br />
000 30 88 7.5 2.28% 2.250% 94.3 41.94 13<br />
0a0 30 76 7.5 1.02% 1.719% 100.3 58.33 14<br />
+++ 37 96 12.7 3.52% 2.208% 99.4 45.02 15<br />
000 30 88 7.5 2.11% 2.034% 100.5 49.43 16<br />
--+ 23 79 12.7 1.18% 1.637% 95.1 58.06 17<br />
00A 30 88 15 2.22% 2.167% 98.9 45.65 18<br />
The data analysis was broken into five parts. Part 1 involved the boil-<strong>of</strong>f loss during the<br />
laboratory preparation process. This does not involve the indigo dyeing process and does not<br />
require separating one dip <strong>of</strong> indigo versus six dips <strong>of</strong> indigo. In other words, the experimenter had<br />
a completely replicated central composite design with axial components. The remaining parts<br />
involved analyzing the data after the indigo dyeing process and therefore must take into<br />
consideration the amount <strong>of</strong> indigo applied from either one or six dips. Part 2 involved <strong>%IOWY</strong> after<br />
one and six dips <strong>of</strong> indigo. Part 3 involved Integ shade value after one and six dips <strong>of</strong> indigo. Part 4<br />
involved penetration factor after one and six dips <strong>of</strong> indigo. Finally, the optimum laboratory set-up<br />
was determined from the results in previous parts. While the exact indigo dye conditions were not<br />
<strong>of</strong> major importance in determining preparation parameter affects, for the record the production<br />
shade consisted <strong>of</strong> 3 g/l indigo dye bath concentration, 12.5 pH, 31 m/sec, and 8.6 meter dwell<br />
length. The skeins were prepared as outlined in section 3.2 (table 3-2 and 3-3), processed through<br />
the range as discussed in section 3.1.2, and all yarn evaluations were conducted as detailed in<br />
section 3.1.3.<br />
100
3.2.1 Analysis <strong>of</strong> Laboratory Preparation Time, Temperature, and Sodium Hydroxide Concentration<br />
Affect on %Boil-<strong>of</strong>f Loss<br />
Figure 3-3 illustrates the affect <strong>of</strong> time on the %Boil-<strong>of</strong>f loss for all data points. The general<br />
trend was slightly greater %Boil-<strong>of</strong>f loss as dwell time increased. However the effect was minimal as<br />
the average value shifts from 2.0% at 20 minutes to 2.25% at 40 minutes. Furthermore the<br />
correlation <strong>of</strong> %Boil-<strong>of</strong>f loss and time was extremely low as indicated by the R 2 value <strong>of</strong> 0.025. This<br />
low correlation was due to the high variability around the average value at each evaluated time and<br />
the relative low time dependence. This does not necessarily mean time doesn't play a significant<br />
role in %Boil-<strong>of</strong>f loss but instead the affect <strong>of</strong> time could be over shadowed by other parameters.<br />
%Boil-<strong>of</strong>f Loss<br />
4.00%<br />
3.50%<br />
3.00%<br />
2.50%<br />
2.00%<br />
1.50%<br />
1.00%<br />
0.50%<br />
0.00%<br />
Relationship <strong>of</strong> Time on %Boil-<strong>of</strong>f Loss during<br />
Laboratory Preparation<br />
Figure 3-3: Relationship <strong>of</strong> time on %boil-<strong>of</strong>f loss during laboratory preparation<br />
R² = 0.025<br />
20 25 30 35 40<br />
Time (minutes)<br />
The effect <strong>of</strong> sodium hydroxide concentration in the boil <strong>of</strong>f box is illustrated in figure 3-4.<br />
As with time, sodium hydroxide concentration causes a slight increase in %Boil-<strong>of</strong>f loss as the<br />
concentration was increased. Unlike time, sodium hydroxide appears to reach a plateau at ~11 g/l.<br />
101
Further increases in concentration appear to have a little effect on average. Also as with time, the<br />
correlation <strong>of</strong> the effect was minimal with a R 2 value <strong>of</strong> 0.148. Again the low correlation was due<br />
the high variability <strong>of</strong> %Boil-<strong>of</strong>f loss at various levels <strong>of</strong> sodium hydroxide concentration.<br />
%Boil-<strong>of</strong>f Loss<br />
4.00%<br />
3.50%<br />
3.00%<br />
2.50%<br />
2.00%<br />
1.50%<br />
1.00%<br />
0.50%<br />
0.00%<br />
Relationship <strong>of</strong> Sodium Hydroxide Concentration on<br />
%Boil-<strong>of</strong>f Loss during Laboratory Preparation<br />
R² = 0.148<br />
0 2 4 6 8 10 12 14 16<br />
Caustic Concentration (g/l)<br />
Figure 3-4: Relationship <strong>of</strong> sodium hydroxide concentration on %Boil-<strong>of</strong>f loss during laboratory preparation<br />
With very low correlations <strong>of</strong> time and sodium hydroxide concentration to %Boil-<strong>of</strong>f loss,<br />
one would expect the temperature to play a major role during the laboratory preparation process.<br />
Based on all %boil-<strong>of</strong>f loss values as a function <strong>of</strong> temperature, it does play a significant role. As<br />
temperature was increased the %Boil-<strong>of</strong>f loss also increased in a non-linear fashion as seen in figure<br />
3-5. The R 2 value was 0.687 which indicates a fairly strong single parameter correlation.<br />
Furthermore, the degree <strong>of</strong> change was rather large with 1.25% at 76°C and increasing to 2.75% at<br />
100°C. This means the %Boil-<strong>of</strong>f loss more than doubles over the range <strong>of</strong> temperatures evaluated.<br />
102
%Boil-<strong>of</strong>f Loss<br />
4.00%<br />
3.50%<br />
3.00%<br />
2.50%<br />
2.00%<br />
1.50%<br />
1.00%<br />
0.50%<br />
0.00%<br />
Relationship <strong>of</strong> Temperature on %Boil-<strong>of</strong>f Loss during<br />
Laboratory Preparation<br />
Figure 3-5: Relationship <strong>of</strong> temperature on %Boil-<strong>of</strong>f loss during the laboratory preparation<br />
Before a mathematical model <strong>of</strong> %Boil-<strong>of</strong>f loss can be constructed, possible parameter<br />
interactions must be evaluated. Interactions were easy to identify graphically as two curves will<br />
cross when each is held constant by one parameter while a second parameter is varied. Figure 3-6<br />
shows the interactions <strong>of</strong> all parameters on %Boil-<strong>of</strong>f loss. The left column <strong>of</strong> graphs show the<br />
interaction <strong>of</strong> time with temperature (middle graph) then sodium hydroxide concentration (bottom<br />
graph). The middle column <strong>of</strong> graphs show the interaction <strong>of</strong> temperature with time (top graph)<br />
and sodium hydroxide concentration (bottom graph). The right column <strong>of</strong> graphs shows the<br />
interaction <strong>of</strong> sodium hydroxide concentration with time (top graph) and temperature (middle<br />
graph). Since none <strong>of</strong> the curves on any graph cross each other, there were no significant<br />
interaction effects on %Boil-<strong>of</strong>f loss.<br />
R² = 0.687<br />
70 75 80 85 90 95 100<br />
Temperature (C)<br />
103
Interaction Pr<strong>of</strong>iles<br />
0.04<br />
0.03<br />
Time<br />
0.02<br />
(min)<br />
0.01<br />
0.04<br />
100<br />
0.03<br />
% Boil<strong>of</strong>f<br />
Loss<br />
% Boil<strong>of</strong>f<br />
Loss<br />
% Boil<strong>of</strong>f<br />
Loss<br />
0.02<br />
0.01<br />
0.04<br />
0.03<br />
0.02<br />
0.01<br />
20<br />
25<br />
30<br />
35<br />
40<br />
76<br />
15<br />
0<br />
Figure 3-6: Interaction pr<strong>of</strong>ile for time, temperature, and sodium hydroxide concentration on %boil-<strong>of</strong>f loss during<br />
laboratory preparation process<br />
The interaction pr<strong>of</strong>ile does however illustrate that time and sodium hydroxide<br />
concentration independently can play a major role in %Boil-<strong>of</strong>f loss even though the R 2 values from<br />
figures 3-3 and 3-4 were very low. For example, the lower left hand graph <strong>of</strong> %Boil-<strong>of</strong> loss as a<br />
function <strong>of</strong> time and sodium hydroxide concentration shows a change in time and sodium hydroxide<br />
concentration causes a linear change in %Boil-<strong>of</strong>f loss. Specifically, as the sodium hydroxide<br />
concentration was held constant at 0 g/l, the increase in time causes a linear increase in %Boil-<strong>of</strong>f<br />
loss. The upper right hand graph shows that as time was held constant an increase in sodium<br />
hydroxide concentration causes a non-linear increase in %Boil-<strong>of</strong>f loss. Graphical depictions <strong>of</strong><br />
single parameter affects on %Boil-<strong>of</strong>f loss highlight these detailed changes in the overall variation <strong>of</strong><br />
the experiment. A more rigorous analysis was needed to determine the significance <strong>of</strong> each<br />
parameters affect on %Boil-loss.<br />
%Boil-<strong>of</strong>f Loss Interaction Pr<strong>of</strong>ile<br />
40<br />
20<br />
Temperature<br />
(C)<br />
80<br />
85<br />
90<br />
95<br />
100<br />
15<br />
0<br />
0<br />
NaOH<br />
(g/l)<br />
An ANOVA analysis <strong>of</strong> time, temperature, and sodium hydroxide concentration on %boil-<strong>of</strong>f<br />
revealed the statistically significant parameters as well as created a model to predict %Boil-<strong>of</strong>f loss<br />
as a function <strong>of</strong> those parameters. Table 3-4 summarizes the ANOVA analysis results after removing<br />
5<br />
10<br />
40<br />
20<br />
100<br />
15<br />
76<br />
Time Temperature NaOH<br />
104
insignificant interaction effects. The parameter estimates indicate time, temperature, and sodium<br />
hydroxide concentrations each have a statistically significant affect as the P-value for each was less<br />
the 0.0059. Furthermore the analysis indicates the second order effect <strong>of</strong> temperature was<br />
statistically significant with a P-value <strong>of</strong> 0.0411. This finding was graphically supported in figure 3-5<br />
since the R 2 value for second order trend curve was higher than a linear trend line. The summary <strong>of</strong><br />
fit produces a R 2 <strong>of</strong> 0.89 for this model compared to the actual data points. Furthermore the<br />
analysis <strong>of</strong> variance calculates a P-value less than 0.0001 for this model. Both values indicate high<br />
correlation and significance for the model compared to actual data points.<br />
Table 3-4: ANOVA analysis results for laboratory preparation parameters on %Boil-<strong>of</strong>f loss<br />
The model was constructed using the estimates from the parameter estimates section in<br />
table 3-4, equation 3-9.<br />
%
This equation was represented in the prediction pr<strong>of</strong>iler graph shown in figure 3-7. Now the<br />
main effects were more easily identified. The time increased the %Boil-<strong>of</strong>f loss linearly while sodium<br />
hydroxide concentration and temperature increase have a non-linear increasing affect. Importantly,<br />
the maximum effect <strong>of</strong> sodium hydroxide on %Boil-<strong>of</strong>f loss occurs at 11 g/l regardless <strong>of</strong> time or<br />
temperature. The true relationship could be a plateau was reached at 11 g/l were further increases<br />
in concentration have little affect on %Boil-<strong>of</strong>f loss. Recall the average effect illustrated in figure 3-<br />
4. These results will later be coupled with effects <strong>of</strong> time, temperature, and sodium hydroxide<br />
concentration affects on <strong>%IOWY</strong>, Integ, and penetration factor to determine the optimum<br />
laboratory values.<br />
% Boil<strong>of</strong>f<br />
Loss<br />
0.030211<br />
±0.00233<br />
%Boil-<strong>of</strong>f Loss Prediction Pr<strong>of</strong>ile for Laboratory Preparation Process<br />
20<br />
25<br />
30<br />
Time (min) Temperature (C) NaOH (g/l)<br />
Figure 3-7: %Boil-<strong>of</strong>f loss model as a function <strong>of</strong> time (minutes), temperature (C), and sodium hydroxide concentration<br />
(g/l) in laboratory preparation process<br />
3.2.2 Analysis <strong>of</strong> Laboratory Preparation Time, Temperature, and Sodium Hydroxide Concentration<br />
Affect on <strong>%IOWY</strong> after One and Six Dip Indigo Dyeing Conditions<br />
35<br />
40<br />
The <strong>%IOWY</strong> after one and six dips <strong>of</strong> indigo as a function <strong>of</strong> time was illustrated in figure 3-8.<br />
Inspection <strong>of</strong> one dip dyeing represented by X's and solid trend line, showed poor correlation which<br />
is statistically supported by the low second order polynomial R 2 value <strong>of</strong> 0.046. While the<br />
75<br />
correlation coefficient was obviously very low the general trend was an increasing <strong>%IOWY</strong> value<br />
80<br />
85<br />
90<br />
95<br />
100<br />
0<br />
5<br />
10<br />
15<br />
106
until approximately 32 minutes. After 32 minutes the amount <strong>of</strong> <strong>%IOWY</strong> decreases with further<br />
increase in time. The <strong>%IOWY</strong> after six dips <strong>of</strong> indigo as represented by O's and dotted trend line<br />
likewise showed poor correlation which is supported by the second order polynomial with a R 2 value<br />
<strong>of</strong> 0.034. As with one dip, the <strong>%IOWY</strong> after six dips as a function <strong>of</strong> time appears to reach a critical<br />
value at 32 minutes. Further increases in time result in slightly lower <strong>%IOWY</strong>. While the effect <strong>of</strong><br />
time appears to have more importance at one dip, the same effect can be seen after six dips. The<br />
time affect was highly variable, particularly after one dip, and thus difficult to draw immediate<br />
conclusions on the role time plays in the laboratory preparation procedure.<br />
<strong>%IOWY</strong> (one dip)<br />
0.400%<br />
0.350%<br />
0.300%<br />
0.250%<br />
0.200%<br />
0.150%<br />
0.100%<br />
0.050%<br />
0.000%<br />
Effect <strong>of</strong> Time on <strong>%IOWY</strong> from One and Six Dips <strong>of</strong> Indigo<br />
R² = 0.034<br />
R² = 0.046<br />
20 25 30 35 40<br />
Time (minutes)<br />
One Dip Six Dips<br />
Figure 3-8: Relationship <strong>of</strong> laboratory preparation time on <strong>%IOWY</strong> after one and six dips <strong>of</strong> indigo dye<br />
Unfortunately the effect <strong>of</strong> laboratory preparation sodium hydroxide concentration on<br />
<strong>%IOWY</strong> was similar to the effect <strong>of</strong> time. The best curve fit after one dip was by second order<br />
polynomial with a R 2 value <strong>of</strong> 0.086. Increasing sodium hydroxide concentration resulted in<br />
2.500%<br />
2.000%<br />
1.500%<br />
1.000%<br />
0.500%<br />
0.000%<br />
increasing <strong>%IOWY</strong> until 9 g/l. Further increases in concentration resulted in decreased <strong>%IOWY</strong> as<br />
<strong>%IOWY</strong> (six dips)<br />
107
illustrated in figure 3-9. For six dips the best curve fit was described as essentially constant with a R 2<br />
value <strong>of</strong> 0.037. Again, the poor correlation was due to high variability in the data points and limited<br />
effect sodium hydroxide concentration during the laboratory preparation process played in <strong>%IOWY</strong>.<br />
<strong>%IOWY</strong> (one dip)<br />
0.400%<br />
0.350%<br />
0.300%<br />
0.250%<br />
0.200%<br />
0.150%<br />
0.100%<br />
0.050%<br />
0.000%<br />
Effect <strong>of</strong> Sodium Hydroxide Concentration on <strong>%IOWY</strong> from<br />
One and Six Dips <strong>of</strong> Indigo<br />
R² = 0.037<br />
R² = 0.086<br />
0 2 4 6 8 10 12 14 16<br />
Sodium Hydroxide Concentration (g/l)<br />
One Dip Six Dips<br />
2.500%<br />
2.000%<br />
1.500%<br />
1.000%<br />
0.500%<br />
0.000%<br />
Figure 3-9: Relationship <strong>of</strong> sodium hydroxide concentration during laboratory preparation on <strong>%IOWY</strong> from one and six<br />
dips <strong>of</strong> indigo dye<br />
The effect <strong>of</strong> temperature during laboratory preparation had a major impact on <strong>%IOWY</strong>.<br />
After one dip <strong>of</strong> indigo the best curve fit was by a second order polynomial with a R 2 value <strong>of</strong> 0.708.<br />
After six dips <strong>of</strong> indigo the second order polynomial R 2 value was 0.743. The same general trend<br />
was seen after one and six dips <strong>of</strong> indigo. Under both dyeing conditions as the temperature was<br />
increased from 76°C, the <strong>%IOWY</strong> increased. The maximum <strong>%IOWY</strong> occurred at 94°C as shown in<br />
figure 3-10. Furthermore, the change in <strong>%IOWY</strong> appears to flatten out at 94°C. The data points<br />
indicate temperatures higher then 95°C do not produce a true change in <strong>%IOWY</strong>. Also notice the<br />
<strong>%IOWY</strong> (six dips)<br />
108
variability around the curve fit appeared to reduce at higher temperatures for both one and six dip<br />
dyeings.<br />
<strong>%IOWY</strong> (one dip)<br />
0.400%<br />
0.350%<br />
0.300%<br />
0.250%<br />
0.200%<br />
0.150%<br />
0.100%<br />
0.050%<br />
0.000%<br />
Effect <strong>of</strong> Temperture on <strong>%IOWY</strong> from One and Six Dips <strong>of</strong><br />
Indigo<br />
R² = 0.743<br />
R² = 0.708<br />
70 75 80 85 90 95 100<br />
Temperature (°C)<br />
One Dip Six Dips<br />
Figure 3-10: Relationship <strong>of</strong> temperature during laboratory preparation on <strong>%IOWY</strong> from one and six dips <strong>of</strong> indigo dye<br />
The interaction <strong>of</strong> the parameters on <strong>%IOWY</strong> were also evaluated to determine if<br />
any significant effect was attributed. Figure 3-11 shows the interaction pr<strong>of</strong>iles for time,<br />
temperature, and sodium hydroxide concentration on <strong>%IOWY</strong> after one and six dips <strong>of</strong> indigo.<br />
Inspection <strong>of</strong> all graphs in figure 3-11 revealed no interactions exist as no curves cross. Temperature<br />
appears to be the only major influence on the <strong>%IOWY</strong> after one and six dips <strong>of</strong> indigo.<br />
2.500%<br />
2.000%<br />
1.500%<br />
1.000%<br />
0.500%<br />
0.000%<br />
<strong>%IOWY</strong> (six dips)<br />
109
<strong>%IOWY</strong> Interaction Pr<strong>of</strong>ile for One Dip <strong>%IOWY</strong> Interaction Pr<strong>of</strong>ile for Six Dips<br />
(min) (min)<br />
(C) (C)<br />
(g/l) (g/l)<br />
Figure 3-11: Interaction pr<strong>of</strong>ile for time, temperature, and sodium hydroxide concentration on <strong>%IOWY</strong> after one and six<br />
dips <strong>of</strong> indigo dye<br />
A full ANOVA analysis was conducted on <strong>%IOWY</strong> after one dip <strong>of</strong> indigo by time, sodium<br />
hydroxide concentration, and temperature during laboratory preparation. The analysis revealed the<br />
second order effect <strong>of</strong> time and sodium hydroxide concentration to be insignificant. Furthermore,<br />
the first order effect was actually determined to be insignificant as illustrated by the high P-values in<br />
the parameter estimates from table 3-5. Time had a P-value <strong>of</strong> 0.6761 while sodium hydroxide<br />
concentration was 0.4675. In fact, the only statistically significant parameter effect was the first and<br />
second order temperature along with intercept (P-value 0.0010, 0.0176, and 0.0259 respectively).<br />
Even though time and sodium hydroxide concentration parameters were determined to be<br />
insignificant, it is customary to leave the first order parameters in model calculations especially since<br />
the equation will be later joined with other models that may have all three parameters. The<br />
summary <strong>of</strong> fit for the resulting model was 0.71 with a P-value <strong>of</strong> 0.0029. Both indicate the model<br />
produced a reasonable fit that was statistically significant compared to the data points.<br />
110
Table 3-5: ANOVA analysis results for laboratory preparation parameters on <strong>%IOWY</strong> for one dip <strong>of</strong> indigo<br />
The exact model was constructed by pulling the parameter estimates from table 3-5 and<br />
equation 3-10 was created.<br />
%
<strong>%IOWY</strong><br />
0.002946<br />
±0.000895<br />
<strong>%IOWY</strong> Prediction Pr<strong>of</strong>ile on One Dip <strong>of</strong> Indigo for Laboratory Preparation Process<br />
20<br />
25<br />
30<br />
35<br />
40<br />
75<br />
Figure 3-12: <strong>%IOWY</strong> for one dip <strong>of</strong> indigo model as a function <strong>of</strong> time, temperature, and sodium hydroxide<br />
concentration in laboratory preparation process<br />
A full ANOVA analysis was conducted on <strong>%IOWY</strong> after six dips <strong>of</strong> indigo by time, sodium<br />
hydroxide concentration, and temperature during laboratory preparation. The results are presented<br />
in table 3-6. Just like one dip <strong>of</strong> indigo the parameter estimates indicate the first and second order<br />
term <strong>of</strong> temperature were statistically significant with P-values <strong>of</strong> ≤0.0001 and 0.0148 respectively<br />
for six dips <strong>of</strong> indigo. Time and sodium hydroxide concentration were left in the model calculations<br />
even though each was determined to be insignificant. The summary <strong>of</strong> fit for the model was<br />
calculated to be R 2 <strong>of</strong> 0.76 and the analysis <strong>of</strong> variance had a P-value <strong>of</strong> 0.0006. Both indicate the<br />
model was a good fit and statistically significant compared to the data used to create the model.<br />
80<br />
85<br />
Time (min) Temperature (C) NaOH (g/l)<br />
90<br />
95<br />
100<br />
0<br />
5<br />
10<br />
15<br />
112
Table 3-6: ANOVA analysis results for laboratory preparation parameters on <strong>%IOWY</strong> for six dips <strong>of</strong> indigo<br />
created.<br />
Using the parameter estimates from table 3-6, equation 3-11 for 6 dips <strong>of</strong> indigo was<br />
%
<strong>%IOWY</strong><br />
0.021429<br />
±0.001654<br />
<strong>%IOWY</strong> Prediction Pr<strong>of</strong>ile on Six Dips <strong>of</strong> Indigo for Laboratory Preparation Process<br />
20<br />
25<br />
30<br />
35<br />
Figure 3-13: <strong>%IOWY</strong> for six dips <strong>of</strong> indigo model as a function <strong>of</strong> time, temperature, and sodium hydroxide<br />
concentration in laboratory preparation process<br />
3.2.3 Analysis <strong>of</strong> Laboratory Preparation Time, Temperature, and Sodium Hydroxide Concentration<br />
Affect on Integ Shade Value after One and Six Dip Indigo Dyeing Conditions<br />
The general trend for time's effect on Integ shade value from both one and six dip dyeings is<br />
shown in figure 3-14. After one dip <strong>of</strong> indigo, increasing boil-<strong>of</strong>f time caused the Integ shade value<br />
to increase which indicates the indigo color became darker. The trend has an overall R 2 value <strong>of</strong><br />
0.245 which indicated a poor overall correlation. The general trend is for constant Integ shade value<br />
from 20 minutes till 30 minutes. At 30 minutes a high degree <strong>of</strong> variability exists in Integ shade<br />
value. Further increases in time result in increased Integ shade values.<br />
40<br />
75<br />
During six dips <strong>of</strong> indigo dyeing, time had the opposite effect on Integ shade value as<br />
reflected in figure 3-14. As the time increased the Integ shade value decreased indicating the indigo<br />
color becomes lighter. The trend has an overall R 2 value <strong>of</strong> 0.021 which indicates a very poor overall<br />
correlation. Over the entire time span the Integ shade value ranged from 91 at 37 minutes to 101 at<br />
30 minutes. This is a change <strong>of</strong> 10 Integ shade value units or less than 10%. The general trend for<br />
Integ as a function <strong>of</strong> time after six dips <strong>of</strong> indigo dyeing is that <strong>of</strong> constant value. Neither the one<br />
80<br />
85<br />
Time (min) Temperature (C) NaOH (g/l)<br />
90<br />
95<br />
100<br />
0<br />
5<br />
10<br />
15<br />
114
dip nor the six dip indigo dyeing condition exhibited a major contribution to Integ shade value due<br />
to time.<br />
Integ (one dip)<br />
34.0<br />
32.0<br />
30.0<br />
28.0<br />
26.0<br />
24.0<br />
22.0<br />
20.0<br />
Effect <strong>of</strong> Time on Integ from One and Six Dips <strong>of</strong> Indigo<br />
R² = 0.021<br />
R² = 0.245<br />
20 25 30 35 40<br />
Time (minutes)<br />
One Dip Six Dips<br />
Figure 3-14: Relationship <strong>of</strong> laboratory preparation time on Integ shade value from one and six dips <strong>of</strong> indigo dye<br />
Next sodium hydroxide concentration during laboratory preparation was evaluated after<br />
one and six dips <strong>of</strong> indigo. Both dyeing conditions exhibited a plateau as the sodium hydroxide<br />
concentration was increased. Figure 3-15 shows the apex is approximately 6 g/l for one dip and 11<br />
g/l for six dips. Continued increasing concentration levels beyond these values resulted in<br />
decreasing Integ values for both dip conditions. However, both dyeing conditions exhibited poor<br />
correlation as reflected in the R 2 values <strong>of</strong> 0.187 and 0.182 for one and six dips respectively. The<br />
poor correlation can be explained by the relatively small change in Integ values over a wide range <strong>of</strong><br />
concentrations coupled with the high variability associated with each concentration. At 7.5 g/l<br />
concentration the variability <strong>of</strong> Integ shade value dramatically increased compared to lower<br />
105.0<br />
100.0<br />
95.0<br />
90.0<br />
85.0<br />
80.0<br />
75.0<br />
Integ (six dips)<br />
115
concentrations. As the concentration is further increased the variability appears to reduce while the<br />
overall Integ shade value also decreased.<br />
Integ (one dip)<br />
34.0<br />
32.0<br />
30.0<br />
28.0<br />
26.0<br />
24.0<br />
22.0<br />
20.0<br />
Effect <strong>of</strong> Sodium Hydroxide Concentration on Integ from One<br />
and Six Dips <strong>of</strong> Indigo<br />
Figure 3-15: Relationship <strong>of</strong> sodium hydroxide concentration during laboratory preparation on Integ shade value after<br />
one and six dips <strong>of</strong> indigo dye<br />
Unlike previous <strong>%IOWY</strong> analysis, temperature doesn't play a major role in Integ shade value<br />
variation. After one dip <strong>of</strong> indigo, the general trend was increased Integ shade as the temperature<br />
was increased from 88°C to 100°C. However the changes in Integ shade values were small and the<br />
overall R 2 correlation was low at 0.122 as shown in figure 3-16. After six dips <strong>of</strong> indigo the general<br />
trend was decreased Integ shade as the temperature was increased from 88°C to 100°C. However,<br />
the changes in Integ shade values were small and the overall R 2 correlation was low at 0.015 as<br />
shown in figure 3-16. At 88°C the variability increased considerably under both one and six dip<br />
dyeing conditions and appears to decrease as the temperature is increased. Like the other two<br />
parameters, temperature has a high degree <strong>of</strong> variability so a detailed ANOVA analysis was needed<br />
to confirm insignificance.<br />
R² = 0.182<br />
R² = 0.187<br />
0 2 4 6 8 10 12 14 16<br />
Sodium Hydroxide Concentration (g/l)<br />
One Dip Six Dips<br />
105.0<br />
100.0<br />
95.0<br />
90.0<br />
85.0<br />
80.0<br />
75.0<br />
Integ (six dips)<br />
116
Integ (one dip)<br />
34.0<br />
32.0<br />
30.0<br />
28.0<br />
26.0<br />
24.0<br />
22.0<br />
20.0<br />
Effect <strong>of</strong> Temperture on Integ from One and Six Dips <strong>of</strong><br />
Indigo<br />
R² = 0.015<br />
R² = 0.122<br />
70 75 80 85 90 95 100<br />
Temperature (°C)<br />
One Dip Six Dips<br />
Figure 3-16: Relationship <strong>of</strong> temperature during laboratory preparation on Integ shade value after one and six dips <strong>of</strong><br />
indigo dye<br />
The full ANOVA analysis involving first and second order plus interactions <strong>of</strong> parameters was<br />
shown in table 3-7 for one dip indigo dyeing condition. The P-values calculated in parameter<br />
estimates shown no statistically significant effect for all values except the intercept which <strong>of</strong> course<br />
was meaningless. This conclusion was further supported by relatively low R 2 in the summary <strong>of</strong> fit<br />
and high P-value in analysis <strong>of</strong> variance results. As a result, the Integ shade value from one dip <strong>of</strong><br />
indigo was not used to optimize the laboratory preparation procedure.<br />
105.0<br />
100.0<br />
95.0<br />
90.0<br />
85.0<br />
80.0<br />
75.0<br />
Integ (six dips)<br />
117
Table 3-7: ANOVA analysis results for laboratory preparation parameters on Integ for one dip <strong>of</strong> indigo<br />
The full ANOVA analysis involving first and second order plus interactions <strong>of</strong> parameters was<br />
shown in table 3-8 for six dip indigo dyeing condition. The P-values calculated in parameter<br />
estimates showed no statistically significant effect on all values except the intercept which <strong>of</strong> course<br />
was meaningless. This conclusion was further supported by relatively low R 2 in the summary <strong>of</strong> fit<br />
and high P-value in analysis <strong>of</strong> variance results. No statistically significant effect from time,<br />
temperature, or sodium hydroxide concentration on Integ shade value for six dips <strong>of</strong> indigo existed.<br />
This is the same results as seen in one dip <strong>of</strong> indigo dye. As a result, the Integ shade value from six<br />
dips <strong>of</strong> indigo was not used to optimize the laboratory preparation procedure.<br />
118
Table 3-8: ANOVA analysis results for laboratory preparation parameters on Integ for six dips <strong>of</strong> indigo<br />
3.2.4 Analysis <strong>of</strong> Laboratory Preparation Time, Temperature, and Sodium Hydroxide Concentration<br />
Affect on Penetration Factor after One and Six Dip Indigo Dyeing Conditions<br />
Since time, temperature, and sodium hydroxide concentration were determined to have<br />
insignificant effect on Integ shade value and penetration factor is a function <strong>of</strong> Integ shade value<br />
and <strong>%IOWY</strong>, this researcher expects the penetration factor to have the same relationship as the<br />
inverse <strong>of</strong> <strong>%IOWY</strong>. For completeness, the full analysis was presented. First, notice a high degree <strong>of</strong><br />
variability in the penetration factor presented in figure 3-17 after one dip <strong>of</strong> indigo. The extremely<br />
low levels <strong>of</strong> <strong>%IOWY</strong> at shorter times produced high penetration factor values. With all data points<br />
the R 2 correlation was very low at 0.088. If the single point at 1200+ penetration factor was<br />
removed, the function was flat with R 2 <strong>of</strong> 0.057. Time doesn't appear to affect penetration factor<br />
after one dip <strong>of</strong> indigo.<br />
119
A similar relationship exists for six dips <strong>of</strong> indigo on penetration factor as a function <strong>of</strong> time.<br />
The high degree <strong>of</strong> variability in the penetration factor presented in figure 3-17 continues for six<br />
dips. While the range <strong>of</strong> penetration factors from six dips is smaller than one dip, the overall<br />
variation is high. With all data points the R 2 correlation was very low at 0.03 and is basically<br />
constant over all times.<br />
Penetration Factor (one dip)<br />
1400.00<br />
1200.00<br />
1000.00<br />
800.00<br />
600.00<br />
400.00<br />
200.00<br />
0.00<br />
Effect <strong>of</strong> Time on Penetration Factor from One and Six Dips<br />
<strong>of</strong> Indigo<br />
R² = 0.03<br />
R² = 0.088<br />
20 25 30 35 40<br />
Time (minutes)<br />
One Dip Six Dips<br />
Figure 3-17: Relationship <strong>of</strong> time during laboratory preparation on penetration factor after one and six dips <strong>of</strong> indigo<br />
dye<br />
The same observations can be made in regards to sodium hydroxide concentration influence<br />
on penetration factor after one and six dips <strong>of</strong> indigo. Very poor correlation exists as illustrated in<br />
figure 3-18 with R 2 values <strong>of</strong> 0.094 and 0.011 for one and six dips respectively. If the 1200+<br />
70.00<br />
60.00<br />
50.00<br />
40.00<br />
30.00<br />
20.00<br />
10.00<br />
penetration factor value was removed, the resulting trend after one dip <strong>of</strong> indigo was flat with a R 2<br />
value <strong>of</strong> 0.049. Sodium hydroxide concentration doesn't have a major affect on penetration factor.<br />
0.00<br />
Penetration Factor (sex dips)<br />
120
Penetration Factor (one dip)<br />
1400.00<br />
1200.00<br />
1000.00<br />
800.00<br />
600.00<br />
400.00<br />
200.00<br />
0.00<br />
Effect <strong>of</strong> Sodium Hydroxide Concentration on Penetration<br />
Factor from One and Six Dips <strong>of</strong> Indigo<br />
R² = 0.011<br />
R² = 0.094<br />
0 2 4 6 8 10 12 14 16<br />
Sodium Hydroxide Concentration (g/l)<br />
One Dip Six Dips<br />
Figure 3-18: Relationship <strong>of</strong> sodium hydroxide concentration during laboratory preparation on penetration factor after<br />
one and six dips <strong>of</strong> indigo dye<br />
The temperature effect on penetration factor after one and six dips <strong>of</strong> indigo was discussed.<br />
Under both indigo dyeing conditions the penetration factor decreased as the temperature was<br />
increased, figure 3-19. This was the opposite trend as shown for <strong>%IOWY</strong> as a function <strong>of</strong><br />
temperature, refer back to figure 3-10. After one dip the general trend in figure 3-19 isn't as<br />
pronounced due to the greater variation in penetration factor values which was reflected in the R 2<br />
value <strong>of</strong> 0.246. However, after six dips the general trend has a much stronger correlation as<br />
reflected in the R 2 value <strong>of</strong> 0.729. Both dyeing conditions exhibit reduce variation as the<br />
temperature is increased. The penetration factor reaches the minimum value at approximately 95°C<br />
and does not vary further as temperature continues to increase.<br />
70.00<br />
60.00<br />
50.00<br />
40.00<br />
30.00<br />
20.00<br />
10.00<br />
0.00<br />
Penetration Factor (six dips)<br />
121
Penetration Factor (one dip)<br />
1400.00<br />
1200.00<br />
1000.00<br />
800.00<br />
600.00<br />
400.00<br />
200.00<br />
0.00<br />
Effect <strong>of</strong> Temperture on Penetration Factor from One and Six<br />
Dips <strong>of</strong> Indigo<br />
R² = 0.729<br />
R² = 0.246<br />
70 75 80 85 90 95 100<br />
Temperature (°C)<br />
One Dip Six Dips<br />
Figure 3-19: Relationship <strong>of</strong> temperature during laboratory preparation on penetration factor after one and six dips <strong>of</strong><br />
indigo dye<br />
Evaluation <strong>of</strong> parameter interaction was shown in figure 3-20 for both one and six dip indigo<br />
conditions. As with <strong>%IOWY</strong>, no actual parameter interactions were detected. Furthermore, the only<br />
major change in penetration factor occurs as a result <strong>of</strong> temperature as evident in large change from<br />
76°C to 100°C in the second row <strong>of</strong> graphs for both one and six dip conditions.<br />
70.00<br />
60.00<br />
50.00<br />
40.00<br />
30.00<br />
20.00<br />
10.00<br />
0.00<br />
Penetration Factor (six dips)<br />
122
P.F.<br />
P.F.<br />
P.F.<br />
250<br />
200<br />
150<br />
100<br />
50<br />
250<br />
200<br />
150<br />
100<br />
50<br />
250<br />
200<br />
150<br />
100<br />
50<br />
P.F. Interaction Pr<strong>of</strong>ile for One Dip P.F. Interaction Pr<strong>of</strong>ile for Six Dips<br />
Interaction Pr<strong>of</strong>iles<br />
Time<br />
60<br />
55<br />
50 Time<br />
(min) 20<br />
40<br />
20<br />
40<br />
45<br />
40<br />
(min)<br />
20<br />
25<br />
30<br />
35<br />
40<br />
76<br />
100<br />
150<br />
76<br />
60<br />
55<br />
75<br />
Temperature<br />
(C) 100<br />
50<br />
45<br />
40<br />
102.5<br />
Temperature<br />
(C)<br />
80<br />
85<br />
90<br />
95<br />
100<br />
150<br />
0<br />
5<br />
10<br />
15<br />
Time Temperature NaOH<br />
Interaction Pr<strong>of</strong>iles<br />
Figure 3-20: Interaction pr<strong>of</strong>ile for time, temperature, and sodium hydroxide concentration on penetration factor after<br />
one and six dips <strong>of</strong> indigo dye<br />
The full ANOVA analysis results after one dip <strong>of</strong> indigo were shown in table 3-9. The<br />
parameter estimates with statistical significance was determined to be first and second order<br />
temperature represented by P-values <strong>of</strong> 0.0021 and 0.0293 respectively. The R 2 <strong>of</strong> 0.68 and P-value<br />
<strong>of</strong> 0.0050 for the complete model indicate reasonable agreement that was statistically significant to<br />
the actual data points. While the overall agreement was lower than for <strong>%IOWY</strong>, this was somewhat<br />
expected given the greater degree <strong>of</strong> variability especially with the 1200+ penetration value.<br />
Table 3-9: ANOVA analysis results for laboratory preparation parameters on penetration factor from one dip <strong>of</strong> indigo<br />
P.F.<br />
P.F.<br />
NaOH<br />
(g/l)<br />
60<br />
55<br />
50<br />
45<br />
40<br />
150<br />
150<br />
NaOH<br />
(g/l)<br />
P.F.<br />
20<br />
25<br />
30<br />
35<br />
40<br />
75<br />
85<br />
95<br />
20<br />
40<br />
105<br />
0<br />
5<br />
10<br />
20<br />
40<br />
75<br />
102.5<br />
15<br />
Time Temperature NaOH<br />
123
The prediction pr<strong>of</strong>iler, figure 3-21, further agrees with the inverse <strong>of</strong> <strong>%IOWY</strong>. Time and<br />
sodium hydroxide concentration have little influence on penetration factor regardless <strong>of</strong><br />
temperature. While an increasing temperature causes a decrease in penetration factor. This trend<br />
was governed by the <strong>%IOWY</strong> at each temperature level. At low temperatures, the <strong>%IOWY</strong> was low<br />
while at higher temperatures the amount <strong>of</strong> <strong>%IOWY</strong> increased. Therefore dividing a relatively<br />
constant Integ shade value by low <strong>%IOWY</strong> at low temperatures produces a high penetration factor<br />
and low penetration factor at high temperatures since the <strong>%IOWY</strong> was higher. Since no new<br />
information regarding laboratory preparation process was gleamed, this relationship will not be<br />
used to determine the optimum laboratory preparation procedure.<br />
Penetration Factor Prediction Pr<strong>of</strong>ile on One Dip <strong>of</strong> Indigo for Laboratory Preparation<br />
Time (min) Temperature (C) NaOH (g/l)<br />
Figure 3-21: Penetration factor for one dip <strong>of</strong> indigo model as a function <strong>of</strong> time, temperature, and sodium hydroxide<br />
concentration in laboratory preparation process<br />
The full ANOVA analysis results after six dips <strong>of</strong> indigo were shown in table 3-10. The<br />
parameter estimates with statistical significance was determined to be first and second order<br />
temperature represented by P-values <strong>of</strong> 0.0001 and 0.0171 respectively. The R 2 <strong>of</strong> 0.75 and P-value<br />
<strong>of</strong> 0.0007 for the complete model indicated reasonable agreement that was statistically significant<br />
to the actual data points. However, the overall agreement was less than previous <strong>%IOWY</strong> analysis.<br />
124
Table 3-10: ANOVA analysis results for laboratory preparation parameters on penetration factor from six dips <strong>of</strong> indigo<br />
The prediction pr<strong>of</strong>iler, figure 3-22, further agrees with the inverse <strong>of</strong> <strong>%IOWY</strong>. Time and<br />
sodium hydroxide concentration have little influence on penetration factor regardless <strong>of</strong><br />
temperature. While increasing temperature causes a decrease in penetration factor. Just like one<br />
dip <strong>of</strong> indigo, this trend was governed by the <strong>%IOWY</strong> at each temperature level. At low<br />
temperatures, the <strong>%IOWY</strong> was low while at higher temperatures the amount <strong>of</strong> <strong>%IOWY</strong> increased.<br />
Therefore, dividing a relatively constant Integ shade value by low <strong>%IOWY</strong> at low temperatures<br />
produces a high penetration factor and low penetration factor at high temperatures since the<br />
<strong>%IOWY</strong> was higher. This relationship will not be used to determine the optimum laboratory<br />
preparation procedure.<br />
125
Penetration Factor Prediction Pr<strong>of</strong>ile on Six Dips <strong>of</strong> Indigo for Laboratory Preparation<br />
Figure 3-22: Penetration factor for six dips <strong>of</strong> indigo model as a function <strong>of</strong> time, temperature, and sodium hydroxide<br />
concentration in laboratory preparation process<br />
3.2.5 Determine Optimum Settings for Laboratory Preparation Procedure<br />
By joining the prediction formulas <strong>of</strong> %Boil-<strong>of</strong>f loss and <strong>%IOWY</strong> at one dip, the prediction<br />
pr<strong>of</strong>ile illustrated in figure 3-23 was generated. The desired outcome was flat or very little change in<br />
%Boil-<strong>of</strong>f loss and <strong>%IOWY</strong> at specific values <strong>of</strong> time, temperature, and sodium hydroxide<br />
concentration. The first row <strong>of</strong> graphs in figure 3-23 illustrated the relationship between %Boil-<strong>of</strong>f<br />
loss as a function <strong>of</strong> time, temperature, and sodium hydroxide concentration. The second row <strong>of</strong><br />
graphs illustrated the relationship between <strong>%IOWY</strong> as a function <strong>of</strong> time, temperature, and sodium<br />
hydroxide concentration. Again, these were the same relationships previously determined in the<br />
ANOVA analysis. The third row <strong>of</strong> graphs represents the combined response by placing equal<br />
importance to %Boil-<strong>of</strong>f loss and <strong>%IOWY</strong>. This sequence <strong>of</strong> graphs was used to determine the<br />
optimum setting for each parameter.<br />
Time (min) Temperature (C) NaOH (g/l)<br />
The first column <strong>of</strong> graphs shows the total effect <strong>of</strong> time on each response variable and the<br />
corresponding desire function. As one can see increasing time caused increase in %Boil-<strong>of</strong>f loss and<br />
no affect on <strong>%IOWY</strong> which resulted in very little overall affect on the total desire function.<br />
Therefore, any value <strong>of</strong> time greater than 20 minutes will produce consistent and repeatable %Boil-<br />
<strong>of</strong>f loss and more importantly <strong>%IOWY</strong>. Given 30 minutes was the center point <strong>of</strong> the design <strong>of</strong><br />
126
experiment and therefore has the greatest replicated data points, this researcher selected 30<br />
minutes for time value under one dip <strong>of</strong> indigo.<br />
The second column <strong>of</strong> graphs illustrated the total effect <strong>of</strong> temperature on each response<br />
variable and the corresponding desire function. According to %Boil-<strong>of</strong>f loss the ideal temperature<br />
value lays greater than 100° C. However, the <strong>%IOWY</strong> function indicated temperature values greater<br />
than ~95° C have no additional impact. Therefore the combined desire function <strong>of</strong> %Boil-<strong>of</strong>f loss<br />
and <strong>%IOWY</strong> actually flattens out at 95° C. As a result, temperatures greater than 95° C had lower<br />
sensitivity to changes which <strong>of</strong> course was desired, therefore temperature values greater than 95° C<br />
were preferred.<br />
The third column in figure 3-23 corresponds to sodium hydroxide concentration effect on<br />
%Boil-<strong>of</strong>f loss and <strong>%IOWY</strong>. Here 11 g/l was determined to have the greatest %Boil-<strong>of</strong>f loss while no<br />
concentration level significantly impacts <strong>%IOWY</strong>. The combined desire function indicates<br />
concentration levels greater than 11 g/l had no additional impact. Therefore, any level greater the<br />
11 g/l was preferred.<br />
127
Prediction Optimized Pr<strong>of</strong>iler Prediction Pr<strong>of</strong>ile on One Dip <strong>of</strong> Indigo for Laboratory Preparation Process<br />
Pred Formula Pred Formula %<br />
<strong>%IOWY</strong> By Dip # Boil-<strong>of</strong>f Loss<br />
0.002823 0.030211<br />
Desirability<br />
0.363667<br />
0.03<br />
0.025<br />
0.02<br />
0.015<br />
0.02<br />
0.015<br />
0.01<br />
0.005<br />
0<br />
0 0.25 0.75 1<br />
Figure 3-23: Optimized laboratory preparation parameters incorporating prediction pr<strong>of</strong>iles from %Boil-<strong>of</strong>f loss and<br />
<strong>%IOWY</strong> from one dip <strong>of</strong> indigo dye<br />
Similar prediction pr<strong>of</strong>ile graphs were created for six dips <strong>of</strong> indigo, figure 3-24. Following<br />
the same logic as discussed with one dip <strong>of</strong> indigo produced the following results. The first column<br />
shows time levels greater the 30 minutes yields little to no impact on the overall desire function.<br />
The second column illustrated the highest level <strong>of</strong> desire function to occur at 100° C and doesn't<br />
flatten out. However, more detailed review shows temperature levels greater the 95° C has little<br />
additional impact on the <strong>%IOWY</strong>. The third column for sodium hydroxide concentration mirrors the<br />
results for one dip <strong>of</strong> indigo. Concentrations greater than 11 g/l have little or no additional effect on<br />
%Boil-<strong>of</strong>f loss or <strong>%IOWY</strong>.<br />
20<br />
25<br />
30<br />
35<br />
40<br />
75<br />
80<br />
85<br />
90<br />
95<br />
100<br />
0<br />
5<br />
10<br />
30<br />
100<br />
11<br />
Time Time (min) Temperature (C) NaOH (g/l)<br />
15<br />
1<br />
1<br />
Dip #<br />
6<br />
0<br />
0.25<br />
0.5<br />
0.75<br />
1<br />
Desirability<br />
128
Prediction Optimized Pr<strong>of</strong>iler Prediction Pr<strong>of</strong>ile on Six Dips <strong>of</strong> Indigo for Laboratory Preparation Process<br />
Pred Formula Pred Formula %<br />
<strong>%IOWY</strong> By Dip # Boil-<strong>of</strong>f Loss<br />
0.021231 0.030211<br />
Desirability<br />
0.964286<br />
0.03<br />
0.025<br />
0.02<br />
0.015<br />
0.02<br />
0.015<br />
0.01<br />
0.005<br />
0<br />
0 0.25 0.75 1<br />
Figure 3-24: Optimized laboratory preparation parameters incorporating prediction pr<strong>of</strong>iles from %Boil-<strong>of</strong>f loss and<br />
<strong>%IOWY</strong> from six dips <strong>of</strong> indigo dye<br />
Additional observations made during the experiment were controlling the temperature <strong>of</strong><br />
the solution was the most difficult <strong>of</strong> the three factors. The time and sodium hydroxide<br />
concentration were the easiest. Temperature levels <strong>of</strong> 100°C were easily maintained at atmospheric<br />
conditions by just maintaining a slow boil in the preparation bath. Combining the above comments<br />
with the results from the analysis <strong>of</strong> one and six dip indigo dyed skeins yields the following optimum<br />
laboratory preparation procedure. These specific laboratory preparation parameters were used on<br />
all following trials.<br />
20<br />
25<br />
30<br />
35<br />
40<br />
75<br />
80<br />
85<br />
90<br />
95<br />
100<br />
30<br />
100<br />
11<br />
Time Time (min) Temperature (C) NaOH (g/l)<br />
Time: 30 minutes<br />
Temperature: 100°C<br />
Sodium hydroxide concentration: 12.7 g/l <strong>of</strong> 50% caustic soda<br />
0<br />
5<br />
10<br />
15<br />
1<br />
6<br />
Dip #<br />
6<br />
0<br />
0.25<br />
0.5<br />
0.75<br />
1<br />
Desirability<br />
129
3.3 <strong>Equilibrium</strong> <strong>Sorption</strong> Experiment to Determine <strong>%IOWY</strong> and Shade Relationship for Uniformly<br />
Dyed Skeins<br />
In 1991 Etters 20 published equilibrium sorption curves for <strong>%IOWY</strong> as a function <strong>of</strong> dye bath<br />
concentration and pH. Unfortunately this data did not contain shade information. With the shade<br />
information from uniformly dyed yarns, the shade <strong>of</strong> ring dyed yarns could be converted into<br />
equivalent <strong>%IOWY</strong> on the "visible" surface <strong>of</strong> yarn. This value compared to actual <strong>%IOWY</strong> would<br />
give a measurement <strong>of</strong> dye penetration into the yarn structure. This method would give a more<br />
quantitative measurement <strong>of</strong> dye penetration as opposed to qualitative such as penetration factor<br />
discussed in section 3.1.3. Specifically penetration level was defined by equation 3-12.<br />
Penetration Level = % M<br />
% I<br />
Equation 3-12: Calculation <strong>of</strong> penetration level as a function <strong>of</strong> measured <strong>%IOWY</strong> and converted surface <strong>%IOWY</strong> from<br />
Integ shade readings.<br />
Here the <strong>%IOWY</strong> in the numerator was measured by Pyrrolidinone extract as discussed in<br />
section 3.1. The <strong>%IOWY</strong> converted from Integ shade value in the denominator was the <strong>%IOWY</strong> that<br />
corresponds to the measured Integ shade value if the dying had been conducted under uniform<br />
dyeing conditions, i.e. uniform dye concentration distribution in the cross section <strong>of</strong> the yarn. The<br />
penetration level values will vary from 1.0 to 0.0 with 1.0 corresponding to uniformly dyed cross<br />
sections <strong>of</strong> yarn and 0.0 representing ideal ring dyed yarn with all dye located on the very outer<br />
perimeter <strong>of</strong> the yarn.<br />
To collect the shade information a series <strong>of</strong> laboratory dyeings were conducted. Eight<br />
different stock mixes were made up and diluted to specific dye bath concentrations. Each dye bath<br />
contained 3 liters <strong>of</strong> volume and at most 4 yarn skeins were dyed in each bath. Approximately 30<br />
grams <strong>of</strong> cotton (4 times 7 grams/skein) to 3000 grams <strong>of</strong> dye bath followed 100:1 liquor: cotton<br />
ratio. The initial dye bath pH was also measured. Then up to 4 skeins that had been pre-wet out<br />
and nipped to 70% wet pick-up were submerged into the dye bath suspended by plastic hooks to<br />
130
keep the skeins from lying on top <strong>of</strong> each other. The top <strong>of</strong> each dye mix was covered with plastic<br />
film to prevent air oxidation <strong>of</strong> the dye. After 14 hours <strong>of</strong> dyeing time, each skein was pulled from<br />
the dye bath and run through a laboratory pad nip to squeeze excess dye from the yarn to<br />
approximately 70% wet pick-up. The skeins were then allowed to air oxidize for 3 minutes prior to<br />
laboratory washing at 40°C. The washing process was deemed completed when the wash water was<br />
void <strong>of</strong> color. Once the skeins were dried, the shade was measured as previously discussed and<br />
finally the <strong>%IOWY</strong> was measured by Pyrrolidinone extraction. Table 3-11 listed the specific dye bath<br />
concentration, pH, and resulting <strong>%IOWY</strong> and Integ shade for 6.3/1 yarn counts. The remaining yarn<br />
counts and measured values are provided in appendix section A-3-3.<br />
131
Table 3-11: <strong>%IOWY</strong> and Integ shade data from equilibrium sorption experiment<br />
Yarn Count Dye Bath g/l Dye Bath pH <strong>%IOWY</strong> Integ Shade Stock Mix #<br />
6.3 0.308 11.1 1.19% 27.9 2<br />
6.3 2.548 11.2 2.97% 63.5 8<br />
6.3 0.641 12.25 1.09% 31.3 1<br />
6.3 0.17663 12.8 0.30% 7.6 4<br />
6.3 1.2287 12.8 1.14% 30.6 6<br />
6.3 1.602 12.72 1.65% 42.4 1<br />
6.3 1.602 12.72 1.66% 43.7 7<br />
6.3 2.564 12.9 2.07% 47.9 7<br />
6.3 8.413 12.8 4.59% 75.1 2<br />
6.3 0.01577 13.17 0.02% 1.2 3<br />
6.3 0.03494 13.3 0.04% 2.3 6<br />
6.3 0.49612 13.19 0.52% 13.4 5<br />
6.3 1.99985 13.21 1.50% 35.3 3<br />
6.3 3.8843 13.24 2.21% 49.9 5<br />
6.3 4.487 13.14 2.70% 58.1 7<br />
6.3 4.487 13.14 2.68% 57.1 1<br />
6.3 6.3355 13.1 3.32% 63.3 4<br />
6.3 9.61464 13.31 4.05% 69.4 3<br />
6.3 14.0149 13.2 4.94% 75.6 6<br />
6.3 14.422 13.2 5.65% 77.2 8<br />
6.3 19.2293 13.43 6.20% 77.7 5<br />
6.3 20.191 13.3 6.68% 81.8 8<br />
6.3 24.037 13.2 8.10% 89.5 2<br />
6.3 29.95 13.2 8.38% 91.3 4<br />
Graphical representation <strong>of</strong> the equilibrium sorption data revealed the same correlation<br />
previously published by Etters 20 . Namely the <strong>%IOWY</strong> follows a Freundlich isotherm or power<br />
relationship between <strong>%IOWY</strong> and dye bath concentration at different dye bath pH values. Also<br />
note the <strong>%IOWY</strong> was independent <strong>of</strong> the yarn count. In figure 3-25 the equilibrium sorption data at<br />
pH ranges 13.1 to 13.3 were illustrated. The "X" marks were Etter's 1991 data points. The other<br />
points were 6.3/1, 7.1/1, 8.0/1, and 12.0/1 yarn count data from current equilibrium sorption<br />
experiment. The curve fit was Etter's 1991 data points extended above and below the original data<br />
range to encompass the range <strong>of</strong> current values.<br />
132
<strong>%IOWY</strong> (gm Indigo/100 gm cotton)<br />
<strong>Equilibrium</strong> <strong>Sorption</strong> Relationship at 13.1 to 13.3 pH<br />
100.00%<br />
10.00%<br />
1.00%<br />
0.10%<br />
0.01%<br />
Figure 3-25: <strong>%IOWY</strong> from 6.3/1, 7.1/1, 8.0/1, and 12.0/1 OE yarns compared to Etters 20 data under equilibrium sorption<br />
at pH 13 range.<br />
The same relationship was illustrated in figure 3-26 for pH ranges <strong>of</strong> 11.0 to 11.2. Once<br />
again the current experimental results mirror Etter's 1991 data. Both sets <strong>of</strong> data are almost<br />
perfectly modeled by a power function.<br />
y = 0.007303x 0.734588<br />
R² = 0.996<br />
0.01 0.1 1 10<br />
Dye Concentration (g/l)<br />
6.3 7.1 8 12 Etters 1991<br />
133
<strong>%IOWY</strong> (gm Indigo/100 gm cotton)<br />
<strong>Equilibrium</strong> <strong>Sorption</strong> Relationship at 11.0 to 11.2 pH<br />
100.00%<br />
10.00%<br />
1.00%<br />
0.10%<br />
0.01 0.1 1 10<br />
Dye Concentration (g/l)<br />
6.3 8 Etters 1991<br />
Figure 3-26: <strong>%IOWY</strong> on 6.3/1, 7.1/1, 8.0/1, and 12.0/1 OE yarns compared to Etters 20 data under equilibrium sorption at<br />
pH 11 range.<br />
By combining all current equilibrium sorption data with Etter's 1991 data, a general<br />
relationship between dye bath concentration and pH affect on total <strong>%IOWY</strong> was revealed. The<br />
power functions at various pH values were summarized in equation 3-13 in the general form.<br />
At each pH: %
When the component values <strong>of</strong> the power functions were graphed as a function <strong>of</strong> pH, the A<br />
component increased with decreasing pH and the B component increased with increasing pH. The<br />
trend for each was shown in figure 3-27. Furthermore the shape <strong>of</strong> the component A was very<br />
reminiscent <strong>of</strong> the monophenolate ionic form <strong>of</strong> indigo dye as a function <strong>of</strong> pH.<br />
Value <strong>of</strong> Componet A<br />
0.025<br />
0.02<br />
0.015<br />
0.01<br />
0.005<br />
0<br />
<strong>Coefficients</strong> <strong>of</strong> <strong>Equilibrium</strong> <strong>Sorption</strong> <strong>%IOWY</strong> <strong>Power</strong><br />
<strong>Function</strong><br />
11 11.5 12 12.5 13 13.5<br />
Figure 3-27: <strong>Power</strong> function coefficients A and B as a function <strong>of</strong> dye bath pH.<br />
By converting figure 3-27 into a function <strong>of</strong> monophenolate ionic indigo dye as it varies with<br />
pH, the regression between all three points becomes linear as shown in figure 3-28. Component A<br />
now increased as the monophenolate fraction increased which occurs as pH decreased. Component<br />
B now decreased with an increase in the monophenolate fraction which occurs as the pH decreased.<br />
pH<br />
Component A Component B<br />
0.8<br />
0.7<br />
0.6<br />
0.5<br />
0.4<br />
0.3<br />
0.2<br />
0.1<br />
0<br />
Value <strong>of</strong> Component B<br />
135
Value <strong>of</strong> Componet A<br />
0.025<br />
0.02<br />
0.015<br />
0.01<br />
0.005<br />
0<br />
Figure 3-28: <strong>Equilibrium</strong> sorption power function coefficients as a function <strong>of</strong> monophenolate ionic form <strong>of</strong> indigo.<br />
These linear equations for component A and B as a function <strong>of</strong> monophenolate ionic indigo<br />
dye fraction which were actually a function <strong>of</strong> pH were used in the general power function to relate<br />
<strong>%IOWY</strong> to dye bath concentration under equilibrium sorption. The specific results were given in<br />
equation 3-14.<br />
<strong>Coefficients</strong> <strong>of</strong> <strong>Equilibrium</strong> <strong>Sorption</strong> <strong>%IOWY</strong> <strong>Power</strong><br />
<strong>Function</strong>
Figure 3-29 shows the results <strong>of</strong> theoretical <strong>%IOWY</strong> at 11.2, 12.2, 12.8, and 13.2 pH. The<br />
curves at various pH levels were the theoretical values based on equation 3-14. The individual data<br />
points were all available points <strong>of</strong> equilibrium sorption as a function <strong>of</strong> dye bath pH and<br />
concentration. While equation 3-14 was certainly not the only possible solution from regression to<br />
fit the data available, it possesses certain elegance by combining the characteristic nature <strong>of</strong><br />
Freundlich isotherm and monophenolate ionic fraction into one equation. This represents the<br />
maximum amount <strong>of</strong> dye pick-up under equilibrium sorption (M∞) that can be achieved given these<br />
two important chemical dye range parameters.<br />
Calculated <strong>%IOWY</strong> (gm Indigo/100 gm cotton)<br />
100.00%<br />
10.00%<br />
1.00%<br />
0.10%<br />
0.01%<br />
Calculated <strong>Equilibrium</strong> <strong>Sorption</strong> Relationship at<br />
Various pH's<br />
0.01 0.1 1 10<br />
Dye Concentration (g/l)<br />
11.2 pH 12.8 pH 13.2 pH <strong>Power</strong> (11.2 pH)<br />
<strong>Power</strong> (13.2 pH) <strong>Power</strong> (12.2 pH) <strong>Power</strong> (12.8 pH)<br />
Figure 3-29: Comparison <strong>of</strong> calculated and measured <strong>%IOWY</strong> under equilibrium sorption laboratory dyeing conditions as<br />
the dye bath concentration and pH were varied.<br />
137
The shade <strong>of</strong> the yarns as a function <strong>of</strong> <strong>%IOWY</strong> can now be investigated. The relationships<br />
were later used to determine the penetration level for each dye range set-up observation. The<br />
Integ shade value <strong>of</strong> a particular yarn was converted into the corresponding <strong>%IOWY</strong> from<br />
equilibrium sorption. Then the penetration level was calculated when compared to the actual<br />
<strong>%IOWY</strong>. The specific Integ shade values from each yarn count as a function <strong>of</strong> <strong>%IOWY</strong> from<br />
equilibrium sorption is featured in figure 3-30. The <strong>%IOWY</strong> and Integ relationship starts <strong>of</strong>f linear at<br />
low <strong>%IOWY</strong> values. As the <strong>%IOWY</strong> increased the resulting change in Integ shade value had less<br />
effect. Therefore the <strong>%IOWY</strong> and Integ relationship is non-linear but does possess unique values<br />
over the entire range <strong>of</strong> <strong>%IOWY</strong>. The best model fit resulted in equation 3-15 that would allow Integ<br />
shade calculations based on the <strong>%IOWY</strong> under equilibrium sorption.<br />
Integ<br />
Figure 3-30: Relationship <strong>of</strong> Integ shade value for various yarn counts as <strong>%IOWY</strong> from equilibrium sorption.<br />
138
As previously discussed K/S660nm cannot be used for <strong>%IOWY</strong> conversion involving equilibrium<br />
sorption data. The relationship was not only non-linear but it was non-unique as shown in figure 3-<br />
32. In fact most researchers who have used K/S660nm have adjusted or "corrected" the curve to<br />
create a linear relationship. However, the correction was based on slope at very low dye<br />
concentrations and projected to about 3.0 <strong>%IOWY</strong>. While this correction was certainly an<br />
acceptable manner to handle the non-linearity at low <strong>%IOWY</strong> values, it was apparent at much higher<br />
<strong>%IOWY</strong> values the correction loses all meaning. For this reason the researcher has decided to use<br />
Integ shade value instead <strong>of</strong> K/S660nm.<br />
K/S at 660 nm<br />
40.0<br />
35.0<br />
30.0<br />
25.0<br />
20.0<br />
15.0<br />
10.0<br />
5.0<br />
0.0<br />
K/S at 660nm as a <strong>Function</strong> <strong>of</strong> <strong>%IOWY</strong><br />
0.00 5.00 10.00 15.00 20.00 25.00 30.00 35.00 40.00 45.00<br />
<strong>%IOWY</strong> from <strong>Equilibrium</strong> <strong>Sorption</strong><br />
6.3 7.1 8 12<br />
Poly. (6.3) Poly. (7.1) Poly. (8) Poly. (12)<br />
Figure 3-32: Shape <strong>of</strong> K/S at 660 nm as a function <strong>of</strong> <strong>%IOWY</strong> from equilibrium sorption experiments.<br />
140
3.4 Observational Indigo Study: Establishing Breadth <strong>of</strong> Dye Conditions and Convergence Test to<br />
Determine Conclusion <strong>of</strong> Study<br />
The dye range conditions consist <strong>of</strong> two different attributes: mechanical parameters and<br />
chemical parameters. Mechanical parameters were the yarn count, dye range speed, immersion<br />
dye bath thread-up length, oxidation thread-up length, nip pressure, and number <strong>of</strong> dye bath dips.<br />
The chemical parameters were the indigo dye bath concentration, pH, and reduction potential.<br />
When a set <strong>of</strong> yarn skeins was processed in the dye range, each parameter was measured and<br />
recorded. As previously discussed, the response variables were %COWY, <strong>%IOWY</strong>, Integ shade, and<br />
penetration level. The range <strong>of</strong> each parameter must be understood prior to beginning the study<br />
and a game plan developed to justify ending the study. Table 3-12 lists the specific parameters<br />
available from all bulk production dye range conditions at this researcher's disposal.<br />
Table 3-12: Observational study parameters and potential range <strong>of</strong> values<br />
Parameter Minimum Value Maximum Value<br />
Yarn Count 6.3/1 12.0/1<br />
Speed (m/sec) 26.5 36.6<br />
Immersion Length (meter) 8.6 11.4<br />
Oxidation Length (meter) 36.0 37.0<br />
Number <strong>of</strong> dips 1 7<br />
Dye concentration (g/l) 0.75 3.25<br />
pH 11.0 13.0<br />
Reduction potential (mV) 720 900<br />
Nip Pressure (psi) 40 75<br />
The dye range speed was set to match the specific dye range set-up sheet by the operator.<br />
The magnitude was controlled and maintained by ABB digital drive control system. The immersion<br />
length was determined by multiplying speed and immersion time. The immersion time <strong>of</strong> each yarn<br />
skein was measured with a stop watch. Immersion time was defined to be from liquor surface to nip<br />
point at the squeeze rolls and was averaged from 10 different measurements each time data was<br />
collected. The dye concentration was measured according to accepted industry methods. The %T<br />
was measured and converted into g/l concentrations by using calibration equations. The %T<br />
141
method is given in Appendix A-1-2a. The reduction potential and pH were measured by respective<br />
probes.<br />
If a traditional 3 level full factorial design <strong>of</strong> experiment was planned, this would result in 3 9<br />
or 19683 trials to cover 3 levels on 9 parameters. As previously discussed, such an experiment isn't<br />
possible. But if it were possible, the levels would look like table 3-13. Here the yarn count, number<br />
<strong>of</strong> dips, and nip pressure were removed. Also oxidation thread-up length was assumed to be<br />
sufficient to result in complete oxidation and therefore inconsequential. The first values in table 3-<br />
13 for each parameter were the target value and the numbers in ()'s were the acceptable ranges to<br />
fall within that group. These were grouped for each yarn count and each dip for analysis.<br />
Because every possible combination <strong>of</strong> parameters were not processed in production, a<br />
certain prime data set was defined which covers an acceptable range <strong>of</strong> parameters. Specifically<br />
yarn skeins were processed targeting the following parameters and response variables measured<br />
accordingly. The percent range <strong>of</strong> span from minimum to maximum value was calculated. Dye bath<br />
concentration appears to vary over a large range. Likewise, the immersion length and speed change<br />
by 30%. The pH does not appear to vary a great deal. This was not unexpected given this particular<br />
dye house does not utilize dye bath pH buffering systems like those discussed by Etters and others.<br />
Table 3-13: Prime data set in the observational study<br />
Parameter Low Value Middle Value High Value Range in Percent<br />
Immersion Length (m) 8.6 11.4 33%<br />
Speed (m/min) 29 (26.5-31) 32 (31-34.5) 35 (34.5-36.6) 37%<br />
Dye Conc. (g/l) 1.1 (0.7-1.5) 1.9 (1.5-2.3) 2.7 (2.3-3.1) 342%<br />
pH 11.3 (11-11.6) 11.8 (11.7-12) 12.3 (12-12.6) 18%<br />
mV 740 (700-780) 820 (780-850) 880 (850-900) 27%<br />
142
The prime data set was created by assigning all possible production variations to one <strong>of</strong> the<br />
groups in table 3-13. Once all possible production variations had been assigned, it was time to<br />
collect data from the observational study. The actual value for each parameter in the prime data set<br />
was illustrated in figure 3-33. Across each parameter the three ranges were demarcated.<br />
Scatterplot <strong>of</strong> Matrix Observational Study Dye Range Set-up Conditions and Interactions<br />
Speed m/min<br />
Indigo<br />
gm/lit<br />
Box pH<br />
Box mV<br />
38<br />
36<br />
34<br />
32<br />
30<br />
28<br />
26<br />
3<br />
2<br />
1<br />
13<br />
12<br />
11<br />
900<br />
800<br />
700<br />
8.63 11.37<br />
Dwell<br />
length m<br />
High value<br />
Middle value<br />
Low value<br />
26 29 3133 3537<br />
Speed m/min<br />
High value<br />
Middle value<br />
Low value<br />
1 2<br />
Indigo<br />
gm/lit g/l<br />
3<br />
High value<br />
Middle value<br />
Low value<br />
11 12 13<br />
Box pH<br />
Figure 3-33: Range <strong>of</strong> observational study dye range set-up conditions and interactions.<br />
High value<br />
Middle value<br />
Low value<br />
143
Once all data was collected for the prime data set, ANOVA analysis was conducted to<br />
determine significance <strong>of</strong> each parameter. Unlike traditional design <strong>of</strong> experiments, analysis <strong>of</strong><br />
observational studies incorporate the actual parameter value measured during the study instead <strong>of</strong><br />
the target value. An effects screening test was conducted and the standard error recorded for the<br />
parameters at each response variable for 6.3/1 yarns after one dip <strong>of</strong> indigo. Then more data,<br />
defined to be the replicated data set, was collected at the same dye range set-up conditions.<br />
Although the dye range set-up conditions were replica <strong>of</strong> the prime data set, the actual measured<br />
dye range variables were not the same. As each new data set was collected, the data was fed into<br />
the effect screening test and ANOVA analysis was repeated. The new standard error was recorded.<br />
This process was repeated for each replicated dye range condition until the standard error reached<br />
a point <strong>of</strong> diminishing return. At this point, the addition <strong>of</strong> more data would not further improve<br />
the model and the observational study was concluded.<br />
Figure 3-34 demonstrates the diminishing improvement <strong>of</strong> standard error for dye bath<br />
concentration parameter with the addition <strong>of</strong> replicates. "0" replicates on the x axis represents the<br />
original prime data set. As each replicate data set was added, the new standard error was<br />
calculated. In figure 3-34 the standard error <strong>of</strong> indigo dye bath concentration parameter affect on<br />
%COWY, <strong>%IOWY</strong>, Integ, and Penetration level was monitored. Dye bath concentration was chosen<br />
since it was the most statistically significant parameter on all response variables. The curves for<br />
each response variable were a second order polynomial fit with projected trajectory <strong>of</strong> 5 imaginary<br />
replicates. After 11 replicates the standard error <strong>of</strong> <strong>%IOWY</strong>, Integ, and Penetration Level appear to<br />
reach their minimum value. In fact the last additional 6 data sets have a standard error average <strong>of</strong><br />
1.56e-4, 9.8e-1, and 1.66e-2 for <strong>%IOWY</strong>, Integ, and Penetration level respectively. The last four<br />
replicate data sets had an average standard error <strong>of</strong> 2.82e-3 for %COWY with the last data set<br />
having a value higher than the previous three data sets. Since the standard error was no longer<br />
improving, the observational study was concluded. For completeness, this convergence test based<br />
on parameter standard error was repeated after the <strong>of</strong>ficial dye model was constructed and<br />
redisplayed later.<br />
144
Standard Error <strong>of</strong> Indigo (g/l)<br />
4.5<br />
4<br />
3.5<br />
3<br />
2.5<br />
2<br />
1.5<br />
1<br />
0.5<br />
0<br />
0 5 10 15 20 25<br />
Figure 3-34: Affect <strong>of</strong> additional replicated data sets on standard error <strong>of</strong> indigo dye bath concentration parameter and<br />
four response variables after one dip <strong>of</strong> indigo.<br />
Data analysis was conducted on all available data sets. After all data had been collected, the<br />
data was then compared to Fick's law <strong>of</strong> diffusion to calculate the diffusion coefficients.<br />
Additionally, cause and effect and the mechanism for dye pick-up were determined.<br />
The final step in traditional design <strong>of</strong> experiments is simulation. Since true simulation isn't<br />
possible, model predicted dye responses were compared to data sets from an independent dye<br />
range. The simulation data sets were collected from a third indigo dye range from a different dye<br />
house in a different country. Use <strong>of</strong> the third dye house guaranteed zero affect in developing the<br />
model. The %COWY, <strong>%IOWY</strong>, penetration level, and final indigo shade from the third dye range<br />
were compared to calculated values from the indigo dye models. The final simulation and validation<br />
are shown in Chapter 5.<br />
Additional Replicates Affect on Standard Error<br />
Number <strong>of</strong> Additional Replicates Added<br />
%COWY e-3 <strong>%IOWY</strong> e-4 Integ PL e-2<br />
145
4 Data Analysis from the Observational Study<br />
Yarn skeins were run and dye range set-up conditions were recorded as discussed in chapter<br />
3. Also, response variables were measured and expressions calculated as detailed in chapter 3. The<br />
entire data set is presented in Appendix section A-4-1 for reference. Data analysis consisted <strong>of</strong><br />
graphical and statistical techniques to evaluate and discuss general trends and specific relationships<br />
between dye range set-up conditions and response variables. Once the effects <strong>of</strong> each parameter<br />
were understood, empirical models were constructed to calculate %COWY, <strong>%IOWY</strong>, penetration<br />
level, and Integ shade value. Last, dye theory model was constructed based on general dye and<br />
diffusion theory.<br />
4.1 Review <strong>of</strong> Main Parameter Affects on Response Variables Obtained from Observational Study<br />
To determine the significance <strong>of</strong> each dye range set-up condition on the response variables,<br />
first a graphical approach was employed. The left graph in figure 4-1 illustrates the impact number<br />
<strong>of</strong> dips had on the %COWY. Clearly, by increasing the number <strong>of</strong> dips, the total %COWY was<br />
increased. The variability within each individual dip was due to other parameter effects. The right<br />
graph in figure 4-1 illustrates the effect <strong>of</strong> successive dips on <strong>%IOWY</strong>. While there is still a good deal<br />
<strong>of</strong> variability in the <strong>%IOWY</strong> at each dip, the trend from dip to dip appears to be more linear in nature<br />
when compared to %COWY relationship to dips.<br />
Figure 4-1: Number <strong>of</strong> dips affect on %COWY and <strong>%IOWY</strong> for all data points.<br />
Graph Builder<br />
<strong>%IOWY</strong> vs. Dip<br />
4.000%<br />
3.000%<br />
2.000%<br />
1.000%<br />
0.000%<br />
1 2 3 4 5 6 7<br />
Dip<br />
146
speciffic<br />
data sets are a presentedd.<br />
In figure 4-2,<br />
6.3/1 yarnn<br />
was dyed in three differeent<br />
indigo dyee<br />
bath<br />
conceentrations<br />
wit th approximaately<br />
constantt<br />
speed, pH, aand<br />
mV. All three<br />
were 311.1<br />
meterrs/minute.<br />
The<br />
3.0 g/l dyeeing<br />
was 12.00<br />
pH and 789 mV with the 2.7 g/l at 11.88<br />
pH and 8000<br />
mV,<br />
and 2.3<br />
g/l at 11.9 pH and 805 mmV.<br />
All threee<br />
follow the ssame<br />
general build curve wwith<br />
large inccrease<br />
in %COWY<br />
from 1 to 2 dips. Addditional<br />
dips beyond 2 conntinued<br />
to inccrease<br />
the %CCOWY<br />
althouugh<br />
at<br />
a slowwer<br />
rate. Last t, the spacingg<br />
between dyee<br />
bath concentrations<br />
wass<br />
as expectedd<br />
with higher dye<br />
bath cconcentration<br />
n resulting in higher %COWWY<br />
while lower<br />
concentrattions<br />
resultedd<br />
in the lowerr<br />
%COWWY.<br />
To further explore the % %COWY and % <strong>%IOWY</strong> as thee<br />
number <strong>of</strong> dips increaseed,<br />
a couple o<strong>of</strong><br />
Figure 4-2: Build curve e relationship foor<br />
%COWY as a ffunction<br />
<strong>of</strong> nummber<br />
<strong>of</strong> dips on 66.3/1<br />
yarn countt<br />
at similar speeed,<br />
pH,<br />
and redduction<br />
potential.<br />
Using the same s data seets<br />
a similar reelationship<br />
exxist<br />
for %IOWWY.<br />
Figure 4-33<br />
illustrates thhe<br />
%IOWWY<br />
build curve e as a function<br />
<strong>of</strong> number <strong>of</strong> dips basedd<br />
on the samee<br />
data points. . Notice the llinear<br />
relatioonship<br />
for <strong>%IOWY</strong><br />
to number<br />
<strong>of</strong> dips. TThese<br />
curves illustrate witth<br />
increasing number <strong>of</strong> dips<br />
147
the % <strong>%IOWY</strong> lineary y increases. AAlso<br />
the higheer<br />
the dye batth<br />
concentrattion,<br />
the highher<br />
the %IOWWY.<br />
This same<br />
linear be ehavior is exhhibited<br />
by all data sets fromm<br />
all dye rangge<br />
set-up connditions.<br />
Whiile<br />
no<br />
previoous<br />
data has been published<br />
comparingg<br />
<strong>%IOWY</strong> andd<br />
the effects o<strong>of</strong><br />
increasing dips, numberrous<br />
examples<br />
have bee en discussed relating shadde<br />
<strong>of</strong> the yarnn<br />
(K/S or Integg)<br />
to increasinng<br />
numbers o<strong>of</strong><br />
dips.<br />
Refer to Xin 4 46<br />
Integ vs dipps<br />
curve in secction<br />
1-1.<br />
Figure 4-3: Build curve e relationship foor<br />
<strong>%IOWY</strong> as a fuunction<br />
<strong>of</strong> numbber<br />
<strong>of</strong> dips on 6.3/1<br />
yarn count at similar speedd,<br />
pH,<br />
and redduction<br />
potential.<br />
Since the <strong>%IOWY</strong> % increaased<br />
with eacch<br />
additional dip <strong>of</strong> indigo dye, one would<br />
expect the<br />
depthh<br />
<strong>of</strong> shade to increase as wwell.<br />
However,<br />
the relationnship<br />
does noot<br />
appear to bbe<br />
linear. Figgure<br />
4-4 illustrates<br />
the realationshipp<br />
between Integ<br />
shade valuue<br />
and number<br />
<strong>of</strong> indigo ddips<br />
from all ddata<br />
pointss.<br />
Even thoug gh the %IOWWY<br />
builds in a llinear<br />
nature, , the non-lineear<br />
nature <strong>of</strong> Integ shade<br />
versus<br />
the number r <strong>of</strong> dips is jusstified<br />
when cconsiderationn<br />
is given to nnon-linear<br />
relaationship<br />
between<br />
Integ and <strong>%IOWY</strong> under u equilibbrium<br />
sorptionn<br />
dye conditioons<br />
as well ass<br />
the possibility<br />
for variablle<br />
penettration<br />
levels from one dipp<br />
to the next. It should be noted the increase<br />
in dipss<br />
does not acctually<br />
148
cause the change in Integ shade. Instead, the change in Integ is caused by the increase in <strong>%IOWY</strong><br />
and it's distribution which is a result <strong>of</strong> the additional indigo box dip.<br />
Integ<br />
Graph Builder<br />
120<br />
100<br />
80<br />
60<br />
40<br />
20<br />
0<br />
Integ vs. Dip<br />
1 2 3 4 5 6 7<br />
Figure 4-4: Integ shade value as a function <strong>of</strong> number <strong>of</strong> indigo dye box dips for all data points.<br />
To further investigate Integ variation as it relates to number <strong>of</strong> dips, once again three<br />
specific dye conditions were used. These specific dye conditions are graphed in figure 4-5. Clearly,<br />
the Integ shade value builds in a non-linear fashion as the number <strong>of</strong> dips is increased. The depth <strong>of</strong><br />
shade also maintains the effect <strong>of</strong> indigo dye box concentration: the higher the dye concentration,<br />
the darker the shade while lighter indigo dye bath concentrations resulted in lighter shades.<br />
Dip<br />
149
Figure 4-5: Integ shade e value as a function<br />
<strong>of</strong> numberr<br />
<strong>of</strong> dips on 6.3/ /1 yarn count att<br />
similar speed, pH, and reduction<br />
potenttial.<br />
Since %IOW WY caused thhe<br />
Integ shadee<br />
and <strong>%IOWY</strong>Y<br />
by dips was linear, what caused Integ to<br />
be noon-linear<br />
func ction <strong>of</strong> numbber<br />
<strong>of</strong> dips? AAs<br />
previously shown in chaapter<br />
3, the Innteg<br />
shade haas<br />
a<br />
non-liinear<br />
relation nship to %IOWWY<br />
during equuilibrium<br />
sorpption.<br />
This coould<br />
explain tthe<br />
shape <strong>of</strong><br />
curves<br />
in figure 4-5 5. The other possibility waas<br />
changes in penetration level as a funnction<br />
<strong>of</strong> nummber<br />
<strong>of</strong> dipps.<br />
The penet tration level aas<br />
a function <strong>of</strong> all data pooints<br />
is shownn<br />
in figure 4-66.<br />
Unlike the<br />
previoous<br />
relationsh hips, the peneetration<br />
level<br />
has a uniquee<br />
and unexpeected<br />
shape as<br />
the number<br />
<strong>of</strong><br />
dips wwas<br />
increased d. As the nummber<br />
<strong>of</strong> dips wwas<br />
increasedd<br />
the penetration<br />
level conntinued<br />
to<br />
decreease<br />
with redu ucing severityy.<br />
From dip 5 through 7 thhe<br />
penetratioon<br />
level remaiins<br />
relatively<br />
unchaanged.<br />
The decreased<br />
aveerage<br />
penetraation<br />
level witth<br />
each dip, ccould<br />
explain the non-lineaar<br />
relatioonship<br />
betwe een Integ andd<br />
dip as demoostrated<br />
in figure<br />
4-5. The penetration level decreassed<br />
with eeach<br />
addition nal dip due to additive proccess<br />
<strong>of</strong> layering<br />
dye not byy<br />
the dip proccess<br />
itself.<br />
150
Penetration level<br />
Graph Builder<br />
0.9<br />
0.8<br />
0.7<br />
0.6<br />
0.5<br />
0.4<br />
0.3<br />
0.2<br />
Penetration level vs. Dip<br />
1 2 3 4 5 6 7<br />
Figure 4-6: Penetration level for all data points as a function <strong>of</strong> the number <strong>of</strong> dips.<br />
When reviewing the penetration level as a function <strong>of</strong> the number <strong>of</strong> dips under the three<br />
specific dye conditions, a similar relationship as shown in figure 4-6 exists. Figure 4-7 shows the<br />
specific relationships. At dip #1 all three dye box concentrations have approximately the same<br />
penetration level. After dip 2, the penetration level becomes separated by the dye box<br />
concentration with higher concentration resulting in a lower penetration level. The decreased<br />
penetration level signifies increased ring dyeing or decreased dye penetration into the yarn. This<br />
effect is actually expected when consideration is given to how dye is added at each dip. The indigo<br />
dye added at dip 4 is layered on top <strong>of</strong> the existing dye from dip 1, 2, and 3. And as additional dye is<br />
added by more dips, the dye continues to be layered on. Thus the Integ shade value becomes<br />
darker with each additional dip because the dye is applied in a ring dyed fashion by each dip. Notice<br />
the greater the dye bath concentration, the lower the penetration level or more ring dyed the yarn.<br />
Dip<br />
151
Figure 4-7: Penetration<br />
level as a funcction<br />
<strong>of</strong> numberr<br />
<strong>of</strong> dips on 6.3/ /1 yarn count at similar speed, ppH,<br />
and reductioon<br />
potenttial.<br />
Besides the<br />
number <strong>of</strong> dips, the indiigo<br />
dye conceentration<br />
in thhe<br />
dye bath o<strong>of</strong><br />
each dip shhould<br />
have a strong impa act on the ressponse<br />
variabbles.<br />
The nexxt<br />
series <strong>of</strong> graaphs<br />
investigaates<br />
the effecct<br />
<strong>of</strong><br />
indigoo<br />
dye bath co oncentration oon<br />
%COWY, % <strong>%IOWY</strong>, Integg,<br />
and penetraation<br />
level whhile<br />
considering<br />
the nuumber<br />
<strong>of</strong> dips s. Figure 4-8 shows the efffect<br />
<strong>of</strong> indigoo<br />
concentratioon<br />
on %COWWY<br />
when separated<br />
by one,<br />
three, and six dips. As iin<br />
figure 4-1, as the numbeer<br />
<strong>of</strong> dips increased<br />
so didd<br />
the %COWYY.<br />
Also aas<br />
in figure 4-2,<br />
as the indigo<br />
dye bath cconcentrationn<br />
increased, tthe<br />
%COWY inncreased.<br />
Thhe<br />
%COWWY<br />
build is fairly<br />
linear by indigo dye baath<br />
concentraation<br />
within eeach<br />
individuaal<br />
dip.<br />
152
%COWY<br />
Graph Builder<br />
14.00%<br />
12.00%<br />
10.00%<br />
8.00%<br />
6.00%<br />
4.00%<br />
2.00%<br />
%COWY vs Average Indigo (g/l) by Dip<br />
%COWY vs. Average Indigo (gm/lit) by Dip<br />
0.00%<br />
0.5 1 1.5 2 2.5 3 3.5 4<br />
Figure 4-8: %COWY for all data points as a function <strong>of</strong> dye bath concentration after one, three, and six dips.<br />
As expected the <strong>%IOWY</strong> had a strong relationship to the dye bath concentration. Figure 4-9<br />
illustrates the build curve <strong>of</strong> <strong>%IOWY</strong> as a function <strong>of</strong> dye concentration when separated by one,<br />
three, and six dips. As shown in figure 4-3, as the number <strong>of</strong> dips increased the total amount <strong>of</strong><br />
<strong>%IOWY</strong> also increased. Additionally, the general trend was increased <strong>%IOWY</strong> as the dye bath<br />
concentration was increased. However, this relationship wasn't linear over the entire range <strong>of</strong> dye<br />
bath concentrations. The <strong>%IOWY</strong> build curve was fairly linear from low concentrations till<br />
approximate 1.75 g/l. But increasing concentration from 1.75 g/l to 2.5 g/l does not result in<br />
substantial change in <strong>%IOWY</strong>. Then, at 2.5 g/l continued increases in dye concentration does result<br />
in increased <strong>%IOWY</strong>. This relationship was repeated for each number <strong>of</strong> dips although it is<br />
accentuated by the higher number <strong>of</strong> dips. This relationship is best described as an indigo dye bath<br />
concentration build plateau spanning 1.75 to 2.5 g/l.<br />
(g/l)<br />
Average Indigo (gm/lit)<br />
Legend<br />
1<br />
3<br />
6<br />
1<br />
3<br />
6<br />
153
Measured <strong>%IOWY</strong><br />
Graph Builder<br />
4.500%<br />
4.000%<br />
3.500%<br />
3.000%<br />
2.500%<br />
2.000%<br />
1.500%<br />
1.000%<br />
0.500%<br />
Figure 4-9: <strong>%IOWY</strong> for all data points as a function <strong>of</strong> dye bath concentration after one, three, and six dips.<br />
Since there is a strong relationship between <strong>%IOWY</strong> and Integ shade value as well as <strong>%IOWY</strong><br />
and dye bath concentration, Integ versus dye bath concentration at various number <strong>of</strong> dips should<br />
have a similar shape as discussed from <strong>%IOWY</strong> versus dye bath concentration in figure 4-9. This is<br />
confirmed in figure 4-10. The Integ shade value has a fairly linear relationship to dye bath<br />
concentration until 1.75 g/l. At 1.75 g/l a plateau is reached where further increases in dye<br />
concentration does not produce substantial increased depth <strong>of</strong> shade. Once the dye concentration<br />
reaches 2.5 g/l, the Integ shade value resumes increasing in value with increased dye concentration.<br />
While there was variation in data points on both figures 4-9 and 4-10, the plateau relationship is<br />
graphically evident.<br />
Measured <strong>%IOWY</strong> vs Average Indigo (g/l) by Dip<br />
Measured <strong>%IOWY</strong> vs. Average Indigo (gm/lit) by<br />
Dip<br />
0.000%<br />
0.5 1 1.5 2 2.5 3 3.5 4<br />
(g/l)<br />
Average Indigo (gm/lit)<br />
Legend<br />
1<br />
3<br />
6<br />
1<br />
3<br />
6<br />
154
Measured Integ<br />
Graph Builder<br />
120<br />
100<br />
80<br />
60<br />
40<br />
20<br />
Measured Integ vs Average Indigo (g/l) by Dip<br />
Measured Integ vs. Average Indigo (gm/lit) by Dip<br />
0<br />
0.5 1 1.5 2 2.5 3 3.5 4<br />
Average Indigo (gm/lit)<br />
Figure 4-10: Integ shade value as a function <strong>of</strong> dye bath concentration at various numbers <strong>of</strong> dips.<br />
To investigate penetration level as a function <strong>of</strong> dye bath concentration, figure 4-6 was<br />
expanded to include the variation in dye bath concentration within each dip to produce figure 4-11.<br />
In this graph, the penetration level is shown to vary by dye bath concentration after 1, 3, and 6 dips.<br />
The mean value within each dip forms the same relationship with increasing dips as previously<br />
discussed: increasing dips resulted in decreased penetration level. Additionally, the variation due to<br />
dye concentration within each dip illustrates penetration level is dependent on dye concentration<br />
and the number <strong>of</strong> dips. Notice a great deal <strong>of</strong> random variation in penetration level at any specific<br />
dip and/or dye bath concentration indicates other parameters have an effect on penetration level.<br />
(g/l)<br />
Legend<br />
1<br />
3<br />
6<br />
1<br />
3<br />
6<br />
155
Penetration level<br />
Graph Builder<br />
0.9<br />
0.8<br />
0.7<br />
0.6<br />
0.5<br />
0.4<br />
0.3<br />
Penetration Level vs Average Indigo (g/l) by Dip<br />
Penetration level vs. Average Indigo (gm/lit) by Dip<br />
0.2<br />
0.5 1 1.5 2 2.5 3 3.5 4<br />
Average Indigo (gm/lit)<br />
Figure 4-11: Penetration level for all data points as a function <strong>of</strong> dye bath concentration within each dip.<br />
With the obvious main parameter effects accounted for, further investigation <strong>of</strong> secondary<br />
parameters such as yarn count, speed, pH, mV, dwell length, and nip pressure become difficult to<br />
visualize if the entire data set was incorporated in graphical form. To reduce the complexity, all <strong>of</strong><br />
the remaining parameter screenings and graphical analysis will be discussed after six dips <strong>of</strong> indigo.<br />
Also, all graphs are generated with arrows that insect at 2.0 g/l dye bath concentrations and a single<br />
figure incorporates all four response variables graphs to facilitate trend illustration and discussion.<br />
Before reducing yarn count to a single value, the effect <strong>of</strong> yarn count on the response<br />
variables was evaluated. To illustrate the effect <strong>of</strong> yarn count on %COWY, <strong>%IOWY</strong>, Integ, and<br />
penetration level; figure 4-12 was constructed after six dips <strong>of</strong> indigo with various dye bath<br />
concentrations. The overall general trend was increasing %COWY as the dye bath concentration<br />
(g/l)<br />
Legend<br />
1<br />
3<br />
6<br />
1<br />
3<br />
6<br />
156
was increased. Furthermore, increasing the yarn count resulted in greater %COWY values at any<br />
given dye bath concentration. The general relationship across all dye conditions is greater yarn<br />
counts (ie finer yarns) have greater %COWY then lower yarn counts (ie courser yarns).<br />
Given the %COWY dependence on yarn count, a similar relationship is expected for <strong>%IOWY</strong>.<br />
The second row <strong>of</strong> graphs in figure 4-12 illustrates the relationship <strong>of</strong> <strong>%IOWY</strong> as a function <strong>of</strong> dye<br />
bath concentration after six dips for each yarn count. As expected, the general <strong>%IOWY</strong> curve had a<br />
plateau from 1.75 g/l to 2.5 g/l within each yarn count. Furthermore, the higher yarn counts (finer<br />
yarns) had greater <strong>%IOWY</strong> than the lower yarn counts (coarser yarns). More specifically the same<br />
relationship for yarn count exists at every dip <strong>of</strong> indigo.<br />
If the %COWY and <strong>%IOWY</strong> varies with different yarn counts, how does the resulting Integ<br />
shade value vary? Well, in fact the Integ shade value doesn't vary at least not as much as one might<br />
expect. The third row <strong>of</strong> graphs in figure 4-12 shows the Integ values as the indigo dye bath<br />
concentration was increased after six dips across all four yarn counts. The biggest trend was the<br />
increased Integ as the dye bath concentration was increased within each yarn count. Although a<br />
slight increase in Integ is exhibited as the yarn count is increased. Any significance with increasing<br />
yarn count will need to be determined from a full ANOVA analysis.<br />
If the <strong>%IOWY</strong> increased by yarn count and the Integ shade is relatively constant by yarn<br />
count than the penetration level as the yarn count was increased is expected to increase. The<br />
bottom row <strong>of</strong> graphs in figure 4-12 illustrates that very relationship for six dips as a function <strong>of</strong> dye<br />
bath concentration. The penetration level clearly decreased as the dye bath concentration was<br />
increased at a constant yarn count. The penetration level increased as the yarn count was increased<br />
regardless <strong>of</strong> the dye bath concentration.<br />
157
%COWY<br />
<strong>%IOWY</strong><br />
Integ<br />
Penetration level<br />
Graph Builder<br />
12.00%<br />
10.00%<br />
8.00%<br />
6.00%<br />
4.00%<br />
Yarn Count Affect on %COWY, <strong>%IOWY</strong>, Integ, and<br />
Penetration Level<br />
Yarn Count<br />
6.3 7.1 8 12<br />
2.00%<br />
4.00%<br />
3.50%<br />
3.00%<br />
2.50%<br />
2.00%<br />
1.50%<br />
1.00%<br />
0.50%<br />
100<br />
90<br />
80<br />
70<br />
60<br />
50<br />
40<br />
30<br />
0.6<br />
0.55<br />
0.5<br />
0.45<br />
0.4<br />
0.35<br />
0.3<br />
0.25<br />
0.2<br />
0.5 1 1.5 2 2.5 3 3.5 0.5 1 1.5 2 2.5 3 3.5 0.5 1 1.5 2 2.5 3 3.5 0.5 1 1.5 2 2.5 3 3.5<br />
Indigo gm/lit (g/l)<br />
Figure 4-12: Illustrates %COWY, <strong>%IOWY</strong>, Integ, and penetration level varies with yarn count and dye concentration after<br />
six dips.<br />
158
Now that yarn count effects had been investigated and to further reduce the complexity, all<br />
<strong>of</strong> the remaining parameter screenings and graphical analysis were reduced to 6.3/1's yarn count<br />
after six dips <strong>of</strong> indigo. All graphs will continue to be generated with arrows that insect at 2.0 g/l<br />
dye bath concentrations and a single figure incorporates all four response variables graphs to<br />
facilitate trend illustration and discussion.<br />
This researcher hypothesized speed would have an impact in overall indigo dyeing process.<br />
However, the top graphs in figure 4-13 indicates speed has very little affect on %COWY. Within each<br />
speed range, the %COWY builds in a similar fashion as previously discussed with changes in dye bath<br />
indigo concentration. Alas, there are no obvious curve shifts as the speed range is increased from<br />
26.5-31 m/min to 31-34.75 m/min or to 34.75-36.6 m/min. The 2.0 g/l indigo dye bath<br />
concentration arrow remains mostly flat as the speed was increased from the left most graph to<br />
center graph and ending with the right most graph.<br />
However, it is clear from graphs on second row in figure 4-13 that speed does have an<br />
impact on <strong>%IOWY</strong>. The <strong>%IOWY</strong> build curves maintain characteristic shape as a function <strong>of</strong> indigo<br />
dye bath concentration including the 1.75 g/l plateau. The 2.0 g/l concentration arrow shows a<br />
decrease in <strong>%IOWY</strong> as the speed was increased. In fact, the average <strong>%IOWY</strong> shift is from ~2.25 % to<br />
~1.5% IOWY when the speed was increased from 26.5 m/min to 36.5 m/min. Whether the<br />
reduction is due to lower wet pick-up or less time for diffusion to occur, the trend is apparent.<br />
The increasing speed also affected the Integ shade value. As the speed increased, the Integ<br />
value decreased as seen by following the 2.0 g/l concentration arrow in third row <strong>of</strong> graphs <strong>of</strong> figure<br />
4-13. At lower speed ranges the Integ value for 2.0 g/l is approximately 85. However, at the higher<br />
speed levels the Integ value had dropped to below 70 given the same dye bath concentration.<br />
Given speed affects on <strong>%IOWY</strong> and Integ, it is expected to have an impact on the<br />
penetration level. The last row <strong>of</strong> graphs in figure 4-13 showed an increased speed causing an<br />
increase in penetration level. This was due to the greater rate <strong>of</strong> drop in Integ value compared to<br />
the drop in <strong>%IOWY</strong> as speed was increased. The Integ value was lower than expected given the<br />
amount <strong>of</strong> indigo on weight <strong>of</strong> yarn. Therefore, the penetration level increased indicating more<br />
penetration <strong>of</strong> the dye into the yarn structure at greater speeds.<br />
159
%COWY<br />
<strong>%IOWY</strong><br />
Integ<br />
Penetration level<br />
Graph Builder<br />
Speed Affect on %COWY, <strong>%IOWY</strong>, Integ, and Penetration Level<br />
Speed (m/min)<br />
26.52 - 31.09 31.09 - 34.75 34.75 - 36.58<br />
12.00%<br />
11.00%<br />
10.00%<br />
9.00%<br />
8.00%<br />
7.00%<br />
6.00%<br />
5.00%<br />
4.00%<br />
3.00%<br />
2.00%<br />
3.50%<br />
3.00%<br />
2.50%<br />
2.00%<br />
1.50%<br />
1.00%<br />
0.50%<br />
100<br />
90<br />
80<br />
70<br />
60<br />
50<br />
40<br />
30<br />
0.5<br />
0.45<br />
0.4<br />
0.35<br />
0.3<br />
0.25<br />
0.2<br />
0.5 1 1.5 2 2.5 3 3.5<br />
0.5 1 1.5 2 2.5 3 3.5 0.5 1 1.5 2 2.5 3 3.5<br />
Indigo gm/lit<br />
Figure 4-13: Speed affect on %COWY, <strong>%IOWY</strong>, Integ, penetration level at various dye bath concentrations after six dips<br />
<strong>of</strong> indigo on 6.3/1 yarn.<br />
(g/l)<br />
160
Next the effect <strong>of</strong> pH was investigated. As previous research by Etters and others, pH<br />
should play a major role in the <strong>%IOWY</strong>, Integ, and penetration level. Figure 4-14 was created based<br />
on 6.3/1 yarn count after six dips <strong>of</strong> indigo dyeing. Four rows <strong>of</strong> graphs represent each <strong>of</strong> the<br />
response variables. The pH range is broken down into three groups: Low with pH from 10.96 to<br />
11.6, Middle range with pH from 11.61 to 11.86, and High with pH from 11.9 to 12.6. Across each<br />
response variable graphs a 2.0 g/l constant dye bath concentration arrow was drawn.<br />
Across the first row <strong>of</strong> graphs, as the pH <strong>of</strong> the dye bath was increased the %COWY actually<br />
decreased. This relationship is a little surprising considering, with everything else constant, higher<br />
pH should have more sodium hydroxide in the bath which should result in more sodium hydroxide<br />
on weight <strong>of</strong> yarn and therefore higher %COWY. Perhaps other parameters or interactions are<br />
causing this unexpected trend. Unlike pH's effect on %COWY, the <strong>%IOWY</strong> actually increased at<br />
higher pH levels. While the increase in <strong>%IOWY</strong> was not overwhelming, the second row <strong>of</strong> graphs<br />
gives a good indication that increased pH causes higher <strong>%IOWY</strong>. Furthermore, given the reduced<br />
%COWY and the increased <strong>%IOWY</strong>, the fixation rate appears greater at higher pH levels.<br />
The Integ shade value remained constant as the pH was increased as shown in third row <strong>of</strong><br />
graphs <strong>of</strong> figure 4-14. A constant Integ value coupled with increasing <strong>%IOWY</strong> should have a major<br />
impact on penetration level. As expected, increasing pH caused a major shift toward increased<br />
penetration level. The relationship is clearly illustrated in final row <strong>of</strong> graphs in figure 4-14. This<br />
was caused by the increase in <strong>%IOWY</strong> while the Integ shade remained constant or actually become<br />
lighter in shade. There the Integ value is not as great as one would expect given the <strong>%IOWY</strong> because<br />
the dye is more penetrated into the yarn structure. This relationship was also supported by<br />
research <strong>of</strong> Etters and others.<br />
161
%COWY<br />
<strong>%IOWY</strong><br />
Integ<br />
Penetration level<br />
Graph Builder<br />
pH Affect on %COWY, <strong>%IOWY</strong>, Integ, and Penetration Level<br />
Box pH<br />
10.96 - 11.6 11.6 - 11.86 11.86 - 12.588<br />
12.00%<br />
11.00%<br />
10.00%<br />
9.00%<br />
8.00%<br />
7.00%<br />
6.00%<br />
5.00%<br />
4.00%<br />
3.00%<br />
2.00%<br />
3.50%<br />
3.00%<br />
2.50%<br />
2.00%<br />
1.50%<br />
1.00%<br />
0.50%<br />
100<br />
90<br />
80<br />
70<br />
60<br />
50<br />
40<br />
30<br />
0.5<br />
0.45<br />
0.4<br />
0.35<br />
0.3<br />
0.25<br />
0.2<br />
0.5 1 1.5 2 2.5 3 3.5<br />
0.5 1 1.5 2 2.5 3 3.5 0.5 1 1.5 2 2.5 3 3.5<br />
(g/l)<br />
Indigo gm/lit<br />
Figure 4-14: pH affect on %COWY, <strong>%IOWY</strong>, Integ, penetration level at various dye bath concentrations after six dips <strong>of</strong><br />
indigo on 6.3/1 yarn.<br />
162
The effects reduction potential had on response variables were far less pronounced<br />
compare to any previous parameter. In fact, any effect may not be significant and must be validated<br />
by a complete ANOVA analysis. Figure 4-15 indicates mV may have a non-linear effect on %COWY.<br />
There are shifts to higher %COWY at the middle mV range compared to the lower and upper ranges.<br />
The exact extent and significance <strong>of</strong> the effect can only be determined during complete ANOVA<br />
analysis.<br />
Increased reduction potential does appear to have a major and consistent role in the<br />
<strong>%IOWY</strong> after six dips <strong>of</strong> indigo at various dye bath concentration levels. The line <strong>of</strong> constant dye<br />
concentration is clearly trending lower as the reduction potential is increased as evident in second<br />
<strong>of</strong> graphs in figure 4-15. This relationship is contradictory to traditional indigo dyeing theory since<br />
lower mV means greater reduction potential. One would think greater reduction potential would<br />
result in more indigo on weight <strong>of</strong> yarn not less. There are <strong>of</strong> course other potential causes for this<br />
relationship such as effects from speed, pH, etc.<br />
Reduction potential also has a slight non-linear effect on Integ shade values. The third row<br />
<strong>of</strong> graphs in figure 4-15 indicates the shade becomes slightly darker as the reduction potential is<br />
increased from low mV to mid-range mV along constant dye bath concentrations. Yet the Integ<br />
shifts slightly lower as the reduction potential is further increased to the high mV range. Once again<br />
the overall change in Integ values isn't great but the general trend does appear to exist.<br />
Coupling <strong>%IOWY</strong> and Integ shade values to calculate penetration level reveals the overall<br />
trend <strong>of</strong> decreasing penetration level as the reduction potential is increased. This trend is<br />
demonstrated in the fourth row <strong>of</strong> figure 4-15. This is not surprising given the general trend <strong>of</strong><br />
increasing Integ and decreasing <strong>%IOWY</strong> as the reduction potential is increased. A darker shade with<br />
less dye can only exist when a greater percentage <strong>of</strong> the dye is located at the outer surface, i.e.<br />
more ring dyed.<br />
163
%COWY<br />
<strong>%IOWY</strong><br />
Integ<br />
Penetration level<br />
Graph Builder<br />
Reduction Potential Affect on %COWY, <strong>%IOWY</strong>, Integ, and<br />
Penetration Level<br />
12.00%<br />
10.00%<br />
8.00%<br />
6.00%<br />
4.00%<br />
2.00%<br />
3.50%<br />
3.00%<br />
2.50%<br />
2.00%<br />
1.50%<br />
1.00%<br />
0.50%<br />
100<br />
90<br />
80<br />
70<br />
60<br />
50<br />
40<br />
30<br />
0.5<br />
0.45<br />
0.4<br />
0.35<br />
0.3<br />
0.25<br />
726 - 786<br />
Box mV<br />
786 - 851 851 - 891<br />
0.2<br />
0.5 1 1.5 2 2.5 3 3.5<br />
0.5 1 1.5 2 2.5 3 3.5 0.5 1 1.5 2 2.5 3 3.5<br />
(g/l)<br />
Indigo gm/lit<br />
Figure 4-15: Reduction potential affect on %COWY, <strong>%IOWY</strong>, Integ, and penetration level at various dye bath<br />
concentrations after six dips <strong>of</strong> indigo on 6.3/1 yarn.<br />
164
The effect <strong>of</strong> dwell length on each response variable is displayed in figure 4-16 for the<br />
relationship on 6.3/1 yarn after 6 dips <strong>of</strong> indigo. Increasing the dwell length from 8.6 meters to 11.4<br />
meters causes the %COWY, <strong>%IOWY</strong>, and Integ shade values to decrease as demonstrated by arrows<br />
<strong>of</strong> constant dye bath concentration in graphical rows 1, 2, and 3. This relationship is also<br />
contradictory to traditional thinking. If the dwell length increased and everything else is constant,<br />
the yarn would be exposed to the dye bath for a greater time. One would think greater time should<br />
result in more pick-up or exchange <strong>of</strong> dye and other chemicals from the bath to the yarn. As rows 1,<br />
2, and 3 from figure 4-16 demonstrates, this did not happen. Therefore another parameter or<br />
interaction <strong>of</strong> parameters must be affecting the results.<br />
The penetration level has a slight increase in value as the dwell length is increased in figure<br />
4-16. This trend would be expected since everything else held constant greater dwell length would<br />
result in greater time for the dye to penetrate into the yarn structure.<br />
165
%COWY<br />
<strong>%IOWY</strong><br />
Integ<br />
Penetration level<br />
Graph Builder<br />
12.00%<br />
10.00%<br />
8.00%<br />
6.00%<br />
4.00%<br />
2.00%<br />
3.50%<br />
3.00%<br />
2.50%<br />
2.00%<br />
1.50%<br />
1.00%<br />
0.50%<br />
100<br />
90<br />
80<br />
70<br />
60<br />
50<br />
40<br />
30<br />
0.5<br />
0.45<br />
0.4<br />
0.35<br />
0.3<br />
0.25<br />
Dwell Length Affect on %COWY, <strong>%IOWY</strong>, Integ, and<br />
Penetration Level<br />
0.2<br />
0.5 1 1.5 2 2.5 3 3.5<br />
Dwell length<br />
8.63 11.37<br />
0.5 1 1.5 2 2.5 3 3.5<br />
Indigo gm/lit<br />
Figure 4-16: Dwell length affect on %COWY, <strong>%IOWY</strong>, Integ, and penetration level at various dye bath concentrations<br />
after six dips <strong>of</strong> indigo on 6.3/1 yarn.<br />
(g/l)<br />
(m)<br />
166
Given the odd relationships uncovered while investigating dwell length, a detailed review <strong>of</strong><br />
dwell time is presented. Dwell time is a factor <strong>of</strong> speed and dwell length and presented in terms <strong>of</strong><br />
seconds. The dwell time was measured from dye liquor surface to entry nip point on the dye range.<br />
The dwell time was summarized into three groups: 14 to 16.7 seconds, 16.7 to 19.6 seconds, and<br />
19.6 to 25.7 seconds. Each group and corresponding response variables on 6.3/1 after 6 dips <strong>of</strong><br />
indigo are presented in figure 4-17.<br />
Unfortunately, the effect <strong>of</strong> dwell time presents more surprising results. The first row <strong>of</strong><br />
graphs in figure 4-17 indicates %COWY decreases with increasing dwell time. This is unexpected<br />
since typically increased dwell time allows for greater dye pick-up and therefore greater %COWY.<br />
Likewise, the second row <strong>of</strong> graphs show <strong>%IOWY</strong> doesn't change with dwell time. This is also<br />
surprising following the same logic as %COWY. Third row <strong>of</strong> graphs show Integ values generally<br />
decrease with increasing dwell time. The behavior <strong>of</strong> these response variables is contradictory to<br />
conventional thinking under the influence <strong>of</strong> changing dwell time. There must be an underlying<br />
effect from another parameter or interaction <strong>of</strong> parameters which should be revealed by a detailed<br />
ANOVA analysis.<br />
The last row <strong>of</strong> figure 4-17 indicates increasing penetration level with increasing dwell time.<br />
This is expected. By increasing submerge time in the dye, the dye is expected to penetrate deeper<br />
into the yarn structure. This causes great dye penetration or less ring dyeing as reflected in higher<br />
penetration level values.<br />
167
%COWY<br />
<strong>%IOWY</strong><br />
Integ<br />
Penetration level<br />
Graph Builder<br />
12.00%<br />
10.00%<br />
8.00%<br />
6.00%<br />
4.00%<br />
2.00%<br />
3.50%<br />
3.00%<br />
2.50%<br />
2.00%<br />
1.50%<br />
1.00%<br />
0.50%<br />
100<br />
90<br />
80<br />
70<br />
60<br />
50<br />
40<br />
30<br />
0.5<br />
0.45<br />
0.4<br />
0.35<br />
0.3<br />
0.25<br />
Dwell Time Affect on %COWY, <strong>%IOWY</strong>, Integ, and<br />
Penetration Level<br />
14.03 - 16.7<br />
Dwell time<br />
16.7 - 19.6 19.6 - 25.7<br />
0.2<br />
0.5 1 1.5 2 2.5 3 3.5<br />
0.5 1 1.5 2 2.5 3 3.5 0.5 1 1.5 2 2.5 3 3.5<br />
Indigo gm/lit<br />
Figure 4-17: Dwell time affect on %COWY, <strong>%IOWY</strong>, Integ, and penetration level at various dye bath concentrations after<br />
six dips <strong>of</strong> indigo on 6.3/1 yarn.<br />
(g/l)<br />
(sec)<br />
168
The effect <strong>of</strong> nip pressure on %COWY, <strong>%IOWY</strong>, Integ, and penetration level is examined in<br />
figure 4-18. As the nip pressure is increased from the 40/45 psi range to the 50/75 psi range,<br />
virtually no impact is detected on the %COWY, <strong>%IOWY</strong>, Integ, and penetration level.<br />
(g/l)<br />
Figure 4-18: Nip pressure affect on %COWY, <strong>%IOWY</strong>, Integ, and penetration level at various dye bath concentrations<br />
after six dips <strong>of</strong> indigo on 6.3/1 yarn.<br />
169
4.2 Empirical Dye Models Based on Dye Range Parameters and the Resulting Affect on Indigo Dye<br />
Response Variables<br />
Clearly manual calculation <strong>of</strong> the ANOVA analysis for all nine dye range set-up condition<br />
affects and interactions on four response variables is mathematically daunting and more<br />
importantly unnecessary. Thanks to the advances <strong>of</strong> modern technology, the observational data<br />
was analyzed using SAS JMP 8.0 statistical s<strong>of</strong>tware package. As discussed in chapter 3.4, the initial<br />
or "prime data" sets were analyzed using the statistical package on all four response variables. Once<br />
a base line model was established, additional data points or "replicas" were added to each model.<br />
Then the analysis was repeated to confirm statistically significant parameters remained important<br />
and no new parameters became important. Also, the standard error after the addition <strong>of</strong> each<br />
replica was recorded. The standard errors were tracked to determine convergence. The<br />
observational study was concluded. The final response model generated. Following this procedure<br />
the initial model, convergence check, and final model are presented next for dye range set-up<br />
condition affects on %COWY, <strong>%IOWY</strong>, Integ shade, and penetration level.<br />
4.2.1 %COWY Empirical Model Generation<br />
Using the prime data set and SAS JMP 8.0 statistical s<strong>of</strong>tware package the %COWY empirical<br />
model was generated using the dye range set-up conditions as the input values. The overall<br />
correlation <strong>of</strong> fit was determined to 0.91 with an F ratio <strong>of</strong> 374.2 as shown in table 4-1. The best<br />
model fit was determined to involve the dye bath concentration and pH. Also, the second order<br />
term <strong>of</strong> speed and interaction <strong>of</strong> speed and pH were also determined to be statistically significant as<br />
indicated by the P-values. Because the second order term <strong>of</strong> speed was significant the first order<br />
term was left in the model even though the P-value warrants removal. Also listed in table 4-1 are<br />
the standard errors for each significant parameter.<br />
170
Table 4-1: ANOVA analysis results from the prime data set on %COWY.<br />
With the initial model for %COWY generated and the standard errors recorded, additional<br />
replica data set were added one at a time. The actual parameter standard errors are listed in<br />
appendix section A-4-2a for reference. To facilitate communication <strong>of</strong> convergence, the standard<br />
errors for each parameter were normalized by the initial standard error from the prime data set.<br />
Then the normalized parameter standard errors were averaged at each replica point to create a<br />
single value. Figure 4-19 demonstrates the convergence test for the empirical model <strong>of</strong> %COWY as<br />
each new averaged normalized standard error is added. At the 0 x-axis point the value is 1.0 since<br />
171
this is the average normalized value to itself. All additional points are based on this starting point.<br />
With the addition <strong>of</strong> the first three replica points the average normalized standard error<br />
actually increased. However after 5 replica points were added to the model, the average<br />
normalized standard error dropped below 1.0 and continued to decrease with each additional<br />
replica set. After 11 replica data sets were added, the average normalized standard error was<br />
approximately 0.90 or 10% less than the prime data set and remained virtually unchanged for the<br />
balance <strong>of</strong> replica data sets. This signifies the observational study could have been concluded after<br />
11 replica data sets based on %COWY analysis.<br />
Average Normalized Standard Error<br />
for all Significant Parameters<br />
1.2<br />
1.15<br />
1.1<br />
1.05<br />
1<br />
0.95<br />
0.9<br />
0.85<br />
0.8<br />
Convergence Test for Empirical %COWY Model<br />
0 5 10 15 20 25<br />
Figure 4-19: Convergence test for empirical %COWY model.<br />
Number <strong>of</strong> Additional Replicates Added<br />
Now the final empirical %COWY model was generated based on all available data points.<br />
The final R 2 correlation coefficient was 0.88 with an F ratio <strong>of</strong> 380 as shown in table 4-2. For<br />
completeness the final parameter estimates and standard errors are also shown. The final model<br />
maintained the same statistically significant parameters as the prime data set model as<br />
demonstrated in the effect tests. No new statistically significant terms surfaced.<br />
172
Table 4-2: ANOVA analysis for %COWY from the entire data set.<br />
173
Using the parameter estimates from table 4-2, the final empirical model for %COWY was<br />
created. The <strong>of</strong>ficial equation is listed below as equation 4-1.<br />
1: 0.0<br />
⎡<br />
⎡<br />
2: 0.1642<br />
⎤<br />
⎢<br />
⎢ ⎥<br />
⎢<br />
⎢<br />
3: 0.3126<br />
⎥<br />
%
Actual %COWY<br />
Figure 4-20: Comparison <strong>of</strong> actual versus predicted %COWY for the entire data set.<br />
To investigate the effects <strong>of</strong> each parameter on %COWY and compare the results to<br />
previous graphical analysis, the prediction pr<strong>of</strong>ile was created. Figure 4-21 illustrates the calculated<br />
%COWY as it varies by each dye range set-up condition. The graph in the first column shows an<br />
increasing %COWY value as the yarn count is increased. This confirms the significance graphically<br />
displayed in figure 4-12. Additionally, the influence <strong>of</strong> yarn count on %COWY has not been observed<br />
in previously published experiments.<br />
175
%COWY<br />
0.086371<br />
[0.08272, 0.09018]<br />
Figure 4-21: %COWY prediction pr<strong>of</strong>ile for dye range set-up condition affect on %COWY from the empirical model.<br />
The graph in the second column from figure 4-21 confirms the number <strong>of</strong> dips has a non-<br />
linear impact on the %COWY. The shape <strong>of</strong> this curve is very similar to the curve in figure 4-1 when<br />
the %COWY versus dips was discussed. Also, the dye range speed was determined to be statistically<br />
significant but by the second order term. As the middle column graph illustrates, as the speed is<br />
increased the %COWY increases until a limit is reached at approximately 33 m/min. The original<br />
graphical analysis did not detect this relationship. The graph in the fourth column identifies a strong<br />
relationship between the dye bath indigo concentration and the %COWY. Logically, as the dye bath<br />
concentration is increased the %COWY also increases. In the final coumn graph <strong>of</strong> figure 4-21, as<br />
the pH <strong>of</strong> the dye bath is increased the %COWY decreases. Recall this same relationship was<br />
detected in figure 4-14.<br />
%COWY Prediction Pr<strong>of</strong>ile for Dye Range Set-up Conditions<br />
6<br />
8<br />
10<br />
12<br />
14<br />
1<br />
3<br />
4.2.2 <strong>%IOWY</strong> Empirical Model Generation<br />
5<br />
7<br />
26<br />
The same process was repeated for the <strong>%IOWY</strong> using the prime data set as the initial<br />
starting point for the ANOVA analysis. The R 2 correlation coefficient was determined to be 0.97 with<br />
an F ratio <strong>of</strong> 1585 as shown in table 4-3. This was determined to be the best possible model fit using<br />
all dye range set-up conditions, second order terms, and interactions. The parameter estimates<br />
listed in table 4-3 produce the initial standard errors for each significant parameter. Note the dye<br />
bath pH was determined to be statistically insignificant with a P-value <strong>of</strong> 0.1449. However, this<br />
29<br />
32<br />
35<br />
1<br />
2<br />
(g/l)<br />
3<br />
11<br />
12<br />
176
parameter was left in the model due to strong evidence in the graphical analysis section and<br />
previously published material that pH should play a strong role in <strong>%IOWY</strong>.<br />
Table 4-3: ANOVA analysis from the prime data set on <strong>%IOWY</strong>.<br />
Next, each replica data set was introduced to the empirical model for <strong>%IOWY</strong>. After each<br />
introduction, the new parameter standard errors were recorded. As with %COWY, the average<br />
normalized standard error after introduction <strong>of</strong> each replica set was calculated. The convergence<br />
trend is illustrated in figure 4-22 with the individual data posted in appendix section A-4-2b. As each<br />
177
new replica data set is introduced, the average normalized standard error continues to decrease.<br />
After 14 replica sets were included, the average normalized standard error remains fairly flat with<br />
no major change in the values. After 16 replica sets the average normalized standard error is 0.85 or<br />
15% less than the prime data set and point <strong>of</strong> diminishing returns indicated the observational study<br />
was concluded.<br />
Average Normalized Standard Error<br />
for all Significant Parameters<br />
1.2<br />
1.15<br />
1.1<br />
1.05<br />
1<br />
0.95<br />
0.9<br />
0.85<br />
0.8<br />
Convergence Test for Empirical <strong>%IOWY</strong> Model<br />
0 5 10 15 20 25<br />
Figure 4-22: Convergence test for the empirical <strong>%IOWY</strong> model.<br />
Number <strong>of</strong> Additional Replicates Added<br />
The final empirical model for <strong>%IOWY</strong> as a function <strong>of</strong> dye range set-up conditions was<br />
calculated based on the entire data set. During this analysis, no new single order, second order, or<br />
interaction parameter effects were deemed statistically significant. Additionally, the effect <strong>of</strong> pH<br />
was determined not to have become significant. The P-value <strong>of</strong> 0.3704 in table 4-4 indicates the<br />
variation due to another parameter is just as likely as the affect <strong>of</strong> pH. For this reason, the pH<br />
parameter was removed from the model and the ANOVA analysis repeated.<br />
178
Table 4-4: Effects test from <strong>%IOWY</strong> ANOVA analysis for the entire data set with pH component.<br />
After removing the pH parameter from the ANOVA analysis the R 2 correlation coefficient<br />
was determined to be 0.97 with an F ratio <strong>of</strong> 2597 from table 4-5. These two coefficients indicate<br />
the model is a very strong fit to the data. Also listed under the parameter estimate section is the<br />
final standard error for each parameter.<br />
179
Table 4-5: ANOVA analysis for the <strong>%IOWY</strong> from the entire data set<br />
Using the parameter estimates from table 4-5, the final <strong>%IOWY</strong> empirical model equation<br />
was determined and listed as equation 4-2.<br />
180
1: 0.0<br />
⎡<br />
2: 0.6057<br />
⎤<br />
⎢ ⎥<br />
⎢<br />
3: 1.0341<br />
⎥<br />
%
A prediction pr<strong>of</strong>ile graph was created for the empirical model <strong>%IOWY</strong> as a function <strong>of</strong> each<br />
dye range set-up condition. As shown in figure 4-24, increasing yarn count causes the <strong>%IOWY</strong> to<br />
increase. This relationship was observed during the graphical analysis section and hasn't been<br />
documented by others. Just as demonstrated by other experiments (Xin 46 ) and illustrated in the<br />
graphical analysis section, increasing the number <strong>of</strong> dips causes the <strong>%IOWY</strong> to increase in a nearly<br />
linear fashion. This relationship is highlighted in the second column graph <strong>of</strong> figure 4-24. The third<br />
column graph shows increasing speed was determined to cause the <strong>%IOWY</strong> to decrease. This was<br />
originally observed in the graphical analysis section and hasn't been documented by others. In the<br />
final column <strong>of</strong> figure 4-24, increasing the indigo concentration in the dye bath causes the <strong>%IOWY</strong> to<br />
increase. This relationship has been well documented in previous experiments.<br />
Measured<br />
<strong>%IOWY</strong><br />
0.01993<br />
[0.01934, 0.02054]<br />
<strong>%IOWY</strong> Prediction Pr<strong>of</strong>ile for Dye Range Set-up Conditions<br />
7<br />
8<br />
9<br />
10<br />
11<br />
12<br />
1<br />
Figure 4-24: Prediction pr<strong>of</strong>ile for <strong>%IOWY</strong> and dye range set-up parameters.<br />
3<br />
5<br />
7<br />
26<br />
28<br />
30<br />
32<br />
34<br />
36<br />
1<br />
2<br />
(g/l)<br />
3<br />
182
4.2.3 Integ Empirical Model Generation<br />
ANOVA analysis <strong>of</strong> the prime data set for dye range set-up conditions affect on Integ shade<br />
are presented in table 4-6. The overall correlation coefficient R 2 was 0.96 with an F ratio <strong>of</strong> 1049.<br />
This was determined to be statistically significant. The initial parameter standard errors are listed in<br />
parameter estimates section <strong>of</strong> table 4-6. The P-value for each dye range set-up parameter is listed<br />
in effect tests section. No other first or second order condition or interaction <strong>of</strong> conditions was<br />
determined to be statistically significant.<br />
Table 4-6: ANOVA analysis <strong>of</strong> Integ shade from the prime data set.<br />
183
The convergence test for dye range set-up parameter affects on Integ shade value are<br />
illustrated in figure 4-25. The individual parameter standard error for each replica set is<br />
documented in the appendix section A-4-2c. Each additional replica set caused the average<br />
normalized standard error to decrease. After 17 replica sets the average normalized standard error<br />
reached the point <strong>of</strong> diminishing return at 0.816 or 18.4% less than the prime data set average<br />
normalized standard error. As indicated by the overall trend line, additional replica sets would not<br />
greatly reduce the standard error and the observational study was concluded.<br />
Average Normalized Standard Error<br />
for all Significant Parameters<br />
1.2<br />
1.15<br />
1.1<br />
1.05<br />
1<br />
0.95<br />
0.9<br />
0.85<br />
0.8<br />
Convergence Test for Empirical Integ Model<br />
0 5 10 15 20 25<br />
Figure 4-25: Convergence test for empirical model Integ.<br />
Number <strong>of</strong> Additional Replicates Added<br />
The final empirical Integ model based on dye range set-up parameters was generated. The<br />
correlation coefficient R 2 value <strong>of</strong> 0.96 and F ratio <strong>of</strong> 1610 from table 4-7 indicated the overall model<br />
improved from the prime data set. The final parameter standard errors are displayed in the<br />
parameter estimates section <strong>of</strong> table 4-7. During the ANOVA analysis other dye range set-up<br />
condition first order, second order, and interaction effects were evaluated and determined to not<br />
184
ecome statistically significant. The final P-value for each parameter is listed in effect tests section<br />
<strong>of</strong> table 4-7.<br />
Table 4-7: ANOVA analysis for Integ from the entire data set.<br />
The final Integ equation was determined based on the parameter estimates from table 4-7.<br />
The empirical model Integ prediction equation based on dye range set-up conditions is listed in<br />
equation 4-3.<br />
185
1: 0.0<br />
⎡<br />
2: 0.6763<br />
⎤<br />
⎢ ⎥<br />
⎢<br />
3: 1.0511<br />
⎥<br />
Integ = exp[4.0128 +
The prediction pr<strong>of</strong>ile for each dye range set-up condition effect on predicted Integ shade<br />
value from the empirical model is shown in figure 4-27. Just as seen in the graphical analysis section<br />
as the yarn count is increased the Integ value increased. Increasing depth <strong>of</strong> shade as a function <strong>of</strong><br />
yarn count has not been previously published. Just as Xin 46 and Chong 29 have demonstrated, as the<br />
number <strong>of</strong> dips was increased the resulting Integ shade value also increased. As previously<br />
discussed in the graphical section, increases in speed caused the Integ values to decrease. Again,<br />
this hasn't been previously discussed in the literature. As the dye bath concentration was increased<br />
the predicted Integ shade value also increased. This again is a well established relationship in<br />
published literature and confirmed here. In the last column <strong>of</strong> figure 4-27, as the dye bath pH values<br />
increase the Integ shade values decrease. This mirrors Etter's detailed experiments on pH sensitivity<br />
<strong>of</strong> the resulting shade <strong>of</strong> the yarn.<br />
Measured<br />
Integ<br />
84.19798<br />
[81.3518, 87.1437]<br />
Integ Prediction Pr<strong>of</strong>ile for Dye Range Set-up Conditions<br />
7<br />
9<br />
11<br />
1<br />
3<br />
5<br />
7<br />
26<br />
28<br />
30<br />
32<br />
34<br />
36<br />
Figure 4-27: Prediction pr<strong>of</strong>ile for Integ shade values as a function <strong>of</strong> each dye range set-up conditions.<br />
1<br />
2<br />
(g/l)<br />
3<br />
11<br />
12<br />
187
4.2.4 Penetration Level Empirical Model Generation<br />
The penetration level from the ANOVA analysis will be discussed. The empirical model from<br />
the prime data set doesn't exhibit a strong correlation to the data as demonstrated by the R 2<br />
correlation coefficient <strong>of</strong> 0.48 but deemed significant due to F ratio <strong>of</strong> 32.6 and P-value for the<br />
model less than 0.0001 as shown in table 4-8. Also, the parameter standard errors are shown in the<br />
parameter estimate section. The effect tests determined the yarn count, dip, dye bath<br />
concentration, pH, speed/pH interaction, and second order speed terms to be significant. Notice<br />
the first order speed term has been left in the model due to interaction and second order effects.<br />
No other dye range set-up parameter was determined to be significant.<br />
188
Table 4-8: ANOVA analysis results from the prime data set and penetration level.<br />
Following the previously discussed convergence test, the average normalized standard error<br />
for each parameter and interaction was recorded after each replica data set was introduced. The<br />
complete standard error values are recorded in appendix section A-4-2d. As shown in figure 4-28, as<br />
each new replica set was introduced, the average normalized standard error decreased in value.<br />
After 15 replica data sets were introduced, the average normalized standard error remains fairly<br />
189
consistent and the point <strong>of</strong> diminishing return was determined to have been reached. The value <strong>of</strong><br />
the last three replica sets was 0.73 or 27% less than the prime data set average normalized standard<br />
error. At this point the observational study was concluded.<br />
Average Normalized Standard Error<br />
for all Significant Parameters<br />
1.2<br />
1.1<br />
1<br />
0.9<br />
0.8<br />
0.7<br />
0.6<br />
Convergence Test for Empirical Penetration Level<br />
Model<br />
0 5 10 15 20 25<br />
Number <strong>of</strong> Additional Replicates Added<br />
Figure 4-28: Convergence test for empirical model penetration level.<br />
The ANOVA analysis on all data sets for penetration level determined the speed and pH<br />
interaction term to no longer be statistically significant as indicated by the P-value <strong>of</strong> 0.3853 in table<br />
4-9. Therefore, this parameter interaction was removed from the final empirical model for<br />
penetration level as a function <strong>of</strong> dye range set-up parameters and the analysis was repeated.<br />
190
Table 4-9: Effect tests for all data points with speed and pH interaction<br />
The final ANOVA analysis <strong>of</strong> penetration level as a function <strong>of</strong> all dye range set-up conditions<br />
did not reveal any new first order, second order, or interaction terms. The final model correlation<br />
coefficient was 0.51 with an F ratio <strong>of</strong> 62.5 as shown in table 4-10. While this isn't a strong<br />
relationship it is deemed significant due to medium strength F ratio and model P-value much less<br />
than 0.0001. The individual parameter final standard error is listed in parameter estimate section.<br />
Note the speed first order term was determined to remain unimportant in the effect tests section<br />
however the term was left in the model due to the significance <strong>of</strong> the second order speed term.<br />
191
Table 4-10: Final empirical model ANOVA analysis for all data sets<br />
The final penetration level prediction equation was determined based on the parameter<br />
estimates from table 4-10. The empirical model prediction equation for penetration level as a<br />
function <strong>of</strong> dye range set-up conditions is provided as equation 4-4.<br />
192
1: 0.0<br />
⎡<br />
2: 0.0433<br />
⎤<br />
⎢<br />
⎥<br />
⎢<br />
3: 0.0098<br />
⎥<br />
Penetration Level = −0.4789 +
Actual Penetration<br />
Level<br />
Figure 4-29: Comparison between actual and predicted penetration level.<br />
The dye range set-up parameter effects on the predicted penetration level will be discussed.<br />
Figure 4-30 shows the prediction pr<strong>of</strong>ile. As discussed and highlighted in the graphical analysis<br />
section, increasing yarn count caused the penetration level to increase. This indicates finer yarns<br />
are more penetrated than courser counts given everything else as a constant. This is an interesting<br />
observation that hasn't been discussed by others. The same relationship for increasing dip is<br />
exhibited in the empirical model for penetration level. Speed does affect the penetration level but<br />
not in a linear fashion as discussed in the graphical analysis section. Instead, increasing the speed<br />
from 26 m/min to 32 m/min caused the penetration level to decrease. After 32 m/min further<br />
increases in speed have little effect on the penetration level. As discussed numerous times,<br />
increasing the dye bath concentration caused the penetration level to decrease. In the last graph on<br />
figure 4-30, the dye box pH has the same relationship as documented by many others in the<br />
published experiments. Increasing the box pH caused the penetration level to increase or the yarns<br />
become less ring dyed.<br />
194
Actual<br />
Penetration Level<br />
0.310253<br />
±0.017625<br />
Penetration Level Prediction Pr<strong>of</strong>ile for Dye Range Set-up Conditions<br />
7<br />
9<br />
11<br />
1<br />
3<br />
5<br />
7<br />
26<br />
Figure 4-30: Prediction pr<strong>of</strong>ile <strong>of</strong> empirical model penetration level as a function <strong>of</strong> dye range set-up parameters.<br />
29<br />
32<br />
35<br />
1<br />
2<br />
(g/l)<br />
3<br />
11<br />
12<br />
195
4.3 Theoretical Model for Indigo Dye Process<br />
A theoretical dye model was constructed based on general dye theory summarized by Etters<br />
and discussed in section 1.4.1 coupled with diffusional theory developed by Ficks. The primary<br />
purpose for this investigation was to gain an understanding <strong>of</strong> the mechanisms that influence the<br />
general trends discussed in section 4.1 and 4.2. Additionally, develop a rigorous mathematical<br />
model <strong>of</strong> the indigo dye process that would be quantitatively extendable to all long chain rope<br />
indigo dye ranges.<br />
4.3.1 Derivation <strong>of</strong> Theoretical Dye Model<br />
Following Etters's dye theory model, the approach is broken into two different components.<br />
1. Dye movement and propagation on a macro scale into the yarn structure from the dye bath. 2.<br />
Dye attraction and movement into the fibers on a micro scale. Both processes occur simultaneously<br />
during the dipping process. After the yarns have been squeezed by the nip rollers, macro movement<br />
within the yarn stops. However, dye attraction for the individual fibers may continue until all the<br />
dye is oxidized. Using this approach, the theoretical model was broken down into three main<br />
sections: the dip process where the yarns are actually submerged in the indigo dye bath, the nip<br />
process where the excess dye liquor is squeezed from the yarns, and last the oxidation process<br />
where the final fixed indigo (<strong>%IOWY</strong>) was determined.<br />
Etters described four main paths that occur in the dip process. These are summarized<br />
below. This dye model did incorporate these four dye paths in the dipping process. However, the<br />
model was expanded to allow path 4 to continue beyond the nip process.<br />
1. Diffusion <strong>of</strong> the dye in the external medium (usually water) toward the diffusional boundary layer<br />
at the fiber surface.<br />
2. Diffusion <strong>of</strong> dye through the diffusional boundary layer that exists at the fiber surface.<br />
3. Adsorption <strong>of</strong> the dye onto the fiber surface.<br />
4. Diffusion <strong>of</strong> dye into the fiber surface.<br />
In addition to these four paths, the theoretical model compensated for wet pick-up from the<br />
nip process, wash reduction <strong>of</strong> chemicals on weight <strong>of</strong> yarn, and the rate <strong>of</strong> oxidation. All combined<br />
this would result in eight unknown coefficients to completing describe the indigo dyeing process:<br />
the four previously discussed paths each with an unknown coefficient, the wet pick-up, wash<br />
196
eduction, diffusion <strong>of</strong> oxygen through the yarn structure, and oxidation rate. The observational<br />
study produced three known values for each yarn, dip, and dye range set-up. Specifically the three<br />
known values were %COWY, <strong>%IOWY</strong>, and Integ shade. To overcome the deficiency in number <strong>of</strong><br />
known values, several assumptions were made.<br />
First the diffusion <strong>of</strong> dye in the external medium and diffusion <strong>of</strong> dye through the boundary<br />
layer were grouped together as one unknown coefficient called the effective yarn diffusion<br />
coefficient, Dy. This coefficient controlled the dye bath concentration within the yarn structure that<br />
was available to dye into the fiber. It was not the actual diffusion coefficient <strong>of</strong> indigo dye through<br />
the dye bath. The influence <strong>of</strong> this parameter determined the effective dye bath concentration<br />
within the yarn structure which affected the %COWY, <strong>%IOWY</strong>, and indigo distribution within the<br />
yarn.<br />
The diffusion coefficient for indigo dye in the water solution is not directly known.<br />
However, a value can be assumed based on other equations and theoretical work. Ozisik 59<br />
presented a method that calculates the diffusion coefficient by use <strong>of</strong> equation 4-5.
controlled the total movement <strong>of</strong> dye into the fiber surface. It was not the actual fiber diffusion<br />
coefficient. This coefficient regulated the amount <strong>of</strong> dye into the fiber which resulted in the final<br />
<strong>%IOWY</strong> value.<br />
Now the theoretical model had six unknown values and one more unknown value can be<br />
approximated. The diffusion <strong>of</strong> oxygen, DOy, through air follows known classical diffusion process.<br />
The mass percentage composition <strong>of</strong> dry air at sea level is approximately 75.5% nitrogen, 23.2%<br />
oxygen, and 1.3% argon 8 . The corresponding mole fractions are 0.78 N2, 0.21 O2, and 0.0096 Ar at<br />
one atmosphere pressure. The density <strong>of</strong> air at room temperature (20° C) and one atmosphere<br />
pressure is 1.21 kg/m 3 or g/l 8 . Therefore the initial concentration <strong>of</strong> oxygen in the air is 0.21 * 1.21<br />
g/l = 0.2541 g/l. Since air is mostly composed <strong>of</strong> oxygen and nitrogen, the mixture can be modeled<br />
as a binary system. The diffusion <strong>of</strong> oxygen through nitrogen at room temperature (20° C) and one<br />
atmosphere pressure has been determined to be 0.219 cm 2 /sec 60 . This value was used during the<br />
oxidation process.<br />
In order to manipulate the remaining five unknown coefficients, calculations were expanded<br />
to incorporate several dips <strong>of</strong> indigo across multiple yarn counts. The following relationships were<br />
utilized to construct an iterative process to goal seek the optimum value for each unknown<br />
coefficient.<br />
1. The effective fiber diffusion coefficient, Df, was assumed constant regardless <strong>of</strong> yarn count and<br />
only dependent on the specific dye range set-up and indigo dip analyzed.<br />
2. The effective yarn diffusion coefficient, Dy, was assumed constant regardless <strong>of</strong> yarn count and<br />
only dependent on the specific dye range set-up and indigo dip analyzed.<br />
3. The wash reduction coefficient was constant regardless <strong>of</strong> yarn count and dips. The dip<br />
assumption applied only to the interior dips not first or last dip since these nip pressures were<br />
higher than the interior dips. This coefficient only depended on dye range set-up.<br />
4. The wet pick-up coefficient was constant regardless <strong>of</strong> yarn count and dips. Constant wet pick-up<br />
only applied to the interior dips for the same reason as wash reduction.<br />
5. The oxidation rate was assumed constant for each yarn count and dip process. It only depended<br />
on the dye range set-up parameters.<br />
Using the above assumptions the following relationships were identified. The effective fiber<br />
diffusion coefficient was governed by the final Integ shade <strong>of</strong> the yarn. By converting the Integ<br />
shade into <strong>%IOWY</strong> from equilibrium sorption, the outside or visible surface indigo concentration was<br />
198
determined. The concentration was fiber diffusion dependent. Therefore the goal seek algorithm<br />
adjusted the fiber diffusion coefficient until the calculated <strong>%IOWY</strong> on the outside surface matched<br />
the target value from the Integ conversion.<br />
With the fiber diffusion coefficient identified the effective yarn diffusion coefficient was<br />
regulated by the final calculated total <strong>%IOWY</strong>. The algorithm adjusted the yarn diffusion coefficient<br />
while applying the appropriate fiber diffusion coefficient until the total calculated <strong>%IOWY</strong> matched<br />
the target value from Pyrrolidinone extractions.<br />
The wet pick-up coefficient controlled the final %COWY. Given the yarn diffusion<br />
coefficient, the dye concentration distribution within the yarn was calculated. The wet pick-up<br />
coefficient regulated the percentage <strong>of</strong> dye bath concentration that was allowed to move on to the<br />
oxidation process. Excess dye bath concentration would either continue to diffuse into the fiber or<br />
was oxidized by oxygen and formed the oxidized boundary layer. By calculating the oxidized<br />
boundary layer the wet pick-up coefficient was determined by the algorithm by matching the value<br />
to the targeted measured %COWY.<br />
Once the fiber diffusion coefficient, yarn diffusion coefficient, and wet pick-up were<br />
determined that matched the targeted %COWY, <strong>%IOWY</strong>, and Integ shade for each yarn count and<br />
dip; the wash reduction value was adjusted until the wet pick-up coefficient was constant across all<br />
interior dye baths. Then the oxidation rate was adjusted until the minimum standard deviation was<br />
determined for fiber diffusion coefficient, yarn diffusion coefficient, and wet pick-up across all the<br />
yarn counts. This method resulted in one fiber diffusion coefficient per dip, one yarn diffusion<br />
coefficient per dip, one wash reduction value, one wet pick-up value, and one oxidation rate per<br />
indigo dye range set-up across all yarn counts.<br />
Once the individual dye theory coefficients are determined, a model for each coefficient was<br />
constructed using the nine dye range set-up conditions. Using the dye theory coefficient equations,<br />
the resulting %COWY, <strong>%IOWY</strong>, and Integ values would emerge from the model. Then the<br />
penetration level was calculated based on the predicted <strong>%IOWY</strong> and Integ values. At the conclusion<br />
the theoretical and empirical models will be compared to one another to identify agreements and<br />
conflicts.<br />
199
4.3.1.a The Dip Process<br />
The dye theory model will incorporate dye bath concentration variation as it moves through<br />
the yarn structure, effective diffusion coefficient encompassing the affinity <strong>of</strong> reduced indigo dye<br />
molecules for the surface <strong>of</strong> cotton fibers and diffusion <strong>of</strong> indigo dye into the fiber surface, wet pick-<br />
up caused by the nip rollers, and last oxidation. Of course any discussion on diffusion will involve<br />
Fick's first and second laws <strong>of</strong> diffusion which are presented in one dimensional form in equation 4-<br />
6. The parameter D is referred as the diffusion coefficient and is written in terms <strong>of</strong> distance<br />
squared per second (cm 2 /sec). The coefficient describes the rate at which a material diffuses<br />
through a unit area.
similar to heat generation term in classical heat transfer theory and is dependent on the dye bath<br />
concentration and location within the yarn.<br />
One <strong>of</strong> the simpler methods to solve classic transient second order partial diffusion<br />
equations is to approximate the solution through finite difference methods. The introduction <strong>of</strong><br />
F(C,r) term to represent the rate <strong>of</strong> dye removal adds a twist but finite difference remains the<br />
simplest method. First, the partial differential equation is transformed into a series <strong>of</strong> linear<br />
algebraic equations by Crank-Nicholson's explicit finite difference method by assuming constant Dy.<br />
The resulting expression is listed in equation 4-8.<br />
<br />
<br />
∆<br />
= <br />
∗ <br />
<br />
<br />
∆
the equilibrium sorption experiments discussed in chapter 3.3, equation 4-11. Second, the fraction<br />
<strong>of</strong> the maximum possible <strong>%IOWY</strong> was calculated based on Cranks 2 theoretical analysis solution for<br />
infinite dye bath conditions, equation 4-10. Incorporating these two expressions together in<br />
equation 4-9 resulted in the final relationship <strong>of</strong> <strong>%IOWY</strong> at each node.<br />
%
laminar flow. The micro vortices produce localized mixing <strong>of</strong> the dye bath. This was assumed to<br />
result in constant concentration <strong>of</strong> the dye bath at the outside or surface node.<br />
<br />
<br />
Equation 4-15 exists due to symmetry about the center <strong>of</strong> the yarn where r = 0.<br />
=0
A finite difference nodal mesh was then constructed starting at the center <strong>of</strong> the yarn<br />
(node=0) and progressing toward the exterior surface <strong>of</strong> the yarn (node=M) as shown in figure 4-31.<br />
By applying the appropriate finite difference equations and/or boundary conditions, M numbers <strong>of</strong><br />
linear algebraic equations were developed. The experimenter has assumed uniform dye bath<br />
conditions exist surrounding the individual fibers in each node during the time step under<br />
consideration.<br />
nodes<br />
C0<br />
C1<br />
∆r<br />
0 1 2 m-1 m m+1 M-1 M<br />
Each nodal equation was rearranged with all dye concentrations at time step j+1 on the left<br />
hand side and j time steps on the right hand side and making substitutions for beta and lambda.<br />
This resulted in the following equations for the center (equation 4-18), interior (equation 4-19), and<br />
exterior (equation 4-20) nodes.<br />
<br />
Node = 0, center where
1+2
program. The concentration gradient is in units <strong>of</strong> grams per liter and was governed by the diffusion<br />
<strong>of</strong> dye through the yarn through coefficient Dy.<br />
4.3.1.b The Nip Process<br />
Before defining the parameters and equations in the oxidation process two more<br />
parameters must be defined. The wash reduction is defined as the percent <strong>of</strong> unfixed oxidized dye<br />
and other chemicals removed from the fiber surface resulting from previous dip <strong>of</strong> indigo. These<br />
remaining chemicals were called the Oxidized Boundary Layer or OBL. It was calculated as shown in<br />
equation 4-24 by subtracting the fixed indigo on weight <strong>of</strong> yarn from the unfixed chemicals after the<br />
previous dip, converting the percent chemical on weight <strong>of</strong> yarn into grams <strong>of</strong> chemical, and<br />
multiplying by the wash reduction coefficient. The wash reduction value will be zero during the first<br />
dip <strong>of</strong> indigo since no previous dye exists.
oxygen was calculated so the next time step calculation would impact air stream concentration<br />
within the yarn structure. Next the quantity <strong>of</strong> reduced boundary layer components RBLgm (grams)<br />
and RBL (g/l) were reduced by indigo diffused into the cotton fiber and the dye in the boundary<br />
layer oxidized by oxygen. The diffusion <strong>of</strong> dye into the fiber utilized the same equations as<br />
previously discussed during the dip process. This property allowed fiber diffusion which impacts<br />
Integ shade and total <strong>%IOWY</strong> to continue beyond the dip process. The oxidized boundary layer was<br />
increased by the addition <strong>of</strong> oxidized dye from the reduced boundary layer. Of course oxidation at<br />
each node was complete after RBLgm equals zero and all dye in the <strong>%IOWY</strong> was oxidized. Equation<br />
4-30 summarizes the expressions used to track the converting <strong>of</strong> reduce dye into oxidized state.<br />
∆
directly measure only sodium dithionite concentration. As a result, only one component <strong>of</strong> item #1<br />
is a direct measurement <strong>of</strong> concentration in the dye bath. Additionally, the actual wet pick-up <strong>of</strong><br />
chemicals during the dip and nip process was an unknown property which was approximated by the<br />
wet pick-up coefficient. The fixation rate <strong>of</strong> indigo dye was unknown and the main property under<br />
investigation. Due to these shortcomings an approximation was developed. The amount <strong>of</strong> residual<br />
chemicals on weight <strong>of</strong> yarn will be a direct function <strong>of</strong> the amount <strong>of</strong> indigo on weight <strong>of</strong> yarn. This<br />
functional relationship was developed by analyzing the indigo reduction/oxidation process.<br />
The oxidation <strong>of</strong> reduced indigo, I R , produces the following chemical reactions.
total indigo on weight <strong>of</strong> yarn from yarn diffusion, fiber diffusion, and wet pick-up reduction effect<br />
during the nip process plus residual oxidized indigo dye in the oxidized boundary layer . This<br />
expression is summarized in equation 4-33.<br />
%
4.3.1.d Optimization <strong>of</strong> Wet Pick-up and Wash Reduction<br />
Once the fiber diffusion, yarn diffusion, and wet pick-up coefficients were determined for<br />
the individual yarn counts after each dip, nip, and oxidation process; the slope <strong>of</strong> the wet pick-up as<br />
it changed across each dip <strong>of</strong> indigo was calculated. The wash reduction value, which was constant<br />
across all dips, was adjusted until the slope <strong>of</strong> wet pick-up equaled zero. This resulted in a constant<br />
wash reduction and wet pick-up coefficient value for each yarn count across the interior indigo dye<br />
boxes.<br />
4.3.1.e Optimization <strong>of</strong> Oxidation Rate<br />
The oxidation rate was determined for all yarn counts at each indigo dye box and individual<br />
dye range set-up. This was carried out by following the original dye coefficient assumptions.<br />
Specifically, constant fiber diffusion, yarn diffusion, and wet pick-up regardless <strong>of</strong> yarn count. The<br />
standard deviation for the fiber diffusion, yarn diffusion, and wet pick-up was calculated for a<br />
specific indigo dip across the yarn counts. The goal was to determine the oxidation rate that<br />
minimized the standard deviation for these coefficients. To facilitate the optimization the variation<br />
in standard deviation as the oxidation rate changes was incorporated.<br />
To establish an algorithm to goal seek the optimum oxidation rate, the behavior <strong>of</strong> oxidation<br />
was investigated. All <strong>of</strong> the following calculations and relationships pertain to a 36.5 m/min, 2.5 g/l<br />
dye bath concentration, 11.7 pH, 800 mV reduction potential, and 8.6 meter dwell length dye range<br />
set-up and one indigo dip but the same relationships exists under all set-up conditions. The<br />
optimum fiber diffusion coefficient was calculated for each yarn count at a given oxidation rate. The<br />
results are illustrated in figure 4-32. At extremely fast oxidation rates the variation in fiber diffusion<br />
coefficient across the yarn counts was great. As the oxidation rate decreased, the variation in fiber<br />
diffusion decreased. Also note the overall fiber diffusion coefficient value decreased. At low<br />
oxidation rates the fiber diffusion coefficients became approximately equal and independent <strong>of</strong> yarn<br />
count. There are two properties <strong>of</strong> oxidation rate worth noting. At extremely high oxidation rates<br />
the reduced indigo on the yarn after the nip process was flash oxidized. This means the indigo was<br />
instantaneously oxidized. While at extremely low oxidation rates, the indigo was never oxidized in<br />
the time allotted. Recall oxidation time was determined by oxidation thread-up length and dye<br />
214
angee<br />
speed. Both h <strong>of</strong> these casses<br />
do not acttually<br />
exist in real world. FFor<br />
this example<br />
the real<br />
oxidattion<br />
rate occu urred betweeen<br />
1.0 e-3 andd<br />
1.0 oxidatioon<br />
rate units.<br />
Figure 4-32: Fiber diffu usion coefficientts<br />
for each yarnn<br />
count as the oxxidation<br />
rate changes.<br />
The same graph was creeated<br />
for yarn<br />
diffusion cooefficients<br />
as a function <strong>of</strong>f<br />
oxidation rate<br />
in<br />
figuree<br />
4-33. Here e the yarn difffusion<br />
coefficcients<br />
have a different behhavior<br />
as the ooxidation<br />
ratee<br />
was<br />
decreeased.<br />
As the oxidation ratte<br />
was decreaased<br />
from higgh<br />
values, thee<br />
variation in yarn diffusionn<br />
across<br />
the yarn counts<br />
became greater. At 11.0<br />
e-2 oxidattion<br />
rate units<br />
the variatioon<br />
in yarn difffusion<br />
was aat<br />
a maximum m. Further redductions<br />
in oxxidation<br />
rate caused the vaariation<br />
betwween<br />
yarn couunts<br />
to deccrease<br />
and th he magnitudee<br />
<strong>of</strong> the yarn ddiffusion<br />
coeffficient<br />
shifted<br />
lower.<br />
215
Figure 4-33: Yarn diffu usion coefficientts<br />
for each yarn count as a function<br />
<strong>of</strong> oxidation<br />
rate.<br />
The variati ion in calculated<br />
wet pick-up<br />
values as a function <strong>of</strong>f<br />
oxidation ratte<br />
was<br />
investtigated.<br />
As ill lustrated in fiigure<br />
4-34, ass<br />
the oxidatioon<br />
rate was deecreased<br />
fromm<br />
high valuess<br />
the<br />
variattion<br />
between yarn counts increased. AAt<br />
approximattely<br />
1.0 e-2 oxxidation<br />
rate units the meaan<br />
value <strong>of</strong> wet pick-u up shifts higher<br />
regardlesss<br />
<strong>of</strong> yarn counnt.<br />
The shifts in yarn diffussion<br />
and wet pick-<br />
up at low oxidation n rates were caused by lacck<br />
<strong>of</strong> indigo oxidation<br />
during<br />
the allotteed<br />
oxidation ttime.<br />
Again this phenom menon doesn't<br />
occur in thee<br />
real world.<br />
216
Figure 4-34: Wet pick- -up variation witthin<br />
yarn countss<br />
as a function o<strong>of</strong><br />
oxidation ratee.<br />
By incorpo orating these properties toogether<br />
the optimum<br />
oxidation<br />
rate thaat<br />
minimizes the<br />
error in fiber diffus sion, yarn difffusion,<br />
and wwet<br />
pick-up was<br />
determineed.<br />
First, the standard<br />
deviattion<br />
for fiber diffusion, yarrn<br />
diffusion, aand<br />
wet pick-up<br />
at each oxxidation<br />
rate was calculateed.<br />
Next, these standa ard deviationss<br />
were normaalized<br />
by the average standdard<br />
deviatioon<br />
for each<br />
coeffiicient.<br />
Then, the normalized<br />
standard ddeviations<br />
weere<br />
combinedd<br />
to produce a single errorr<br />
measurement<br />
relationship.<br />
Whhen<br />
this valuee<br />
reached a mminimum<br />
the optimum oxiddation<br />
rate had<br />
been determined. The normalized<br />
standard deviations foor<br />
each dye coefficient<br />
andd<br />
the combined<br />
relatioonship<br />
are displayed<br />
in figgure<br />
4-35. Staarting<br />
with ann<br />
extremely loow<br />
oxidation rate the<br />
combbined<br />
normalized<br />
standard deviations wwere<br />
high. As the oxidationn<br />
rate was inccreased<br />
the<br />
combbined<br />
normalized<br />
standard deviations began<br />
to decreease.<br />
In this particular exaample,<br />
the<br />
optimmum<br />
oxidation n rate was 0.0064<br />
oxidationn<br />
rate units. FFurther<br />
increaases<br />
in oxidattion<br />
rate caussed<br />
the coombined<br />
norm malized standdard<br />
deviation<br />
to increase slightly in value<br />
with furthher<br />
increases<br />
resultting<br />
in constant<br />
combined normalized sstandard<br />
deviiations<br />
due too<br />
instantaneoously<br />
fast indigo<br />
217
oxidattion.<br />
Due to the nature <strong>of</strong>f<br />
the oxidatioon<br />
pr<strong>of</strong>ile all ooxidation<br />
ratee<br />
optimizationn<br />
began at the<br />
low<br />
end o<strong>of</strong><br />
the spectrum<br />
with increaasing<br />
oxidatioon<br />
rate until tthe<br />
minimumm<br />
combined normalized<br />
standard<br />
deviation n was reachedd.<br />
Figure 4-35: Standard deviations as a function <strong>of</strong> oxiddation<br />
rate.<br />
4.3.2 Algorithm to Calculate thee<br />
Dye <strong>Coefficients</strong><br />
The operat tor would inpput<br />
the speciffic<br />
dye range set-up condittions<br />
such as speed, indigoo<br />
dye<br />
bath cconcentration<br />
n, etc and thee<br />
final target vvalues<br />
for %CCOWY,<br />
%IOWWY,<br />
and Integ sshade<br />
by yarnn<br />
countt<br />
and dip. Firs st the fiber diiffusion<br />
coeffficient,<br />
yarn ddiffusion<br />
coeffficient,<br />
and wwet<br />
pick-up was<br />
calcullated<br />
based on o the yarn coount<br />
and assuumed<br />
initial wwash<br />
reductioon,<br />
wet pick-uup,<br />
and oxidattion<br />
rate. Then the wash<br />
reduction coefficient annd<br />
wet pick-uup<br />
were optimmized<br />
to mainntain<br />
constant<br />
values<br />
across all dy ye dips and yaarn<br />
counts. TThen<br />
the oxiddation<br />
rate waas<br />
adjusted until<br />
the minimmum<br />
combbined<br />
normalized<br />
standard deviation occcurred<br />
at eacch<br />
dip. After all calculationns<br />
and<br />
218
convergence were satisfied, the program would output the average fiber diffusion coefficient,<br />
average yarn diffusion coefficient, and average oxidation rate by indigo dip and the overall wash<br />
reduction and wet pick-up coefficient values. The actual c++ computer program is provided in<br />
appendix section A-4-3a.<br />
4.3.3 Spatial and Time Step Optimization<br />
Before the program can be used to determine the indigo dyeing coefficient from the<br />
experimental data, the stability <strong>of</strong> the program was ensured. With the introduction <strong>of</strong> time<br />
dependent components in the dye bath and air stream calculation, the model was no longer explicit<br />
in nature. Additionally, the nodal spacing would influence the dye coefficient values. An iterative<br />
process was utilized to determine the optimum nodal mesh size and time step to ensure stability <strong>of</strong><br />
the dye and air stream and convergence for the dye coefficients. The initial value was 5 nodes and 1<br />
second time step. These two values were increased until both stability and convergence was<br />
guarantee across both the lowest and highest yarn counts and several dye range set-up conditions.<br />
The final optimum values were 21 nodes and 0.01 second time step.<br />
4.3.4 Determination <strong>of</strong> Indigo Dyeing Coefficient Models<br />
After the computer program was utilized to calculate the optimum fiber diffusion<br />
coefficient, yarn diffusion coefficient, wash reduction, wet pick-up, and oxidation rate for each yarn<br />
count processed through each dye range set-up; each dye coefficient was pr<strong>of</strong>iled to determine<br />
relationship to the dye range set-up values. Since convergence <strong>of</strong> the observational study was<br />
already established during the empirical model phase, all available data from the two separate<br />
indigo dye ranges were utilized in the analysis. When evaluating each dye coefficient all first and<br />
second order dye range step-up parameters and the respective interactions were considered. The<br />
following models for fiber diffusion coefficient, yarn diffusion coefficient, wash reduction, wet pick-<br />
up, and oxidation rate were based on only the dye range set-up parameters that were statistically<br />
significant.<br />
219
4.3.4.a <strong>Function</strong>al Relationship <strong>of</strong> Effective Fiber Diffusion Coefficient<br />
A statistical analysis <strong>of</strong> all dye range set-up parameters and the effect on effective fiber<br />
diffusion coefficient was conducted to develop the functional relationship. It was determined the<br />
dye bath concentration and pH at each dip was statistically significant. This was not surprising and<br />
in fact desirable. Likewise, no significant effect was contributed by dye range speed, dwell time,<br />
dwell length, or yarn count. As shown in table 4-11, the adjusted R 2 value was 0.68 for the<br />
relationship between individual fiber diffusion coefficients and the calculated values from the<br />
model. While this is not a perfect fit the F ratio <strong>of</strong> 100.5 and P value much less than 0.0001 does<br />
support a statistically significant correlation. The influence and significance <strong>of</strong> dye bath<br />
concentration and pH at each dip was re-enforced by evaluating the parameter estimates and effect<br />
tests <strong>of</strong> each. Table 4-11 shows the P value for the dip number, dye bath concentration and pH was<br />
much less than 0.0001.<br />
220
Table 4-11: ANOVA analysis results for fiber diffusion coefficient.<br />
Graphically, the relationship between calculated fiber diffusion and the individual points is<br />
shown in figure 4-36. The wide variation at higher values contributed to the relatively poor<br />
correlation. However, a large cluster <strong>of</strong> relatively similar values existed at lower values. This<br />
grouping caused the correlation to improve.<br />
221
Actual Fiber Diffusion<br />
Figure 4-36: Comparison <strong>of</strong> model predicted and actual fiber diffusion coefficient.<br />
The statistical analysis also produced the working equation for fiber diffusion coefficient.<br />
Equation 4-34 allows the fiber diffusion coefficient to be calculated based on the dye bath<br />
concentration, pH, and specific dip.<br />
1: 0.0<br />
⎡<br />
2: −0.3903<br />
⎤<br />
⎢<br />
⎥<br />
⎢<br />
3: 0.2868<br />
⎥
the dye bath pH was increased. This relationship supports the concept <strong>of</strong> increased dye affinity at<br />
higher pH values. The effect <strong>of</strong> increased dye bath concentration was not completely unexpected as<br />
many substances diffusion rate is concentration dependent. Under these conditions, faster diffusion<br />
occurred at higher dye bath concentrations.<br />
The fiber diffusion coefficient was effectively constant for dip one and two. Clearly, as the<br />
yarns process through increasing numbers <strong>of</strong> dye dips, the fiber diffusion coefficient increased.<br />
After dip two, the effective fiber diffusion coefficient increased from greater affinity <strong>of</strong> dye for the<br />
fiber surface or actual diffusion into the fiber interior. This effect was also seen in the general trend<br />
analysis and the empirical model discussion sections. This effect results in the yarn not only getting<br />
darker due to more indigo on the outside surface with increasing dips but in fact gets darker than<br />
simply multiplying the first dip times 2, 3, or say 6. Etters has already discussed increasing fiber<br />
diffusion as the number <strong>of</strong> dips increased could be related to ionic charging <strong>of</strong> the cotton fiber by<br />
excess sodium hydroxide thus increasing the affinity. The ionization after each dip causes the dye to<br />
be more attracted to the fiber in the subsequent dip.<br />
Predicted Fiber Diffusion<br />
2.209e-9<br />
[1.89e-9, 2.58e-9]<br />
Effective Fiber Diffusion Coefficient Prediction Pr<strong>of</strong>ile for Dye Range Set-up<br />
1<br />
2<br />
3<br />
4<br />
5<br />
6<br />
7<br />
Figure 4-37: Effective fiber diffusion functional relationship to dye range set-up conditions.<br />
1<br />
2<br />
(g/l)<br />
3<br />
11<br />
12<br />
223
4.3.4.b <strong>Function</strong>al Relationship <strong>of</strong> Yarn Diffusion Coefficient<br />
The yarn diffusion coefficient was evaluated against all dye range set-up values. The dye<br />
bath concentration, pH, and dwell time at each dip was determined to have the greatest statistical<br />
effect. Once again this was not surprising. Concentration and pH effect on diffusional coefficients<br />
was expected. As shown in table 4-12 the adjusted R 2 value was 0.72 for the relationship between<br />
individual yarn diffusion coefficients and the calculated values from the model. While this was not a<br />
perfect fit the F ratio <strong>of</strong> 106.6 does support a statistically significant correlation. The influence and<br />
significance <strong>of</strong> dye bath concentration, pH, and dwell time at each dip was re-enforced by evaluating<br />
the parameter estimates and effect tests <strong>of</strong> each. Table 4-12 shows the P value for the dip number,<br />
dye bath concentration, pH, and dwell time was much less than 0.0001. A strong correlation<br />
coefficient, reasonable F ratio for the model, and extremely low P values indicated the model was<br />
more likely to cause the variation in yarn diffusion coefficient values than happenstance.<br />
224
Table 4-12: ANOVA analysis results for yarn diffusion coefficient.<br />
Using the parameter estimates from table 4-12, the functional relationship between yarn<br />
diffusion coefficient and dye range set-up parameters was determined. The specific mathematical<br />
equation is given as equation 4-35 and the distribution <strong>of</strong> actual versus calculated yarn diffusion<br />
coefficients is shown in figure 4-39. Like the fiber diffusion coefficient distribution, the separation<br />
between the model and actual values becomes greater at higher values. Similarly, the large cluster<br />
<strong>of</strong> values at lower actual yarn diffusion coefficients influenced the overall model correlation.<br />
225
Comparison <strong>of</strong> Actual Yarn Diffusion by Dye Theory Model<br />
0.000011<br />
0.00001<br />
0.000009<br />
0.000008<br />
0.000007<br />
0.000006<br />
0.000005<br />
0.000004<br />
0.000003<br />
0.000002<br />
0.000001<br />
0<br />
0 0.000001 0.000003 0.000005 0.000007 0.000009 0.000011<br />
Predicted Yarn Diffusion Coefficient<br />
Actual Yarn Diffusion<br />
Figure 4-38: Comparison <strong>of</strong> model predicted and actual yarn diffusion coefficient.<br />
1: 0.0<br />
⎡<br />
2: −0.0516<br />
⎤<br />
⎢<br />
⎥<br />
⎢<br />
3: −0.4549<br />
⎥
ecomes understandable. As the dye bath concentration increases, the amount <strong>of</strong> residual<br />
chemicals from the previous dip increases. Thus the dye stream path was further hindered resulting<br />
in a slower diffusion process at greater numbers <strong>of</strong> dip.<br />
Effective Yarn Diffusion Coefficient Prediction Pr<strong>of</strong>ile for Dye Range Set-up Conditions<br />
Predicted Yarn Diffusion<br />
3.172e-6<br />
[2.85e-6, 3.53e-6]<br />
1<br />
3<br />
5<br />
Figure 4-39: Effective yarn diffusion functional relationship to dye range set-up conditions.<br />
The effect <strong>of</strong> pH on yarn diffusion coefficient is also shown in figure 4-39. As the pH was<br />
increased the diffusion coefficient also increased. A higher diffusion value means a greater dye bath<br />
concentration was penetrating into the structure <strong>of</strong> the yarn. This resulted in more dye being<br />
available for fiber transfer in the yarn interior. This coupled with a higher fiber diffusion coefficient<br />
at higher pH values as demonstrated in section 4.3.4.a produced a more penetrated (or less ring<br />
dyed) yarn cross section. This supports the concept <strong>of</strong> ring dyed yarns as a function <strong>of</strong> pH previously<br />
discussed by numerous authors and summarized in chapter 1.<br />
7<br />
1<br />
2<br />
(g/l)<br />
The effect <strong>of</strong> dwell time on yarn diffusion coefficient must be discussed. As the dwell time<br />
was increased, the yarn diffusion coefficient actually decreased. At first glance this seemed counter-<br />
intuitive. However, one must realize to increase the dwell time on a fixed dwell length dye range,<br />
the speed must be reduced. As the speed was reduced the turbulent forces acting to push the dye<br />
3<br />
11<br />
12<br />
14<br />
16<br />
18<br />
20<br />
22<br />
227
ath into the yarn structure were reduced. Whether this was an actual phenomenon or the result <strong>of</strong><br />
assuming constant dye bath concentration at the outside node surface, it was reasonable for this<br />
effect to be present.<br />
4.3.4.c <strong>Function</strong>al Relationship <strong>of</strong> Wet Pick-up<br />
In contrast to the fiber and yarn diffusion coefficient analysis, the wet pick-up relationship<br />
to individual dye range set-up parameters was not very strong. This was primarily due to the fact<br />
that wet pick-up was dye range specific and highly dependent on chemical exchange. The calculated<br />
wet pick-up numbers were indirectly measurements <strong>of</strong> the individual dye range under certain<br />
dyeing conditions. Also, it was influenced by the diffusion <strong>of</strong> dye into the yarn and fiber structure<br />
since this was a wet on wet application. Technically speaking the pick-up would be 0% if the yarns<br />
were squeezed at the same pressure by the entrance and exit nip running through water only dye<br />
bath. Any pick-up on the yarn in actual dyeing process was the result <strong>of</strong> dye and other chemicals<br />
replacing the water in the yarn. With this in mind, the nip pressure, dye bath concentration, and<br />
yarn diffusion coefficient were expected to have the greatest impact on wet pick-up. After detailed<br />
statistical analysis these dye range set-up parameters were the only significant influences. The best<br />
possible model resulted in an R 2 correlation coefficient <strong>of</strong> 0.26 and F ratio <strong>of</strong> 43.0 as shown in table<br />
4-13. While this certainly wasn't a great model fit to the data, the significance <strong>of</strong> dye bath<br />
concentration and yarn diffusion coefficients were deemed statistically significant due to P values<br />
much less than 0.0001 and 0.0061 for nip pressure as shown in the effect test section <strong>of</strong> table 4-13.<br />
The lack <strong>of</strong> correlation was certainly due the error or variation surrounding each wet pick-up value.<br />
228
Table 4-13: ANOVA analysis for wet pick-up coefficient.<br />
The poor correlation was further demonstrated by plotting the actual versus calculated wet<br />
pick-up values as shown in figure 4-40. While a general trend following the 1 to 1 center line was<br />
apparent, much variation occurred <strong>of</strong>f line. The overall average wet pick-up was 4.1% and no<br />
significant difference was determined between the two dye ranges in the investigation. Using the<br />
parameter estimates from table 4-13, the analysis produced the following mathematical expression<br />
for the wet pick-up coefficient as a function <strong>of</strong> dye range set-up parameters, equation 4-36. This<br />
researcher proposed the unexplained variation in wet pick-up could be due to errors in the yarn dye<br />
measurement properties such as %COWY. These errors would certainly influence the wet pick-up<br />
values as well as other coefficients. Hopefully, the error in calculated coefficients would later <strong>of</strong>f set<br />
each other and the final model would still produce reliable %COWY, <strong>%IOWY</strong>, and Integ values<br />
compared to measured performance.<br />
229
Actual<br />
Wet Pick-up<br />
Figure 4-40: Comparison <strong>of</strong> model predicted and actual wet pick-up coefficient.
Wet pick-up<br />
0.031492<br />
±0.002685<br />
Figure 4-41: Dye theory model wet pick-up functional relationship to dye range set-up conditions.<br />
4.3.4.d <strong>Function</strong>al Relationship <strong>of</strong> Wash Reduction<br />
The wash reduction or amount <strong>of</strong> chemical on weight <strong>of</strong> yarn from a previous dip removed<br />
during a subsequent dip was determined to be related to the dye bath concentration, speed, dwell<br />
time, and dye bath reduction potential. The correlation between actual and calculated was 0.45<br />
with an F ratio <strong>of</strong> 60.0 as displayed in table 4-14. While the correlation wasn't great it was deemed<br />
significant due to a P value much less than 0.0001. The overall average wash reduction value was<br />
13.1%. Evaluation <strong>of</strong> the individual parameter effects is shown in table 4-14. Speed had a P value <strong>of</strong><br />
0.0015 while all other parameters were much less than 0.0001. This indicated all were statistically<br />
significant.<br />
Wet Pick-up Coefficient Prediction Pr<strong>of</strong>ile for Dye Range Set-up Conditions<br />
40<br />
50<br />
60<br />
70<br />
1<br />
2<br />
(g/l)<br />
3<br />
0<br />
0.000001<br />
0.000002<br />
0.000003<br />
0.000004<br />
0.000005<br />
0.000006<br />
0.000007<br />
0.000008<br />
231
Table 4-14: ANOVA analysis results for wash reduction coefficient<br />
The plot <strong>of</strong> actual versus calculated wash reduction coefficient is shown in figure 4-42. The<br />
values vary in order <strong>of</strong> magnitude from 0.01 to 0.3 with a mean value <strong>of</strong> 0.13. The overall trend<br />
followed a 1 to 1 relationship. However, there are obvious issues with the correlation. When the<br />
model predicted the wash reduction value to be 0.15, the actual value varied from 0.02 to 0.26. As<br />
with wet pick-up this variation could be explained by error in measurements <strong>of</strong> yarn properties<br />
which resulted in other dye coefficients skewing to match the results. It is hoped the averages will<br />
balance out in the final model. The parameter estimates from table 4-14 produced the following<br />
mathematical expression for the wash reduction coefficient as a function <strong>of</strong> dye range set-up<br />
parameters, equation 4-37.<br />
232
Actual Wash Reduction<br />
Figure 4-42: Comparison <strong>of</strong> model predicted and actual wash reduction.
concentration effect on wash reduction maybe related to the definition <strong>of</strong> %COWY as previously<br />
discussed.<br />
Wash %<br />
0.110581<br />
±0.006796<br />
Figure 4-43: Dye theory model wash reduction functional relationship to dye range set-up conditions.<br />
4.3.4.e <strong>Function</strong>al Relationship <strong>of</strong> Oxidation Rate<br />
The last dye theory coefficient evaluated was oxidation rate. It was determined the speed,<br />
oxidation time, and reduction potential at each dip were statistically significant. The other dye<br />
parameters did not have a significant impact. The best correlation established was 0.51 with an F<br />
ratio <strong>of</strong> 45.3 and P value much less than 0.0001 as shown in table 4-15. The parameter estimates<br />
and effect tests are also displayed in table 4-15. While only dip had a P value much less than 0.0001,<br />
the other parameters were statistically significant since P values were below 0.0272. While the<br />
model fit did not possess an extremely strong correlation to the data, it was deemed the best model<br />
possible.<br />
Wash Reduction Coefficient Prediction Pr<strong>of</strong>ile for Dye Range Set-up Conditions<br />
27<br />
29<br />
31<br />
33<br />
35<br />
37<br />
14<br />
15<br />
16<br />
17<br />
18<br />
19<br />
20<br />
21<br />
800<br />
900<br />
1<br />
2<br />
(g/l)<br />
3<br />
234
Table 4-15: ANOVA analysis results for oxidation rate coefficient.<br />
The plot <strong>of</strong> actual versus calculated oxidation rate is presented in figure 4-44. The values<br />
ranged from 0.01 to 0.2 grams <strong>of</strong> reduced indigo that were oxidized per gram <strong>of</strong> oxygen per second.<br />
Of course this wasn't necessarily the true or absolute oxidation rate; it was relative to other dye<br />
range set-up conditions in this observational study under the current dye theory model. As the<br />
actual oxidation rate increased in most cases the predicted values did not increase as rapidly.<br />
However, the correlation at lower oxidation rates appears to be quite well. The analysis produced<br />
the following mathematical expression for the oxidation rate coefficient as a function <strong>of</strong> dye range<br />
set-up parameters, equation 4-38.<br />
235
Actual Oxidization Rate<br />
Figure 4-44: Comparison <strong>of</strong> model predicted and actual oxidation rate.<br />
1: 0.0<br />
⎡<br />
2: −0.4686<br />
⎤<br />
⎢<br />
⎥<br />
⎢<br />
3: −0.6932<br />
⎥
course makes sense. The interestingly part was that reduction potential wasn't used in any dye<br />
theory model calculation and yet the effect surfaced here.<br />
Predicted Oxidization Rate<br />
0.086658<br />
[0.07606, 0.09873]<br />
Oxidation Rate Coefficient Prediction Pr<strong>of</strong>ile for Dye Range Set-up Conditions<br />
1<br />
3<br />
5<br />
Figure 4-45: Dye theory model oxidation rate functional relationship to dye range set-up conditions.<br />
4.3.5 Algorithm to Calculate the %COWY, <strong>%IOWY</strong>, and Integ Shade<br />
The final program enters in the appropriate dye range set-up conditions: yarn count, dip<br />
number, speed, dyeing dwell time, pH, dye bath concentration, nip pressure, and oxidation dwell<br />
time. Then the corresponding values for indigo dyeing coefficients: fiber diffusion, yarn diffusion,<br />
wet pick-up, wash reduction, and oxidation rate were calculated. The following logic was used to<br />
calculate the <strong>%IOWY</strong>, %COWY, and Integ shade value. The actual computer program is referenced<br />
in appendix section A-4-3b.<br />
7<br />
27<br />
29<br />
31<br />
33<br />
35<br />
37<br />
60<br />
Enter dye range parameters<br />
Calculate dyeing coefficients and initialize all parameters<br />
Start time loop for the dip process equal to total dwell time<br />
Calculations:<br />
Dye bath concentration within the yarn<br />
Diffusion <strong>of</strong> dye into the fiber<br />
70<br />
700<br />
800<br />
900<br />
237
Close dip time loop<br />
Adjust boundary layers due to wet pick-up and removal <strong>of</strong> previous oxidized dye<br />
Start oxidation time loop equal to total oxidation time<br />
Calculations:<br />
Oxygen concentration within the yarn<br />
Adjust reduced indigo available in yarn<br />
1. Dye in boundary layer by amount <strong>of</strong> dye oxidized<br />
2. Dye diffused into fiber<br />
3. If no reduced boundary exists start to oxidize dye in the fiber<br />
Increase oxidized boundary layer<br />
Close oxidation time loop<br />
Calculate total <strong>%IOWY</strong> by summing all <strong>%IOWY</strong> at each node<br />
Calculate total %COWY by adding total <strong>%IOWY</strong> and summing oxidized boundary layer at each node<br />
Convert <strong>%IOWY</strong> at the surface <strong>of</strong> the yarn into Integ shade value<br />
Repeat for each additional dip<br />
238
5 Empirical and Dye theory model simulation and validation<br />
The final step in traditional experimental design is model simulation and validation. Under<br />
this observational study, simulation was conducted by comparing calculated and measured %COWY,<br />
<strong>%IOWY</strong>, and Integ shade values, from sources <strong>of</strong> data independent from the respective data sets<br />
used to create the models. First the models were compared to a third dye range located in Canada.<br />
Again, none <strong>of</strong> the Canadian data was used in the creation <strong>of</strong> the empirical or dye theory models.<br />
Second, the empirical and dye theory models were compared to actual production yarns. This will<br />
validate the effectiveness <strong>of</strong> model results to actually predict production dye properties.<br />
5.1 Simulation <strong>of</strong> Empirical and Dye Theory models on Third Independent Dye Range<br />
Yarn skeins were processed on a third indigo long chain rope dye range following the same<br />
methods and procedures previously discussed in Chapter 3. Due to curtailment <strong>of</strong> this production<br />
facility all indigo shades were transferred to US operations so customers would have a seamless<br />
transition. To make the transition as smooth as possible, US technicians with US laboratory<br />
equipment went to the Canadian operation. By having the same person and the same equipment<br />
perform indigo dye box testing, conditions such as grams <strong>of</strong> indigo per liter and reduction potential,<br />
as much testing error was removed as possible. This effort resulted in five different dye range set-<br />
ups with yarn skeins to be compared to empirical and dye theory models. The specific dye range<br />
conditions for each dye range set-up are listed in table 5-1. The complete set <strong>of</strong> observational data<br />
is listed in appendix section A-5-1 for detailed review.<br />
Table 5-1: Canadian dye range set-up conditions used for simulation<br />
Reference # <strong>of</strong> Speed Dwell Oxidation Dye Bath Dye Dye Dye NaOH<br />
Shade # Dips (m/min) Time (sec) Time (sec) (g/l) pH mV (g/l)<br />
443 1 to 6 29 20.1 73.6 1.26 12.2 813 2.58<br />
418 1 to 6 32 18.2 66.7 1.66 11.8 814 3.29<br />
402 1 to 6 28 20.8 76.3 1.99 12.2 841 3.53<br />
471 1 to 6 32 18.2 66.7 2.09 12.1 838 3.42<br />
401 1 to 6 28 20.8 76.3 2.21 12.1 820 3.72<br />
239
5.1.1 Actual Versus Predicted %COWY<br />
The individual dye range parameters were used to calculate %COWY from the empirical dye<br />
model. The empirical model performed beautifully with a great correlation <strong>of</strong> R 2 = 0.91 and deemed<br />
highly significant with F ratio <strong>of</strong> 651 as shown in table 5-2. The predicted versus actual graph, figure<br />
5-1, does however show a slight issue. The slope <strong>of</strong> curve fit wasn’t 1.0. With a slope <strong>of</strong> 1.014, the<br />
model over predicts the true %COWY by 1.4%. This isn’t a huge difference but it was real.<br />
%COWY Actual<br />
Figure 5-1: Empirical model predicted %COWY compared to actual measured values.<br />
240
Table 5-2: ANOVA analysis results <strong>of</strong> empirical model to actual measured %COWY<br />
Following the same analysis method the dye theory model %COWY was compared to actual<br />
measured values. The results weren't as well correlated as the empirical model. The resulting R 2<br />
correlation coefficient is 0.74 with an F ratio <strong>of</strong> 179 as shown in table 5-3. Furthermore, the slope<br />
was 0.76 with an intercept <strong>of</strong> 0.72%. This indicates the dye theory model over predicts the true<br />
%COWY at high values. This is graphically represented in figure 5-2 where a 10% predicted %COWY<br />
corresponds to an 8% actual value.<br />
241
%COWY Actual<br />
Figure 5-2: Dye theory model predicted %COWY compared to actual measured values.<br />
Table 5-3: ANOVA analysis results <strong>of</strong> dye theory model to actual measured %COWY<br />
The empirical model obviously out performs the dye theory model in predicting the<br />
%COWY. Not only does the empirical model predict the true value better but the error associated<br />
with the prediction was about half that <strong>of</strong> the dye theory model. The flaw in the dye theory model<br />
242
was traced back to the basic assumptions used to generate the solution algorithm. By assuming<br />
total chemical on weight <strong>of</strong> yarn was directly related to amount <strong>of</strong> indigo on weight yarn, the dye<br />
theory model doesn't accurately predict the true %COWY. This wasn't a good start for the dye<br />
theory model but there are many more comparisons to evaluate.<br />
5.1.2 Actual Versus Predicted <strong>%IOWY</strong><br />
At the end <strong>of</strong> the day the most important property any model should predict well is <strong>%IOWY</strong><br />
and the resulting shade. The comparison <strong>of</strong> calculated <strong>%IOWY</strong> to actual measured <strong>%IOWY</strong> is<br />
presented in figure 5-3 and table 5-4 for the empirical model. The empirical model matched up with<br />
the actual values very well as indicated by the R 2 <strong>of</strong> 0.94. Furthermore the model results were<br />
deemed statistically significant following the overall model F ratio <strong>of</strong> 1077. However, like %COWY,<br />
the predicted <strong>%IOWY</strong> over estimated the actual <strong>%IOWY</strong> by 1.2% since the slope is 1.012.<br />
<strong>%IOWY</strong> Actual<br />
Figure 5-3: Empirical model predicted <strong>%IOWY</strong> compared to actual measured values.<br />
243
Table 5-4: ANOVA analysis results <strong>of</strong> empirical model to actual measured <strong>%IOWY</strong><br />
After a rough start in predicting %COWY, hopefully the dye model theory will redeem itself<br />
in predicting the <strong>%IOWY</strong>. In fact, the dye theory model actually has a slightly better correlation<br />
coefficient than the empirical model at 0.95 and an F ratio <strong>of</strong> 1112, see table 5-5. Both <strong>of</strong> these<br />
indicate extremely good fit to the measured values. However, the slope <strong>of</strong> the fit is 0.94 which<br />
indicates approximately 6% over estimation. While this was an extremely accurate data fit, the<br />
overall performance wasn't as good as the empirical model but certainly redeemed itself from the<br />
misstep on %COWY predication.<br />
244
<strong>%IOWY</strong> Actual<br />
Figure 5-4: Dye theory model predicted <strong>%IOWY</strong> compared to actual measured values.<br />
Table 5-5: ANOVA analysis results <strong>of</strong> dye theory model to actual measured <strong>%IOWY</strong><br />
245
5.1.3 Actual Versus Predicted Integ Shade Value<br />
The Integ shade values for the empirical model prediction versus actual are presented in<br />
figure 5-5 and table 5-6. The overall correlation coefficient for the fit was R 2 <strong>of</strong> 0.97 with an F ratio<br />
<strong>of</strong> 2108. Both <strong>of</strong> these calculations indicate extremely strong empirical model fit to the actual<br />
measured values. The slope <strong>of</strong> the model fit was 1.084 which means the model underestimates the<br />
actual Integ shade values by 8.4%.<br />
Integ Actual<br />
Figure 5-5: Empirical model predicted Integ compared to actual measured values.<br />
246
Table 5-6: ANOVA analysis results <strong>of</strong> empirical model to actual measured Integ<br />
The dye theory model fit to actual measured Integ shade values is shown in figure 5-6. The<br />
overall model fit correlation coefficient was R 2 <strong>of</strong> 0.97 with an F ratio <strong>of</strong> 1823 as shown in table 5-7.<br />
These values indicate an extremely strong correlation to the actual values and perform as well as<br />
the empirical model. Unfortunately, the slope <strong>of</strong> the fit is 1.097 with an intercept <strong>of</strong> -5.8. These are<br />
the result <strong>of</strong> the dye theory model over predicting the Integ shade at low values and slightly under<br />
predicting at high values. However, the general trend is for comparable Integ prediction<br />
performance to the empirical model.<br />
247
Integ Actual<br />
Figure 5-6: Dye theory model predicted Integ compared to actual measured values.<br />
Table 5-7: ANOVA analysis results <strong>of</strong> dye theory model to actual measured Integ<br />
248
5.1.4 Actual Versus Predicted Penetration Level<br />
By converting the measured Integ shade values into <strong>%IOWY</strong> on the surface <strong>of</strong> the yarn, the<br />
actual penetration level was calculated. Comparison <strong>of</strong> the empirical model predicted penetration<br />
level to actual penetration levels are presented in figure 5-7 and table 5-8. The overall model<br />
correlation coefficient was R 2 <strong>of</strong> 0.63 which isn’t extremely strong but deemed statistically<br />
significant by the F ratio <strong>of</strong> 109 and P-value < 0.0001. The reason for poor correlation is due to the<br />
great variation as evident by the wider range <strong>of</strong> the confidence intervals in figure 5-7. The mean<br />
penetration level is 0.38 units. The slope <strong>of</strong> the data fit is 0.97 which is very close to a 1 to 1 ratio as<br />
visibly evident. However, the intercept is -0.05 penetration units which is 1/8 <strong>of</strong> the mean value.<br />
This causes the empirical model to over predict the level <strong>of</strong> penetration in the yarns. In other words<br />
the empirical model predicts the yarns are less ring dyed or more penetrated than what actually<br />
occurred.<br />
Penetration Level Actual<br />
Figure 5-7: Empirical model predicted penetration level compared to actual measured values.<br />
249
Table 5-8: ANOVA analysis results <strong>of</strong> empirical model to actual measured penetration level<br />
The dye theory model has a similar issue with the predicted penetration level on the<br />
Canadian dye range. Comparison <strong>of</strong> the dye theory model predicted penetration level to actual<br />
values were summarized in the table 5-9 and figure 5-8. The overall model fit was slightly better<br />
than the empirical model as indicated by R 2 correlation coefficient <strong>of</strong> 0.67 and F ratio <strong>of</strong> 129.<br />
However, the slope wasn't close 1 to 1. A slope <strong>of</strong> 0.81 coupled with an intercept <strong>of</strong> 0.04 indicates<br />
the dye theory model also over estimates the level <strong>of</strong> penetration.<br />
250
Dye Theory Model Compared to Canadian Dye Range Actual Penetration Level<br />
Penetration Level Actual<br />
0.6<br />
0.5<br />
0.4<br />
0.3<br />
0.2<br />
0.2 0.25 0.3 0.35 0.4 0.45 0.5 0.55 0.6<br />
Dye Theory Model Penetration Level Predicted<br />
Linear Fit<br />
Figure 5-8: Dye theory model predicted penetration level compared to actual measured values.<br />
Table 5-9: ANOVA analysis results <strong>of</strong> dye theory model to actual measured penetration level<br />
251
5.1.5 Summary <strong>of</strong> Dye Theory Model Compared with Empirical Model<br />
It was expected that the empirical model would provide the best possible prediction <strong>of</strong><br />
%COWY, <strong>%IOWY</strong>, Integ, and penetration level. This was the purpose <strong>of</strong> the calculation, to provide a<br />
baseline for comparing the dye theory model performance. Taken in this context, the dye theory<br />
model preformed reasonably well. While the dye theory model did not perform well in predicting<br />
the %COWY, this property in fact has little to do with actual dyeing <strong>of</strong> yarns with indigo dye as all<br />
residual chemicals are washed <strong>of</strong>f during the final wash stage in the dye range. The most important<br />
properties are <strong>%IOWY</strong>, Integ shade, and the resulting penetration level.<br />
As shown, the dye theory model preformed very well compared to the empirical model in<br />
predicting the <strong>%IOWY</strong> and Integ shade. The difference between the two models is approximately<br />
5% in <strong>%IOWY</strong> prediction while the Integ shade predictions were almost identical. The relatively poor<br />
performance <strong>of</strong> the dye theory model in penetration level prediction compared to empirical model<br />
is disappointing but understandable. The empirical model directly calculates the penetration level<br />
while the dye theory model penetration level was calculated based on predicted <strong>%IOWY</strong> and<br />
converted Integ shade values. The difference between direct and indirect penetration level<br />
calculations can certainly explain the difference in performance <strong>of</strong> the two models. This discrepancy<br />
warrants further investigation.<br />
Indigo build pr<strong>of</strong>iles were constructed for each Canadian dye range set-up for detailed<br />
comparison <strong>of</strong> measured <strong>%IOWY</strong> and Integ shade versus the predicted values from both models.<br />
Figure 5-9 shows the build pr<strong>of</strong>ile <strong>of</strong> Integ shade as a function <strong>of</strong> <strong>%IOWY</strong> for the measured<br />
observational skeins, empirical model, and dye theory model. Each individual point represents the<br />
<strong>%IOWY</strong> and Integ shade after a particular dip <strong>of</strong> indigo. Clearly on this dye range set-up, both<br />
models over predict the amount <strong>of</strong> <strong>%IOWY</strong>. The empirical model predicts the Integ shade values<br />
fairly well while the dye theory model over predicts the Integ.<br />
The really interesting observation is the location <strong>of</strong> the prediction pr<strong>of</strong>iles relative to the<br />
observational skein data. Curves falling below the measured build pr<strong>of</strong>ile indicate more penetration<br />
or less ring dyeing. While any curves above the measured pr<strong>of</strong>ile would indicate less penetration or<br />
more ring dyeing. On this particular dye range set-up, the dye theory model prediction build curve<br />
252
is actuually<br />
closer to o the observaational<br />
curve. This indicatees<br />
the dye theeory<br />
model bbetter<br />
predicts<br />
the<br />
penettration<br />
level than t the emppirical<br />
model.<br />
Figure 5-9: Indigo build d pr<strong>of</strong>ile for Cannadian<br />
dye rangge<br />
set-up on 4433<br />
shade with 29 m/min, 1.26 g/ l dye bath<br />
concenntration<br />
and 12. 2 pH.<br />
By constru ucting similar build pr<strong>of</strong>ile curves for the<br />
other Canadian<br />
dye rangge<br />
set-ups a<br />
similaar<br />
relationship p developed. Figure 5-10 was construccted<br />
from 32 mm/min,<br />
1.66 gg/l,<br />
and 11.8 pH<br />
dye seet-up<br />
and figu ure 5-11 fromm<br />
32 m/min, 22.09<br />
g/l, and 112.1<br />
pH. In fiigure<br />
5-10 booth<br />
models slightly<br />
underr<br />
predict the <strong>%IOWY</strong> % and tthe<br />
resulting IInteg<br />
shade. However, thee<br />
dye theory models buildd<br />
pr<strong>of</strong>ile<br />
better matc ches the obseervational<br />
meeasured<br />
pr<strong>of</strong>ille<br />
even thouggh<br />
both modeels<br />
predict moore<br />
penettionrat<br />
than measured. m Inn<br />
figure 5-11, the empirical<br />
model slighttly<br />
under estimates<br />
the <strong>%IOWY</strong><br />
and Innteg<br />
values while w the dye ttheory<br />
model<br />
slightly overr<br />
estimates thhe<br />
<strong>%IOWY</strong> but<br />
underestimmates<br />
the Innteg.<br />
In this dye d range set-up,<br />
both models<br />
over estimate<br />
penetrration<br />
level byy<br />
basically thee<br />
same degree.<br />
253
Figure 5-10: Indigo build<br />
pr<strong>of</strong>ile for Caanadian<br />
dye rannge<br />
set-up on 4118<br />
shade with 322<br />
m/min, 1.66 gg/l<br />
dye bath<br />
concenntration<br />
and 11. 8 pH.<br />
Figure 5-11: Indigo build<br />
pr<strong>of</strong>ile for Caanadian<br />
dye rannge<br />
set-up on 4771<br />
shade with 322<br />
m/min, 2.09 gg/l<br />
dye bath<br />
concenntration<br />
and 12. 1 pH.<br />
254
The superior performance <strong>of</strong> empirical model prediction <strong>of</strong> penetration level compared to<br />
dye theory model results from the model's ability to calculate the penetration level independent <strong>of</strong><br />
the <strong>%IOWY</strong> and Integ shade values. The dye theory model penetration level is indirectly converted<br />
from the predicted <strong>%IOWY</strong> and Integ values. This ability gives the empirical model a false sense <strong>of</strong><br />
conformity. The analysis <strong>of</strong> empirical model penetration level prediction is repeated but this time<br />
the penetration level is calculated from the predicted <strong>%IOWY</strong> and Integ values. Figure 5-12 and<br />
table 5-10 compares the empirical model predicted indirect penetration level to the actual<br />
penetration level calculated from the measured <strong>%IOWY</strong> and Integ. Now the correlation coefficient<br />
is R 2 <strong>of</strong> 0.59 with an F ratio <strong>of</strong> 92.7. This is actually a slightly inferior fit to the data than the dye<br />
theory model. More importantly, with a slope <strong>of</strong> 0.70 and intercept <strong>of</strong> 0.066 the shape <strong>of</strong> the fit<br />
was worse than the dye theory model. Recall dye theory had a slope <strong>of</strong> 0.80 and intercept <strong>of</strong> 0.04.<br />
Empirical Model Indirect Penetration Level Comparison on Canadian Dye Range<br />
0.6<br />
Penetration Level Actual<br />
0.5<br />
0.4<br />
0.3<br />
0.2<br />
0.2 0.25 0.3 0.35 0.4 0.45 0.5 0.55 0.6 0.65<br />
Empirical Model Indirect<br />
Penetration Level Predicted<br />
Linear Fit<br />
Figure 5-12: Empirical model predicted indirect penetration level compared to actual measured values.<br />
255
Table 5-10: ANOVA analysis results <strong>of</strong> empirical model indirect penetration level to actual measured penetration level<br />
Considering the overall performance <strong>of</strong> the dye theory model compared to empirical model,<br />
an acceptable level <strong>of</strong> performance was obtained. The dye theory model predicts the <strong>%IOWY</strong> and<br />
Integ shade as well as the empirical model. While the empirical model direct penetration level does<br />
perform better than the dye theory model, the calculated indirect penetration level <strong>of</strong> the empirical<br />
model was actually worse than the dye theory model.<br />
5.2 Simulation <strong>of</strong> Empirical and Dye Theory Models to Actual Production Yarn<br />
The real measure <strong>of</strong> any indigo dye model is how well it predicts <strong>%IOWY</strong> and Integ shade<br />
from actual production dyed yarns. To perform this comparison, actual production dyed yarns were<br />
measured for <strong>%IOWY</strong> and Integ shade after processing through production scale indigo chain rope<br />
dye ranges. Six production shades were selected and the particular dye range set-up conditions are<br />
summarized in table 5-11. Five <strong>of</strong> the shades were pure indigo so <strong>%IOWY</strong> and Integ values were<br />
measured. The 1169 shade was a black sulfur top so only the <strong>%IOWY</strong> was applicable. Three samples<br />
were collected from each <strong>of</strong> the two prime USA production ranges to provide variation in dwell<br />
length.<br />
256
Table 5-11: Production Yarn Dye Range Set-up Conditions<br />
Reference # <strong>of</strong> Speed Dwell Oxidation Dye Bath Dye Dye Dwell<br />
Shade # Dips (m/min) Time (sec) Time (sec) (g/l) pH mV Length, m<br />
1134 1 to 7 31.1 16.7 69.5 2.994 11.98 789 8.63<br />
1157 1 to 6 32.9 15.9 65.7 2.497 12.41 847 8.63<br />
1169 1 to 7 31.1 16.7 69.5 2.34 11.6 888 8.63<br />
4223 1 to 2 32.9 20.7 67.5 2.07 12.49 907 11.37<br />
1134 1 to 6 29.3 23.5 75.9 3.497 11.62 897 11.37<br />
1110 1 to 2 32.9 20.7 69.5 0.733 12.23 813 11.37<br />
The resulting <strong>%IOWY</strong> and Integ values are detailed in table 5-12. The actual <strong>%IOWY</strong> and<br />
Integ values correspond to the actual production yarn count were measured. Columns five and six<br />
list the results predicted by the empirical model. Columns seven and eight list the predicted results<br />
from the dye theory model.<br />
Table 5-12: Measured, Empirical Model, and Dye Theory Model <strong>%IOWY</strong> and Integ values<br />
Reference Production Actual Actual Empirical Empirical Dye Theory Dye Theory<br />
Shade # Yarn Count <strong>%IOWY</strong> Integ <strong>%IOWY</strong> Integ <strong>%IOWY</strong> Integ<br />
1134 7.75 3.01% 85.4 3.21% 112.7 3.02% 92.2<br />
1157 6.55 1.89% 77.3 2.34% 91.3 1.88% 76.2<br />
1169 9.75 2.56% N/A 2.79% N/A 2.55% N/A<br />
4223 6.3 0.55% 33 0.64% 32.37 0.55% 33.2<br />
1134 7.75 3.39% 101.1 3.28% 128.7 3.39% 107.7<br />
1110 12 0.30% 12.1 0.33% 15.53 0.31% 14.2<br />
One will notice the dye theory <strong>%IOWY</strong> in column seven <strong>of</strong> table 5-12 matches the measured<br />
actual <strong>%IOWY</strong> from column three. This was an intentional result due to adjustments in the yarn<br />
porosity value during the prediction model calculation phase. Unlike the empirical model, the dye<br />
theory model was porosity dependent. The original value <strong>of</strong> 0.65 was selected as discussed in<br />
section 4.3.1.a since observational yarn skeins were in non-tension state. But what value should be<br />
used for yarns under tension when submerged in a dye bath? Instead <strong>of</strong> guessing at a value, this<br />
257
esearched decided to find the porosity value that would match the target <strong>%IOWY</strong>. This would allow<br />
the predicted Integ values to be calculated and the final porosity value would be analyzed. Given<br />
this assumption the dye theory model predicted <strong>%IOWY</strong> will match the production yarn actual<br />
value.<br />
The results <strong>of</strong> the empirical model predicted <strong>%IOWY</strong> are presented in figure 5-13 and table<br />
5-13. The model predicts the <strong>%IOWY</strong> extremely well as the correlation coefficient <strong>of</strong> 0.97 and F<br />
ratio <strong>of</strong> 180 indicates. This is visually evident in the graph <strong>of</strong> predicted versus actual with all points<br />
falling extremely close to the center line and well within the 95% confidence intervals demarcated<br />
by the dotted lines. Furthermore, the slope <strong>of</strong> 0.98 and intercept <strong>of</strong> -0.10% confirms the empirical<br />
model performed exceptional well at predicting the <strong>%IOWY</strong> on actual production scale dyed yarns.<br />
<strong>%IOWY</strong> Actual<br />
Figure 5-13: Empirical model predicted <strong>%IOWY</strong> compared to actual measured values from production yarns.<br />
258
Table 5-13: ANOVA analysis results <strong>of</strong> empirical model to actual measured production yarn <strong>%IOWY</strong><br />
As previously discussed the dye theory model <strong>%IOWY</strong> value was calculated by adjusting the<br />
porosity value used in the model. These results are listed in table 5-14. To match the actual <strong>%IOWY</strong><br />
from production yarns the porosity value ranged from 0.92 to 0.995. Two interesting points to<br />
make: the porosity values weren't constant and the porosity values were much higher than<br />
expected. One possible cause for porosity variation will be presented shortly. For the higher values,<br />
this could be explained by the high tension <strong>of</strong> the yarns in a wet state during the dyeing process or<br />
the need for lower porosity value than 0.65 during the model construction phase. Either way the<br />
porosity values were below the theoretical limit <strong>of</strong> 1.0.<br />
Table 5-14: Calculated porosity value to fit Dye theory model <strong>%IOWY</strong> to production yarn results<br />
Reference Production Actual Actual Dye Theory Dye Theory Porosity<br />
Shade # Yarn Count <strong>%IOWY</strong> Integ <strong>%IOWY</strong> Integ Value<br />
1134 7.75 3.01% 85.4 3.02% 92.2 0.964<br />
1157 6.55 1.89% 77.3 1.88% 76.2 0.98<br />
1169 9.75 2.56% N/A 2.55% N/A 0.968<br />
4223 6.3 0.55% 33 0.55% 33.2 0.9925<br />
1134 7.75 3.39% 101.1 3.39% 107.7 0.92<br />
1110 12 0.30% 12.1 0.31% 14.2 0.995<br />
259
For completeness, the resulting model fit <strong>of</strong> dye theory model <strong>%IOWY</strong> to actual measured<br />
production yarns is presented in figure 5-14 and table 5-15. Of course there were no surprises.<br />
Basically there was a perfect model fit to the data.<br />
<strong>%IOWY</strong> Actual<br />
Figure 5-14: Dye theory model predicted <strong>%IOWY</strong> compared to actual measured values from production yarns.<br />
260
Table 5-15: ANOVA analysis results <strong>of</strong> dye theory model to actual measured production yarn <strong>%IOWY</strong><br />
Next the empirical model predicted Integ values were compared to the measured values<br />
from production yarns. The ANOVA analysis results are presented in table 5-16 and than graphically<br />
displayed in figure 5-15. The empirical model had an extremely strong model fit to the measured<br />
data as indicated by a correlation coefficient <strong>of</strong> 0.98 and F ratio <strong>of</strong> 254. Graphically, the model fit<br />
demonstrates the strong correlation with most points falling near the center line and well within the<br />
95% confidence intervals.<br />
Unfortunately, the parameter estimates tell a different story. The slope <strong>of</strong> the fit is 0.75<br />
with an intercept <strong>of</strong> 4.7 Integ units. As a result, the empirical model performs reasonably well at<br />
predicting Integ values at lower depths <strong>of</strong> shade. But as the actual depth increases (higher Integ),<br />
the predicted values over estimate the real values. As a result, at 85.4 measured Integ the empirical<br />
model predicts 112.7 Integ and at 101.1 measured units the model predicts 128.7 units. These two<br />
points average to 30% over estimate <strong>of</strong> Integ at darker shades by the empirical model.<br />
261
Integ Actual<br />
Figure 5-15: Empirical model predicted Integ compared to actual measured values from production yarns.<br />
Table 5-16: ANOVA analysis results <strong>of</strong> empirical model to actual measured production yarn Integ<br />
In contrast, the dye theory model performed much better at predicting the Integ shade <strong>of</strong><br />
production dyed yarns. The model fit analysis results are presented in table 5-17 and figure 5-16.<br />
262
The correlation coefficient is 0.99 with an F ratio <strong>of</strong> 498. This indicated an extremely strong<br />
correlation that was statistically significant. Even better, the slope <strong>of</strong> the fit was 0.94 and intercept<br />
was 0.64. As a result, the dye theory model predicted Integ virtually falls on the 1 to 1 curve to<br />
actual Integ values and the 95% confidence intervals are extremely tight with the root mean square<br />
error <strong>of</strong> the fit at 3.36 compared to 4.69 for the empirical model.<br />
Integ Actual<br />
Figure 5-16: Dye theory model predicted Integ compared to actual measured values from production yarns.<br />
263
Table 5-17: ANOVA analysis results <strong>of</strong> dye theory model to actual measured production yarn Integ<br />
The superior performance <strong>of</strong> the dye theory model compared to empirical model resulted<br />
from the ability to compensate for yarn porosity. While this may seem like an unfair advantage for<br />
the dye theory model, it illustrates the importance <strong>of</strong> building models based on theory instead <strong>of</strong><br />
pure statistical analysis. Simply by adjusting the space between fibers in the yarn cross section, the<br />
dye theory model could accurately predict the <strong>%IOWY</strong> and Integ shade while maintaining the<br />
established relationships <strong>of</strong> the underlying dye coefficients such as fiber and yarn diffusion.<br />
So what is the actual production yarn porosity value? After a complete ANOVA statistical<br />
analysis only one parameter showed correlation to changes in required porosity value: dye range<br />
speed. Regardless <strong>of</strong> yarn count, dwell length, dye concentration, and/or pH; only the dye range<br />
speed correlated well with the changes in required porosity value. The ANOVA analysis results are<br />
shown in table 5-18 and graphically displayed in figure 5-17. The correlation coefficient R 2 was 0.90<br />
and F ratio was 47.4. While this isn't the strongest correlation it was deemed to be statistically<br />
significant due to P values <strong>of</strong> 0.0023.<br />
264
Theoretical Porosity<br />
Figure 5-17: <strong>Function</strong>al relationship between theoretical porosity value and dye range speed.<br />
Table 5-18: ANOVA analysis results <strong>of</strong> dye theory model calculated porosity value to dye range speed<br />
The relationship between yarn porosity and dye range speed makes sense under the context<br />
<strong>of</strong> tension. Production yarn under tension will have a high porosity value than observerational<br />
skeins under no tension. Additionally, as the dye range speed was increased, the tension the yarn<br />
was exposed to would increase as well. The higher tension at faster speeds would result in slightly<br />
265
higher porosity values as the individual fibers are packed closer together. While care should be<br />
exercised not to base definitive conclusions from 6 data points, the evidence and rational behind the<br />
relationship was compelling.<br />
266
6 Summary <strong>of</strong> Results, Discussions, and Recommendations<br />
During this endeavor several important learning's have been detailed and this researcher<br />
will present each item with highlights and discussions on key components. Before any observational<br />
data was gathered, a rigorous experimental design was conducted to determine the optimum<br />
method for preparing 100% cotton yarn skeins in the laboratory. The optimum laboratory<br />
procedure involved cooking the yarn skeins at 100° C temperature with 12.7 g/l <strong>of</strong> 50% sodium<br />
hydroxide for 30 minutes. Following this method ensured the most consistent yarn preparation<br />
from day to day. While this research was conducted on 100% cotton open end spun yarns, similar<br />
methods more than likely applies to knitted or woven substrates. Hopefully, future studies will<br />
repeat the analysis on several substrates so a common preparation method can be established.<br />
Today, most published articles provide a detailed description <strong>of</strong> the preparation method utilized but<br />
there are too many variations, study to study. Variations in preparation potentially can skew<br />
measured results and absolute values do not translate from one experiment to another. If industry<br />
adopted a common preparation method, research from many experiments could be grouped<br />
together for greater understanding instead <strong>of</strong> each being treated as a standalone data set.<br />
Following the practice <strong>of</strong> Etters, laboratory experiments were conducted under equilibrium<br />
sorption conditions. There were two primary reasons for conducting these experiments. Under<br />
equilibrium sorption conditions, a mathematical expression was developed that relates indigo dye<br />
bath concentration to the maximum <strong>%IOWY</strong>. A relationship was developed that expressed <strong>%IOWY</strong><br />
in terms <strong>of</strong> indigo dye bath concentration at specific dye bath pH levels. It was determined the<br />
pr<strong>of</strong>ile <strong>of</strong> pH dependence followed the monophenolate ionic form <strong>of</strong> the indigo dye molecule as<br />
purposed by Etters and summarized in equation 6-1.
Second, equilibrium sorption conditions were used to develop a mathematical expression<br />
for <strong>%IOWY</strong> located at the surface <strong>of</strong> the yarn to the Integ shade value. The reverse expression was<br />
also developed. With these two equations the approximate <strong>%IOWY</strong> at the surface from non-<br />
uniformly dyed yarns were calculated based on the measured Integ shade value as summarized in<br />
equation 6-2. This resulted in the ability to quantitatively express the penetration level <strong>of</strong> non-<br />
uniformly dyed yarns. Combining the two primary conclusions from the equilibrium sorption<br />
experiments provided the base relationships needed to develop a theoretical dye model.<br />
%
or the Integ shade value; may result in reducing variable cost associated with each yard <strong>of</strong> fabric and<br />
reduce effluent chemicals that require processing before releasing to the environment.<br />
It was determined that finer yarns have a greater %COWY and the relationship is fairly linear<br />
in nature. Likewise, adding more dips <strong>of</strong> indigo increased the %COWY but the relationship wasn't<br />
linear as each additional dip resulted in a smaller change in %COWY. Increasing the speed from 26<br />
m/min to 33 m/min resulted in an increase in %COWY. At approximately 33 m/min the relationship<br />
peaked and %COWY deceased at higher speeds. Unsurprisingly, increasing the dye bath indigo<br />
concentration resulted in greater %COWY. Last, increasing pH actually decreased the %COWY. It<br />
would appear that operating the indigo dye range with high number <strong>of</strong> dips, relatively fast speeds,<br />
high pH values, and coarse yarns would reduce the residual %COWY. Of course these changes may<br />
change the <strong>%IOWY</strong> and Integ shade values on established production shades but when developing a<br />
new production shade with new dye range set-up conditions these trends should be kept in mind.<br />
Many results have been published relating <strong>%IOWY</strong> to various parameters. Results from the<br />
graphical and ANOVA analysis for <strong>%IOWY</strong> confirm many <strong>of</strong> these relationships. Specifically,<br />
increased number <strong>of</strong> dips and increased dye bath concentration both resulted in increased <strong>%IOWY</strong>.<br />
However, contrary to previously published results, dye bath pH was determined to be statistically<br />
insignificant. This, <strong>of</strong> course, could be related to the limited dye bath pH range over which the<br />
observational study was conducted. Also, the graphical analysis indicated an increase in pH caused<br />
an increase in <strong>%IOWY</strong>. Both <strong>of</strong> these conclusions contradict conventional wisdom and should be<br />
confirmed with additional production scale indigo dye range analysis preferably at far lower pH<br />
ranges. In addition to previously published dye range set-up parameters this observational study<br />
included many parameters never investigated before. It was determined that finer yarns have<br />
increased <strong>%IOWY</strong> compared to courser counts. Also, the dye range speed was determined to have a<br />
significant impact and increased speeds resulted in decreased <strong>%IOWY</strong>.<br />
Besides <strong>%IOWY</strong> many published experiments discuss the relationship <strong>of</strong> indigo shade to dye<br />
range set-up conditions. In most cases, the discussions are based on corrected K/S values at a<br />
specific wavelength. In this study, shade was expressed in terms <strong>of</strong> Integ values which proved to be<br />
continuous and unique, although not linear, over a wide range <strong>of</strong> <strong>%IOWY</strong> values. The general trend<br />
and ANOVA analysis results from the observational study confirms all published trends. Specifically,<br />
269
increased <strong>%IOWY</strong>, increased number <strong>of</strong> dips, increased dye bath concentration, and decreased dye<br />
bath pH caused the Integ shade values to increase. Additionally, new relationships were uncovered<br />
from the analysis <strong>of</strong> observational data. Finer yarns produced higher Integ values than courser<br />
counts. Increasing the dye range speed resulted in a decreased Integ value; and increasing the dwell<br />
time caused the Integ values to slightly decrease.<br />
The last response variable evaluated from the observational study was penetration level. As<br />
mentioned before, penetration level was a calculated parameter dependent on the Integ shade,<br />
<strong>%IOWY</strong>, and derived expression relating Integ and <strong>%IOWY</strong> from equilibrium sorption. Finer yarn<br />
counts were observed to have higher penetration levels than courser counts. This relationship<br />
mirrors real world experiences since finer yarn counts are more penetrated or less ring dyed than<br />
coarser counts. While finer yarns do have slightly higher Integ values at a given dye range set-up,<br />
the change in <strong>%IOWY</strong> was much greater at finer counts. As the number <strong>of</strong> dips <strong>of</strong> indigo increased<br />
the penetration level decreased. This was due to the additive nature <strong>of</strong> indigo dyeing with each<br />
additional dip layered on top <strong>of</strong> the previous dip. As speed was increased, the penetration level was<br />
observed to decrease non-linearly until approximately 33 m/min. Further increases in speed<br />
resulted in slightly higher penetration levels. Although the impact <strong>of</strong> speed on penetration trends<br />
hasn't been published, this relationship mirrors real world experience. An increase in the dye bath<br />
concentration was determined to cause the penetration level to decrease. Also, increased dye bath<br />
pH was linked to increased penetration levels. This observational study confirmed many pH related<br />
experiments conducted by Etters.<br />
Based on the observational study results an empirical dye model was created to link dye<br />
range set-up conditions with the resulting %COWY, <strong>%IOWY</strong>, Integ, and penetration level. The<br />
empirical model proved to perform well at predicting the response variables. When compared to a<br />
third independent dye range, the empirical model performed well. The correlation coefficients,<br />
slope, and intercept relating the predicted to actual values are listed in table 6-1.<br />
270
Table 6-1: Empirical model performance review<br />
Response Correlation Coef, R 2 Slope Intercept<br />
%COWY 0.91 1.014 -0.000<br />
<strong>%IOWY</strong> 0.94 1.012 -0.001<br />
Integ 0.97 1.084 -1.344<br />
Penetration Level 0.59 0.680 0.066<br />
The empirical model was compared to actual production yarns from full scale indigo chain<br />
rope dye equipment. Surprising the <strong>%IOWY</strong> was predicted with exceptional level <strong>of</strong> accuracy.<br />
Unfortunately, that level <strong>of</strong> performance was not carried over to the Integ shade prediction. The<br />
empirical model correlated well with measured values but over predicted the actual value. At the<br />
higher Integ levels the differences between actual and empirical model prediction approached 30%.<br />
As a result, the penetration level wasn't predicted well either.<br />
A second indigo dye model was also created based on general dye and diffusion theory. In<br />
the dye theory model, dye coefficients such as fiber diffusion, yarn diffusion, wet pick-up, wash<br />
reduction, and oxidation rate were calculated based on the dye range set-up conditions. Then, using<br />
these dye coefficients the dye theory model calculated the resulting %COWY, <strong>%IOWY</strong>, Integ, and<br />
indirectly penetration level.<br />
Just like the empirical model, the dye theory model was compared to a third independent<br />
indigo dye range. The resulting comparison demonstrated poorer correlation in predicting %COWY<br />
then the empirical model. However, the dye theory model performed as well as the empirical<br />
model at predicting the <strong>%IOWY</strong> and Integ. Further, the dye model actually outperformed the<br />
empirical model at predicting penetration level. The correlation coefficients, slopes, and intercepts<br />
from the dye theory model predicted compared to actual values are listed in table 6-2.<br />
Table 6-2: Dye theory model performance review<br />
Response Correlation Coef, R 2 Slope Intercept<br />
%COWY 0.74 0.764 0.007<br />
<strong>%IOWY</strong> 0.95 0.943 -0.001<br />
Integ 0.97 1.097 -5.764<br />
Penetration Level 0.67 0.806 0.041<br />
271
The dye theory model was compared to actual full scale production dyed cotton yarns. By<br />
adjusting the yarn porosity value used in the calculations to match the actual <strong>%IOWY</strong>, an excellent<br />
correlation was established for the Integ shade values. The resulting correlation coefficient for<br />
predicted and actual Integ was R 2 <strong>of</strong> 0.99 with a slope <strong>of</strong> 0.945 and intercept <strong>of</strong> 0.643.<br />
The outperformance <strong>of</strong> the dye theory model compared to the empirical model was due to<br />
the ability to compensate for yarn porosity changes between the observational data collection state,<br />
non-tension, and production state, high tension. Furthermore, potential porosity dependence on<br />
dye range speed was introduced. While six data points were certainly not enough evidence to<br />
present a compelling argument, the strong correlation does warrant further investigation.<br />
Recommendations<br />
1. Expansion <strong>of</strong> the equilibrium sorption experiments would add more insight in the behavior and<br />
dependence <strong>of</strong> indigo dye uptake at various dye bath indigo concentrations and pH levels.<br />
Additional data points at lower pH levels are required to confirm the mathematical relationships<br />
presented. Specifically, higher dye bath indigo concentrations at much lower pH levels are required.<br />
While the current study coupled with Etters' previously published results <strong>of</strong>fers a compelling<br />
argument, more data points are required to provide statistically strong support.<br />
2. Additional observational studies need to be conducted from other full scale production chain<br />
rope indigo dye ranges. By adding more data points to the dye theory model, confidence intervals<br />
would be increased and observed general trends clarified. Specifically, a wider range <strong>of</strong> dye bath pH<br />
levels must be explored which incorporates pH buffering systems. The inability to reproduce<br />
published <strong>%IOWY</strong> and pH relationship must be further explored. Additionally, the speed and dwell<br />
time effect on response variables needs a greater variety in the range <strong>of</strong> values. These can only be<br />
achieved by varying the thread-up dwell length.<br />
3. Refinement <strong>of</strong> the dye theory model nodal mesh would provide more insight in physico-<br />
chemical effects during the indigo dye process. Making changes in the finite difference nodal mesh<br />
which models the fiber and yarn structural characteristics would provide better prediction <strong>of</strong> dye<br />
272
ath movement within the yarn structure and thereby better prediction <strong>of</strong> <strong>%IOWY</strong>, Integ shade, and<br />
indigo distribution or penetration level. Furthermore, it may be possible to decouple the yarn and<br />
fiber diffusion coefficients back into four elements instead <strong>of</strong> two. This would allow description <strong>of</strong><br />
dye affinity or adsorption for the fiber surface and diffusion into the fiber interior. As well as<br />
understanding the difference between dye movement through the dye bath medium and boundary<br />
layer surrounding the individual fibers.<br />
4. Incorporate additional production scale dyed yarn data points to expand dye theory model<br />
prediction and explore the effects <strong>of</strong> porosity value relating zero and production state tension.<br />
The current dye theory model preformed well at predicting the production yarn <strong>%IOWY</strong> and Integ<br />
shade. Additional data points are required to confirm the relationship. The relationship between<br />
dye range speed and actual yarn porosity presented is extremely enticing. However more data<br />
points are required from many different indigo chain rope dye ranges to confirm the relationship<br />
presented.<br />
5. Combine current presented information and recommendations to create a commercial quality<br />
indigo dye prediction program. An accurate indigo dye prediction program would greatly assist the<br />
manufacturing quality control engineer. By coupling the prediction s<strong>of</strong>tware with end item shade<br />
analysis and production history, the production engineer would know how current production<br />
conditions will affect the end item. This would allow for intelligent dye range adjustments to be<br />
made to control <strong>%IOWY</strong> and indigo distribution. Additionally, the indigo dye prediction s<strong>of</strong>tware<br />
would assist dye range equipment manufactures. By understanding the dye range mechanical<br />
affects on <strong>%IOWY</strong>, Integ, and penetration level; certain fixed dye range mechanical properties could<br />
be tailored to a customer's requirements. Finally, the indigo dye prediction s<strong>of</strong>tware would greatly<br />
assist an indigo dye house when developing new production shades. The ability to predict <strong>%IOWY</strong>,<br />
Integ, and indigo distribution without the need for trials would reduce development time and costs.<br />
273
REFERENCES<br />
1. Buffalo Color Corporation, Technical Information Bulletin, Indigo Paste: Common Sense Practices in Indigo<br />
Dyeing, 1997.<br />
2. J. Crank, Mathematics <strong>of</strong> Diffusion, Oxford University Press, 1957.<br />
3. P.B. Weisz, <strong>Sorption</strong>-Diffusion in Porous Solids and the Dyeing Process, 1966.<br />
4. R. McGregor, Diffusion and <strong>Sorption</strong> in Fibers and Films, Academic Press, London, 1974.<br />
5. Y.A. Cengel and M.A. Boles, Thermodynamics: An Engineering Approach, 1989, McGraw-Hill.<br />
6. P.M. Gerhart, R.J. Gross, and J.I. Hochstein, Fundamentals <strong>of</strong> Fluid Mechanics, 2 nd Edition, Addison-Wesley<br />
Publishing, 1992.<br />
7. A. Bejan, Heat Transfer, John Wiley and Sons, 1993.<br />
8. P. Atkins, Physical Chemistry, 5 th Edition, 1994, Oxford University Press.<br />
9. R. McDonald, Colour Physics for Industry, 2 nd Edition, Society <strong>of</strong> Dyers and Colourists, 1997.<br />
10. J.N. Etters, “Diffusion Equations Made Easy”, source, June 1980 Vol 12, No 6 p. 37-42.<br />
11. J.N. Etters, “The Diffusional Boundary Layer: Some Implications for the Dyeing Technologist”, Journal <strong>of</strong><br />
Society <strong>of</strong> Dyers & Colorist, April 1981, Vol 97 p. 170-179.<br />
12. J.N. Etters, “An Automatic Computation <strong>of</strong> Diffusion Equation Solutions”, Textile Research Journal, 1983,<br />
53, p. 598-605.<br />
13. J.A. Greer and G.R. Turner, “Indigo Denims: The Practical Side”, Textile Chemist and Colorist, Vol 15, No 6,<br />
June 1983, p.11-18.<br />
14. J.N. Etters, “Efficient Use <strong>of</strong> Sodium Hydrosulfite in Commerical Vat Dyeing Processes”, American Dyestuff<br />
Reporter, March 1989, p18-26.<br />
274
15. J.N. Etters, “Effect <strong>of</strong> Dyebath pH on Color Yield in Indigo Dyeing <strong>of</strong> Cotton Denim Yarn”, Southeastern<br />
Section <strong>of</strong> AATCC, 1989 ITPC Paper, Textile Chemist and Colorist, 21 (12) p25-31.<br />
16. I.L. Haas, “Indigo Dyeing: Process and Machine Concepts”, International Textile Bulletin, Feb. 1990, p45-48.<br />
17. J.N. Etters, “New Opportunities in Indigo Dyeing”, American Dyestuff Reporter, Sept. 1990, p19,101.<br />
18. J.N Etters, “Estimating and Using Surface Reflactance in Kubelka-Munk Computations”, American Dyestuff<br />
Reporter, April 1991, p 15- 21.<br />
19. P.A. Annis, J.N.Etters, and G.L. Baughman “Dyeing with Indigo: New Data Correlating Colour Yeild with<br />
Ionic Form <strong>of</strong> Applied Dye”, Canadian Textile Journal, May 1991, p20-23.<br />
20. J.N Etters and M. Hou, “<strong>Equilibrium</strong> <strong>Sorption</strong> Isoterms <strong>of</strong> Indigo on Cotton Denim Yarn: Effect <strong>of</strong> pH”,<br />
Textile Research Journal, Dec. 1991 Vol 61(12), p. 773-776.<br />
21. J.N. Etters, “Predicting Shade Depth and Wash-Down Characteristics <strong>of</strong> Indigo-Dyed Denim: A<br />
Mathematical Analysis”, American Dyestuff Reporter, Feb. 1992, p42-46.<br />
22. J.N. Etters, “Quality Control <strong>of</strong> Cotton Denim in Indigo Dyeing”, American Dyestuff Reporter, March 1992,<br />
p17-24.<br />
23. J.N. Etters, “Sorting Dyed Denim Fabric to Possess Similar Wash-Down Characteristics”, American Dyestuff<br />
Reporter, Aug. 1992, p26-37.<br />
24. J.N Etters, “Reducing Environmental Contamination by Indigo in Continuous Dyeing <strong>of</strong> Cotton Denim Yarn”,<br />
American Dyestuff Reporter, Feb. 1993, P30-33,50.<br />
25. J.N. Etters, “Indigo dyeing <strong>of</strong> cotton denim yarn: correlating theory with practice”, Journal <strong>of</strong> Society <strong>of</strong><br />
Dyers & Colorist, July/Aug. 1993, Vol 109 p.251-255.<br />
26. J.N. Etters, “Quick-Wash Denim: New Opportunity for Denim Garment Manufacturers”, American Dyestuff<br />
Reporter, May 1994, p15-16.<br />
27. J.N. Etters, “Reproducibility in Indigo Dyeing”, American Dyestuff Reporter, June 1994, p26-29.<br />
275
28. J.N. Etters, “Kinetics <strong>of</strong> Dye <strong>Sorption</strong>: Effect <strong>of</strong> Dyebath Flow on Dyeing Uniformity”, American Dyestuff<br />
Reporter, Jan. 1995.<br />
29. C.L. Chong, L.W. Poon, and W.C. Poon, “Improving Indigo dyeing Colour Yield”, Textile Asia, Jan. 1995, p55-<br />
57.<br />
30. J.N Etters., “Advances in Indigo Dyeing: Implications for the Dyer, apparel Manufacture and Enironment”,<br />
American Dyestuff Reporter, Feb. 1995 p17-22.<br />
31. J.N. Etters, “Diffusion-Controlled <strong>Sorption</strong> <strong>of</strong> Dye by Cylindrical Fibers: Matching Empirical and Theoretical<br />
Models”, AATCC 1995 International Conference & Exhibition Book <strong>of</strong> Papers, Oct 8-11.<br />
32. P.J. Hauser and B.D. Basinger, “Creative Textile Finishing: Two Commercial Examples”, AATCC 1995<br />
International Conference & Exhibition Book <strong>of</strong> Papers, Oct 8-11.<br />
33. J.N. Etters, “Recent Progrss in Indigo Dyeing <strong>of</strong> Cotton Denim Yarn”, Indian Journal <strong>of</strong> Fibre & Textile<br />
Research, Vol 21 March 1996, p-30-34.<br />
34. P.J. Hauser, A. Bairathi, “New System for Improved Denim Dyeing”, American Dyestuff Reporter, Aug.<br />
1996, p55-57,69.<br />
35. M.S. Parmar, S.S. Satsangi, and J. Prakash, “Indigo Dyed Warp Yarn – An Essential Requirement for<br />
Manufacturing Denim”, Colourage, Sept. 1996, p45-50.<br />
36. R. Paul, S.R. Naik, and R. Rajagopal, “The Indigo Phenomenon: Evolution from Natural to Synthetic”, Denim<br />
Series – Part III, Textile Dyer & Printer, Nov.6, 1996, p12-16.<br />
37. R. Paul, S.R. Naik and R. Kumar, “The Indigo Machine – The Cradle <strong>of</strong> Blue Revolution”, Denim Series – Part<br />
V, Textile Dyer & Printer, Dec.4, 1996, p15-21.<br />
38. R. Paul, S.R. Naik and U. Sharma, “Indigo Dyeing: Chemistry Process and Trouble Shooting”, Denim Series –<br />
Part VI, Textile Dyer & Printer, Dec.18, 1996, p18-23.<br />
39. R. Paul and S.R. Naik, “The Continuous Indigo Dyeing <strong>of</strong> Cotton Denim Warp Yarn”, Denim Series – Part VII,<br />
Textile Dyer & Printer, Jan.1, 1997, p11-14.<br />
40. R. Paul and S.R. Naik, “Historical Aspects <strong>of</strong> Indigo Dyeing”, Denim Series – Part VIII, Textile Dyer & Printer,<br />
Feb.12, 1997, p13-16.<br />
276
41. R. Paul and S.R. Naik, “Full Spectrum Denim – A Recent Development”, Denim Series – Part X, Textile Dyer<br />
& Printer, Mar. 12, 1997, p16-17.<br />
42. R. Paul and S.R. Naik, “The Technology <strong>of</strong> Ring Dyeing – An Economically Viable, Environment Friendly<br />
Development”, Denim Series – Part XI, Textile Dyer & Printer, April 9, 1997, p16-22.<br />
43. T. Bechtold, E. Burtscher, G. Kuhnel, and O. Bobleter, “Electrochemical Reduction Processes in Indigo<br />
Dyeing”, Journal <strong>of</strong> Society <strong>of</strong> Dyers and Colorist, Vol 113, April 1997, p135-144.<br />
44. T.Bechtold, E. Burtscher, A. Turcanu, and O. Bobleter, “Dyeing Behavior <strong>of</strong> Indigo Reduced by Indirect<br />
Electrolysis”, Textile Research Journal, Vol 69, Sept. 1997, p635-642.<br />
45. J.N. Etters, “pH-Controlled Indigo Dyeing: Buffered Dyebaths vs Caustic Dosing”, American Dyestuff<br />
Reporter, Sept. 1998, p15-17.<br />
46. J.H. Xin, “Colour Variation in the Dyeing <strong>of</strong> Denim Yarn with Indigo”, Journal <strong>of</strong> Society <strong>of</strong> Dyers & Colorist,<br />
Sept. 2000, Vol 116, P. 260-265.<br />
47. P.J. Hauser and J.T. Merritt, “Improved Determination <strong>of</strong> Indigo on Fibers or Fabrics”, Textile Chemist and<br />
Colorist & American Dyestuff Reporter, Vol 32, No 12, Dec. 2000, p33-35.<br />
48. X. Zhou, “Studies on Indigo Dyeing and Diffusion by the Film Roll Method”, Color Technology, 117, 2001, p.<br />
68-75.<br />
49. E.G. McFarland, W.W. Carr, and S. Michilsen, “Determining Diffusion and Convective Mass Transfer<br />
<strong>Coefficients</strong> in Dyeing a thin Flat Film”, Textile Research Journal, Vol 72, Sept. 2002, p756-763.<br />
50.C. Choi, J. Nah, “Seperation <strong>of</strong> Dye Substance form Polygoum Tinctoris and It’s Dyeing Characterization”,<br />
Theories and Applications <strong>of</strong> Chemical Engineering, Vol9, N02, 2003, p624-627.<br />
51. P. Westbroek, “Improving Quality and Reproducibility <strong>of</strong> the Indigo Dye Process by Measuring and<br />
Controlling Indigo and Sodium Dithionite Concentrations”, Textile Research Journal, Dec. 2003 Vol 73(2), p.<br />
1079-1084.<br />
52. H.T Deo and R. Paul, “Standing Bath Technique for Indigo Denim Dyeing”, International Textile Bulletin,<br />
Feb. 2004, p66-68.<br />
277
53. U. Sahin, “Real Time Monitoring <strong>of</strong> Indigo Concentrations in the Dye bath with a Laser Diode<br />
Spectrometer”, Textile Research Journal, Mar. 2004 Vol 74(3), p 193-197.<br />
54. E.P.A. Kumbasar, “Automatic Indigo Measurement System as Part <strong>of</strong> a Dosing System for Indigo Dyeing”,<br />
Fibers & Textiles, July/Sept. 2006 Vol 14 No 3 p. 86-90.<br />
55. N. Meksi, “Cotton dyeing by Indigo with the Borohydride Process: Effect <strong>of</strong> Some Experimental Conditions<br />
on Indigo Reduction and Dyeing Quality”, Chemical Engineering Journal, 2007, Vol 131, p. 187-193.<br />
56. P. Hudson, A. Clapp, D. Kness, Joseph's Introductory Textile Science, Sixth Ed., Harcourt Brace Jovanovich<br />
Publishers, 1993.<br />
57. Y. Mogahzy, "Understanding the Fiber-to-Yarn Conversion System PART II: Yarn Characteristics",<br />
Auburn.edu, 1993.<br />
58. A. Nabovati, "Through-thickness Permeability Prediction <strong>of</strong> three-dimensional Multifilament Woven<br />
Fabrics", Composites, Part A41, 2010, p453-463.<br />
59. M. Ozisik, Heat Transfer: A Basic Approach, McGraw-Hill, 1985.<br />
60. J.R. Welty, C.E. Wicks, R.E Wilson, Fundamentals <strong>of</strong> Momentum, Heat, and Mass Transfer, 3rd Ed, John<br />
Wiley & Sons, 1984.<br />
61. J.T. Merritt, K.R. Beck, C.B. Smith, P. Hauser, W.J. Jasper, "Determination <strong>of</strong> Indigo in Dyebaths by Flow<br />
Injection Analysis and Redox Titrations", AATCC Review, 53-57, 2001.<br />
278
APPENDIX<br />
279
Section A-1-2a: Spectrophotometric method to measure indigo dye bath concentration by %T.<br />
Spectronic 21<br />
1. Position sensitivity control to "M" (medium).<br />
2. Adjust wavelength/Nanometer control to read "660".<br />
3. Set dial on face <strong>of</strong> Spectonic 21 to "Transmittance".<br />
Method<br />
1. Zeroing the machine<br />
2. Fill the test tube with clear water.<br />
3. Place test tube in opening.<br />
4. Line up number on test tube with notch located to the right <strong>of</strong> the opening. <strong>Digital</strong> indicator<br />
should zero to 100.0<br />
Test<br />
1. Add approximately 300-400 mls <strong>of</strong> water to a clean 500 ml volumetric flask.<br />
2. Add a magnetic strring bar and place the flask on a magnestir with rapid agition.<br />
3. Pipet 1 ml <strong>of</strong> dye box liquor into the swirling water, being careful to wipe any excess from the<br />
outside <strong>of</strong> the pipet.<br />
4. Agitiate for four minutes or until the Indigo is completely oxidized - bright blue.<br />
5. Remove the magentic bar.<br />
6. Dilute to volume with water and mix until uniform (500 ml).<br />
7. Pour the solution into a test tube.<br />
8. Place in Spectronic 21, making sure numbers are aligned with notch.<br />
9. Read results.<br />
Equation calculation for oz/gal <strong>of</strong> 20% indigo<br />
<br />
<br />
= (−%
Section A-1-2b: Total alkalinity titration method.<br />
1. Pipette 10 ml <strong>of</strong> liquor into a 250 ml beaker.<br />
2. Add 100 ml <strong>of</strong> distilled water to the beaker.<br />
3. Place the beaker on the mag stirrer and place a magnet in the liquor.<br />
4. Begin stirring at a brisk level so that the level on the wall never exceeds the 150 ml mark.<br />
5. Place the electrodes <strong>of</strong> a properly calibrated pH meter into the beaker.<br />
6. Begin adding 0.05N Hcl acid at no more than 1 drop every 2 seconds to allow the pH meter<br />
enough time to equilibrate after each addition. After the pH has dropped below 9.0, add not more<br />
than 1 drop every 4 seconds.<br />
7. Titrate to a pH <strong>of</strong> 8.28.<br />
8. Calculate the g/l <strong>of</strong> total alkalinity by equation A-1-2.
Section A-2: Nothing.<br />
Section A-3-1: % Reflectance values <strong>of</strong> mock dyed 100% cotton yarns used to calculate K/S.<br />
Table A-3-1: % Reflectance values <strong>of</strong> mock dyed 100% cotton yarns used to calculate K/S.<br />
Wavelength, nm 6.3/1 7.1./1 8.0/1 12.0/1<br />
400 44.2175 46.26 47.10667 47.13<br />
420 47.125 49.46 50.15667 50.27<br />
440 50.29 52.83 53.35333 53.62571<br />
460 52.9825 55.63333 55.94 56.39143<br />
480 55.79 58.49 58.58 59.23714<br />
500 58.2225 60.99333 60.86 61.71857<br />
520 60.575 63.3 62.97 64.02857<br />
540 62.86 65.51 65.02333 66.29143<br />
560 65.1375 67.65333 67.02 68.53429<br />
580 67.11 69.50667 68.81 70.49857<br />
600 68.8975 71.16667 70.41667 72.25<br />
620 70.5625 72.68 71.89 73.85429<br />
640 72.2425 74.21667 73.34667 75.40429<br />
660 73.93 75.83667 74.83 76.87286<br />
680 75.7825 77.7 76.61667 78.47857<br />
700 77.22 79.19 78.06333 79.75429<br />
Section A-3-2: Nothing.<br />
282
Section A-3-3: Balance <strong>of</strong> data from equilibrium sorption experiment.<br />
Table A-3-3: <strong>%IOWY</strong> and Integ shade data from equilibrium sorption experiment<br />
Yarn Count Dye Bath g/l Dye Bath pH <strong>%IOWY</strong> Integ Shade Stock Mix<br />
7.1 0.641 12.25 1.10% 32.7 1<br />
7.1 0.17663 12.8 0.29% 7.4 4<br />
7.1 1.2287 12.8 1.16% 30.9 6<br />
7.1 0.01577 13.17 0.02% 1.2 3<br />
7.1 0.03494 13.3 0.04% 2.2 6<br />
7.1 0.49612 13.19 0.51% 14.0 5<br />
7.1 1.99985 13.21 1.48% 36.9 3<br />
7.1 3.8843 13.24 2.29% 51.0 5<br />
7.1 6.3355 13.1 3.28% 64.0 4<br />
7.1 9.61464 13.31 4.10% 68.7 3<br />
7.1 14.0149 13.2 5.33% 76.3 6<br />
7.1 19.2293 13.43 6.04% 78.5 5<br />
7.1 29.95 13.2 8.51% 91.0 4<br />
8 2.548 11.2 2.98% 61.8 8<br />
8 0.17663 12.8 0.29% 7.1 4<br />
8 1.2287 12.8 1.17% 30.2 6<br />
8 2.564 12.9 2.02% 47.5 7<br />
8 0.01577 13.17 0.03% 1.2 3<br />
8 0.03494 13.3 0.08% 2.3 6<br />
8 0.49612 13.19 0.50% 14.1 5<br />
8 1.99985 13.21 1.41% 35.9 3<br />
8 3.8843 13.24 2.29% 48.3 5<br />
8 6.3355 13.1 3.32% 63.2 4<br />
8 9.61464 13.31 3.93% 67.9 3<br />
8 14.0149 13.2 5.15% 75.4 6<br />
8 19.2293 13.43 5.60% 78.7 5<br />
8 20.191 13.3 6.67% 80.0 8<br />
8 29.95 13.2 8.44% 89.8 4<br />
12 0.641 12.25 1.09% 34.5 1<br />
12 1.602 12.72 1.61% 45.6 1<br />
12 0.17663 12.8 0.30% 7.8 4<br />
12 1.2287 12.8 1.25% 31.4 6<br />
12 2.564 12.9 2.06% 50.5 8<br />
12 0.01577 13.17 0.02% 1.2 3<br />
12 0.03494 13.3 0.06% 2.8 6<br />
12 0.49612 13.19 0.50% 13.8 5<br />
12 1.99985 13.21 1.46% 36.0 3<br />
12 3.8843 13.24 2.31% 49.7 5<br />
12 4.487 13.14 2.85% 59.3 7<br />
12 6.3355 13.1 3.25% 60.7 4<br />
12 9.61464 13.31 4.31% 68.7 3<br />
12 14.0149 13.2 5.04% 75.6 6<br />
12 19.2293 13.43 5.86% 75.8 5<br />
12 29.95 13.2 8.53% 87.5 4<br />
283
Section A-4-1: Observational Study Raw Data -Dye Range Parameters<br />
Table A-4-1: Prime and replica raw data set<br />
Shade<br />
Dye Bath<br />
ID<br />
Dwell<br />
(gpl<br />
Dye Dye Bath Dwell<br />
Nip<br />
Speed Time Oxidation 100% Dye Bath Alkalinity Length Oxidation Pressures<br />
(m/min) (sec) Time (sec) Indigo) Bath pH (mV) (gpl) (m) Length (m) (psi)<br />
1160 36.6 14.1 59.1 0.891 11.66 745 3.16 8.63 36.03 70<br />
Yarn Skein Response Variables<br />
Yarn Dye<br />
Greige Boil Off Dyed Washed<br />
Total Surface<br />
Penetration<br />
Count route Dips Weight Weight Weight Weight %COWY <strong>%IOWY</strong> <strong>%IOWY</strong> Integ Level<br />
7.1 1 only 1 6.9561 7.0521 6.9425 1.380% 0.128% 0.182% 6.198167 0.70<br />
7.1 1 --> 2 2 7.0316 7.1811 7.0267 2.126% 0.263% 0.471% 13.73814 0.56<br />
7.1 1 --> 3 3 7.0931 7.3064 7.101 3.007% 0.437% 0.802% 21.46723 0.54<br />
7.1 1 --> 4 4 6.9405 7.119 6.9549 2.572% 0.526% 1.141% 28.84153 0.46<br />
% Reflectance Readings<br />
Wavelength<br />
(nm) Dip 1 Dip 2 Dip 3 Dip 4 Dip 5 Dip 6 Dip 7<br />
400 22.78 15.15 11.40 9.33<br />
420 28.23 19.75 15.23 12.70<br />
440 27.56 18.64 14.14 11.63<br />
460 25.10 16.23 12.06 9.78<br />
480 23.09 14.31 10.38 8.25<br />
500 21.16 12.69 9.07 7.08<br />
520 18.82 10.87 7.49 5.71<br />
540 15.90 8.77 5.95 4.48<br />
560 14.25 7.64 5.07 3.80<br />
580 12.60 6.48 4.26 3.20<br />
600 10.82 5.40 3.56 2.69<br />
620 9.44 4.60 3.07 2.35<br />
640 7.96 3.83 2.62 2.05<br />
660 7.03 3.51 2.49 1.95<br />
680 9.24 4.58 3.15 2.46<br />
700 18.45 10.63 7.54 5.78<br />
284
Table A-4-1: Continued<br />
Shade<br />
Dye Bath<br />
ID<br />
Dwell<br />
(gpl<br />
Dye Dye Bath Dwell<br />
Nip<br />
Speed Time Oxidation 100% Dye Bath Alkalinity Length Oxidation Pressures<br />
(m/min) (sec) Time (sec) Indigo) Bath pH (mV) (gpl) (m) Length (m) (psi)<br />
1160 36.576 14.1 59.1 0.891 11.66 745 3.16 8.63 36.03 70<br />
Yarn Skein Response Variables<br />
Yarn Dye<br />
Greige Boil Off Dyed Washed<br />
Total Surface<br />
Penetration<br />
Count route Dips Weight Weight Weight Weight %COWY <strong>%IOWY</strong> <strong>%IOWY</strong> Integ Level<br />
12 1 only 1 6.1529 5.9725 6.0856 5.9596 1.894% 0.145% 0.188% 6.4 0.80<br />
12 1--2 2 6.1463 5.9698 6.109 5.9689 2.332% 0.264% 0.405% 12.1 0.56<br />
12 1--3 3 6.5291 6.3408 6.5588 6.3577 3.438% 0.447% 0.731% 19.9 0.56<br />
12 1--4 4 6.3526 6.1746 6.3433 6.1902 2.732% 0.538% 0.949% 24.7 0.47<br />
% Reflectance Readings<br />
Wavelength<br />
(nm) Dip 1 Dip 2 Dip 3 Dip 4 Dip 5 Dip 6 Dip 7<br />
400 22.62 16.46 11.88 10.47<br />
420 28.00 21.35 15.73 14.13<br />
440 27.21 20.23 14.68 13.00<br />
460 24.70 17.72 12.61 10.98<br />
480 22.66 15.68 10.93 9.35<br />
500 20.73 13.97 9.61 8.13<br />
520 18.42 11.99 8.00 6.61<br />
540 15.56 9.71 6.40 5.21<br />
560 13.96 8.48 5.46 4.43<br />
580 12.35 7.26 4.60 3.72<br />
600 10.63 6.04 3.85 3.11<br />
620 9.30 5.15 3.32 2.70<br />
640 7.88 4.28 2.81 2.30<br />
660 6.98 3.88 2.64 2.19<br />
680 9.11 5.09 3.35 2.76<br />
700 18.00 11.73 8.00 6.56<br />
285
Table A-4-1: Continued<br />
Shade<br />
Dye Bath<br />
ID<br />
Dwell<br />
(gpl<br />
Dye Dye Bath Dwell<br />
Nip<br />
Speed Time Oxidation 100% Dye Bath Alkalinity Length Oxidation Pressures<br />
(m/min) (sec) Time (sec) Indigo) Bath pH (mV) (gpl) (m) Length (m) (psi)<br />
1160 36.576 14.1 59.1 0.764 11.91 762 2.5 8.63 36.03 70<br />
Yarn Skein Response Variables<br />
Yarn Dye<br />
Greige Boil Off Dyed Washed<br />
Total Surface<br />
Penetration<br />
Count route Dips Weight Weight Weight Weight %COWY <strong>%IOWY</strong> <strong>%IOWY</strong> Integ Level<br />
6.3 I only 1 7.9045 7.5992 7.7051 7.5822 1.394% 0.150% 0.216% 7.2 0.69<br />
6.3 1--2 2 7.616 7.3223 7.4879 7.3162 2.262% 0.281% 0.477% 13.9 0.59<br />
6.3 1--3 3 7.7551 7.4518 7.6594 7.4602 2.786% 0.458% 0.802% 21.5 0.57<br />
6.3 1--4 4 7.781 7.476 7.6616 7.4896 2.483% 0.523% 1.086% 27.7 0.48<br />
% Reflectance Readings<br />
Wavelength<br />
(nm) Dip 1 Dip 2 Dip 3 Dip 4 Dip 5 Dip 6 Dip 7<br />
400 21.20 14.84 11.38 9.63<br />
420 26.48 19.48 15.24 13.13<br />
440 25.80 18.52 14.16 12.05<br />
460 23.39 16.21 12.09 10.15<br />
480 21.37 14.29 10.39 8.56<br />
500 19.50 12.69 9.10 7.38<br />
520 17.20 10.83 7.49 5.94<br />
540 14.40 8.73 5.98 4.67<br />
560 12.78 7.56 5.06 3.95<br />
580 11.18 6.40 4.25 3.32<br />
600 9.49 5.29 3.54 2.78<br />
620 8.20 4.50 3.04 2.42<br />
640 6.89 3.75 2.61 2.10<br />
660 6.08 3.42 2.44 1.98<br />
680 8.16 4.50 3.14 2.52<br />
700 16.86 10.59 7.47 5.95<br />
286
Table A-4-1: Continued<br />
Shade<br />
Dye Bath<br />
ID<br />
Dwell<br />
(gpl<br />
Dye Dye Bath Dwell<br />
Nip<br />
Speed Time Oxidation 100% Dye Bath Alkalinity Length Oxidation Pressures<br />
(m/min) (sec) Time (sec) Indigo) Bath pH (mV) (gpl) (m) Length (m) (psi)<br />
1160 36.576 14.1 59.1 0.764 11.91 762 2.5 8.63 36.03 60.00<br />
Yarn Skein Response Variables<br />
Yarn Dye<br />
Greige Boil Off Dyed Washed<br />
Total Surface<br />
Penetration<br />
Count route Dips Weight Weight Weight Weight %COWY <strong>%IOWY</strong> <strong>%IOWY</strong> Integ Level<br />
7.1 1 only 1 6.7962 6.556 6.6875 6.5431 2.006% 0.161% 0.253% 8.2 0.64<br />
7.1 1--2 2 6.8133 6.562 6.7048 6.5562 2.176% 0.302% 0.470% 13.7 0.64<br />
7.1 1--3 3 6.9451 6.69 6.8819 6.6933 2.868% 0.469% 0.821% 21.9 0.57<br />
7.1 1--4 4 6.8598 6.615 6.7976 6.6334 2.760% 0.653% 1.264% 31.4 0.52<br />
% Reflectance Readings<br />
Wavelength<br />
(nm) Dip 1 Dip 2 Dip 3 Dip 4 Dip 5 Dip 6 Dip 7<br />
400 19.66 15.27 11.17 8.59<br />
420 24.53 19.96 15.01 11.61<br />
440 23.68 18.91 13.99 10.65<br />
460 21.37 16.51 11.95 8.96<br />
480 19.47 14.56 10.27 7.51<br />
500 17.73 12.94 9.00 6.45<br />
520 15.62 11.03 7.40 5.19<br />
540 13.10 8.87 5.90 4.10<br />
560 11.64 7.66 5.00 3.48<br />
580 10.20 6.47 4.20 2.95<br />
600 8.70 5.34 3.48 2.50<br />
620 7.56 4.54 2.99 2.21<br />
640 6.42 3.77 2.54 1.98<br />
660 5.74 3.43 2.35 1.90<br />
680 7.58 4.56 3.06 2.39<br />
700 15.32 10.79 7.31 5.37<br />
287
Table A-4-1: Continued<br />
Shade<br />
Dye Bath<br />
ID<br />
Dwell<br />
(gpl<br />
Dye Dye Bath Dwell<br />
Nip<br />
Speed Time Oxidation 100% Dye Bath Alkalinity Length Oxidation Pressures<br />
(m/min) (sec) Time (sec) Indigo) Bath pH (mV) (gpl) (m) Length (m) (psi)<br />
1160 36.576 14.1 59.1 0.764 11.91 762 2.5 8.63 36.03 60.00<br />
Yarn Skein Response Variables<br />
Yarn Dye<br />
Greige Boil Off Dyed Washed<br />
Total Surface<br />
Penetration<br />
Count route Dips Weight Weight Weight Weight %COWY <strong>%IOWY</strong> <strong>%IOWY</strong> Integ Level<br />
8 1 only 1 6.0312 5.8294 5.9189 5.7961 1.535% 0.163% 0.210% 7.0 0.78<br />
8 1--2 2 6.0612 5.8525 5.9722 5.8303 2.045% 0.310% 0.418% 12.4 0.74<br />
8 1--3 3 6.0001 5.7917 5.9468 5.7817 2.678% 0.480% 0.743% 20.1 0.65<br />
8 1--4 4 6.1102 5.9038 6.0451 5.8998 2.393% 0.660% 1.208% 30.3 0.55<br />
% Reflectance Readings<br />
Wavelength<br />
(nm) Dip 1 Dip 2 Dip 3 Dip 4 Dip 5 Dip 6 Dip 7<br />
400 21.30 16.02 11.81 8.99<br />
420 26.56 20.89 15.77 12.26<br />
440 25.92 19.87 14.71 11.25<br />
460 23.58 17.42 12.61 9.44<br />
480 21.62 15.46 10.89 7.95<br />
500 19.78 13.77 9.57 6.82<br />
520 17.51 11.82 7.94 5.49<br />
540 14.74 9.57 6.36 4.31<br />
560 13.11 8.32 5.40 3.64<br />
580 11.51 7.09 4.55 3.06<br />
600 9.80 5.88 3.77 2.56<br />
620 8.50 4.99 3.24 2.23<br />
640 7.18 4.15 2.75 1.96<br />
660 6.36 3.74 2.55 1.84<br />
680 8.46 4.97 3.28 2.34<br />
700 17.06 11.45 7.80 5.47<br />
288
Table A-4-1: Continued<br />
Shade<br />
Dye Bath<br />
ID<br />
Dwell<br />
(gpl<br />
Dye Dye Bath Dwell<br />
Nip<br />
Speed Time Oxidation 100% Dye Bath Alkalinity Length Oxidation Pressures<br />
(m/min) (sec) Time (sec) Indigo) Bath pH (mV) (gpl) (m) Length (m) (psi)<br />
1160 36.576 14.1 59.1 0.764 11.91 762 2.5 8.63 36.03 60.00<br />
Yarn Skein Response Variables<br />
Yarn Dye<br />
Greige Boil Off Dyed Washed<br />
Total Surface<br />
Penetration<br />
Count route Dips Weight Weight Weight Weight %COWY <strong>%IOWY</strong> <strong>%IOWY</strong> Integ Level<br />
12 1 only 1 3.856 3.7189 3.8039 3.7106 2.286% 0.204% 0.240% 7.8 0.85<br />
12 1--2 2 4.0024 3.8631 3.9669 3.8586 2.687% 0.377% 0.552% 15.7 0.68<br />
12 1--3 3 4.0023 3.8535 3.9861 3.861 3.441% 0.560% 0.887% 23.4 0.63<br />
12 1--4 4 3.9139 3.7728 3.8844 3.791 2.958% 0.725% 1.267% 31.5 0.57<br />
% Reflectance Readings<br />
Wavelength<br />
(nm) Dip 1 Dip 2 Dip 3 Dip 4 Dip 5 Dip 6 Dip 7<br />
400 20.23 13.84 10.78 8.69<br />
420 25.34 18.15 14.46 11.72<br />
440 24.56 17.15 13.43 10.70<br />
460 22.16 14.91 11.45 9.00<br />
480 20.19 13.09 9.81 7.54<br />
500 18.39 11.61 8.58 6.47<br />
520 16.21 9.88 7.02 5.22<br />
540 13.58 7.95 5.57 4.12<br />
560 12.07 6.85 4.72 3.49<br />
580 10.54 5.76 3.94 2.95<br />
600 8.97 4.76 3.27 2.49<br />
620 7.78 4.06 2.81 2.19<br />
640 6.57 3.39 2.40 1.94<br />
660 5.86 3.12 2.23 1.85<br />
680 7.77 4.09 2.91 2.33<br />
700 15.83 9.63 7.01 5.31<br />
289
Table A-4-1: Continued<br />
Shade<br />
Dye Bath<br />
ID<br />
Dwell<br />
(gpl<br />
Dye Dye Bath Dwell<br />
Nip<br />
Speed Time Oxidation 100% Dye Bath Alkalinity Length Oxidation Pressures<br />
(m/min) (sec) Time (sec) Indigo) Bath pH (mV) (gpl) (m) Length (m) (psi)<br />
1162 31.0896 16.7 69.5 1.066 11.76 743 3.42 8.63 36.03 70.00<br />
Yarn Skein Response Variables<br />
Yarn<br />
Count<br />
Dye<br />
route Dips<br />
Greige<br />
Weight<br />
Boil Off<br />
Weight<br />
Dyed<br />
Weight<br />
Washed<br />
Weight %COWY<br />
Total<br />
<strong>%IOWY</strong><br />
Surface<br />
<strong>%IOWY</strong> Integ<br />
Penetration<br />
Level<br />
7.1 1 only 1 6.9125 6.6961 6.8589 6.6845 2.431% 0.153% 0.226% 7.4 0.68<br />
7.1 1--2 2 6.9989 6.7661 6.9954 6.7766 3.389% 0.357% 0.716% 19.5 0.50<br />
7.1 1--3 3 6.9641 6.7352 7.0001 6.7439 3.933% 0.527% 1.171% 29.5 0.45<br />
7.1 1--4 4 6.9822 6.7466 7.0094 6.7845 3.895% 0.645% 1.534% 37.0 0.42<br />
7.1 1--5 5 6.9435 6.7046 6.9901 6.7499 4.258% 0.849% 2.028% 46.7 0.42<br />
7.1 1--6 6 6.9078 6.6907 6.9952 6.7343 4.551% 0.998% 2.361% 53.0 0.42<br />
7.1 1--7 7 6.915 6.6881 6.9739 6.7501 4.273% 1.138% 2.680% 57.4 0.42<br />
% Reflectance Readings<br />
Wavelength<br />
(nm) Dip 1 Dip 2 Dip 3 Dip 4 Dip 5 Dip 6 Dip 7<br />
400 20.08 11.74 8.92 7.52 6.23 5.56 5.03<br />
420 25.40 15.80 12.30 10.38 8.43 7.34 6.60<br />
440 24.71 14.73 11.21 9.30 7.39 6.39 5.72<br />
460 22.34 12.59 9.32 7.67 6.01 5.15 4.61<br />
480 20.36 10.85 7.79 6.28 4.86 4.14 3.71<br />
500 18.59 9.55 6.68 5.34 4.11 3.50 3.15<br />
520 16.44 7.96 5.41 4.28 3.29 2.82 2.55<br />
540 13.85 6.41 4.28 3.39 2.62 2.27 2.06<br />
560 12.41 5.51 3.67 2.92 2.28 1.99 1.83<br />
580 11.05 4.69 3.13 2.50 2.00 1.78 1.66<br />
600 9.52 3.94 2.68 2.18 1.79 1.63 1.55<br />
620 8.28 3.40 2.36 1.96 1.66 1.54 1.49<br />
640 7.03 2.94 2.14 1.84 1.63 1.55 1.51<br />
660 6.24 2.81 2.10 1.85 1.69 1.64 1.62<br />
680 8.00 3.52 2.62 2.26 2.02 1.93 1.87<br />
700 15.81 7.88 5.60 4.64 3.82 3.45 3.18<br />
290
Table A-4-1: Continued<br />
Shade<br />
Dye Bath<br />
ID<br />
Dwell<br />
(gpl<br />
Dye Dye Bath Dwell<br />
Nip<br />
Speed Time Oxidation 100% Dye Bath Alkalinity Length Oxidation Pressures<br />
(m/min) (sec) Time (sec) Indigo) Bath pH (mV) (gpl) (m) Length (m) (psi)<br />
1162 31.0896 16.7 69.5 1.066 11.76 743 3.42 8.63 36.03 70.00<br />
Yarn Skein Response Variables<br />
Yarn<br />
Count<br />
Dye<br />
route Dips<br />
Greige<br />
Weight<br />
Boil Off<br />
Weight<br />
Dyed<br />
Weight<br />
Washed<br />
Weight %COWY<br />
Total<br />
<strong>%IOWY</strong><br />
Surface<br />
<strong>%IOWY</strong> Integ<br />
Penetration<br />
Level<br />
8 1 only 1 6.0851 5.8856 6.0242 5.8739 2.355% 0.167% 0.235% 7.7 0.71<br />
8 1--2 2 6.0246 5.8307 6.0216 5.8278 3.274% 0.355% 0.651% 18.0 0.54<br />
8 1--3 3 6.0942 5.9039 6.1043 5.9017 3.394% 0.531% 1.048% 26.9 0.51<br />
8 1--4 4 6.0591 5.8724 6.1037 5.8845 3.939% 0.735% 1.598% 38.2 0.46<br />
8 1--5 5 6.1861 5.988 6.2333 6.0167 4.097% 0.926% 2.054% 47.2 0.45<br />
8 1--6 6 6.0467 5.8509 6.11 5.884 4.428% 1.022% 2.237% 50.7 0.46<br />
8 1--7 7 6.0202 5.8246 6.1046 5.8788 4.807% 1.196% 2.665% 57.2 0.45<br />
% Reflectance Readings<br />
Wavelength<br />
(nm) Dip 1 Dip 2 Dip 3 Dip 4 Dip 5 Dip 6 Dip 7<br />
400 19.57 12.31 9.46 7.18 6.16 5.75 5.13<br />
420 24.81 16.60 12.96 9.88 8.29 7.63 6.74<br />
440 24.19 15.60 11.93 8.89 7.32 6.68 5.87<br />
460 21.93 13.44 10.04 7.35 5.98 5.41 4.73<br />
480 20.02 11.64 8.48 6.03 4.86 4.38 3.81<br />
500 18.29 10.28 7.34 5.14 4.12 3.72 3.23<br />
520 16.19 8.65 5.96 4.13 3.31 3.00 2.61<br />
540 13.60 6.95 4.73 3.28 2.63 2.41 2.10<br />
560 12.17 5.97 4.05 2.83 2.27 2.09 1.86<br />
580 10.80 5.06 3.44 2.44 1.99 1.87 1.66<br />
600 9.27 4.22 2.92 2.13 1.77 1.69 1.53<br />
620 8.06 3.62 2.55 1.91 1.62 1.58 1.45<br />
640 6.81 3.08 2.26 1.79 1.58 1.56 1.45<br />
660 6.06 2.87 2.19 1.82 1.61 1.63 1.51<br />
680 7.81 3.66 2.75 2.22 1.95 1.93 1.76<br />
700 15.62 8.51 6.09 4.51 3.80 3.53 3.17<br />
291
Table A-4-1: Continued<br />
Shade<br />
Dye Bath<br />
ID<br />
Dwell<br />
(gpl Dye Dye Dye Bath Dwell<br />
Nip<br />
Speed Time Oxidation 100% Bath Bath Alkalinity Length Oxidation Pressures<br />
(m/min) (sec) Time (sec) Indigo) pH (mV) (gpl) (m) Length (m) (psi)<br />
1162 31.0896 16.7 69.5 1.129 11.7 747 3.62 8.63 36.03 70.00<br />
Yarn Skein Response Variables<br />
Yarn<br />
Count<br />
Dye<br />
route Dips<br />
Greige<br />
Weight<br />
Boil Off<br />
Weight<br />
Dyed<br />
Weight<br />
Washed<br />
Weight %COWY<br />
Total<br />
<strong>%IOWY</strong><br />
Surface<br />
<strong>%IOWY</strong> Integ<br />
Penetration<br />
Level<br />
6.3 1 only 1 7.9444 7.6489 7.801 7.6285 1.989% 0.171% 0.204% 6.8 0.84<br />
6.3 1--2 2 7.6963 7.3949 7.6295 7.4014 3.172% 0.366% 0.671% 18.5 0.55<br />
6.3 1--3 3 7.696 7.4129 7.6787 7.4273 3.586% 0.588% 1.374% 33.7 0.43<br />
6.3 1--4 4 7.6995 7.3936 7.651 7.4227 3.481% 0.718% 1.629% 38.9 0.44<br />
6.3 1--5 5 7.7576 7.4609 7.758 7.5016 3.982% 0.955% 2.133% 48.7 0.45<br />
6.3 1--5 5 7.5935 7.3037 7.6196 7.3553 4.325% 0.950% 2.088% 47.8 0.45<br />
6.3 1--7 7 7.7599 7.4576 7.7748 7.5221 4.253% 1.311% 2.919% 60.0 0.45<br />
% Reflectance Readings<br />
Wavelength<br />
(nm) Dip 1 Dip 2 Dip 3 Dip 4 Dip 5 Dip 5 Dip 7<br />
400 20.29 12.05 7.97 7.15 5.94 6.02 4.74<br />
420 25.62 16.25 10.97 9.91 8.01 8.19 6.23<br />
440 25.26 15.27 10.04 8.90 7.07 7.20 5.41<br />
460 23.17 13.13 8.40 7.35 5.78 5.85 4.37<br />
480 21.34 11.35 6.95 6.00 4.67 4.71 3.52<br />
500 19.62 9.99 5.94 5.10 3.94 3.98 2.98<br />
520 17.47 8.38 4.78 4.10 3.17 3.20 2.42<br />
540 14.78 6.75 3.77 3.23 2.53 2.56 1.98<br />
560 13.25 5.79 3.22 2.77 2.19 2.21 1.75<br />
580 11.80 4.91 2.74 2.38 1.92 1.95 1.59<br />
600 10.15 4.11 2.35 2.07 1.71 1.76 1.50<br />
620 8.84 3.54 2.08 1.87 1.60 1.62 1.43<br />
640 7.51 3.05 1.91 1.77 1.58 1.60 1.49<br />
660 6.60 2.86 1.89 1.78 1.61 1.66 1.58<br />
680 8.53 3.63 2.36 2.19 1.93 1.97 1.83<br />
700 16.88 8.28 5.09 4.48 3.68 3.69 3.08<br />
292
Table A-4-1: Continued<br />
Shade<br />
Dye Bath<br />
ID<br />
Dwell<br />
(gpl Dye Dye Dye Bath Dwell<br />
Nip<br />
Speed Time Oxidation 100% Bath Bath Alkalinity Length Oxidation Pressures<br />
(m/min) (sec) Time (sec) Indigo) pH (mV) (gpl) (m) Length (m) (psi)<br />
1162 31.0896 16.7 69.5 1.129 11.7 747 3.62 8.63 36.03 70.00<br />
Yarn Skein Response Variables<br />
Yarn<br />
Count<br />
Dye<br />
route Dips<br />
Greige<br />
Weight<br />
Boil Off<br />
Weight<br />
Dyed<br />
Weight<br />
Washed<br />
Weight %COWY<br />
Total<br />
<strong>%IOWY</strong><br />
Surface<br />
<strong>%IOWY</strong> Integ<br />
Penetration<br />
Level<br />
12 1 only 1 3.7295 3.6009 3.7002 3.5896 2.758% 0.221% 0.290% 9.2 0.76<br />
12 1--2 2 3.997 3.8643 4.0212 3.8692 4.060% 0.456% 0.801% 21.4 0.57<br />
12 1--3 3 3.9658 3.8243 4.0051 3.8387 4.728% 0.723% 1.375% 33.7 0.53<br />
12 1--4 4 3.8058 3.6712 3.8291 3.6938 4.301% 0.939% 1.867% 43.6 0.50<br />
12 1--5 5 3.9635 3.8259 4.021 3.8633 5.099% 1.219% 2.274% 51.4 0.54<br />
12 1--6 6 3.955 3.8093 4.044 3.8612 6.161% 1.547% 3.116% 61.9 0.50<br />
12 1--7 7 3.933 3.7989 3.9968 3.8481 5.209% 1.711% 3.613% 65.7 0.47<br />
% Reflectance Readings<br />
Wavelength<br />
(nm) Dip 1 Dip 2 Dip 3 Dip 4 Dip 5 Dip 6 Dip 7<br />
400 17.75 11.06 8.21 6.61 5.78 4.69 4.34<br />
420 22.65 14.93 11.24 9.02 7.71 6.05 5.57<br />
440 22.01 13.97 10.23 8.04 6.76 5.25 4.81<br />
460 19.84 11.98 8.51 6.63 5.50 4.25 3.87<br />
480 17.97 10.28 7.02 5.40 4.44 3.43 3.12<br />
500 16.32 9.02 5.99 4.58 3.74 2.90 2.65<br />
520 14.35 7.47 4.82 3.67 3.01 2.37 2.16<br />
540 11.99 5.98 3.80 2.91 2.40 1.93 1.79<br />
560 10.65 5.11 3.24 2.48 2.08 1.71 1.61<br />
580 9.37 4.30 2.75 2.15 1.83 1.56 1.48<br />
600 7.99 3.58 2.34 1.87 1.64 1.45 1.41<br />
620 6.88 3.07 2.07 1.69 1.52 1.39 1.37<br />
640 5.81 2.62 1.89 1.59 1.49 1.43 1.43<br />
660 5.22 2.48 1.84 1.63 1.56 1.54 1.54<br />
680 6.78 3.22 2.35 1.98 1.85 1.78 1.78<br />
700 13.96 7.52 5.09 4.07 3.51 3.02 2.87<br />
293
Table A-4-1: Continued<br />
Shade<br />
Dye Bath<br />
ID<br />
Dwell<br />
(gpl Dye Dye Dye Bath Dwell<br />
Nip<br />
Speed Time Oxidation 100% Bath Bath Alkalinity Length Oxidation Pressures<br />
(m/min) (sec) Time (sec) Indigo) pH (mV) (gpl) (m) Length (m) (psi)<br />
T3675 34.75 14.7 62.2 1.932 11.5 836 4.82 8.63 36.03 70.00<br />
Yarn Skein Response Variables<br />
Yarn Dye<br />
Greige Boil Off Dyed Washed<br />
Total Surface<br />
Penetration<br />
Count route Dips Weight Weight Weight Weight %COWY <strong>%IOWY</strong> <strong>%IOWY</strong> Integ Level<br />
6.3 1 only 1 8.209646 7.9091 8.2466 7.9158 4.267% 0.385% 0.861% 22.8 0.45<br />
6.3 1--2 2 8.15951 7.8608 8.3462 7.8953 6.175% 0.631% 1.739% 41.0 0.36<br />
6.3 1--2 2 8.167399 7.8684 8.2713 7.8062 5.120% 0.653% 1.748% 41.2 0.37<br />
6.3 1--4 4 8.174977 7.8757 8.4725 7.9623 7.578% 1.222% 4.299% 70.1 0.28<br />
6.3 1--5 5 8.167399 7.8684 8.5453 7.9757 8.603% 1.495% 5.891% 78.7 0.25<br />
6.3 1--6 6 8.23736 7.9358 8.5928 8.0797 8.279% 1.741% 7.325% 85.3 0.24<br />
% Reflectance Readings<br />
Wavelength<br />
(nm) Dip 1 Dip 2 Dip 2 Dip 4 Dip 5 Dip 6 Dip 7<br />
400 11.09 7.17 7.10 4.09 3.44 3.00<br />
420 15.07 9.91 9.83 5.28 4.34 3.72<br />
440 13.96 8.85 8.81 4.58 3.74 3.21<br />
460 11.80 7.27 7.24 3.70 3.05 2.62<br />
480 10.10 5.93 5.91 3.00 2.48 2.15<br />
500 8.82 5.02 5.01 2.55 2.14 1.88<br />
520 7.21 4.00 3.99 2.08 1.78 1.59<br />
540 5.72 3.14 3.13 1.71 1.51 1.40<br />
560 4.81 2.65 2.64 1.53 1.38 1.30<br />
580 4.00 2.26 2.26 1.39 1.29 1.23<br />
600 3.29 1.93 1.91 1.30 1.22 1.19<br />
620 2.82 1.72 1.72 1.26 1.20 1.17<br />
640 2.42 1.57 1.57 1.25 1.22 1.21<br />
660 2.32 1.56 1.56 1.34 1.33 1.31<br />
680 3.07 1.98 1.96 1.58 1.54 1.53<br />
700 7.25 4.20 4.20 2.61 2.32 2.13<br />
294
Table A-4-1: Continued<br />
Shade<br />
Dye Bath<br />
ID<br />
Dwell<br />
(gpl Dye Dye Dye Bath Dwell<br />
Nip<br />
Speed Time Oxidation 100% Bath Bath Alkalinity Length Oxidation Pressures<br />
(m/min) (sec) Time (sec) Indigo) pH (mV) (gpl) (m) Length (m) (psi)<br />
T3675 34.75 14.7 62.2 1.932 11.5 836 4.82 8.63 36.03 70.00<br />
Yarn Skein Response Variables<br />
Yarn Dye<br />
Greige Boil Off Dyed Washed<br />
Total Surface<br />
Penetration<br />
Count route Dips Weight Weight Weight Weight %COWY <strong>%IOWY</strong> <strong>%IOWY</strong> Integ Level<br />
7.1 1 only 1 7.0445 6.8512 7.1585 6.8528 4.485% 0.359% 0.811% 21.7 0.44<br />
7.1 1--2 2 7.07 6.8743 7.3384 6.9061 6.751% 0.691% 1.824% 42.7 0.38<br />
7.1 1--3 3 7.2324 7.0316 7.5021 7.0851 6.691% 1.001% 2.701% 57.7 0.37<br />
7.1 1--4 4 7.1538 6.9599 7.4319 7.0392 6.782% 1.476% 4.598% 71.8 0.32<br />
7.1 1--5 5 7.1736 6.9814 7.5533 7.08 8.192% 1.773% 6.253% 80.4 0.28<br />
7.1 1--6 6 7.1894 6.9918 7.5306 7.1185 7.706% 2.153% 7.877% 87.6 0.27<br />
% Reflectance Readings<br />
Wavelength<br />
(nm) Dip 1 Dip 2 Dip 3 Dip 4 Dip 5 Dip 6 Dip 7<br />
400 11.62 6.97 5.30 3.99 3.40 2.93<br />
420 15.70 9.58 6.97 5.10 4.33 3.64<br />
440 14.54 8.52 6.11 4.41 3.73 3.13<br />
460 12.32 6.97 4.95 3.57 3.03 2.55<br />
480 10.56 5.69 3.99 2.90 2.46 2.08<br />
500 9.25 4.82 3.37 2.47 2.11 1.83<br />
520 7.61 3.84 2.70 2.02 1.75 1.55<br />
540 6.04 3.01 2.15 1.67 1.48 1.36<br />
560 5.08 2.55 1.85 1.50 1.34 1.27<br />
580 4.22 2.18 1.64 1.37 1.26 1.21<br />
600 3.46 1.86 1.46 1.28 1.19 1.16<br />
620 2.94 1.67 1.37 1.24 1.17 1.15<br />
640 2.51 1.55 1.34 1.25 1.19 1.18<br />
660 2.39 1.56 1.39 1.34 1.29 1.28<br />
680 3.18 1.97 1.66 1.57 1.50 1.49<br />
700 7.55 4.09 3.14 2.55 2.28 2.08<br />
295
Table A-4-1: Continued<br />
Shade<br />
Dye Bath<br />
ID<br />
Dwell<br />
(gpl Dye Dye Dye Bath Dwell<br />
Nip<br />
Speed Time Oxidation 100% Bath Bath Alkalinity Length Oxidation Pressures<br />
(m/min) (sec) Time (sec) Indigo) pH (mV) (gpl) (m) Length (m) (psi)<br />
T3675 34.75 14.7 62.2 1.932 11.5 836 4.82 8.63 36.03 70.00<br />
Yarn Skein Response Variables<br />
Yarn Dye<br />
Greige Boil Off Dyed Washed<br />
Total Surface<br />
Penetration<br />
Count route Dips Weight Weight Weight Weight %COWY <strong>%IOWY</strong> <strong>%IOWY</strong> Integ Level<br />
12 1 only 1 6.1357 5.9461 6.2804 5.9571 5.622% 0.487% 0.841% 22.3 0.58<br />
12 1--2 2 6.146 5.9627 6.4084 5.9993 7.475% 0.897% 1.768% 41.6 0.51<br />
12 1--3 3 5.7399 5.5191 5.9891 5.579 8.516% 1.467% 2.980% 60.6 0.49<br />
12 1--4 4 5.9484 5.9925 6.4706 6.086 7.978% 1.698% 4.228% 69.6 0.40<br />
12 1--5 5 5.82 5.5935 6.2417 5.7228 11.588% 2.189% 7.207% 84.8 0.30<br />
12 1--6 6 6.1973 6.0232 6.5289 6.1572 8.396% 2.463% 8.470% 90.0 0.29<br />
% Reflectance Readings<br />
Wavelength<br />
(nm) Dip 1 Dip 2 Dip 3 Dip 4 Dip 5 Dip 6 Dip 7<br />
400 11.27 7.11 5.05 4.15 3.17 2.87<br />
420 15.17 9.67 6.54 5.26 3.89 3.49<br />
440 13.98 8.62 5.72 4.56 3.35 3.00<br />
460 11.83 7.08 4.62 3.69 2.74 2.46<br />
480 10.12 5.77 3.73 2.99 2.23 2.01<br />
500 8.87 4.90 3.14 2.54 1.92 1.76<br />
520 7.28 3.91 2.54 2.07 1.61 1.51<br />
540 5.81 3.09 2.03 1.73 1.40 1.33<br />
560 4.92 2.62 1.76 1.54 1.29 1.24<br />
580 4.10 2.24 1.57 1.41 1.22 1.19<br />
600 3.39 1.91 1.41 1.31 1.17 1.14<br />
620 2.92 1.72 1.34 1.28 1.17 1.13<br />
640 2.51 1.60 1.30 1.28 1.20 1.15<br />
660 2.42 1.61 1.37 1.38 1.32 1.29<br />
680 3.18 2.00 1.63 1.61 1.52 1.50<br />
700 7.29 4.18 3.02 2.61 2.22 2.10<br />
296
Table A-4-1: Continued<br />
Shade<br />
Dye Bath<br />
ID<br />
Dwell<br />
(gpl<br />
Dye Dye Bath Dwell<br />
Nip<br />
Speed Time Oxidation 100% Dye Bath Alkalinity Length Oxidation Pressures<br />
(m/min) (sec) Time (sec) Indigo) Bath pH (mV) (gpl) (m) Length (m) (psi)<br />
4257 31.09 16.7 69.5 2.084 11.62 847 4.71 8.63 36.03 70.00<br />
Yarn Skein Response Variables<br />
Yarn Dye<br />
Greige Boil Off Dyed Washed<br />
Total Surface<br />
Penetration<br />
Count route Dips Weight Weight Weight Weight %COWY <strong>%IOWY</strong> <strong>%IOWY</strong> Integ Level<br />
6.3 1 only 1 8.3432 8.0041 8.3513 7.9669 4.338% 0.416% 0.951% 24.8 0.44<br />
6.3 1--2 2 8.3076 7.9612 8.4339 7.9705 5.938% 0.652% 1.796% 42.2 0.36<br />
6.3 1--3 3 7.7893 7.4662 7.9978 7.4984 7.120% 0.936% 2.622% 56.7 0.36<br />
6.3 1--4 4 7.9303 7.5905 8.1786 7.6566 7.748% 1.383% 4.261% 69.8 0.32<br />
6.3 1--5 5 8.3555 8.0023 8.6951 8.0934 8.658% 1.759% 5.960% 79.0 0.30<br />
6.3 1--6 6 7.6623 7.3511 7.9466 7.4567 8.101% 2.089% 7.179% 84.6 0.29<br />
% Reflectance Readings<br />
Wavelength<br />
(nm) Dip 1 Dip 2 Dip 3 Dip 4 Dip 5 Dip 6 Dip 7<br />
400 10.36 6.97 5.21 4.03 3.34 2.96<br />
420 14.01 9.50 6.77 5.11 4.11 3.55<br />
440 12.96 8.50 5.95 4.44 3.56 3.07<br />
460 10.95 6.98 4.83 3.61 2.91 2.52<br />
480 9.32 5.71 3.92 2.95 2.40 2.09<br />
500 8.12 4.83 3.32 2.52 2.08 1.84<br />
520 6.62 3.87 2.69 2.06 1.75 1.58<br />
540 5.25 3.05 2.17 1.71 1.51 1.41<br />
560 4.43 2.60 1.88 1.54 1.39 1.33<br />
580 3.68 2.21 1.68 1.41 1.30 1.26<br />
600 3.05 1.90 1.51 1.32 1.25 1.23<br />
620 2.66 1.66 1.43 1.29 1.25 1.25<br />
640 2.34 1.59 1.40 1.30 1.26 1.27<br />
660 2.27 1.59 1.45 1.38 1.36 1.38<br />
680 2.95 1.97 1.70 1.59 1.55 1.56<br />
700 6.82 4.15 3.15 2.61 2.31 2.15<br />
297
Table A-4-1: Continued<br />
Shade<br />
Dye Bath<br />
ID<br />
Dwell<br />
(gpl Dye Dye Dye Bath Dwell<br />
Nip<br />
Speed Time Oxidation 100% Bath Bath Alkalinity Length Oxidation Pressures<br />
(m/min) (sec) Time (sec) Indigo) pH (mV) (gpl) (m) Length (m) (psi)<br />
1169 31.09 16.7 69.5 2.34 11.6 888 6.27 8.63 36.03 70.00<br />
Yarn Skein Response Variables<br />
Yarn<br />
Count<br />
Dye<br />
route Dips<br />
Greige<br />
Weight<br />
Boil Off<br />
Weight<br />
Dyed<br />
Weight<br />
Washed<br />
Weight %COWY<br />
Total<br />
<strong>%IOWY</strong><br />
Surface<br />
<strong>%IOWY</strong> Integ<br />
Penetration<br />
Level<br />
6.3 1 only 1 8.8602 8.6341 9.0951 8.6456 5.339% 0.339% 0.775% 20.8 0.44<br />
6.3 1--2 2 8.1011 7.8951 8.4853 7.9318 7.476% 0.702% 1.773% 41.7 0.40<br />
6.3 1--3 3 8.4191 8.2117 8.8716 8.2815 8.036% 1.108% 2.698% 57.6 0.41<br />
6.3 1--4 4 8.6023 8.3729 9.0466 8.4835 8.046% 1.430% 4.058% 68.6 0.35<br />
6.3 1--5 5 8.3565 8.1541 8.8352 8.2801 8.353% 1.808% 5.701% 77.7 0.32<br />
6.3 1--6 6 8.3364 8.1265 8.9261 8.2935 9.839% 2.126% 6.905% 83.4 0.31<br />
6.3 1--7 7 8.1278 7.9263 8.6595 8.0976 9.250% 2.474% 8.728% 91.0 0.28<br />
% Reflectance Readings<br />
Wavelength<br />
(nm) Dip 1 Dip 2 Dip 3 Dip 4 Dip 5 Dip 6 Dip 7<br />
400 11.93 7.15 5.24 4.23 3.48 3.08 2.72<br />
420 15.97 9.80 6.91 5.43 4.41 3.79 3.30<br />
440 14.83 8.72 6.03 4.71 3.81 3.26 2.84<br />
460 12.58 7.14 4.86 3.78 3.08 2.65 2.33<br />
480 10.80 5.82 3.92 3.06 2.51 2.18 1.92<br />
500 9.47 4.93 3.31 2.60 2.17 1.90 1.70<br />
520 7.82 3.93 2.67 2.12 1.78 1.61 1.46<br />
540 6.23 3.09 2.14 1.75 1.52 1.41 1.30<br />
560 5.25 2.61 1.85 1.56 1.39 1.32 1.23<br />
580 4.34 2.21 1.64 1.42 1.30 1.26 1.18<br />
600 3.57 1.89 1.47 1.32 1.24 1.22 1.16<br />
620 3.05 1.70 1.40 1.29 1.23 1.22 1.17<br />
640 2.61 1.57 1.37 1.29 1.26 1.28 1.24<br />
660 2.51 1.60 1.42 1.39 1.35 1.41 1.39<br />
680 3.31 2.00 1.70 1.62 1.55 1.60 1.59<br />
700 7.97 4.26 3.16 2.71 2.37 2.25 2.13<br />
298
Table A-4-1: Continued<br />
Shade<br />
Dye Bath<br />
ID<br />
Dwell<br />
(gpl<br />
Dye Dye Bath Dwell<br />
Nip<br />
Speed Time Oxidation 100% Dye Bath Alkalinity Length Oxidation Pressures<br />
(m/min) (sec) Time (sec) Indigo) Bath pH (mV) (gpl) (m) Length (m) (psi)<br />
1134 31.09 16.7 69.5 2.314 11.89 805 5.17 8.63 36.03 70.00<br />
Yarn Skein Response Variables<br />
Yarn Dye<br />
Greige Boil Off Dyed Washed<br />
Total Surface<br />
Penetration<br />
Count route Dips Weight Weight Weight Weight %COWY <strong>%IOWY</strong> <strong>%IOWY</strong> Integ Level<br />
6.3 1 only 1 7.598 7.2978 7.632 7.274 4.579% 0.358% 0.669% 18.4 0.54<br />
6.3 1--2 2 7.7048 7.4103 7.8917 7.3868 6.496% 0.757% 1.685% 40.0 0.45<br />
6.3 1--3 3 7.7848 7.4763 7.9975 7.4662 6.971% 1.245% 2.699% 57.6 0.46<br />
6.3 1--4 4 7.6821 7.3905 7.9348 7.4245 7.365% 1.500% 3.958% 67.9 0.38<br />
6.3 1--5 5 7.7462 7.4572 8.0651 7.5261 8.152% 1.859% 5.370% 76.0 0.35<br />
6.3 1--6 6 7.727 7.4248 8.1051 7.53 9.163% 2.177% 6.677% 82.4 0.33<br />
% Reflectance Readings<br />
Wavelength<br />
(nm) Dip 1 Dip 2 Dip 3 Dip 4 Dip 5 Dip 6 Dip 7<br />
400 12.64 7.21 5.16 4.15 3.55 3.15<br />
420 17.04 9.96 6.78 5.35 4.43 3.87<br />
440 15.90 8.92 5.89 4.64 3.83 3.32<br />
460 13.59 7.33 4.83 3.76 3.12 2.71<br />
480 11.76 5.99 3.92 3.06 2.54 2.23<br />
500 10.34 5.10 3.32 2.62 2.22 1.96<br />
520 8.63 4.07 2.68 2.14 1.83 1.65<br />
540 6.90 3.21 2.14 1.77 1.56 1.44<br />
560 5.88 2.73 1.87 1.58 1.43 1.34<br />
580 4.92 2.34 1.65 1.44 1.34 1.27<br />
600 4.05 1.99 1.49 1.35 1.27 1.23<br />
620 3.43 1.76 1.38 1.29 1.25 1.21<br />
640 2.90 1.63 1.35 1.29 1.29 1.26<br />
660 2.72 1.61 1.38 1.36 1.38 1.36<br />
680 3.54 2.01 1.62 1.57 1.57 1.55<br />
700 8.45 4.23 3.07 2.62 2.38 2.22<br />
299
Table A-4-1: Continued<br />
Shade<br />
Dye Bath<br />
ID<br />
Dwell<br />
(gpl<br />
Dye Dye Bath Dwell<br />
Nip<br />
Speed Time Oxidation 100% Dye Bath Alkalinity Length Oxidation Pressures<br />
(m/min) (sec) Time (sec) Indigo) Bath pH (mV) (gpl) (m) Length (m) (psi)<br />
1134 31.09 16.7 69.5 2.314 11.89 805 5.17 8.63 36.03 70.00<br />
Yarn Skein Response Variables<br />
Yarn<br />
Count<br />
Dye<br />
route Dips<br />
Greige<br />
Weight<br />
Boil Off<br />
Weight<br />
Dyed<br />
Weight<br />
Washed<br />
Weight %COWY<br />
Total<br />
<strong>%IOWY</strong><br />
Surface<br />
<strong>%IOWY</strong> Integ<br />
Penetration<br />
Level<br />
7.1 1 only 1 6.8377 6.6735 7.0041 6.647 4.954% 0.396% 0.699% 19.1 0.57<br />
7.1 1--2 2 6.9015 6.6689 7.1094 6.6723 6.605% 0.766% 1.742% 41.1 0.44<br />
7.1 1--3 3 6.6829 6.5137 7.0283 6.5492 7.900% 1.260% 2.647% 57.0 0.48<br />
7.1 1--4 4 6.9189 6.6779 7.1999 6.7504 7.817% 1.477% 4.112% 68.9 0.36<br />
7.1 1--5 5 6.8978 6.7207 7.3111 6.8215 8.785% 1.833% 6.694% 82.5 0.27<br />
7.1 1--6 6 7.0832 6.8714 7.5302 7.0116 9.588% 2.150% 7.551% 86.2 0.28<br />
7.1 1--7 7 6.92 6.7401 7.4097 6.9168 9.935% 2.644% 10.504% 97.4 0.25<br />
% Reflectance Readings<br />
Wavelength<br />
(nm) Dip 1 Dip 2 Dip 3 Dip 4 Dip 5 Dip 6 Dip 7<br />
400 12.45 7.19 5.41 4.22 3.32 3.06 2.57<br />
420 16.76 9.88 7.09 5.40 4.11 3.77 3.00<br />
440 15.61 8.81 6.19 4.67 3.53 3.22 2.57<br />
460 13.30 7.22 5.00 3.78 2.87 2.63 2.13<br />
480 11.45 5.89 4.03 3.06 2.32 2.13 1.75<br />
500 10.08 4.99 3.41 2.61 2.02 1.88 1.57<br />
520 8.40 4.00 2.74 2.14 1.69 1.58 1.37<br />
540 6.71 3.13 2.18 1.74 1.43 1.37 1.23<br />
560 5.69 2.66 1.88 1.55 1.32 1.28 1.17<br />
580 4.77 2.27 1.66 1.42 1.25 1.22 1.13<br />
600 3.92 1.94 1.49 1.32 1.19 1.17 1.11<br />
620 3.33 1.71 1.37 1.26 1.16 1.16 1.11<br />
640 2.81 1.58 1.32 1.27 1.19 1.20 1.17<br />
660 2.65 1.57 1.36 1.34 1.29 1.31 1.29<br />
680 3.47 1.98 1.63 1.57 1.48 1.49 1.48<br />
700 8.17 4.20 3.11 2.64 2.22 2.14 1.96<br />
300
Table A-4-1: Continued<br />
Shade<br />
Dye Bath<br />
ID<br />
Dwell<br />
(gpl<br />
Dye Dye Bath Dwell<br />
Nip<br />
Speed Time Oxidation 100% Dye Bath Alkalinity Length Oxidation Pressures<br />
(m/min) (sec) Time (sec) Indigo) Bath pH (mV) (gpl) (m) Length (m) (psi)<br />
1134 31.09 16.7 69.5 2.314 11.89 805 5.17 8.63 36.03 70.00<br />
Yarn Skein Response Variables<br />
Yarn<br />
Count<br />
Dye<br />
route Dips<br />
Greige<br />
Weight<br />
Boil Off<br />
Weight<br />
Dyed<br />
Weight<br />
Washed<br />
Weight %COWY<br />
Total<br />
<strong>%IOWY</strong><br />
Surface<br />
<strong>%IOWY</strong> Integ<br />
Penetration<br />
Level<br />
8 1 only 1 6.111 5.8975 6.2071 5.8698 5.250% 0.439% 0.705% 19.3 0.62<br />
8 1--2 2 6.0613 5.8551 6.2451 5.8486 6.661% 0.863% 1.680% 39.9 0.51<br />
8 1--3 3 6.0564 5.8397 6.2566 5.8536 7.139% 1.299% 2.390% 53.5 0.54<br />
8 1--4 4 6.0814 5.8677 6.3564 5.9073 8.329% 1.593% 3.537% 65.2 0.45<br />
8 1--5 5 5.9915 5.7855 6.2681 5.8422 8.342% 2.013% 5.328% 75.8 0.38<br />
8 1--6 6 6.1051 5.8809 6.443 5.9587 9.558% 2.336% 6.044% 79.4 0.39<br />
8 1--7 7 5.4855 5.2819 5.7895 5.3765 9.610% 2.802% 8.573% 90.4 0.33<br />
% Reflectance Readings<br />
Wavelength<br />
(nm) Dip 1 Dip 2 Dip 3 Dip 4 Dip 5 Dip 6 Dip 7<br />
400 12.11 7.09 5.52 4.43 3.63 3.36 2.81<br />
420 16.32 9.72 7.25 5.69 4.53 4.14 3.39<br />
440 15.16 8.69 6.35 4.94 3.89 3.56 2.90<br />
460 12.89 7.15 5.15 3.98 3.15 2.89 2.37<br />
480 11.09 5.85 4.17 3.22 2.55 2.36 1.93<br />
500 9.75 4.99 3.54 2.75 2.23 2.07 1.71<br />
520 8.16 4.03 2.87 2.26 1.85 1.73 1.48<br />
540 6.55 3.18 2.30 1.84 1.57 1.48 1.31<br />
560 5.61 2.74 2.01 1.65 1.44 1.38 1.24<br />
580 4.75 2.35 1.78 1.50 1.34 1.30 1.19<br />
600 3.96 2.03 1.59 1.38 1.27 1.26 1.16<br />
620 3.39 1.81 1.48 1.33 1.24 1.23 1.17<br />
640 2.89 1.69 1.45 1.33 1.27 1.28 1.21<br />
660 2.75 1.69 1.49 1.41 1.36 1.38 1.34<br />
680 3.49 2.11 1.76 1.64 1.57 1.56 1.54<br />
700 7.93 4.26 3.26 2.79 2.41 2.32 2.09<br />
301
Table A-4-1: Continued<br />
Shade<br />
Dye Bath<br />
ID<br />
Dwell<br />
(gpl<br />
Dye Dye Bath Dwell<br />
Nip<br />
Speed Time Oxidation 100% Dye Bath Alkalinity Length Oxidation Pressures<br />
(m/min) (sec) Time (sec) Indigo) Bath pH (mV) (gpl) (m) Length (m) (psi)<br />
1134 31.09 16.7 69.5 2.314 11.89 805 5.17 8.63 39.40 70.00<br />
Yarn Skein Response Variables<br />
Yarn<br />
Count<br />
Dye<br />
route Dips<br />
Greige<br />
Weight<br />
Boil Off<br />
Weight<br />
Dyed<br />
Weight<br />
Washed<br />
Weight %COWY<br />
Total<br />
<strong>%IOWY</strong><br />
Surface<br />
<strong>%IOWY</strong> Integ<br />
Penetration<br />
Level<br />
12 1 only 1 3.8875 3.7511 3.9984 3.7398 6.593% 0.511% 0.811% 20.5 0.63<br />
12 1--2 2 3.9071 3.7686 4.0917 3.7811 8.573% 0.929% 1.554% 41.3 0.60<br />
12 1--3 3 4.0031 3.861 4.2138 3.8945 9.138% 1.364% 2.938% 58.4 0.46<br />
12 1--4? 4 3.9513 3.8107 4.162 3.8586 9.219% 1.941% 4.454% 70.7 0.44<br />
12 1--5? 5 4.1207 3.9709 4.398 4.047 10.756% 2.348% 5.787% 78.7 0.41<br />
12 1--6 6 3.8214 3.6823 4.1031 3.7702 11.428% 2.947% 8.498% 90.2 0.35<br />
12 1--7 7 3.9128 3.771 4.186 3.8829 11.005% 3.366% 10.167% 95.3 0.33<br />
% Reflectance Readings<br />
Wavelength<br />
(nm) Dip 1 Dip 2 Dip 3 Dip 4 Dip 5 Dip 6 Dip 7<br />
400 11.69 7.10 5.10 4.05 3.48 2.90 2.60<br />
420 15.76 9.72 6.66 5.15 4.31 3.54 3.08<br />
440 14.58 8.61 5.81 4.44 3.71 3.02 2.63<br />
460 12.37 7.03 4.71 3.58 3.01 2.46 2.17<br />
480 10.61 5.72 3.80 2.91 2.44 1.99 1.77<br />
500 9.32 4.85 3.23 2.49 2.13 1.76 1.59<br />
520 7.76 3.90 2.62 2.04 1.76 1.49 1.38<br />
540 6.22 3.07 2.10 1.69 1.50 1.30 1.25<br />
560 5.32 2.63 1.84 1.54 1.39 1.24 1.20<br />
580 4.49 2.26 1.63 1.40 1.30 1.17 1.15<br />
600 3.73 1.95 1.48 1.31 1.23 1.14 1.14<br />
620 3.19 1.74 1.39 1.27 1.22 1.13 1.14<br />
640 2.73 1.63 1.37 1.28 1.25 1.18 1.21<br />
660 2.58 1.63 1.43 1.35 1.36 1.30 1.34<br />
680 3.34 2.02 1.68 1.55 1.58 1.50 1.53<br />
700 7.54 4.14 3.08 2.57 2.39 2.10 2.00<br />
302
Table A-4-1: Continued<br />
Shade<br />
Dye Bath<br />
ID<br />
Dwell<br />
(gpl<br />
Dye Dye Bath Dwell<br />
Nip<br />
Speed Time Oxidation 100% Dye Bath Alkalinity Length Oxidation Pressures<br />
(m/min) (sec) Time (sec) Indigo) Bath pH (mV) (gpl) (m) Length (m) (psi)<br />
t3688 32.92 15.8 65.7 2.417 11.82 867 4.93 8.63 39.40 70.00<br />
Yarn Skein Response Variables<br />
Yarn<br />
Count<br />
Dye<br />
route Dips<br />
Greige<br />
Weight<br />
Boil Off<br />
Weight<br />
Dyed<br />
Weight<br />
Washed<br />
Weight %COWY<br />
Total<br />
<strong>%IOWY</strong><br />
Surface<br />
<strong>%IOWY</strong> Integ<br />
Penetration<br />
Level<br />
7.1 1 only 1 7.1993 6.9937 7.2912 7.0139 4.254% 0.402% 0.857% 22.6 0.47<br />
7.1 1--2 2 7.214 7.0135 7.4253 7.0657 5.872% 0.766% 1.776% 44.9 0.43<br />
7.1 1--3 3 7.2494 7.0394 7.4845 7.1113 6.323% 1.060% 2.900% 58.0 0.37<br />
7.1 1--4 4 7.1546 6.9528 7.5403 7.0535 8.450% 1.501% 5.082% 74.7 0.30<br />
7.1 1--5 5 7.1444 6.9383 7.4825 7.0733 7.843% 1.825% 6.725% 83.3 0.27<br />
7.1 1--6 6 7.1714 6.9694 7.486 7.1378 7.412% 2.167% 8.503% 90.2 0.25<br />
7.1 1--6,6 7 7.1765 6.9675 7.5829 7.1726 8.832% 2.572% 11.771% 99.3 0.22<br />
% Reflectance Readings<br />
Wavelength<br />
(nm) Dip 1 Dip 2 Dip 3 Dip 4 Dip 5 Dip 6 Dip 7<br />
400 11.30 6.64 5.27 3.80 3.21 2.80 2.40<br />
420 15.28 9.01 6.91 4.80 3.97 3.34 2.83<br />
440 14.10 8.00 6.05 4.15 3.42 2.87 2.44<br />
460 11.93 6.57 4.90 3.36 2.79 2.38 2.05<br />
480 10.17 5.33 3.94 2.71 2.26 1.94 1.69<br />
500 8.89 4.53 3.34 2.34 1.98 1.73 1.53<br />
520 7.27 3.61 2.67 1.89 1.65 1.47 1.34<br />
540 5.76 2.85 2.14 1.59 1.43 1.32 1.22<br />
560 4.86 2.41 1.84 1.43 1.32 1.25 1.16<br />
580 4.04 2.08 1.63 1.33 1.24 1.19 1.12<br />
600 3.32 1.80 1.46 1.26 1.19 1.16 1.11<br />
620 2.85 1.62 1.37 1.23 1.17 1.17 1.11<br />
640 2.45 1.52 1.33 1.25 1.21 1.22 1.15<br />
660 2.32 1.53 1.36 1.33 1.29 1.34 1.26<br />
680 3.05 1.90 1.63 1.53 1.48 1.55 1.44<br />
700 7.29 3.89 3.07 2.45 2.18 2.10 1.88<br />
303
Table A-4-1: Continued<br />
Shade<br />
Dye Bath<br />
ID<br />
Dwell<br />
(gpl<br />
Dye Dye Bath Dwell<br />
Nip<br />
Speed Time Oxidation 100% Dye Bath Alkalinity Length Oxidation Pressures<br />
(m/min) (sec) Time (sec) Indigo) Bath pH (mV) (gpl) (m) Length (m) (psi)<br />
1156 36.58 14.1 59.1 2.572 11.72 797 5.55 8.63 39.40 70.00<br />
Yarn Skein Response Variables<br />
Yarn<br />
Count<br />
Dye<br />
route Dips<br />
Greige<br />
Weight<br />
Boil Off<br />
Weight<br />
Dyed<br />
Weight<br />
Washed<br />
Weight %COWY<br />
Total<br />
<strong>%IOWY</strong><br />
Surface<br />
<strong>%IOWY</strong> Integ<br />
Penetration<br />
Level<br />
6.3 1 only 1 7.556 7.2736 7.583 7.2751 4.25% 0.333% 0.773% 18.7 0.43<br />
6.3 1--2 2 7.4803 7.2056 7.651 7.2164 6.18% 0.639% 1.381% 38.2 0.46<br />
6.3 1--3 3 7.6443 7.3585 7.8813 7.3934 7.10% 0.961% 2.715% 56.2 0.35<br />
6.3 1--4 4 7.8569 7.5632 8.1077 7.6298 7.20% 1.262% 3.559% 63.9 0.35<br />
6.3 1--5 5 7.5259 7.2366 7.8535 7.3429 8.52% 1.795% 5.705% 78.3 0.31<br />
6.3 1--6 6 7.7609 7.4636 8.1188 7.5897 8.78% 2.090% 6.706% 83.2 0.31<br />
6.3 1--7 7 7.7295 7.4312 8.0923 7.6072 8.90% 2.432% 8.581% 90.5 0.28<br />
% Reflectance Readings<br />
Wavelength<br />
(nm) Dip 1 Dip 2 Dip 3 Dip 4 Dip 5 Dip 6 Dip 7<br />
400 12.60 7.55 5.36 4.57 3.46 3.11 2.66<br />
420 16.95 10.42 7.09 5.96 4.35 3.84 3.19<br />
440 15.82 9.38 6.21 5.17 3.74 3.28 2.73<br />
460 13.54 7.73 5.03 4.15 3.02 2.66 2.26<br />
480 11.68 6.31 4.05 3.35 2.44 2.14 1.84<br />
500 10.26 5.36 3.41 2.83 2.10 1.87 1.63<br />
520 8.57 4.30 2.76 2.32 1.76 1.60 1.44<br />
540 6.85 3.38 2.21 1.89 1.50 1.41 1.31<br />
560 5.79 2.86 1.90 1.66 1.38 1.32 1.24<br />
580 4.82 2.43 1.67 1.50 1.29 1.25 1.21<br />
600 3.95 2.06 1.50 1.39 1.25 1.23 1.20<br />
620 3.36 1.82 1.41 1.33 1.24 1.24 1.24<br />
640 2.85 1.68 1.39 1.36 1.30 1.32 1.35<br />
660 2.70 1.65 1.42 1.42 1.43 1.47 1.52<br />
680 3.56 2.11 1.72 1.69 1.66 1.71 1.76<br />
700 8.59 4.57 3.24 2.92 2.46 2.37 2.24<br />
304
Table A-4-1: Continued<br />
Shade<br />
Dye Bath<br />
ID<br />
Dwell<br />
(gpl<br />
Dye Dye Bath Dwell<br />
Nip<br />
Speed Time Oxidation 100% Dye Bath Alkalinity Length Oxidation Pressures<br />
(m/min) (sec) Time (sec) Indigo) Bath pH (mV) (gpl) (m) Length (m) (psi)<br />
1156 36.58 14.1 59.1 2.572 11.72 797 5.55 8.63 39.40 70.00<br />
Yarn Skein Response Variables<br />
Yarn<br />
Count<br />
Dye<br />
route Dips<br />
Greige<br />
Weight<br />
Boil Off<br />
Weight<br />
Dyed<br />
Weight<br />
Washed<br />
Weight %COWY<br />
Total<br />
<strong>%IOWY</strong><br />
Surface<br />
<strong>%IOWY</strong> Integ<br />
Penetration<br />
Level<br />
7.1 1 only 1 6.9734 6.7622 7.0402 6.7304 4.11% 0.318% 0.744% 17.4 0.43<br />
7.1 1--2 2 7.0212 6.7926 7.1906 6.8108 5.86% 0.591% 1.365% 37.8 0.43<br />
7.1 1--3 3 6.8123 6.5915 7.086 6.6331 7.50% 0.987% 2.524% 54.2 0.39<br />
7.1 1--4 4 6.9715 6.7395 7.2619 6.824 7.75% 1.423% 4.099% 68.1 0.35<br />
7.1 1--5 5 6.9565 6.7298 7.3058 6.8297 8.56% 1.724% 5.340% 76.3 0.32<br />
7.1 1--6 6 6.9443 6.7022 7.3574 6.8302 9.78% 2.231% 6.720% 83.3 0.33<br />
7.1 1--7 7 6.8847 6.6635 7.2592 6.8068 8.94% 2.496% 7.807% 87.8 0.32<br />
% Reflectance Readings<br />
Wavelength<br />
(nm) Dip 1 Dip 2 Dip 3 Dip 4 Dip 5 Dip 6 Dip 7<br />
400 13.21 7.64 5.59 4.24 3.59 3.13 2.82<br />
420 17.66 10.55 7.38 5.42 4.50 3.81 3.39<br />
440 16.52 9.51 6.47 4.69 3.85 3.26 2.88<br />
460 14.16 7.84 5.24 3.79 3.11 2.65 2.37<br />
480 12.27 6.40 4.23 3.06 2.50 2.14 1.93<br />
500 10.81 5.44 3.57 2.58 2.15 1.87 1.69<br />
520 9.11 4.35 2.87 2.11 1.79 1.59 1.48<br />
540 7.31 3.42 2.30 1.75 1.53 1.39 1.34<br />
560 6.22 2.90 1.97 1.56 1.41 1.32 1.28<br />
580 5.20 2.45 1.74 1.44 1.33 1.26 1.24<br />
600 4.28 2.08 1.55 1.34 1.28 1.24 1.23<br />
620 3.61 1.83 1.44 1.30 1.27 1.25 1.25<br />
640 3.06 1.67 1.41 1.33 1.34 1.34 1.37<br />
660 2.88 1.66 1.47 1.42 1.47 1.50 1.56<br />
680 3.79 2.10 1.79 1.66 1.69 1.71 1.82<br />
700 9.00 4.60 3.40 2.77 2.53 2.35 2.35<br />
305
Table A-4-1: Continued<br />
Shade<br />
Dye Bath<br />
ID<br />
Dwell<br />
(gpl<br />
Dye Dye Bath Dwell<br />
Nip<br />
Speed Time Oxidation 100% Dye Bath Alkalinity Length Oxidation Pressures<br />
(m/min) (sec) Time (sec) Indigo) Bath pH (mV) (gpl) (m) Length (m) (psi)<br />
1156 36.58 14.1 59.1 2.572 11.72 797 5.55 8.63 39.40 70.00<br />
Yarn Skein Response Variables<br />
Yarn Dye<br />
Greige Boil Off Dyed Washed<br />
Total Surface<br />
Penetration<br />
Count route Dips Weight Weight Weight Weight %COWY <strong>%IOWY</strong> <strong>%IOWY</strong> Integ Level<br />
7.1 2 only 1 6.983 6.7611 7.0953 6.7585 4.94% 0.399% 0.812% 20.5 0.49<br />
7.1 2,2 2 6.8036 6.5773 6.9899 6.5918 6.27% 0.728% 1.443% 39.4 0.50<br />
7.1 2,2-3 3 7.0364 6.7992 7.3311 6.8485 7.82% 1.129% 2.753% 56.6 0.41<br />
7.1 2,2-4 4 6.9084 6.6972 7.2414 6.7656 8.13% 1.515% 3.770% 65.6 0.40<br />
7.1 2,2-5 5 7.0571 6.8152 7.4134 6.9268 8.78% 1.980% 5.695% 78.2 0.35<br />
% Reflectance Readings<br />
Wavelength<br />
(nm) Dip 1 Dip 2 Dip 3 Dip 4 Dip 5 Dip 6 Dip 7<br />
400 11.87 7.40 5.40 4.41 3.51<br />
420 15.95 10.19 7.11 5.69 4.36<br />
440 14.82 9.12 6.18 4.89 3.73<br />
460 12.62 7.49 4.98 3.92 3.01<br />
480 10.86 6.11 4.01 3.15 2.43<br />
500 9.52 5.18 3.38 2.67 2.09<br />
520 7.89 4.15 2.72 2.18 1.75<br />
540 6.30 3.27 2.19 1.81 1.50<br />
560 5.33 2.77 1.89 1.62 1.38<br />
580 4.44 2.35 1.68 1.48 1.30<br />
600 3.65 2.01 1.50 1.40 1.25<br />
620 3.12 1.79 1.40 1.34 1.24<br />
640 2.67 1.67 1.37 1.39 1.31<br />
660 2.55 1.66 1.41 1.50 1.45<br />
680 3.35 2.12 1.71 1.76 1.68<br />
700 7.92 4.47 3.21 2.90 2.48<br />
306
Table A-4-1: Continued<br />
Shade<br />
Dye Bath<br />
ID<br />
Dwell<br />
(gpl<br />
Dye Dye Bath Dwell<br />
Nip<br />
Speed Time Oxidation 100% Dye Bath Alkalinity Length Oxidation Pressures<br />
(m/min) (sec) Time (sec) Indigo) Bath pH (mV) (gpl) (m) Length (m) (psi)<br />
1156 36.58 14.1 59.1 2.572 11.72 797 5.55 8.63 39.40 70.00<br />
Yarn Skein Response Variables<br />
Yarn<br />
Count<br />
Dye<br />
route Dips<br />
Greige<br />
Weight<br />
Boil Off<br />
Weight<br />
Dyed<br />
Weight<br />
Washed<br />
Weight %COWY<br />
Total<br />
<strong>%IOWY</strong><br />
Surface<br />
<strong>%IOWY</strong> Integ<br />
Penetration<br />
Level<br />
8 1 only 1 6.0265 5.8348 6.1145 5.8318 4.79% 0.369% 0.771% 18.6 0.48<br />
8 1--2 2 6.0783 5.8852 6.2864 5.9 6.82% 0.729% 1.337% 37.3 0.55<br />
8 1--3 3 5.9853 5.7931 6.2608 5.8401 8.07% 1.154% 2.445% 53.3 0.47<br />
8 1--4 4 6.09 5.8885 6.3461 5.96 7.77% 1.532% 3.925% 66.8 0.39<br />
8 1--5 5 6.0606 5.8632 6.3572 5.9571 8.43% 1.927% 5.307% 76.1 0.36<br />
8 1--6 6 6.0638 5.8725 6.4474 5.9869 9.79% 2.310% 6.765% 83.5 0.34<br />
8 1--7 7 6.0695 5.8727 6.4365 6.0203 9.60% 2.687% 8.083% 88.8 0.33<br />
% Reflectance Readings<br />
Wavelength<br />
(nm) Dip 1 Dip 2 Dip 3 Dip 4 Dip 5 Dip 6 Dip 7<br />
400 12.86 7.76 5.69 4.39 3.66 3.17 2.83<br />
420 17.19 10.61 7.52 5.65 4.60 3.89 3.37<br />
440 15.96 9.55 6.56 4.88 3.93 3.30 2.87<br />
460 13.60 7.88 5.32 3.93 3.17 2.66 2.35<br />
480 11.74 6.46 4.30 3.18 2.57 2.16 1.91<br />
500 10.31 5.49 3.63 2.70 2.21 1.88 1.70<br />
520 8.63 4.40 2.91 2.20 1.82 1.58 1.46<br />
540 6.91 3.46 2.33 1.80 1.55 1.40 1.33<br />
560 5.85 2.93 2.01 1.60 1.42 1.32 1.27<br />
580 4.87 2.48 1.76 1.45 1.32 1.25 1.21<br />
600 4.00 2.11 1.58 1.35 1.27 1.23 1.22<br />
620 3.39 1.87 1.46 1.28 1.24 1.22 1.22<br />
640 2.87 1.73 1.43 1.30 1.29 1.30 1.33<br />
660 2.70 1.70 1.48 1.38 1.42 1.46 1.51<br />
680 3.58 2.18 1.78 1.63 1.65 1.70 1.75<br />
700 8.55 4.72 3.43 2.80 2.53 2.37 2.26<br />
307
Table A-4-1: Continued<br />
Shade<br />
Dye Bath<br />
ID<br />
Dwell<br />
(gpl<br />
Dye Dye Bath Dwell<br />
Nip<br />
Speed Time Oxidation 100% Dye Bath Alkalinity Length Oxidation Pressures<br />
(m/min) (sec) Time (sec) Indigo) Bath pH (mV) (gpl) (m) Length (m) (psi)<br />
1156 36.58 14.1 59.1 2.572 11.72 797 5.55 8.63 39.40 70.00<br />
Yarn Skein Response Variables<br />
Yarn Dye<br />
Greige Boil Off Dyed Washed<br />
Total Surface<br />
Penetration<br />
Count route Dips Weight Weight Weight Weight %COWY <strong>%IOWY</strong> <strong>%IOWY</strong> Integ Level<br />
8 2 only 1 5.9864 5.791 6.123 5.7978 5.73% 0.438% 0.820% 20.9 0.53<br />
8 2,2 2 6.1299 5.9379 6.3578 5.9582 7.07% 0.804% 1.480% 40.0 0.54<br />
8 2,2-3 3 5.9995 5.8051 6.2847 5.847 8.26% 1.153% 2.411% 53.0 0.48<br />
8 2,2-4 4 6.0744 5.8782 6.3371 5.9483 7.81% 1.555% 3.695% 65.0 0.42<br />
8 2,2-5 5 6.0165 5.8274 6.318782 5.9211 8.43% 2.071% 5.329% 76.2 0.39<br />
% Reflectance Readings<br />
Wavelength<br />
(nm) Dip 1 Dip 2 Dip 3 Dip 4 Dip 5 Dip 6 Dip 7<br />
400 11.80 7.27 5.67 4.49 3.61<br />
420 15.89 9.96 7.47 5.78 4.50<br />
440 14.70 8.86 6.52 4.99 3.83<br />
460 12.48 7.27 5.28 4.01 3.08<br />
480 10.71 5.94 4.26 3.25 2.49<br />
500 9.40 5.05 3.61 2.75 2.16<br />
520 7.75 4.04 2.91 2.23 1.79<br />
540 6.19 3.19 2.34 1.83 1.54<br />
560 5.24 2.73 2.03 1.64 1.43<br />
580 4.36 2.32 1.78 1.49 1.33<br />
600 3.60 1.99 1.61 1.39 1.29<br />
620 3.05 1.78 1.47 1.33 1.26<br />
640 2.62 1.66 1.45 1.36 1.34<br />
660 2.51 1.67 1.51 1.47 1.48<br />
680 3.31 2.10 1.82 1.73 1.71<br />
700 7.83 4.36 3.43 2.90 2.54<br />
308
Table A-4-1: Continued<br />
Shade<br />
Dye Bath<br />
ID<br />
Dwell<br />
(gpl<br />
Dye Dye Bath Dwell<br />
Nip<br />
Speed Time Oxidation 100% Dye Bath Alkalinity Length Oxidation Pressures<br />
(m/min) (sec) Time (sec) Indigo) Bath pH (mV) (gpl) (m) Length (m) (psi)<br />
1156 36.58 14.1 59.1 2.572 11.72 797 5.55 8.63 39.40 70.00<br />
Yarn Skein Response Variables<br />
Yarn<br />
Count<br />
Dye<br />
route Dips<br />
Greige<br />
Weight<br />
Boil Off<br />
Weight<br />
Dyed<br />
Weight<br />
Washed<br />
Weight %COWY<br />
Total<br />
<strong>%IOWY</strong><br />
Surface<br />
<strong>%IOWY</strong> Integ<br />
Penetration<br />
Level<br />
12 1 only 1 3.9582 3.8257 4.0678 3.8273 6.33% 0.472% 0.812% 20.6 0.58<br />
12 1--2 2 3.9604 3.8242 4.1419 3.8493 8.31% 0.882% 1.542% 41.1 0.57<br />
12 1--3 3 3.9143 3.7782 4.148 3.8214 9.79% 1.407% 2.839% 57.4 0.50<br />
12 1--4 4 3.8219 3.688 4.0574 3.7553 10.02% 1.860% 4.625% 71.8 0.40<br />
12 1--5 5 3.8788 3.7391 4.1079 3.8222 9.86% 2.278% 6.089% 80.3 0.37<br />
12 1--6 6 3.8516 3.7129 4.1444 3.8153 11.62% 2.747% 8.421% 90.0 0.33<br />
12 1--7 7 3.9529 3.8151 4.2469 3.9385 11.32% 3.149% 9.766% 94.2 0.32<br />
% Reflectance Readings<br />
Wavelength<br />
(nm) Dip 1 Dip 2 Dip 3 Dip 4 Dip 5 Dip 6 Dip 7<br />
400 11.88 7.26 5.34 4.05 3.43 2.90 2.64<br />
420 15.83 9.93 6.96 5.12 4.23 3.53 3.13<br />
440 14.66 8.84 6.07 4.40 3.62 2.99 2.65<br />
460 12.47 7.23 4.91 3.55 2.93 2.43 2.18<br />
480 10.74 5.90 3.96 2.87 2.37 1.97 1.78<br />
500 9.44 5.02 3.34 2.43 2.05 1.72 1.57<br />
520 7.82 4.00 2.68 1.98 1.70 1.46 1.36<br />
540 6.28 3.15 2.16 1.65 1.46 1.30 1.25<br />
560 5.33 2.66 1.86 1.48 1.35 1.23 1.19<br />
580 4.45 2.26 1.65 1.36 1.27 1.17 1.16<br />
600 3.68 1.94 1.49 1.29 1.23 1.17 1.17<br />
620 3.13 1.70 1.38 1.26 1.21 1.16 1.19<br />
640 2.70 1.57 1.36 1.31 1.29 1.26 1.29<br />
660 2.60 1.57 1.43 1.42 1.40 1.42 1.48<br />
680 3.44 2.00 1.73 1.64 1.63 1.64 1.69<br />
700 7.93 4.30 3.22 2.64 2.41 2.22 2.17<br />
309
Table A-4-1: Continued<br />
Shade<br />
Dye Bath<br />
ID<br />
Dwell<br />
(gpl<br />
Dye Dye Bath Dwell<br />
Nip<br />
Speed Time Oxidation 100% Dye Bath Alkalinity Length Oxidation Pressures<br />
(m/min) (sec) Time (sec) Indigo) Bath pH (mV) (gpl) (m) Length (m) (psi)<br />
1157 32.92 15.9 65.7 2.497 12.41 847 3.67 8.63 39.40 70.00<br />
Yarn Skein Response Variables<br />
Yarn<br />
Count<br />
Dye<br />
route Dips<br />
Greige<br />
Weight<br />
Boil Off<br />
Weight<br />
Dyed<br />
Weight<br />
Washed<br />
Weight %COWY<br />
Total<br />
<strong>%IOWY</strong><br />
Surface<br />
<strong>%IOWY</strong> Integ<br />
Penetration<br />
Level<br />
6.3 1 only 1 8.142 7.9097 8.2668 7.933 4.51% 0.389% 0.829% 21.4 0.47<br />
6.3 1--2 2 8.1133 7.8832 8.3604 7.9382 6.05% 0.620% 1.543% 41.2 0.40<br />
6.3 1--3 3 8.1656 7.9386 8.458 8.0229 6.54% 0.961% 3.340% 62.1 0.29<br />
6.3 1--4 4 8.0574 7.8317 8.3743 7.9624 6.93% 1.433% 4.997% 74.2 0.29<br />
6.3 1--5 5 8.0475 7.8235 8.4644 7.9766 8.19% 1.799% 7.223% 85.5 0.25<br />
6.3 1--6 6 8.1859 7.9489 8.5703 8.1472 7.82% 2.163% 8.439% 90.0 0.26<br />
6.3 1--6,6 7 7.9508 7.719432 8.3508 7.937 8.18% 2.453% 9.925% 94.6 0.25<br />
% Reflectance Readings<br />
Wavelength<br />
(nm) Dip 1 Dip 2 Dip 3 Dip 4 Dip 5 Dip 6 Dip 7<br />
400 11.83 7.30 4.93 3.87 3.17 2.83 2.55<br />
420 15.90 10.00 6.42 4.88 3.90 3.39 3.00<br />
440 14.64 8.87 5.57 4.19 3.33 2.89 2.56<br />
460 12.40 7.26 4.51 3.39 2.71 2.37 2.12<br />
480 10.61 5.91 3.64 2.75 2.20 1.93 1.76<br />
500 9.29 5.02 3.09 2.37 1.92 1.72 1.58<br />
520 7.64 3.99 2.48 1.93 1.59 1.47 1.38<br />
540 6.09 3.14 1.99 1.62 1.38 1.32 1.26<br />
560 5.11 2.65 1.72 1.45 1.27 1.24 1.21<br />
580 4.24 2.24 1.52 1.33 1.20 1.18 1.17<br />
600 3.49 1.92 1.38 1.25 1.16 1.17 1.17<br />
620 2.98 1.70 1.30 1.21 1.16 1.18 1.18<br />
640 2.57 1.60 1.30 1.26 1.24 1.28 1.29<br />
660 2.45 1.59 1.34 1.36 1.35 1.43 1.45<br />
680 3.20 2.01 1.58 1.57 1.58 1.62 1.66<br />
700 7.71 4.28 2.95 2.54 2.28 2.16 2.07<br />
310
Table A-4-1: Continued<br />
Shade<br />
Dye Bath<br />
ID<br />
Dwell<br />
(gpl<br />
Dye Dye Bath Dwell<br />
Nip<br />
Speed Time Oxidation 100% Dye Bath Alkalinity Length Oxidation Pressures<br />
(m/min) (sec) Time (sec) Indigo) Bath pH (mV) (gpl) (m) Length (m) (psi)<br />
1157 32.92 15.9 65.7 2.497 12.41 847 3.67 8.63 39.40 70.00<br />
Yarn Skein Response Variables<br />
Yarn<br />
Count<br />
Dye<br />
route Dips<br />
Greige<br />
Weight<br />
Boil Off<br />
Weight<br />
Dyed<br />
Weight<br />
Washed<br />
Weight %COWY<br />
Total<br />
<strong>%IOWY</strong><br />
Surface<br />
<strong>%IOWY</strong> Integ<br />
Penetration<br />
Level<br />
7.1 1 only 1 7.1734 6.9485 7.2544 6.9731 4.40% 0.434% 0.882% 23.7 0.49<br />
7.1 1--2 2 7.4045 7.1267 7.5365 7.1713 5.75% 0.768% 1.674% 43.3 0.46<br />
7.1 1--3 3 7.4093 7.2019 7.6543 7.2853 6.28% 1.143% 3.005% 59.0 0.38<br />
7.1 1--4 4 7.421 7.2128 7.7295 7.3259 7.16% 1.550% 4.910% 73.7 0.32<br />
7.1 1--5 5 7.4693 7.2597 7.8361 7.4102 7.94% 1.943% 6.729% 83.3 0.29<br />
7.1 1--6 6 7.1638 6.9308 7.4922 7.0949 8.10% 2.331% 7.859% 88.0 0.30<br />
7.1 1--6,6 7 7.3332 7.1254 7.7125 7.3283 8.24% 2.702% 9.470% 93.3 0.29<br />
% Reflectance Readings<br />
Wavelength<br />
(nm) Dip 1 Dip 2 Dip 3 Dip 4 Dip 5 Dip 6 Dip 7<br />
400 11.16 7.05 5.30 3.93 3.28 2.90 2.57<br />
420 15.05 9.55 6.86 4.91 3.99 3.44 2.95<br />
440 13.78 8.42 5.95 4.22 3.42 2.92 2.52<br />
460 11.56 6.89 4.80 3.41 2.79 2.40 2.10<br />
480 9.85 5.60 3.87 2.77 2.28 1.98 1.75<br />
500 8.60 4.75 3.28 2.39 1.98 1.75 1.59<br />
520 6.99 3.77 2.62 1.93 1.64 1.50 1.38<br />
540 5.54 2.98 2.09 1.62 1.42 1.35 1.28<br />
560 4.66 2.52 1.82 1.46 1.32 1.27 1.23<br />
580 3.84 2.13 1.59 1.34 1.23 1.22 1.20<br />
600 3.17 1.85 1.45 1.27 1.19 1.21 1.21<br />
620 2.69 1.63 1.33 1.22 1.16 1.21 1.22<br />
640 2.34 1.56 1.34 1.27 1.23 1.30 1.34<br />
660 2.24 1.56 1.38 1.36 1.33 1.45 1.54<br />
680 2.96 1.94 1.64 1.55 1.51 1.64 1.77<br />
700 7.06 4.08 3.09 2.50 2.22 2.16 2.18<br />
311
Table A-4-1: Continued<br />
Shade<br />
Dye Bath<br />
ID<br />
Dwell<br />
(gpl<br />
Dye Dye Bath Dwell<br />
Nip<br />
Speed Time Oxidation 100% Dye Bath Alkalinity Length Oxidation Pressures<br />
(m/min) (sec) Time (sec) Indigo) Bath pH (mV) (gpl) (m) Length (m) (psi)<br />
1157 32.92 15.9 65.7 2.497 12.41 847 3.67 8.63 39.40 70.00<br />
Yarn Skein Response Variables<br />
Yarn<br />
Count<br />
Dye<br />
route Dips<br />
Greige<br />
Weight<br />
Boil Off<br />
Weight<br />
Dyed<br />
Weight<br />
Washed<br />
Weight %COWY<br />
Total<br />
<strong>%IOWY</strong><br />
Surface<br />
<strong>%IOWY</strong> Integ<br />
Penetration<br />
Level<br />
8 1 only 1 9.5909 9.3454 9.7845 9.3589 4.70% 0.405% 0.852% 22.4 0.48<br />
8 1--2 2 9.8043 9.5337 10.0859 9.6053 5.79% 0.731% 1.610% 42.3 0.45<br />
8 1--3 3 9.5334 9.2729 9.8587 9.3787 6.32% 1.176% 3.190% 60.7 0.37<br />
8 1--4 4 9.4579 9.1968 9.8563 9.3389 7.17% 1.553% 5.139% 75.1 0.30<br />
8 1--5 5 9.736 9.4737 10.2325 9.6579 8.01% 1.877% 6.661% 83.0 0.28<br />
8 1--6 6 9.6276 9.3484 10.0819 9.5725 7.85% 2.304% 9.218% 92.5 0.25<br />
8 1--6,6 7 9.6693 9.4075 10.1896 9.6689 8.31% 2.705% 10.476% 96.1 0.26<br />
% Reflectance Readings<br />
Wavelength<br />
(nm) Dip 1 Dip 2 Dip 3 Dip 4 Dip 5 Dip 6 Dip 7<br />
400 11.41 7.09 5.03 3.84 3.28 2.77 2.48<br />
420 15.32 9.77 6.59 4.89 4.09 3.35 2.93<br />
440 14.10 8.65 5.71 4.19 3.48 2.85 2.49<br />
460 11.91 7.08 4.61 3.38 2.83 2.34 2.08<br />
480 10.20 5.75 3.72 2.74 2.28 1.90 1.71<br />
500 8.93 4.89 3.16 2.36 2.00 1.69 1.54<br />
520 7.34 3.89 2.55 1.92 1.65 1.44 1.35<br />
540 5.84 3.07 2.03 1.60 1.43 1.28 1.24<br />
560 4.91 2.58 1.76 1.44 1.31 1.20 1.19<br />
580 4.06 2.19 1.56 1.31 1.23 1.15 1.16<br />
600 3.35 1.87 1.41 1.24 1.19 1.13 1.16<br />
620 2.86 1.67 1.32 1.19 1.17 1.13 1.17<br />
640 2.49 1.57 1.32 1.22 1.23 1.22 1.29<br />
660 2.40 1.58 1.36 1.30 1.34 1.35 1.46<br />
680 3.16 2.01 1.61 1.51 1.53 1.56 1.67<br />
700 7.42 4.21 2.99 2.46 2.26 2.09 2.07<br />
312
Table A-4-1: Continued<br />
Shade<br />
Dye Bath<br />
ID<br />
Dwell<br />
(gpl<br />
Dye Dye Bath Dwell<br />
Nip<br />
Speed Time Oxidation 100% Dye Bath Alkalinity Length Oxidation Pressures<br />
(m/min) (sec) Time (sec) Indigo) Bath pH (mV) (gpl) (m) Length (m) (psi)<br />
X3254 27.43 18.9 78.8 2.614 12.29 778 2.85 8.63 39.40 70.00<br />
Yarn Skein Response Variables<br />
Yarn Dye<br />
Greige Boil Off Dyed Washed<br />
Total Surface<br />
Penetration<br />
Count route Dips Weight Weight Weight Weight %COWY <strong>%IOWY</strong> <strong>%IOWY</strong> Integ Level<br />
6.3 1 only 1 7.0863 6.8354 7.0327 6.832 2.89% 0.457% 0.861% 22.8 0.53<br />
6.3 1--2 2 7.0547 6.7858 7.0644 6.8202 4.11% 0.888% 1.643% 42.8 0.54<br />
6.3 1--3 3 7.1753 6.9132 7.2362 6.973 4.67% 1.367% 2.886% 57.9 0.47<br />
6.3 1--5 5 7.2079 6.9466 7.3506 7.0718 5.82% 2.223% 6.482% 82.2 0.34<br />
% Reflectance Readings<br />
Wavelength<br />
(nm) Dip 1 Dip 2 Dip 3 Dip 4 Dip 5 Dip 6 Dip 7<br />
400 10.98 6.81 5.15 3.19<br />
420 14.90 9.23 6.65 3.82<br />
440 13.81 8.16 5.78 3.26<br />
460 11.67 6.64 4.65 2.64<br />
480 9.97 5.41 3.76 2.17<br />
500 8.73 4.59 3.18 1.87<br />
520 7.14 3.68 2.58 1.60<br />
540 5.68 2.92 2.08 1.40<br />
560 4.79 2.50 1.82 1.32<br />
580 4.00 2.17 1.64 1.28<br />
600 3.30 1.89 1.50 1.26<br />
620 2.84 1.74 1.45 1.30<br />
640 2.45 1.67 1.46 1.41<br />
660 2.35 1.74 1.57 1.60<br />
680 3.06 2.11 1.87 1.81<br />
700 7.14 4.11 3.24 2.46<br />
313
Table A-4-1: Continued<br />
Shade<br />
Dye Bath<br />
ID<br />
Dwell<br />
(gpl<br />
Dye Dye Bath Dwell<br />
Nip<br />
Speed Time Oxidation 100% Dye Bath Alkalinity Length Oxidation Pressures<br />
(m/min) (sec) Time (sec) Indigo) Bath pH (mV) (gpl) (m) Length (m) (psi)<br />
1156 36.58 14.1 59.1 2.716 11.94 836 6.06 8.63 39.40 70.00<br />
Yarn Skein Response Variables<br />
Yarn<br />
Count<br />
Dye<br />
route Dips<br />
Greige<br />
Weight<br />
Boil Off<br />
Weight<br />
Dyed<br />
Weight<br />
Washed<br />
Weight %COWY<br />
Total<br />
<strong>%IOWY</strong><br />
Surface<br />
<strong>%IOWY</strong> Integ<br />
Penetration<br />
Level<br />
7.1 1 only 1 7.0846 6.8944 7.2006 6.9102 4.44% 0.395% 0.825% 21.1 0.48<br />
7.1 1--2 2 7.2738 7.0726 7.5669 7.1244 6.99% 0.764% 1.694% 43.6 0.45<br />
7.1 1--3 3 7.2817 7.0866 7.684 7.1666 8.43% 1.146% 3.115% 60.1 0.37<br />
7.1 1--4 4 7.2632 7.0713 7.6334 7.1794 7.95% 1.439% 4.487% 70.9 0.32<br />
7.1 1--5 5 7.2981 7.0959 7.7082 7.2403 8.63% 1.977% 7.020% 84.6 0.28<br />
7.1 1--6 6 7.2366 7.0459 7.7565 7.2116 10.09% 2.212% 8.471% 90.1 0.26<br />
7.1 1--7 7 7.3062 7.1145 7.7676 7.3076 9.18% 2.571% 10.845% 97.1 0.24<br />
% Reflectance Readings<br />
Wavelength<br />
(nm) Dip 1 Dip 2 Dip 3 Dip 4 Dip 5 Dip 6 Dip 7<br />
400 11.54 6.73 5.02 4.06 3.11 2.80 2.50<br />
420 15.49 9.16 6.50 5.14 3.80 3.38 2.95<br />
440 14.41 8.16 5.71 4.45 3.26 2.91 2.52<br />
460 12.27 6.71 4.62 3.58 2.65 2.37 2.08<br />
480 10.57 5.49 3.74 2.90 2.16 1.93 1.71<br />
500 9.27 4.65 3.17 2.47 1.87 1.70 1.53<br />
520 7.65 3.70 2.54 2.00 1.56 1.44 1.32<br />
540 6.13 2.93 2.04 1.67 1.37 1.30 1.22<br />
560 5.18 2.49 1.77 1.50 1.29 1.23 1.17<br />
580 4.31 2.13 1.58 1.38 1.23 1.18 1.13<br />
600 3.57 1.84 1.43 1.31 1.21 1.17 1.14<br />
620 3.07 1.68 1.38 1.29 1.23 1.22 1.18<br />
640 2.62 1.57 1.34 1.30 1.30 1.28 1.26<br />
660 2.54 1.60 1.41 1.44 1.46 1.46 1.46<br />
680 3.31 1.98 1.68 1.66 1.66 1.66 1.70<br />
700 7.75 4.10 3.07 2.67 2.31 2.19 2.12<br />
314
Table A-4-1: Continued<br />
Shade<br />
Dye Bath<br />
ID<br />
Dwell<br />
(gpl<br />
Dye Dye Bath Dwell<br />
Nip<br />
Speed Time Oxidation 100% Dye Bath Alkalinity Length Oxidation Pressures<br />
(m/min) (sec) Time (sec) Indigo) Bath pH (mV) (gpl) (m) Length (m) (psi)<br />
1156 36.58 14.1 59.1 2.716 11.94 836 6.06 8.63 39.40 70.00<br />
Yarn Skein Response Variables<br />
Yarn Dye<br />
Greige Boil Off Dyed Washed<br />
Total Surface<br />
Penetration<br />
Count route Dips Weight Weight Weight Weight %COWY <strong>%IOWY</strong> <strong>%IOWY</strong> Integ Level<br />
8 1 only 1 9.157 8.8285 9.285 8.8582 5.17% 0.448% 0.828% 21.3 0.54<br />
8 1--2 2 9.2187 8.8819 9.5447 8.9483 7.46% 0.822% 1.590% 42.0 0.52<br />
8 1--3 3 9.2091 8.8697 9.6067 8.9843 8.31% 1.262% 2.837% 57.4 0.44<br />
8 1--4 4 9.1593 8.8267 9.5991 8.9816 8.75% 1.690% 5.299% 76.0 0.32<br />
8 1--5 5 9.1617 8.8393 9.74 9.0191 10.19% 1.936% 6.485% 82.2 0.30<br />
8 1--6 6 12.3627 11.9224 13.1881 12.2615 10.62% 2.426% 9.334% 92.9 0.26<br />
% Reflectance Readings<br />
Wavelength<br />
(nm) Dip 1 Dip 2 Dip 3 Dip 4 Dip 5 Dip 6 Dip 7<br />
400 11.71 6.98 5.19 3.66 3.18 2.64<br />
420 15.68 9.49 6.71 4.56 3.88 3.16<br />
440 14.53 8.46 5.89 3.95 3.35 2.72<br />
460 12.33 6.97 4.79 3.22 2.73 2.25<br />
480 10.59 5.70 3.89 2.62 2.24 1.85<br />
500 9.25 4.84 3.29 2.25 1.94 1.64<br />
520 7.63 3.86 2.65 1.84 1.63 1.42<br />
540 6.09 3.05 2.14 1.55 1.42 1.28<br />
560 5.14 2.58 1.86 1.41 1.32 1.21<br />
580 4.28 2.22 1.65 1.31 1.26 1.16<br />
600 3.54 1.91 1.49 1.25 1.23 1.15<br />
620 3.04 1.73 1.43 1.25 1.26 1.19<br />
640 2.59 1.61 1.41 1.28 1.33 1.24<br />
660 2.48 1.60 1.47 1.40 1.50 1.39<br />
680 3.27 2.02 1.75 1.62 1.71 1.60<br />
700 7.84 4.25 3.22 2.54 2.40 2.11<br />
315
Table A-4-1: Continued<br />
Shade<br />
Dye Bath<br />
ID<br />
Dwell<br />
(gpl<br />
Dye Dye Bath Dwell<br />
Nip<br />
Speed Time Oxidation 100% Dye Bath Alkalinity Length Oxidation Pressures<br />
(m/min) (sec) Time (sec) Indigo) Bath pH (mV) (gpl) (m) Length (m) (psi)<br />
1156 36.58 14.1 59.1 2.716 11.94 836 6.06 8.63 39.40 70.00<br />
Yarn Skein Response Variables<br />
Yarn<br />
Count<br />
Dye<br />
route Dips<br />
Greige<br />
Weight<br />
Boil Off<br />
Weight<br />
Dyed<br />
Weight<br />
Washed<br />
Weight %COWY<br />
Total<br />
<strong>%IOWY</strong><br />
Surface<br />
<strong>%IOWY</strong> Integ<br />
Penetration<br />
Level<br />
12 1 only 1 6.2957 6.1185 6.4358 6.1379 5.19% 0.472% 0.790% 19.5 0.60<br />
12 1--2 2 6.231 6.0586 6.515 6.1125 7.53% 0.919% 1.669% 43.2 0.55<br />
12 1--3 3 6.2971 6.1169 6.6442 6.201 8.62% 1.331% 2.966% 58.7 0.45<br />
12 1--4 4 6.2537 6.0728 6.6664 6.1909 9.77% 1.812% 4.964% 74.0 0.37<br />
12 1--5 5 6.1908 6.0126 6.7291 6.1594 11.92% 2.260% 6.244% 81.1 0.36<br />
12 1--6 6 6.2478 6.0675 6.7356 6.2375 11.01% 2.587% 8.617% 90.6 0.30<br />
12 1--7 7 6.3074 6.1333 6.7564 6.3226 10.16% 2.970% 9.696% 94.0 0.31<br />
% Reflectance Readings<br />
Wavelength<br />
(nm) Dip 1 Dip 2 Dip 3 Dip 4 Dip 5 Dip 6 Dip 7<br />
400 12.42 6.85 5.13 3.83 3.33 2.80 2.59<br />
420 16.73 9.30 6.73 4.84 4.12 3.39 3.09<br />
440 15.50 8.24 5.86 4.17 3.53 2.90 2.64<br />
460 13.18 6.75 4.74 3.36 2.85 2.37 2.16<br />
480 11.32 5.51 3.83 2.72 2.31 1.92 1.77<br />
500 9.93 4.67 3.23 2.32 2.00 1.69 1.46<br />
520 8.24 3.73 2.60 1.89 1.66 1.44 1.37<br />
540 6.58 2.96 2.09 1.59 1.44 1.29 1.25<br />
560 5.57 2.51 1.81 1.44 1.33 1.22 1.21<br />
580 4.65 2.15 1.61 1.33 1.25 1.17 1.16<br />
600 3.83 1.86 1.45 1.27 1.22 1.16 1.18<br />
620 3.28 1.70 1.40 1.27 1.25 1.20 1.22<br />
640 2.79 1.58 1.38 1.32 1.33 1.29 1.33<br />
660 2.63 1.60 1.46 1.45 1.50 1.47 1.53<br />
680 3.47 2.02 1.76 1.69 1.74 1.69 1.77<br />
700 8.32 4.14 3.18 2.60 2.46 2.21 2.18<br />
316
Table A-4-1: Continued<br />
Shade<br />
Dye Bath<br />
ID<br />
Dwell<br />
(gpl<br />
Dye Dye Bath Dwell<br />
Nip<br />
Speed Time Oxidation 100% Dye Bath Alkalinity Length Oxidation Pressures<br />
(m/min) (sec) Time (sec) Indigo) Bath pH (mV) (gpl) (m) Length (m) (psi)<br />
1134 31.09 16.7 69.5 2.994 11.98 789 6.6 8.63 39.40 70.00<br />
Yarn Skein Response Variables<br />
Yarn<br />
Count<br />
Dye<br />
route Dips<br />
Greige<br />
Weight<br />
Boil Off<br />
Weight<br />
Dyed<br />
Weight<br />
Washed<br />
Weight %COWY<br />
Total<br />
<strong>%IOWY</strong><br />
Surface<br />
<strong>%IOWY</strong> Integ<br />
Penetration<br />
Level<br />
6.3 1 only 1 8.7563 8.5312 9.0642 8.5625 6.25% 0.445% 0.892% 24.2 0.50<br />
6.3 1--2 2 8.3909 8.1668 8.8673 8.242 8.58% 0.863% 2.160% 50.0 0.40<br />
6.3 1--3 3 8.2301 8.0143 8.7259 8.1204 8.88% 1.317% 3.666% 64.8 0.36<br />
6.3 1--4 4 8.3198 8.0998 8.8964 8.2629 9.83% 1.798% 6.038% 80.0 0.30<br />
6.3 1--5 5 8.0571 7.858 8.6747 8.0267 10.39% 2.166% 7.865% 88.0 0.28<br />
6.3 1--6 6 8.182 7.9761 8.9362 8.1966 12.04% 2.681% 10.103% 95.1 0.27<br />
6.3 1--7 7 9.2415 9.0051 9.9958 9.2982 11.00% 3.014% 13.358% 102.6 0.23<br />
% Reflectance Readings<br />
Wavelength<br />
(nm) Dip 1 Dip 2 Dip 3 Dip 4 Dip 5 Dip 6 Dip 7<br />
400 10.91 6.13 4.65 3.48 3.01 2.60 2.31<br />
420 14.81 8.22 6.02 4.34 3.67 3.06 2.64<br />
440 13.56 7.19 5.20 3.71 3.12 2.60 2.25<br />
460 11.35 5.81 4.18 2.99 2.53 2.14 1.86<br />
480 9.64 4.69 3.37 2.43 2.06 1.75 1.56<br />
500 8.39 3.96 2.85 2.08 1.79 1.55 1.40<br />
520 6.82 3.17 2.31 1.73 1.52 1.37 1.25<br />
540 5.40 2.52 1.88 1.48 1.35 1.24 1.17<br />
560 4.52 2.15 1.64 1.35 1.26 1.19 1.14<br />
580 3.75 1.86 1.47 1.25 1.18 1.14 1.11<br />
600 3.10 1.63 1.35 1.20 1.15 1.15 1.11<br />
620 2.67 1.51 1.30 1.20 1.16 1.19 1.15<br />
640 2.34 1.47 1.31 1.27 1.25 1.29 1.28<br />
660 2.26 1.52 1.39 1.40 1.40 1.48 1.48<br />
680 2.96 1.87 1.64 1.63 1.61 1.72 1.72<br />
700 6.97 3.64 2.88 2.44 2.22 2.18 2.04<br />
317
Table A-4-1: Continued<br />
Shade<br />
Dye Bath<br />
ID<br />
Dwell<br />
(gpl<br />
Dye Dye Bath Dwell<br />
Nip<br />
Speed Time Oxidation 100% Dye Bath Alkalinity Length Oxidation Pressures<br />
(m/min) (sec) Time (sec) Indigo) Bath pH (mV) (gpl) (m) Length (m) (psi)<br />
1134 31.09 16.7 69.5 2.994 11.98 789 6.6 8.63 39.40 70.00<br />
Yarn Skein Response Variables<br />
Yarn<br />
Count<br />
Dye<br />
route Dips<br />
Greige<br />
Weight<br />
Boil Off<br />
Weight<br />
Dyed<br />
Weight<br />
Washed<br />
Weight %COWY<br />
Total<br />
<strong>%IOWY</strong><br />
Surface<br />
<strong>%IOWY</strong> Integ<br />
Penetration<br />
Level<br />
8 1 only 1 8.741 8.4602 9.0905 8.4991 7.45% 0.577% 0.897% 24.4 0.64<br />
8 1--2 2 8.6098 8.3352 9.1162 8.4211 9.37% 1.143% 1.853% 46.0 0.62<br />
8 1--3 3 8.1409 7.8845 8.6864 7.9923 10.17% 1.534% 3.590% 64.2 0.43<br />
8 1--4 4 8.4871 8.2161 9.1 8.3712 10.76% 1.972% 5.054% 74.6 0.39<br />
8 1--5 5 7.8553 7.6096 8.4208 7.8006 10.66% 2.480% 7.095% 84.9 0.35<br />
8 1--6 6 7.8736 7.622 8.638 7.8505 13.33% 2.947% 8.436% 90.0 0.35<br />
8 1--7 7 8.6011 8.3298 9.3674 8.6612 12.46% 3.533% 10.628% 96.5 0.33<br />
% Reflectance Readings<br />
Wavelength<br />
(nm) Dip 1 Dip 2 Dip 3 Dip 4 Dip 5 Dip 6 Dip 7<br />
400 10.75 6.43 4.59 3.76 2.99 2.71 2.38<br />
420 14.54 8.55 5.87 4.68 3.57 3.16 2.66<br />
440 13.32 7.52 5.07 4.00 3.05 2.69 2.28<br />
460 11.14 6.13 4.07 3.22 2.50 2.22 1.91<br />
480 9.44 4.97 3.27 2.60 2.05 1.82 1.59<br />
500 8.21 4.22 2.78 2.25 1.81 1.63 1.45<br />
520 6.69 3.39 2.27 1.85 1.55 1.43 1.31<br />
540 5.33 2.72 1.86 1.57 1.38 1.31 1.24<br />
560 4.49 2.34 1.66 1.44 1.30 1.26 1.22<br />
580 3.74 2.04 1.51 1.35 1.27 1.23 1.20<br />
600 3.11 1.79 1.40 1.29 1.25 1.23 1.24<br />
620 2.67 1.64 1.33 1.26 1.24 1.25 1.27<br />
640 2.36 1.63 1.40 1.35 1.37 1.40 1.45<br />
660 2.29 1.67 1.52 1.49 1.53 1.60 1.70<br />
680 2.96 2.01 1.75 1.68 1.71 1.81 1.94<br />
700 6.84 3.89 2.97 2.58 2.33 2.29 2.26<br />
318
Table A-4-1: Continued<br />
Shade<br />
Dye Bath<br />
ID<br />
Dwell<br />
(gpl<br />
Dye Dye Bath Dwell<br />
Nip<br />
Speed Time Oxidation 100% Dye Bath Alkalinity Length Oxidation Pressures<br />
(m/min) (sec) Time (sec) Indigo) Bath pH (mV) (gpl) (m) Length (m) (psi)<br />
1134 31.09 16.7 69.5 3.133 12.54 801 6.16 8.63 39.40 70.00<br />
Yarn Skein Response Variables<br />
Yarn<br />
Count<br />
Dye<br />
route Dips<br />
Greige<br />
Weight<br />
Boil Off<br />
Weight<br />
Dyed<br />
Weight<br />
Washed<br />
Weight %COWY<br />
Total<br />
<strong>%IOWY</strong><br />
Surface<br />
<strong>%IOWY</strong> Integ<br />
Penetration<br />
Level<br />
6.3 1 only 1 7.3185 7.2391 7.5081 7.033 3.72% 0.470% 0.936% 26.0 0.50<br />
6.3 1--2 2 7.1757 7.0941 7.4719 6.8659 5.33% 0.991% 2.121% 49.5 0.47<br />
6.3 1--3 3 7.3111 7.2613 7.7102 7.0736 6.18% 1.586% 4.255% 69.3 0.37<br />
6.3 1--4 4 7.216 7.1484 7.6962 7.0295 7.66% 2.035% 5.226% 75.6 0.39<br />
6.3 1--5 5 7.097 6.9895 7.6214 6.9277 9.04% 2.699% 7.838% 87.9 0.34<br />
6.3 1--6 6 7.2095 7.1868 7.8637 7.1291 9.42% 3.322% 10.718% 96.7 0.31<br />
6.3 1--7 7 7.1665 7.1341 7.7023 7.0573 7.96% 3.632% 12.695% 101.3 0.29<br />
% Reflectance Readings<br />
Wavelength<br />
(nm) Dip 1 Dip 2 Dip 3 Dip 4 Dip 5 Dip 6 Dip 7<br />
400 10.10 6.10 4.17 3.58 2.89 2.49 2.31<br />
420 13.66 8.11 5.30 4.45 3.48 2.89 2.62<br />
440 12.55 7.13 4.58 3.83 2.96 2.47 2.25<br />
460 10.54 5.80 3.70 3.11 2.42 2.04 1.88<br />
480 8.93 4.70 2.99 2.52 1.97 1.67 1.56<br />
500 7.77 3.98 2.55 2.19 1.74 1.51 1.43<br />
520 6.32 3.20 2.09 1.82 1.50 1.33 1.28<br />
540 4.99 2.54 1.71 1.55 1.33 1.21 1.17<br />
560 4.21 2.16 1.53 1.42 1.26 1.17 1.15<br />
580 3.51 1.88 1.41 1.34 1.21 1.15 1.13<br />
600 2.92 1.66 1.32 1.29 1.20 1.16 1.14<br />
620 2.54 1.53 1.29 1.29 1.22 1.22 1.18<br />
640 2.25 1.49 1.35 1.38 1.34 1.35 1.32<br />
660 2.22 1.57 1.49 1.53 1.53 1.59 1.56<br />
680 2.92 1.94 1.79 1.80 1.78 1.88 1.84<br />
700 6.56 3.73 2.87 2.63 2.34 2.27 2.17<br />
319
Table A-4-1: Continued<br />
Shade<br />
Dye Bath<br />
ID<br />
Dwell<br />
(gpl<br />
Dye Dye Bath Dwell<br />
Nip<br />
Speed Time Oxidation 100% Dye Bath Alkalinity Length Oxidation Pressures<br />
(m/min) (sec) Time (sec) Indigo) Bath pH (mV) (gpl) (m) Length (m) (psi)<br />
1134 31.09 16.7 69.5 3.133 12.54 801 6.16 8.63 39.40 70.00<br />
Yarn Skein Response Variables<br />
Yarn<br />
Count<br />
Dye<br />
route Dips<br />
Greige<br />
Weight<br />
Boil Off<br />
Weight<br />
Dyed<br />
Weight<br />
Washed<br />
Weight %COWY<br />
Total<br />
<strong>%IOWY</strong><br />
Surface<br />
<strong>%IOWY</strong> Integ<br />
Penetration<br />
Level<br />
12 1 only 1 3.4995 3.4726 3.667 3.3694 5.60% 0.686% 0.987% 27.9 0.70<br />
12 1--2 2 3.6025 3.5409 3.8154 3.4882 7.75% 1.339% 2.448% 53.4 0.55<br />
12 1--3 3 3.6048 3.5595 3.8785 3.4992 8.96% 2.061% 4.629% 71.9 0.45<br />
12 1--4 4 3.5576 3.5402 3.888 3.495 9.82% 2.679% 6.662% 83.0 0.40<br />
12 1--5 5 3.564 3.5048 3.939 3.5345 12.39% 3.338% 9.695% 94.0 0.34<br />
12 1--6 6 3.6194 3.5478 4.0037 3.5965 12.85% 3.916% 13.240% 102.3 0.30<br />
12 1--7 7 3.6135 3.5623 4.0011 3.637 12.32% 4.354% 15.926% 107.1 0.27<br />
% Reflectance Readings<br />
Wavelength<br />
(nm) Dip 1 Dip 2 Dip 3 Dip 4 Dip 5 Dip 6 Dip 7<br />
400 9.78 5.82 4.11 3.27 2.72 2.37 2.18<br />
420 13.10 7.57 5.18 3.98 3.22 2.73 2.48<br />
440 11.94 6.63 4.47 3.41 2.75 2.34 2.12<br />
460 10.02 5.41 3.61 2.78 2.26 1.95 1.76<br />
480 8.47 4.38 2.93 2.26 1.85 1.61 1.47<br />
500 7.33 3.72 2.50 1.95 1.62 1.44 1.33<br />
520 5.95 2.99 2.03 1.63 1.40 1.28 1.20<br />
540 4.70 2.37 1.66 1.40 1.24 1.15 1.10<br />
560 3.96 2.02 1.48 1.30 1.18 1.11 1.09<br />
580 3.29 1.76 1.36 1.24 1.15 1.09 1.08<br />
600 2.74 1.55 1.26 1.20 1.14 1.10 1.09<br />
620 2.37 1.42 1.23 1.21 1.15 1.12 1.14<br />
640 2.12 1.40 1.26 1.29 1.26 1.24 1.28<br />
660 2.10 1.47 1.39 1.48 1.45 1.45 1.53<br />
680 2.80 1.83 1.65 1.73 1.68 1.71 1.78<br />
700 6.25 3.52 2.71 2.45 2.20 2.10 2.11<br />
320
Table A-4-1: Continued<br />
Shade<br />
Dye Bath<br />
ID<br />
Dwell<br />
(gpl<br />
Dye Dye Bath Dwell<br />
Nip<br />
Speed Time Oxidation 100% Dye Bath Alkalinity Length Oxidation Pressures<br />
(m/min) (sec) Time (sec) Indigo) Bath pH (mV) (gpl) (m) Length (m) (psi)<br />
t3735 34.75 19.6 63.9 0.761 11.08 722 2.13 11.37 40.50 40.00<br />
Yarn Skein Response Variables<br />
Yarn Dye<br />
Greige Boil Off Dyed Washed<br />
Total Surface<br />
Penetration<br />
Count route Dips Weight Weight Weight Weight %COWY <strong>%IOWY</strong> <strong>%IOWY</strong> Integ Level<br />
6.3 1 only 1 8.2806 7.9396 8.0993 7.9339 2.01% 0.137% 0.443% 8.2 0.31<br />
6.3 1--2 2 8.1831 7.8587 8.00842 7.8595 1.91% 0.305% 0.765% 18.4 0.40<br />
6.3 1--3 3 8.3069 7.9597 8.2823 7.9829 4.05% 0.577% 1.141% 32.7 0.51<br />
6.3 1--4 4 8.236 7.9002 8.2137 7.934 3.97% 0.666% 1.539% 41.1 0.43<br />
6.3 1--5 5 8.2356 7.8895 8.2191 7.936 4.18% 0.902% 2.312% 51.8 0.39<br />
6.3 1--5,4<br />
1--5,4-<br />
6 8.3191 7.9783 8.3805 8.0502 5.04% 1.167% 3.321% 61.9 0.35<br />
6.3 5 7 8.1713 7.8316 8.2105 7.9057 4.84% 1.358% 3.884% 66.5 0.35<br />
% Reflectance Readings<br />
Wavelength<br />
(nm) Dip 1 Dip 2 Dip 3 Dip 4 Dip 5 Dip 6 Dip 7<br />
400 19.61 12.55 8.22 7.02 5.70 4.65 4.19<br />
420 24.45 16.56 11.00 9.45 7.36 5.83 5.17<br />
440 23.74 15.60 10.09 8.43 6.49 5.10 4.50<br />
460 21.48 13.50 8.51 6.98 5.33 4.19 3.69<br />
480 19.57 11.75 7.13 5.73 4.36 3.44 3.03<br />
500 17.81 10.36 6.12 4.87 3.68 2.92 2.59<br />
520 15.66 8.68 4.95 3.89 2.98 2.38 2.12<br />
540 13.09 6.96 3.94 3.09 2.39 1.94 1.78<br />
560 11.54 5.91 3.35 2.63 2.07 1.72 1.61<br />
580 10.00 4.94 2.84 2.27 1.82 1.56 1.49<br />
600 8.47 4.08 2.42 1.97 1.64 1.45 1.41<br />
620 7.31 3.48 2.14 1.77 1.52 1.40 1.38<br />
640 6.17 2.94 1.95 1.67 1.50 1.40 1.42<br />
660 5.53 2.72 1.90 1.66 1.53 1.48 1.51<br />
680 7.38 3.52 2.37 2.01 1.81 1.69 1.72<br />
700 15.35 8.50 5.11 4.15 3.42 2.92 2.75<br />
321
Table A-4-1: Continued<br />
Shade<br />
Dye Bath<br />
ID<br />
Dwell<br />
(gpl<br />
Dye Dye Bath Dwell<br />
Nip<br />
Speed Time Oxidation 100% Dye Bath Alkalinity Length Oxidation Pressures<br />
(m/min) (sec) Time (sec) Indigo) Bath pH (mV) (gpl) (m) Length (m) (psi)<br />
1110 32.92 20.7 67.5 0.733 12.23 813 2.79 11.37 40.50 40.00<br />
Yarn Skein Response Variables<br />
Yarn Dye<br />
Greige Boil Off Dyed Washed<br />
Total Surface<br />
Penetration<br />
Count route Dips Weight Weight Weight Weight %COWY <strong>%IOWY</strong> <strong>%IOWY</strong> Integ Level<br />
7.1 1 only 1 6.9391 6.6999 6.8035 6.6768 1.55% 0.134% 0.370% 6.9 0.36<br />
7.1 1--2 2 6.9948 6.782 6.8888 6.7635 1.57% 0.220% 0.627% 12.9 0.35<br />
7.1 1--2,1<br />
1--2,1-<br />
3 6.854 6.62 6.746 6.6079 1.90% 0.365% 0.763% 18.3 0.48<br />
7.1 2 4 6.9343 6.7022 6.8375 6.6915 2.02% 0.446% 0.875% 23.5 0.51<br />
% Reflectance Readings<br />
Wavelength<br />
(nm) Dip 1 Dip 2 Dip 3 Dip 4 Dip 5 Dip 6 Dip 7<br />
400 21.96 15.92 13.01 11.02<br />
420 27.54 20.86 17.54 15.13<br />
440 26.78 19.76 16.36 13.96<br />
460 24.19 17.16 13.95 11.73<br />
480 22.11 15.10 12.03 9.95<br />
500 20.18 13.42 10.54 8.65<br />
520 17.70 11.42 8.74 6.98<br />
540 14.85 9.23 6.97 5.50<br />
560 13.22 8.03 5.91 4.65<br />
580 11.58 6.85 4.96 3.91<br />
600 9.85 5.67 4.09 3.23<br />
620 8.50 4.78 3.45 2.76<br />
640 7.15 3.96 2.87 2.34<br />
660 6.37 3.63 2.66 2.20<br />
680 8.53 4.79 3.47 2.84<br />
700 17.48 11.10 8.54 6.88<br />
322
Table A-4-1: Continued<br />
Shade<br />
Dye Bath<br />
ID<br />
Dwell<br />
(gpl<br />
Dye Dye Bath Dwell<br />
Nip<br />
Speed Time Oxidation 100% Dye Bath Alkalinity Length Oxidation Pressures<br />
(m/min) (sec) Time (sec) Indigo) Bath pH (mV) (gpl) (m) Length (m) (psi)<br />
1110 32.92 20.7 67.5 0.733 12.23 813 2.79 11.37 40.50 40.00<br />
Yarn Skein Response Variables<br />
Yarn Dye<br />
Greige Boil Off Dyed Washed<br />
Total Surface<br />
Penetration<br />
Count route Dips Weight Weight Weight Weight %COWY <strong>%IOWY</strong> <strong>%IOWY</strong> Integ Level<br />
8 1 only 1 6.1777 5.9717 6.0737 5.9531 1.71% 0.131% 0.284% 5.5 0.46<br />
8 1--2 2 6.0447 5.8247 5.939 5.8135 1.96% 0.245% 0.572% 11.3 0.43<br />
8 1--2,1<br />
1--2,1-<br />
3 6.1363 5.9296 6.0544 5.9254 2.10% 0.369% 0.726% 16.6 0.51<br />
8 2 4 6.1302 5.9119 6.0437 5.9109 2.23% 0.455% 0.864% 23.0 0.53<br />
% Reflectance Readings<br />
Wavelength<br />
(nm) Dip 1 Dip 2 Dip 3 Dip 4 Dip 5 Dip 6 Dip 7<br />
400 24.57 17.14 13.71 11.23<br />
420 30.34 22.27 18.38 15.33<br />
440 29.79 21.15 17.21 14.13<br />
460 27.25 18.48 14.73 11.86<br />
480 25.14 16.37 12.75 10.07<br />
500 23.14 14.60 11.21 8.74<br />
520 20.53 12.55 9.40 7.10<br />
540 17.40 10.23 7.52 5.61<br />
560 15.57 8.96 6.44 4.76<br />
580 13.73 7.74 5.43 3.99<br />
600 11.74 6.45 4.48 3.31<br />
620 10.20 5.46 3.80 2.82<br />
640 8.62 4.53 3.15 2.39<br />
660 7.62 4.10 2.91 2.22<br />
680 10.19 5.39 3.76 2.88<br />
700 20.21 12.11 9.10 6.97<br />
323
Table A-4-1: Continued<br />
Shade<br />
Dye Bath<br />
ID<br />
Dwell<br />
(gpl<br />
Dye Dye Bath Dwell<br />
Nip<br />
Speed Time Oxidation 100% Dye Bath Alkalinity Length Oxidation Pressures<br />
(m/min) (sec) Time (sec) Indigo) Bath pH (mV) (gpl) (m) Length (m) (psi)<br />
1110 32.92 20.7 67.5 0.733 12.23 813 2.79 11.37 40.50 40.00<br />
Yarn Skein Response Variables<br />
Yarn Dye<br />
Greige Boil Off Dyed Washed<br />
Total Surface<br />
Penetration<br />
Count route Dips Weight Weight Weight Weight %COWY <strong>%IOWY</strong> <strong>%IOWY</strong> Integ Level<br />
12 1 only 1 3.9485 3.8069 3.8929 3.802 2.26% 0.171% 0.375% 7.0 0.46<br />
12 1--2 2 3.9064 3.7635 3.8499 3.7621 2.30% 0.305% 0.630% 13.0 0.48<br />
12 1--2,1<br />
1--2,1-<br />
3 3.9594 3.8156 3.9091 3.819 2.45% 0.417% 0.756% 17.9 0.55<br />
12 2<br />
1--2,1-<br />
4 4.0246 3.8837 3.9877 3.8952 2.68% 0.583% 0.930% 25.8 0.63<br />
12 2,1<br />
1-2,1-<br />
5 3.9455 3.805 3.9101 3.8191 2.76% 0.670% 1.041% 29.8 0.64<br />
12 2,1-2<br />
1-2,1-<br />
6 3.8618 3.7262 3.8285 3.747 2.75% 0.821% 1.271% 35.9 0.65<br />
12 2,1-2,1 7 3.8127 3.6766 3.7908 3.6985 3.11% 0.964% 1.530% 40.9 0.63<br />
% Reflectance Readings<br />
Wavelength<br />
(nm) Dip 1 Dip 2 Dip 3 Dip 4 Dip 5 Dip 6 Dip 7<br />
400 22.20 15.94 13.27 10.41 9.36 8.07 7.25<br />
420 27.85 20.82 17.82 14.23 12.93 11.16 10.02<br />
440 26.95 19.65 16.59 12.98 11.74 10.04 8.89<br />
460 24.22 17.04 14.11 10.82 9.71 8.26 7.26<br />
480 22.01 14.98 12.14 9.10 8.09 6.73 5.87<br />
500 20.02 13.30 10.63 7.86 6.90 5.71 4.97<br />
520 17.58 11.34 8.85 6.33 5.52 4.54 3.94<br />
540 14.72 9.18 7.06 5.00 4.34 3.57 3.11<br />
560 13.10 7.99 6.01 4.24 3.67 3.04 2.65<br />
580 11.46 6.80 5.06 3.57 3.10 2.59 2.28<br />
600 9.75 5.64 4.17 2.97 2.61 2.21 1.96<br />
620 8.42 4.78 3.52 2.57 2.25 1.93 1.74<br />
640 7.08 3.96 2.94 2.20 1.97 1.73 1.59<br />
660 6.33 3.63 2.72 2.10 1.89 1.68 1.57<br />
680 8.44 4.78 3.53 2.70 2.41 2.10 1.93<br />
700 17.23 11.05 8.60 6.28 5.48 4.58 4.01<br />
324
Table A-4-1: Continued<br />
Shade<br />
Dye Bath<br />
ID<br />
Dwell<br />
(gpl<br />
Dye Dye Bath Dwell<br />
Nip<br />
Speed Time Oxidation 100% Dye Bath Alkalinity Length Oxidation Pressures<br />
(m/min) (sec) Time (sec) Indigo) Bath pH (mV) (gpl) (m) Length (m) (psi)<br />
t3706 34.75 19.6 63.9 0.94 11.48 861 2.22 11.37 40.50 40.00<br />
Yarn Skein Response Variables<br />
Yarn<br />
Count<br />
Dye<br />
route Dips<br />
Greige<br />
Weight<br />
Boil Off<br />
Weight<br />
Dyed<br />
Weight<br />
Washed<br />
Weight %COWY<br />
Total<br />
<strong>%IOWY</strong><br />
Surface<br />
<strong>%IOWY</strong> Integ<br />
Penetration<br />
Level<br />
6.3 1 only 1 8.2635 7.95 8.1871 7.9431 2.98% 0.163% 0.497% 9.4 0.33<br />
6.3 1--2 2 8.3017 7.9697 8.2575 7.9723 3.61% 0.305% 0.776% 18.9 0.39<br />
6.3 1--3 3 8.2384 7.918 8.2369 7.9335 4.03% 0.501% 1.046% 29.9 0.48<br />
6.3 1--4 4 8.2754 7.9427 8.3124 7.969 4.65% 0.598% 1.507% 40.5 0.40<br />
6.3 1--5 5 8.3279 7.9936 8.4145 8.028 5.27% 0.716% 1.936% 47.1 0.37<br />
6.3 1--6 6 8.302 7.9718 8.3508 8.0209 4.75% 0.913% 2.765% 56.7 0.33<br />
6.3 1--6,6 7 8.3061 7.9788 8.3878 8.0325 5.13% 1.102% 3.588% 64.2 0.31<br />
% Reflectance Readings<br />
Wavelength<br />
(nm) Dip 1 Dip 2 Dip 3 Dip 4 Dip 5 Dip 6 Dip 7<br />
400 18.24 12.35 8.81 7.18 6.28 5.20 4.51<br />
420 22.94 16.34 11.88 9.81 8.46 6.78 5.82<br />
440 22.23 15.39 10.97 8.81 7.53 5.97 5.10<br />
460 19.94 13.27 9.27 7.29 6.17 4.89 4.15<br />
480 18.07 11.51 7.82 5.98 5.04 3.98 3.40<br />
500 16.35 10.16 6.75 5.08 4.27 3.38 2.89<br />
520 14.30 8.48 5.46 4.05 3.41 2.73 2.35<br />
540 11.86 6.81 4.33 3.18 2.70 2.19 1.91<br />
560 10.43 5.78 3.68 2.70 2.30 1.90 1.68<br />
580 9.01 4.82 3.11 2.30 1.99 1.69 1.52<br />
600 7.60 3.98 2.62 1.97 1.74 1.52 1.39<br />
620 6.50 3.38 2.29 1.75 1.58 1.41 1.31<br />
640 5.44 2.83 2.01 1.58 1.45 1.32 1.24<br />
660 4.92 2.61 1.93 1.52 1.41 1.32 1.25<br />
680 6.56 3.40 2.46 1.88 1.70 1.54 1.42<br />
700 13.96 8.24 5.49 4.09 3.53 2.96 2.60<br />
325
Table A-4-1: Continued<br />
Shade<br />
Dye Bath<br />
ID<br />
Dwell<br />
(gpl<br />
Dye Dye Bath Dwell<br />
Nip<br />
Speed Time Oxidation 100% Dye Bath Alkalinity Length Oxidation Pressures<br />
(m/min) (sec) Time (sec) Indigo) Bath pH (mV) (gpl) (m) Length (m) (psi)<br />
t3706 34.75 19.6 63.9 0.94 11.48 861 2.22 11.37 40.50 40.00<br />
Yarn Skein Response Variables<br />
Yarn<br />
Count<br />
Dye<br />
route Dips<br />
Greige<br />
Weight<br />
Boil Off<br />
Weight<br />
Dyed<br />
Weight<br />
Washed<br />
Weight %COWY<br />
Total<br />
<strong>%IOWY</strong><br />
Surface<br />
<strong>%IOWY</strong> Integ<br />
Penetration<br />
Level<br />
8 1 only 1 9.1853 8.8494 9.1124 8.8452 2.97% 0.177% 0.517% 9.9 0.34<br />
8 1--2 2 9.2492 8.9176 9.241 8.9307 3.63% 0.325% 0.788% 19.4 0.41<br />
8 1--3 3 9.3365 9.0043 9.3891 9.0301 4.27% 0.501% 1.064% 30.5 0.47<br />
8 1--4 4 9.2811 8.9443 9.389 8.9828 4.97% 0.664% 1.509% 40.6 0.44<br />
8 1--5 5 9.2993 8.9629 9.3567 9.0165 4.39% 0.828% 2.083% 49.1 0.40<br />
8 1--6 6 9.2632 8.9339 9.406 9.0083 5.28% 1.124% 3.184% 60.7 0.35<br />
8 1--6,6 7 9.3886 9.0562 9.5544 9.1498 5.50% 1.262% 3.760% 65.6 0.34<br />
% Reflectance Readings<br />
Wavelength<br />
(nm) Dip 1 Dip 2 Dip 3 Dip 4 Dip 5 Dip 6 Dip 7<br />
400 17.65 12.10 8.97 7.14 6.11 4.89 4.47<br />
420 22.11 15.93 12.12 9.71 8.19 6.33 5.76<br />
440 21.39 14.99 11.16 8.73 7.27 5.57 5.04<br />
460 19.18 12.93 9.37 7.24 5.97 4.55 4.12<br />
480 17.36 11.23 7.89 5.95 4.87 3.71 3.36<br />
500 15.73 9.89 6.78 5.07 4.12 3.15 2.87<br />
520 13.77 8.27 5.45 4.04 3.29 2.55 2.33<br />
540 11.44 6.63 4.30 3.19 2.61 2.04 1.88<br />
560 10.10 5.63 3.63 2.71 2.22 1.79 1.65<br />
580 8.75 4.72 3.04 2.31 1.93 1.58 1.49<br />
600 7.40 3.90 2.56 1.98 1.68 1.43 1.36<br />
620 6.35 3.33 2.22 1.75 1.51 1.34 1.27<br />
640 5.35 2.79 1.91 1.56 1.38 1.25 1.19<br />
660 4.86 2.59 1.82 1.51 1.36 1.25 1.19<br />
680 6.40 3.37 2.33 1.88 1.63 1.45 1.38<br />
700 13.32 8.02 5.42 4.09 3.41 2.78 2.56<br />
326
Table A-4-1: Continued<br />
Shade<br />
Dye Bath<br />
ID<br />
Dwell<br />
(gpl<br />
Dye Dye Bath Dwell<br />
Nip<br />
Speed Time Oxidation 100% Dye Bath Alkalinity Length Oxidation Pressures<br />
(m/min) (sec) Time (sec) Indigo) Bath pH (mV) (gpl) (m) Length (m) (psi)<br />
1142 34.75 19.6 63.9 0.946 11.49 742 3.4 11.37 40.50 40.00<br />
Yarn Skein Response Variables<br />
Yarn<br />
Count<br />
Dye<br />
route Dips<br />
Greige<br />
Weight<br />
Boil Off<br />
Weight<br />
Dyed<br />
Weight<br />
Washed<br />
Weight %COWY<br />
Total<br />
<strong>%IOWY</strong><br />
Surface<br />
<strong>%IOWY</strong> Integ<br />
Penetration<br />
Level<br />
7.1 1 only 1 7.2284 7.0323 7.2354 7.0342 2.89% 0.207% 0.507% 9.6 0.41<br />
7.1 1--2 2 7.3446 7.1456 7.4288 7.1571 3.96% 0.359% 0.839% 21.8 0.43<br />
7.1 1--3 3 7.3514 7.1554 7.4505 7.1775 4.12% 0.455% 1.076% 30.8 0.42<br />
7.1 1--4 4 7.2888 7.0958 7.4793 7.1321 5.40% 0.619% 1.523% 40.8 0.41<br />
7.1 1--5 5 7.1916 6.9923 7.3246 7.0431 4.75% 0.756% 1.928% 47.0 0.39<br />
7.1 1--6 6 7.251 7.055 7.4416 7.1208 5.48% 0.956% 2.795% 57.0 0.34<br />
7.1 1--6,6 7 7.2646 7.0636 7.4684 7.1509 5.73% 1.125% 3.410% 62.7 0.33<br />
% Reflectance Readings<br />
Wavelength<br />
(nm) Dip 1 Dip 2 Dip 3 Dip 4 Dip 5 Dip 6 Dip 7<br />
400 18.11 11.10 8.77 7.16 6.19 5.25 4.57<br />
420 22.76 14.61 11.78 9.67 8.15 6.74 5.76<br />
440 21.83 13.61 10.78 8.61 7.22 5.89 5.03<br />
460 19.51 11.69 9.09 7.12 5.94 4.80 4.10<br />
480 17.61 10.09 7.63 5.83 4.85 3.89 3.33<br />
500 15.89 8.86 6.55 4.95 4.11 3.30 2.84<br />
520 13.93 7.35 5.30 3.95 3.30 2.65 2.30<br />
540 11.59 5.90 4.20 3.12 2.65 2.13 1.90<br />
560 10.24 5.03 3.57 2.67 2.28 1.87 1.70<br />
580 8.92 4.23 3.01 2.29 2.01 1.67 1.55<br />
600 7.55 3.52 2.54 1.97 1.78 1.52 1.44<br />
620 6.50 3.04 2.23 1.77 1.64 1.44 1.41<br />
640 5.50 2.61 1.99 1.64 1.58 1.43 1.44<br />
660 4.98 2.47 1.94 1.64 1.63 1.50 1.54<br />
680 6.53 3.19 2.46 2.04 1.94 1.78 1.78<br />
700 13.46 7.31 5.45 4.24 3.75 3.23 2.97<br />
327
Table A-4-1: Continued<br />
Shade<br />
Dye Bath<br />
ID<br />
Dwell<br />
(gpl<br />
Dye Dye Bath Dwell<br />
Nip<br />
Speed Time Oxidation 100% Dye Bath Alkalinity Length Oxidation Pressures<br />
(m/min) (sec) Time (sec) Indigo) Bath pH (mV) (gpl) (m) Length (m) (psi)<br />
1142 34.75 19.6 63.9 0.946 11.49 742 3.4 11.37 40.50 40.00<br />
Yarn Skein Response Variables<br />
Yarn<br />
Count<br />
Dye<br />
route Dips<br />
Greige<br />
Weight<br />
Boil Off<br />
Weight<br />
Dyed<br />
Weight<br />
Washed<br />
Weight %COWY<br />
Total<br />
<strong>%IOWY</strong><br />
Surface<br />
<strong>%IOWY</strong> Integ<br />
Penetration<br />
Level<br />
12 1 only 1 6.3876 6.2068 6.4218 6.218 3.46% 0.207% 0.560% 10.9 0.37<br />
12 1--2 2 6.3814 6.2032 6.4725 6.2262 4.34% 0.381% 0.818% 20.9 0.47<br />
12 1--3 3 6.3095 6.1344 6.4446 6.168 5.06% 0.602% 1.128% 32.3 0.53<br />
12 1--4 4 6.2744 6.0969 6.4446 6.141 5.70% 0.744% 1.533% 41.0 0.49<br />
12 1--5 5 6.352 6.1726 6.5428 6.2305 6.00% 0.922% 1.989% 47.8 0.46<br />
12 1--6 6 6.4709 6.286 6.6476 6.3654 5.75% 1.177% 2.875% 57.8 0.41<br />
12 1--6,6 7 6.347 6.1699 6.5511 6.2549 6.18% 1.395% 3.524% 63.6 0.40<br />
% Reflectance Readings<br />
Wavelength<br />
(nm) Dip 1 Dip 2 Dip 3 Dip 4 Dip 5 Dip 6 Dip 7<br />
400 16.18 11.29 8.42 6.95 6.01 4.98 4.40<br />
420 20.37 14.85 11.29 9.25 7.82 6.33 5.52<br />
440 19.61 13.89 10.30 8.27 6.91 5.54 4.81<br />
460 17.56 11.96 8.64 6.87 5.70 4.52 3.94<br />
480 15.85 10.38 7.22 5.67 4.66 3.70 3.22<br />
500 14.36 9.17 6.21 4.84 3.99 3.15 2.77<br />
520 12.56 7.63 5.01 3.89 3.21 2.56 2.26<br />
540 10.46 6.14 3.97 3.09 2.58 2.08 1.86<br />
560 9.26 5.25 3.40 2.66 2.24 1.85 1.69<br />
580 8.08 4.43 2.88 2.29 1.98 1.68 1.55<br />
600 6.85 3.69 2.45 1.99 1.77 1.54 1.45<br />
620 5.93 3.19 2.16 1.80 1.65 1.46 1.40<br />
640 5.07 2.74 1.96 1.69 1.61 1.47 1.44<br />
660 4.66 2.59 1.91 1.69 1.68 1.57 1.55<br />
680 5.99 3.33 2.41 2.08 2.00 1.82 1.79<br />
700 12.16 7.59 5.19 4.21 3.72 3.14 2.91<br />
328
Table A-4-1: Continued<br />
Shade<br />
Dye Bath<br />
ID<br />
Dwell<br />
(gpl<br />
Dye Dye Bath Dwell<br />
Nip<br />
Speed Time Oxidation 100% Dye Bath Alkalinity Length Oxidation Pressures<br />
(m/min) (sec) Time (sec) Indigo) Bath pH (mV) (gpl) (m) Length (m) (psi)<br />
1126 34.75 19.6 63.9 1.051 11.38 792 3.32 11.37 40.50 40.00<br />
Yarn Skein Response Variables<br />
Yarn Dye<br />
Greige Boil Off Dyed Washed<br />
Total Surface<br />
Penetration<br />
Count route Dips Weight Weight Weight Weight %COWY <strong>%IOWY</strong> <strong>%IOWY</strong> Integ Level<br />
6.3 1 only 1 8.7651 8.4139 8.6682 8.4 3.02% 0.188% 0.539% 10.4 0.35<br />
6.3 1--2 2 8.2092 7.8849 8.1745 7.8886 3.67% 0.342% 0.837% 21.7 0.41<br />
6.3 1--3 3 8.2085 7.8872 8.2382 7.8986 4.45% 0.544% 1.270% 35.8 0.43<br />
6.3 1--4 4 8.3558 8.0246 8.4065 8.0616 4.76% 0.727% 1.847% 45.9 0.39<br />
6.3 1--5 5 8.5064 8.1656 8.5507 8.2185 4.72% 0.915% 2.615% 55.2 0.35<br />
6.3 1--6 6 8.2067 7.8703 8.2531 7.9356 4.86% 1.010% 2.894% 58.0 0.35<br />
% Reflectance Readings<br />
Wavelength<br />
(nm) Dip 1 Dip 2 Dip 3 Dip 4 Dip 5 Dip 6 Dip 7<br />
400 17.20 11.28 7.93 6.42 5.51 5.09<br />
420 21.84 14.99 10.74 8.62 7.16 6.59<br />
440 21.06 14.00 9.78 7.70 6.31 5.79<br />
460 18.84 12.01 8.16 6.37 5.17 4.74<br />
480 16.95 10.34 6.76 5.22 4.22 3.86<br />
500 15.31 9.08 5.77 4.43 3.56 3.27<br />
520 13.32 7.50 4.62 3.54 2.86 2.65<br />
540 11.01 5.99 3.64 2.80 2.28 2.13<br />
560 9.64 5.05 3.07 2.37 1.95 1.85<br />
580 8.30 4.21 2.59 2.04 1.72 1.66<br />
600 6.93 3.49 2.19 1.77 1.53 1.49<br />
620 5.91 2.98 1.91 1.59 1.40 1.39<br />
640 4.99 2.55 1.73 1.48 1.34 1.35<br />
660 4.53 2.37 1.66 1.44 1.31 1.34<br />
680 6.03 3.10 2.11 1.76 1.56 1.56<br />
700 12.91 7.35 4.75 3.75 3.15 2.99<br />
329
Table A-4-1: Continued<br />
Shade<br />
Dye Bath<br />
ID<br />
Dwell<br />
(gpl<br />
Dye Dye Bath Dwell<br />
Nip<br />
Speed Time Oxidation 100% Dye Bath Alkalinity Length Oxidation Pressures<br />
(m/min) (sec) Time (sec) Indigo) Bath pH (mV) (gpl) (m) Length (m) (psi)<br />
1126 34.75 19.6 63.9 1.051 11.38 792 3.32 11.37 40.50 40.00<br />
Yarn Skein Response Variables<br />
Yarn Dye<br />
Greige Boil Off Dyed Washed<br />
Total Surface<br />
Penetration<br />
Count route Dips Weight Weight Weight Weight %COWY <strong>%IOWY</strong> <strong>%IOWY</strong> Integ Level<br />
8 1 only 1 9.4125 9.2 9.4641 9.1953 2.87% 0.192% 0.525% 10.1 0.37<br />
8 1--2 2 9.2127 9.0388 9.3955 9.0539 3.95% 0.350% 0.806% 20.3 0.43<br />
8 1--3 3 9.4864 9.2298 9.6258 9.2625 4.29% 0.521% 1.087% 31.2 0.48<br />
8 1--4 4 9.3524 9.1666 9.618 9.2176 4.92% 0.657% 1.461% 39.7 0.45<br />
8 1--5 5 9.6241 9.1361 9.6072 9.2005 5.16% 0.933% 2.377% 52.6 0.39<br />
8 1--6 6 9.4108 9.0548 9.5177 9.1357 5.11% 1.060% 2.924% 58.3 0.36<br />
% Reflectance Readings<br />
Wavelength<br />
(nm) Dip 1 Dip 2 Dip 3 Dip 4 Dip 5 Dip 6 Dip 7<br />
400 17.77 11.87 8.95 7.35 5.75 5.19<br />
420 22.37 15.71 12.11 9.99 7.52 6.74<br />
440 21.44 14.64 11.02 8.92 6.61 5.88<br />
460 19.11 12.56 9.22 7.38 5.40 4.79<br />
480 17.22 10.85 7.73 6.05 4.40 3.89<br />
500 15.55 9.55 6.61 5.14 3.71 3.28<br />
520 13.58 7.94 5.33 4.11 2.98 2.65<br />
540 11.27 6.37 4.19 3.25 2.38 2.12<br />
560 9.90 5.39 3.53 2.75 2.04 1.84<br />
580 8.55 4.51 2.97 2.35 1.80 1.64<br />
600 7.21 3.73 2.49 2.01 1.60 1.48<br />
620 6.19 3.20 2.16 1.78 1.47 1.37<br />
640 5.27 2.73 1.93 1.64 1.43 1.35<br />
660 4.83 2.56 1.84 1.60 1.43 1.36<br />
680 6.32 3.31 2.37 2.00 1.69 1.59<br />
700 13.10 7.76 5.38 4.27 3.33 3.04<br />
330
Table A-4-1: Continued<br />
Shade<br />
Dye Bath<br />
ID<br />
Dwell<br />
(gpl<br />
Dye Dye Bath Dwell<br />
Nip<br />
Speed Time Oxidation 100% Dye Bath Alkalinity Length Oxidation Pressures<br />
(m/min) (sec) Time (sec) Indigo) Bath pH (mV) (gpl) (m) Length (m) (psi)<br />
1126B 34.75 19.6 63.9 1.157 11.05 817 1.56 11.37 40.50 40.00<br />
Yarn Skein Response Variables<br />
Yarn Dye<br />
Greige Boil Off Dyed Washed<br />
Total Surface<br />
Penetration<br />
Count route Dips Weight Weight Weight Weight %COWY <strong>%IOWY</strong> <strong>%IOWY</strong> Integ Level<br />
6.3 1 only 1 8.1808 7.8405 8.0988 7.8212 3.29% 0.177% 0.520% 9.9 0.34<br />
6.3 1--2 2 8.2137 7.871 8.1732 7.8627 3.84% 0.328% 0.807% 20.3 0.41<br />
6.3 1--3 3 8.2085 7.8738 8.2324 7.8896 4.55% 0.514% 1.103% 31.6 0.47<br />
6.3 1--4 4 8.1237 7.792 8.225 7.814 5.56% 0.625% 1.347% 37.5 0.46<br />
6.3 1--5 5 7.7693 7.4351 7.8435 7.475 5.49% 0.757% 1.916% 46.8 0.40<br />
6.3 1--6 6 8.323 7.9781 8.4272 8.0408 5.63% 0.999% 2.889% 57.9 0.35<br />
% Reflectance Readings<br />
Wavelength<br />
(nm) Dip 1 Dip 2 Dip 3 Dip 4 Dip 5 Dip 6 Dip 7<br />
400 17.47 11.66 8.46 7.43 6.14 4.94<br />
420 22.07 15.33 11.29 9.93 7.96 6.21<br />
440 21.33 14.39 10.42 9.04 7.14 5.52<br />
460 19.10 12.43 8.85 7.61 5.99 4.62<br />
480 17.27 10.79 7.46 6.35 4.97 3.83<br />
500 15.64 9.51 6.43 5.44 4.23 3.26<br />
520 13.66 7.92 5.20 4.38 3.41 2.66<br />
540 11.35 6.35 4.12 3.46 2.72 2.16<br />
560 9.98 5.39 3.48 2.95 2.33 1.87<br />
580 8.63 4.50 2.94 2.50 2.02 1.67<br />
600 7.26 3.72 2.48 2.13 1.77 1.51<br />
620 6.23 3.20 2.18 1.88 1.62 1.41<br />
640 5.26 2.72 1.93 1.70 1.51 1.36<br />
660 4.77 2.54 1.85 1.63 1.48 1.33<br />
680 6.26 3.24 2.30 2.02 1.75 1.52<br />
700 13.11 7.66 5.16 4.38 3.59 2.88<br />
331
Table A-4-1: Continued<br />
Shade<br />
Dye Bath<br />
ID<br />
Dwell<br />
(gpl<br />
Dye Dye Bath Dwell<br />
Nip<br />
Speed Time Oxidation 100% Dye Bath Alkalinity Length Oxidation Pressures<br />
(m/min) (sec) Time (sec) Indigo) Bath pH (mV) (gpl) (m) Length (m) (psi)<br />
1126B 34.75 19.6 63.9 1.157 11.05 817 1.56 11.37 40.50 40.00<br />
Yarn Skein Response Variables<br />
Yarn Dye<br />
Greige Boil Off Dyed Washed<br />
Total Surface<br />
Penetration<br />
Count route Dips Weight Weight Weight Weight %COWY <strong>%IOWY</strong> <strong>%IOWY</strong> Integ Level<br />
8 1 only 1 12.302 11.8549 12.2783 11.8331 3.57% 0.202% 0.550% 10.7 0.37<br />
8 1--2 2 9.2127 8.8729 9.2975 8.8858 4.79% 0.312% 0.779% 19.0 0.40<br />
8 1--3 3 9.2118 8.8698 9.3328 8.899 5.22% 0.499% 1.102% 31.6 0.45<br />
8 1--4 4 9.2176 8.8863 9.4257 8.933 6.07% 0.688% 1.517% 40.7 0.45<br />
8 1--5 5 9.1641 8.8245 9.3425 8.8805 5.87% 0.865% 2.077% 49.0 0.42<br />
8 1--6 6 9.1681 8.8336 9.3633 8.9096 6.00% 1.055% 2.732% 56.4 0.39<br />
% Reflectance Readings<br />
Wavelength<br />
(nm) Dip 1 Dip 2 Dip 3 Dip 4 Dip 5 Dip 6 Dip 7<br />
400 16.99 12.28 8.46 6.91 5.89 5.12<br />
420 21.56 16.12 11.27 9.10 7.57 6.45<br />
440 20.74 15.10 10.43 8.22 6.77 5.73<br />
460 18.47 13.03 8.85 6.92 5.67 4.79<br />
480 16.61 11.32 7.48 5.76 4.70 3.97<br />
500 15.00 9.99 6.44 4.93 4.01 3.38<br />
520 13.07 8.37 5.22 3.97 3.24 2.75<br />
540 10.81 6.75 4.14 3.16 2.59 2.22<br />
560 9.47 5.73 3.50 2.71 2.22 1.93<br />
580 8.15 4.81 2.94 2.32 1.95 1.71<br />
600 6.83 3.99 2.49 2.00 1.71 1.54<br />
620 5.84 3.41 2.19 1.79 1.57 1.44<br />
640 4.93 2.90 1.94 1.65 1.48 1.36<br />
660 4.50 2.69 1.85 1.60 1.45 1.35<br />
680 5.87 3.44 2.31 1.94 1.70 1.56<br />
700 12.46 8.03 5.17 4.04 3.40 2.99<br />
332
Table A-4-1: Continued<br />
Shade<br />
Dye Bath<br />
ID<br />
Dwell<br />
(gpl<br />
Dye Dye Bath Dwell<br />
Nip<br />
Speed Time Oxidation 100% Dye Bath Alkalinity Length Oxidation Pressures<br />
(m/min) (sec) Time (sec) Indigo) Bath pH (mV) (gpl) (m) Length (m) (psi)<br />
1126 34.75 19.6 63.9 1.117 11.55 771 2.79 11.37 40.50 40.00<br />
Yarn Skein Response Variables<br />
Yarn<br />
Count<br />
Dye<br />
route Dips<br />
Greige<br />
Weight<br />
Boil Off<br />
Weight<br />
Dyed<br />
Weight<br />
Washed<br />
Weight %COWY<br />
Total<br />
<strong>%IOWY</strong><br />
Surface<br />
<strong>%IOWY</strong> Integ<br />
Penetration<br />
Level<br />
6.3 1 only 1 8.1062 7.7651 8.0002 7.7641 3.03% 0.186% 0.540% 10.4 0.34<br />
6.3 1--2 2 8.2555 7.9106 8.2317 7.9256 4.06% 0.382% 0.833% 21.5 0.46<br />
6.3 1--3 3 8.3467 8.01 8.3753 8.0304 4.56% 0.546% 1.218% 34.6 0.45<br />
6.3 1--4 4 8.3702 8.0196 8.3981 8.0532 4.72% 0.662% 1.562% 41.5 0.42<br />
6.3 1--5 5 8.2585 7.9182 8.3323 7.9726 5.23% 0.833% 2.222% 50.8 0.37<br />
6.3 1--6 6 8.2929 7.9479 8.363 8.0079 5.22% 1.083% 3.241% 61.2 0.33<br />
6.3 1--6,6 7 8.3391 7.9963 8.4083 8.0759 5.15% 1.235% 3.864% 66.4 0.32<br />
% Reflectance Readings<br />
Wavelength<br />
(nm) Dip 1 Dip 2 Dip 3 Dip 4 Dip 5 Dip 6 Dip 7<br />
400 16.85 11.19 7.94 6.81 5.78 4.73 4.25<br />
420 21.42 14.78 10.65 9.19 7.54 6.08 5.41<br />
440 20.68 13.76 9.71 8.24 6.69 5.33 4.72<br />
460 18.55 11.80 8.17 6.86 5.52 4.36 3.87<br />
480 16.70 10.15 6.79 5.63 4.49 3.55 3.16<br />
500 15.12 8.94 5.83 4.82 3.84 3.04 2.71<br />
520 13.17 7.40 4.69 3.85 3.07 2.45 2.20<br />
540 10.92 5.95 3.73 3.07 2.48 2.00 1.83<br />
560 9.58 5.06 3.16 2.62 2.13 1.75 1.62<br />
580 8.29 4.26 2.69 2.26 1.87 1.58 1.48<br />
600 6.97 3.56 2.30 1.97 1.66 1.45 1.38<br />
620 5.98 3.08 2.02 1.76 1.52 1.36 1.31<br />
640 5.04 2.64 1.83 1.63 1.45 1.34 1.30<br />
660 4.56 2.50 1.76 1.60 1.44 1.36 1.32<br />
680 6.06 3.24 2.25 1.98 1.74 1.61 1.53<br />
700 12.84 7.37 4.86 4.06 3.42 2.88 2.65<br />
333
Table A-4-1: Continued<br />
Shade<br />
Dye Bath<br />
ID<br />
Dwell<br />
(gpl<br />
Dye Dye Bath Dwell<br />
Nip<br />
Speed Time Oxidation 100% Dye Bath Alkalinity Length Oxidation Pressures<br />
(m/min) (sec) Time (sec) Indigo) Bath pH (mV) (gpl) (m) Length (m) (psi)<br />
1126 34.75 19.6 63.9 1.117 11.55 771 2.79 11.37 40.50 40.00<br />
Yarn Skein Response Variables<br />
Yarn Dye<br />
Greige Boil Off Dyed Washed<br />
Total Surface<br />
Penetration<br />
Count route Dips Weight Weight Weight Weight %COWY <strong>%IOWY</strong> <strong>%IOWY</strong> Integ Level<br />
8 1 only 1 6.2123 6.0011 6.1837 5.9981 3.04% 0.204% 0.562% 11.0 0.36<br />
8 1--4 4 6.0963 5.8867 6.2185 5.9163 5.64% 0.879% 1.553% 41.3 0.57<br />
8 1--5 5 6.0526 5.8445 6.147 5.8863 5.18% 0.926% 2.153% 49.9 0.43<br />
8 1--6 6 6.2229 6.005099 6.3646 6.061 5.99% 1.279% 3.107% 60.0 0.41<br />
8 1--6,6 7 6.0154 5.8229 6.1585 5.8883 5.76% 1.403% 3.387% 62.5 0.41<br />
% Reflectance Readings<br />
Wavelength<br />
(nm) Dip 1 Dip 2 Dip 3 Dip 4 Dip 5 Dip 6 Dip 7<br />
400 16.92 7.06 5.97 5.02 4.66<br />
420 21.53 9.58 7.87 6.50 5.96<br />
440 20.66 8.54 6.95 5.68 5.21<br />
460 18.40 7.06 5.72 4.63 4.25<br />
480 16.48 5.78 4.66 3.74 3.45<br />
500 14.86 4.92 3.97 3.19 2.95<br />
520 12.86 3.93 3.17 2.56 2.38<br />
540 10.59 3.11 2.54 2.06 1.95<br />
560 9.25 2.64 2.16 1.79 1.71<br />
580 7.94 2.27 1.89 1.60 1.55<br />
600 6.62 1.95 1.67 1.45 1.43<br />
620 5.64 1.73 1.52 1.34 1.35<br />
640 4.73 1.59 1.44 1.30 1.34<br />
660 4.30 1.57 1.43 1.31 1.36<br />
680 5.75 1.95 1.76 1.55 1.61<br />
700 12.53 4.12 3.51 2.95 2.84<br />
334
Table A-4-1: Continued<br />
Shade<br />
Dye Bath<br />
ID<br />
Dwell<br />
(gpl<br />
Dye Dye Bath Dwell<br />
Nip<br />
Speed Time Oxidation 100% Dye Bath Alkalinity Length Oxidation Pressures<br />
(m/min) (sec) Time (sec) Indigo) Bath pH (mV) (gpl) (m) Length (m) (psi)<br />
1126A 34.75 19.6 63.9 1.174 10.98 826 1.57 11.37 40.50 40.00<br />
Yarn Skein Response Variables<br />
Yarn Dye<br />
Greige Boil Off Dyed Washed<br />
Total Surface<br />
Penetration<br />
Count route Dips Weight Weight Weight Weight %COWY <strong>%IOWY</strong> <strong>%IOWY</strong> Integ Level<br />
6.3 1 only 1 8.2781 7.934 8.196 7.9298 3.30% 0.195% 0.584% 11.6 0.33<br />
6.3 1--2 2 8.3137 7.9781 8.2875 7.9807 3.88% 0.337% 0.832% 21.5 0.41<br />
6.3 1--3 3 8.3089 7.9721 8.329 7.9888 4.48% 0.489% 1.106% 31.7 0.44<br />
6.3 1--5 5 8.2309 7.9008 8.3304 7.9474 5.44% 0.812% 2.084% 49.1 0.39<br />
6.3 1--6 6 8.2494 7.9121 8.3354 7.9723 5.35% 1.033% 2.924% 58.3 0.35<br />
% Reflectance Readings<br />
Wavelength<br />
(nm) Dip 1 Dip 2 Dip 3 Dip 4 Dip 5 Dip 6 Dip 7<br />
400 16.20 11.15 8.47 5.86 4.89<br />
420 20.62 14.64 11.27 7.55 6.12<br />
440 19.82 13.74 10.40 6.75 5.46<br />
460 17.61 11.86 8.85 5.65 4.57<br />
480 15.78 10.28 7.48 4.68 3.80<br />
500 14.20 9.05 6.44 3.98 3.24<br />
520 12.31 7.51 5.21 3.22 2.64<br />
540 10.11 6.03 4.12 2.58 2.13<br />
560 8.83 5.11 3.49 2.22 1.86<br />
580 7.54 4.27 2.93 1.93 1.66<br />
600 6.27 3.55 2.47 1.71 1.50<br />
620 5.36 3.05 2.16 1.57 1.41<br />
640 4.52 2.61 1.92 1.48 1.36<br />
660 4.16 2.46 1.82 1.47 1.34<br />
680 5.45 3.15 2.31 1.74 1.53<br />
700 11.83 7.30 5.18 3.44 2.90<br />
335
Table A-4-1: Continued<br />
Shade<br />
Dye Bath<br />
ID<br />
Dwell<br />
(gpl<br />
Dye Dye Bath Dwell<br />
Nip<br />
Speed Time Oxidation 100% Dye Bath Alkalinity Length Oxidation Pressures<br />
(m/min) (sec) Time (sec) Indigo) Bath pH (mV) (gpl) (m) Length (m) (psi)<br />
t3738 34.75 19.6 63.9 1.409 11.36 874 2.35 11.37 40.50 40.00<br />
Yarn Skein Response Variables<br />
Yarn<br />
Count<br />
Dye<br />
route Dips<br />
Greige<br />
Weight<br />
Boil Off<br />
Weight<br />
Dyed<br />
Weight<br />
Washed<br />
Weight %COWY<br />
Total<br />
<strong>%IOWY</strong><br />
Surface<br />
<strong>%IOWY</strong> Integ<br />
Penetration<br />
Level<br />
6.3 1 only 1 8.2544 7.9397 8.1588 7.9409 2.76% 0.210% 0.611% 12.4 0.34<br />
6.3 1--2 2 8.2514 7.945 8.2044 7.9675 3.26% 0.428% 0.959% 26.9 0.45<br />
6.3 1--3 3 8.3209 8.012 8.3459 8.0561 4.17% 0.645% 1.444% 39.4 0.45<br />
6.3 1--4 4 8.2785 7.9614 8.3492 8.0302 4.87% 1.028% 2.584% 54.8 0.40<br />
6.3 1--5 5 8.2834 7.9686 8.3555 8.0528 4.86% 1.268% 3.389% 62.5 0.37<br />
6.3 1--6 6 8.2551 7.9297 8.344 8.0413 5.22% 1.661% 4.650% 72.0 0.36<br />
6.3 1--6,6 7 8.3067 7.9951 8.4212 8.119 5.33% 1.869% 5.491% 77.1 0.34<br />
% Reflectance Readings<br />
Wavelength<br />
(nm) Dip 1 Dip 2 Dip 3 Dip 4 Dip 5 Dip 6 Dip 7<br />
400 15.83 9.91 7.38 5.51 4.71 3.86 3.50<br />
420 20.69 13.58 10.21 7.26 6.11 4.87 4.39<br />
440 19.71 12.52 9.18 6.37 5.33 4.21 3.78<br />
460 17.30 10.53 7.57 5.19 4.32 3.43 3.09<br />
480 15.33 8.92 6.18 4.21 3.51 2.79 2.53<br />
500 13.71 7.71 5.24 3.56 2.99 2.42 2.21<br />
520 11.74 6.18 4.16 2.84 2.41 1.97 1.81<br />
540 9.53 4.84 3.26 2.26 1.94 1.65 1.55<br />
560 8.30 4.08 2.77 1.96 1.72 1.50 1.43<br />
580 7.07 3.41 2.36 1.73 1.55 1.40 1.34<br />
600 5.87 2.83 2.01 1.54 1.41 1.31 1.25<br />
620 4.97 2.43 1.78 1.42 1.33 1.26 1.22<br />
640 4.14 2.10 1.61 1.35 1.29 1.27 1.20<br />
660 3.76 1.97 1.57 1.35 1.30 1.31 1.22<br />
680 4.97 2.54 1.92 1.56 1.46 1.43 1.30<br />
700 11.45 6.23 4.29 3.10 2.72 2.36 2.10<br />
336
Table A-4-1: Continued<br />
Shade<br />
Dye Bath<br />
ID<br />
Dwell<br />
(gpl<br />
Dye Dye Bath Dwell<br />
Nip<br />
Speed Time Oxidation 100% Dye Bath Alkalinity Length Oxidation Pressures<br />
(m/min) (sec) Time (sec) Indigo) Bath pH (mV) (gpl) (m) Length (m) (psi)<br />
1099 32.92 20.7 67.5 1.827 11.71 867 3.11 11.37 40.50 40.00<br />
Yarn Skein Response Variables<br />
Yarn Dye<br />
Greige Boil Off Dyed Washed<br />
Total Surface<br />
Penetration<br />
Count route Dips Weight Weight Weight Weight %COWY <strong>%IOWY</strong> <strong>%IOWY</strong> Integ Level<br />
6.3 1 only 1 7.8393 7.7815 7.976 7.7521 2.50% 0.250% 0.665% 14.2 0.38<br />
6.3 1--2 2 7.86 7.8393 8.1362 7.8361 3.79% 0.482% 1.024% 29.2 0.47<br />
6.3 1--3 3 7.9407 7.9407 8.3054 7.9527 4.59% 0.789% 1.758% 44.6 0.45<br />
6.3 1--4 4 7.9155 7.9155 8.3465 7.943 5.45% 0.916% 2.343% 52.2 0.39<br />
6.3 1--5 5 7.9914 7.9914 8.4123 8.0618 5.27% 1.249% 3.742% 65.4 0.33<br />
6.3 1--6 6 7.9182 7.9182 8.3955 7.9999 6.03% 1.488% 4.678% 72.2 0.32<br />
% Reflectance Readings<br />
Wavelength<br />
(nm) Dip 1 Dip 2 Dip 3 Dip 4 Dip 5 Dip 6 Dip 7<br />
400 14.89 9.33 6.61 5.63 4.37 3.75<br />
420 19.50 12.71 8.92 7.37 5.56 4.67<br />
440 18.45 11.65 7.94 6.50 4.86 4.06<br />
460 16.04 9.73 6.53 5.31 3.95 3.33<br />
480 14.10 8.20 5.34 4.33 3.23 2.75<br />
500 12.53 7.04 4.53 3.67 2.75 2.37<br />
520 10.70 5.68 3.63 2.95 2.25 1.96<br />
540 8.62 4.48 2.87 2.38 1.86 1.66<br />
560 7.43 3.76 2.44 2.07 1.64 1.51<br />
580 6.22 3.14 2.10 1.82 1.49 1.40<br />
600 5.12 2.62 1.81 1.62 1.38 1.32<br />
620 4.35 2.28 1.63 1.50 1.33 1.28<br />
640 3.66 2.03 1.53 1.47 1.32 1.29<br />
660 3.39 1.93 1.49 1.47 1.34 1.32<br />
680 4.49 2.47 1.82 1.71 1.50 1.45<br />
700 10.57 5.81 3.85 3.33 2.66 2.36<br />
337
Table A-4-1: Continued<br />
Shade<br />
Dye Bath<br />
ID<br />
Dwell<br />
(gpl<br />
Dye Dye Bath Dwell<br />
Nip<br />
Speed Time Oxidation 100% Dye Bath Alkalinity Length Oxidation Pressures<br />
(m/min) (sec) Time (sec) Indigo) Bath pH (mV) (gpl) (m) Length (m) (psi)<br />
1099 32.92 20.7 67.5 1.738 11.71 873 3.07 11.37 40.50 40.00<br />
Yarn Skein Response Variables<br />
Yarn<br />
Count<br />
Dye<br />
route Dips<br />
Greige<br />
Weight<br />
Boil Off<br />
Weight<br />
Dyed<br />
Weight<br />
Washed<br />
Weight %COWY<br />
Total<br />
<strong>%IOWY</strong><br />
Surface<br />
<strong>%IOWY</strong> Integ<br />
Penetration<br />
Level<br />
7.1 1 only 1 7.13 6.9251 7.1227 6.9058 2.85% 0.274% 0.687% 15.0 0.40<br />
7.1 1--2 2 7.1819 6.9748 7.2357 6.978 3.74% 0.445% 0.996% 28.2 0.45<br />
7.1 1--3 3 6.9886 6.7835 7.1097 6.8007 4.81% 0.699% 1.506% 40.5 0.46<br />
7.1 1--4 4 6.9426 6.7426 7.12 6.7755 5.60% 0.868% 2.107% 49.4 0.41<br />
7.1 1--5 5 7.201 6.9919 7.3966 7.0434 5.79% 1.199% 3.289% 61.6 0.36<br />
7.1 1--6 6 7.1282 6.9184 7.3011 6.9913 5.53% 1.388% 4.546% 71.3 0.31<br />
7.1 1--6,3 7 7.068 6.8735 7.3049 6.9644 6.28% 1.701% 5.162% 75.2 0.33<br />
% Reflectance Readings<br />
Wavelength<br />
(nm) Dip 1 Dip 2 Dip 3 Dip 4 Dip 5 Dip 6 Dip 7<br />
400 14.21 9.55 7.18 6.03 4.78 3.92 3.62<br />
420 18.66 12.96 9.75 7.96 6.13 4.95 4.52<br />
440 17.58 11.89 8.72 7.04 5.34 4.30 3.91<br />
460 15.22 9.95 7.17 5.76 4.34 3.50 3.20<br />
480 13.35 8.40 5.87 4.70 3.53 2.87 2.63<br />
500 11.84 7.24 4.99 3.98 2.99 2.46 1.94<br />
520 10.11 5.86 4.00 3.19 2.43 2.02 1.88<br />
540 8.18 4.62 3.16 2.55 1.98 1.68 1.60<br />
560 7.08 3.90 2.69 2.18 1.73 1.52 1.47<br />
580 5.96 3.25 2.29 1.90 1.57 1.39 1.35<br />
600 4.95 2.72 1.98 1.68 1.43 1.31 1.29<br />
620 4.23 2.37 1.77 1.55 1.37 1.27 1.26<br />
640 3.58 2.10 1.67 1.49 1.35 1.28 1.26<br />
660 3.33 2.00 1.64 1.49 1.38 1.30 1.29<br />
680 4.33 2.55 2.01 1.75 1.56 1.41 1.39<br />
700 9.91 5.97 4.24 3.51 2.84 2.37 2.26<br />
338
Table A-4-1: Continued<br />
Shade<br />
Dye Bath<br />
ID<br />
Dwell<br />
(gpl<br />
Dye Dye Bath Dwell<br />
Nip<br />
Speed Time Oxidation 100% Dye Bath Alkalinity Length Oxidation Pressures<br />
(m/min) (sec) Time (sec) Indigo) Bath pH (mV) (gpl) (m) Length (m) (psi)<br />
1099 32.92 20.7 67.5 1.827 11.71 867 3.11 11.37 40.50 40.00<br />
Yarn Skein Response Variables<br />
Yarn Dye<br />
Greige Boil Off Dyed Washed<br />
Total Surface<br />
Penetration<br />
Count route Dips Weight Weight Weight Weight %COWY <strong>%IOWY</strong> <strong>%IOWY</strong> Integ Level<br />
8 1 only 1 9.2313 8.896 9.177 8.8828 3.16% 0.314% 0.704% 15.7 0.45<br />
8 1--2 2 9.192 8.8576 9.2629 8.8629 4.58% 0.610% 1.051% 30.1 0.58<br />
8 1--3 3 9.2144 8.8863 9.3232 8.9124 4.92% 0.946% 1.615% 42.4 0.59<br />
8 1--6 6 9.3212 8.8924 9.4782 9.0115 6.59% 1.815% 4.990% 74.2 0.36<br />
% Reflectance Readings<br />
Wavelength<br />
(nm) Dip 1 Dip 2 Dip 3 Dip 4 Dip 5 Dip 6 Dip 7<br />
400 14.02 9.11 6.90 3.71<br />
420 18.46 12.39 9.38 4.61<br />
440 17.39 11.34 8.35 4.01<br />
460 15.05 9.46 6.86 3.28<br />
480 13.17 7.96 5.61 2.69<br />
500 11.66 6.83 4.76 2.32<br />
520 9.92 5.51 3.82 1.92<br />
540 7.98 4.35 3.03 1.63<br />
560 6.84 3.67 2.58 1.48<br />
580 5.70 3.05 2.20 1.36<br />
600 4.70 2.57 1.90 1.28<br />
620 4.00 2.24 1.71 1.24<br />
640 3.38 2.00 1.60 1.24<br />
660 3.15 1.93 1.57 1.27<br />
680 4.18 2.48 1.91 1.41<br />
700 9.84 5.70 4.06 2.33<br />
339
Table A-4-1: Continued<br />
Shade<br />
Dye Bath<br />
ID<br />
Dwell<br />
(gpl<br />
Dye Dye Bath Dwell<br />
Nip<br />
Speed Time Oxidation 100% Dye Bath Alkalinity Length Oxidation Pressures<br />
(m/min) (sec) Time (sec) Indigo) Bath pH (mV) (gpl) (m) Length (m) (psi)<br />
1099 32.92 20.7 67.5 1.615 11.61 863 3.12 11.37 40.50 40.00<br />
Yarn Skein Response Variables<br />
Yarn<br />
Count<br />
Dye<br />
route Dips<br />
Greige<br />
Weight<br />
Boil Off<br />
Weight<br />
Dyed<br />
Weight<br />
Washed<br />
Weight %COWY<br />
Total<br />
<strong>%IOWY</strong><br />
Surface<br />
<strong>%IOWY</strong> Integ<br />
Penetration<br />
Level<br />
12 1 only 1 6.2704 6.0839 6.3259 6.0759 3.98% 0.293% 0.649% 13.7 0.45<br />
12 1--2 2 6.3197 6.137 6.4326 6.1427 4.82% 0.543% 0.982% 27.7 0.55<br />
12 1--3 3 6.2591 6.0727 6.4005 6.0945 5.40% 0.883% 1.669% 43.2 0.53<br />
12 1--4 4 6.3126 6.1273 6.5078 6.172 6.21% 1.084% 2.499% 53.9 0.43<br />
12 1--5 5 6.1723 5.9917 6.3383 6.0469 5.78% 1.322% 3.318% 61.9 0.40<br />
12 1--6 6 6.2837 6.0954 6.4653 6.1761 6.07% 1.534% 4.365% 70.1 0.35<br />
12 1--6,3 7 6.2179 6.032 6.4599 6.1393 7.09% 1.915% 5.421% 76.7 0.35<br />
% Reflectance Readings<br />
Wavelength<br />
(nm) Dip 1 Dip 2 Dip 3 Dip 4 Dip 5 Dip 6 Dip 7<br />
400 15.29 9.62 6.82 5.55 4.70 4.05 3.46<br />
420 19.99 12.97 9.17 7.20 6.02 5.11 4.28<br />
440 18.80 11.88 8.13 6.33 5.25 4.46 3.69<br />
460 16.28 9.96 6.67 5.15 4.28 3.62 3.01<br />
480 14.30 8.42 5.45 4.19 3.48 2.96 2.47<br />
500 12.70 7.26 4.63 3.54 2.96 2.53 2.15<br />
520 10.89 5.89 3.71 2.87 2.42 2.07 1.80<br />
540 8.84 4.67 2.95 2.30 1.97 1.73 1.55<br />
560 7.67 3.95 2.51 1.99 1.74 1.55 1.43<br />
580 6.49 3.31 2.15 1.76 1.56 1.40 1.34<br />
600 5.40 2.78 1.88 1.58 1.44 1.31 1.28<br />
620 4.62 2.44 1.70 1.48 1.37 1.27 1.28<br />
640 3.91 2.17 1.60 1.44 1.36 1.28 1.31<br />
660 3.64 2.10 1.61 1.47 1.38 1.27 1.36<br />
680 4.72 2.67 1.94 1.69 1.54 1.42 1.49<br />
700 10.63 6.04 3.99 3.26 2.80 2.44 2.28<br />
340
Table A-4-1: Continued<br />
Shade<br />
Dye Bath<br />
ID<br />
Dwell<br />
(gpl<br />
Dye Dye Bath Dwell<br />
Nip<br />
Speed Time Oxidation 100% Dye Bath Alkalinity Length Oxidation Pressures<br />
(m/min) (sec) Time (sec) Indigo) Bath pH (mV) (gpl) (m) Length (m) (psi)<br />
x3319 27.43 25 81 1.848 12.19 801 2.55 11.37 40.50 40.00<br />
Yarn Skein Response Variables<br />
Yarn Dye<br />
Greige Boil Off Dyed Washed<br />
Total Surface<br />
Penetration<br />
Count route Dips Weight Weight Weight Weight %COWY <strong>%IOWY</strong> <strong>%IOWY</strong> Integ Level<br />
6.3 1 only 1 7.2411 6.9752 7.1837 6.9426 2.99% 0.361% 0.788% 19.4 0.46<br />
6.3 1--2 2 7.2213 6.9499 7.2304 6.9491 4.04% 0.657% 1.229% 34.9 0.53<br />
6.3 1--6 6 7.0463 6.7812 7.2084 6.879 6.30% 2.210% 6.007% 79.9 0.37<br />
% Reflectance Readings<br />
Wavelength<br />
(nm) Dip 1 Dip 2 Dip 3 Dip 4 Dip 5 Dip 6 Dip 7<br />
400 12.41 7.98 3.14<br />
420 16.61 10.98 3.77<br />
440 15.48 9.97 3.23<br />
460 13.23 8.28 2.67<br />
480 11.42 6.84 2.20<br />
500 10.02 5.83 1.94<br />
520 8.33 4.67 1.66<br />
540 6.65 3.69 1.48<br />
560 5.61 3.13 1.39<br />
580 4.65 2.65 1.33<br />
600 3.83 2.25 1.32<br />
620 3.25 1.99 1.32<br />
640 2.79 1.82 1.40<br />
660 2.60 1.76 1.48<br />
680 3.38 2.17 1.61<br />
700 8.24 4.79 2.27<br />
341
Table A-4-1: Continued<br />
Shade<br />
Dye Bath<br />
ID<br />
Dwell<br />
(gpl<br />
Dye Dye Bath Dwell<br />
Nip<br />
Speed Time Oxidation 100% Dye Bath Alkalinity Length Oxidation Pressures<br />
(m/min) (sec) Time (sec) Indigo) Bath pH (mV) (gpl) (m) Length (m) (psi)<br />
x3319 27.43 25 81 1.848 12.19 801 2.55 11.37 40.50 40.00<br />
Yarn Skein Response Variables<br />
Yarn Dye<br />
Greige Boil Off Dyed Washed<br />
Total Surface<br />
Penetration<br />
Count route Dips Weight Weight Weight Weight %COWY <strong>%IOWY</strong> <strong>%IOWY</strong> Integ Level<br />
12 1 only 1 3.7058 3.5809 3.7472 3.5754 4.64% 0.484% 0.823% 21.1 0.59<br />
12 1--2 2 3.6324 3.5067 3.6773 3.5192 4.86% 0.947% 1.511% 40.6 0.63<br />
12 1--3 3 3.759 3.6322 3.8482 3.6585 5.95% 1.426% 2.462% 53.5 0.58<br />
12 1--6 6 3.7118 3.5766 3.857 3.6567 7.84% 2.595% 6.728% 83.3 0.39<br />
% Reflectance Readings<br />
Wavelength<br />
(nm) Dip 1 Dip 2 Dip 3 Dip 4 Dip 5 Dip 6 Dip 7<br />
400 11.65 7.15 5.53 3.15<br />
420 15.58 9.74 7.20 3.82<br />
440 14.43 8.68 6.31 3.27<br />
460 12.29 7.16 5.14 2.68<br />
480 10.57 5.87 4.18 2.20<br />
500 9.27 5.00 3.56 1.93<br />
520 7.68 4.00 2.87 1.62<br />
540 6.15 3.16 2.31 1.43<br />
560 5.19 2.69 2.01 1.32<br />
580 4.33 2.30 1.78 1.26<br />
600 3.59 1.97 1.60 1.22<br />
620 3.07 1.76 1.49 1.22<br />
640 2.66 1.66 1.46 1.27<br />
660 2.51 1.61 1.47 1.34<br />
680 3.25 1.96 1.70 1.47<br />
700 7.58 4.15 3.22 2.14<br />
342
Table A-4-1: Continued<br />
Shade<br />
Dye Bath<br />
ID<br />
Dwell<br />
(gpl<br />
Dye Dye Bath Dwell<br />
Nip<br />
Speed Time Oxidation 100% Dye Bath Alkalinity Length Oxidation Pressures<br />
(m/min) (sec) Time (sec) Indigo) Bath pH (mV) (gpl) (m) Length (m) (psi)<br />
q1910 34.75 19.4 63.9 1.831 11.54 875 4.56 11.37 40.50 40.00<br />
Yarn Skein Response Variables<br />
Yarn<br />
Count<br />
Dye<br />
route Dips<br />
Greige<br />
Weight<br />
Boil Off<br />
Weight<br />
Dyed<br />
Weight<br />
Washed<br />
Weight %COWY<br />
Total<br />
<strong>%IOWY</strong><br />
Surface<br />
<strong>%IOWY</strong> Integ<br />
Penetration<br />
Level<br />
6.3 1 only 1 8.2323 7.9272 8.3113 7.9373 4.85% 0.304% 0.767% 18.5 0.40<br />
6.3 1--2 2 8.2581 7.9618 8.4448 8 6.07% 0.519% 1.273% 35.9 0.41<br />
6.3 1--3 3 8.485 8.1695 8.6831 8.2328 6.29% 0.770% 2.292% 51.6 0.34<br />
6.3 1--4 4 8.3714 8.0747 8.7107 8.1577 7.88% 1.223% 4.101% 68.2 0.30<br />
6.3 1--5 5 8.3184 8.0223 8.6216 8.1279 7.47% 1.433% 5.208% 75.5 0.28<br />
6.3 1--6 6 8.2286 7.9186 8.5442 8.0586 7.90% 1.806% 6.792% 83.6 0.27<br />
6.3 1--6,6 7 8.3819 8.0795 8.7471 8.2544 8.26% 2.010% 8.190% 89.2 0.25<br />
% Reflectance Readings<br />
Wavelength<br />
(nm) Dip 1 Dip 2 Dip 3 Dip 4 Dip 5 Dip 6 Dip 7<br />
400 12.54 7.89 5.79 4.22 3.72 3.13 2.85<br />
420 16.85 10.93 7.79 5.49 4.79 3.90 3.51<br />
440 15.81 9.93 6.87 4.78 4.14 3.37 3.03<br />
460 13.58 8.23 5.61 3.87 3.35 2.75 2.48<br />
480 11.76 6.78 4.53 3.12 2.70 2.23 2.02<br />
500 10.37 5.79 3.85 2.67 2.34 1.98 1.80<br />
520 8.63 4.60 3.06 2.15 1.89 1.63 1.51<br />
540 6.92 3.61 2.44 1.76 1.59 1.43 1.34<br />
560 5.87 3.05 2.09 1.57 1.43 1.31 1.25<br />
580 4.91 2.58 1.82 1.43 1.32 1.25 1.19<br />
600 4.04 2.18 1.62 1.33 1.24 1.20 1.16<br />
620 3.42 1.91 1.47 1.27 1.19 1.17 1.14<br />
640 2.89 1.71 1.39 1.26 1.18 1.17 1.15<br />
660 2.71 1.68 1.40 1.30 1.21 1.22 1.21<br />
680 3.59 2.17 1.69 1.51 1.39 1.36 1.36<br />
700 8.67 4.84 3.37 2.62 2.32 2.04 1.94<br />
343
Table A-4-1: Continued<br />
Shade<br />
Dye Bath<br />
ID<br />
Dwell<br />
(gpl<br />
Dye Dye Bath Dwell<br />
Nip<br />
Speed Time Oxidation 100% Dye Bath Alkalinity Length Oxidation Pressures<br />
(m/min) (sec) Time (sec) Indigo) Bath pH (mV) (gpl) (m) Length (m) (psi)<br />
q1910 34.75 19.4 63.9 1.831 11.54 875 4.56 11.37 40.50 40.00<br />
Yarn Skein Response Variables<br />
Yarn<br />
Count<br />
Dye<br />
route Dips<br />
Greige<br />
Weight<br />
Boil Off<br />
Weight<br />
Dyed<br />
Weight<br />
Washed<br />
Weight %COWY<br />
Total<br />
<strong>%IOWY</strong><br />
Surface<br />
<strong>%IOWY</strong> Integ<br />
Penetration<br />
Level<br />
7.1 1 only 1 7.2029 7.0332 7.3818 7.0399 4.96% 0.310% 0.760% 18.2 0.41<br />
7.1 1--2 2 7.333 7.1592 7.552 7.1788 5.49% 0.640% 1.296% 36.4 0.49<br />
7.1 1--3 3 7.2629 7.0885 7.5579 7.1394 6.62% 0.994% 2.462% 53.5 0.40<br />
7.1 1--4 4 7.3773 7.2105 7.7982 7.2833 8.15% 1.484% 4.344% 69.9 0.34<br />
7.1 1--5 5 7.2513 7.0835 7.671 7.1767 8.29% 1.705% 5.098% 74.8 0.33<br />
7.1 1--6 6 7.1983 7.0364 7.6291 7.1597 8.42% 1.984% 6.156% 80.6 0.32<br />
7.1 1--6,6 7 7.2217 7.0393 7.6763 7.1922 9.05% 2.450% 8.627% 90.7 0.28<br />
% Reflectance Readings<br />
Wavelength<br />
(nm) Dip 1 Dip 2 Dip 3 Dip 4 Dip 5 Dip 6 Dip 7<br />
400 12.44 7.84 5.71 4.19 3.74 3.32 2.80<br />
420 16.73 10.85 7.68 5.45 4.81 4.21 3.46<br />
440 15.77 9.86 6.77 4.73 4.16 3.62 2.97<br />
460 13.60 8.17 5.50 3.81 3.36 2.93 2.44<br />
480 11.79 6.71 4.44 3.06 2.71 2.36 1.97<br />
500 10.45 5.74 3.76 2.62 2.34 2.07 1.76<br />
520 8.75 4.56 2.98 2.10 1.89 1.70 1.49<br />
540 7.04 3.57 2.37 1.72 1.60 1.47 1.32<br />
560 5.99 3.02 2.01 1.53 1.44 1.35 1.22<br />
580 5.03 2.55 1.76 1.39 1.33 1.27 1.18<br />
600 4.15 2.16 1.55 1.29 1.26 1.23 1.15<br />
620 3.52 1.88 1.41 1.23 1.21 1.19 1.12<br />
640 2.96 1.69 1.33 1.23 1.22 1.20 1.16<br />
660 2.75 1.65 1.35 1.29 1.26 1.27 1.21<br />
680 3.63 2.12 1.64 1.50 1.44 1.43 1.37<br />
700 8.60 4.70 3.29 2.57 2.35 2.14 1.92<br />
344
Table A-4-1: Continued<br />
Shade<br />
Dye Bath<br />
ID<br />
Dwell<br />
(gpl<br />
Dye Dye Bath Dwell<br />
Nip<br />
Speed Time Oxidation 100% Dye Bath Alkalinity Length Oxidation Pressures<br />
(m/min) (sec) Time (sec) Indigo) Bath pH (mV) (gpl) (m) Length (m) (psi)<br />
q1910 34.75 19.4 63.9 1.831 11.54 875 4.56 11.37 40.50 40.00<br />
Yarn Skein Response Variables<br />
Yarn<br />
Count<br />
Dye<br />
route Dips<br />
Greige<br />
Weight<br />
Boil Off<br />
Weight<br />
Dyed<br />
Weight<br />
Washed<br />
Weight %COWY<br />
Total<br />
<strong>%IOWY</strong><br />
Surface<br />
<strong>%IOWY</strong> Integ<br />
Penetration<br />
Level<br />
8 1 only 1 9.3656 9.0787 9.5368 9.0704 5.05% 0.334% 0.736% 17.1 0.45<br />
8 1--2 2 9.2041 8.899 9.4735 8.9336 6.46% 0.649% 1.253% 35.5 0.52<br />
8 1--3 3 9.2402 8.9373 9.6106 9.0075 7.53% 1.042% 2.284% 51.5 0.46<br />
8 1--4 4 9.3055 9.0069 9.7547 9.1089 8.30% 1.467% 4.250% 69.2 0.35<br />
8 1--5 5 9.3216 9.035 9.7564 9.1587 7.98% 1.667% 4.942% 73.9 0.34<br />
8 1--6 6 9.5513 9.2395 10.0173 9.4061 8.42% 1.982% 6.549% 82.5 0.30<br />
8 1--6,6 7 9.4464 9.1405 10.0175 9.3583 9.59% 2.447% 8.610% 90.6 0.28<br />
% Reflectance Readings<br />
Wavelength<br />
(nm) Dip 1 Dip 2 Dip 3 Dip 4 Dip 5 Dip 6 Dip 7<br />
400 12.96 7.94 5.73 4.20 3.76 3.25 2.77<br />
420 17.29 10.94 7.67 5.41 4.80 4.07 3.36<br />
440 16.26 9.91 6.77 4.69 4.16 3.49 2.88<br />
460 14.05 8.23 5.51 3.80 3.38 2.84 2.38<br />
480 12.19 6.75 4.43 3.06 2.72 2.28 1.94<br />
500 10.79 5.78 3.77 2.61 2.35 2.00 1.73<br />
520 9.11 4.61 3.01 2.11 1.92 1.66 1.48<br />
540 7.34 3.63 2.41 1.74 1.62 1.44 1.32<br />
560 6.29 3.08 2.08 1.54 1.46 1.33 1.24<br />
580 5.32 2.62 1.84 1.41 1.36 1.25 1.19<br />
600 4.41 2.22 1.64 1.31 1.28 1.20 1.16<br />
620 3.77 1.97 1.51 1.26 1.24 1.18 1.15<br />
640 3.19 1.77 1.45 1.24 1.23 1.19 1.18<br />
660 2.98 1.72 1.46 1.27 1.28 1.26 1.22<br />
680 3.84 2.20 1.75 1.48 1.47 1.43 1.38<br />
700 8.82 4.78 3.37 2.54 2.36 2.13 1.92<br />
345
Table A-4-1: Continued<br />
Shade<br />
Dye Bath<br />
ID<br />
Dwell<br />
(gpl<br />
Dye Dye Bath Dwell<br />
Nip<br />
Speed Time Oxidation 100% Dye Bath Alkalinity Length Oxidation Pressures<br />
(m/min) (sec) Time (sec) Indigo) Bath pH (mV) (gpl) (m) Length (m) (psi)<br />
q1910 34.75 19.4 63.9 1.831 11.54 875 4.56 11.37 40.50 40.00<br />
Yarn Skein Response Variables<br />
Yarn<br />
Count<br />
Dye<br />
route Dips<br />
Greige<br />
Weight<br />
Boil Off<br />
Weight<br />
Dyed<br />
Weight<br />
Washed<br />
Weight %COWY<br />
Total<br />
<strong>%IOWY</strong><br />
Surface<br />
<strong>%IOWY</strong> Integ<br />
Penetration<br />
Level<br />
12 1 only 1 6.3961 6.2118 6.5552 6.2301 5.53% 0.365% 0.760% 18.1 0.48<br />
12 1--2 2 6.4423 6.2676 6.6617 6.3022 6.29% 0.743% 1.405% 38.6 0.53<br />
12 1--3 3 6.4742 6.2971 6.7834 6.3538 7.72% 1.062% 2.284% 51.5 0.47<br />
12 1--4 4 6.4341 6.2628 6.8095 6.3536 8.73% 1.618% 3.944% 67.0 0.41<br />
12 1--5 5 6.6569 6.4754 7.0561 6.5851 8.97% 1.891% 5.059% 74.6 0.37<br />
12 1--6 6 6.3026 6.1314 6.6941 6.2694 9.18% 2.194% 6.088% 80.3 0.36<br />
12 1--6,6 7 6.2438 6.0627 6.6495 6.2253 9.68% 2.695% 8.236% 89.3 0.33<br />
% Reflectance Readings<br />
Wavelength<br />
(nm) Dip 1 Dip 2 Dip 3 Dip 4 Dip 5 Dip 6 Dip 7<br />
400 12.78 7.56 5.88 4.32 3.82 3.41 2.89<br />
420 17.00 10.36 7.85 5.57 4.86 4.27 3.55<br />
440 15.90 9.34 6.91 4.83 4.20 3.68 3.04<br />
460 13.67 7.72 5.63 3.92 3.40 2.99 2.48<br />
480 11.82 6.31 4.53 3.15 2.73 2.41 2.01<br />
500 10.42 5.38 3.84 2.69 2.35 2.11 1.78<br />
520 8.73 4.29 3.06 2.18 1.91 1.73 1.51<br />
540 7.03 3.37 2.44 1.79 1.60 1.48 1.33<br />
560 5.98 2.84 2.09 1.59 1.44 1.34 1.25<br />
580 5.02 2.41 1.83 1.46 1.34 1.28 1.19<br />
600 4.15 2.04 1.62 1.35 1.25 1.21 1.16<br />
620 3.54 1.79 1.48 1.30 1.21 1.18 1.14<br />
640 2.99 1.63 1.41 1.30 1.22 1.21 1.17<br />
660 2.79 1.61 1.42 1.35 1.27 1.26 1.24<br />
680 3.67 2.05 1.71 1.56 1.46 1.45 1.39<br />
700 8.66 4.50 3.39 2.65 2.37 2.19 1.95<br />
346
Table A-4-1: Continued<br />
Shade<br />
Dye Bath<br />
ID<br />
Dwell<br />
(gpl<br />
Dye Dye Bath Dwell<br />
Nip<br />
Speed Time Oxidation 100% Dye Bath Alkalinity Length Oxidation Pressures<br />
(m/min) (sec) Time (sec) Indigo) Bath pH (mV) (gpl) (m) Length (m) (psi)<br />
x3313 32.92 20.7 67.5 1.762 12.31 795 3.12 11.37 40.50 40.00<br />
Yarn Skein Response Variables<br />
Yarn Dye<br />
Greige Boil Off Dyed Washed<br />
Total Surface<br />
Penetration<br />
Count route Dips Weight Weight Weight Weight %COWY <strong>%IOWY</strong> <strong>%IOWY</strong> Integ Level<br />
6.3 1 only 1 7.0088 6.7264 7.0731 6.8342 5.15% 0.384% 0.777% 18.9 0.49<br />
6.3 1--2 2 7.2426 6.9697 7.2378 6.957 3.85% 0.625% 1.221% 34.7 0.51<br />
6.3 1--3 3 7.1191 6.8402 7.1819 6.8554 5.00% 0.985% 2.327% 52.0 0.42<br />
6.3 1--4 4 7.3453 7.058 7.4495 7.0843 5.55% 1.284% 3.179% 60.6 0.40<br />
6.3 1--5 5 7.1441 6.874 7.2638 6.9278 5.67% 1.590% 4.411% 70.4 0.36<br />
6.3 1--6 6 7.2771 7.0013 7.3976 7.0653 5.66% 1.847% 5.147% 75.1 0.36<br />
% Reflectance Readings<br />
Wavelength<br />
(nm) Dip 1 Dip 2 Dip 3 Dip 4 Dip 5 Dip 6 Dip 7<br />
400 12.20 7.93 5.70 4.73 3.99 3.57<br />
420 16.25 10.89 7.50 6.03 5.02 4.42<br />
440 15.18 9.88 6.58 5.25 4.32 3.77<br />
460 13.01 8.18 5.34 4.25 3.48 3.05<br />
480 11.30 6.77 4.34 3.46 2.84 2.48<br />
500 9.99 5.80 3.69 2.95 2.44 2.16<br />
520 8.36 4.65 2.95 2.40 1.98 1.79<br />
540 6.72 3.68 2.38 1.97 1.67 1.55<br />
560 5.73 3.14 2.06 1.75 1.52 1.44<br />
580 4.81 2.66 1.81 1.59 1.41 1.36<br />
600 3.99 2.27 1.62 1.48 1.34 1.32<br />
620 3.44 2.04 1.53 1.44 1.33 1.34<br />
640 2.91 1.84 1.47 1.43 1.34 1.36<br />
660 2.76 1.85 1.53 1.54 1.48 1.53<br />
680 3.55 2.30 1.83 1.78 1.69 1.73<br />
700 8.21 4.90 3.45 3.04 2.66 2.53<br />
347
Table A-4-1: Continued<br />
Shade<br />
Dye Bath<br />
ID<br />
Dwell<br />
(gpl<br />
Dye Dye Bath Dwell<br />
Nip<br />
Speed Time Oxidation 100% Dye Bath Alkalinity Length Oxidation Pressures<br />
(m/min) (sec) Time (sec) Indigo) Bath pH (mV) (gpl) (m) Length (m) (psi)<br />
x3313 32.92 20.7 67.5 1.762 12.31 795 3.12 11.37 40.50 40.00<br />
Yarn Skein Response Variables<br />
Yarn Dye<br />
Greige Boil Off Dyed Washed<br />
Total Surface<br />
Penetration<br />
Count route Dips Weight Weight Weight Weight %COWY <strong>%IOWY</strong> <strong>%IOWY</strong> Integ Level<br />
7.1 1 only 1 5.8487 5.7 5.8979 5.6788 3.47% 0.359% 0.742% 17.3 0.48<br />
7.1 1--2 2 6.5628 6.3415 6.6026 6.3355 4.12% 0.615% 1.146% 32.8 0.54<br />
7.1 1--3 3 6.499 6.2929 6.5905 6.3009 4.73% 1.011% 2.175% 50.2 0.46<br />
7.1 1--4 4 6.5925 6.3731 6.7401 6.4029 5.76% 1.360% 3.362% 62.3 0.40<br />
% Reflectance Readings<br />
Wavelength<br />
(nm) Dip 1 Dip 2 Dip 3 Dip 4 Dip 5 Dip 6 Dip 7<br />
400 12.95 8.44 5.89 4.70<br />
420 17.18 11.61 7.83 6.06<br />
440 16.15 10.54 6.89 5.25<br />
460 13.91 8.72 5.60 4.23<br />
480 12.14 7.25 4.55 3.44<br />
500 10.77 6.20 3.87 2.91<br />
520 9.07 4.97 3.10 2.37<br />
540 7.32 3.92 2.48 1.94<br />
560 6.24 3.33 2.14 1.71<br />
580 5.23 2.80 1.87 1.55<br />
600 4.32 2.38 1.66 1.43<br />
620 3.70 2.12 1.56 1.39<br />
640 3.11 1.91 1.49 1.36<br />
660 2.96 1.89 1.55 1.46<br />
680 3.84 2.38 1.85 1.71<br />
700 8.95 5.18 3.55 2.94<br />
348
Table A-4-1: Continued<br />
Shade<br />
Dye Bath<br />
ID<br />
Dwell<br />
(gpl<br />
Dye Dye Bath Dwell<br />
Nip<br />
Speed Time Oxidation 100% Dye Bath Alkalinity Length Oxidation Pressures<br />
(m/min) (sec) Time (sec) Indigo) Bath pH (mV) (gpl) (m) Length (m) (psi)<br />
x3313 32.92 20.7 67.5 1.762 12.31 795 3.12 11.37 40.50 40.00<br />
Yarn Skein Response Variables<br />
Yarn Dye<br />
Greige Boil Off Dyed Washed<br />
Total Surface<br />
Penetration<br />
Count route Dips Weight Weight Weight Weight %COWY <strong>%IOWY</strong> <strong>%IOWY</strong> Integ Level<br />
8 1 only 1 5.8101 5.6212 5.8169 5.6029 3.48% 0.396% 0.766% 18.4 0.52<br />
8 1--2 2 5.7765 5.64 5.8693 5.6401 4.07% 0.698% 1.187% 33.9 0.59<br />
8 1--3 3 5.726 5.5375 5.8057 5.5472 4.84% 1.055% 2.052% 48.7 0.51<br />
8 1--4 4 5.8234 5.6296 5.946 5.6582 5.62% 1.445% 3.132% 60.2 0.46<br />
% Reflectance Readings<br />
Wavelength<br />
(nm) Dip 1 Dip 2 Dip 3 Dip 4 Dip 5 Dip 6 Dip 7<br />
400 12.33 7.92 6.04 4.84<br />
420 16.40 10.81 8.08 6.22<br />
440 15.36 9.87 7.07 5.37<br />
460 13.21 8.23 5.74 4.33<br />
480 11.52 6.85 4.67 3.52<br />
500 10.20 5.89 3.96 2.99<br />
520 8.56 4.74 3.17 2.43<br />
540 6.92 3.77 2.55 1.99<br />
560 5.90 3.23 2.20 1.77<br />
580 4.95 2.74 1.93 1.60<br />
600 4.11 2.35 1.72 1.48<br />
620 3.53 2.11 1.61 1.44<br />
640 2.99 1.90 1.53 1.43<br />
660 2.83 1.91 1.60 1.53<br />
680 3.64 2.39 1.90 1.77<br />
700 8.47 5.08 3.64 3.03<br />
349
Table A-4-1: Continued<br />
Shade<br />
Dye Bath<br />
ID<br />
Dwell<br />
(gpl<br />
Dye Dye Bath Dwell<br />
Nip<br />
Speed Time Oxidation 100% Dye Bath Alkalinity Length Oxidation Pressures<br />
(m/min) (sec) Time (sec) Indigo) Bath pH (mV) (gpl) (m) Length (m) (psi)<br />
x3313 32.92 20.7 67.5 1.762 12.31 795 3.12 11.37 40.50 40.00<br />
Yarn Skein Response Variables<br />
Yarn Dye<br />
Greige Boil Off Dyed Washed<br />
Total Surface<br />
Penetration<br />
Count route Dips Weight Weight Weight Weight %COWY <strong>%IOWY</strong> <strong>%IOWY</strong> Integ Level<br />
12 1 only 1 3.7928 3.6563 3.8136 3.6513 4.30% 0.500% 0.810% 20.4 0.62<br />
12 1--2 2 3.6681 3.5419 3.6959 3.5516 4.35% 0.848% 1.339% 37.3 0.63<br />
12 1--3 3 3.6897 3.5664 3.7866 3.5817 6.17% 1.298% 2.361% 52.4 0.55<br />
12 1--4 4 3.7325 3.5998 3.8364 3.6348 6.57% 1.727% 3.586% 64.1 0.48<br />
12 1--5 5 3.7053 3.581 3.8509 3.6372 7.54% 2.167% 4.842% 73.2 0.45<br />
12 1--6 6 3.7607 3.6263 3.912 3.6989 7.88% 2.614% 5.975% 79.7 0.44<br />
% Reflectance Readings<br />
Wavelength<br />
(nm) Dip 1 Dip 2 Dip 3 Dip 4 Dip 5 Dip 6 Dip 7<br />
400 11.65 7.71 5.70 4.55 3.83 3.27<br />
420 15.46 10.50 7.47 5.80 4.74 3.98<br />
440 14.38 9.43 6.55 5.02 4.07 3.41<br />
460 12.30 7.79 5.33 4.05 3.28 2.79<br />
480 10.65 6.40 4.34 3.30 2.67 2.28<br />
500 9.38 5.47 3.68 2.80 2.29 1.99<br />
520 7.82 4.37 2.95 2.27 1.88 1.67<br />
540 6.29 3.46 2.37 1.87 1.59 1.47<br />
560 5.35 2.94 2.05 1.66 1.47 1.37<br />
580 4.49 2.49 1.80 1.51 1.36 1.30<br />
600 3.72 2.12 1.61 1.40 1.31 1.28<br />
620 3.22 1.90 1.52 1.37 1.33 1.31<br />
640 2.74 1.71 1.46 1.37 1.35 1.35<br />
660 2.63 1.72 1.53 1.47 1.50 1.54<br />
680 3.39 2.17 1.82 1.71 1.72 1.73<br />
700 7.80 4.62 3.45 2.87 2.60 2.41<br />
350
Table A-4-1: Continued<br />
Shade<br />
Dye Bath<br />
ID<br />
Dwell<br />
(gpl<br />
Dye Dye Bath Dwell<br />
Nip<br />
Speed Time Oxidation 100% Dye Bath Alkalinity Length Oxidation Pressures<br />
(m/min) (sec) Time (sec) Indigo) Bath pH (mV) (gpl) (m) Length (m) (psi)<br />
4223 32.92 20.7 67.5 2.07 12.49 907 3.75 11.37 40.50 40.00<br />
Yarn Skein Response Variables<br />
Yarn<br />
Greige Boil Off Dyed Washed<br />
Total Surface<br />
Penetration<br />
Count Dye route Dips Weight Weight Weight Weight %COWY <strong>%IOWY</strong> <strong>%IOWY</strong> Integ Level<br />
6.3 1 only 1 7.0745 6.9739 7.1606 6.8906 2.68% 0.333% 0.694% 15.3 0.48<br />
6.3 1--2 2 7.0767 6.9669 7.2175 6.8938 3.60% 0.630% 0.992% 28.1 0.63<br />
6.3 1-2,2 3 7.0788 6.9842 7.2548 6.9179 3.87% 0.961% 1.379% 38.1 0.70<br />
6.3 1-2,2,2 4 7.0893 6.985 7.2603 6.9307 3.94% 1.094% 1.784% 45.0 0.61<br />
6.3 1-2,2,2,2 5 7.0793 6.9933 7.2746 6.9562 4.02% 1.461% 2.491% 53.8 0.59<br />
6.3 1-2,2,2,2,2<br />
1-<br />
6 7.025 6.916 7.252 6.9043 4.86% 1.551% 2.859% 57.6 0.54<br />
6.3 2,2,2,2,2,2 7 7.0844 6.9686 7.3252 6.9766 5.12% 1.828% 3.468% 63.2 0.53<br />
% Reflectance Readings<br />
Wavelength<br />
(nm) Dip 1 Dip 2 Dip 3 Dip 4 Dip 5 Dip 6 Dip 7<br />
400 14.19 9.39 7.44 6.35 5.36 4.82 4.33<br />
420 18.75 12.78 10.13 8.53 6.96 6.13 5.46<br />
440 17.70 11.80 9.17 7.60 6.17 5.43 4.81<br />
460 15.32 9.95 7.61 6.26 5.06 4.48 3.95<br />
480 13.40 8.41 6.26 5.11 4.13 3.67 3.25<br />
500 11.89 7.26 5.33 4.33 3.51 3.14 2.78<br />
520 10.04 5.85 4.26 3.48 2.83 2.57 2.29<br />
540 8.09 4.64 3.37 2.79 2.30 2.13 1.92<br />
560 6.96 3.91 2.87 2.40 2.00 1.87 1.72<br />
580 5.82 3.27 2.44 2.09 1.77 1.69 1.57<br />
600 4.79 2.74 2.09 1.85 1.61 1.56 1.46<br />
620 4.05 2.37 1.85 1.68 1.49 1.47 1.39<br />
640 3.42 2.08 1.68 1.59 1.44 1.45 1.39<br />
660 3.20 2.00 1.66 1.56 1.42 1.45 1.40<br />
680 4.27 2.59 2.04 1.85 1.61 1.59 1.51<br />
700 10.09 6.04 4.43 3.67 3.08 2.84 2.56<br />
351
Table A-4-1: Continued<br />
Shade<br />
Dye Bath<br />
ID<br />
Dwell<br />
(gpl<br />
Dye Dye Bath Dwell<br />
Nip<br />
Speed Time Oxidation 100% Dye Bath Alkalinity Length Oxidation Pressures<br />
(m/min) (sec) Time (sec) Indigo) Bath pH (mV) (gpl) (m) Length (m) (psi)<br />
4223 32.92 20.7 67.5 2.07 12.49 907 3.75 11.37 40.50 40.00<br />
Yarn Skein Response Variables<br />
Yarn Dye<br />
Greige Boil Off Dyed Washed<br />
Total Surface<br />
Penetration<br />
Count route Dips Weight Weight Weight Weight %COWY <strong>%IOWY</strong> <strong>%IOWY</strong> Integ Level<br />
7.1 1 only 1 6.475 6.3967 6.5935 6.3195 3.08% 0.343% 0.701% 15.6 0.49<br />
7.1 1--2 2 6.5846 6.5142 6.7445 6.4489 3.54% 0.640% 0.977% 27.6 0.66<br />
% Reflectance Readings<br />
Wavelength<br />
(nm) Dip 1 Dip 2 Dip 3 Dip 4 Dip 5 Dip 6 Dip 7<br />
400 14.36 9.79<br />
420 18.81 13.24<br />
440 17.73 12.20<br />
460 15.32 10.24<br />
480 13.35 8.63<br />
500 11.81 7.46<br />
520 10.00 6.02<br />
540 8.04 4.77<br />
560 6.88 4.01<br />
580 5.73 3.33<br />
600 4.71 2.78<br />
620 3.98 2.39<br />
640 3.36 2.10<br />
660 3.17 2.01<br />
680 4.25 2.62<br />
700 10.14 6.19<br />
352
Table A-4-1: Continued<br />
Shade<br />
Dye Bath<br />
ID<br />
Dwell<br />
(gpl<br />
Dye Dye Bath Dwell<br />
Nip<br />
Speed Time Oxidation 100% Dye Bath Alkalinity Length Oxidation Pressures<br />
(m/min) (sec) Time (sec) Indigo) Bath pH (mV) (gpl) (m) Length (m) (psi)<br />
4223 32.92 20.7 67.5 2.07 12.49 907 3.75 11.37 40.50 40.00<br />
Yarn Skein Response Variables<br />
Yarn Dye<br />
Greige Boil Off Dyed Washed<br />
Total Surface<br />
Penetration<br />
Count route Dips Weight Weight Weight Weight %COWY <strong>%IOWY</strong> <strong>%IOWY</strong> Integ Level<br />
8 1 only 1 5.7344 5.661 5.8671 5.6131 3.64% 0.321% 0.693% 15.3 0.46<br />
8 1--2 2 5.6597 5.5909 5.8276 5.5547 4.23% 0.634% 0.995% 28.2 0.64<br />
% Reflectance Readings<br />
Wavelength<br />
(nm) Dip 1 Dip 2 Dip 3 Dip 4 Dip 5 Dip 6 Dip 7<br />
400 14.29 9.50<br />
420 18.79 12.85<br />
440 17.78 11.85<br />
460 15.42 9.95<br />
480 13.46 8.39<br />
500 11.93 7.24<br />
520 10.12 5.84<br />
540 8.15 4.63<br />
560 7.01 3.91<br />
580 5.86 3.26<br />
600 4.82 2.73<br />
620 4.07 2.36<br />
640 3.44 2.09<br />
660 3.21 2.00<br />
680 4.29 2.59<br />
700 10.14 6.00<br />
353
Table A-4-1: Continued<br />
Shade<br />
Dye Bath<br />
ID<br />
Dwell<br />
(gpl<br />
Dye Dye Bath Dwell<br />
Nip<br />
Speed Time Oxidation 100% Dye Bath Alkalinity Length Oxidation Pressures<br />
(m/min) (sec) Time (sec) Indigo) Bath pH (mV) (gpl) (m) Length (m) (psi)<br />
4223 32.92 20.7 67.5 2.07 12.49 907 3.75 11.37 40.50 40.00<br />
Yarn Skein Response Variables<br />
Yarn Dye<br />
Greige Boil Off Dyed Washed<br />
Total Surface<br />
Penetration<br />
Count route Dips Weight Weight Weight Weight %COWY <strong>%IOWY</strong> <strong>%IOWY</strong> Integ Level<br />
12 1 only 1 3.5474 3.4913 3.6178 3.4652 3.62% 0.398% 0.746% 17.5 0.53<br />
12 2 only 1 3.6069 3.5505 3.6872 3.522 3.85% 0.480% 0.813% 20.6 0.59<br />
12 1--2 2 3.7068 3.6437 3.7792 3.6242 3.72% 0.757% 1.065% 30.5 0.71<br />
12 1--2,1 3 3.5935 3.543 3.6935 3.5284 4.25% 0.902% 1.317% 36.9 0.68<br />
12 1--2,2 3 3.6744 3.6178 3.805 3.6117 5.17% 1.026% 1.538% 41.1 0.67<br />
% Reflectance Readings<br />
Wavelength<br />
(nm) Dip 1 Dip 1 Dip 2 Dip 3 Dip 3 Dip 6 Dip 7<br />
400 12.96 11.86 8.98 7.76 7.05<br />
420 17.20 15.87 12.21 10.58 9.62<br />
440 16.21 14.78 11.22 9.60 8.62<br />
460 13.93 12.54 9.37 7.94 7.09<br />
480 12.14 10.81 7.86 6.55 5.81<br />
500 10.75 9.52 6.78 5.59 4.95<br />
520 9.05 7.88 5.44 4.47 3.96<br />
540 7.29 6.31 4.29 3.52 3.13<br />
560 6.21 5.35 3.62 2.98 2.66<br />
580 5.21 4.45 3.04 2.53 2.28<br />
600 4.28 3.66 2.54 2.15 1.95<br />
620 3.61 3.10 2.20 1.87 1.74<br />
640 3.05 2.66 1.96 1.71 1.62<br />
660 2.89 2.55 1.90 1.68 1.61<br />
680 3.84 3.36 2.45 2.11 1.98<br />
700 9.12 8.05 5.66 4.64 4.17<br />
354
Table A-4-1: Continued<br />
Shade<br />
Dye Bath<br />
ID<br />
Dwell<br />
(gpl<br />
Dye Dye Bath Dwell<br />
Nip<br />
Speed Time Oxidation 100% Dye Bath Alkalinity Length Oxidation Pressures<br />
(m/min) (sec) Time (sec) Indigo) Bath pH (mV) (gpl) (m) Length (m) (psi)<br />
x3313 32.92 20.7 67.5 1.93 12.33 800 3.26 11.37 40.50 40.00<br />
Yarn Skein Response Variables<br />
Yarn Dye<br />
Greige Boil Off Dyed Washed<br />
Total Surface<br />
Penetration<br />
Count route Dips Weight Weight Weight Weight %COWY <strong>%IOWY</strong> <strong>%IOWY</strong> Integ Level<br />
12 1 only 1 3.6373 3.5076 3.6763 3.5062 4.81% 0.530% 0.819% 20.9 0.65<br />
12 1--2 2 3.7084 3.5745 3.7704 3.5885 5.48% 0.957% 1.407% 38.7 0.68<br />
12 1--3 3 3.6452 3.5159 3.7292 3.5398 6.07% 1.489% 2.513% 54.1 0.59<br />
12 1--4 4 3.7243 3.5849 3.8534 3.6266 7.49% 1.857% 3.874% 66.4 0.48<br />
12 1--5 5 3.6299 3.5014 3.7814 3.5641 8.00% 2.271% 4.897% 73.6 0.46<br />
12 1--6 6 3.605 3.466 3.7744 3.5592 8.90% 2.730% 6.648% 83.0 0.41<br />
% Reflectance Readings<br />
Wavelength<br />
(nm) Dip 1 Dip 2 Dip 3 Dip 4 Dip 5 Dip 6 Dip 7<br />
400 11.68 7.46 5.57 4.40 3.74 3.16<br />
420 15.55 10.15 7.21 5.57 4.60 3.83<br />
440 14.36 9.04 6.29 4.79 3.94 3.25<br />
460 12.22 7.44 5.09 3.87 3.20 2.65<br />
480 10.53 6.11 4.13 3.15 2.61 2.17<br />
500 9.27 5.20 3.49 2.67 2.26 1.90<br />
520 7.67 4.16 2.81 2.18 1.85 1.60<br />
540 6.16 3.30 2.27 1.79 1.59 1.41<br />
560 5.24 2.81 1.97 1.60 1.46 1.32<br />
580 4.37 2.39 1.74 1.46 1.37 1.26<br />
600 3.63 2.06 1.58 1.37 1.32 1.24<br />
620 3.20 1.87 1.51 1.35 1.33 1.28<br />
640 2.67 1.71 1.46 1.35 1.37 1.32<br />
660 2.56 1.76 1.55 1.48 1.52 1.49<br />
680 3.32 2.17 1.84 1.70 1.71 1.66<br />
700 7.61 4.48 3.36 2.81 2.56 2.31<br />
355
Table A-4-1: Continued<br />
Shade<br />
Dye Bath<br />
ID<br />
Dwell<br />
(gpl Dye Dye Dye Bath Dwell<br />
Nip<br />
Speed Time Oxidation 100% Bath Bath Alkalinity Length Oxidation Pressures<br />
(m/min) (sec) Time (sec) Indigo) pH (mV) (gpl) (m) Length (m) (psi)<br />
4223 32.92 20.67 67.5 2.011 12.7 924 4.12 11.37 40.50 40.00<br />
Yarn Skein Response Variables<br />
Yarn Dye<br />
Greige Boil Off Dyed Washed<br />
Total Surface<br />
Penetration<br />
Count route Dips Weight Weight Weight Weight %COWY <strong>%IOWY</strong> <strong>%IOWY</strong> Integ Level<br />
6.3 1 only 1 7.03 6.771999 7.0441 6.7844 4.02% 0.262% 0.701% 15.6 0.37<br />
6.3 1--2 2 7.021 6.725472 7.043 6.7478 4.72% 0.519% 0.944% 26.3 0.55<br />
% Reflectance Readings<br />
Wavelength<br />
(nm) Dip 1 Dip 2 Dip 3 Dip 4 Dip 5 Dip 6 Dip 7<br />
400 14.13 10.18<br />
420 18.70 13.85<br />
440 17.66 12.77<br />
460 15.22 10.68<br />
480 13.28 9.02<br />
500 11.76 7.82<br />
520 9.94 6.29<br />
540 7.98 4.95<br />
560 6.87 4.18<br />
580 5.74 3.49<br />
600 4.71 2.88<br />
620 3.97 2.48<br />
640 3.31 2.15<br />
660 3.07 2.04<br />
680 4.10 2.64<br />
700 9.88 6.42<br />
356
Table A-4-1: Continued<br />
Shade<br />
Dye Bath<br />
ID<br />
Dwell<br />
(gpl Dye Dye Dye Bath Dwell<br />
Nip<br />
Speed Time Oxidation 100% Bath Bath Alkalinity Length Oxidation Pressures<br />
(m/min) (sec) Time (sec) Indigo) pH (mV) (gpl) (m) Length (m) (psi)<br />
4223 32.92 20.67 67.5 2.011 12.7 924 4.12 11.37 40.50 40.00<br />
Yarn Skein Response Variables<br />
Yarn Dye<br />
Greige Boil Off Dyed Washed<br />
Total Surface<br />
Penetration<br />
Count route Dips Weight Weight Weight Weight %COWY <strong>%IOWY</strong> <strong>%IOWY</strong> Integ Level<br />
7.1 1 only 1 6.301 6.07168 6.3521 6.1162 4.62% 0.298% 0.689% 15.1 0.43<br />
7.1 1--2 2 6.0678 5.845112 6.191 5.9095 5.92% 0.545% 0.942% 26.3 0.58<br />
% Reflectance Readings<br />
Wavelength<br />
(nm) Dip 1 Dip 2 Dip 3 Dip 4 Dip 5 Dip 6 Dip 7<br />
400 14.39 9.99<br />
420 18.94 13.57<br />
440 17.91 12.60<br />
460 15.48 10.60<br />
480 13.57 8.98<br />
500 12.02 7.80<br />
520 10.22 6.31<br />
540 8.22 4.98<br />
560 7.10 4.21<br />
580 5.95 3.52<br />
600 4.88 2.92<br />
620 4.11 2.50<br />
640 3.42 2.15<br />
660 3.18 2.06<br />
680 4.27 2.65<br />
700 10.15 6.40<br />
357
Table A-4-1: Continued<br />
Shade<br />
Dye Bath<br />
ID<br />
Dwell<br />
(gpl Dye Dye Dye Bath Dwell<br />
Nip<br />
Speed Time Oxidation 100% Bath Bath Alkalinity Length Oxidation Pressures<br />
(m/min) (sec) Time (sec) Indigo) pH (mV) (gpl) (m) Length (m) (psi)<br />
4223 32.92 20.67 67.5 2.011 12.7 924 4.12 11.37 40.50 40.00<br />
Yarn Skein Response Variables<br />
Yarn Dye<br />
Greige Boil Off Dyed Washed<br />
Total Surface<br />
Penetration<br />
Count route Dips Weight Weight Weight Weight %COWY <strong>%IOWY</strong> <strong>%IOWY</strong> Integ Level<br />
8 1 only 1 5.582 5.377141 5.6381 5.4209 4.85% 0.278% 0.636% 13.2 0.44<br />
8 1--2 2 5.621 5.414709 5.7319 5.484 5.86% 0.520% 0.913% 25.1 0.57<br />
% Reflectance Readings<br />
Wavelength<br />
(nm) Dip 1 Dip 2 Dip 3 Dip 4 Dip 5 Dip 6 Dip 7<br />
400 15.70 10.35<br />
420 20.49 14.00<br />
440 19.55 13.00<br />
460 17.06 10.97<br />
480 15.05 9.33<br />
500 13.42 8.12<br />
520 11.44 6.58<br />
540 9.22 5.20<br />
560 7.99 4.41<br />
580 6.70 3.68<br />
600 5.49 3.04<br />
620 4.61 2.61<br />
640 3.83 2.24<br />
660 3.50 2.11<br />
680 4.81 2.75<br />
700 11.48 6.67<br />
358
Table A-4-1: Continued<br />
Shade<br />
Dye Bath<br />
ID<br />
Dwell<br />
(gpl Dye Dye Dye Bath Dwell<br />
Nip<br />
Speed Time Oxidation 100% Bath Bath Alkalinity Length Oxidation Pressures<br />
(m/min) (sec) Time (sec) Indigo) pH (mV) (gpl) (m) Length (m) (psi)<br />
4223 32.92 20.67 67.5 2.011 12.7 924 4.12 11.37 40.50 40.00<br />
Yarn Skein Response Variables<br />
Yarn Dye<br />
Greige Boil Off Dyed Washed<br />
Total Surface<br />
Penetration<br />
Count route Dips Weight Weight Weight Weight %COWY <strong>%IOWY</strong> <strong>%IOWY</strong> Integ Level<br />
12 1 only 1 3.525 3.395633 3.5906 3.4191 5.74% 0.360% 0.690% 15.2 0.52<br />
12 1--2 2 3.5068 3.3781 3.5844 3.4127 6.11% 0.734% 1.047% 30.0 0.70<br />
% Reflectance Readings<br />
Wavelength<br />
(nm) Dip 1 Dip 2 Dip 3 Dip 4 Dip 5 Dip 6 Dip 7<br />
400 14.50 9.13<br />
420 19.11 12.33<br />
440 18.06 11.38<br />
460 15.59 9.55<br />
480 13.63 8.05<br />
500 12.07 6.93<br />
520 10.23 5.59<br />
540 8.23 4.41<br />
560 7.09 3.73<br />
580 5.93 3.11<br />
600 4.85 2.58<br />
620 4.09 2.22<br />
640 3.42 1.93<br />
660 3.18 1.82<br />
680 4.30 2.38<br />
700 10.24 5.70<br />
359
Table A-4-1: Continued<br />
Shade<br />
Dye Bath<br />
ID<br />
Dwell<br />
(gpl<br />
Dye Dye Bath Dwell<br />
Nip<br />
Speed Time Oxidation 100% Dye Bath Alkalinity Length Oxidation Pressures<br />
(m/min) (sec) Time (sec) Indigo) Bath pH (mV) (gpl) (m) Length (m) (psi)<br />
t3663 34.75 19.6 63.9 2.053 11.84 865 4.29 11.37 40.50 40.00<br />
Yarn Skein Response Variables<br />
Yarn<br />
Count<br />
Dye<br />
route Dips<br />
Greige<br />
Weight<br />
Boil Off<br />
Weight<br />
Dyed<br />
Weight<br />
Washed<br />
Weight %COWY<br />
Total<br />
<strong>%IOWY</strong><br />
Surface<br />
<strong>%IOWY</strong> Integ<br />
Penetration<br />
Level<br />
6.3 1 only 1 8.1651 7.8331 8.1628 7.8071 4.21% 0.299% 0.776% 18.9 0.39<br />
6.3 1--2 2 8.3718 8.0264 8.4349 8.0296 5.09% 0.602% 1.338% 37.3 0.45<br />
6.3 1--3 3 8.2892 7.9509 8.4839 7.9736 6.70% 0.959% 2.362% 52.4 0.41<br />
6.3 1--4 4 8.2337 7.9014 8.4259 7.951 6.64% 1.268% 3.931% 66.9 0.32<br />
6.3 1--5 5 8.0853 7.756 8.3329 7.8362 7.44% 1.602% 5.611% 77.8 0.29<br />
6.3 1--6 6 8.301 7.9584 8.5545 8.0585 7.49% 1.750% 6.144% 80.6 0.28<br />
6.3 1--7 7 8.3284 7.9843 8.6764 8.1288 8.67% 2.127% 7.807% 87.8 0.27<br />
% Reflectance Readings<br />
Wavelength<br />
(nm) Dip 1 Dip 2 Dip 3 Dip 4 Dip 5 Dip 6 Dip 7<br />
400 12.87 7.86 5.86 4.40 3.62 3.33 2.88<br />
420 17.39 10.92 7.87 5.68 4.57 4.14 3.50<br />
440 16.14 9.83 6.87 4.92 3.93 3.56 2.99<br />
460 13.70 8.06 5.54 3.97 3.17 2.89 2.47<br />
480 11.76 6.57 4.46 3.21 2.58 2.37 2.04<br />
500 10.28 5.57 3.75 2.73 2.22 2.06 1.81<br />
520 8.52 4.42 2.99 2.21 1.82 1.71 1.55<br />
540 6.79 3.46 2.39 1.82 1.55 1.50 1.38<br />
560 5.74 2.93 2.04 1.62 1.40 1.37 1.29<br />
580 4.78 2.47 1.80 1.46 1.30 1.29 1.22<br />
600 3.92 2.10 1.59 1.34 1.22 1.23 1.19<br />
620 3.32 1.84 1.46 1.27 1.17 1.18 1.16<br />
640 2.81 1.67 1.38 1.23 1.15 1.17 1.15<br />
660 2.64 1.62 1.38 1.24 1.17 1.20 1.19<br />
680 3.45 2.04 1.66 1.44 1.34 1.34 1.34<br />
700 8.51 4.57 3.30 2.55 2.18 2.07 1.92<br />
360
Table A-4-1: Continued<br />
Shade<br />
Dye Bath<br />
ID<br />
Dwell<br />
(gpl<br />
Dye Dye Bath Dwell<br />
Nip<br />
Speed Time Oxidation 100% Dye Bath Alkalinity Length Oxidation Pressures<br />
(m/min) (sec) Time (sec) Indigo) Bath pH (mV) (gpl) (m) Length (m) (psi)<br />
1472 34.75 19.6 63.9 2.259 11.85 858 4.17 11.37 40.50 40.00<br />
Yarn Skein Response Variables<br />
Yarn<br />
Count<br />
Dye<br />
route Dips<br />
Greige<br />
Weight<br />
Boil Off<br />
Weight<br />
Dyed<br />
Weight<br />
Washed<br />
Weight %COWY<br />
Total<br />
<strong>%IOWY</strong><br />
Surface<br />
<strong>%IOWY</strong> Integ<br />
Penetration<br />
Level<br />
6.3 1 only 1 8.032 7.8333 8.2375 7.8335 5.16% 0.369% 0.814% 20.6 0.45<br />
6.3 1--2 2 8.2171 8.0055 8.534 8.0456 6.60% 0.680% 1.487% 40.2 0.46<br />
6.3 1--3 3 7.9604 7.7594 8.3303 7.8241 7.36% 1.140% 3.216% 61.0 0.35<br />
6.3 1--4 4 8.2216 8.0146 8.6908 8.1186 8.44% 1.579% 5.254% 75.8 0.30<br />
6.3 1--5 5 8.1625 7.9496 8.6538 8.078 8.86% 1.893% 6.629% 82.9 0.29<br />
6.3 1--6 6 8.1076 7.896 8.5833 8.0701 8.70% 2.320% 9.206% 92.5 0.25<br />
6.3 1--6,6 7 8.1482 7.9452 8.6776 8.1481 9.22% 2.776% 12.658% 101.2 0.22<br />
% Reflectance Readings<br />
Wavelength<br />
(nm) Dip 1 Dip 2 Dip 3 Dip 4 Dip 5 Dip 6 Dip 7<br />
400 12.13 7.48 5.11 3.85 3.32 2.79 2.40<br />
420 16.28 10.29 6.72 4.93 4.16 3.42 2.90<br />
440 15.12 9.19 5.85 4.24 3.57 2.93 2.47<br />
460 12.87 7.56 4.72 3.42 2.91 2.41 2.06<br />
480 11.06 6.17 3.80 2.77 2.35 1.97 1.70<br />
500 9.69 5.22 3.20 2.36 2.04 1.74 1.53<br />
520 8.00 4.15 2.56 1.92 1.70 1.48 1.33<br />
540 6.35 3.25 2.04 1.59 1.45 1.31 1.21<br />
560 5.33 2.73 1.76 1.43 1.32 1.22 1.14<br />
580 4.39 2.30 1.55 1.30 1.23 1.15 1.10<br />
600 3.58 1.94 1.39 1.21 1.17 1.10 1.06<br />
620 3.04 1.71 1.29 1.16 1.13 1.08 1.05<br />
640 2.58 1.58 1.26 1.15 1.14 1.09 1.08<br />
660 2.44 1.55 1.26 1.17 1.18 1.13 1.13<br />
680 3.22 1.93 1.50 1.34 1.32 1.28 1.28<br />
700 8.04 4.37 2.94 2.33 2.13 1.90 1.79<br />
361
Table A-4-1: Continued<br />
Shade<br />
Dye Bath<br />
ID<br />
Dwell<br />
(gpl<br />
Dye Dye Bath Dwell<br />
Nip<br />
Speed Time Oxidation 100% Dye Bath Alkalinity Length Oxidation Pressures<br />
(m/min) (sec) Time (sec) Indigo) Bath pH (mV) (gpl) (m) Length (m) (psi)<br />
1472 34.75 19.6 63.9 2.158 11.88 846 4.4 11.37 40.50 40.00<br />
Yarn Skein Response Variables<br />
Yarn<br />
Count<br />
Dye<br />
route Dips<br />
Greige<br />
Weight<br />
Boil Off<br />
Weight<br />
Dyed<br />
Weight<br />
Washed<br />
Weight %COWY<br />
Total<br />
<strong>%IOWY</strong><br />
Surface<br />
<strong>%IOWY</strong> Integ<br />
Penetration<br />
Level<br />
12 1 only 1 6.447 6.2519 6.6002 6.2628 5.57% 0.414% 0.801% 20.0 0.52<br />
12 1--2 2 6.3497 6.1528 6.5768 6.1785 6.89% 0.754% 1.457% 39.6 0.52<br />
12 1--3 3 6.3301 6.1345 6.6115 6.1922 7.78% 1.154% 2.757% 56.6 0.42<br />
12 1--4 4 6.4312 6.2393 6.8487 6.3386 9.77% 1.672% 4.750% 72.6 0.35<br />
12 1--5 5 6.4161 6.2238 6.8584 6.3486 10.20% 2.008% 6.186% 80.8 0.32<br />
12 1--6 6 6.5723 6.379 6.9502 6.527 8.95% 2.355% 7.485% 86.5 0.31<br />
12 1--6,6 7 6.3727 6.1859 6.7831 6.3583 9.65% 2.824% 9.110% 92.2 0.31<br />
% Reflectance Readings<br />
Wavelength<br />
(nm) Dip 1 Dip 2 Dip 3 Dip 4 Dip 5 Dip 6 Dip 7<br />
400 12.33 7.56 5.54 4.06 3.46 3.09 2.71<br />
420 16.46 10.34 7.28 5.15 4.31 3.79 3.26<br />
440 15.19 9.20 6.34 4.42 3.70 3.24 2.79<br />
460 12.90 7.55 5.13 3.57 3.00 2.66 2.32<br />
480 11.08 6.17 4.14 2.89 2.43 2.17 1.91<br />
500 9.72 5.23 3.49 2.46 2.11 1.90 1.71<br />
520 8.08 4.17 2.79 1.99 1.74 1.60 1.46<br />
540 6.48 3.28 2.22 1.66 1.48 1.40 1.32<br />
560 5.47 2.77 1.91 1.48 1.35 1.29 1.23<br />
580 4.54 2.34 1.67 1.36 1.26 1.20 1.18<br />
600 3.74 1.99 1.47 1.26 1.19 1.15 1.14<br />
620 3.19 1.75 1.36 1.20 1.16 1.13 1.12<br />
640 2.74 1.62 1.31 1.22 1.18 1.14 1.14<br />
660 2.59 1.58 1.31 1.25 1.23 1.17 1.19<br />
680 3.39 1.98 1.56 1.44 1.37 1.33 1.32<br />
700 8.02 4.36 3.14 2.46 2.21 2.02 1.89<br />
362
Table A-4-1: Continued<br />
Shade<br />
Dye Bath<br />
ID<br />
Dwell<br />
(gpl Dye Dye Dye Bath Dwell<br />
Nip<br />
Speed Time Oxidation 100% Bath Bath Alkalinity Length Oxidation Pressures<br />
(m/min) (sec) Time (sec) Indigo) pH (mV) (gpl) (m) Length (m) (psi)<br />
x3626 31.09 21.7 71.5 2.283 11.8 783 4.48 11.37 40.50 40.00<br />
Yarn Skein Response Variables<br />
Yarn<br />
Count<br />
Dye<br />
route Dips<br />
Greige<br />
Weight<br />
Boil Off<br />
Weight<br />
Dyed<br />
Weight<br />
Washed<br />
Weight %COWY<br />
Total<br />
<strong>%IOWY</strong><br />
Surface<br />
<strong>%IOWY</strong> Integ<br />
Penetration<br />
Level<br />
6.3 1 only 1 7.6676 7.3705 7.5957 7.3264 3.06% 0.269% 0.695% 15.4 0.39<br />
6.3 1--2 2 7.5517 7.2591 7.5283 7.2227 3.71% 0.512% 1.085% 31.1 0.47<br />
6.3 1--3 3 7.775 7.4737 7.8205 7.4725 4.64% 0.905% 2.283% 51.5 0.40<br />
6.3 1--4 4 7.6524 7.3559 7.8012 7.3751 6.05% 1.257% 3.558% 63.9 0.35<br />
6.3 1--5 5 7.6481 7.3518 7.8006 7.4118 6.10% 1.588% 4.585% 71.6 0.35<br />
6.3 1--6 6 7.7748 7.4736 7.9554 7.5411 6.45% 1.915% 6.496% 82.3 0.29<br />
6.3 1--7 7 7.7656 7.4647 7.977 7.5723 6.86% 2.168% 7.223% 85.5 0.30<br />
% Reflectance Readings<br />
Wavelength<br />
(nm) Dip 1 Dip 2 Dip 3 Dip 4 Dip 5 Dip 6 Dip 7<br />
400 14.31 8.98 5.88 4.60 3.98 3.26 3.04<br />
420 19.21 12.51 7.94 6.01 5.07 4.04 3.69<br />
440 17.94 11.31 6.94 5.19 4.34 3.44 3.13<br />
460 15.36 9.31 5.58 4.15 3.46 2.77 2.54<br />
480 13.37 7.73 4.50 3.35 2.81 2.27 2.08<br />
500 11.77 6.59 3.80 2.84 2.40 1.97 1.82<br />
520 9.94 5.27 3.04 2.30 1.96 1.66 1.56<br />
540 7.94 4.13 2.42 1.88 1.65 1.44 1.38<br />
560 6.86 3.50 2.08 1.68 1.50 1.34 1.31<br />
580 5.81 2.96 1.83 1.52 1.39 1.26 1.25<br />
600 4.80 2.48 1.62 1.40 1.32 1.21 1.21<br />
620 4.09 2.18 1.50 1.33 1.29 1.21 1.22<br />
640 3.40 1.92 1.39 1.29 1.29 1.22 1.24<br />
660 3.15 1.84 1.41 1.33 1.35 1.29 1.34<br />
680 4.04 2.34 1.68 1.53 1.54 1.43 1.49<br />
700 9.66 5.35 3.34 2.71 2.49 2.15 2.11<br />
363
Table A-4-1: Continued<br />
Shade<br />
Dye Bath<br />
ID<br />
Dwell<br />
(gpl<br />
Dye Dye Bath Dwell<br />
Nip<br />
Speed Time Oxidation 100% Dye Bath Alkalinity Length Oxidation Pressures<br />
(m/min) (sec) Time (sec) Indigo) Bath pH (mV) (gpl) (m) Length (m) (psi)<br />
x3626 31.09 21.7 71.5 2.134 11.76 789 4.58 11.37 40.50 40.00<br />
Yarn Skein Response Variables<br />
Yarn Dye<br />
Greige Boil Off Dyed Washed<br />
Total Surface<br />
Penetration<br />
Count route Dips Weight Weight Weight Weight %COWY <strong>%IOWY</strong> <strong>%IOWY</strong> Integ Level<br />
8 1 only 1 6.1223 5.9148 6.1102 5.8681 3.30% 0.323% 0.731% 16.8 0.44<br />
8 1--2 2 6.0951 5.8885 6.1361 5.8684 4.20% 0.547% 1.152% 33.0 0.47<br />
8 1--3 3 6.0795 5.8735 6.1711 5.8636 5.07% 0.772% 1.951% 47.3 0.40<br />
8 1--4 4 6.0613 5.8559 6.2155 5.8792 6.14% 1.261% 3.184% 60.7 0.40<br />
8 1--5 5 6.1556 5.947 6.2897 5.9884 5.76% 1.548% 4.060% 67.9 0.38<br />
8 1--6 6 6.1024 5.8956 6.2778 5.955 6.48% 1.738% 4.785% 72.9 0.36<br />
% Reflectance Readings<br />
Wavelength<br />
(nm) Dip 1 Dip 2 Dip 3 Dip 4 Dip 5 Dip 6 Dip 7<br />
400 13.69 8.60 6.29 4.86 4.25 3.84<br />
420 18.39 11.95 8.63 6.36 5.50 4.86<br />
440 17.06 10.78 7.59 5.51 4.72 4.15<br />
460 14.51 8.85 6.14 4.41 3.77 3.32<br />
480 12.57 7.31 4.96 3.57 3.05 2.70<br />
500 11.04 6.22 4.19 3.03 2.60 2.32<br />
520 9.27 4.97 3.34 2.46 2.12 1.91<br />
540 7.41 3.89 2.65 2.00 1.76 1.62<br />
560 6.35 3.31 2.28 1.77 1.59 1.49<br />
580 5.36 2.80 1.99 1.59 1.45 1.38<br />
600 4.43 2.37 1.73 1.46 1.36 1.31<br />
620 3.78 2.09 1.59 1.38 1.31 1.28<br />
640 3.15 1.84 1.49 1.33 1.28 1.28<br />
660 2.93 1.79 1.48 1.36 1.32 1.34<br />
680 3.77 2.24 1.78 1.55 1.51 1.50<br />
700 9.00 5.03 3.59 2.82 2.54 2.39<br />
364
Table A-4-1: Continued<br />
Shade<br />
Dye Bath<br />
ID<br />
Dwell<br />
(gpl<br />
Dye Dye Bath Dwell<br />
Nip<br />
Speed Time Oxidation 100% Dye Bath Alkalinity Length Oxidation Pressures<br />
(m/min) (sec) Time (sec) Indigo) Bath pH (mV) (gpl) (m) Length (m) (psi)<br />
1139 28.35 24.1 78.4 2.261 11.69 810 5.09 11.37 40.50 40.00<br />
Yarn Skein Response Variables<br />
Yarn Dye<br />
Greige Boil Off Dyed Washed<br />
Total Surface<br />
Penetration<br />
Count route Dips Weight Weight Weight Weight %COWY <strong>%IOWY</strong> <strong>%IOWY</strong> Integ Level<br />
6.3 1 only 1 8.2729 7.9479 8.207 7.9275 3.26% 0.290% 0.709% 15.9 0.41<br />
6.3 1--2 2 8.3119 7.9733 8.3618 7.9816 4.87% 0.609% 1.181% 33.7 0.52<br />
6.3 1--3 3 8.3462 8.0196 8.4306 8.05 5.12% 1.042% 2.285% 51.5 0.46<br />
6.3 1--3,2 4 8.3676 8.0251 8.4956 8.0903 5.86% 1.258% 2.984% 58.8 0.42<br />
6.3 1-3,2-3<br />
1-3,2-<br />
5 8.2123 7.8902 8.3684 7.9789 6.06% 1.624% 4.320% 69.7 0.38<br />
6.3 3,2<br />
1-3,2-<br />
6 8.2672 7.9373 8.4549 8.057 6.52% 1.986% 5.539% 77.4 0.36<br />
6.3 3,2-3 7 8.2995 7.9644 8.5276 8.1316 7.07% 2.410% 7.229% 85.5 0.33<br />
% Reflectance Readings<br />
Wavelength<br />
(nm) Dip 1 Dip 2 Dip 3 Dip 4 Dip 5 Dip 6 Dip 7<br />
400 13.76 8.27 5.80 4.90 4.01 3.42 2.90<br />
420 18.33 11.39 7.65 6.32 5.06 4.18 3.43<br />
440 17.25 10.31 6.73 5.50 4.36 3.59 2.94<br />
460 14.89 8.52 5.47 4.45 3.53 2.92 2.42<br />
480 12.99 7.03 4.45 3.62 2.88 2.40 2.00<br />
500 11.50 6.00 3.77 3.09 2.47 2.09 1.78<br />
520 9.70 4.79 3.01 2.50 2.01 1.74 1.53<br />
540 7.79 3.79 2.42 2.04 1.69 1.52 1.38<br />
560 6.70 3.22 2.09 1.82 1.55 1.43 1.32<br />
580 5.62 2.73 1.83 1.63 1.43 1.35 1.27<br />
600 4.64 2.34 1.63 1.52 1.36 1.30 1.27<br />
620 3.93 2.05 1.50 1.44 1.30 1.27 1.26<br />
640 3.32 1.88 1.45 1.44 1.33 1.32 1.32<br />
660 3.10 1.85 1.46 1.50 1.40 1.40 1.44<br />
680 4.09 2.31 1.73 1.71 1.57 1.55 1.57<br />
700 9.65 5.07 3.40 3.02 2.55 2.30 2.13<br />
365
Table A-4-1: Continued<br />
Shade<br />
Dye Bath<br />
ID<br />
Dwell<br />
(gpl<br />
Dye Dye Bath Dwell<br />
Nip<br />
Speed Time Oxidation 100% Dye Bath Alkalinity Length Oxidation Pressures<br />
(m/min) (sec) Time (sec) Indigo) Bath pH (mV) (gpl) (m) Length (m) (psi)<br />
x3669 31.09 21.7 71.5 2.277 11.92 880 5.14 11.37 40.50 40.00<br />
Yarn Skein Response Variables<br />
Yarn Dye<br />
Greige Boil Off Dyed Washed<br />
Total Surface<br />
Penetration<br />
Count route Dips Weight Weight Weight Weight %COWY <strong>%IOWY</strong> <strong>%IOWY</strong> Integ Level<br />
6.3 1 only 1 7.8172 7.4743 7.7695 7.4467 3.95% 0.362% 0.755% 17.9 0.48<br />
6.3 1--2 2 8.216 7.867 8.3122 7.8683 5.66% 0.680% 1.346% 37.5 0.51<br />
6.3 1--3 3 8.3614 7.97 8.5573 8.0045 7.37% 1.075% 2.515% 54.1 0.43<br />
6.3 1--4 4 7.8534 7.56 8.2356 7.6236 8.94% 1.442% 4.041% 67.7 0.36<br />
6.3 1--5 5 8.384 8.0202 8.6356 8.1199 7.67% 1.798% 5.721% 78.4 0.31<br />
6.3 1--6 6 8.3886 8.0244 8.6667 8.154 8.00% 2.114% 7.003% 84.5 0.30<br />
% Reflectance Readings<br />
Wavelength<br />
(nm) Dip 1 Dip 2 Dip 3 Dip 4 Dip 5 Dip 6 Dip 7<br />
400 13.21 7.71 5.57 4.23 3.49 3.05<br />
420 17.80 10.67 7.35 5.37 4.35 3.71<br />
440 16.54 9.52 6.39 4.62 3.73 3.16<br />
460 14.03 7.75 5.13 3.72 3.00 2.56<br />
480 12.10 6.31 4.14 3.03 2.46 2.09<br />
500 10.61 5.37 3.50 2.59 2.15 1.87<br />
520 8.86 4.30 2.82 2.13 1.78 1.58<br />
540 7.06 3.38 2.26 1.76 1.52 1.40<br />
560 6.01 2.89 1.97 1.59 1.40 1.32<br />
580 5.03 2.47 1.76 1.46 1.31 1.26<br />
600 4.14 2.12 1.58 1.37 1.24 1.23<br />
620 3.51 1.88 1.47 1.31 1.21 1.22<br />
640 2.95 1.73 1.44 1.31 1.22 1.26<br />
660 2.75 1.71 1.43 1.35 1.25 1.32<br />
680 3.56 2.09 1.67 1.52 1.39 1.46<br />
700 8.70 4.48 3.19 2.58 2.20 2.11<br />
366
Table A-4-1: Continued<br />
Shade<br />
Dye Bath<br />
ID<br />
Dwell<br />
(gpl<br />
Dye Dye Bath Dwell<br />
Nip<br />
Speed Time Oxidation 100% Dye Bath Alkalinity Length Oxidation Pressures<br />
(m/min) (sec) Time (sec) Indigo) Bath pH (mV) (gpl) (m) Length (m) (psi)<br />
1139 28.35 24.1 78.4 2.307 11.77 822 5.62 11.37 40.50 40.00<br />
Yarn Skein Response Variables<br />
Yarn Dye<br />
Greige Boil Off Dyed Washed<br />
Total Surface<br />
Penetration<br />
Count route Dips Weight Weight Weight Weight %COWY <strong>%IOWY</strong> <strong>%IOWY</strong> Integ Level<br />
7.1 1 only 1 7.2476 7.0441 7.3261 7.0477 4.00% 0.351% 0.767% 18.5 0.46<br />
7.1 1--2 2 7.2488 7.0476 7.4163 7.0762 5.23% 0.708% 1.338% 37.3 0.53<br />
7.1 1--3 3 7.218 7.0199 7.4125 7.0754 5.59% 1.042% 2.061% 48.8 0.51<br />
7.1 1-3,1 4 7.0859 6.8954 7.2841 6.9645 5.64% 1.249% 3.124% 60.1 0.40<br />
7.1 1-3,1-2 5 7.263 7.0584 7.5089 7.1656 6.38% 1.588% 4.651% 72.0 0.34<br />
7.1 1-3,1-3<br />
1-3,1-<br />
6 6.9719 6.7815 7.243 6.9018 6.81% 1.839% 5.282% 75.9 0.35<br />
7.1 3,3 7 7.2627 7.0641 7.5541 7.204 6.94% 2.036% 6.052% 80.1 0.34<br />
% Reflectance Readings<br />
Wavelength<br />
(nm) Dip 1 Dip 2 Dip 3 Dip 4 Dip 5 Dip 6 Dip 7<br />
400 12.76 7.67 6.12 4.87 3.87 3.48 3.19<br />
420 17.03 10.49 8.22 6.26 4.88 4.32 3.93<br />
440 15.87 9.46 7.23 5.46 4.21 3.73 3.38<br />
460 13.55 7.79 5.87 4.41 3.41 3.04 2.76<br />
480 11.70 6.39 4.76 3.59 2.78 2.48 2.26<br />
500 10.27 5.44 4.02 3.04 2.38 2.16 1.99<br />
520 8.57 4.34 3.21 2.47 1.96 1.79 1.67<br />
540 6.89 3.44 2.57 2.01 1.65 1.56 1.48<br />
560 5.85 2.92 2.19 1.76 1.49 1.43 1.38<br />
580 4.91 2.48 1.92 1.60 1.39 1.36 1.31<br />
600 4.05 2.13 1.69 1.47 1.31 1.30 1.28<br />
620 3.47 1.89 1.57 1.42 1.29 1.30 1.27<br />
640 2.96 1.75 1.52 1.42 1.31 1.34 1.32<br />
660 2.80 1.75 1.55 1.47 1.38 1.40 1.40<br />
680 3.63 2.18 1.85 1.66 1.50 1.54 1.53<br />
700 8.56 4.67 3.62 2.95 2.43 2.30 2.20<br />
367
Table A-4-1: Continued<br />
Shade<br />
Dye Bath<br />
ID<br />
Dwell<br />
(gpl Dye Dye Dye Bath Dwell<br />
Nip<br />
Speed Time Oxidation 100% Bath Bath Alkalinity Length Oxidation Pressures<br />
(m/min) (sec) Time (sec) Indigo) pH (mV) (gpl) (m) Length (m) (psi)<br />
1134 26.52 25.7 83.8 3.228 11.4 873 6.15 11.37 40.50 40.00<br />
Yarn Skein Response Variables<br />
Yarn Dye<br />
Greige Boil Off Dyed Washed<br />
Total Surface<br />
Penetration<br />
Count route Dips Weight Weight Weight Weight %COWY <strong>%IOWY</strong> <strong>%IOWY</strong> Integ Level<br />
6.3 1 only 1 8.3125 8.1211 8.5311 8.1202 5.05% 0.536% 1.134% 32.5 0.47<br />
6.3 1--2 2 8.4711 8.2729 8.7909 8.3016 6.26% 0.985% 2.517% 54.1 0.39<br />
6.3 1--3 3 8.1344 7.949 8.4708 8.0168 6.56% 1.390% 3.911% 66.7 0.36<br />
6.3 1--4 4 8.0632 7.8635 8.4996 7.9789 8.09% 1.873% 6.196% 80.8 0.30<br />
6.3 1--5 5 8.4616 8.2617 8.9728 8.4229 8.61% 2.404% 9.286% 92.8 0.26<br />
6.3 1--6 6 8.2664 8.0742 8.7887 8.2648 8.85% 2.716% 11.748% 99.2 0.23<br />
% Reflectance Readings<br />
Wavelength<br />
(nm) Dip 1 Dip 2 Dip 3 Dip 4 Dip 5 Dip 6 Dip 7<br />
400 8.80 5.75 4.49 3.36 2.72 2.42<br />
420 11.99 7.57 5.77 4.17 3.27 2.87<br />
440 10.84 6.59 4.97 3.56 2.79 2.46<br />
460 8.98 5.33 4.00 2.89 2.30 2.04<br />
480 7.45 4.30 3.23 2.35 1.89 1.69<br />
500 6.37 3.63 2.74 2.04 1.67 1.51<br />
520 5.10 2.90 2.21 1.69 1.45 1.33<br />
540 4.01 2.31 1.81 1.47 1.29 1.22<br />
560 3.38 1.99 1.60 1.36 1.23 1.18<br />
580 2.81 1.73 1.45 1.27 1.16 1.12<br />
600 2.37 1.55 1.34 1.23 1.14 1.11<br />
620 2.07 1.42 1.28 1.19 1.13 1.10<br />
640 1.87 1.36 1.26 1.21 1.16 1.13<br />
660 1.86 1.38 1.30 1.29 1.22 1.21<br />
680 2.42 1.68 1.52 1.46 1.38 1.37<br />
700 5.46 3.32 2.70 2.22 1.90 1.81<br />
368
Table A-4-1: Continued<br />
Shade<br />
Dye Bath<br />
ID<br />
Dwell<br />
(gpl<br />
Dye Dye Bath Dwell<br />
Nip<br />
Speed Time Oxidation 100% Dye Bath Alkalinity Length Oxidation Pressures<br />
(m/min) (sec) Time (sec) Indigo) Bath pH (mV) (gpl) (m) Length (m) (psi)<br />
1134 29.26 23.5 75.9 3.497 11.62 897 5.13 11.37 40.50 40.00<br />
Yarn Skein Response Variables<br />
Yarn Dye<br />
Greige Boil Off Dyed Washed<br />
Total Surface<br />
Penetration<br />
Count route Dips Weight Weight Weight Weight %COWY <strong>%IOWY</strong> <strong>%IOWY</strong> Integ Level<br />
6.3 1 only 1 8.1467 7.9327 8.4423 7.9751 6.42% 0.572% 1.173% 33.5 0.49<br />
6.3 1--2 2 8.0416 7.8292 8.4436 7.9149 7.85% 1.018% 2.575% 54.7 0.40<br />
6.3 1--3 3 8.1968 7.9807 8.7331 8.1307 9.43% 1.740% 5.540% 77.4 0.31<br />
6.3 1--4 4 8.8101 8.5772 9.5213 8.7939 11.01% 2.221% 7.437% 86.3 0.30<br />
6.3 1--5 5 8.1834 7.9693 8.8128 8.2008 10.58% 2.837% 10.632% 96.5 0.27<br />
6.3 1--6 6 8.2567 8.0436 8.9386 8.344 11.13% 3.520% 15.773% 106.8 0.22<br />
% Reflectance Readings<br />
Wavelength<br />
(nm) Dip 1 Dip 2 Dip 3 Dip 4 Dip 5 Dip 6 Dip 7<br />
400 8.39 5.54 3.61 3.07 2.53 2.15<br />
420 11.38 7.28 4.57 3.79 3.04 2.51<br />
440 10.33 6.39 3.95 3.26 2.61 2.16<br />
460 8.62 5.20 3.21 2.67 2.18 1.81<br />
480 7.18 4.22 2.62 2.18 1.80 1.55<br />
500 6.14 3.57 2.25 1.89 1.60 1.39<br />
520 4.92 2.86 1.84 1.60 1.39 1.25<br />
540 3.89 2.29 1.56 1.39 1.25 1.15<br />
560 3.28 1.96 1.40 1.29 1.19 1.11<br />
580 2.75 1.72 1.29 1.20 1.13 1.07<br />
600 2.32 1.53 1.22 1.15 1.11 1.05<br />
620 2.02 1.41 1.17 1.13 1.09 1.05<br />
640 1.86 1.38 1.19 1.15 1.13 1.09<br />
660 1.84 1.41 1.27 1.22 1.22 1.21<br />
680 2.38 1.72 1.47 1.41 1.40 1.39<br />
700 5.27 3.31 2.37 2.09 1.90 1.76<br />
369
Section A- 4-2a: Convergence test - standard errors from empirical model %COWY parameter.<br />
Table A-4-2a: Convergence test - standard errors from empirical model %COWY parameter.<br />
Replica Yarn Count Speed Dye Bath pH speed^2 pHxspeed<br />
0 0.003113 0.003133 0.01738 0.02172 0.000914 0.01364<br />
1 0.00315 0.003396 0.018228 0.021433 0.000958 0.014312<br />
2 0.00313 0.003355 0.017996 0.021339 0.000951 0.01421<br />
3 0.00314 0.00342 0.018731 0.021787 0.000964 0.014765<br />
4 0.003112 0.003084 0.017408 0.021387 0.000915 0.013797<br />
5 0.003115 0.003153 0.017462 0.021557 0.00094 0.013836<br />
6 0.003113 0.00314 0.017343 0.021474 0.000932 0.013792<br />
7 0.0031 0.003098 0.017026 0.020976 0.000919 0.013469<br />
8 0.00307 0.003052 0.016932 0.020782 0.000914 0.013297<br />
9 0.003068 0.003037 0.0168 0.020657 0.000908 0.013199<br />
10 0.003062 0.00301 0.016887 0.020668 0.000891 0.012464<br />
11 0.00306 0.002926 0.016651 0.020338 0.000825 0.010533<br />
12 0.003 0.002943 0.016492 0.020163 0.000823 0.010474<br />
13 0.00298 0.002965 0.01632 0.020056 0.000824 0.01046<br />
14 0.00297 0.002928 0.016272 0.02 0.00082 0.010441<br />
15 0.00298 0.002958 0.016713 0.020503 0.000838 0.01073<br />
16 0.002985 0.002952 0.016678 0.020059 0.000835 0.010561<br />
17 0.002975 0.002985 0.01681 0.020034 0.000841 0.010593<br />
18 0.002978 0.002926 0.016542 0.019788 0.000837 0.010441<br />
19 0.002978 0.002915 0.016484 0.01984 0.000837 0.010467<br />
20 0.002979 0.00291 0.016437 0.019681 0.000833 0.010433<br />
Section A-4-2b: Convergence test - standard errors from empirical model <strong>%IOWY</strong> parameter.<br />
Table A-4-2b: Convergence test - standard errors from empirical model <strong>%IOWY</strong> parameter.<br />
Replica Yarn Count speed dye pH<br />
0 0.002927 0.002615 0.016024 0.019996<br />
1 0.002895 0.002653 0.016316 0.018978<br />
2 0.002864 0.002628 0.016038 0.018823<br />
3 0.002844 0.002658 0.016224 0.018855<br />
4 0.00281 0.002469 0.015318 0.01855<br />
5 0.002798 0.002544 0.015398 0.018731<br />
6 0.002756 0.002528 0.015238 0.018597<br />
7 0.002694 0.002502 0.01498 0.018202<br />
8 0.00268 0.002483 0.014918 0.018067<br />
9 0.002645 0.00246 0.014809 0.017961<br />
10 0.002598 0.002419 0.014756 0.017865<br />
11 0.002545 0.00232 0.014578 0.017354<br />
12 0.002531 0.002287 0.014245 0.016994<br />
13 0.002528 0.002269 0.013943 0.016748<br />
14 0.002522 0.00225 0.013844 0.016644<br />
15 0.002509 0.002271 0.014003 0.016852<br />
16 0.002507 0.002267 0.013973 0.016531<br />
17 0.002505 0.002263 0.013961 0.016384<br />
18 0.002501 0.002239 0.013747 0.016199<br />
19 0.0025 0.002232 0.013637 0.016157<br />
20 0.002502 0.002252 0.013757 0.016186<br />
370
Section A-4-2c: Convergence test - standard errors from empirical model Integ parameter.<br />
Table A-4-2c: Convergence test - standard errors from empirical model Integ parameter.<br />
Replica Yarn Count speed dye pH<br />
0 0.00324 0.002894 0.017737 0.022134<br />
1 0.00315 0.002874 0.01767 0.020554<br />
2 0.003058 0.002856 0.017427 0.020453<br />
3 0.003011 0.002794 0.017054 0.019819<br />
4 0.002984 0.002596 0.016104 0.019501<br />
5 0.003008 0.002677 0.016204 0.019712<br />
6 0.002993 0.002664 0.016064 0.019604<br />
7 0.002981 0.002654 0.015895 0.019314<br />
8 0.002943 0.002643 0.015879 0.01923<br />
9 0.002924 0.002623 0.015789 0.01915<br />
10 0.002901 0.002579 0.015733 0.019048<br />
11 0.002858 0.002505 0.015736 0.018733<br />
12 0.002843 0.002488 0.015494 0.018484<br />
13 0.002821 0.00249 0.015302 0.018381<br />
14 0.0028 0.00247 0.015197 0.01827<br />
15 0.00274 0.002443 0.015062 0.018127<br />
16 0.00272 0.002435 0.015011 0.017759<br />
17 0.00271 0.002421 0.014939 0.017532<br />
18 0.00269 0.002413 0.014815 0.017459<br />
19 0.00267 0.002409 0.014718 0.017438<br />
20 0.00268 0.002412 0.014737 0.017339<br />
Section A-4-2d: Convergence test - standard errors from empirical model Penetration Level<br />
parameter.<br />
Table A-4-2d: Convergence test - standard errors from empirical model penetration level parameter.<br />
Replica Yarn Count speed dye pH speedxpH speed^2<br />
0 0.00158 0.001596 0.005862 0.011468 0.007098 0.000474<br />
1 0.001542 0.001644 0.005836 0.010732 0.007072 0.000471<br />
2 0.001548 0.001627 0.005711 0.01069 0.007045 0.000468<br />
3 0.001535 0.001561 0.005602 0.010299 0.006884 0.000447<br />
4 0.001521 0.001432 0.00523 0.010235 0.006492 0.000431<br />
5 0.001448 0.001417 0.005111 0.009974 0.006299 0.000428<br />
6 0.001432 0.001411 0.005069 0.00928 0.006276 0.000424<br />
7 0.001426 0.001395 0.004984 0.009734 0.006139 0.00042<br />
8 0.001401 0.001375 0.00496 0.009651 0.006065 0.000417<br />
9 0.001381 0.00137 0.004932 0.009603 0.006027 0.000415<br />
10 0.001368 0.001347 0.004919 0.009538 0.005648 0.000404<br />
11 0.001352 0.001315 0.004819 0.009392 0.004787 0.000378<br />
12 0.001348 0.001319 0.00475 0.009294 0.004746 0.000377<br />
13 0.001334 0.001319 0.004678 0.009185 0.004767 0.000374<br />
14 0.001321 0.001297 0.004646 0.009123 0.00468 0.000371<br />
15 0.00131 0.001247 0.004562 0.00894 0.004608 0.000362<br />
16 0.001288 0.001246 0.004558 0.008766 0.00454 0.000362<br />
17 0.001281 0.001245 0.004541 0.008665 0.004502 0.00036<br />
18 0.001279 0.001225 0.004409 0.008546 0.004456 0.000359<br />
19 0.001278 0.001226 0.004387 0.008601 0.004485 0.00036<br />
20 0.001279 0.001227 0.004383 0.008546 0.00448 0.000359<br />
371
Section A-4-3a: Computer program to calculate dye coefficients given the input dye range set-up<br />
conditions and target %COWY, <strong>%IOWY</strong>, and Integ shade values.<br />
#include <br />
#include <br />
#include <br />
#include <br />
int main ()<br />
{<br />
FILE * pFile;<br />
FILE * oFile;<br />
double AA[61][61], BB[61][61], RBLgm[61], RBL1gm[61], Cj[61], Cj1[61], d[61],<br />
TBL[61], TBL1[61], RBL[61], RBL1[61], OBL[61], OBL1[61];<br />
double AAinvt[61][62], X[61], Xrbl[61], Xiowy[61], temp[61], IOWY[61],<br />
COWY[61], IOWYoxd[61], temp1, Multi, fraction_dye_affinity<br />
, fraction_oxy_affinity;<br />
double OBLgm[61], OBL1gm[61], dumb[61], IOWYstep[61], gms_ctn_node[61],<br />
liter_per_node[61], Df_constantAO[10], Dy_constantAO[10],<br />
WP_constantAO[10], wash_constantAO[10];<br />
double IOWYpre[61], COWYpre[61], dip_error[10], pickup_error[10],<br />
Df_dip[5][10], Dy_dip[5][10], WP_dip[5][10], wash_dip[5][10];<br />
double dye_bath_dist[5][10][61], air_dist[5][10][61], IOWY_dist[5][10][61],<br />
COWY_dist[5][10][61], Integ_save[5][10], IOWY_save[5][10],<br />
COWY_save[5][10];<br />
float input[1][20], num_time_steps, oxd_time_steps;<br />
double Mt, Dy, DOy, Df, dt, DT, dr, radius, Monophenate_Ion, CompA, CompB, A,<br />
AO[10], AO_old, AO_conv[10], AO_change, wash, old_wash, wetpickup,<br />
gmIplit, gmNaOHplit, pH, Air, normal_ave[10], WP_normal_ave;<br />
double lamda, alpha, beta, Ur, UOr, K, porosity, Kph, L, percent_to_grams,<br />
grams_to_percent, Integ, num_cycles;<br />
double IOWYtarget, IOWYsurface_target, COWYtarget, IOWYsurface,<br />
IOWYoutside_old, IOWYtotal, COWYtotal, IOWYsurface_ratio,<br />
IOWYtotal_ratio, COWYtotal_ratio;<br />
double dwelltime, oxd_time, totalgramsperindigo, new_stdev[10], old_stdev[10],<br />
Df_temp, Dy_temp, WP_temp, Df_total[10], Dy_total[10], WP_total[10];<br />
double mean_dip, mean_pickup, slope, demon, Df_run_ave[10], Dy_run_ave[10],<br />
WP_run_ave[10], Df_AO[10], Dy_AO[10], WP_AO[10], wash_AO[10];<br />
long rows, cols;<br />
int x, num_nodes, ts, yarn_count, num_yarns;<br />
int z, ctx, cty, ctz, current_dip, num_dips;<br />
int i, j, pivot, k;<br />
double PI25DT = 3.141592653589793238462643;<br />
// Iniatialization<br />
num_dips=7; // this is now number <strong>of</strong> dips in data<br />
num_cycles=1;<br />
cols=1;<br />
num_yarns = 4; // number <strong>of</strong> yarn counts processed<br />
DT=0.01; // Define a actual time step to be used in dyeing and oxidation<br />
num_nodes=21;<br />
rows=num_nodes-1;<br />
porosity=0.65;<br />
Ur = 0.0;<br />
K = 1.0;<br />
percent_to_grams = (0.0154 * porosity)/(1.0 - porosity);<br />
grams_to_percent = 1.0/percent_to_grams;<br />
totalgramsperindigo = 2.3884;<br />
AO_old = 0.0;<br />
wash = 0.1;<br />
372
mean_dip = 0.0;<br />
mean_pickup = 0.0;<br />
slope = 1.0;<br />
Df = 4.6e-10;<br />
Dy = 1.18e-6;<br />
wetpickup = 0.05;<br />
yarn_count = 1;<br />
for (cty = 1; cty
if (yarn_count == 3) oFile = fopen ("yarninput3.txt", "rb" );<br />
if (yarn_count == 4) oFile = fopen ("yarninput4.txt", "rb" );<br />
if (oFile==NULL) {fputs ("File error",stderr); exit (1);}<br />
while (input[0][0] != current_dip)<br />
{<br />
for (z=0; z
X[ctx]=0.0;<br />
Cj[ctx]=0.0;<br />
Cj1[ctx]=0.0;<br />
d[ctx]=0.0;<br />
temp[ctx]=0.0;<br />
RBL[ctx]=0.0;<br />
RBL1[ctx]=0.0;<br />
RBLgm[ctx]=0.0;<br />
RBL1gm[ctx]=0.0;<br />
IOWY[ctx]=0.0; //these will change for multiple dips<br />
IOWYoxd[ctx]=0.0;<br />
COWY[ctx]=0.0;<br />
IOWYstep[ctx]=0.0;<br />
dumb[ctx]=0.0;<br />
OBL[ctx]=0.0;<br />
OBL1[ctx]=0.0;<br />
OBLgm[ctx]=0.0;<br />
OBL1gm[ctx]=0.0;<br />
TBL[ctx] = RBL[ctx] + OBL[ctx];<br />
TBL1[ctx] = RBL1[ctx] + OBL1[ctx];<br />
for(cty = 0; cty
Mt = (((4.0/pow(PI25DT,0.5))*(pow((Df*dwelltime/(0.0009*0.0009)),0.5)))<br />
-(Df*dwelltime/(0.0009*0.0009))-((1.0/(3.0*pow(PI25DT,0.5)))*(pow((Df*<br />
dwelltime/(0.0009*0.0009)),(3.0/2.0)))))/num_time_steps;<br />
for (ctx = 0; ctx < rows; ctx++)<br />
{<br />
if (Cj[ctx]
}<br />
}<br />
}<br />
Cj1[rows-1] = AAinvt[rows-1][rows] / AAinvt[rows-1][rows-1];<br />
for (j = (rows-2); j >= 0; j--)<br />
{<br />
Cj1[j] = AAinvt[j][rows];<br />
for ( k = (j+1); k < rows; k++)<br />
{<br />
Cj1[j] = Cj1[j] - (AAinvt[j][k] * Cj1[k]);<br />
}<br />
Cj1[j] = Cj1[j] / AAinvt[j][j];<br />
}<br />
// End Gauss-Jordan<br />
{<br />
IOWY[0] = IOWY[0] + IOWYstep[0];<br />
}<br />
for (ctx = 1; ctx < rows; ctx++)<br />
{<br />
{<br />
IOWY[ctx] = IOWY[ctx] + IOWYstep[ctx];<br />
}<br />
}<br />
IOWY[rows] = IOWY[rows] + IOWYstep[rows];<br />
for (ctx = 0; ctx
BB[ctx][ctx]=1.0 + (-2.0*lamda);<br />
}<br />
for (ctx = 1; ctx
for (i = 0; i < rows; i++)<br />
{<br />
if (AAinvt[i][i] == 0)<br />
{<br />
pivot = 0;<br />
j = i + 1;<br />
while ((pivot == 0) && (j = 0; j--)<br />
{<br />
Cj1[j] = AAinvt[j][rows];<br />
for ( k = (j+1); k < rows; k++)<br />
{<br />
Cj1[j] = Cj1[j] - (AAinvt[j][k] * Cj1[k]);<br />
}<br />
Cj1[j] = Cj1[j] / AAinvt[j][j];<br />
}<br />
// End Gauss-Jordan<br />
Mt = (((4.0/pow(PI25DT,0.5))*(pow((Df*oxd_time/(0.0009*0.0009)),0.5)))<br />
-(Df*oxd_time/(0.0009*0.0009))-((1.0/(3.0*pow(PI25DT,0.5)))*(pow(<br />
(Df*oxd_time/(0.0009*0.0009)),(3.0/2.0)))))/oxd_time_steps;<br />
for (ctx = 0; ctx 0.0)<br />
{<br />
dumb[ctx] = (AO[current_dip]*Cj1[ctx]*liter_per_node[ctx]*<br />
dt)/RBLgm[ctx];<br />
if (dumb[ctx] > 1.0)<br />
{<br />
RBL1gm[ctx] = 0.0;<br />
RBL1[ctx] = 0.0;<br />
OBL1gm[ctx] = OBLgm[ctx] + RBLgm[ctx];<br />
}<br />
else<br />
379
{<br />
RBL1gm[ctx] = RBLgm[ctx] - (dumb[ctx]*RBLgm[ctx]);<br />
RBL1[ctx] = RBL[ctx] - (dumb[ctx]*RBLgm[ctx]/(liter_per_node[ctx]<br />
*wetpickup));<br />
OBL1gm[ctx] = OBLgm[ctx] + (dumb[ctx]*RBLgm[ctx]);<br />
if (RBL1gm[ctx]
printf("%e\t%e\t%e\n", IOWYsurface_ratio, IOWYtotal_ratio, COWYtotal_ratio);<br />
if (current_dip > 1)<br />
{<br />
Df = Df * IOWYsurface_ratio;<br />
Dy = Dy * IOWYtotal_ratio;<br />
wetpickup = wetpickup * COWYtotal_ratio;<br />
}<br />
else<br />
{<br />
Dy = Dy * IOWYtotal_ratio;<br />
Df = Df * IOWYsurface_ratio;<br />
wetpickup = wetpickup * COWYtotal_ratio;<br />
}<br />
} // Close Dy & Df convergence loop<br />
// Save IOWY & COWY amount and distribution<br />
for (ctx = 0; ctx
if (wash
for (ctx = 1; ctx
COWY_save[cty][ctx], Integ_save[cty][ctx]);<br />
}<br />
}<br />
cty = 1;<br />
for (ctz = 1; ctz
for (ctz = 1; ctz
Section A-4-3b: Computer program to calculate %COWY, <strong>%IOWY</strong>, and Integ shade values given the<br />
input dye range set-up conditions.<br />
#include <br />
#include <br />
#include <br />
#include <br />
int main ()<br />
{<br />
FILE * pFile;<br />
FILE * oFile;<br />
FILE * o2File;<br />
FILE * o3File;<br />
FILE * o4File;<br />
double AA[61][61], BB[61][61], RBLgm[61], RBL1gm[61], Cj[61], Cj1[61], d[61], TBL[61], TBL1[61], RBL[61], RBL1[61], OBL[61], OBL1[61];<br />
double AAinvt[61][62], X[61], Xrbl[61], Xiowy[61], temp[61], IOWY[61], COWY[61], IOWYoxd[61], temp1, Multi, fraction_dye_affinity,<br />
fraction_oxy_affinity;<br />
double OBLgm[61], OBL1gm[61], dumb[61], IOWYstep[61], gms_ctn_node[61], liter_per_node[61], Df_constantAO[10],<br />
Dy_constantAO[10], WP_constantAO[10], wash_constantAO[10];<br />
double IOWYpre[61], COWYpre[61], dip_error[10], pickup_error[10], Df_dip[5][10], Dy_dip[5][10], WP_dip[5][10], wash_dip[5][10];<br />
double dye_bath_dist[5][10][61], air_dist[5][10][61], IOWY_dist[5][10][61], COWY_dist[5][10][61], Integ_save[5][10], IOWY_save[5][10],<br />
COWY_save[5][10];<br />
float input[1][22], num_time_steps, oxd_time_steps;<br />
double Mt, Dy, DOy, Df, dt, DT, dr, radius, Monophenate_Ion, CompA, CompB, A, AO[10], AO_old, AO_conv[10], AO_change, wash,<br />
old_wash, wetpickup, gmIplit, gmNaOHplit, pH, Air, normal_ave[10], WP_normal_ave;<br />
double lamda, alpha, beta, Ur, UOr, K, porosity, Kph, L, percent_to_grams, grams_to_percent, Integ, num_cycles;<br />
double IOWYtarget, IOWYsurface_target, COWYtarget, IOWYsurface, IOWYoutside_old, IOWYtotal, COWYtotal, IOWYsurface_ratio,<br />
IOWYtotal_ratio, COWYtotal_ratio;<br />
double dwelltime, oxd_time, totalgramsperindigo, new_stdev[10], old_stdev[10], Df_temp, Dy_temp, WP_temp, Df_total[10],<br />
Dy_total[10], WP_total[10];<br />
double mean_dip, mean_pickup, slope, demon, Df_run_ave[10], Dy_run_ave[10], WP_run_ave[10], Df_AO[10], Dy_AO[10], WP_AO[10],<br />
wash_AO[10];<br />
double speed, mV, nip_pressure, Total_IOWY_pre, Total_COWY_pre;<br />
long rows, cols;<br />
int x, num_nodes, ts, yarn_count, num_yarns;<br />
int z, ctx, cty, ctz, current_dip, num_dips;<br />
int i, j, pivot, k;<br />
double PI25DT = 3.141592653589793238462643;<br />
// Iniatialization<br />
num_dips=5; // this is now number <strong>of</strong> dips in data<br />
num_cycles=1;<br />
cols=1;<br />
num_yarns = 1; // number <strong>of</strong> yarn counts processed<br />
DT=0.01; // Define a actual time step to be used in dyeing and oxidization<br />
num_nodes=21;<br />
rows=num_nodes-1;<br />
porosity=0.65;<br />
Ur = 0.0;<br />
K = 1.0;<br />
percent_to_grams = (0.0154 * porosity)/(1.0 - porosity);<br />
grams_to_percent = 1.0/percent_to_grams;<br />
totalgramsperindigo = 2.3884;<br />
AO_old = 0.0;<br />
wash = 0.1;<br />
mean_dip = 0.0;<br />
mean_pickup = 0.0;<br />
slope = 1.0;<br />
386
yarn_count = 1;<br />
for (cty = 1; cty
DOy = 0.219; //oxygen diffusion coefficient cm2/sec<br />
Ur = 0.0;<br />
UOr = -1.0 * input[0][19] * input[0][14]*100/60; //air velocity propagation cm/sec<br />
A = input[0][15]; // dye affinity 1/sec<br />
IOWYsurface_ratio=0.0;<br />
IOWYtotal_ratio=0.0;<br />
COWYtotal_ratio=0.0;<br />
gmIplit = input[0][7]; //gm/lit<br />
gmNaOHplit = input[0][8]; // gm/lit<br />
pH = input[0][9]; //dye bath pH<br />
Integ = input[0][11]; //shade<br />
IOWYtarget = input[0][10];<br />
IOWYsurface_target = 0.0; // <strong>%IOWY</strong> at the surface from Integ conversion<br />
COWYtarget = input[0][12];<br />
mV = input[0][20];<br />
nip_pressure = input[0][21];<br />
speed = input[0][4];<br />
if (current_dip == 1)<br />
{<br />
Df = exp(-27.3480169 + (0.7766363*gmIplit) + (0.4031649*pH));<br />
Dy = exp(-17.3699775 - (0.503326*gmIplit) + (0.588888*pH) - (0.0736707*dwelltime));<br />
AO[current_dip] = exp(-10.4653532 + (0.1263413*speed) + (0.0685300*oxd_time) - (0.0010179*mV));<br />
}<br />
else if (current_dip == 2)<br />
{<br />
Df = exp(-27.3480169 - 0.3903350 + (0.7766363*gmIplit) + (0.4031649*pH));<br />
Dy = exp(-17.3699775 - 0.0516144 - (0.503326*gmIplit) + (0.588888*pH) - (0.0736707*dwelltime));<br />
AO[current_dip] = exp(-10.4653532 -0.4685870 + (0.1263413*speed) + (0.0685300*oxd_time) - (0.0010179*mV));<br />
}<br />
else if (current_dip == 3)<br />
{<br />
Df = exp(-27.3480169 + 0.2868312 + (0.7766363*gmIplit) + (0.4031649*pH));<br />
Dy = exp(-17.3699775 - 0.454878 - (0.503326*gmIplit) + (0.588888*pH) - (0.0736707*dwelltime));<br />
AO[current_dip] = exp(-10.4653532 -0.6931914 + (0.1263413*speed) + (0.0685300*oxd_time) - (0.0010179*mV));<br />
}<br />
else if (current_dip == 4)<br />
{<br />
Df = exp(-27.3480169 + 0.5783337 + (0.7766363*gmIplit) + (0.4031649*pH));<br />
Dy = exp(-17.3699775 - 1.032697 - (0.503326*gmIplit) + (0.588888*pH) - (0.0736707*dwelltime));<br />
AO[current_dip] = exp(-10.4653532 -0.9826215 + (0.1263413*speed) + (0.0685300*oxd_time) - (0.0010179*mV));<br />
}<br />
else if (current_dip == 5)<br />
{<br />
Df = exp(-27.3480169 + 0.9180302 + (0.7766363*gmIplit) + (0.4031649*pH));<br />
Dy = exp(-17.3699775 - 1.392668 - (0.503326*gmIplit) + (0.588888*pH) - (0.0736707*dwelltime));<br />
AO[current_dip] = exp(-10.4653532 -0.6885056 + (0.1263413*speed) + (0.0685300*oxd_time) - (0.0010179*mV));<br />
}<br />
else if (current_dip == 6)<br />
{<br />
Df = exp(-27.3480169 + 1.0879995 + (0.7766363*gmIplit) + (0.4031649*pH));<br />
Dy = exp(-17.3699775 - 1.4830235 - (0.503326*gmIplit) + (0.588888*pH) - (0.0736707*dwelltime));<br />
AO[current_dip] = exp(-10.4653532 -1.3461714 + (0.1263413*speed) + (0.0685300*oxd_time) - (0.0010179*mV));<br />
}<br />
else if (current_dip == 7)<br />
{<br />
Df = exp(-27.3480169 + 0.9494075 + (0.7766363*gmIplit) + (0.4031649*pH));<br />
Dy = exp(-17.3699775 - 1.4538142 - (0.503326*gmIplit) + (0.588888*pH) - (0.0736707*dwelltime));<br />
AO[current_dip] = exp(-10.4653532 -1.3170116 + (0.1263413*speed) + (0.0685300*oxd_time) - (0.0010179*mV));<br />
}<br />
wash = -0.1043059 + (0.0043698*speed) - (0.0174137*dwelltime) + (0.00064822*mV) - (0.06827879*gmIplit);<br />
wetpickup = 0.07959512 - (0.000159807*nip_pressure) - (0.01133595*gmIplit) - (3960.68825*Dy);<br />
IOWYsurface_target = 0.0;<br />
388
IOWYsurface_target = -0.02646465 + (9.53859e-4*Integ) + (1.35931e-5*pow((Integ-55.2088),2)) + (3.909e-8*pow((Integ-55.2088),3));<br />
IOWYsurface_target = IOWYsurface_target + (2.42444e-9*pow((Integ-55.2088),4)) + (6.4303e-11*pow((Integ-55.2088),5));<br />
for (ctx = 0; ctx
AA[0][1]=-2.0*lamda;<br />
AA[1][0]=(beta/dr)-lamda-(alpha);<br />
BB[0][1]=2.0*lamda;<br />
BB[1][0]=(-beta/dr)+lamda+(alpha);<br />
Monophenate_Ion = 1.0/(1.0 + (pow(10,(9.5-pH))) + (pow(10,(pH-12.7))));<br />
CompA = (0.016492 * Monophenate_Ion) + 0.003465;<br />
CompB = (-0.244296 * Monophenate_Ion) + 0.816158;<br />
for (ts = 1; ts
}<br />
if(pivot == (j-1))<br />
{<br />
for (j = 0; j < (rows+1); j++)<br />
{<br />
temp1 = AAinvt[i][j];<br />
AAinvt[i][j]=AAinvt[pivot][j];<br />
AAinvt[pivot][j] = temp1;<br />
}<br />
}<br />
for (j = (i+1); j < rows; j++)<br />
{<br />
Multi = -AAinvt[j][i] / AAinvt[i][i];<br />
for (k = i; k < (rows+1); k++)<br />
{<br />
AAinvt[j][k] = AAinvt[j][k] + (Multi * AAinvt[i][k]);<br />
}<br />
}<br />
}<br />
Cj1[rows-1] = AAinvt[rows-1][rows] / AAinvt[rows-1][rows-1];<br />
for (j = (rows-2); j >= 0; j--)<br />
{<br />
Cj1[j] = AAinvt[j][rows];<br />
for ( k = (j+1); k < rows; k++)<br />
{<br />
Cj1[j] = Cj1[j] - (AAinvt[j][k] * Cj1[k]);<br />
}<br />
Cj1[j] = Cj1[j] / AAinvt[j][j];<br />
}<br />
// End Gauss-Jordan<br />
{<br />
IOWY[0] = IOWY[0] + IOWYstep[0];<br />
}<br />
for (ctx = 1; ctx < rows; ctx++)<br />
{<br />
{<br />
IOWY[ctx] = IOWY[ctx] + IOWYstep[ctx];<br />
}<br />
}<br />
IOWY[rows] = IOWY[rows] + IOWYstep[rows];<br />
for (ctx = 0; ctx
X[ctx]=0.0;<br />
Xrbl[ctx]=0.0;<br />
Xiowy[ctx]=0.0;<br />
for(cty = 0; cty
for (cty = 0; cty
{<br />
if (RBLgm[ctx] > 0.0)<br />
{<br />
dumb[ctx] = (AO[current_dip]*Cj1[ctx]*liter_per_node[ctx]*dt)/RBLgm[ctx];<br />
if (dumb[ctx] > 1.0)<br />
{<br />
RBL1gm[ctx] = 0.0;<br />
RBL1[ctx] = 0.0;<br />
OBL1gm[ctx] = OBLgm[ctx] + RBLgm[ctx];<br />
}<br />
else<br />
{<br />
RBL1gm[ctx] = RBLgm[ctx] - (dumb[ctx]*RBLgm[ctx]);<br />
RBL1[ctx] = RBL[ctx] - (dumb[ctx]*RBLgm[ctx]/(liter_per_node[ctx]*wetpickup));<br />
OBL1gm[ctx] = OBLgm[ctx] + (dumb[ctx]*RBLgm[ctx]);<br />
if (RBL1gm[ctx]
Integ_save[yarn_count][current_dip] = 45.60937 + (592.19421*IOWYsurface) - (9928.5539*pow((IOWYsurface-0.045773),2)) +<br />
(1.83538e+5*pow((IOWYsurface-0.045773),3));<br />
Integ_save[yarn_count][current_dip] = Integ_save[yarn_count][current_dip] - (1.522451e+6*pow((IOWYsurface-0.045773),4))+<br />
(4.27080e+6*pow((IOWYsurface-0.045773),5));<br />
Total_IOWY_pre = IOWYtotal;<br />
Total_COWY_pre = COWYtotal;<br />
// Save IOWY & COWY amount and distribution<br />
for (ctx = 0; ctx
Section A-5-1: Observational Study Raw Data -Dye Range Parameters<br />
Table A-5-1: Independent indigo dye range raw data set<br />
Shade<br />
Dye Bath<br />
ID<br />
Dwell<br />
(gpl<br />
Dye Dye Bath Dwell<br />
Nip<br />
Speed Time Oxidation 100% Dye Bath Alkalinity Length Oxidation Pressures<br />
(m/min) (sec) Time (sec) Indigo) Bath pH (mV) (gpl) (m) Length (m) (psi)<br />
443 29.00 20.1 73.6 1.262 12.18 813 2.58 9.70 38.90 95.00<br />
Yarn Skein Response Variables<br />
Yarn Dye<br />
Greige Boil Off Dyed Washed<br />
Total Surface<br />
Penetration<br />
Count route Dips Weight Weight Weight Weight %COWY <strong>%IOWY</strong> <strong>%IOWY</strong> Integ Level<br />
6.3 1 only 1 8.2301 7.885 8.1841 7.8671 1.72% 0.166% 0.437% 8.1 0.38<br />
6.3 1--2 2 7.7329 7.3991 7.7581 7.3974 2.75% 0.286% 0.740% 17.2 0.39<br />
6.3 1--3 3 8.3473 8.0082 8.4238 8.0085 3.09% 0.455% 1.034% 29.5 0.44<br />
6.3 1--4 4 7.7045 7.3799 7.7854 7.4011 3.38% 0.510% 1.269% 35.8 0.40<br />
6.3 1--5 5 8.2838 7.9276 8.3811 7.9722 3.61% 0.744% 2.164% 50.1 0.34<br />
6.3 1--6 6 8.3773 8.0322 8.44 8.0778 4.30% 0.885% 2.836% 57.4 0.31<br />
% Reflectance Readings<br />
Wavelength<br />
(nm) Dip 1 Dip 2 Dip 3 Dip 4 Dip 5 Dip 6 Dip 7<br />
400 19.43 13.08 9.08 7.95 5.99 5.19<br />
420 24.21 16.95 12.03 10.62 7.70 6.55<br />
440 23.52 16.01 11.13 9.70 6.89 5.83<br />
460 21.30 13.98 9.51 8.20 5.80 4.90<br />
480 19.39 12.24 8.09 6.83 4.78 4.04<br />
500 17.66 10.86 7.00 5.84 4.07 3.44<br />
520 15.57 9.17 5.66 4.68 3.25 2.75<br />
540 13.12 7.40 4.48 3.68 2.58 2.20<br />
560 11.61 6.28 3.76 3.09 2.18 1.89<br />
580 10.10 5.21 3.11 2.58 1.87 1.65<br />
600 8.65 4.31 2.61 2.18 1.64 1.48<br />
620 7.52 3.70 2.26 1.91 1.48 1.37<br />
640 6.50 3.16 2.01 1.72 1.41 1.32<br />
660 5.93 2.98 1.94 1.67 1.40 1.34<br />
680 7.72 3.93 2.59 2.21 1.78 1.66<br />
700 15.16 9.11 5.91 4.95 3.68 3.26<br />
396
Table A-5-1: Continued<br />
Shade<br />
Dye Bath<br />
ID<br />
Dwell<br />
(gpl<br />
Dye Dye Bath Dwell<br />
Nip<br />
Speed Time Oxidation 100% Dye Bath Alkalinity Length Oxidation Pressures<br />
(m/min) (sec) Time (sec) Indigo) Bath pH (mV) (gpl) (m) Length (m) (psi)<br />
443 29.00 20.1 73.6 1.262 12.18 813 2.58 9.70 38.90 95.00<br />
Yarn Skein Response Variables<br />
Yarn Dye<br />
Greige Boil Off Dyed Washed<br />
Total Surface<br />
Penetration<br />
Count route Dips Weight Weight Weight Weight %COWY <strong>%IOWY</strong> <strong>%IOWY</strong> Integ Level<br />
7.1 1 only 1 6.9605 6.7511 7.0156 6.7396 1.84% 0.180% 0.533% 10.3 0.34<br />
7.1 1--2 2 6.9388 6.7247 7.0592 6.7256 2.87% 0.312% 0.765% 18.3 0.41<br />
7.1 1--3 3 7.1311 6.9206 7.3021 6.9363 3.40% 0.490% 1.013% 28.8 0.48<br />
7.1 1--4 4 7.0685 6.8668 7.2129 6.8864 2.94% 0.612% 1.498% 40.4 0.41<br />
7.1 1--5 5 7.2281 7.0148 7.4632 7.0448 4.26% 0.732% 1.911% 46.8 0.38<br />
7.1 1--6 6 7.0234 6.8175 7.1867 6.852 4.60% 0.911% 2.825% 57.3 0.32<br />
% Reflectance Readings<br />
Wavelength<br />
(nm) Dip 1 Dip 2 Dip 3 Dip 4 Dip 5 Dip 6 Dip 7<br />
400 17.74 12.72 9.40 7.36 6.47 5.42<br />
420 22.38 16.60 12.49 9.81 8.43 6.90<br />
440 21.50 15.58 11.53 8.84 7.54 6.10<br />
460 19.20 13.50 9.81 7.42 6.32 5.05<br />
480 17.26 11.77 8.34 6.13 5.21 4.15<br />
500 15.58 10.39 7.22 5.23 4.44 3.50<br />
520 13.55 8.76 5.84 4.17 3.54 2.79<br />
540 11.22 7.05 4.62 3.27 2.79 2.22<br />
560 9.80 5.96 3.86 2.74 2.35 1.89<br />
580 8.35 4.93 3.19 2.30 1.99 1.64<br />
600 6.99 4.07 2.66 1.94 1.72 1.46<br />
620 6.00 3.49 2.30 1.72 1.54 1.34<br />
640 5.10 2.97 2.03 1.57 1.45 1.30<br />
660 4.69 2.79 1.96 1.55 1.44 1.31<br />
680 6.33 3.72 2.61 2.01 1.85 1.63<br />
700 13.33 8.61 6.04 4.47 3.92 3.27<br />
397
Table A-5-1: Continued<br />
Shade<br />
Dye Bath<br />
ID<br />
Dwell<br />
(gpl<br />
Dye Dye Bath Dwell<br />
Nip<br />
Speed Time Oxidation 100% Dye Bath Alkalinity Length Oxidation Pressures<br />
(m/min) (sec) Time (sec) Indigo) Bath pH (mV) (gpl) (m) Length (m) (psi)<br />
443 29.00 20.10 73.60 1.196 12.06 807 2.51 9.70 38.90 95<br />
Yarn Skein Response Variables<br />
Yarn Dye<br />
Greige Boil Off Dyed Washed<br />
Total Surface<br />
Penetration<br />
Count route Dips Weight Weight Weight Weight %COWY <strong>%IOWY</strong> <strong>%IOWY</strong> Integ Level<br />
7.1 1 only 1 7.0115 6.8131 7.0888 6.7928 1.97% 0.157% 0.438% 8.1 0.36<br />
7.1 1--2 2 7.0284 6.831 7.1646 6.8207 2.79% 0.285% 0.737% 17.1 0.39<br />
7.1 1--3 3 7.0272 6.8247 7.1861 6.8223 3.19% 0.431% 0.960% 26.9 0.45<br />
7.1 1--4 4 7.2151 7.0028 7.369 7.0351 3.12% 0.546% 1.315% 36.8 0.42<br />
7.1 1--5 5 7.207 6.9949 7.4293 7.0223 4.09% 0.687% 1.866% 46.2 0.37<br />
7.1 1--6 6 7.1864 6.9674 7.3599 7.0164 4.70% 0.865% 2.665% 55.7 0.32<br />
% Reflectance Readings<br />
Wavelength<br />
(nm) Dip 1 Dip 2 Dip 3 Dip 4 Dip 5 Dip 6 Dip 7<br />
400 19.83 13.28 9.85 7.79 6.53 5.49<br />
420 24.69 17.19 12.97 10.31 8.58 6.97<br />
440 23.93 16.18 12.02 9.42 7.69 6.20<br />
460 21.62 14.08 10.27 7.98 6.43 5.18<br />
480 19.68 12.32 8.79 6.65 5.30 4.25<br />
500 17.92 10.92 7.65 5.69 4.51 3.61<br />
520 15.75 9.25 6.21 4.56 3.59 2.88<br />
540 13.25 7.47 4.93 3.60 2.83 2.30<br />
560 11.70 6.35 4.13 3.02 2.39 1.96<br />
580 10.12 5.26 3.41 2.52 2.02 1.69<br />
600 8.63 4.34 2.84 2.13 1.74 1.49<br />
620 7.48 3.72 2.46 1.86 1.55 1.38<br />
640 6.42 3.18 2.15 1.70 1.45 1.32<br />
660 5.86 3.00 2.05 1.65 1.44 1.36<br />
680 7.72 4.00 2.73 2.18 1.85 1.68<br />
700 15.37 9.19 6.40 4.88 3.95 3.36<br />
398
Table A-5-1: Continued<br />
Shade<br />
Dye Bath<br />
ID<br />
Dwell<br />
(gpl<br />
Dye Dye Bath Dwell<br />
Nip<br />
Speed Time Oxidation 100% Dye Bath Alkalinity Length Oxidation Pressures<br />
(m/min) (sec) Time (sec) Indigo) Bath pH (mV) (gpl) (m) Length (m) (psi)<br />
418 32.00 18.20 66.70 1.658 11.83 814 3.29 9.70 38.90 95<br />
Yarn Skein Response Variables<br />
Yarn Dye<br />
Greige Boil Off Dyed Washed<br />
Total Surface<br />
Penetration<br />
Count route Dips Weight Weight Weight Weight %COWY <strong>%IOWY</strong> <strong>%IOWY</strong> Integ Level<br />
6.3 1 only 1 7.8005 7.4685 7.7353 7.4733 3.57% 0.322% 0.725% 16.6 0.44<br />
6.3 1--2 2 8.2502 7.9087 8.294 7.9319 4.87% 0.556% 1.263% 35.7 0.44<br />
6.3 1--3 3 8.2 7.8407 8.3168 7.9097 6.07% 0.811% 2.327% 52.0 0.35<br />
6.3 1--4 4 7.9116 7.5711 8.0109 7.6461 5.81% 1.049% 3.291% 61.6 0.32<br />
6.3 1--5 5 7.7039 7.3753 7.8447 7.4811 6.36% 1.372% 4.751% 72.7 0.29<br />
6.3 1--6 6 8.2011 7.8532 8.3437 7.9801 6.50% 1.670% 6.416% 81.9 0.26<br />
% Reflectance Readings<br />
Wavelength<br />
(nm) Dip 1 Dip 2 Dip 3 Dip 4 Dip 5 Dip 6 Dip 7<br />
400 13.64 7.99 5.82 4.81 3.84 3.28<br />
420 18.04 10.83 7.57 6.15 4.77 3.98<br />
440 16.94 9.81 6.67 5.37 4.14 3.44<br />
460 14.65 8.17 5.50 4.39 3.42 2.85<br />
480 12.75 6.75 4.49 3.58 2.82 2.35<br />
500 11.26 5.75 3.80 3.04 2.42 2.05<br />
520 9.49 4.60 3.04 2.45 1.97 1.69<br />
540 7.60 3.62 2.41 1.97 1.64 1.45<br />
560 6.48 3.06 2.06 1.74 1.48 1.33<br />
580 5.37 2.57 1.80 1.55 1.37 1.25<br />
600 4.43 2.19 1.60 1.42 1.29 1.20<br />
620 3.77 1.95 1.48 1.35 1.25 1.20<br />
640 3.22 1.79 1.44 1.35 1.29 1.23<br />
660 3.07 1.80 1.49 1.42 1.38 1.33<br />
680 4.03 2.27 1.81 1.69 1.58 1.54<br />
700 9.48 4.95 3.55 3.06 2.61 2.35<br />
399
Table A-5-1: Continued<br />
Shade<br />
Dye Bath<br />
ID<br />
Dwell<br />
(gpl<br />
Dye Dye Bath Dwell<br />
Nip<br />
Speed Time Oxidation 100% Dye Bath Alkalinity Length Oxidation Pressures<br />
(m/min) (sec) Time (sec) Indigo) Bath pH (mV) (gpl) (m) Length (m) (psi)<br />
402 28.00 20.80 76.30 1.986 12.24 841 3.53 9.70 38.90 95<br />
Yarn Skein Response Variables<br />
Yarn Dye<br />
Greige Boil Off Dyed Washed<br />
Total Surface<br />
Penetration<br />
Count route Dips Weight Weight Weight Weight %COWY <strong>%IOWY</strong> <strong>%IOWY</strong> Integ Level<br />
6.3 1 only 1 7.7818 7.4511 7.7775 7.4437 3.13% 0.320% 0.725% 16.6 0.44<br />
6.3 1--2 2 8.1611 7.8115 8.2261 7.8274 4.04% 0.550% 1.176% 33.6 0.47<br />
6.3 1--3 3 7.8049 7.4705 7.9675 7.5075 5.37% 0.856% 2.150% 49.9 0.40<br />
6.3 1--4 4 7.7129 7.3701 7.8701 7.4395 5.50% 1.164% 3.670% 64.8 0.32<br />
6.3 1--5 5 7.8049 7.482 8.0171 7.559 5.87% 1.561% 5.577% 77.6 0.28<br />
6.3 1--6 6 8.2905 7.945 8.4682 8.0669 5.31% 1.830% 6.629% 82.9 0.28<br />
% Reflectance Readings<br />
Wavelength<br />
(nm) Dip 1 Dip 2 Dip 3 Dip 4 Dip 5 Dip 6 Dip 7<br />
400 13.25 8.47 6.07 4.59 3.58 3.16<br />
420 17.46 11.43 7.96 5.83 4.43 3.78<br />
440 16.47 10.41 7.05 5.10 3.84 3.27<br />
460 14.25 8.70 5.80 4.18 3.16 2.72<br />
480 12.45 7.25 4.74 3.42 2.60 2.26<br />
500 11.02 6.20 4.01 2.90 2.24 1.98<br />
520 9.37 4.98 3.22 2.35 1.84 1.66<br />
540 7.57 3.91 2.56 1.89 1.53 1.44<br />
560 6.49 3.29 2.17 1.65 1.40 1.34<br />
580 5.42 2.73 1.87 1.47 1.28 1.25<br />
600 4.49 2.30 1.64 1.35 1.22 1.21<br />
620 3.86 2.02 1.51 1.30 1.21 1.21<br />
640 3.26 1.79 1.41 1.25 1.22 1.23<br />
660 3.12 1.80 1.49 1.34 1.35 1.38<br />
680 4.03 2.35 1.84 1.60 1.58 1.60<br />
700 9.14 5.27 3.69 2.91 2.49 2.34<br />
400
Table A-5-1: Continued<br />
Shade<br />
Dye Bath<br />
ID<br />
Dwell<br />
(gpl<br />
Dye Dye Bath Dwell<br />
Nip<br />
Speed Time Oxidation 100% Dye Bath Alkalinity Length Oxidation Pressures<br />
(m/min) (sec) Time (sec) Indigo) Bath pH (mV) (gpl) (m) Length (m) (psi)<br />
402 28.00 20.80 76.30 1.986 12.24 841 3.53 9.70 38.90 95<br />
Yarn Skein Response Variables<br />
Yarn Dye<br />
Greige Boil Off Dyed Washed<br />
Total Surface<br />
Penetration<br />
Count route Dips Weight Weight Weight Weight %COWY <strong>%IOWY</strong> <strong>%IOWY</strong> Integ Level<br />
7.1 1 only 1 7.0215 6.8197 7.1193 6.8162 3.14% 0.354% 0.806% 20.3 0.44<br />
7.1 1--2 2 7.0354 6.8369 7.2252 6.8568 4.41% 0.621% 1.488% 40.2 0.42<br />
7.1 1--3 3 7.2442 7.0315 7.5124 7.0802 5.56% 0.885% 2.607% 55.1 0.34<br />
7.1 1--4 4 7.0342 6.8316 7.272 6.8981 5.17% 1.210% 3.406% 62.6 0.36<br />
7.1 1--5 5 7.0837 6.882 7.3738 6.963 5.86% 1.605% 4.657% 72.0 0.34<br />
7.1 1--6 6 7.0648 6.8578 7.2998 6.9678 5.17% 1.974% 7.055% 84.8 0.28<br />
% Reflectance Readings<br />
Wavelength<br />
(nm) Dip 1 Dip 2 Dip 3 Dip 4 Dip 5 Dip 6 Dip 7<br />
400 12.19 7.42 5.62 4.84 4.01 3.12<br />
420 16.21 10.07 7.23 6.18 4.99 3.82<br />
440 15.08 9.04 6.35 5.40 4.34 3.30<br />
460 12.84 7.49 5.20 4.43 3.56 2.75<br />
480 11.07 6.15 4.25 3.62 2.93 2.27<br />
500 9.70 5.22 3.59 3.06 2.51 1.98<br />
520 8.06 4.16 2.88 2.47 2.04 1.64<br />
540 6.41 3.25 2.29 1.97 1.67 1.40<br />
560 5.41 2.74 1.96 1.72 1.50 1.30<br />
580 4.46 2.29 1.70 1.52 1.36 1.21<br />
600 3.68 1.95 1.51 1.37 1.27 1.17<br />
620 3.15 1.74 1.42 1.31 1.24 1.16<br />
640 2.66 1.57 1.34 1.25 1.22 1.16<br />
660 2.57 1.59 1.42 1.35 1.33 1.30<br />
680 3.36 2.01 1.73 1.61 1.57 1.51<br />
700 8.01 4.42 3.37 2.95 2.61 2.25<br />
401
Table A-5-1: Continued<br />
Shade<br />
Dye Bath<br />
ID<br />
Dwell<br />
(gpl<br />
Dye Dye Bath Dwell<br />
Nip<br />
Speed Time Oxidation 100% Dye Bath Alkalinity Length Oxidation Pressures<br />
(m/min) (sec) Time (sec) Indigo) Bath pH (mV) (gpl) (m) Length (m) (psi)<br />
402 28.00 20.80 76.30 1.986 12.24 841 3.53 9.70 38.90 95<br />
Yarn Skein Response Variables<br />
Yarn Dye<br />
Greige Boil Off Dyed Washed<br />
Total Surface<br />
Penetration<br />
Count route Dips Weight Weight Weight Weight %COWY <strong>%IOWY</strong> <strong>%IOWY</strong> Integ Level<br />
8 1 only 1 9.3167 8.9763 9.3606 8.8991 3.03% 0.405% 0.821% 21.0 0.49<br />
8 1--2 2 9.228 8.9051 9.4013 8.8917 4.31% 0.706% 1.382% 38.2 0.51<br />
8 1--3 3 9.8658 9.4983 10.167 9.5727 5.76% 1.166% 2.780% 56.8 0.42<br />
8 1--4 4 8.9274 8.5972 9.2155 8.7022 5.91% 1.481% 4.331% 69.8 0.34<br />
8 1--5 5 9.2807 8.9442 9.6769 9.1161 6.89% 1.893% 6.248% 81.1 0.30<br />
8 1--6 6 9.1866 8.8523 9.5417 9.0438 6.49% 2.194% 7.096% 84.9 0.31<br />
% Reflectance Readings<br />
Wavelength<br />
(nm) Dip 1 Dip 2 Dip 3 Dip 4 Dip 5 Dip 6 Dip 7<br />
400 11.87 7.60 5.33 4.17 3.32 2.99<br />
420 15.78 10.32 6.84 5.19 4.04 3.56<br />
440 14.68 9.27 6.00 4.51 3.50 3.07<br />
460 12.51 7.66 4.90 3.69 2.90 2.55<br />
480 10.78 6.30 4.00 3.03 2.39 2.13<br />
500 9.45 5.36 3.39 2.58 2.07 1.87<br />
520 7.83 4.29 2.73 2.10 1.72 1.59<br />
540 6.23 3.39 2.19 1.73 1.47 1.40<br />
560 5.25 2.87 1.90 1.54 1.35 1.31<br />
580 4.32 2.42 1.66 1.39 1.25 1.24<br />
600 3.55 2.07 1.49 1.30 1.21 1.22<br />
620 3.05 1.85 1.41 1.27 1.20 1.24<br />
640 2.60 1.67 1.36 1.26 1.21 1.27<br />
660 2.52 1.72 1.46 1.38 1.36 1.45<br />
680 3.34 2.17 1.74 1.62 1.57 1.66<br />
700 7.97 4.62 3.30 2.73 2.38 2.32<br />
402
Table A-5-1: Continued<br />
Shade<br />
Dye Bath<br />
ID<br />
Dwell<br />
(gpl<br />
Dye Dye Bath Dwell<br />
Nip<br />
Speed Time Oxidation 100% Dye Bath Alkalinity Length Oxidation Pressures<br />
(m/min) (sec) Time (sec) Indigo) Bath pH (mV) (gpl) (m) Length (m) (psi)<br />
471 32.00 18.20 66.70 2.094 12.12 838 3.42 9.70 38.90 95<br />
Yarn Skein Response Variables<br />
Yarn Dye<br />
Greige Boil Off Dyed Washed<br />
Total Surface<br />
Penetration<br />
Count route Dips Weight Weight Weight Weight %COWY <strong>%IOWY</strong> <strong>%IOWY</strong> Integ Level<br />
6.3 1 only 1 7.9307 7.5955 7.9387 7.585 4.52% 0.333% 0.746% 17.5 0.45<br />
6.3 1--2 2 8.2671 7.9191 8.3645 7.9288 5.62% 0.631% 1.248% 35.3 0.51<br />
6.3 1--3 3 7.9353 7.5908 8.0965 7.6303 6.66% 0.996% 2.267% 51.3 0.44<br />
6.3 1--4 4 7.6814 7.3619 7.8528 7.4163 6.67% 1.286% 3.834% 66.1 0.34<br />
6.3 1--5 5 8.2861 7.9359 8.4814 8.0135 6.87% 1.602% 5.328% 76.2 0.30<br />
6.3 1--6 6 7.9222 7.5824 8.0857 7.6956 6.64% 1.973% 7.164% 85.2 0.28<br />
% Reflectance Readings<br />
Wavelength<br />
(nm) Dip 1 Dip 2 Dip 3 Dip 4 Dip 5 Dip 6 Dip 7<br />
400 12.93 8.01 5.89 4.38 3.62 3.02<br />
420 17.05 10.81 7.71 5.58 4.52 3.64<br />
440 16.03 9.84 6.81 4.88 3.93 3.16<br />
460 13.84 8.22 5.61 4.02 3.24 2.63<br />
480 12.07 6.81 4.58 3.28 2.65 2.16<br />
500 10.67 5.84 3.87 2.79 2.29 1.89<br />
520 9.05 4.71 3.12 2.27 1.89 1.61<br />
540 7.30 3.71 2.48 1.85 1.58 1.40<br />
560 6.21 3.13 2.12 1.63 1.43 1.31<br />
580 5.15 2.60 1.82 1.46 1.31 1.22<br />
600 4.25 2.20 1.60 1.34 1.23 1.18<br />
620 3.62 1.94 1.47 1.28 1.20 1.18<br />
640 3.09 1.77 1.43 1.29 1.23 1.25<br />
660 2.93 1.76 1.48 1.36 1.34 1.38<br />
680 3.88 2.31 1.85 1.65 1.59 1.62<br />
700 8.91 5.01 3.64 2.88 2.54 2.30<br />
403
Table A-5-1: Continued<br />
Shade<br />
Dye Bath<br />
ID<br />
Dwell<br />
(gpl<br />
Dye Dye Bath Dwell<br />
Nip<br />
Speed Time Oxidation 100% Dye Bath Alkalinity Length Oxidation Pressures<br />
(m/min) (sec) Time (sec) Indigo) Bath pH (mV) (gpl) (m) Length (m) (psi)<br />
471 32.00 18.20 66.70 2.094 12.12 838 3.42 9.70 38.90 95<br />
Yarn Skein Response Variables<br />
Yarn Dye<br />
Greige Boil Off Dyed Washed<br />
Total Surface<br />
Penetration<br />
Count route Dips Weight Weight Weight Weight %COWY <strong>%IOWY</strong> <strong>%IOWY</strong> Integ Level<br />
7.1 1 only 1 7.0215 7.0117 7.3237 6.9992 4.45% 0.375% 0.782% 19.1 0.48<br />
7.1 1--2 2 7.0354 7.0328 7.4309 7.0457 5.66% 0.655% 1.379% 38.1 0.48<br />
7.1 1--3 3 7.2442 7.2045 7.6625 7.2414 6.36% 0.951% 2.484% 53.8 0.38<br />
7.1 1--4 4 7.0342 7.0233 7.4485 7.0942 6.05% 1.493% 4.629% 71.9 0.32<br />
7.1 1--5 5 7.0837 7.0282 7.5511 7.1115 7.44% 1.714% 5.414% 76.7 0.32<br />
7.1 1--6 6 7.0648 6.9459 7.4152 7.0605 6.76% 2.162% 7.680% 87.3 0.28<br />
% Reflectance Readings<br />
Wavelength<br />
(nm) Dip 1 Dip 2 Dip 3 Dip 4 Dip 5 Dip 6 Dip 7<br />
400 12.52 7.66 5.72 4.01 3.60 2.96<br />
420 16.58 10.35 7.42 5.04 4.43 3.57<br />
440 15.52 9.33 6.55 4.38 3.84 3.08<br />
460 13.32 7.76 5.40 3.59 3.17 2.57<br />
480 11.56 6.39 4.40 2.93 2.59 2.11<br />
500 10.18 5.45 3.73 2.49 2.23 1.85<br />
520 8.54 4.38 3.00 2.04 1.85 1.57<br />
540 6.84 3.44 2.37 1.67 1.56 1.36<br />
560 5.75 2.90 2.02 1.50 1.42 1.27<br />
580 4.73 2.41 1.74 1.36 1.31 1.20<br />
600 3.88 2.05 1.53 1.27 1.24 1.16<br />
620 3.30 1.82 1.42 1.23 1.22 1.16<br />
640 2.82 1.68 1.37 1.27 1.26 1.23<br />
660 2.68 1.68 1.42 1.37 1.37 1.36<br />
680 3.55 2.18 1.78 1.64 1.63 1.60<br />
700 8.41 4.63 3.47 2.71 2.51 2.25<br />
404
Table A-5-1: Continued<br />
Shade<br />
Dye Bath<br />
ID<br />
Dwell<br />
(gpl<br />
Dye Dye Bath Dwell<br />
Nip<br />
Speed Time Oxidation 100% Dye Bath Alkalinity Length Oxidation Pressures<br />
(m/min) (sec) Time (sec) Indigo) Bath pH (mV) (gpl) (m) Length (m) (psi)<br />
471 32.00 18.20 66.70 2.094 12.12 838 3.42 9.70 38.90 95<br />
Yarn Skein Response Variables<br />
Yarn Dye<br />
Greige Boil Off Dyed Washed<br />
Total Surface<br />
Penetration<br />
Count route Dips Weight Weight Weight Weight %COWY <strong>%IOWY</strong> <strong>%IOWY</strong> Integ Level<br />
12 1 only 1 6.1779 5.7167 5.9994 5.7123 4.95% 0.398% 0.772% 18.7 0.52<br />
12 1--2 2 5.9573 5.7311 6.1273 5.7502 6.91% 0.755% 1.384% 38.2 0.55<br />
12 1--3 3 6.0513 5.8758 6.2831 5.9182 6.93% 1.136% 2.339% 52.1 0.49<br />
12 1--4 4 5.9588 5.7315 6.1815 5.8074 7.85% 1.607% 4.211% 69.0 0.38<br />
12 1--6 6 5.8451 5.6216 6.1025 5.7299 8.55% 2.210% 6.725% 83.3 0.33<br />
12 1--6 6 6.0562 5.8765 6.3204 5.9896 7.55% 2.330% 6.360% 81.6 0.37<br />
% Reflectance Readings<br />
Wavelength<br />
(nm) Dip 1 Dip 2 Dip 3 Dip 4 Dip 6 Dip 6 Dip 7<br />
400 12.59 7.72 5.83 4.21 3.21 3.17<br />
420 16.56 10.38 7.58 5.30 3.94 3.86<br />
440 15.47 9.36 6.68 4.62 3.40 3.34<br />
460 13.28 7.78 5.49 3.79 2.83 2.78<br />
480 11.53 6.41 4.48 3.10 2.32 2.29<br />
500 10.20 5.47 3.80 2.64 2.03 2.00<br />
520 8.60 4.41 3.07 2.16 1.68 1.69<br />
540 6.94 3.47 2.44 1.76 1.43 1.45<br />
560 5.88 2.92 2.09 1.57 1.32 1.35<br />
580 4.85 2.41 1.80 1.41 1.22 1.27<br />
600 4.01 2.03 1.58 1.30 1.17 1.23<br />
620 3.41 1.80 1.46 1.25 1.16 1.22<br />
640 2.93 1.65 1.43 1.26 1.22 1.29<br />
660 2.81 1.65 1.48 1.36 1.35 1.43<br />
680 3.72 2.17 1.86 1.63 1.57 1.67<br />
700 8.49 4.69 3.59 2.77 2.36 2.39<br />
405
Table A-5-1: Continued<br />
Shade<br />
Dye Bath<br />
ID<br />
Dwell<br />
(gpl<br />
Dye Dye Bath Dwell<br />
Nip<br />
Speed Time Oxidation 100% Dye Bath Alkalinity Length Oxidation Pressures<br />
(m/min) (sec) Time (sec) Indigo) Bath pH (mV) (gpl) (m) Length (m) (psi)<br />
401 28.00 20.80 76.30 2.211 12.11 820 3.72 9.70 38.90 95<br />
Yarn Skein Response Variables<br />
Yarn Dye<br />
Greige Boil Off Dyed Washed<br />
Total Surface<br />
Penetration<br />
Count route Dips Weight Weight Weight Weight %COWY <strong>%IOWY</strong> <strong>%IOWY</strong> Integ Level<br />
8 1 only 1 9.3795 9.0347 9.4691 9.0311 3.76% 0.422% 0.827% 21.2 0.51<br />
8 1--2 2 9.3241 8.9773 9.5306 9.013 5.10% 0.751% 1.481% 40.1 0.51<br />
8 1--3 3 9.2045 8.8731 9.4807 8.9362 5.78% 1.178% 2.841% 57.5 0.41<br />
8 1--4 4 9.2051 8.8685 9.492 8.967 5.96% 1.573% 4.330% 69.8 0.36<br />
8 1--6 6 9.1474 8.8177 9.5895 8.9952 7.67% 2.379% 7.711% 87.4 0.31<br />
% Reflectance Readings<br />
Wavelength<br />
(nm) Dip 1 Dip 2 Dip 3 Dip 4 Dip 5 Dip 6 Dip 7<br />
400 11.81 7.38 5.31 4.17 2.97<br />
420 15.74 9.97 6.80 5.25 3.55<br />
440 14.62 8.94 5.97 4.56 3.08<br />
460 12.45 7.41 4.89 3.74 2.58<br />
480 10.69 6.06 3.96 3.04 2.13<br />
500 9.34 5.15 3.36 2.60 1.87<br />
520 7.73 4.11 2.71 2.12 1.58<br />
540 6.14 3.24 2.16 1.73 1.36<br />
560 5.19 2.75 1.88 1.55 1.28<br />
580 4.29 2.32 1.66 1.41 1.21<br />
600 3.53 1.97 1.48 1.30 1.16<br />
620 2.99 1.75 1.36 1.23 1.13<br />
640 2.57 1.62 1.34 1.24 1.16<br />
660 2.48 1.66 1.44 1.36 1.30<br />
680 3.24 2.06 1.71 1.58 1.48<br />
700 7.82 4.44 3.24 2.70 2.15<br />
406