Introduction Data Estimating the relationship between house value ...
Introduction Data Estimating the relationship between house value ...
Introduction Data Estimating the relationship between house value ...

You also want an ePaper? Increase the reach of your titles
YUMPU automatically turns print PDFs into web optimized ePapers that Google loves.
<strong>Introduction</strong><br />
1<br />
Economics 312<br />
Sample Project Report<br />
Jeffrey Parker<br />
This project is based on Exercise 2.12 on page 81 of <strong>the</strong> Hill, Griffiths, and Lim text. It<br />
examines how <strong>the</strong> sale price of <strong>house</strong>s in Stockton, California, are affected by <strong>house</strong> characteristics<br />
including living area, age, and lot size.<br />
<strong>Data</strong><br />
The project uses a dataset called stockton4.dta from <strong>the</strong> authors’ collection. The data<br />
definition file provided by <strong>the</strong> authors is reproduced below:<br />
sprice livarea beds baths lgelot age pool<br />
Obs: 1500 home sales in Stockton, CA from Oct 1, 1996 to Nov 30, 1998<br />
This is a subset of stockton3.dat, <strong>the</strong> first 1500 observations<br />
sprice selling price of home, dollars<br />
livarea living area, hundreds of square feet<br />
beds number of beds<br />
baths number of baths<br />
lgelot =1 if lot size > .5 acres, 0 o<strong>the</strong>rwise<br />
age age of home at time of sale, years<br />
pool =1 if home has pool, 0 o<strong>the</strong>rwise<br />
<strong>Data</strong> source: Dr. John Knight, Department of Finance, University of <strong>the</strong> Pacific<br />
Variable | Obs Mean Std. Dev. Min Max<br />
-------------+--------------------------------------------------------<br />
sprice | 1500 123693.9 63250.89 22000 713000<br />
livarea | 1500 16.74667 5.461963 7 49<br />
beds | 1500 3.285333 .619818 1 6<br />
baths | 1500 2.133 .5253523 1 6.5<br />
lgelot | 1500 .0633333 .2436428 0 1<br />
-------------+--------------------------------------------------------<br />
age | 1500 21.86 13.11464 0 97<br />
pool | 1500 .0653333 .2471955 0 1<br />
<strong>Estimating</strong> <strong>the</strong> <strong>relationship</strong> <strong>between</strong> <strong>house</strong> <strong>value</strong> and living area (Parts a–e)<br />
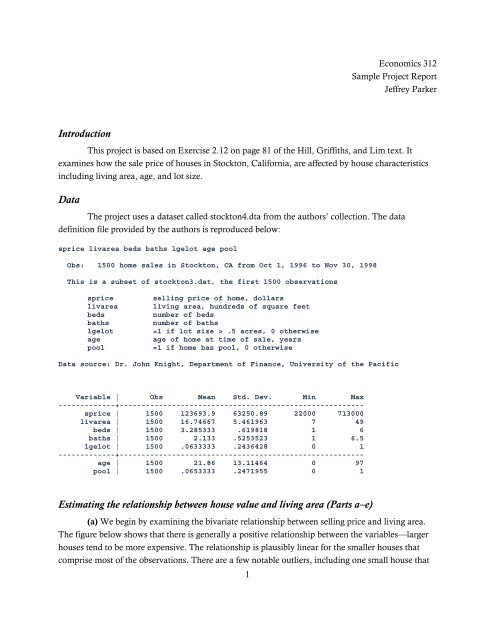
(a) We begin by examining <strong>the</strong> bivariate <strong>relationship</strong> <strong>between</strong> selling price and living area.<br />
The figure below shows that <strong>the</strong>re is generally a positive <strong>relationship</strong> <strong>between</strong> <strong>the</strong> variables—larger<br />
<strong>house</strong>s tend to be more expensive. The <strong>relationship</strong> is plausibly linear for <strong>the</strong> smaller <strong>house</strong>s that<br />
comprise most of <strong>the</strong> observations. There are a few notable outliers, including one small <strong>house</strong> that
sold for several times <strong>the</strong> amount of <strong>the</strong> next most expensive <strong>house</strong> of similar size. The figure also<br />
shows one limitation of <strong>the</strong> data: <strong>the</strong> living-area variable appears to be rounded to <strong>the</strong> nearest<br />
hundred.<br />
selling price of home, dollars<br />
0 200000 400000 600000 800000<br />
(b) A bivariate regression of selling price on living area yields an estimated slope of 9182.<br />
(See regression table below.) This means that an increase of 100 square feet of living area (<strong>the</strong> size of<br />
one small room) raises <strong>the</strong> expected selling price by $9,182.<br />
The estimated intercept of <strong>the</strong> linear <strong>relationship</strong> is –30069. If <strong>the</strong> same linear <strong>relationship</strong><br />
extended down to <strong>house</strong>s of zero size (an empty lot?), <strong>the</strong>n <strong>the</strong> intercept could be interpreted as <strong>the</strong><br />
<strong>value</strong> of such a “null” <strong>house</strong>. However, <strong>the</strong>re are no <strong>house</strong>s below 700 square feet in <strong>the</strong> sample, so<br />
such an interpretation entails <strong>the</strong> dangerous practice of out-of-sample extrapolation. Moreover,<br />
given that <strong>the</strong> estimated intercept is negative, it seems likely that extrapolating <strong>the</strong> estimated linear<br />
<strong>relationship</strong> to zero living area is unreliable.<br />
The estimated fitted line is graphed below (in part d).<br />
. reg sprice livarea<br />
10 20 30 40 50<br />
living area, hundreds of square feet<br />
2
Source | SS df MS Number of obs = 1500<br />
-------------+------------------------------ F( 1, 1498) = 2535.97<br />
Model | 3.7700e+12 1 3.7700e+12 Prob > F = 0.0000<br />
Residual | 2.2270e+12 1498 1.4866e+09 R-squared = 0.6287<br />
-------------+------------------------------ Adj R-squared = 0.6284<br />
Total | 5.9970e+12 1499 4.0007e+09 Root MSE = 38557<br />
------------------------------------------------------------------------------<br />
sprice | Coef. Std. Err. t P>|t| [95% Conf. Interval]<br />
-------------+----------------------------------------------------------------<br />
livarea | 9181.711 182.3272 50.36 0.000 8824.067 9539.355<br />
_cons | -30069.2 3211.568 -9.36 0.000 -36368.85 -23769.55<br />
------------------------------------------------------------------------------<br />
(c) Both <strong>the</strong> scatter plot and <strong>the</strong> counterintuitive negative intercept suggest that <strong>the</strong><br />
<strong>relationship</strong> <strong>between</strong> price and living area might be nonlinear. We next examine a restricted<br />
quadratic form in which price is a linear function of squared living area (livarea2).<br />
. reg sprice livarea2<br />
Source | SS df MS Number of obs = 1500<br />
-------------+------------------------------ F( 1, 1498) = 2924.16<br />
Model | 3.9655e+12 1 3.9655e+12 Prob > F = 0.0000<br />
Residual | 2.0315e+12 1498 1.3561e+09 R-squared = 0.6613<br />
-------------+------------------------------ Adj R-squared = 0.6610<br />
Total | 5.9970e+12 1499 4.0007e+09 Root MSE = 36826<br />
------------------------------------------------------------------------------<br />
sprice | Coef. Std. Err. t P>|t| [95% Conf. Interval]<br />
-------------+----------------------------------------------------------------<br />
livarea2 | 212.611 3.931742 54.08 0.000 204.8987 220.3233<br />
_cons | 57728.31 1546.67 37.32 0.000 54694.44 60762.18<br />
------------------------------------------------------------------------------<br />
The estimated <strong>relationship</strong> is once again positive, with an increase of 1 unit in <strong>the</strong> square<br />
living area variable leading to a rise of $213 in price. In order to interpret this more meaningfully, we<br />
must examine <strong>the</strong> marginal effect of living area on price, which is not constant in <strong>the</strong> nonlinear<br />
function:<br />
∂SPRICE<br />
= 2 α2LIVAREA,<br />
∂LIVAREA<br />
where α2 is <strong>the</strong> coefficient on living area squared. Thus, for a <strong>house</strong> of 1,500 square feet of living<br />
area (LIVAREA = 15), <strong>the</strong> estimated marginal effect is 2 × 212.6 × 15 = $6,378. This would be <strong>the</strong><br />
estimated effect on expected selling price of an increase of 100 square feet for a <strong>house</strong> of 1,500<br />
square feet. This is a considerably smaller estimated effect of living area than <strong>the</strong> $9,181 that we<br />
obtained in <strong>the</strong> linear specification.<br />
3
(d) The graph below shows <strong>the</strong> scatter plot (blue dots) with <strong>the</strong> linear (red dots) and<br />
quadratic (green dots) fitted <strong>value</strong>s:<br />
0 200000 400000 600000 800000<br />
10 20 30 40 50<br />
living area, hundreds of square feet<br />
selling price of home, dollars Linear fitted <strong>value</strong>s<br />
Quadratic fitted <strong>value</strong>s<br />
It appears that <strong>the</strong> quadratic function form fits <strong>the</strong> data slightly better at both <strong>the</strong> upper and<br />
lower extremes of <strong>the</strong> sample. Although extrapolation outside <strong>the</strong> sample is always risky, it is also<br />
worth noting that <strong>the</strong> quadratic model predicts a positive <strong>value</strong> ($57,728) for a lot with a <strong>house</strong> of<br />
zero area, which is more plausible than <strong>the</strong> negative prediction of <strong>the</strong> linear model.<br />
The graph also shows that <strong>the</strong> estimated quadratic function (green) is flatter than <strong>the</strong><br />
estimated linear function (red) for a 1,500 square foot <strong>house</strong>, as demonstrated by <strong>the</strong> smaller<br />
estimated marginal effect at that size calculated in part (c).<br />
Because <strong>the</strong> dependent variable is <strong>the</strong> same in both models, we can compare <strong>the</strong> sum of<br />
squared residuals to provide fur<strong>the</strong>r evidence about which model fits <strong>the</strong> data better. The SSE for <strong>the</strong><br />
linear model is 2.2270 × 10 12 whereas <strong>the</strong> SSE for <strong>the</strong> quadratic model is 2.0315 × 10 12 . This evidence<br />
supports <strong>the</strong> quadratic model as it has about 10% small sum of squared residuals than <strong>the</strong> linear<br />
model.<br />
4
(e) To examine whe<strong>the</strong>r lot size affects <strong>the</strong> <strong>relationship</strong> <strong>between</strong> living space and selling<br />
price, we estimate separate quadratic regressions for <strong>house</strong>s on large lots and those on small lots.<br />
The large-lot regression is<br />
. reg sprice livarea2 if lgelot==1<br />
Source | SS df MS Number of obs = 95<br />
-------------+------------------------------ F( 1, 93) = 175.70<br />
Model | 9.9495e+11 1 9.9495e+11 Prob > F = 0.0000<br />
Residual | 5.2663e+11 93 5.6627e+09 R-squared = 0.6539<br />
-------------+------------------------------ Adj R-squared = 0.6502<br />
Total | 1.5216e+12 94 1.6187e+10 Root MSE = 75251<br />
------------------------------------------------------------------------------<br />
sprice | Coef. Std. Err. t P>|t| [95% Conf. Interval]<br />
-------------+----------------------------------------------------------------<br />
livarea2 | 193.8298 14.62285 13.26 0.000 164.7917 222.8679<br />
_cons | 113279.4 12824.64 8.83 0.000 87812.16 138746.6<br />
------------------------------------------------------------------------------<br />
For smaller lots, <strong>the</strong> regression is<br />
. reg sprice livarea2 if lgelot==0<br />
Source | SS df MS Number of obs = 1405<br />
-------------+------------------------------ F( 1, 1403) = 1749.57<br />
Model | 1.5997e+12 1 1.5997e+12 Prob > F = 0.0000<br />
Residual | 1.2828e+12 1403 914323077 R-squared = 0.5550<br />
-------------+------------------------------ Adj R-squared = 0.5546<br />
Total | 2.8825e+12 1404 2.0530e+09 Root MSE = 30238<br />
------------------------------------------------------------------------------<br />
sprice | Coef. Std. Err. t P>|t| [95% Conf. Interval]<br />
-------------+----------------------------------------------------------------<br />
livarea2 | 186.8586 4.467319 41.83 0.000 178.0952 195.6219<br />
_cons | 62172.41 1503.058 41.36 0.000 59223.92 65120.89<br />
------------------------------------------------------------------------------<br />
Before proceeding to compare <strong>the</strong> results, we note that only 95 of <strong>the</strong> 1,500 <strong>house</strong>s in <strong>the</strong><br />
sample are on large lots, thus we must interpret <strong>the</strong> results for this subsample with some caution.<br />
Based on our sample, additional living area appears to have a larger price effect if <strong>the</strong> <strong>house</strong> is on a<br />
large lot than if it is on a small lot. (This is consistent with my intuition because big <strong>house</strong>s fit better<br />
on larger lots.)<br />
The estimated coefficient on living area squared is smaller in both subsamples than it is in <strong>the</strong><br />
full sample. When controlling crudely for lot size, <strong>house</strong> size seems to matter less. This suggests that<br />
when we do not control for lot size, <strong>the</strong> <strong>house</strong> size variable might be picking up some of <strong>the</strong> effect<br />
that is actually due to lot size. In o<strong>the</strong>r words, some of <strong>the</strong> large <strong>house</strong>s may be expensive not only<br />
because <strong>the</strong> <strong>house</strong>s are large, but because <strong>the</strong> lots are large. This omitted-variable bias would be<br />
present if large <strong>house</strong>s tend to be on large lots (and lot size matters for selling price). The result<br />
reported below verifies that <strong>the</strong> average living area on large lots is 2,463 square feet compared to<br />
5
1,621 square feet on smaller lots, supporting our result that failure to correct for lot size leads to an<br />
overestimation of <strong>the</strong> effect of <strong>house</strong> size.<br />
. by lgelot: summarize livarea<br />
--------------------------------------------------------------------------------------<br />
-<br />
-> lgelot = 0<br />
Variable | Obs Mean Std. Dev. Min Max<br />
-------------+--------------------------------------------------------<br />
livarea | 1405 16.21352 4.585679 7 49<br />
--------------------------------------------------------------------------------------<br />
-<br />
-> lgelot = 1<br />
Variable | Obs Mean Std. Dev. Min Max<br />
-------------+--------------------------------------------------------<br />
livarea | 95 24.63158 9.724998 8 48<br />
A logical way to compare <strong>the</strong> marginal effects of living space in <strong>the</strong> two subsamples is to<br />
evaluate each at <strong>the</strong> subsample mean. For large lots, <strong>the</strong> mean of LIVAREA is 24.63 and <strong>the</strong><br />
coefficient on LIVAREA 2 is 193.8, so <strong>the</strong> marginal effect evaluated at <strong>the</strong> mean is 2 × 193.8 × 24.63 =<br />
$9,549. For smaller lots, <strong>the</strong> corresponding calculation is 2 × 186.9 × 16.21 = $6,059. Thus, an<br />
additional 100 square foot room is worth much more if added to a <strong>house</strong> on a large lot than to one<br />
on a smaller lot.<br />
O<strong>the</strong>r determinants of <strong>house</strong> selling price (parts f and g)<br />
(f) The age of a <strong>house</strong> may also influence its selling price. The regression below shows that<br />
<strong>the</strong> linear <strong>relationship</strong> <strong>between</strong> selling price and age is negative: a <strong>house</strong> that is one year older is<br />
expected to sell for $627 less. The intercept of 137,404 could be interpreted as <strong>the</strong> expected selling<br />
price of a new <strong>house</strong> (AGE = 0). There are some <strong>house</strong>s of age zero in <strong>the</strong> sample, so this is not an<br />
out-of-sample extrapolation.<br />
. reg sprice age<br />
Source | SS df MS Number of obs = 1500<br />
-------------+------------------------------ F( 1, 1498) = 25.77<br />
Model | 1.0141e+11 1 1.0141e+11 Prob > F = 0.0000<br />
Residual | 5.8956e+12 1498 3.9357e+09 R-squared = 0.0169<br />
-------------+------------------------------ Adj R-squared = 0.0163<br />
Total | 5.9970e+12 1499 4.0007e+09 Root MSE = 62735<br />
------------------------------------------------------------------------------<br />
sprice | Coef. Std. Err. t P>|t| [95% Conf. Interval]<br />
-------------+----------------------------------------------------------------<br />
age | -627.161 123.5524 -5.08 0.000 -869.515 -384.8069<br />
_cons | 137403.6 3149.347 43.63 0.000 131226 143581.2<br />
------------------------------------------------------------------------------<br />
6
An alternative functional form for <strong>the</strong> <strong>relationship</strong> would be to regress <strong>the</strong> log of selling price<br />
on age. This is done in <strong>the</strong> table below.<br />
. g lnsprice = ln(sprice)<br />
. reg lnsprice age<br />
Source | SS df MS Number of obs = 1500<br />
-------------+------------------------------ F( 1, 1498) = 41.45<br />
Model | 5.84157999 1 5.84157999 Prob > F = 0.0000<br />
Residual | 211.122211 1498 .140936055 R-squared = 0.0269<br />
-------------+------------------------------ Adj R-squared = 0.0263<br />
Total | 216.963791 1499 .14473902 Root MSE = .37541<br />
------------------------------------------------------------------------------<br />
lnsprice | Coef. Std. Err. t P>|t| [95% Conf. Interval]<br />
-------------+----------------------------------------------------------------<br />
age | -.00476 .0007394 -6.44 0.000 -.0062103 -.0033097<br />
_cons | 11.74597 .0188462 623.26 0.000 11.70901 11.78294<br />
------------------------------------------------------------------------------<br />
Again, <strong>the</strong> <strong>relationship</strong> <strong>between</strong> selling price and age is negative. The estimated coefficient of<br />
–0.00476 can be interpreted as reflecting a 0.476% reduction in selling price for each additional year<br />
of age.<br />
The first scatter plot below shows <strong>the</strong> <strong>relationship</strong> <strong>between</strong> selling price and age. It is a large<br />
cluster of points without an obvious linear <strong>relationship</strong> and with numerous outliers. Moreover, all of<br />
<strong>the</strong> outliers are above <strong>the</strong> cluster. The second plot shows <strong>the</strong> <strong>relationship</strong> <strong>between</strong> log price and age,<br />
which seems slightly more linear and where <strong>the</strong> outliers occur on both sides. Based on visual fit, I’d<br />
prefer <strong>the</strong> log model.<br />
7
selling price of home, dollars<br />
0 200000 400000 600000 800000<br />
lnsprice<br />
10 11 12 13 14<br />
0 20 40 60 80 100<br />
age of home at time of sale, years<br />
0 20 40 60 80 100<br />
age of home at time of sale, years<br />
8
(g) Finally, we estimate <strong>the</strong> <strong>relationship</strong> <strong>between</strong> price and <strong>the</strong> dummy variable indicating lot<br />
size. We established above that controlling for lot size by splitting <strong>the</strong> sample had a large effect on<br />
<strong>the</strong> estimated coefficient for living area, which suggests that lot size may be an important<br />
determinant of selling price. Because of <strong>the</strong> binary nature of <strong>the</strong> lot size variable, we are restricted to<br />
a ra<strong>the</strong>r crude way of characterizing <strong>the</strong> <strong>relationship</strong> <strong>between</strong> lot size and selling price, but our<br />
model should indicate <strong>the</strong> direction effectively. The results, shown in <strong>the</strong> table below, demonstrate<br />
<strong>the</strong> expected <strong>relationship</strong>. Lots larger than ½ acre are expected to sell for $133,797 more than those<br />
on smaller lots. The estimated intercept term of $115,220 is <strong>the</strong> expected selling price of a <strong>house</strong> on a<br />
small lot, where LGELOT = 0.<br />
. reg sprice lgelot<br />
Source | SS df MS Number of obs = 1500<br />
-------------+------------------------------ F( 1, 1498) = 541.83<br />
Model | 1.5930e+12 1 1.5930e+12 Prob > F = 0.0000<br />
Residual | 4.4041e+12 1498 2.9400e+09 R-squared = 0.2656<br />
-------------+------------------------------ Adj R-squared = 0.2651<br />
Total | 5.9970e+12 1499 4.0007e+09 Root MSE = 54221<br />
------------------------------------------------------------------------------<br />
sprice | Coef. Std. Err. t P>|t| [95% Conf. Interval]<br />
-------------+----------------------------------------------------------------<br />
lgelot | 133797.3 5747.992 23.28 0.000 122522.4 145072.3<br />
_cons | 115220 1446.546 79.65 0.000 112382.5 118057.5<br />
------------------------------------------------------------------------------<br />
Conclusions and validity assessment<br />
The sample of 1500 <strong>house</strong>s in Stockton yields estimates of <strong>the</strong> effects of living area, lot size,<br />
and age of home that confirm intuition. Larger and newer <strong>house</strong>s and larger lots seem to be<br />
associated with higher selling prices.<br />
The assumptions of <strong>the</strong> least-squares model seem reasonable for this application, with some<br />
qualifications:<br />
• Autocorrelation <strong>between</strong> <strong>the</strong> error terms of nearby <strong>house</strong>s could be a problem: <strong>the</strong>re<br />
may be unobserved neighborhood characteristics that would affect all <strong>house</strong>s in an area in a<br />
similar way. Correcting for this, if possible, might give more efficient estimators, though <strong>the</strong><br />
OLS coefficient estimators are still unbiased.<br />
• Reverse causality does not seem to be a worry here. The characteristics of <strong>the</strong> <strong>house</strong><br />
that we have used on <strong>the</strong> right-hand side are determined before <strong>the</strong> sale, so it is unlikely that<br />
random variation in <strong>the</strong> selling price would have any influence on <strong>the</strong>m.<br />
• Homoskedasticity and normality. It is more problematic to assume that all <strong>house</strong>s<br />
in <strong>the</strong> sample have equal error variance. Big <strong>house</strong>s that are expected to sell for $500,000<br />
would logically have a larger error variance than smaller <strong>house</strong>s with expected price of<br />
$150,000. These considerations of <strong>the</strong> distribution of <strong>the</strong> error term point toward using <strong>the</strong><br />
9
log of selling price as <strong>the</strong> dependent variable because I think it is more likely that percentage<br />
deviations from expected selling price are symmetrically distributed with constant variance<br />
than <strong>the</strong> dollar deviations. This means that <strong>the</strong> assumptions of homoskedasticity and<br />
normality are more plausible when using log(price) than when using price. Failure to<br />
account properly for heteroskedasticity leads to inefficient, but still unbiased, coefficient<br />
estimators.<br />
• Omitted variables. Because we have identified several characteristics that seem to be<br />
associated with selling price, it would be useful to include all of <strong>the</strong>m in <strong>the</strong> same regression<br />
equation using multiple regression. This would mitigate possible issues of omitted-variables<br />
bias such as <strong>the</strong> one we identified when estimating <strong>the</strong> effects of living area separately for<br />
large and small lots. Such omitted-variable bias manifests itself as correlation <strong>between</strong> <strong>the</strong><br />
regressor and <strong>the</strong> error term that includes <strong>the</strong> effect of <strong>the</strong> omitted variable.<br />
• Functional form. The fact that <strong>the</strong> quadratic (for living area) and logarithmic (for<br />
age) functions fit better than linear models suggests that some additional exploration of<br />
nonlinear forms might be appropriate.<br />
With respect to external validity, we have no information on how <strong>the</strong> sample was drawn, so<br />
it is difficult to assess whe<strong>the</strong>r <strong>the</strong> sample accurately represents real estate in Stockton, California.<br />
The sample is now more than a decade old, so any applications to <strong>the</strong> modern housing market<br />
would need to be updated for inflation. Moreover, it is possible that <strong>the</strong> <strong>value</strong> attached to specific<br />
<strong>house</strong> characteristics may be different now than in 1996–98.<br />
It is difficult to know how <strong>the</strong> effects of home characteristics on prices in Stockton might<br />
differ from those in o<strong>the</strong>r cities. One would expect some differences in effects across cities associated<br />
with variations in demographics, topographical features, and population density, so it would be<br />
unwise to apply specific results from this study to o<strong>the</strong>r urban areas.<br />
10