

Determination of Mixing and Compaction Temperatures ... - ijcebm
Determination of Mixing and Compaction Temperatures ... - ijcebm
Determination of Mixing and Compaction Temperatures ... - ijcebm

You also want an ePaper? Increase the reach of your titles
YUMPU automatically turns print PDFs into web optimized ePapers that Google loves.
<strong>Mixing</strong>/<strong>Compaction</strong> temp. o C<br />
250<br />
240<br />
230<br />
220<br />
210<br />
200<br />
190<br />
180<br />
170<br />
160<br />
150<br />
International Journal <strong>of</strong> Civil Engineering <strong>and</strong> Building Materials (ISSN 2223-487X) Vol. 2 No.4 2012<br />
© 2012 International Science <strong>and</strong> Engineering Research Center<br />
Hydrated lime mix.temp<br />
Lime mix.temp<br />
Cement mix.temp<br />
Hydrated lime comp.temp<br />
lime comp.temp<br />
Portl<strong>and</strong> cement comp.temp<br />
Hydrated lime mixing temp.polyline<br />
Hydrated lime com.temp. polyline<br />
Portl<strong>and</strong> cement mix.temp. polyline<br />
Portl<strong>and</strong> cement comp.temp. polyline<br />
Limestone mix.temp. polyline<br />
Limestone comp.temp polyline<br />
140<br />
0 0.3 0.6 0.9 1.2 1.5<br />
Dust to binder ratio<br />
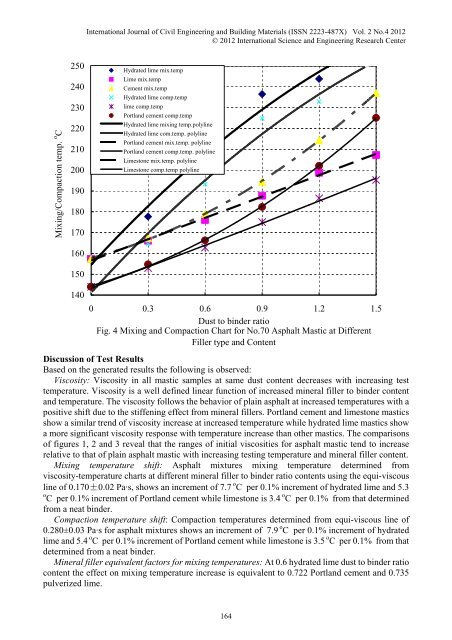
Fig. 4 <strong>Mixing</strong> <strong>and</strong> <strong>Compaction</strong> Chart for No.70 Asphalt Mastic at Different<br />
Filler type <strong>and</strong> Content<br />
Discussion <strong>of</strong> Test Results<br />
Based on the generated results the following is observed:<br />
Viscosity: Viscosity in all mastic samples at same dust content decreases with increasing test<br />
temperature. Viscosity is a well defined linear function <strong>of</strong> increased mineral filler to binder content<br />
<strong>and</strong> temperature. The viscosity follows the behavior <strong>of</strong> plain asphalt at increased temperatures with a<br />
positive shift due to the stiffening effect from mineral fillers. Portl<strong>and</strong> cement <strong>and</strong> limestone mastics<br />
show a similar trend <strong>of</strong> viscosity increase at increased temperature while hydrated lime mastics show<br />
a more significant viscosity response with temperature increase than other mastics. The comparisons<br />
<strong>of</strong> figures 1, 2 <strong>and</strong> 3 reveal that the ranges <strong>of</strong> initial viscosities for asphalt mastic tend to increase<br />
relative to that <strong>of</strong> plain asphalt mastic with increasing testing temperature <strong>and</strong> mineral filler content.<br />
<strong>Mixing</strong> temperature shift: Asphalt mixtures mixing temperature determined from<br />
viscosity-temperature charts at different mineral filler to binder ratio contents using the equi-viscous<br />
line <strong>of</strong> 0.170±0.02 Pa·s, shows an increment <strong>of</strong> 7.7 o C per 0.1% increment <strong>of</strong> hydrated lime <strong>and</strong> 5.3<br />
o o<br />
C per 0.1% increment <strong>of</strong> Portl<strong>and</strong> cement while limestone is 3.4 C per 0.1% from that determined<br />
from a neat binder.<br />
<strong>Compaction</strong> temperature shift: <strong>Compaction</strong> temperatures determined from equi-viscous line <strong>of</strong><br />
0.280±0.03 Pa·s for asphalt mixtures shows an increment <strong>of</strong> 7.9 o C per 0.1% increment <strong>of</strong> hydrated<br />
lime <strong>and</strong> 5.4 o C per 0.1% increment <strong>of</strong> Portl<strong>and</strong> cement while limestone is 3.5 o C per 0.1% from that<br />
determined from a neat binder.<br />
Mineral filler equivalent factors for mixing temperatures: At 0.6 hydrated lime dust to binder ratio<br />
content the effect on mixing temperature increase is equivalent to 0.722 Portl<strong>and</strong> cement <strong>and</strong> 0.735<br />
pulverized lime.<br />
164