

Sonar4 and Sonar5-Pro
Sonar4 and Sonar5-Pro
Sonar4 and Sonar5-Pro

Create successful ePaper yourself
Turn your PDF publications into a flip-book with our unique Google optimized e-Paper software.
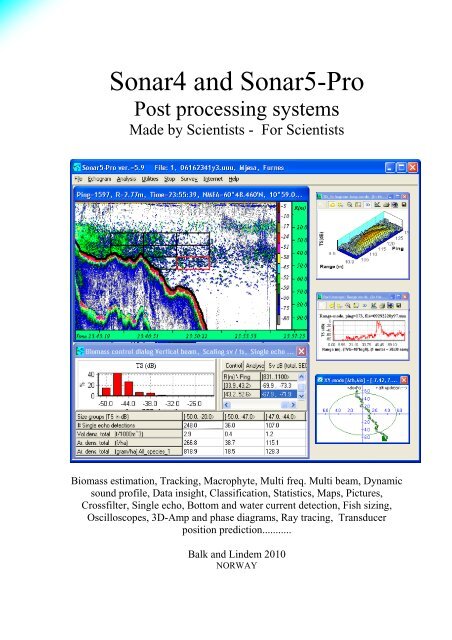
<strong>Sonar4</strong> <strong>and</strong> <strong>Sonar5</strong>-<strong>Pro</strong><br />
Post processing systems<br />
Made by Scientists - For Scientists<br />
Biomass estimation, Tracking, Macrophyte, Multi freq. Multi beam, Dynamic<br />
sound profile, Data insight, Classification, Statistics, Maps, Pictures,<br />
Crossfilter, Single echo, Bottom <strong>and</strong> water current detection, Fish sizing,<br />
Oscilloscopes, 3D-Amp <strong>and</strong> phase diagrams, Ray tracing, Transducer<br />
position prediction...........<br />
Balk <strong>and</strong> Lindem 2010<br />
NORWAY
SonarX. Default setup for biomass estimation as described in chapter 8.<br />
SonarX. Horizontal approach. Simple tracking setup with additional windows added from<br />
the Analysis->1-Setup menu (chapter 4 <strong>and</strong> 12). The track's exact positions relative to the<br />
bottom profile <strong>and</strong> the river surface is seen in the lower left position diagram. The position<br />
diagram in the lower center part display the sound beam as seen from a bird's view. Red<br />
lines indicate the direction <strong>and</strong> strength of the water current. The chart to the right can<br />
display all the tracks features as a function of time. At the moment the echo intensity is<br />
displayed. Stable TS values are seen within the -3 dB beam while erroneous off-axis<br />
compensation is observed outside the beam.
Sonar 5-<strong>Pro</strong> Setup for auto tracking as described in chapter 12. Here Echogram window<br />
in SED-display mode with Event lines, Tracker, Classification window, one position<br />
diagram <strong>and</strong> the advanced parameter dialog's description page.<br />
Sonar 5-<strong>Pro</strong>. Study echoes in a layer with oscilloscopes (chapter 16) <strong>and</strong> the 3Dechograms<br />
(chapter 17)
Fish tracking in data from a horizontally aligned transducer in a river. The Amp echogram<br />
threshold has been set to presents the entire echo intensity in order to see background<br />
reverberation. In noisy environment the background reverberation gives important<br />
information for the interpretation of tracks. Three position-diagrams have been opened to<br />
study the tracks true position in the river relative to the bottom profile, relative to the<br />
water current <strong>and</strong> relative to the cross section of the beam. It is clearly seen that the track<br />
moves against the water current. The track info dialog in the lower right corner is set up to<br />
present the individual echo positions. The advanced parameter dialog opened at the<br />
description page is placed in the upper right corner to present pictures <strong>and</strong> text notes from<br />
the survey. Additional comments <strong>and</strong> notes can be added here during the analysis. The<br />
example file can be found in the folder: Balk_Lindem\Sonar demo files\Rivers\Tana of the<br />
installation CD.
<strong>Sonar5</strong> set up to work with a 6 frequency recording of herring <strong>and</strong> mackerel. The<br />
Frequency response function indicates that the analyzed school is mackerel. Each<br />
echogram can be operated individually or linked to the other echograms so that zooming in<br />
one echogram zoom the other as well. One echogram can be filtered <strong>and</strong> subtracted from<br />
another with another frequency <strong>and</strong> echograms can be applied as thresholds to other<br />
echograms. Classification maps <strong>and</strong> RGB-echograms are available as well.
Acknowledgement<br />
SonarX would not have been what it is today had it not been for the help from many<br />
different persons contributing with suggestions for new methods <strong>and</strong> improvements of<br />
existing tools, for help with testing <strong>and</strong> for providing test data.<br />
First of all we want to thank dr. Jan Kubecka <strong>and</strong> his team <strong>and</strong> students at the<br />
Hydrobiological Institute, Academy of science of the Czech Republic, Ceske Budejovice.<br />
Without Dr. Kubecka <strong>and</strong> his team SonarX would never have have been what it is today.<br />
Simrad AS with their staff has been of great help with theoretical <strong>and</strong> practical support. In<br />
particular, we will like to thank Frank R. Knudsen, Haakon Solli <strong>and</strong> Helge Bodholt for<br />
their assistance.<br />
BioSonics, Sound Metrics Corp, MacArtneyAS, <strong>and</strong> HTI have been very helpful with the<br />
development answering questions <strong>and</strong> providing background documentations for theire<br />
echosounders <strong>and</strong> data formats.<br />
An important milestone in the development was the inclusion of the Software Guided<br />
Analysis (SGA). This work was higly supported by dr. Lars Rudstam <strong>and</strong> the Study Group<br />
on Fisheries Acoustics in the Great Lakes.<br />
Other people who have contributed significantly are Marc Schmidt from<br />
L<strong>and</strong>esfischereiverb<strong>and</strong> Westfalen und Lippe e.V. (Ge), Georg Rakowitz from the<br />
University of Vienna (Au), Karl Øystein Gjell<strong>and</strong> at the institute of aquatic biology at the<br />
university in Tromsø Norway, Jan Kemper from the Organization for the Improvement of<br />
Inl<strong>and</strong> Fisheries in Netherl<strong>and</strong>.<br />
Test data have been of great importance. We have recorded data <strong>and</strong> performed<br />
experiments in the field for years. Data from other scientists have, however, played an<br />
important role in the development. Some of these data are available on the SonarX CD. We<br />
will thank every one that has contributed. Especially we want to thank Jean Guillard <strong>and</strong><br />
Nathalie Gaudreau (Ca), Dan Yule (US), Atso Romakkianemi (Fi), Juha Jurvelius (Fi), Pia<br />
Romare (Se)<br />
Experiments in the field
What SonarX can do<br />
<strong>Sonar5</strong> has all the option. For <strong>Sonar4</strong>, tools related to st<strong>and</strong>ard biomass estimation <strong>and</strong><br />
simple tracking are available.<br />
Pre-analysis<br />
• Single echo detection<br />
• Bottom detection. (Enhanced with image analysis)<br />
• Max range detection<br />
• Dynamic sound speed <strong>and</strong> alpha correction<br />
• Passive noise subtraction<br />
• Heave correction<br />
• Manual noise erasing tools<br />
• Automatic noise reduction systems, unwanted target removal<br />
• Water current detection<br />
Analysis<br />
• Biomasse estimation<br />
• Tracking <strong>and</strong> tracing<br />
• Macrophyte<br />
• Track statistics<br />
• Image analysis<br />
• Multi frequency analysis<br />
• Synchronized echograms with DIDON movies<br />
• Export of bathymetric data<br />
Data insight<br />
• 3D-echogram<br />
• Oscilloscope<br />
• DIDSON movie player<br />
• Frequency response function, classification maps <strong>and</strong> RGB echograms<br />
• TS range distribution, Size distribution,<br />
• Integrams<br />
• SED detections versus off axis angle<br />
Interpretation<br />
• Fish database<br />
• Catch data<br />
• TS to weight <strong>and</strong> length calculator<br />
• Track aspect TS correction<br />
• De convolution for estimation of size when aspect is unknown<br />
• Ray tracing for estimation of targets <strong>and</strong> beam in hor. app.
Presentation<br />
• Transect maps<br />
• Tracked echoes in all aspects<br />
• Tracks relative to surface <strong>and</strong> bottom profile (horizontal app.)<br />
• Tracks relative to water current (horizontal app.)<br />
• Photos, drawings <strong>and</strong> maps<br />
• Free threshold.<br />
• Free color per dB scale<br />
• Time, ping number, <strong>and</strong> range<br />
• Geographical positions <strong>and</strong> sailed ship distance.<br />
• Zoom in <strong>and</strong> out<br />
• Layers: Pelagic, Bottom, Free number of sub layers <strong>and</strong> sub segments<br />
Noise<br />
• Manual <strong>and</strong> automatic noise removal systems<br />
• Noise filtering<br />
• Target noise separator.<br />
• Track filtering<br />
• Passive noise subtraction<br />
Editors<br />
• Noise editor<br />
• Bottom editor<br />
• Text editors (txt, rtf)<br />
• Bottom profile editor<br />
• Water current editor<br />
• Graphical transducer positioning tools<br />
• Event notes editor <strong>and</strong> browser<br />
File overview <strong>and</strong> file opening<br />
• Simple file open dialog presenting only filenames<br />
• Advanced file open menu presenting filenames with record number, survey<br />
description, transect description, additional text description <strong>and</strong> photos.<br />
• Graphical presentation of transects in digital maps.<br />
• Opening of echograms at positions selected graphically from maps<br />
• Quick file change functions.