Raman Spectroscopy - Art Application Note - Horiba
Raman Spectroscopy - Art Application Note - Horiba
Raman Spectroscopy - Art Application Note - Horiba

Create successful ePaper yourself
Turn your PDF publications into a flip-book with our unique Google optimized e-Paper software.
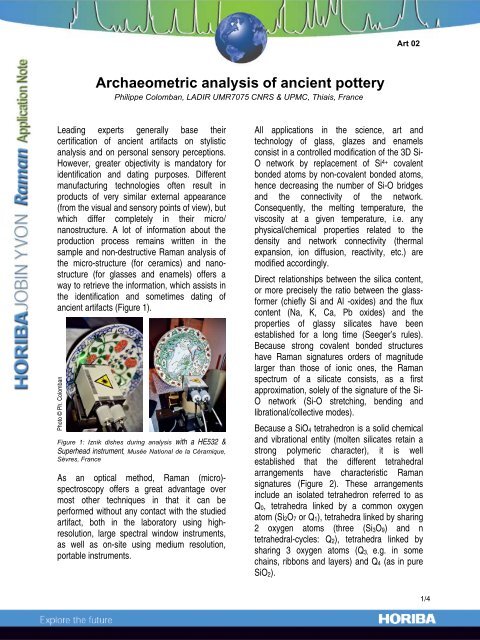
Archaeometric analysis of ancient pottery<br />
Leading experts generally base their<br />
certification of ancient artifacts on stylistic<br />
analysis and on personal sensory perceptions.<br />
However, greater objectivity is mandatory for<br />
identification and dating purposes. Different<br />
manufacturing technologies often result in<br />
products of very similar external appearance<br />
(from the visual and sensory points of view), but<br />
which differ completely in their micro/<br />
nanostructure. A lot of information about the<br />
production process remains written in the<br />
sample and non-destructive <strong>Raman</strong> analysis of<br />
the micro-structure (for ceramics) and nanostructure<br />
(for glasses and enamels) offers a<br />
way to retrieve the information, which assists in<br />
the identification and sometimes dating of<br />
ancient artifacts (Figure 1).<br />
Photo © Ph. Colomban<br />
Philippe Colomban, LADIR UMR7075 CNRS & UPMC, Thiais, France<br />
Figure 1: Iznik dishes during analysis with a HE532 &<br />
Superhead instrument, Musée National de la Céramique,<br />
Sèvres, France<br />
As an optical method, <strong>Raman</strong> (micro)spectroscopy<br />
offers a great advantage over<br />
most other techniques in that it can be<br />
performed without any contact with the studied<br />
artifact, both in the laboratory using highresolution,<br />
large spectral window instruments,<br />
as well as on-site using medium resolution,<br />
portable instruments.<br />
<strong>Art</strong> 02<br />
All applications in the science, art and<br />
technology of glass, glazes and enamels<br />
consist in a controlled modification of the 3D Si-<br />
O network by replacement of Si4+ covalent<br />
bonded atoms by non-covalent bonded atoms,<br />
hence decreasing the number of Si-O bridges<br />
and the connectivity of the network.<br />
Consequently, the melting temperature, the<br />
viscosity at a given temperature, i.e. any<br />
physical/chemical properties related to the<br />
density and network connectivity (thermal<br />
expansion, ion diffusion, reactivity, etc.) are<br />
modified accordingly.<br />
Direct relationships between the silica content,<br />
or more precisely the ratio between the glassformer<br />
(chiefly Si and Al -oxides) and the flux<br />
content (Na, K, Ca, Pb oxides) and the<br />
properties of glassy silicates have been<br />
established for a long time (Seeger’s rules).<br />
Because strong covalent bonded structures<br />
have <strong>Raman</strong> signatures orders of magnitude<br />
larger than those of ionic ones, the <strong>Raman</strong><br />
spectrum of a silicate consists, as a first<br />
approximation, solely of the signature of the Si-<br />
O network (Si-O stretching, bending and<br />
librational/collective modes).<br />
Because a SiO4 tetrahedron is a solid chemical<br />
and vibrational entity (molten silicates retain a<br />
strong polymeric character), it is well<br />
established that the different tetrahedral<br />
arrangements have characteristic <strong>Raman</strong><br />
signatures (Figure 2). These arrangements<br />
include an isolated tetrahedron referred to as<br />
Q0, tetrahedra linked by a common oxygen<br />
atom (Si2O7 or Q1), tetrahedra linked by sharing<br />
2 oxygen atoms (three (Si3O9) and n<br />
tetrahedral-cycles: Q2), tetrahedra linked by<br />
sharing 3 oxygen atoms (Q3, e.g. in some<br />
chains, ribbons and layers) and Q4 (as in pure<br />
SiO2).<br />
1/4
<strong>Raman</strong> Intensity<br />
165<br />
255<br />
300<br />
450<br />
540<br />
410<br />
305<br />
480<br />
600<br />
485<br />
590<br />
800<br />
lapis lazuli<br />
mullite, disthene, carbon<br />
795<br />
800<br />
1090<br />
965<br />
1130<br />
1045<br />
1340<br />
1350<br />
glaze<br />
1595<br />
1600<br />
400 800 1200 1600<br />
Wavenumber / cm -1<br />
Figure 2: Representative <strong>Raman</strong> spectra recorded at the<br />
laboratory on the glaze-body interface fracture of a<br />
Böttger ewer stopper from ~1725 (MNC 7152); note the<br />
lapis lazuli signature (Meissen, Saxony)<br />
Six years of experience on various materials<br />
has enabled us to propose a tentative guide to<br />
identify different types of glassy silicates and to<br />
classify them as a function of their composition<br />
[1-7] using two main tools:<br />
i) the spectral decomposition of the Si-O<br />
stretching peak into its components associated<br />
to the different types of SiO4 tetrahedra of the<br />
silicate polymerized network area and<br />
ii) a new concept, the polymerization index Ip<br />
calculated as the ratio (A500/A1000) of the Si-O<br />
bending (~500 cm-1 ) and stretching (i.e. ~1000<br />
cm-1 ) [3,4]. However, many properties of a<br />
glass depend on its chemical composition,<br />
which is a result of the kind and ratio of the raw<br />
materials used in the batch (mixture of raw<br />
materials).<br />
On-site analysis in Museum-secured areas has<br />
been performed on different productions: Della<br />
Robbia sculptures and pots (Figure 3), Bernard<br />
Palissy rocaille shards excavated from Louvre<br />
site, Medici Firenze [5] and Böttger Meissen<br />
first European porcelains (Figure 4), as well are<br />
Ottoman ceramics. [7-10]<br />
<strong>Art</strong> 02<br />
Photo © Ph. Colomban<br />
Figure 3: Della Robbia pot, Musée National de la<br />
Céramique, Sèvres, France<br />
Photo © Ph. Colomban<br />
Figure 4: Medici Porcelain, Musée National de la<br />
Céramique, Sèvres, France<br />
In order to draw conclusions about artifacts<br />
whose origins are in debate, it is necessary to<br />
study systematically and in a non-destructive<br />
manner artifacts with good pedigree in order to<br />
go further in identification/classification of these<br />
precious items. Using the protocols described in<br />
the previous paragraphs, classification of such<br />
artifacts was performed by plotting the<br />
polymerization index as a function of νmax, the<br />
main Si-O stretching component wavenumber<br />
(Figure 5). Classification in 7 distinct families is<br />
evident: from top to bottom as a function of the<br />
melting/processing temperature (at the top<br />
porcelain and then stoneware glazes, below,<br />
2/4
faience and terra-cotta glazes and glasses, all<br />
types of low temperature processed silicates),<br />
and from left to right as function of the main flux.<br />
Figure 5: Plots of the polymerization index as a function<br />
of the main Si-O stretching component wavenumber<br />
However, Iznik and Kütahya wares and the<br />
history of their production remain a source of<br />
debate among scholars. The exact origin of<br />
“Iznik” products (Iznik, Damascus, Istanbul,<br />
Kütahya or elsewhere) is still an open question.<br />
As for Medici porcelains, wares (and shards)<br />
being very rare, they are not well documented<br />
and some fakes have been made for centuries.<br />
Some of the earlier fritwares are generally<br />
assigned to Iznik productions (blue and white<br />
wares sometimes classified as Touran, Roumi<br />
or Abraham of Kütahya style), but their<br />
production by Kütahya kilns was questioned.<br />
The real development of the production of<br />
Kütahya wares dates back to the end of the 17th century, following the emancipation of<br />
Byzantine and Armenian Christian communities.<br />
Furthermore, copies or fakes were made since<br />
the 19th century in different places.<br />
The same analysis and classification was thus<br />
performed on Iznik and Kütahya wares (Figure<br />
6). Some of the Kütahya glazes can be<br />
associated to family 7 (PbO-rich glass) but<br />
some of them are also located in the Iznik<br />
group (e.g. sample 7460). On the other hand,<br />
Iznik glazes are all located in between family 5<br />
(Na2O + PbO) and family 4 (Na2O-rich silicates)<br />
<strong>Art</strong> 02<br />
except for two types of glazes located in family<br />
7 (PbO-rich) and in family 2 (CaO-rich).<br />
The <strong>Raman</strong> signature of the Iznik production<br />
thus appears to be fairly homogeneous. This is<br />
due to the fact that Iznik manufacturers were<br />
controlled by the nakkashane, the Ottoman<br />
office for décor and drawing. By contrast, the<br />
significant variation in the <strong>Raman</strong> signature of<br />
the Kütahya glazes reflects the autonomy of<br />
different production centers working according<br />
to the Kütahya style. Furthermore, the<br />
procedure was also efficient to discriminate<br />
between early and late Iznik production, based<br />
on a small compositional shift of the silicate<br />
glaze at the decline of the production (17th<br />
century) [8].<br />
Figure 6: Bi-plot of the polymerization index (Ip) as a<br />
function of the Si-O stretching wavenumber maximum for<br />
the series of Iznik and Kütahya fritware glazes. Sample<br />
label: Curator' assignment (Iz, Iznik; Ku, Kütahya), color<br />
(b: blue, r : red, …), artifact record number.<br />
The two parameters Ip and νmax, thus appear to<br />
be good tools for classification, and<br />
differentiation between Kütahya and Iznik<br />
Ottoman pottery is relatively straightforward<br />
from the <strong>Raman</strong> fingerprint [7,8].<br />
Analysis of the colorless/white regions of the<br />
samples always reveals the more or less strong<br />
<strong>Raman</strong> signature of α-quartz (Figure 7). By<br />
modifying the focal point of the laser with the<br />
XYZ plate it is possible to confirm that the white<br />
color is obtained by an α-quartz-rich slip<br />
3/4
deposited below the glaze. This quartz layer is<br />
at the origin of the high gloss and very powerful<br />
colored décor. <strong>Note</strong> that the technique of a<br />
white α-quartz slip to mask the red color of the<br />
body was already used for Vietnamese<br />
porcelain and stoneware.<br />
Intensity / arbitr. units<br />
Iznik<br />
515<br />
465<br />
465<br />
545<br />
550<br />
515 650<br />
MNC 8408<br />
615<br />
645<br />
780<br />
785<br />
785<br />
1055<br />
985<br />
1065<br />
1065<br />
990<br />
blue<br />
MNC 15472<br />
blue<br />
blue<br />
white<br />
500 1000 1500<br />
Wavenumber / cm -1<br />
Figure 7: As-recorded spectra for Iznik glazes. <strong>Note</strong> the<br />
very strong quartz fingerprint for white glaze due to the<br />
characteristic quartz slip deposited on the body, below<br />
the glaze layer.<br />
Strongly colored regions give a strong <strong>Raman</strong><br />
signature, nearly free of any background<br />
(Figure 7). The ways to obtain a blue glaze are<br />
rather limited: copper in alkaline silicate<br />
(turquoise), cobalt (blue) and lapis lazuli<br />
(ultramarine blue), whatever the fluxing agent<br />
[7]. The last pigment has a very typical<br />
resonance <strong>Raman</strong> signature when excited with<br />
the 532nm laser. If small amounts of cobalt<br />
(copper) dissolve in the glaze, no specific<br />
<strong>Raman</strong> signature is expected. Saturation leads<br />
to cobalt mixed silicates or to cobalt aluminate.<br />
Cobalt-containing Mn-rich ores (spinels) can<br />
also be used as blue pigments, if the firing is<br />
conducted in a reducing atmosphere. The<br />
observed color excludes the use of lapis lazuli<br />
and Cu. In most blue regions analyzed, we only<br />
observed the <strong>Raman</strong> signature of the glaze,<br />
(All HORIBA Jobin Yvon companies were formerly known as Jobin Yvon)<br />
<strong>Art</strong> 02<br />
which indicates that cobalt is dissolved within<br />
the glaze network.<br />
In conclusion, this work has shown that <strong>Raman</strong><br />
microanalysis is invaluable in assisting in the<br />
characterization of all types of ceramic artifacts.<br />
The information obtained on the composition of<br />
the glaze and pigments can yield important<br />
information on the fabrication and processing of<br />
these ancient artifacts and may even help<br />
putting to rest many controversies about the<br />
provenance of certain pieces.<br />
References:<br />
1. Ph. Colomban, Glasses, Glazes and Ceramics – Recognition<br />
of the Ancient Technology from the <strong>Raman</strong> Spectra, chapter in<br />
<strong>Raman</strong> <strong>Spectroscopy</strong> in Archaeology and <strong>Art</strong> History, Edwards<br />
HGM and Chalmers JM (Eds), Royal Society of Chemistry,<br />
London, 2005, ch13.<br />
2. Ph. Colomban, F. Treppoz, Identification and Differentiation<br />
of Ancient and Modern European Porcelains by <strong>Raman</strong> Macro-<br />
and Microspectroscopy, J. <strong>Raman</strong> Spectr. 32 (2001) 93-102<br />
3. Ph. Colomban, Polymerisation Degree and <strong>Raman</strong><br />
Identification of Ancient Glasses used for Jewellery, Ceramics<br />
Enamels and Mosaics, J. Non-Crystalline Solids 323 [1-3]<br />
(2003) 180-187.<br />
4. Ph. Colomban, O. Paulsen <strong>Raman</strong> Determination of the<br />
Structure and Composition of Glazes, J. Amer. Ceram. Soc. 88<br />
[2] (2005) 390-395.<br />
5. Ph. Colomban Recent Case studies in the <strong>Raman</strong> Analysis<br />
of Ancient Ceramics: Glaze Opacification in Abbasid Pottery,<br />
Medici and 18 th century French Porcelains, Iznik and Kütahya<br />
Ottoman Fritwares and Unexpected Lapis Lazuli Pigment in<br />
Lajvardina Wares, Mater. Res. Soc. Symp. Proc. 2005 vol 852,<br />
P. Vandiver, J. Mass & A. Murray Eds. OO8.4.<br />
6. Ph. Colomban, C. Truong, A Non-destructive <strong>Raman</strong> Study<br />
of the Glazing Technique in Lustre Potteries and Faiences (9 th -<br />
14 th centuries) : Silver ions, Nanoclusters, Microstructure and<br />
Processing, J. <strong>Raman</strong> Spectrosc. 35 [3] (2004) 195-207.<br />
7. Ph. Colomban, V. Milande, L. Le Bihan, On-site <strong>Raman</strong><br />
Analysis of Iznik pottery glazes and pigments, J. <strong>Raman</strong><br />
Spectrosc. 35 (2004) 527-535.<br />
8. Ph. Colomban, R. de Laveaucoupet, V. Milande, On Site<br />
<strong>Raman</strong> Analysis of Kütahya fritwares, J. <strong>Raman</strong> <strong>Spectroscopy</strong><br />
36 [9] (2005) 857-863.<br />
9. Ph. Colomban, V. Milande, On Site Analysis of the earliest<br />
known Meissen Porcelain and Stoneware, J. <strong>Raman</strong> Spectrosc.<br />
37 (2006).<br />
10. Ph. Colomban, A. Tournie, L. Bellot-Gurlet, <strong>Raman</strong><br />
Identification of glassy silicates used in ceramic, glass and<br />
jewellry : a tentative differentiation guide, J. <strong>Raman</strong> Spectrosc.<br />
37 (2006) 841-852.<br />
France : HORIBA Jobin Yvon S.A.S., 231 rue de Lille, 59650 Villeneuve d’Ascq. Tel : +33 (0)3 20 59 18 00,<br />
Fax : +33 (0)3 20 59 18 08. Email : raman@jobinyvon.fr www.jobinyvon.fr<br />
USA : HORIBA Jobin Yvon Inc., 3880 Park Avenue, Edison, NJ 08820-3012. Tel : +1-732-494-8660,<br />
Fax : +1-732-549-2571. Email : raman@jobinyvon.com www.jobinyvon.com<br />
Japan : HORIBA Ltd., JY Optical Sales Dept., 1-7-8 Higashi-kanda, Chiyoda-ku, Tokyo 101-0031.<br />
Tel: +81 (0)3 3861 8231, Fax: +81 (0)3 3861 8259. Email: raman@horiba.com<br />
Germany: +49 (0) 6251 84 75-0<br />
China: +86 (0) 10 6849 2216<br />
Italy: +39 02 57603050 UK: +44 (0)20 8204 8142 4/4