Analyzing Tone Quality Using a Spectrum Analyzer - University of ...
Analyzing Tone Quality Using a Spectrum Analyzer - University of ...
Analyzing Tone Quality Using a Spectrum Analyzer - University of ...

Create successful ePaper yourself
Turn your PDF publications into a flip-book with our unique Google optimized e-Paper software.
<strong>Analyzing</strong> <strong>Tone</strong> <strong>Quality</strong><br />
<strong>Using</strong> a <strong>Spectrum</strong> <strong>Analyzer</strong><br />
UIUC Physics 193 POM<br />
Pr<strong>of</strong>. Steven Errede<br />
December 17, 2010<br />
By:<br />
Andrew Alsterda
Introduction<br />
The purpose <strong>of</strong> this experiment is to investigate how the different properties<br />
<strong>of</strong> a tone determine the quality (aesthetic appeal) <strong>of</strong> its sound. After analyzing two<br />
different tones using a spectrum analyzer, the results will be compared to explain<br />
why a tone sounds the way it does.<br />
The characteristics <strong>of</strong> a sound that determine its tone are loudness, pitch, and<br />
quality. Loudness is a measure <strong>of</strong> the intensity <strong>of</strong> a sound, which is determined by<br />
the power <strong>of</strong> its source, and the distance the source is from the ear. Pitch is mostly<br />
determined by the frequency <strong>of</strong> a tone, which allows two tones to be compared in<br />
terms <strong>of</strong> low or high. The quality <strong>of</strong> a tone is what distinguishes it from other tones<br />
with the same loudness and pitch. While the intensity <strong>of</strong> a sound does affect its<br />
aesthetic appeal, the focus <strong>of</strong> this experiment will be on quality. Therefore, the<br />
intensity <strong>of</strong> the two samples will be kept relatively constant, which will make the<br />
results more transparent. The pitch <strong>of</strong> the samples will also be kept constant for the<br />
same reason. The samples will be recorded at middle C on the piano, which has a<br />
frequency <strong>of</strong> 256 Hz. This will allow both the low and high frequencies <strong>of</strong> the tones<br />
to be equally represented.<br />
In order to analyze quality most effectively, the quality <strong>of</strong> the two samples<br />
should vary as much as possible. So when choosing tones to sample, it would make<br />
the most sense to compare an aesthetically appealing tone to a tone that is not<br />
appealing. The simplest tone is a sine wave, also known as a pure tone, and has a<br />
single frequency. Sine waves are uninteresting to the ear because they lack<br />
‐2‐
complexity. This is why pure tones are rare in music. On the other hand,<br />
instruments typically produce complex tones. Complex tones are a combination <strong>of</strong><br />
simple tones with varying frequency and amplitude. The number, frequency, and<br />
amplitude <strong>of</strong> the simple (partial) tones determine the overall quality <strong>of</strong> a complex<br />
tone. Each partial tone is also known as a harmonic. The most significant harmonic<br />
has the greatest amplitude and is known as the fundamental. The frequency <strong>of</strong> each<br />
consequent harmonic must be related to the fundamental frequency by integer<br />
multiples (1,2,3,4,5…etc.). So, because a sine wave is the least appealing tone, a tone<br />
aesthetically similar to sine wave will be used. Because leads typically have the most<br />
interesting and appealing tone, a synth lead will be used as the aesthetically<br />
appealing tone.<br />
The two samples will first be compared by ear so that a hypothesis can be<br />
made. Then, the two samples will be compared through a spectrum analysis<br />
s<strong>of</strong>tware. A spectrum analyzer is a device or s<strong>of</strong>tware that can be used to examine<br />
the spectral composition <strong>of</strong> an acoustic waveform. The spectrum analyzer measures<br />
several different properties <strong>of</strong> waves including frequency, amplitude, and phase.<br />
The phase <strong>of</strong> a wave denotes its position in the cycle <strong>of</strong> its waveform. When waves<br />
are heard together, their amplitudes are summed to produce a new wave. This<br />
means that when two identical waves are completely out <strong>of</strong> phase, the waves will<br />
cancel each other out. This is important when analyzing tone, because a waveform<br />
with more complex phase relationships will have an overall more complex sound.<br />
‐3‐
Hypothesis<br />
If the spectral composition <strong>of</strong> a tone aesthetically similar to a sine wave is<br />
compared to that <strong>of</strong> an aesthetically appealing tone, then the aesthetically appealing<br />
tone should have a more complex harmonic structure. Both tones should have their<br />
fundamental harmonic at 256 Hz (middle C), followed by a second harmonic at 512<br />
Hz, a third harmonic at 768 Hz, a fourth harmonic at 1024 Hz, and so on. While a<br />
real sine wave would only have the single harmonic at 256 Hz, the sample that was<br />
used could be heard to clearly contain other higher order harmonics. Also, while the<br />
harmonics <strong>of</strong> both samples should have the same frequencies, the amplitudes <strong>of</strong> the<br />
synth lead harmonics should fluctuate over time. This is because the synth lead<br />
oscillates. The phase <strong>of</strong> the synth lead harmonics should also fluctuate over time for<br />
the same reason. On the other hand, the harmonics <strong>of</strong> the sine wave should have<br />
constant amplitudes over time, and as well, the phase <strong>of</strong> the sine wave harmonics<br />
should be constant over time. This is because the sine wave does not oscillate.<br />
Procedure<br />
Obtaining Sound Files:<br />
1. Open Reason.<br />
2. Find an instrument that is aesthetically similar to a sine wave.<br />
3. Play a note (preferably middle C) and record a 15 second sample.<br />
4. Go to File… Export Song as Audio File… and save the .wav file with a sample<br />
rate <strong>of</strong> 44,100 Hz and a 24 bit depth.<br />
‐4‐
5. Repeat steps 3 and 4 with an aesthetically appealing instrument (this will<br />
constitute as the complex tone).<br />
<strong>Analyzing</strong> Samples<br />
1. Open MATLAB, open the “wav_analysis” folder, and then run the<br />
“wav_analysis.m” program.<br />
2. In the wav_analysis window, go to File… Open WAV… and open the sine wave<br />
sample.<br />
3. Choose the channel you wish to analyze when prompted “Which Channel?”<br />
4. Click “Clip Waveform” and clip the fifteen second sound file into the four<br />
second interval that has the most consistent amplitude.<br />
5. Click “Choose Harmonics” and select the frequency intervals <strong>of</strong> the first six<br />
harmonics.<br />
6. Click “Analyze” and wait for the program to finish fitting the harmonics.<br />
7. Click “Show Harmonic Fits” and “Show Aggregate Plots” to view the results.<br />
8. Go to File… Save All.<br />
9. Close MATLAB and then repeat steps 1 through 8 for the aesthetically<br />
appealing sample.<br />
‐5‐
Results<br />
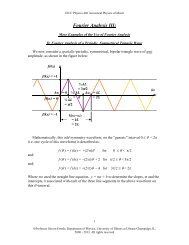
Sine Wave Graphs<br />
Figure 1<br />
Figure 2<br />
Figure 3<br />
‐6‐<br />
Synth Lead Graphs<br />
Figure 5<br />
Figure 6<br />
Figure 7
Analysis<br />
Figure 4<br />
‐7‐<br />
Figure 8<br />
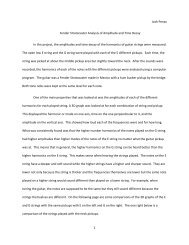
The spectrogram <strong>of</strong> the sine wave (Fig. 1) does support the hypothesis. In fig.<br />
2, a graph <strong>of</strong> frequency vs. amplitude, the fundamental harmonic can be seen clearly<br />
at 256 Hz, followed by a second harmonic at 512 Hz, a third harmonic at 768 Hz, a<br />
fourth harmonic at 1024 Hz, and so on. Also, the amplitudes <strong>of</strong> sine wave’s higher<br />
order harmonics are all smaller than the fundamental’s amplitude by at least a<br />
power <strong>of</strong> ten (Fig. 2). In fig. 3, a graph <strong>of</strong> harmonic amplitudes vs. time, the<br />
amplitudes <strong>of</strong> the sine wave harmonics are constant over time. In fig. 4, a graph <strong>of</strong><br />
harmonic phases vs. time, the relative phase <strong>of</strong> the higher order harmonics<br />
compared to the fundamental are also constant overtime.<br />
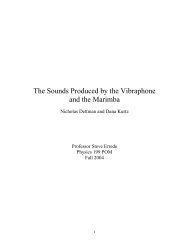
The spectrogram <strong>of</strong> the synth lead (Fig. 5) does not completely agree with the<br />
hypothesis. In fig. 6, a graph <strong>of</strong> frequency vs. amplitude, the fundamental harmonic<br />
is not at 256 Hz but rather at about 64 Hz. The second harmonic is at about 128 Hz<br />
(not 512 Hz); the third harmonic is at about 256 Hz (not 768 Hz); the fourth<br />
harmonic is at about 384 Hz (not 512 Hz); and the fifth harmonic is at about 512 Hz.
Also, the amplitudes <strong>of</strong> the synth lead’s higher harmonics are not all significantly<br />
smaller than the fundamental amplitude (Fig. 6). The amplitude <strong>of</strong> the second, third,<br />
and fourth harmonics are all within a power <strong>of</strong> ten <strong>of</strong> the fundamental. However, fig<br />
7, a graph <strong>of</strong> harmonic amplitudes vs. time, does support the hypothesis. The<br />
amplitudes <strong>of</strong> the synth lead harmonics are clearly fluctuating over time. In fig. 8, a<br />
graph <strong>of</strong> harmonic phases vs. time, the relative phase <strong>of</strong> the higher order harmonics<br />
are also changing overtime.<br />
Conclusion:<br />
The results <strong>of</strong> this experiment did somewhat support the overall hypothesis,<br />
however there were a few discrepancies. The harmonic structure <strong>of</strong> the synth lead is<br />
obviously more complex than that <strong>of</strong> the sine wave, but the harmonics <strong>of</strong> the synth<br />
lead did not agree with the hypothesis. Since the synth lead sample was recorded at<br />
middle C, the fundamental <strong>of</strong> the tone should have been at about 256 Hz. The<br />
spectrum analysis s<strong>of</strong>tware mostly likely had trouble analyzing the sample because<br />
it oscillates too much. Further investigation is necessary to understand exactly why<br />
the harmonics <strong>of</strong> the synth lead were <strong>of</strong>f.<br />
Besides the synth lead harmonics, the rest <strong>of</strong> the data fits the hypothesis. The<br />
sine wave sample is indeed not a sine wave because it has multiple harmonics. A<br />
pure sine wave would only have a single fundamental frequency. The higher order<br />
harmonics <strong>of</strong> the sine wave (512 Hz, 768 Hz, 1024 Hz, etc.) were integer multiples <strong>of</strong><br />
the fundamental middle C (256 Hz) as the hypothesis predicted.<br />
‐8‐
The amplitudes <strong>of</strong> the sine wave harmonics were constant which differed<br />
from the synth lead, which had fluctuating harmonic amplitudes. This helps explain<br />
why the synth lead is more interesting to hear. The fluctuating harmonics are<br />
complex which is aesthetically appealing while constant amplitudes are boring. The<br />
relative phase <strong>of</strong> the sine wave harmonics were also constant which differed from<br />
the synth lead. The relative phase <strong>of</strong> the synth lead harmonics changed a great deal<br />
over time. This also adds to the complexity <strong>of</strong> the <strong>of</strong> the synth lead tone, further<br />
explaining why it is more interesting to hear.<br />
A major factor that was over looked when making the hypothesis was the<br />
amplitudes <strong>of</strong> the higher order harmonics compared to the fundamental frequency.<br />
While the amplitudes <strong>of</strong> the sine wave’s higher order harmonics were all<br />
significantly smaller than the fundamental (by at least a power <strong>of</strong> ten), the synth<br />
lead’s were not. The synth lead has three higher order harmonics that are<br />
comparable to the fundamental’s amplitude, and therefore, will all be almost equally<br />
heard. So while the harmonics <strong>of</strong> the sine wave will be background, the harmonics <strong>of</strong><br />
the synth lead will be core components <strong>of</strong> the wave. It seems that being able to hear<br />
multiple harmonics in a tone attributes to complexity <strong>of</strong> its sound. And clearly,<br />
complexity in sound is more aesthetically appealing than simplicity.<br />
‐9‐
Bibliography:<br />
Backus, John. The Acoustical Foundations <strong>of</strong> Music. 2 nd ed. New York: W. W. Norton<br />
and Company Inc., 1977<br />
Errede, Steven. "Lecture 6 – Ch. 6 Acoustic Foundations <strong>of</strong> Music ‐ <strong>Tone</strong> <strong>Quality</strong>."<br />
Department <strong>of</strong> Physics, <strong>University</strong> <strong>of</strong> Illinois at Urbana‐Champaign, Illinois,<br />
2010. Web. 17 Dec 2010. .<br />
‐10‐