Measuring Animal Spirits - Decision Analyst, Inc.
Measuring Animal Spirits - Decision Analyst, Inc.
Measuring Animal Spirits - Decision Analyst, Inc.

Create successful ePaper yourself
Turn your PDF publications into a flip-book with our unique Google optimized e-Paper software.
Economists have long theorized about the role<br />
consumer expectations play in creating our<br />
economic future. During the Great Depression,<br />
John Maynard Keynes attributed the business<br />
cycle to alternating waves of optimism and<br />
pessimism, which he termed “animal spirits.”<br />
Keynes believed that these waves cause the boomand-bust<br />
cycle experienced by market economies.<br />
In the twenty-first century, the science and art<br />
of prognostication is especially<br />
relevant to marketers. Information<br />
about the economic future<br />
is invaluable in helping them<br />
position their offerings so as<br />
to maximize sales and profits.<br />
Although a massive industry<br />
has arisen from attempts to<br />
divine the future through<br />
the use of forecasting models,<br />
many models do not leverage<br />
the insight offered by tracking<br />
consumer sentiment.<br />
Indices based on consumer<br />
surveys, such as the <strong>Decision</strong><br />
<strong>Analyst</strong> Economic Index,<br />
attempt to measure these<br />
“animal spirits.” By correlating<br />
the <strong>Decision</strong> <strong>Analyst</strong> Economic Index to other<br />
data, and including it in forecasting models, we<br />
have found that our ability to see into the future<br />
can be dramatically improved.<br />
Strategic Research Analytics Modeling Optimization<br />
Copyright © 2006 <strong>Decision</strong> <strong>Analyst</strong>. All rights reserved.<br />
<strong>Measuring</strong> <strong>Animal</strong> <strong>Spirits</strong>:<br />
Economic Indices and the Future<br />
By Michael Richarme, Paul McDonnold, and Edward Carnal<br />
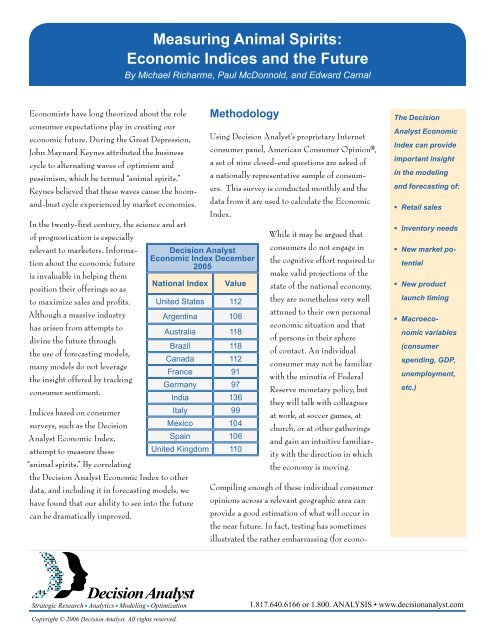
Methodology<br />
<strong>Decision</strong> <strong>Analyst</strong><br />
Economic Index December<br />
2005<br />
National Index Value<br />
United States 112<br />
Argentina 106<br />
Australia 118<br />
Brazil 118<br />
Canada 112<br />
France 91<br />
Germany 97<br />
India 136<br />
Italy 99<br />
Mexico 104<br />
Spain 106<br />
United Kingdom 110<br />
Using <strong>Decision</strong> <strong>Analyst</strong>’s proprietary Internet<br />
consumer panel, American Consumer Opinion®,<br />
a set of nine closed-end questions are asked of<br />
a nationally representative sample of consumers.<br />
This survey is conducted monthly and the<br />
data from it are used to calculate the Economic<br />
Index.<br />
While it may be argued that<br />
consumers do not engage in<br />
the cognitive effort required to<br />
make valid projections of the<br />
state of the national economy,<br />
they are nonetheless very well<br />
attuned to their own personal<br />
economic situation and that<br />
of persons in their sphere<br />
of contact. An individual<br />
consumer may not be familiar<br />
with the minutia of Federal<br />
Reserve monetary policy, but<br />
they will talk with colleagues<br />
at work, at soccer games, at<br />
church, or at other gatherings<br />
and gain an intuitive familiarity<br />
with the direction in which<br />
the economy is moving.<br />
Compiling enough of these individual consumer<br />
opinions across a relevant geographic area can<br />
provide a good estimation of what will occur in<br />
the near future. In fact, testing has sometimes<br />
illustrated the rather embarrassing (for econo-<br />
The <strong>Decision</strong><br />
<strong>Analyst</strong> Economic<br />
Index can provide<br />
important insight<br />
in the modeling<br />
and forecasting of:<br />
Retail sales<br />
Inventory needs<br />
New market po-<br />
tential<br />
New product<br />
launch timing<br />
Macroeco-<br />
nomic variables<br />
(consumer<br />
spending, GDP,<br />
unemployment,<br />
etc.)<br />
1.817.640.6166 or 1.800. ANALYSIS • www.decisionanalyst.com
When compared to<br />
two leading United<br />
States economic<br />
indices, the<br />
<strong>Decision</strong> <strong>Analyst</strong><br />
Economic Index<br />
provides a broader<br />
international<br />
scope and a more<br />
granular and sta-<br />
ble regional scope<br />
within the United<br />
States.<br />
mists) conclusion that properly constructed<br />
consumer surveys can more accurately predict<br />
the state of the national economy than can<br />
abstract theoretical models constructed by<br />
economists (for example, see Thomas, Jr. 1 and<br />
Gramlich 2 ).<br />
Geography<br />
The <strong>Decision</strong> <strong>Analyst</strong> Economic Index was initially<br />
constructed for the United States economy,<br />
though the global nature of the American<br />
Consumer Opinion® panel led to a rapid expansion<br />
to additional countries across the globe. At<br />
this time, the <strong>Decision</strong> <strong>Analyst</strong> Economic Index<br />
data are collected monthly in the following<br />
12 countries: United States, Canada, Mexico,<br />
Brazil, Argentina, United Kingdom, France,<br />
Italy, Germany, Spain, Australia, and India.<br />
All surveys are conducted in English or the<br />
native language of the respondent. Because<br />
the surveys contain the same questions from<br />
country to country, the indices for each country<br />
are both indicative of consumer sentiment in<br />
that country and can be directly compared from<br />
country to country. The table on page 1 presents<br />
the indices for each country as of December<br />
2005.<br />
The <strong>Decision</strong> <strong>Analyst</strong> Economic Index for the<br />
United States employs approximately 2,500<br />
completed surveys per month, and is calibrated<br />
such that a value below 100 indicates economic<br />
contraction, while a value above 110 indicates<br />
economic expansion. Values between 100 and<br />
110 indicate uncertainty or, possibly, economic<br />
stagnation.<br />
1 Thomas Jr., Lloyd B., “Survey Measures of<br />
Expected U.S. Inflation.” Journal of Economic<br />
Perspectives; Fall 1999, Vol. 13, Issue 4, p. 125.<br />
Gramlich, Edward M., “Models of Inflation Expectations<br />
Formation.” Journal of Money, Credit<br />
& Banking; May 1983, Vol. 15, Issue 2, pp. 155-<br />
173.<br />
<strong>Decision</strong> <strong>Analyst</strong><br />
In addition, the sample size of the United States<br />
survey allows for the construction of regional<br />
indices, conforming to the geography of the<br />
nine United States census divisions. This allows<br />
for direct comparison between regions in the<br />
United States. The same calibration of the index<br />
is performed, so that the regional indices can<br />
also be directly compared to the overall United<br />
States index.<br />
For countries other than the United States, the<br />
sample size ranges from approximately 250 to<br />
over 2,000 completed surveys per month per<br />
country. For most of the countries the sample<br />
size is not large enough to be disaggregated<br />
into smaller geographies, but this expansion is<br />
planned for future indices. In addition, other<br />
countries, such as China, will be added to the<br />
international list in the future.<br />
Validation<br />
The two best known consumer-related indices<br />
are the University of Michigan Index of<br />
Consumer Sentiment (ICS) and the Conference<br />
Board Consumer Confidence Index (CCI).<br />
Similar to the <strong>Decision</strong> <strong>Analyst</strong> Economic<br />
Index, both utilize consumer surveys to ascertain<br />
the current state and future path of the<br />
economy. However, there are also differences<br />
between the three indices that are important to<br />
understand from an interpretation perspective.<br />
The University of Michigan ICS was started in<br />
1946. This survey is administered monthly to<br />
approximately 500 consumers via telephone.<br />
The survey contains 50 questions and is a<br />
composite index of both current and future<br />
expectations.<br />
The Conference Board CCI was started in 1967.<br />
This survey is administered monthly to approximately<br />
5,000 consumers via mail. At this<br />
time, the Conference Board utilizes an external
marketing research firm for data collection. The survey<br />
contains five questions, covering current and future business<br />
conditions, current and future employment conditions, and<br />
future family income. The time frame for future expectations<br />
is six months. The Conference Board CCI is also available<br />
for eight additional countries (Australia, France, Germany,<br />
United Kingdom, Spain, Japan, Korea, and Mexico) though<br />
no methodology statements are available on the Conference<br />
Board website about these additional countries.<br />
Examining the relationship between the <strong>Decision</strong> <strong>Analyst</strong><br />
Economic Index and the other two indices, a correlation of<br />
160<br />
140<br />
120<br />
100<br />
80<br />
60<br />
<strong>Decision</strong> <strong>Analyst</strong> Economic Index Vs. Michigan<br />
and Conference Board Indices<br />
Dec-99 Dec-00 Dec-01 Dec-02 Dec-03 Dec-04 Dec-05<br />
<strong>Decision</strong> <strong>Analyst</strong> U.S. Economic Index<br />
CB Consumer Confidence<br />
UM Consumer Sentiment<br />
0.87 is obtained since 1999. The relationship is illustrated in<br />
the following chart.<br />
In the index comparison chart, major directional movements<br />
in consumer expectations can be related to economic and<br />
geopolitical events during that period. For example, a major<br />
inflection point is November of 2000, when consumer<br />
expectations began trending downward. Shortly after this,<br />
unemployment began trending upward and an economic<br />
contraction began. Another major inflection point is seen<br />
in September 2001 after the World Trade Center disaster.<br />
Consumer expectations went down due to concerns of global<br />
terrorism impacting the economy.<br />
OR<br />
CA<br />
WA<br />
AK<br />
NV<br />
<strong>Measuring</strong> <strong>Animal</strong> <strong>Spirits</strong><br />
Given the relatively tight correlation of the three consumerbased<br />
indices (ICS, CCI, and <strong>Decision</strong> <strong>Analyst</strong>) with each<br />
other, the question arises as to why <strong>Decision</strong> <strong>Analyst</strong> has undertaken<br />
the expense of creating its own index. A large part of<br />
the answer lies in the level of control and customization that<br />
<strong>Decision</strong> <strong>Analyst</strong> can offer clients by having its own index.<br />
The <strong>Decision</strong> <strong>Analyst</strong> Economic Index can be broken down<br />
regionally, extended to new countries of interest, or it can be<br />
broken down to analyze the trends of specific questions, such<br />
as consumer expectations about the stock market.<br />
Regional Detail<br />
It is possible to disaggregate the <strong>Decision</strong> <strong>Analyst</strong> Economic<br />
Index for the United States into the nine U.S. Census<br />
divisions. The index for each Census division for December<br />
2005 is shown in the following chart. As can be seen, there<br />
are significant differences in the <strong>Decision</strong> <strong>Analyst</strong> Economic<br />
Index for different divisions and regions.<br />
ID<br />
UT<br />
AZ<br />
MT<br />
WY<br />
CO<br />
MN<br />
ND<br />
SD<br />
NE<br />
KS<br />
TX<br />
OK<br />
MN<br />
IA<br />
MO<br />
AR<br />
LA<br />
WI<br />
MI<br />
IL IN OH<br />
West Region<br />
Pacific ................................................................ 111<br />
Mountain ............................................................ 115<br />
Midwest Region<br />
West North Central ............................................ 110<br />
East North Central .............................................108<br />
South Region<br />
West South Central .......................................... 111<br />
East South Central ...........................................108<br />
South Atlantic ................................................... 118<br />
Northeast Region<br />
Middle Atlantic ....................................................109<br />
New England ...................................................... 115<br />
MS<br />
TN<br />
AL<br />
KY<br />
WV<br />
GA<br />
PA<br />
SC<br />
NY<br />
VA<br />
FL<br />
NC<br />
ME
In addition to point-in-time differences between regions, it is also of interest to analyze the differences in trend for the various<br />
regional index breakdowns. This can be seen graphically for each of the nine divisions in the following four charts.<br />
4<br />
130<br />
120<br />
110<br />
100<br />
90<br />
Mountain:<br />
Pacific:<br />
130<br />
120<br />
110<br />
100<br />
90<br />
Oct-<br />
04<br />
Oct-<br />
04<br />
Nov-<br />
04<br />
Nov-<br />
04<br />
East North Central:<br />
West North Central:<br />
Dec-<br />
04<br />
Jan-<br />
05<br />
<strong>Decision</strong> <strong>Analyst</strong> Economic Index<br />
Mountain Vs. Pacific<br />
Feb-<br />
05<br />
Apr-<br />
05<br />
Jun-<br />
05<br />
Montana, Idaho, Wyoming, Colorado, New Mexico, Arizona, Utah, and Nevada<br />
Alaska, Washington, Oregon, California, and Hawaii<br />
Dec-<br />
04<br />
Mountain Index<br />
Mar-<br />
05<br />
May-<br />
05<br />
Ohio, Indiana, Illinois, Michigan, and Wisconsin<br />
Minnesota, Iowa, Missouri, North Dakota, South Dakota, Nebraska, and Kansas<br />
<strong>Decision</strong> <strong>Analyst</strong><br />
Jul-<br />
05<br />
Pacific Index<br />
Aug-<br />
05<br />
<strong>Decision</strong> <strong>Analyst</strong> Economic Index<br />
East North Central Vs. West North Central<br />
Jan-<br />
05<br />
Feb-<br />
05<br />
Mar-<br />
05<br />
East North Central Index<br />
Apr-<br />
05<br />
May-<br />
05<br />
Jun-<br />
05<br />
Jul-<br />
05<br />
Aug-<br />
05<br />
Sep-<br />
05<br />
Sep-<br />
05<br />
West North Central Index<br />
Oct-<br />
05<br />
Oct-<br />
05<br />
Nov-<br />
05<br />
Nov-<br />
05<br />
Dec-<br />
05<br />
Dec-<br />
05
130<br />
120<br />
110<br />
100<br />
90<br />
130<br />
120<br />
110<br />
100<br />
90<br />
Oct-<br />
04<br />
Oct-<br />
04<br />
Nov-<br />
04<br />
New England:<br />
Middle Atlantic:<br />
Dec-<br />
04<br />
<strong>Decision</strong> <strong>Analyst</strong> Economic Index<br />
New England Vs. Middle Atlantic<br />
Feb-<br />
05<br />
New England Index<br />
Apr-<br />
05<br />
Middle Atlantic Index<br />
Maine, New Hampshire, Vermont, Massachusetts, Rhode Island, and Connecticut<br />
New York, New Jersey, and Pennsylvania<br />
<strong>Decision</strong> <strong>Analyst</strong> Economic Index<br />
South Atlantic Vs. East South Central Vs. West South Central<br />
Nov-<br />
04<br />
Dec-<br />
04<br />
South Atlantic:<br />
Jan-<br />
05<br />
East South Central:<br />
Jan-<br />
05<br />
West South Central:<br />
Feb-<br />
05<br />
Mar-<br />
05<br />
Mar-<br />
05<br />
Apr-<br />
05<br />
May-<br />
05<br />
May-<br />
05<br />
West South Central Index East South Central Index<br />
South Atlantic Index<br />
Jun-<br />
05<br />
Jun-<br />
05<br />
Jul-<br />
05<br />
Jul-<br />
05<br />
Aug-<br />
05<br />
Aug-<br />
05<br />
Delaware, Maryland, District of Columbia, Virginia, West Virginia,<br />
North Carolina, South Carolina, Georgia, and Florida<br />
Kentucky, Tennessee, Alabama, and Mississippi<br />
Arkansas, Louisiana, Oklahoma, and Texas<br />
Sep-<br />
05<br />
Sep-<br />
05<br />
<strong>Measuring</strong> <strong>Animal</strong> <strong>Spirits</strong><br />
Oct-<br />
05<br />
Oct-<br />
05<br />
Nov-<br />
05<br />
Nov-<br />
05<br />
Dec-<br />
05<br />
Dec-<br />
05<br />
Localized events<br />
can cause con-<br />
sumerexpecta- tions to differ from<br />
region to region,<br />
though the general<br />
trend tracks with<br />
the overall United<br />
States index.<br />
This leads to more<br />
volatility in region-<br />
al indices, reflect-<br />
ing the impact of<br />
a large plant clos-<br />
ing or opening, a<br />
natural disaster, or<br />
other events which<br />
cause expecta-<br />
tions to change.<br />
Over the past 15<br />
months, regional<br />
indices have pre-<br />
dicted turbulent<br />
conditions, though<br />
the trend of the<br />
past quarter points<br />
to economic ex-<br />
pansion across the<br />
United States.
6<br />
To fit individual<br />
client needs, the<br />
<strong>Decision</strong> <strong>Analyst</strong><br />
Economic Index<br />
can be broken<br />
down:<br />
<br />
<br />
Geographically,<br />
to focus on a<br />
particular mar-<br />
ket.<br />
By survey ques-<br />
tions, to focus in<br />
on a particular<br />
consumer at-<br />
titude (for ex-<br />
ample, attitudes<br />
about the stock<br />
market).<br />
Though they generally move together, the<br />
regional indices are more sensitive to events and<br />
news that directly affect their area. For example,<br />
a major employer closing a plant or a major<br />
regional weather event may cause the consumer<br />
expectations for that region to decline further<br />
than those of other regions that are not immediately<br />
or directly affected by those events.<br />
One example of such regional differences can<br />
be found in unemployment rates. The <strong>Decision</strong><br />
<strong>Analyst</strong> Economic Index has been shown to be<br />
an excellent predictor of unemployment rates at<br />
both the national and regional level, with a correlation<br />
of -0.90 at a six-month lag (see graphs<br />
below). As the Economic Index falls (indicating<br />
West South Central Index<br />
U.S. Economic Index<br />
150<br />
140<br />
130<br />
120<br />
110<br />
100<br />
90<br />
Jun-<br />
99<br />
Dec-<br />
99<br />
<strong>Decision</strong> <strong>Analyst</strong><br />
more consumer trepidation about the economy),<br />
we would expect a corresponding rise in the<br />
unemployment rate approximately six months<br />
later. This illustrates the power of consumer<br />
economic surveys.<br />
While the typical survey respondent is not a<br />
trained economist, and may know little about<br />
economic theory or forecasting, they do know<br />
what they have been hearing. Are rumors of<br />
layoffs circulating at work? Are friends facing<br />
layoffs? Is sales revenue off this year? By gauging<br />
these attitudes on a broad scale, <strong>Decision</strong><br />
<strong>Analyst</strong>’s Economic Index turns the attitudes of<br />
noneconomists into a de facto economic forecasting<br />
model with an admirable track record.<br />
<strong>Decision</strong> <strong>Analyst</strong> Economic Index<br />
West South Central Index vs. Unemployment Rate<br />
80 3.0<br />
140<br />
130<br />
120<br />
110<br />
100<br />
90<br />
80 Jun-<br />
99<br />
Dec-<br />
99<br />
Jun-<br />
00<br />
West South Central Index West South Central Unemployment Rate<br />
Jun-<br />
00<br />
Dec-<br />
00<br />
Jun-<br />
01<br />
<strong>Decision</strong> <strong>Analyst</strong> Economic Index<br />
U.S. Index vs. Unemployment Rate<br />
Dec-<br />
00<br />
Jun-<br />
01<br />
U.S. Economic Index<br />
Dec-<br />
01<br />
Dec-<br />
01<br />
Jun-<br />
02<br />
Jun-<br />
02<br />
Dec-<br />
02<br />
Dec-<br />
02<br />
Jun-<br />
03<br />
Jun-<br />
03<br />
Dec-<br />
03<br />
Dec-<br />
03<br />
Jun-<br />
04<br />
Jun-<br />
04<br />
Dec-<br />
04<br />
Dec-<br />
04<br />
7.0<br />
6.5<br />
6.0<br />
5.5<br />
5.0<br />
4.5<br />
4.0<br />
3.5<br />
Seasonally Adjusted U.S. Unemployment Rate (%)<br />
Jun-<br />
05<br />
Jun-<br />
05<br />
Dec-<br />
05<br />
Dec-<br />
05<br />
6.5<br />
6.0<br />
5.5<br />
5.0<br />
4.5<br />
4.0<br />
3.5<br />
3.0<br />
West South Central Unemployment Rate<br />
Seasonally Adjusted U.S. Unemployment Rate (%)
Econometric Applications<br />
Armed with a consumer index which has demonstrated predictive<br />
ability, marketers have access to valuable information<br />
with which to take advantage of upturns and to mitigate the<br />
effects of downturns in the economy.<br />
Take, for instance, sales forecasting. Much of the uncertainty<br />
involved in forecasting sales is a result of uncertainty regarding<br />
the overall business climate that will prevail over the<br />
term of the forecast. By using a consumer confidence index<br />
to inform the forecast, some of the uncertainty can be eliminated,<br />
or at least clarified.<br />
As an example, imagine that you are performing a sales<br />
forecast for a product for which sales have been escalating<br />
rapidly. Standard forecasting techniques would likely<br />
extrapolate the trend outward. But say that the economy has<br />
been booming over the period that sales have been escalating,<br />
and you can see from the consumer index that a cooling-off<br />
period, perhaps even a recession, is coming. In this case,<br />
based on the information the consumer index is giving you,<br />
you would want to modify your forecast to account for the<br />
expected cooling business climate.<br />
As another example, consider the plight faced by an executive<br />
in charge of new product development. Launching new<br />
products is the penultimate exercise in uncertainty. In such<br />
U.S. Index<br />
116<br />
114<br />
112<br />
110<br />
108<br />
106<br />
104<br />
102<br />
100<br />
98<br />
96<br />
Jun-<br />
04<br />
Sep-<br />
04<br />
<strong>Decision</strong> <strong>Analyst</strong> Economic Index<br />
U.S. Index vs. Customer Satisfaction<br />
Dec-<br />
04<br />
U.S. Index<br />
Mar-<br />
05<br />
<strong>Measuring</strong> <strong>Animal</strong> <strong>Spirits</strong><br />
a situation, a need exists for real data to inform the process,<br />
and the information contained in a consumer survey index<br />
can help. For instance, when consumer confidence is on the<br />
rise, an astute executive will want to have launches ready to<br />
roll. And when confidence is declining, he or she may want<br />
to have fewer actual launches occurring, and have more<br />
resources devoted to R&D activities, which will provide the<br />
company with new products to launch when the business cycle<br />
begins to turn back up. With anticyclical products (those that<br />
sell better during a recession) the opposite logic would apply.<br />
To take a more concrete example of the possible applications<br />
of a consumer index, the <strong>Decision</strong> <strong>Analyst</strong> Economic Index<br />
has been successfully related to customer satisfaction data for<br />
a large, national mass market retailer. In the following chart,<br />
it can be seen that changes in the consumer index precede<br />
changes in the customer satisfaction data by approximately<br />
three months. When the satisfaction data are lagged, the<br />
indices correlate by approximately 0.60. This three-month<br />
window gives the retailer the opportunity to take proactive<br />
measures related to advertising, staffing levels, pricing adjustments,<br />
and the like, to mitigate the coming impact on store<br />
sales.<br />
There are clearly many factors that influence customer satisfaction.<br />
The correlation seen previously would indicate that<br />
the <strong>Decision</strong> <strong>Analyst</strong> Economic Index captures some of those<br />
Jun-<br />
05<br />
Sep-<br />
05<br />
Overall Customer Satisfaction<br />
Dec-<br />
05<br />
3.50<br />
3.48<br />
3.46<br />
3.44<br />
3.42<br />
3.40<br />
Overall Customer Satisfaction
factors. If a consumer believes that economic expectations<br />
are headed downward, there will be a cognitive dissonance<br />
occurring in the near future, which validates that expectation<br />
and translates to a less satisfactory retail experience. The<br />
consumer is more prone to notice those elements fitting with<br />
the preconceived notion of retail conditions, such as service<br />
level, inventory availability, and even less significant elements<br />
as store cleanliness or merchandise in disarray. However, if<br />
the consumer has an economic expectation of improvement,<br />
the same cognitive dissonance process works in reverse, and<br />
the consumer is prone to notice positive elements that fit with<br />
the preconceived notion of the retail experience.<br />
There are many such possibilities for relating the <strong>Decision</strong><br />
<strong>Analyst</strong> Economic Index to company-level data. Retail sales,<br />
for instance, are often driven by consumer expectations<br />
about the economy, especially for large- ticket items. By<br />
capturing consumer expectations in the category of interest,<br />
and combining that with other driver variables (such as<br />
disposable personal income), a sales forecasting model can be<br />
About the Author<br />
constructed which can aid in budgeting, inventory scheduling,<br />
advertising planning, and the like. When the role of consumer<br />
economic expectations is ignored in such forecasting<br />
models, a valuable source of information is left unexploited.<br />
Through the Economic Index, <strong>Decision</strong> <strong>Analyst</strong> has captured<br />
this information and incorporated it into sales forecasting<br />
and optimization models.<br />
Conclusion<br />
The <strong>Decision</strong> <strong>Analyst</strong> Economic Index can be customized<br />
and manipulated to fit a wide variety of product categories<br />
and modeling needs, to help clients drive revenue growth and<br />
maximize profits. It does this by capturing, quantifying, and<br />
aggregating the attitudes of consumers. These attitudes, the<br />
“animal spirits” spoken of by John Maynard Keynes, play an<br />
important role in determining the direction in which the<br />
business climate will move. By measuring them we gain a<br />
powerful tool to help us see into the economic future.<br />
Michael Richarme is a Senior Vice President at <strong>Decision</strong> <strong>Analyst</strong>. The author may be reached by emailing<br />
mrichar@decisionanalyst.com or by calling 1-800-262-5974 or 1-817-640-6166.<br />
<strong>Decision</strong> <strong>Analyst</strong> is a leading international marketing research and analytical consulting firm. The company<br />
specializes in advertising testing, strategy research, new product ideation, new product research, and advanced<br />
modeling for marketing-decision optimization.<br />
Strategic Research Analytics Modeling Optimization<br />
604 Avenue H East • Arlington, TX 76011- 100, USA<br />
1.817.640.6166 or 1.800. ANALYSIS • www.decisionanalyst.com<br />
8 Copyright © 2006 <strong>Decision</strong> <strong>Analyst</strong>. All rights reserved.