

Here - Canada-Nova Scotia Offshore Petroleum Board
Here - Canada-Nova Scotia Offshore Petroleum Board
Here - Canada-Nova Scotia Offshore Petroleum Board

Create successful ePaper yourself
Turn your PDF publications into a flip-book with our unique Google optimized e-Paper software.
CANADA-NOVA SCOTIA<br />
OFFSHORE PETROLEUM BOARD<br />
The Upper Jurassic Abenaki Formation<br />
<strong>Offshore</strong> <strong>Nova</strong> <strong>Scotia</strong>:<br />
A Seismic and Geologic Perspective<br />
Arthur G. Kidston 1, 2 , David E. Brown 1 , Brenton M. Smith 1 and Brian Altheim 1<br />
( 1 <strong>Canada</strong>-<strong>Nova</strong> <strong>Scotia</strong> <strong>Offshore</strong> <strong>Petroleum</strong> <strong>Board</strong>, 2 Table Rock Resources Ltd. )<br />
June 2005 – Version 1.0<br />
HALIFAX, NOVA SCOTIA, CANADA
CONFIDENTIALITY<br />
This Report was originally created by the <strong>Canada</strong>-<strong>Nova</strong> <strong>Scotia</strong> <strong>Offshore</strong> <strong>Petroleum</strong> <strong>Board</strong> for its<br />
exclusive internal use. This version has been edited for public release, as the original work<br />
contained portions of well, seismic, and other information currently held under confidentiality<br />
agreements between the respective owners of the data and the CNSOPB. Most of the figures that<br />
were included in the original Report are included herein, and where appropriate, with the express<br />
permission of the data owners.<br />
ACKNOWLEDGEMENTS<br />
The authors hereby acknowledge the ongoing support of the <strong>Canada</strong>-<strong>Nova</strong> <strong>Scotia</strong> <strong>Offshore</strong> <strong>Petroleum</strong><br />
<strong>Board</strong>, especially Steve Bigelow, Manager-Resources & Rights, for providing the resources required for<br />
this study, and guidance and integration of human resources with day-to-day operational responsibilities.<br />
His vision of accomplishing a study of this magnitude, to further enhance the knowledge base for the<br />
<strong>Nova</strong> <strong>Scotia</strong> Margin, is admirable. We also warmly thank our CNSOPB colleagues Carl Makrides,<br />
Andrew McBoyle, Christine Bonnell-Eisnor and Troy MacDonald for their continuous input, support and<br />
encouragement. We greatly appreciate the generous support of John Hogg, Rick Wierzbicki and Nancy<br />
Harland (EnCana), John Weissenberger (Husky, formerly with EnCana), Kim Abdallah (TGS-NOPEC),<br />
Ian Davison (Earthmoves) and Gabor Taru (Vanco), and thank them and their firms for permission to use<br />
selected seismic profiles and figures. We recognize Sonya Dehler, Lubomir Jansa, John Wade and Don<br />
McAlpine (Geological Survey of <strong>Canada</strong>-Atlantic), Haddou Jabour (ONAREP/ONHYM), and Paul J. Post<br />
(U.S. Minerals Management Service) for their insights and advice. Finally, we sincerely thank Jim Dickey,<br />
CEO of the CNSOPB for his endorsement and support of the study.<br />
RECOMMENDED CITATION<br />
Kidston, A.G., Brown, D.E., Smith, B. and Altheim, B., 2005: The Upper Jurassic Abenaki Formation,<br />
<strong>Offshore</strong> <strong>Nova</strong> <strong>Scotia</strong>: A Seismic and Geologic Perspective. <strong>Canada</strong>-<strong>Nova</strong> <strong>Scotia</strong> <strong>Offshore</strong> <strong>Petroleum</strong><br />
<strong>Board</strong>, Halifax, <strong>Nova</strong> <strong>Scotia</strong>,168 p.<br />
2
TABLE OF CONTENTS<br />
LIST OF FIGURES..................................................................................................................................5<br />
LIST OF TABLES ...................................................................................................................................7<br />
1. INTRODUCTION AND SCOPE OF STUDY........................................................................................9<br />
2. DATABASE ..................................................................................................................................... 12<br />
2.1 Wells.......................................................................................................................................... 12<br />
2.2 Seismic ..................................................................................................................................... 12<br />
2.3 Key Papers................................................................................................................................ 15<br />
3. EXPLORATION HISTORY ............................................................................................................... 17<br />
3.1 Drilling Results to Date ............................................................................................................ 17<br />
3.2 Tests and Shows ...................................................................................................................... 18<br />
4. REGIONAL GEOLOGY.................................................................................................................... 21<br />
4.1 The <strong>Scotia</strong>n Basin..................................................................................................................... 22<br />
4.2 Geological History.................................................................................................................... 22<br />
5. THE ABENAKI FORMATION........................................................................................................... 27<br />
5.1 Depositional Setting................................................................................................................. 27<br />
5.2 Lithostratigraphy...................................................................................................................... 29<br />
5.2.1 Abenaki Formation ............................................................................................................ 29<br />
5.2.2 Scatarie Member (Abenaki 1) ............................................................................................ 30<br />
5.2.3 Misaine Member (Abenaki 2 equivalent)........................................................................... 30<br />
5.2.4 Bacarro Member (Abenaki 2, 3, 4, 5, 6)............................................................................. 31<br />
5.2.5 Artimon Member (Abenaki 7) ............................................................................................ 32<br />
5.2.6 Roseway Unit..................................................................................................................... 32<br />
5.3 Abenaki Platform Margin Facies Models................................................................................. 32<br />
5.4 Bank Profiles ............................................................................................................................ 36<br />
5.5 Pre-Platform Geology, Salt Tectonism and the Montagnais Impact Event ............................ 37<br />
5.6 Overcrop and Unconformities.................................................................................................. 45<br />
5.7 Reservoir Development and Diagenesis ................................................................................. 45<br />
5.8 Play Types ................................................................................................................................ 48<br />
5.9 Deep Panuke Gas Field ............................................................................................................ 51<br />
6. ANALOGUE BASINS....................................................................................................................... 61<br />
6.1 U.S. Atlantic Margin.................................................................................................................. 62<br />
6.1.1 Baltimore Canyon Trough................................................................................................. 63<br />
6.1.2 George’s Bank Basin......................................................................................................... 67<br />
6.1.3 Minerals Management Service Reource Assessment...................................................... 73<br />
6.2 Northwest Africa Margin .......................................................................................................... 73<br />
6.2.1 Morocco ............................................................................................................................. 73<br />
6.2.2 Mauritania .......................................................................................................................... 82<br />
6.3 Gulf of Mexico........................................................................................................................... 82<br />
6.3.1 United States ..................................................................................................................... 83<br />
6.3.2 USGS Resource Assessment............................................................................................ 87<br />
6.3.3 Mexico................................................................................................................................ 87<br />
6.4 Western <strong>Canada</strong> Sedimentary Basin ....................................................................................... 91<br />
3
7. ABENAKI BANK MARGIN............................................................................................................... 96<br />
7.1 Regional Late Jurassic Mapping and Play Concepts.............................................................. 96<br />
7.2 Panuke Segment....................................................................................................................... 99<br />
7.2.1 Seismic Data and Well Control ......................................................................................... 99<br />
7.2.2 Interpretation ................................................................................................................... 100<br />
7.2.3 Play Concepts.................................................................................................................. 115<br />
7.3 Acadia Segment...................................................................................................................... 117<br />
7.3.1 Well Control and Seismic Data ....................................................................................... 117<br />
7.3.2 Interpretation ................................................................................................................... 120<br />
7.3.3 Play Concepts.................................................................................................................. 133<br />
7.4 Shelburne Segment................................................................................................................ 134<br />
7.4.1 Well Control and Seismic Data ....................................................................................... 135<br />
7.4.2 Interpretation ................................................................................................................... 135<br />
7.4.3 Play Concepts.................................................................................................................. 139<br />
7.5 Comparative Summary of Bank Edge.................................................................................... 139<br />
7.6 Platform Interior...................................................................................................................... 139<br />
7.6.1 Outer Platform ................................................................................................................. 141<br />
7.6.2 Inner Platform.................................................................................................................. 144<br />
7.7 Play Summary......................................................................................................................... 149<br />
8. PETROLEUM SYSTEMS ............................................................................................................... 151<br />
8.1 Cohasset/Panuke Oils ............................................................................................................ 151<br />
8.2 Deep Panuke Gas ................................................................................................................... 151<br />
8.3 Source Rocks ......................................................................................................................... 151<br />
9. RESOURCE ASSESSMENTS........................................................................................................ 154<br />
9.1 Historical Assessments ......................................................................................................... 154<br />
10. CONCLUSIONS ........................................................................................................................... 155<br />
10.1. Basin Evaluation.................................................................................................................. 155<br />
REFERENCES.................................................................................................................................... 159<br />
4
LIST OF FIGURES<br />
Chapter 1 – Introduction and Scope of Study<br />
1. Location map of the circum-Central and North Atlantic Region<br />
2. <strong>Scotia</strong>n Basin tectonic elements<br />
3. Location map of study area, offshore <strong>Nova</strong> <strong>Scotia</strong><br />
Chapter 2 – Database<br />
4. Abenaki well and seismic base map<br />
5. Abenaki exploration drilling chronology<br />
Chapter 3 – Exploration History<br />
Chapter 4 – Regional Geology<br />
6. Jurassic carbonate margin, Eastern North America<br />
7. <strong>Scotia</strong>n Basin generalized stratigraphic chart<br />
Chapter 5 – The Abenaki Formation<br />
8. Abenaki facies and plays map<br />
9. Detailed sequence stratigraphic chart for the Abenaki Formation<br />
10. Generalized carbonate sequence stratigraphic model<br />
11. Simplified Abenaki Fm. carbonate facies model and associations<br />
12. Detailed Abenaki Fm. carbonate facies model and associations<br />
13. Surface sediment facies of the Florida-Bahamas Plateau<br />
14. Isometric models of carbonate bank types<br />
15. Simplified profiles of Jurassic carbonate bank margin profiles, circum-North & Central Atlantic region<br />
16. Jurassic carbonate bank margin types, Eastern North America<br />
17. Regional seismic line, Mohican Graben<br />
18. Regional seismic line, Mohican Graben<br />
19. Regional seismic line, Acadia Segment, Albatross B-13 well<br />
20. Regional schematic of Abenaki Formation stratigraphic relationships<br />
21. Map of regional unconformities affecting the Abenaki Formation<br />
22. Regional seismic line, Acadia Segment, Acadia K-62 well<br />
23. Regional seismic line, Acadia Segment, Bonnet P-23 well<br />
24. Carbonate platform play schematic<br />
25. Events Timing Chart – Regional Abenaki Formation<br />
26. Deep Panuke depth structure map, top of the Abenaki 5 sequence<br />
27. 3D depth structure of the main Deep Panuke gas reservoir, top Abenaki 5 sequence<br />
28. Deep Panuke field and adjacent margin structure map, top Abenaki 5 sequence<br />
29. Structural cross section, Deep Panuke gas field<br />
30. Seismic depth profile through the Panuke M-79 and M-79A wells<br />
31. Seismic time profile through the Panuke B-90, PI-1A and PI-1B wells<br />
32. Abenaki 5 net pay map<br />
33. Abenaki 5 porosity (Phi-h) map<br />
Chapter 6 – Circum-North Atlantic Analogue Basins<br />
34. North Atlantic Lower Jurassic depositional setting<br />
35. Tectonic elements, Eastern North America<br />
36. Geological cross section, U.S. Atlantic Margin<br />
Baltimore Canyon<br />
37. Baltimore Canyon Location Map<br />
38. Geological cross section, Baltimore Canyon<br />
39. Regional seismic line, Baltimore Canyon Trough<br />
40. Detailed seismic line, bank margin, Baltimore Canyon Trough<br />
41. Structure map, top Early Cretaceous carbonates, Baltimore Canyon<br />
42. Diagrammatic cross sections: Shell 372-1, 586-1 and 587-1 wells<br />
5
George’s Bank<br />
43. George’s Bank location map<br />
44. Regional geological cross section, Georges Bank<br />
45. Abenaki platform margin seismic line DS 907, George’s Bank<br />
46. Abenaki platform margin seismic line DS 916, George’s Bank<br />
47. Abenaki platform margin seismic line DS 927, George’s Bank<br />
Morocco<br />
48. Comparative stratigraphic chart for the <strong>Nova</strong> <strong>Scotia</strong>n and Moroccan offshore successions<br />
49. Stratigraphic chart, Agadir-Essaouira Basin, Morocco<br />
50. Play concept schematic, offshore Morocco<br />
51. Moroccan Atlantic margin geology, wells and seismic grids<br />
52. Trace of the Upper Jurassic carbonate bank margin, Puerto Cansado Fm.<br />
53. Location and structure maps of the Cap Juby Oil Field and Trident Lead<br />
54. Regional seismic line through MO-8 and MO-2 (projected) wells, Cap Juby Field<br />
55. Regional seismic line southwest of the Cap Juby Field<br />
56. Regional seismic line through the Cap Juby Anticline, north of the Cap Juby Field<br />
Mauritania<br />
57. Schematic geological cross section through Mauritanian coastal basin<br />
58. 3D view top Upper Jurassic-Earliest Cretaceous carbonate platform margin, offshore Mauritania<br />
Gulf of Mexico<br />
59. Map and general stratigraphy of the Jurassic- Cretaceous succession, Gulf of Mexico<br />
60. Structural setting of the Upper Jurassic, central Gulf of Mexico region<br />
61. Stratigraphic relationships and lithologies of the upper Jurassic, central Gulf of Mexico region<br />
62. Areal extent, lithologies and facies distribution of the Smackover Formation<br />
63. Upper Smackover Formation trap types<br />
64. Map of the Pimienta-Tamabra(!) trend<br />
65. Pimienta-Tamabra(!) Events Timing Chart<br />
66. Map of Tuxpan area oil and gas fields<br />
67. Schematic of Mid-Cretaceous Pimienta-Tamabra(!) carbonate reservoir facies<br />
Western <strong>Canada</strong><br />
68. Schematic cross section, Upper Devonian Woodbend-Winterburn Groups, WCSB<br />
69. Redwater oil field, central Alberta<br />
70. Clarke Lake gas field, northeast British Columbia<br />
71. Caroline gas field, southwest Alberta<br />
72. Field Size Distribution - Swan Hills and Slave Point bank margins<br />
Chapter 7 – Abenaki Bank Edge Segmentation<br />
Panuke Segment<br />
73. Isometric 3D image of the regional top Jurassic (~Abenaki 7)<br />
74. Isometric 3D image of the Abenaki 6 horizon (depth map / coarse gridding), view to the west<br />
75. Isometric 3D image of the Abenaki 6 horizon (depth map / fine gridding), view to the north<br />
76. Isometric 3D image of the Abenaki 6 horizon (depth map / fine gridding), view to the west<br />
77. Isometric 3D image of the Abenaki 6 horizon (depth map / coarse gridding), view to the north<br />
78. Near Basement Morphology, Lower Jurassic horizon time map<br />
79. Detailed seismic profile – Cohasset D-42<br />
80. Detailed seismic profile – Demascota G-32<br />
81. Detailed seismic profile – Penobscot L-30<br />
82. Detailed seismic profile – Cohasset L-97<br />
83. Detailed seismic profile – Deep Panuke Discovery PP-3C<br />
84. Detailed seismic profile – Deep Panuke P1-1A/1B, first appraisal well<br />
85. Detailed seismic profile – Deep Panuke H-08, second appraisal well<br />
86. Detailed seismic profile – Deep Panuke M79A, third appraisal well<br />
87. Detailed seismic profile – Panuke F-09<br />
88. Detailed seismic profile – Musquodoboit E-23<br />
89. Detailed seismic profile – Queensland M-88<br />
90. Detailed seismic profile – Marquis L-35<br />
6
91. Detailed seismic profile – Margaree F-70, fourth appraisal well<br />
92. Detailed seismic profile – MarCoh D-41, fifth appraisal well<br />
93. <strong>Petroleum</strong> System Events Timing Chart – Panuke Segment<br />
Acadia Segment<br />
94. Detailed seismic profile – Acadia K-62<br />
95. Detailed seismic profile – Albatross B-13<br />
96. Detailed seismic profile – Bonnet P-23<br />
97 Seismic profile – Southwestern limit of TGS NOPEC survey<br />
98. Seismic profile – Rotated fault block<br />
99. Seismic profile – Longitudinal erosion, Base Tertiary<br />
100. Seismic profile – Eroded bank edge<br />
101. Seismic profile – Bank edge and salt<br />
102. Seismic profile – Salt intersection with bank edge<br />
103. Seismic profile – Faulted margin<br />
104. Seismic profile – Down-slope mound<br />
105. Seismic profile – Fault precursor<br />
106. Seismic profile – Rimmed margin<br />
107. Seismic profile – Faulted bank<br />
108. Seismic profile – High relief bank margin<br />
109. Seismic profile – Example of bank margin imaging at the eastern end of the TGS survey<br />
110. <strong>Petroleum</strong> System Events Timing Chart – Acadia Segment<br />
Shelburne Segment<br />
111. Seismic profile – Faulted sigmoidal bank margin profile<br />
112. Seismic profile – Faulted bank margin with salt piercement<br />
113. Seismic profile – Interior platform salt piercement<br />
114. Seismic profile – Salt disruption of bank edge<br />
Pl4tform Interior<br />
115. Regional seismic line across Oneida O-25<br />
116. Detailed seismic profile- Oneida O-25<br />
117. Detailed seismic profile – Kegeshook G-67<br />
118. Seismic profile – Abenaki J-56<br />
119. Detailed seismic profile – Mohican I-100<br />
120. Regional seismic line across Moheida P-13 and Glooscap C-63<br />
121. Detailed seismic profile – Moheida P-13<br />
122. Detailed seismic profile – Glooscap C-63<br />
123. Seismic profile – Como P-21<br />
124. Seismic profile – Dover A-43<br />
Chapter 8 – Geochemistry of Abenaki Bank<br />
125. Abenaki petroleum systems schematic drawing<br />
LIST OF TABLES<br />
Table 1. Chronological List of Abenaki Formation Exploration Wells.<br />
Table 2. Chronological List of Deep Panuke Abenaki Discovery and Delineation Wells<br />
Table 3. Deep Panuke Well Reservoir Data<br />
Table 4. Deep Panuke Drill Stem Test Data<br />
Table 5. MMS 2000 Assessment, U.S. Atlantic Mesozoic Margin: Ultimate Recoverable Reserves<br />
Table 6. USGS 2000 Assessment, Smackover Formation – Discovered Resources.<br />
Table 7. USGS 2000 Assessment, Smackover Formation – Undiscovered Potential.<br />
Table 8. Panuke Segment – Wells and Shows<br />
Table 9. Acadia Segment – Wells and Shows<br />
Table 10. Comparative Summary of Abenaki Bank Edge Segments.<br />
Table 11. GSC 1989 Assessment: Carbonate Bank Play.<br />
7
EXECUTIVE SUMMARY<br />
This study documents the geology of the Upper Jurassic Abenaki Formation carbonate platform located<br />
along the edge of the continental margin, offshore <strong>Nova</strong> <strong>Scotia</strong>. The study area extends for 650<br />
kilometres from Sable Island southwest to the U.S. border.<br />
During Upper Jurassic time, the circum-North Atlantic was fringed by carbonate platforms and related<br />
facies. Within the Abenaki offshore <strong>Nova</strong> <strong>Scotia</strong>, three main depositional facies are recognized; an inner<br />
low energy shelf, an outer high energy shelf including the bank edge, and a deeper water foreslope.<br />
Analogues to the Abenaki are similar aged strata along the U.S. Atlantic margin, on the conjugate margin<br />
offshore Morocco, and both U.S. and Mexican Gulf of Mexico.<br />
Based on geological characteristics, the <strong>Nova</strong> <strong>Scotia</strong>n Abenaki carbonate platform and margin<br />
succession is subdivided into three segments along the trend: Panuke, Acadia and Shelburne.<br />
The Panuke Segment is 120 km long and lies adjacent to the Sable Sub-Basin and includes EnCana’s<br />
Deep Panuke gas discovery made on the bank edge in 1999. This area has 14 of the 21 exploration<br />
wells, seven on the bank edge, six in the back-reef and one on the foreslope. The latest 3D seismic<br />
surveys were used for detailed mapping in time and depth. The Cohasset/Panuke oil production<br />
(44MMB) was from Cretaceous sands draped over the bank edge.<br />
The Acadia Segment extends 400 km from the edge of the Sable area to the Northeast Channel adjacent<br />
to George’s Bank. The modern 2D regional seismic survey by TGS-NOPEC was used. Unlike the<br />
Panuke area this segment is faulted, eroded and intruded by salt but the presence of reefal facies bodes<br />
well for likely reservoir development. There are seven wells in this area, three on the bank edge and four<br />
in the back-reef with no discoveries but with reservoir and mud-gas shows.<br />
The Shelburne Segment is about 120 km long and includes the George’s Bank Moratorium area and<br />
extends to the U.S. border. This area is the least understood because of dated 1970 and 1980 seismic<br />
and a lack of wells.<br />
From 1970 to the present (2004), there have been 28 wells drilled on the Abenaki Platform in the study<br />
area: ten bank edge wildcats, seven delineation wells at the Deep Panuke field and 11 other wells either<br />
landward or basinward. Only two wells were drilled in the Abenaki along the U.S. margin in the late<br />
1970s and early 1980’s but without success. On the conjugate Moroccan margins several wells<br />
encountered oil shows but none of commercial value. To date, the prolific Mexican “Golden Lane” trend<br />
in the western Gulf of Mexico is the only region with production from carbonate bank margins in<br />
the circum -Atlantic realm.<br />
8
1. INTRODUCTION AND SCOPE OF STUDY<br />
This study documents the <strong>Canada</strong>-<strong>Nova</strong> <strong>Scotia</strong><br />
<strong>Offshore</strong> <strong>Petroleum</strong> <strong>Board</strong>’s* seismic and<br />
geologic study of the Upper Jurassic carbonate<br />
bank margin offshore <strong>Nova</strong> <strong>Scotia</strong> from Sable<br />
Island to the U.S. border. The Abenaki was<br />
compared to analogues from the circum-North<br />
Atlantic region including the United States,<br />
Northwest Africa and Mexico. The global map<br />
(Figure 1) shows the traditional continental fit of<br />
North America between the Bahamas and the<br />
Grand Banks to Africa from Morocco to Sierra<br />
90°0'0"W<br />
90°0'0"W<br />
60°0'0"W<br />
<strong>Nova</strong> <strong>Scotia</strong><br />
60°0'0"W<br />
Leone. More specifically is the conjugate<br />
continental margin comparison of offshore <strong>Nova</strong><br />
<strong>Scotia</strong> from the Grand Banks to the New<br />
England chain of seamounts relative to the<br />
equivalent margin off Morocco from Gibralter<br />
south to the Canary Islands. The present-day<br />
North American continental shelf is broad<br />
compared to the narrow shelf of Northwest<br />
Africa. During Middle-Upper Jurassic time, the<br />
former area including the Gulf of Mexico was<br />
rimmed by a carbonate-prone continental shelf.<br />
30°0'0"W<br />
60°0'0"N 60°0'0"N<br />
30°0'0"N 30°0'0"N<br />
µ<br />
Togo<br />
0°0'0"N 0°0'0"N<br />
30°0'0"W<br />
0°0'0"E<br />
0°0'0"E<br />
0 500 1,000 2,000 3,000 4,000 5,000<br />
Kilometers FIGURE 1<br />
Figure 1. Location map of the circum-Central and North Atlantic region. Dark lines follow oceanic<br />
fracture zones that show relationships to the respective conjugate margins.<br />
A map of the <strong>Scotia</strong>n Basin illustrates the<br />
components of the basin from the Yarmouth<br />
Arch in the southwest to the Avalon Uplift of the<br />
Grand Banks in the northeast, a distance of<br />
1200 km (Figure 2). The Jurassic carbonate<br />
shelf is a major component of the <strong>Scotia</strong>n Basin<br />
and it extends in a non-linear fashion across the<br />
basin. The carbonate shelf profile changes<br />
dramatically just north of Sable Island from<br />
steeply-dipping in the southwest to a low-angle<br />
ramp in the northeast. The steeply-dipping bank<br />
edge or rimmed margin of the Jurassic Abenaki<br />
Formation from Sable Island to the U.S. border<br />
will be the subject of this study.<br />
9
72°W<br />
48°N<br />
46°N<br />
44°N<br />
42°N<br />
40°N<br />
72°W<br />
70°W<br />
70°W<br />
ª ª<br />
ª ª<br />
ª ª ª<br />
ª<br />
68°W<br />
68°W<br />
Yarmouth Arch<br />
Quebec<br />
New Brunswick<br />
ª<br />
ª<br />
ª ª * ª<br />
Prince Edward ª Island<br />
ª ª<br />
ª<br />
ª<br />
ª<br />
ª<br />
ª ª ª<br />
ª<br />
ª<br />
µ µ ª ª ª ª<br />
ª µ ª ª ª ª<br />
+<br />
ª ª ª ª ª<br />
ª<br />
0 +<br />
ª ª<br />
ª ª ª<br />
+ +<br />
ª * *<br />
** + +<br />
ª '<br />
ª ' 'ª<br />
ª 1ª ª ª 1<br />
+<br />
+ ª<br />
ª ª + ª + ª<br />
ª<br />
ª +<br />
ª<br />
* ª<br />
ª ª * *<br />
ª ª ª<br />
ª ª<br />
ª<br />
ª<br />
ª<br />
ª<br />
ª ª<br />
ª<br />
* *<br />
* **<br />
* *<br />
*<br />
* **<br />
*<br />
ª "<br />
Orpheus<br />
"<br />
Laurentian<br />
<strong>Nova</strong> <strong>Scotia</strong><br />
Abenaki<br />
Penobscot<br />
Marquis<br />
"<br />
+<br />
ª "<br />
Panuke *<br />
"<br />
ª<br />
*" *+ "<br />
*<br />
Musquodoboit "<br />
"<br />
Acadia " "<br />
Bonnet<br />
"<br />
Albatross<br />
66°W<br />
66°W<br />
64°W 62°W<br />
LaHave<br />
Platform<br />
Jurassic Bank Edge<br />
³<br />
64°W<br />
62°W<br />
60°W<br />
ª<br />
ª<br />
++<br />
Deep Water Slope<br />
Kilometers<br />
60°W<br />
58°W<br />
0 200 400<br />
Newfoundland And Labrador<br />
Abenaki<br />
58°W<br />
56°W<br />
56°W<br />
54°W<br />
ª<br />
ª<br />
52°W<br />
Avalon Uplift<br />
S. Whale<br />
54°W<br />
50°W<br />
<strong>Scotia</strong>n Basin<br />
Outline and Components<br />
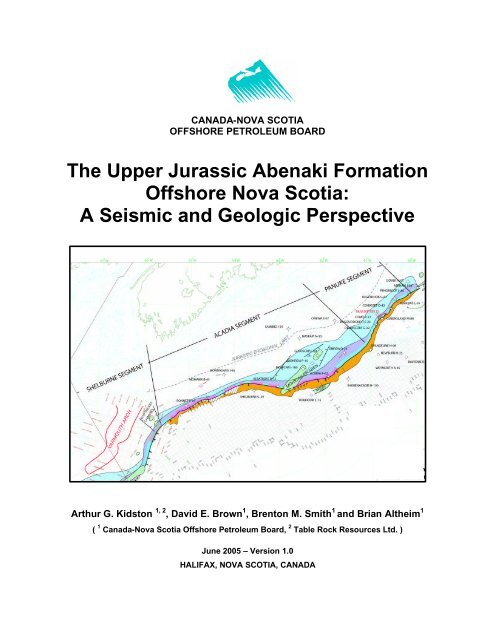
Figure 2. The <strong>Scotia</strong>n Basin, its subbasins and related tectonic elements. Significant Abenaki wells are<br />
highlighted.<br />
The Upper Jurassic Abenaki Formation is<br />
divided into four members and in ascending<br />
order are the Scatarie, Misaine, Baccaro and<br />
Artimon. Based on our study of the bank margin<br />
and its physical attributes, the Abenaki bank<br />
margin can be subdivided into three areal<br />
segments; from the northeast to the southwest<br />
they are termed the Panuke, Acadia and<br />
Shelburne Segments. The study areas extend<br />
from the platform interior on the shallow <strong>Scotia</strong>n<br />
Shelf to the margin foreslope in deepwater on<br />
the <strong>Scotia</strong>n Slope (Figure 3).<br />
The bank edge reef facies of the Abenaki<br />
carbonate margin was first drilled in 1973. While<br />
the carbonate target was dry, an oil discovery<br />
was made in shallower overlying draped sands<br />
of the Upper Cretaceous Logan Canyon<br />
Formation. This discovery was eventually<br />
Sable<br />
52°W<br />
48°N<br />
50°W<br />
46°N<br />
44°N<br />
42°N<br />
40°N<br />
developed and became part of the<br />
Cohasset/Panuke oil project that produced 44.4<br />
million barrels (MMB) of light gravity crude from<br />
1992 – 1999. Since 1973, another ten<br />
exploration wells were drilled on features along<br />
the bank margin resulting in a single gas show<br />
until PanCanadian (EnCana) discovered the<br />
Deep Panuke field in 1999.<br />
Analogue carbonate margins off northwest<br />
Africa and the U.S. Atlantic margin were used<br />
for same-age comparisons. The Middle<br />
Cretaceous carbonates of Northeast Mexico as<br />
well Western <strong>Canada</strong> Sedimentary Basin<br />
(WCSB) Devonian systems were also<br />
compared. While there are producing Jurassicage<br />
carbonate platforms in the world, there are<br />
no known significant Upper Jurassic carbonate<br />
bank edge producing regions.<br />
10
Figure 3. Location map of Abenaki study area, offshore <strong>Nova</strong> <strong>Scotia</strong>. Red lines indicate gas pipelines.<br />
Cross-hatched areas define exploration moratorium (SW) and marine protected areas (NE) respectively.<br />
Land block licenses: EL – exploration, PL – production, SDL - significant discovery.<br />
With a single significant commercial<br />
hydrocarbon discovery off <strong>Nova</strong> <strong>Scotia</strong> and none<br />
encountered off the U.S. or Morocco margins,<br />
the success factors of this play remain to be<br />
determined. The variable quantity and quality of<br />
relevant datasets inhibit a comprehensive<br />
numerical analysis of the entire platform and<br />
margin succession. Additional seismic data,<br />
well results and future discoveries are required<br />
to better understand and more accurately<br />
quantify the resource potential of the Abenaki<br />
carbonate margin and equivalent plays offshore<br />
<strong>Nova</strong> <strong>Scotia</strong>, Morocco and the United States.<br />
* <strong>Here</strong>in referred to as “the <strong>Board</strong>” or<br />
“CNSOPB”.
A number of geological and geophysical data<br />
sources were used in the preparation of this<br />
study. Well data is sourced from both existing<br />
(public) and recently drilled (proprietary)<br />
exploration and delineation wells held in the<br />
CNSOPB Archives. Confidentiality periods<br />
range from 90 days (delineation wells) to two<br />
years (exploration wells) from the date of the rig<br />
release from the well site. The seismic data is of<br />
variable vintage, quality and coverage, ranging<br />
from 1970’s vintage programs in the Shelburne<br />
Segment to the latest proprietary 3D surveys in<br />
the Panuke Segment. Given this mix of public<br />
and confidential data, strict editing was required<br />
to prepare this report for release into the public<br />
domain (see Confidentiality Clause). Finally, a<br />
number of definitive papers from the late 1970’s<br />
and early 1990’s are briefly reviewed as they<br />
form the basis for most of the current<br />
understanding of the Abenaki Formation and<br />
Deep Panuke field. Well and seismic line and<br />
program locations are shown in Figure 4.<br />
2.1 Wells<br />
Twenty-eight exploration wells were drilled on<br />
the carbonate margin from Sable Island to the<br />
U.S. border. Of these, 10 are defined as bankedge<br />
new field wildcats (NFW), seven as<br />
existing field delineation wells (all at Deep<br />
Panuke) and 11 as off-reef wells, i.e. landward<br />
on the shallow interior platform or seaward on<br />
the deep foreslope.<br />
On the U.S. Atlantic Margin, a total of 54 wells<br />
were drilled to test various structures and play<br />
types similar to those encountered on the <strong>Nova</strong><br />
<strong>Scotia</strong> margin (Figure 5). Five industrysponsored<br />
COST wells (Continental <strong>Offshore</strong><br />
Stratigraphic Test) were drilled in 1976-77 and<br />
were then followed by 49 exploration wells<br />
drilled between 1981 and 1984. The chronology<br />
of exploration is important because the<br />
acquisition of data and the objectives and<br />
subsequent results of each well is a learning<br />
experience. The wells provide data on basic<br />
lithology, stratigraphy, ages, and most<br />
importantly identifying and quantifying the<br />
petroleum systems elements and the viability of<br />
the different play types. For example, in order to<br />
understand the controlling factors of existing and<br />
potential hydrocarbon accumulations in the<br />
Abenaki carbonate margin off <strong>Nova</strong> <strong>Scotia</strong>, it is<br />
2. DATABASE<br />
important to know the results of the 54 wells<br />
drilled in equivalent strata in American waters.<br />
Surprisingly, only two of those wells tested the<br />
Abenaki equivalent reefal facies.<br />
For wells offshore <strong>Nova</strong> <strong>Scotia</strong>, publiclyaccessible<br />
well data in the <strong>Board</strong>’s Data<br />
Archives provided information such as logs,<br />
cores, cuttings, etc. The well data files were<br />
consulted to identify any minor shows, mud-gas<br />
anomalies, etc. that could further assist in the<br />
evaluation of the Abenaki petroleum systems<br />
(see Section 3.2).<br />
2.2 Seismic<br />
A variety of seismic surveys were available for<br />
use in this study, ranging from an old 1974 2D<br />
program shot on the George’s Bank to the very<br />
latest 3D acquired in 2003 over the Panuke<br />
Field. The following 2D surveys were studied<br />
and digital data from selected programs were<br />
used for mapping purposes. All digital datasets<br />
were interpreted on a Sun workstation using<br />
Geoquest software. CNSOPB Program<br />
Numbers are indicated in brackets. Some of this<br />
seismic data is confidential and could only be<br />
shown where permission from the owner has<br />
been obtained.<br />
GSI, 2001 (Marquis Survey) – 2100 km, 120-<br />
Fold (NS24-G05-04P)<br />
This recently-obtained survey completed the<br />
seismic coverage from the 3D coverage over the<br />
Panuke area to the Penobscot wells in the<br />
northeast and to the limit of the steep-banked<br />
carbonate margin.<br />
TGS-NOPEC, 1998-1999 – 30,000 km, 80-Fold<br />
(NS24-G65-01P<br />
This survey was used for the <strong>Board</strong>’s 2002<br />
deep-water study and had sufficient bank edge<br />
crossings (47 lines) from southwest of Bonnet P-<br />
23 near the Northeast Channel to the edge of<br />
the Sable Subbasin near Evangeline H-98. Data<br />
quality is from good to excellent but there are<br />
places where the bank edge is poorly imaged<br />
and the lines are too short. The data processing<br />
employed post-stack time migration.<br />
12
45<br />
G-1<br />
133<br />
312<br />
357<br />
46<br />
975<br />
G-2<br />
273<br />
145<br />
187<br />
410<br />
113<br />
47<br />
MOHAWK B-43<br />
BONNET P-23<br />
114<br />
97<br />
111<br />
112<br />
MONTAGNAIS I-94<br />
98<br />
23, 96<br />
MOHICAN I-100<br />
ALBATROSS B-13<br />
99<br />
SHELBURNE G-29<br />
SAMBRO I-29<br />
NASKAPI N-30<br />
119<br />
18, 108<br />
22,94<br />
107<br />
17,106<br />
105<br />
100<br />
101<br />
102103<br />
104<br />
19, 95<br />
##<br />
OJIBWA E-07<br />
ACADIA ACADI ACADIA ACADI ACADIA ACADI K-62<br />
123<br />
ONEID ONEIDA O-25<br />
120, 121, 122<br />
GLOOSCAP GLOOSCA GLOOSCAP P C-63<br />
MOHEIDA MOHEID P-15<br />
115, 116<br />
Seismic Lines shown in report (figure #)<br />
109<br />
117<br />
TGS-NOPEC 2D; 1998-1999<br />
Marquis 2D; 2003<br />
PENOBSCOT L-30<br />
KEGESHOOK G-67<br />
COHASSET D-42<br />
COMO P-21<br />
EnCana 3Ds; 2000-2002<br />
SHUBENACADIE H-100<br />
Lithoprobe (GSC) 2D; 1988<br />
EVANGELINE H-98<br />
124<br />
DOVER A-47<br />
ABENAKI J-56<br />
118<br />
MARQUIS L-35<br />
COPAN fields<br />
QUEENSLAND M-88<br />
MUSQUODOBOIT E-23<br />
DEMASCOTA G-32<br />
<strong>Canada</strong> - <strong>Nova</strong> <strong>Scotia</strong> O ffshore<br />
<strong>Petroleum</strong> <strong>Board</strong><br />
Western 2D; 1985<br />
JEBCO 2D; 1984<br />
DIGICON 2D; 1974<br />
Key Wells<br />
Figure 4. Well and seismic base map. Locations of seismic lines illustrated in this study are identified and indicated as heavy brown lines.
OFFSHORE NOVA SCOTIA DRILLING - Upper Jurassic Carbonate Platform, Western Shelf<br />
(Based on Rig Release)<br />
Expl Deln Off-reef Exploration (Bank Edge) Delineation Off-Reef<br />
1970 1 Oneida O-25<br />
71 1 Abenaki J-56<br />
72 1 Mohican I-100<br />
73 1 Cohasset D-42<br />
74<br />
75<br />
1 Demascota G-32<br />
76 1 US Atlantic Margin Penobscot L-30<br />
77 1 5 COST Wells Moheida P-15<br />
78<br />
79<br />
1980<br />
2 Acadia K-62, Cohasset L-97<br />
81 US Atlantic Margin<br />
82 49<br />
83 Exploration<br />
84 1 2 Bonnet P-23 Wells Glooscap C-63, Dover A-43<br />
85 1 1 Albatross B-13 Kegeshook G-67<br />
86 1 Panuke B-90<br />
87<br />
88<br />
89<br />
1990<br />
91<br />
92<br />
93<br />
94<br />
95<br />
96<br />
97<br />
98<br />
1 Como P-21<br />
99 1 1 Deep Panuke PP-3C (J-99) Panuke P1-1A (J-99)<br />
2000 3 1 Panuke M-79/M-79A, Panuke H-08 Panuke F-09<br />
1 1 1 Musquodoboit E-23 Panuke P1-1B (J-99)<br />
2 1 1 Marquis L-35 Queensland M-88<br />
3<br />
4<br />
2 Margaree F-70, MarCoh D-41<br />
5<br />
5<br />
Totals 10 7 11<br />
Total All 28<br />
4<br />
3<br />
2<br />
1<br />
0<br />
1970<br />
72<br />
74<br />
76<br />
78<br />
1980<br />
82<br />
84<br />
86<br />
88<br />
1990<br />
92<br />
94<br />
96<br />
98<br />
2000<br />
2<br />
4<br />
Off-reef<br />
Deln<br />
Expl<br />
Figure 4<br />
Figure 5. Chronology of exploration and delineation drilling in the Abenaki Formation, offshore <strong>Nova</strong><br />
<strong>Scotia</strong>.<br />
GEOLOGICAL SURVEY OF CANADA<br />
(WESTERN), 1988, - 350 km, 30 Fold (AGC 88-<br />
1 & 88-1A)<br />
A deep crustal seismic line (25 seconds TWT)<br />
was shot by the GSC extending from the coast<br />
of <strong>Nova</strong> <strong>Scotia</strong> out into the deep abyssal plain.<br />
Digital data and paper sections were used to
assist in regional and well correlations, definition<br />
of basement architecture, structural styles,<br />
timing of tectonic events and deep water<br />
stratigraphy.<br />
WESTERN, 1985 – 40-Fold (8624-W013-004P)<br />
Several lines were used to fill in gaps between<br />
the TGS and Jebco surveys. Available paper<br />
sections were interpreted and digitized into the<br />
mapping program.<br />
JEBCO, 1984 – 6800 km, 60-Fold (8624-J13-<br />
001P)<br />
This 1983 survey covered what became the<br />
“George’s Bank” Moratorium Area and covered<br />
from where the TGS survey ended to the US<br />
border. Data quality is variable from good to<br />
very good however the bank edge imaging is<br />
degraded because it lies beneath the presentday<br />
continental slope which is highly eroded in<br />
places. Only paper sections were available for<br />
interpretation and digitizing into the mapping<br />
program.<br />
DIGICON, 1974 – 36-Fold (8624-D001-005P)<br />
A regional line reproduced from microfiche was<br />
required to make the important 300 km<br />
correlation between the Canadian Mohawk B-93<br />
and American Exxon Block 975, No.1 wells.<br />
Paper sections were interpreted and digitized<br />
into the mapping program. In addition, a<br />
number of lines from the American side of the<br />
border were obtained from the GSC but are part<br />
of the same project number above.<br />
PANCANADIAN / ENCAN - Three proprietary<br />
3D surveys were used covering the Panuke<br />
Segment:<br />
Huckleberry– PanCanadian, 1998<br />
Abenaki – PanCanadian, 2001<br />
Part of EL2356 – EnCana, 2002<br />
2.3 Key Papers<br />
There are numerous volumes written on<br />
carbonate platform and reef margin geology<br />
worldwide and several excellent AAPG Memoirs<br />
on the subject, but for the local <strong>Scotia</strong>n Basin<br />
Abenaki Formation one is limited to a few but<br />
excellent significant papers that follow the<br />
evolution of knowledge of the <strong>Scotia</strong>n Basin and<br />
the Jurassic carbonate platform within the basin.<br />
Although these are “must-read” papers, they are<br />
nonetheless dated given the number of new<br />
wells and seismic data now available. It is<br />
interesting to note that while the earliest<br />
research was limited to data from but a handful<br />
of industry wells, geoscientists formulating the<br />
framework and evolution of Atlantic-style<br />
tectonically stable passive margins intuitively<br />
postulated that such margins would include<br />
Jurassic age carbonate platforms. The following<br />
are brief notes on eight key papers listed in<br />
chronological order with full citations appearing<br />
in the References.<br />
(1) N. L. McIver, Shell <strong>Canada</strong>, 1972<br />
“Cenozoic and Mesozoic Stratigraphy of<br />
the <strong>Nova</strong> <strong>Scotia</strong> Shelf”<br />
For the first time the offshore <strong>Nova</strong> <strong>Scotia</strong><br />
Cenozoic – Mesozoic stratigraphy was defined<br />
and nomenclature proposed. The first<br />
stratigraphic schematic cross-section was also<br />
presented and this paper became the<br />
cornerstone for all subsequent work. By 1972<br />
the carbonate platform had been penetrated by<br />
several wells including the Shell Oneida O-25<br />
which became the type section for the Abenaki<br />
Formation. Although the carbonate bank-edge<br />
reefal facies had not yet been penetrated, the<br />
regional seismic surveys revealed the margin’s<br />
existence.<br />
(2) Don Sherwin, Energy, Mines & Resources<br />
<strong>Canada</strong>, 1973<br />
“<strong>Scotia</strong>n Shelf and Grand Banks”<br />
This is an excellent paper on the eastern region<br />
of the Atlantic offshore embracing both the<br />
<strong>Scotia</strong> Shelf and the Grand Banks of<br />
Newfoundland. The history of earth science for<br />
the region is documented including the early<br />
efforts of American and Canadian geological<br />
research. For the first time, maps were<br />
published on basin fill, paleogeography, extent<br />
of salt and carbonates, and Cretaceous<br />
drainage concepts plus regional scale geological<br />
cross-sections. The paper was also the first to<br />
discuss volumetric estimates of hydrocarbon<br />
potential for the various shelf, slope and rise<br />
areas.<br />
(3) Lubomir F. Jansa and John A. Wade, 1974<br />
“Geology of the Continental Margin off<br />
<strong>Nova</strong> <strong>Scotia</strong> and Newfoundland”<br />
This was the first comprehensive Geological<br />
Survey of <strong>Canada</strong> paper on the East Coast<br />
offshore region and contained significant<br />
number of cross-sections, maps and<br />
stratigraphic descriptions that greatly advanced<br />
the sub-surface understanding of both the<br />
<strong>Scotia</strong>n and East Newfoundland Basins.<br />
However, the only bank-edge wells of the time,<br />
15
Mobil Cohasset D-42 and Shell Demascota G-<br />
32 were not publicly available for study.<br />
(4) Mary M. Given, Shell <strong>Canada</strong> Ltd. 1977<br />
“Mesozoic and Early Cenozoic Geology<br />
of <strong>Offshore</strong> <strong>Nova</strong> <strong>Scotia</strong>”<br />
Given discussed sedimentation on the <strong>Nova</strong><br />
<strong>Scotia</strong> Shelf since Late Triassic in the context of<br />
Falvey’s (1974) plate tectonics model for an<br />
Atlantic-type continental margin. She had at her<br />
disposal 33 Shell wells plus 8 competitor wells<br />
and a 75,000 km seismic grid from which 7<br />
major seismic events were correlated and<br />
mapped. It is interesting to note that while only<br />
two Abenaki bank-edge wells existed (Shell<br />
Demascota G-32 and Mobil Cohasset D-42),<br />
Shell’s vast seismic database permitted Given to<br />
describe the massive Baccaro limestone shelfedge<br />
complex and advance basin understanding<br />
from earlier work by Jansa and Wade, Sherwin,<br />
and McIver.<br />
(5) Leslie J. Eliuk, Shell <strong>Canada</strong> Ltd. 1978<br />
“The Abenaki Formation, <strong>Nova</strong> <strong>Scotia</strong><br />
Shelf, <strong>Canada</strong> – A Depositional and<br />
Diagenetic Model for a Mesozoic<br />
Carbonate Platform”<br />
Eliuk’s research was undertaken about the same<br />
time as Given’s but concentrated solely on the<br />
Abenaki Formation. His work is a landmark<br />
study, being a detailed examination of the<br />
stratigraphy, paleontology, paleogeography,<br />
lithofacies and diagenesis of the entire Abenaki<br />
Formation. Included is an Abenaki facies<br />
template, core analysis and core photos and<br />
descriptions. Using the existing carbonate<br />
platform wells and Shell’s extensive seismic<br />
database, Eliuk was able to extrapolate across<br />
the bank margin and prepare a suite of regional<br />
maps that even today remain extremely useful.<br />
He also interpreted depositional sequences<br />
relative to eustatic sea-level fluctuations for<br />
insights into subaerial exposure and porosity<br />
enhancement. He identified a key factor for<br />
exploration with the identification of Abenaki<br />
paleo-highs on which the likelihood of subaerial<br />
exposure and porosity enhancement is<br />
increased.<br />
(6) Lubomir F. Jansa, Geological Survey of<br />
<strong>Canada</strong>,, 1981<br />
“Mesozoic Carbonate Platforms and<br />
Banks of the Eastern North American Margin”<br />
As more industry wells and data became<br />
available from offshore <strong>Canada</strong> and the U.S.,<br />
the extent of the Jurassic carbonate margin from<br />
the Grand Banks to the Bahamas was<br />
recognized. Key observations are discussed,<br />
such as the carbonate margin younging<br />
southward to the Bahamas where it still thrives<br />
today. A global observation was that coeval<br />
Tethyan bank edges were involved in Alpine<br />
orogenesis whereas the Atlantic margin was<br />
tectonically stable and hence preserved.<br />
(7) John A. Wade, Geological Survey of<br />
<strong>Canada</strong> - Atlantic, 1990<br />
“Part 1: The Stratigraphy of George’s<br />
Bank Basin and Relationships to the <strong>Scotia</strong>n<br />
Basin”<br />
“Part 2: Aspects of the Geology of the<br />
<strong>Scotia</strong>n Basin from Recent Seismic and Well<br />
Data”<br />
This is a comprehensive update of the <strong>Scotia</strong>n<br />
Basin by the GSC incorporating four additional<br />
Abenaki bank edge wells that improved<br />
understanding of the stratigraphy and facies of<br />
the Abenaki Formation. The study extended to<br />
the southwest to include the Shelburne<br />
Subbasin (George’s Bank area).<br />
(8) Lubomir F. Jansa, Geological Survey of<br />
<strong>Canada</strong> - Atlantic, 1993<br />
“Early Cretaceous Carbonate Platforms<br />
of the Northeastern North American Margin”<br />
This is an excellent summary of then-current<br />
thinking on the Early Cretaceous carbonate<br />
successor facies to the extensive Jurassic<br />
carbonate platform complex. Jansa discusses<br />
the platform facies distribution, carbonate<br />
platform geometries and finally platform<br />
drowning.<br />
16
Exploration on the carbonate platform has<br />
undergone three cycles of exploration drilling<br />
since Shell drilled Oneida O-25 in 1970 looking<br />
for draped reservoir over a basement high. This<br />
was followed by two more platform wells by<br />
Shell (Abenaki J-56, Mohican I-100) which were<br />
then followed by Mobil who drilled Cohasset D-<br />
42 on the bank margin in 1973 (Figure 5, Table<br />
1). Three more bank edge wells were drilled at<br />
Demascota G-32 (Shell), Acadia K-62 (Chevron)<br />
and Cohasset L-97 (Mobil) along with the<br />
foreslope Penobscot L-30 and the platform<br />
interior Moheida P-15 wells both drilled by Petro-<br />
<strong>Canada</strong> & Shell.<br />
A six year hiatus in Canadian drilling of the<br />
margin ensued following the aforementioned<br />
wells. During this time, industry aggressively<br />
explored the American Atlantic Margin drilling a<br />
total of 49 exploratory wells and five COST wells<br />
(Continental <strong>Offshore</strong> Stratigraphic Test) mostly<br />
on the shelf. Only two closely spaced wells<br />
targeted features on the Jurassic bank edge in<br />
the Baltimore Canyon area (see Section 5.1 for<br />
detailed descriptions).<br />
In 1984-85, Petro-<strong>Canada</strong> drilled the Bonnet P-<br />
23 and Albatross B-13 wells without success.<br />
Four platform interior wells were drilled on<br />
structures during this period: Glooscap C-63<br />
(Husky), Dover A-43 (Petro-<strong>Canada</strong>),<br />
Kegeshook G-67 (Shell) and Como P-21 (Petro-<br />
<strong>Canada</strong>), again without success.<br />
In 1986 Shell drilled the Panuke B-90 well which<br />
only penetrated about 300 m of the Abenaki<br />
(Bacarro Member) limestone. However, while<br />
the Abenaki reservoirs were tight, light gravity<br />
(~55ºAPI) oil was discovered in overlying sands<br />
of the Early Cretaceous Logan Canyon<br />
Formation in a shallow structural closure draped<br />
over the underlying reef margin. Details on the<br />
Cohasset-Panuke oil fields can be found in<br />
Section 7.1.<br />
For the next 12 years there was no exploration<br />
activity on the bank margin until 1999 when<br />
PanCanadian (now EnCana) drilled an Abenaki<br />
prospect beneath the shallow Panuke oil field<br />
from the Panuke J-99 production platform. The<br />
Deep Panuke gas discovery well, PP-3C,<br />
encountered approximately 75 metres net pay of<br />
vuggy and cavernous limestones and dolomites<br />
3. EXPLORATION HISTORY<br />
and tested between 50-55 MMcf/d gas from the<br />
Abenaki 5 interval (Baccaro Member). Seven<br />
delineation wells were drilled following the<br />
discovery.<br />
Since 1999, four more wildcats were drilled all in<br />
the vicinity of Deep Panuke targeting the<br />
Abenaki: two bank-edge wells - EnCana<br />
Musquodoboit E-23 and Canadian Superior<br />
Marquis L-35; one back-reef well EnCana F-09;<br />
and one fore-reef well, EnCana Queensland M-<br />
88. All were subsequently abandoned.<br />
3.1 Drilling Results to Date<br />
For the discussions that follow, the emphasis will<br />
be on the 10 bank-edge wildcats, and the two<br />
off-reef wells - Panuke F-09 and Queensland M-<br />
88 respectively. This focus reflects the natural<br />
bias to the success at Deep Panuke with the<br />
discovery of commercial quantities of gas in the<br />
margin reefal facies. The availability of new 2D<br />
and 3D seismic datasets facilitates the study.<br />
The aforementioned 12 wells are also listed in<br />
Figure 5 with generalized comments on their<br />
results which are further expanded in Section<br />
3.2. Information from the remaining nine wells<br />
that penetrated the Abenaki Formation, located<br />
on the platform interior was also used in this<br />
assessment. Potential plays also exist in the<br />
carbonates of the underlying Middle Jurassic<br />
Scatarie Member (Abenaki Formation) and Early<br />
Jurassic Iroquois Formation.<br />
Notwithstanding the success at Deep Panuke,<br />
industry has yet to aggressively pursue the<br />
bank-edge play along most of the <strong>Scotia</strong>n Basin<br />
margin, despite the wealth of knowledge on<br />
carbonate depositional systems. Nor did<br />
industry earlier pursue this play off the U.S.<br />
Atlantic coast in the 1980s: of the 54 wells<br />
drilled, only two targeted potential bank-edge<br />
reefal reservoirs in structural closures off the<br />
Baltimore Canyon. Indeed, notwithstanding the<br />
water depths, limited technology, costs, oil<br />
versus gas potential and so forth, this play was<br />
probably just not sufficiently attractive at the<br />
time. In the 20 years that have passed, natural<br />
gas has become the North American fuel of<br />
choice. The <strong>Scotia</strong>n Basin’s Deep Panuke<br />
discovery may thus be the catalyst required for a<br />
re-evaluation at this play in jurisdictions<br />
encompassing the circum-North Atlantic region.<br />
17
3.2 Tests and Shows<br />
Of the 21 exploration wells (Table 1) drilled on<br />
the Abenaki platform offshore <strong>Nova</strong> <strong>Scotia</strong>, there<br />
has been one significant discovery and the<br />
others, though dry, nevertheless yielded<br />
Year Operator Name ID<br />
FTD<br />
(m)<br />
important data (Figure 5). Ten wells focused on<br />
the bank edge, and of these seven were drilled<br />
on the Panuke Segment and three on the<br />
Acadia Segment, while none have been drilled<br />
on the Shelburne Segment.<br />
Status Comments<br />
1970 Shell Oneida O-25 4110 D&A Platform – overlying basement structure<br />
1971 Shell Abenaki J-56 4569 D&A Platform – flank of salt piercement diapir<br />
1972 Shell Mohican I-100 4393 D&A Platform – overlying salt swell<br />
1973 Mobil Cohasset D-42 4427 D&A<br />
Bank Edge – some porosity, mud gas (oil in<br />
Cretaceous Logan Canyon Fm. sands)<br />
1974 Shell Demascota G-32 4672 D&A Bank Edge – 168 m porosity, mud gas, tested water<br />
1976 Petro<strong>Canada</strong> Penobscot L-30 4267 D&A Bank Edge – no porosity, mud gas<br />
1977 Petro<strong>Canada</strong> Moheida P-15 4298 D&A Platform – overlying basement structure<br />
1978 Chevron Acadia K-62 5286 D&A<br />
Bank Edge – good porosities, no mud log, tested<br />
water<br />
1978 Mobil Cohasset L-97 4872 D&A Bank Edge – some porosity, tested gas-cut mud<br />
1984 Husky Glooscap C-63 4542 D&A Platform – overlying salt swell<br />
1984 Petro<strong>Canada</strong> Bonnet P-23 4336 D&A<br />
Back Reef (25km) – extensive zones of lost<br />
circulation, no tests, incomplete mud gas log<br />
1984 Petro<strong>Canada</strong> Dover A-43 4525 D&A Platform – high side of a tilted fault block<br />
1985 Petro<strong>Canada</strong> Albatross B-13 4046 D&A Bank Edge – some porosity, mud gas, no tests<br />
1986 Shell Panuke B-90 3445 D&A<br />
Bank Edge – oil discovery in Cretaceous Missisauga<br />
Fm. sands<br />
1987 Shell Kegeshook G-67 3540 D&A Platform – overlying basement structure<br />
1987 Petro<strong>Canada</strong> Como P-21 3540 D&A Platform – overlying basement structure<br />
1999 PanCanadian Panuke<br />
J-99<br />
(PP3C)<br />
4163 Gas<br />
Bank Edge – gas discovery in Abenaki 5 / Bacarro<br />
(well also known as PP3C)<br />
2000 PanCanadian Panuke F-09 3815 D&A Back Reef - oolitic facies, tight<br />
2001 PanCanadian Musquodoboit E-23 3818 D&A<br />
2002 PanCanadian Queensland M-88 4401 D&A<br />
Bank edge – up-dip step-out from Demascota G-32,<br />
mud gas, no porosity<br />
Fore Reef – by-pass sand play, but important for<br />
stratigraphy<br />
2002 Cdn.Superior Marquis L-35 4501 D&A Bank Edge – no porosity, low mud gas<br />
Table 1. Chronological List of Abenaki Formation Exploration Wells.<br />
The ten bank edge wells include one gas<br />
discovery and nine dry holes but well symbols<br />
on the maps do not tell the whole story. To<br />
understand and appreciate the results of the<br />
drilling, a close examination of their respective<br />
details is required: final total depth, thickness of<br />
Abenaki penetrated, mud gas readings, tests,<br />
cores, drilling breaks, etc. It also most<br />
enlightening to learn what the pre-drill objectives<br />
were versus the results. The exploration wells<br />
are located in Figure 4 and are discussed in a<br />
northeast to southwest progression, with seismic<br />
profiles across all wells presented in Chapter 7.<br />
The Abenaki stratigraphic nomenclature is<br />
detailed and discussed in Section 5.2. Depths<br />
and elevations are based on True Vertical<br />
Depths (TVD) well logs measured from the rig<br />
Rotary Table (RT) unless otherwise noted.<br />
18
Penobscot B-41 & L-30<br />
The B-41 well was drilled on a seismically<br />
defined structural closure to test for shallow<br />
Early Cretaceous oil-prone sands draped over<br />
the Abenaki bank margin. Non-commercial<br />
hydrocarbons were discovered in the sands but<br />
none in the 24 m of limestone penetrated at the<br />
base of the well (3420-3444 m). The L-30<br />
delineation well penetrated a significantly<br />
greater 708 m thick sequence, but with no<br />
porosity, oil staining or trace gas shows (all less<br />
then 1%) throughout the Abenaki (Baccaro /<br />
Abenaki 7-3).<br />
Marquis L-35/L-35A<br />
A vertical and a sidetrack well were drilled on<br />
this prospect to test for Abenaki reefal porosity<br />
following the success at Deep Panuke. The first<br />
well, L-35, penetrated the entire Baccaro<br />
Member and the upper part of the Misaine<br />
Member shales. It encountered minor mud-gas<br />
peaks throughout the Abenaki (Baccaro/Abenaki<br />
Sequences 7, 6, 4 & 3) ranging in values from<br />
40-114 total gas units (TGU) though no tests<br />
were run. The L-35A sidetrack well was drilled<br />
to test an additional seismic amplitude event<br />
interpreted as porous reefal facies. The well<br />
found porous reefal facies with one good 154<br />
TGU mud-gas peak in the thin Abenaki 7 but<br />
was not tested. There were no wash-out or lost<br />
circulation zones encountered in either well. An<br />
excellent full suite of well logs and cuttings were<br />
obtained from both wells.<br />
Cohasset D-42<br />
Two wells were drilled on this structural feature<br />
to test for possible shallow Lower Cretaceous<br />
draped sands and porous reef facies. The D-42<br />
well drilled the Abenaki Formation from 3170-<br />
4427 metres. A 1259 metre thick section was<br />
penetrated which included the entire Baccaro<br />
Member (Abenaki 6-2), Misaine Member shales<br />
and ended up in the lowermost Scatarie Member<br />
(Abenaki 1). Approximately 35 metres of oilbearing<br />
sands were discovered in the overlying<br />
Logan Canyon Formation. Within the deeper<br />
Abenaki, oil staining occurred at 3280, 3315,<br />
3330 and 3612 metres (Baccaro / Abenaki 6-5).<br />
An isolated gas show also occurred at 3330 m<br />
and several minor shows from 3414-4427 m. A<br />
drillstem test (DST) was run over the interval<br />
3481-3512 m and recovered gas-cut mud.<br />
Cohasset L-97<br />
The L-97 well penetrated the entire Abenaki<br />
Formation from 3158-4768 m (1610 m),<br />
bottoming in the sandstones of the Middle<br />
Jurassic Mohican Formation. Scattered oil<br />
staining and minor gas shows were seen from<br />
3188-3490 m. Mud gas peaks were recorded<br />
from 3600-3625 m (Baccaro/Abenaki 6) and at<br />
4725 m (Scatarie/Abenaki 1) with a DST run<br />
over the interval of 3599-3620 m recovering gascut<br />
mud. It is yet to be determined if the gasbearing<br />
porous reefal facies extends<br />
northeastwards into the structurally shallower<br />
Abenaki at Cohasset D-42.<br />
Deep Panuke Field<br />
Seven delineation and exploration wells have<br />
been drilled into the Abenaki Formation to test<br />
for gas in the Baccaro Member / Abenaki 5) at or<br />
in the immediate vicinity of the Deep Panuke<br />
Field. Four of the wells flow-tested gas in<br />
excess of 50 MMcf/d (Panuke PP-3C, M-79A,<br />
PI-1B, H-08). The remaining three wells<br />
(Panuke M-79, PI-1A & F-09) encountered<br />
varying volumes of mud gas but either did not<br />
test these occurrences or could not flow gas to<br />
surface.<br />
Demascota G-32<br />
The Demascota G-32 well was drilled to test a<br />
structural high at the edge of the Abenaki bank<br />
margin and penetrated almost the entire<br />
Abenaki Formation from 3400-4672 m (1471 m),<br />
bottoming in the Scatarie Member (Abenaki 1).<br />
Mud gas peaks >100 TGU and scattered vuggy<br />
porosity were observed throughout the Upper<br />
Baccaro (Abenaki 5). Within this section, 168<br />
metres of secondary dolomitized porosity was<br />
present in reefal lithofacies (Harvey, 1990;<br />
Weissenberger et al., 2000; Wierzbicki et al.,<br />
2002). Two DST’s recovered only formation<br />
water from intervals at 3860-3921 m and 3813-<br />
3828 m. These tests were several hundred<br />
metres below the petrophysically-defined fieldwide<br />
-3504 mTVDSS gas-water contact at Deep<br />
Panuke (PanCanadian, 2002).<br />
Musquodoboit E-23<br />
The Musquodoboit well was an up-dip step-out<br />
from the Demascota well targeting interpreted<br />
porous reef seismic amplitudes. It drilled a 471<br />
m thick Abenaki section (Baccaro/Abenaki 7-5)<br />
from 3347-3818 m. Two mud-gas peaks were<br />
recorded in the Abenaki 5 at 3552 m (103 TGU)<br />
and 3572 m (138 TGU). Tests in these intervals<br />
showed no porosity development.<br />
19
Acadia K-62<br />
The K-62 well was drilled on the northeastern<br />
part of the Acadia Segment to test a bank-edge<br />
structural closure delineated by seismic. The<br />
entire Abenaki Formation was penetrated from<br />
3306-4950 m (1644 m) and bottomed in the<br />
distal oolitic limestone facies of the Iroquois<br />
Formation (4962-5287 m / 325 m thick). Fair to<br />
good porosities were observed throughout the<br />
Abenaki section in oolitic grainstones and in<br />
dolomitized peloidal skeletal lime sands in the<br />
Abenaki 4 (Weissenberger et al., 2000).<br />
Circulation was lost over the 4677-4790 m<br />
interval (Iroquois Formation) possibly indicating<br />
good porosity or a fault intersection. Due to this<br />
event there is no mud gas log over this and<br />
deeper intervals. A single flow test was run in<br />
the Iroquois from 4822-4838 m which recovered<br />
formation water. There was no mention of oil<br />
staining or gas in the cuttings report from any of<br />
the formations drilled.<br />
Albatross B-13<br />
The Albatross B-13 well was drilled on a<br />
pronounced structural high at the edge of the<br />
Abenaki bank margin. About 1035 metres of the<br />
Baccaro Member was penetrated and the well<br />
bottomed in shales of the Misaine Member.<br />
Scattered porosity was observed throughout the<br />
section with partial loss circulation occurring<br />
over the same section. Mud gas peaks were<br />
recorded (~ 100 TGU’s) at two intervals, 3434-<br />
3440 m and 3012 m (Abenaki 3, 2) though no<br />
DSTs were attempted.<br />
Bonnet P-23<br />
This is the westernmost well on the <strong>Scotia</strong>n<br />
Shelf and was drilled to test a tilted fault block 6<br />
km from the edge of the Abenaki margin. The<br />
entire Abenaki Formation was penetrated (2091-<br />
3525 m / 1435 m thick) with the facies<br />
dominated by outer shelf oolitic shoal<br />
environments. No reefal limestones were<br />
drilled. Fair porosities are observed in the<br />
oolites but were good to very good in<br />
dolomitized vuggy lagoonal facies (4325-4434<br />
m, Baccaro / Abenaki 6 & 5). The lower<br />
Baccaro / Abenaki 3 & 2 section appears to be<br />
dominated by dolomitized oolites with fair<br />
porosity. There were extensive intervals of lost<br />
circulation and caving over this lower interval<br />
and cuttings recovery was poor to nil. This may<br />
be the result of enhanced porous intervals and<br />
or the several large faults in this section. In the<br />
deeper Iroquois Formation, modest porosity<br />
development is seen in the dolomites though<br />
again, much of the interval had no sample<br />
recovery due to caving and lost circulation<br />
problems. Four gas peaks under 100 TGU were<br />
encountered over this section and oil staining in<br />
two samples. No DSTs were attempted<br />
(probably due to hole conditions) though a core<br />
was cut at the bottom of the well (4325-4334 m)<br />
and recovered nine metres of dolomitized vuggy<br />
lagoonal mudstones (Weissenberger et al.,<br />
2000).<br />
20
The presence of a thick carbonate platform and<br />
reefs beneath the Atlantic margin was first<br />
indicated by geophysical studies and dredging in<br />
the mid-1960’s as described by Jansa (1981).<br />
With over 200 industry wells drilled offshore<br />
North America plus 5 deep stratigraphic tests on<br />
the U.S. shelf and 10 Deep Sea Drilling Project<br />
holes on the U.S. lower slope and rise plus<br />
4. REGIONAL GEOLOGY<br />
about 400,000 km of seismic the development of<br />
the Atlantic passive margin was gradually<br />
revealed. An integral part of this margin<br />
development is the almost continuous carbonate<br />
bank from the Grand Banks to the Bahamas.<br />
The map of Jansa (1981) has not been modified<br />
for subsequent well locations since it was<br />
published (Figure 6).<br />
CNSOPB JURISDICTION<br />
Figure 6. Extent of the Jurassic carbonate succession along the North American offshore margin (Jansa,<br />
1981).<br />
21
Unlike the dominantly East-West trending<br />
Mesozoic carbonate platforms of the European<br />
Tethys that became involved in the Alpine<br />
orogeny, the Northeast-Southwest North<br />
America platform has been tectonically stable<br />
(Jansa, 1981). It was this undisturbed nature<br />
that allowed the Atlantic style passive margin<br />
model to be developed. In particular, the<br />
continuous transition from nearshore facies<br />
across the shelf into the deep ocean basin<br />
provided evidence of the role of carbonates in<br />
passive margin building and plate tectonic<br />
processes during the late rift to early drift period<br />
(Jansa, ibid).<br />
As more and more data becomes available the<br />
complexities of this Mid to Late Jurassic/Early<br />
Cretaceous carbonate bank along the Atlantic<br />
margin becomes more evident. The following<br />
discussions of the stratigraphy and morphology<br />
will reveal many changes along strike during and<br />
after deposition of the bank and the difficulties in<br />
locating the original bank edge.<br />
4.1 The <strong>Scotia</strong>n Basin<br />
The <strong>Scotia</strong>n Basin exists along the entire length<br />
of offshore <strong>Nova</strong> <strong>Scotia</strong> and southern<br />
Newfoundland (Figure 2). It extends 1200<br />
kilometers from the Yarmouth Arch and the<br />
United States border in the southwest to the<br />
Avalon Uplift on the Grand Banks of<br />
Newfoundland in the northeast. With an<br />
average breadth of 250 km, the total area of the<br />
basin is approximately 300,000 km 2 . Half of the<br />
basin lies on the present-day continental shelf in<br />
water depths less than 200 m with the other half<br />
on the continental slope in water depths from<br />
200 to 4000 m. The subbasin components of<br />
the basin are shown with the Upper Jurassic<br />
Baccaro Bank rimming the LaHave Platform<br />
from the U.S. border to just north of Sable<br />
Island.<br />
For clarification purposes, George’s Bank is a<br />
physiographic feature that straddles the<br />
<strong>Canada</strong>/United States border. The George’s<br />
Bank Basin lies wholly on the American side and<br />
is separated from the <strong>Scotia</strong>n Basin by the<br />
Yarmouth Arch and experienced a different<br />
geological history and basin evolution. On the<br />
Canadian side of the Yarmouth Arch the<br />
subsurface rocks are in the Shelburne Subbasin,<br />
a sub- component of the <strong>Scotia</strong>n Basin. An<br />
exploration moratorium on the George’s Bank<br />
area is in place until December 31, 2012.<br />
4.2 Geological History<br />
This section of the report discusses the geology<br />
and geologic history of the <strong>Scotia</strong>n Basin and<br />
surrounding region. It is not an exhaustive<br />
geological study, and the interested reader can<br />
access the excellent publications by staff of the<br />
Geological Survey of <strong>Canada</strong> (e.g. Wade and<br />
MacLean, 1990; GSC, 1991) and others<br />
although published material on the older<br />
sediments underlying the <strong>Scotia</strong>n Slope is<br />
lacking.<br />
The <strong>Scotia</strong>n Basin is a passive continental<br />
margin that developed after rifting and<br />
separation of the North American and African<br />
continents beginning in the Middle Triassic<br />
(Figure 7). The rift phase was characterized by<br />
continental fluvial/lacustrine/playa red bed and<br />
evaporite deposition while the drift phase was<br />
characterized by typical clastic progradational<br />
sequences with periods of carbonate deposition.<br />
A prominent carbonate platform developed in<br />
the western part of the basin during the Middle<br />
to Latest Jurassic-earliest Cretaceous and its<br />
eastern extent was limited by a major deltaic<br />
depocentre located in the Sable Island area<br />
during the Late Jurassic and Early Cretaceous.<br />
Major transgressive sequences continued<br />
throughout the Late Cretaceous and Tertiary as<br />
relative sea level rose (Wade and MacLean,<br />
1990; Welsink et al, 1989; Balkwill and Legall,<br />
1989). These were punctuated by major sea<br />
level drops and regressive low-stand sequences<br />
were deposited as turbidite deposits further<br />
seaward.<br />
Break-up and rifting of the Pangaean<br />
supercontinent commenced in the Middle<br />
Triassic Period about 225 million years ago<br />
(mya). At that time, the <strong>Nova</strong> <strong>Scotia</strong> region<br />
occupied a near equatorial position situated<br />
adjacent to Morocco to the east, with most of its<br />
older Paleozoic rocks having direct Moroccan<br />
affinities. A series of narrow, interconnected,<br />
below-sea level basins were created, in which<br />
were deposited fluvial and lacustrine red bed<br />
sediments as well as volcanic rocks (Fundy-type<br />
sequences). As sedimentation continued<br />
throughout the Late Triassic, the interconnected<br />
basins filled and coalesced, eventually to form a<br />
long, narrow, intracratonic rift basin by the Early<br />
Jurassic.<br />
22
AGE<br />
(MY)<br />
0<br />
20<br />
40<br />
60<br />
80<br />
100<br />
120<br />
140<br />
160<br />
180<br />
200<br />
220<br />
240<br />
260<br />
Epoch/Age<br />
L. CRETACEOUS TERTIARY<br />
E. CRETACEOUS<br />
L. JUR.<br />
M. JUR.<br />
E. JURASSIC<br />
L. TRIASSIC<br />
M. TRI.<br />
PLIOCENE<br />
MIOCENE<br />
OLIGOCENE<br />
EOCENE<br />
PALAEOCENE<br />
PLEIS T.<br />
MAASTRICHTIAN<br />
CAMPANIAN<br />
SANTONIAN<br />
CONIACIAN<br />
TURONIAN<br />
CENOMANIAN<br />
ALBIAN<br />
APTIAN<br />
BARREMIAN<br />
HAUTERIVIAN<br />
VALANGINIAN<br />
BERRIASIAN<br />
TITHONIAN<br />
KIMMERIDGIAN<br />
OXFORDIAN<br />
CALLOVIAN<br />
BATHONIAN<br />
BAJOCIAN<br />
AALENIAN<br />
TOARCIAN<br />
PLIENSBACHIAN<br />
SINEMURIAN<br />
HETTENGIAN<br />
RHAETIAN<br />
MFS<br />
A u<br />
BU<br />
*<br />
S<br />
ECMA<br />
NORIAN<br />
CARNIAN<br />
LADINIAN<br />
ANISIAN<br />
MAGNETIC ANOMALIES<br />
M0r<br />
M1<br />
M3<br />
M5/M10<br />
M11<br />
M12/15<br />
M16<br />
M17<br />
M18/M21<br />
M22<br />
M23/M25<br />
M26/M32<br />
M33/M37<br />
ECMA<br />
RISE FALL<br />
EUSTATIC<br />
CURVE<br />
200 100 0m<br />
MFS<br />
MFS<br />
MFS<br />
DSDP<br />
A u<br />
A c<br />
J 1<br />
J 2<br />
BU<br />
Legend<br />
- Maximum Flooding Surfaces<br />
- Deep sea stratigraphic markers<br />
- Breakup Unconformity<br />
- Gas w - Oil<br />
- Deepwater turbidite<br />
- Source Rock Intervals<br />
- East Coast Magnetic Anomaly<br />
NW SE<br />
BANQUEREAU<br />
WYANDOT<br />
DAWSON<br />
CANYON<br />
LOGAN<br />
CANYON<br />
MOHAWK<br />
'O' MARKER<br />
MISSISAUGA<br />
S<br />
MIC<br />
MAC<br />
w *<br />
w *<br />
w *<br />
w *<br />
*<br />
*<br />
NASKAPI SHALE<br />
BACCARO<br />
MISAINE SHALE<br />
SCATARIE<br />
MOHICAN<br />
Figure 7. <strong>Scotia</strong>n Basin Generalized Stratigraphic Chart (CNSOPB).<br />
CREE<br />
PETREL<br />
SABLE SHALE<br />
IROQUOIS & EQ.<br />
EURYDICE & EQUIVALENTS<br />
ARGO ARGO<br />
RED BEDS<br />
S<br />
ABENAKI<br />
RED BEDS<br />
VERRILL<br />
CANYON<br />
PALAEOZOIC METASEDIMENTARY & IGNEOUS ROCKS<br />
Time scale from Gradstein and Ogg (2004)<br />
Eustatic curve from Haq et al (1987)<br />
Stratigraphy modified from<br />
MacLean and Wade (1993),<br />
Wade and MacLean (1990), and<br />
Wade et al. (1995)<br />
S<br />
S<br />
S<br />
S<br />
S<br />
S<br />
23
By the latest Triassic-earliest Jurassic, tectonic<br />
motion had moved the North American and<br />
African plates slowly northward, with the <strong>Nova</strong><br />
<strong>Scotia</strong>-Moroccan region now in the more arid<br />
sub-equatorial climate zone (ca. 10-20°N paleolatitude).<br />
Renewed Late Triassic rifting of<br />
continental crust further to the north and east in<br />
the Grand Banks / Iberia region breached<br />
topographic barriers and permitted the first<br />
incursions of marine waters from the eastern<br />
Tethys paleo-ocean to flood into these<br />
interconnected syn-rift basins. Restricted,<br />
shallow marine conditions were established with<br />
some carbonate sedimentation (Eurydice<br />
Formation). Due to the hot and dry climate and<br />
sub-sea level elevation, these waters were<br />
repeatedly evaporated, resulting in the<br />
precipitation of extensive salt and anhydrite<br />
deposits of perhaps one to two kilometers in<br />
thickness in this central rift system (Argo<br />
Formation). Marine incursions eventually<br />
covered the basin with a narrow, shallow and<br />
restricted sea within which thin sequences of<br />
carbonate and clastic sediments accumulated.<br />
Coarser grained clastic sediments from fluvial<br />
sources were deposited concurrently on the<br />
basin margins sourced from adjacent high relief<br />
terrains.<br />
An earliest Jurassic phase of siliciclastic<br />
deposition is observed in the west-central part of<br />
the <strong>Scotia</strong>n Basin that may exist elsewhere<br />
along the margin. This eastward-directed pulse<br />
of sediments conformably overlies and deforms<br />
(through loading) Argo Formation evaporites in<br />
the Mohican Graben (see Figure 17). The westdipping<br />
listric faults inboard of the margin hingeline<br />
on the Mohican and Naskapi grabens are<br />
interpreted as the antithetic response to<br />
extension in the Fundy Basin during the Late<br />
Triassic (Wade et al., 1996). These grabens<br />
acted as loci for clastic deposition for newly<br />
established fluvial drainage systems (GSC,<br />
1991), with the source of the sediments from the<br />
current mainland region of <strong>Nova</strong> <strong>Scotia</strong>. While<br />
not yet encountered in wells or observed<br />
elsewhere along the margin, the age of this<br />
succession can be reasonably inferred as early<br />
Hettangian to perhaps mid- to late Sinemurian<br />
since it conformably overlies the Argo<br />
Formation and is later truncated by the younger<br />
Break-up Unconformity as described below.<br />
Near the region of the interpreted central rift<br />
axis, deep crustal seismic (Lithoprobe AGS 88-<br />
1A) reveals the presence of highly rotated fault<br />
blocks exhibiting westward-thickening reflection<br />
sequences later truncated by the mid- to late<br />
Sinemurian Break-up Unconformity. These<br />
features are interpreted to represent the<br />
products of post-salt / pre-break-up thermal<br />
bulging along the central rift axis and shoulder<br />
regions inboard of the basin hinge line. The<br />
west-directed deposition seen in deepwater<br />
seismic profiles is thought to have been sourced<br />
from erosion of highly attenuated and<br />
serpentinized continental crust at the incipient<br />
rift axis. Such a setting would suggest not a<br />
single central rift salt basin but paired basins<br />
opposite the <strong>Nova</strong> <strong>Scotia</strong> and Moroccan margins<br />
respectively (e.g., model of Jackson et al., 2000)<br />
separated by an elevated and highly attenuated<br />
continental crust delineating the future rift axis<br />
and spreading centre.<br />
Renewed tectonism in the central rift basin<br />
during the Early Jurassic (mid-Sinemurian) is<br />
observed in the complex faulting and erosion of<br />
Late Triassic and Early Jurassic sediments and<br />
older rocks. This phase of the rifting process is<br />
known as the Break-Up Unconformity (BU) and<br />
defines the final separation of the North America<br />
and Africa continents, creation of true oceanic<br />
crust through volcanism, seafloor spreading and<br />
opening of the proto-Atlantic Ocean.<br />
The basins and platforms created on the <strong>Nova</strong><br />
<strong>Scotia</strong> and Moroccan margins appear to have<br />
been defined by landward extensions of<br />
regularly-spaced oceanic fracture zones onto<br />
continental crust. (Welsink et al., 1990) From<br />
the southwest to the northeast, a series of<br />
alternating “highs and lows”, or platforms and<br />
depocentres, occur along the entire <strong>Scotia</strong>n<br />
margin, these being the Georges<br />
Bank/Shelburne Basin, La Have Platform, Sable<br />
and Abenaki Subbasins, Banquereau Bank<br />
Platform and the Orpheus Graben/Laurentian<br />
Subbasin (Figure 2). A basement hinge zone in<br />
these areas defined the landward limit of<br />
maximum tectonic extension and subsidence of<br />
the seaward basinal portion of the margin. This<br />
antecedent basement morphology would thus<br />
come to assert a strong control on sediment<br />
distribution and deposition in the region for the<br />
next 190 million years.<br />
As a result of the final continental separation<br />
event (Break-Up Unconformity), the <strong>Scotia</strong>n<br />
Basin margin consisted of a heavily faulted,<br />
complex terrane of grabens and basement highs<br />
that underwent a significant degree on<br />
24
peneplanation. Transgressive shallow water to<br />
tidally influenced dolomites and clastics were<br />
laid down in localized areas on the seaward<br />
portion of the margin under slightly restricted<br />
marine conditions (Iroquois Formation)<br />
(Adams, 1986). This sequence was later<br />
followed by a thick succession of coeval fluvial<br />
sandstones and shales (Mohican Formation),<br />
which eventually prograded out over the margin<br />
to fill graben lows and bury basement highs by<br />
the lower Middle Jurassic. The fine muds from<br />
this succession were transported by marine<br />
processes further out into relatively deeper<br />
water and began to slowly infill basinal lows and<br />
cover new oceanic crust in this depositional<br />
setting.<br />
The combination of sea-floor spreading, thermal<br />
subsidence and global sea level rise caused the<br />
Atlantic Ocean to become broader and deeper<br />
(~1000 metres) by the Middle Jurassic. A<br />
carbonate platform and margin succession was<br />
established along the outer basin hinge zone<br />
(Scatarie Member, Abenaki Formation) and<br />
prograded out into deeper waters where marls<br />
and clastic muds were deposited (~DSDP J2<br />
Reflector). Continued margin subsidence<br />
coupled with global sea level rise resulted in<br />
transgression of these waters over the shelf and<br />
blanketing the carbonates with deeper marine<br />
shales (Misaine Member, Abenaki Formation)<br />
From the late-Middle to the end of the Jurassic,<br />
carbonate reef, bank and platform environments<br />
were formed and thrived along the basin hinge<br />
line on the La Have Platform (Baccaro Member,<br />
Abenaki Formation). A shallow mixed<br />
carbonate-clastic ramp succession existed on<br />
the Banquereau Platform on the northeast<br />
margin. Deep-water sedimentation was<br />
represented by a thin sequence of shales and<br />
limestones (DSDP J1 Reflector). Concurrent<br />
with carbonate deposition, regional uplift to the<br />
west resulted in an influx of clastic sediments<br />
and the establishment of the mixed energy<br />
(current and tidal) Sable Delta complex in the<br />
Laurentian Subbasin, and slightly later in the<br />
Sable Subbasin. In the southwest, a similar<br />
progradation of sediments may have occurred at<br />
an embayment in the vicinity of the Northeast<br />
Channel (Shelburne Delta of Wade, 1990)<br />
however the existing seismic data is too poor to<br />
unequivocally interpret a deltaic system. These<br />
sediments were primarily sourced from the<br />
adjacent thick (14+ km) blanket of latest<br />
Devonian to Permian sediments centered in the<br />
Gulf of St. Lawrence region that covered the<br />
entire Atlantic Provinces region and parts of<br />
New England. The MicMac Formation records<br />
this first phase of delta progradation into these<br />
subbasins, represented by distributary channel<br />
and delta front fluvial sands cyclically<br />
interfingering with prodelta and shelf marine<br />
shales of the Verrill Canyon Formation.<br />
Sediment loading of unstable shelf shales south<br />
of the basement hinge zone initiated subsidence<br />
and development of seaward-dipping growth<br />
faults which acted as traps for further sand<br />
deposition.<br />
During periods of sea level lowstand, rivers<br />
quickly down-cut into the exposed sand-rich<br />
shelf with shelf-edge delta complexes possibly<br />
created at the edge of the continental shelf.<br />
Turbidity currents, mass sediment flows and<br />
large slumps carried significant volumes of<br />
sands and muds into deep-water (500+ metres)<br />
and depositing these on the slope and abyssal<br />
plain. Sediment loading mobilized deeply buried<br />
Jurassic-age resulting in structural relief at the<br />
seafloor. Continuous sedimentation<br />
accentuated this process, and in areas such as<br />
the Sable and possibly Shelburne Deltas where<br />
sedimentation was high, the salt moved both<br />
vertically and laterally seaward in an upwardstepping<br />
manner forming diapirs, pillows,<br />
canopies and related features. This salt motion<br />
has been ongoing from about the Middle<br />
Jurassic to the present day.<br />
Throughout the Cretaceous Period, the Atlantic<br />
Ocean became progressively wider and deeper<br />
with significant surface and deep-water<br />
circulation patterns. The ancestral St. Lawrence<br />
River was well established by the earliest<br />
Cretaceous, delivering increasing supplies of<br />
clastic sediments into the <strong>Scotia</strong>n Basin that<br />
overwhelmed and buried the carbonate reefs<br />
and banks on the La Have Platform and later the<br />
Banquereau Platform. The Missisauga<br />
Formation, a series of thick sand-rich deltaic,<br />
strand plain, carbonate shoals and shallow<br />
marine shelf successions, dominated<br />
sedimentation throughout the Early Cretaceous.<br />
The Sable Delta prograded rapidly southwest<br />
into the Laurentian and Sable Subbasins and<br />
out over the Banquereau Platform. In the<br />
Shelburne Subbasin the postulated Shelburne<br />
Delta disappeared due to the exhaustion of its<br />
river’s sediment supply. Along the La Have<br />
Platform, small local rivers draining off of<br />
southwest <strong>Nova</strong> <strong>Scotia</strong> mainland provided<br />
25
modest amounts of sands and shales to this<br />
region and associated deeper water realm.<br />
Within the Sable and Laurentian Subbasins,<br />
growth faulting accompanied this time of rapid<br />
deposition, moving progressively seaward as the<br />
delta advanced. When sea levels dropped,<br />
large volumes of sands were deposited as<br />
lowstand delta complexes along the outer<br />
reaches of the delta (Cummings and Arnott, in<br />
press) and further out into deep-waters on the<br />
slope. Such high deposition rates further loaded<br />
salt features that in turn initiated renewed salt<br />
motion with turbidite fan and channel sediments<br />
filling intra-salt minibasins. Shales of the deepwater<br />
Verrill Canyon Formation continued to<br />
dominate sedimentation in this environment<br />
throughout the Cretaceous.<br />
Deltaic sedimentation ceased along the entire<br />
<strong>Scotia</strong>n margin following a late Early Cretaceous<br />
major marine transgression that is manifested by<br />
thick shales of the overlying Naskapi Member,<br />
Logan Canyon Formation. Subdued coastal<br />
plain and shallow shelf sand and shale<br />
sedimentation of the Late Cretaceous Logan<br />
Canyon Formation, and later deeper marine<br />
shales (and some limestones) of the Dawson<br />
Canyon Formation reflected continued high<br />
sea level and a lower relief hinterland, together<br />
reducing sediment supply to the basins. During<br />
periods of sea level fall, mud-rich sediments<br />
were still being transported out into the deepwater<br />
basin though in reduced quantities (Verrill<br />
Canyon Formation).<br />
The end of the Cretaceous period in the <strong>Scotia</strong>n<br />
Basin saw a rise in sea level and basin<br />
subsidence and deposition of marine marls and<br />
chalky mudstones of the Wyandot Formation.<br />
These strata were eventually buried by Tertiary<br />
age and marine shelf mudstones and later shelf<br />
sands and conglomerates of the Banquereau<br />
Formation. Throughout the Tertiary on the<br />
<strong>Scotia</strong>n margin, several major unconformities<br />
related to sea level falls occurred. During<br />
Paleocene, Oligocene and Miocene times, fluvial<br />
and deep-water current processes cut into and<br />
eroded these mostly unconsolidated sediments<br />
and transported sediments out into the deeper<br />
water slope and abyssal plain. During the<br />
Quaternary Period of the last 2 million years,<br />
several hundred metres of glacial and marine<br />
sediments were deposited on the outer shelf and<br />
upper slope.<br />
26
5.1 Depositional Setting<br />
During the Middle Jurassic to Early Cretaceous,<br />
carbonate deposition dominated sedimentation<br />
around the entire North Atlantic margin,<br />
reflecting a period of continuous global sea level<br />
rise and gentle downwarping and thermal<br />
subsidence of rift-bounding continental crust.<br />
Reef, platform and related facies were<br />
established along the margins of the Atlantic and<br />
Tethys Oceans under ideal conditions of broad,<br />
stable, low relief and shallow shelves, warm<br />
oxygenated waters with limited oceanic<br />
circulation, limited background clastic<br />
sedimentation and low fluctuations of oxygen<br />
and nutrient levels. Jansa (1993) suggests that<br />
in the Atlantic realm there was a NE-SW flowing,<br />
margin-parallel current in existence throughout<br />
the Late Jurassic, at which time the Gulf of<br />
Mexico and Central America were connected to<br />
the Pacific Ocean by shallow seas.<br />
In the Late Jurassic, <strong>Nova</strong> <strong>Scotia</strong> was positioned<br />
between 25-30º north paleolatitude. The<br />
regional climate was arid with significant<br />
seasonal shifts to monsoonal conditions<br />
punctuated by clastic influxes sourced from the<br />
western hinterland. These factors infer limited<br />
erosion and fluvial deposition in the rift region,<br />
and further enhancing conditions favourable for<br />
carbonate deposition.<br />
Seismic and well data reveal the Abenaki<br />
Formation carbonate platform and margin<br />
complex, a second-order stratigraphic sequence<br />
succession, as extending for over 2500 kms<br />
along almost the entire length of the current<br />
North American offshore continental margin<br />
edge and slope; from the Sable Basin offshore<br />
<strong>Nova</strong> <strong>Scotia</strong> in the northeast down to the Blake<br />
Plateau Basin off northeast Florida in the<br />
southwest. (Figure 6) Eroded remnants of the<br />
Abenaki extend further south to the Bahama<br />
Platform (Schlee et al., 1988). The Abenaki’s<br />
northern limit is the area immediately north of<br />
Sable Island where carbonates extended out<br />
beyond the hinge line and into the Sable<br />
Subbasin depocentre; an area of significant<br />
subsidence and greater influx of clastics (Figure<br />
3).<br />
5. THE ABENAKI FORMATION<br />
On the <strong>Scotia</strong>n Basin margin, the Abenaki was<br />
deposited along the edge of the basin hinge<br />
zone in a homoclinal to steepening ramp and<br />
later platform setting. Except for the Misaine<br />
Member shales, the Abenaki is composed of<br />
repetitive shallowing-upward carbonate<br />
successions. Coeveal, predominantly<br />
siliciclastic delta-strand plain facies of the Mic<br />
Mac Formation were deposited in the eastern<br />
part of the Sable Basin, i.e. Sable and<br />
Laurentian Subbasins (Figure 2). <strong>Here</strong>, Jurassic<br />
age carbonates equivalent to the Abenaki are<br />
encountered in wells and observed in seismic<br />
profiles capping clastic regressional sequences<br />
in a ramp-like setting. Thinner coastal plain<br />
successions of the Mohawk Formation are<br />
present on the northwestern margin of the La<br />
Have Platform. Shales and other fine clastics of<br />
the Verrill Canyon Formation represent<br />
deposition in the deeper water marine setting<br />
along the entire basin margin. The entire<br />
Abenaki is buried under a thick prism of<br />
Cretaceous and Tertiary clastic sediments<br />
upwards of four kilometres thick.<br />
Given its setting, the width and thickness of the<br />
Abenaki facies’ belt is variable (Figure 8). On<br />
the La Have Platform, it exists as a narrow belt<br />
from 10-40 km in width with thicknesses from<br />
600 – 1000 metres. It is slightly thicker and<br />
considerably wider in the U.S. part of the<br />
Georges Bank Basin further to the west. It is<br />
much wider, up to 150 km, on the northeastern<br />
part of the Platform over the Mohican Graben<br />
where the underlying basement is attenuated<br />
and faulted. Hettangian-age bedded evaporites<br />
(Argo Formation) and in places a previously<br />
unrecognized Hettangian-Sinemurian siliciclastic<br />
succession underlie the carbonates, and as will<br />
be discussed later have an important influence<br />
on its deposition. Thickness of the Abenaki is<br />
greatest in this area, and to the east along the<br />
hinge line margin opposite the Sable Subbasin<br />
depocentre. Seismic and well data indicate<br />
maximum thicknesses of greater than 1600<br />
metres in these areas (GSC, 1991).<br />
27
44 N<br />
o<br />
43 N<br />
o<br />
42 N<br />
o<br />
41 N<br />
o<br />
40 N<br />
o<br />
69 W<br />
o<br />
69 W<br />
o<br />
68 W<br />
o<br />
68 W<br />
o<br />
67 o<br />
67 W<br />
o<br />
YARMOUTH ARC H<br />
66 W<br />
o<br />
66 W<br />
o<br />
NO RTHEAS T<br />
CHANNEL<br />
65 W<br />
o<br />
65 W<br />
o<br />
64 W<br />
o<br />
64 W<br />
o<br />
63 W<br />
o<br />
JURASSIC EROSIONALLIMIT<br />
Impact<br />
crater<br />
63 W<br />
o<br />
62 W<br />
o<br />
62 W<br />
o<br />
61 W<br />
o<br />
PANUKE FIELD<br />
SHELBURNE ACADI A SEGMENT PANUKE SEGMEN T<br />
MOHICAN GRABEN<br />
Carbonate Facies<br />
Low Energy Open Shelf, Oolite Shoals, Patch Reefs<br />
61 W<br />
o<br />
60 W<br />
o<br />
High Energy Outer Shelf - Oolite Shoals, Bank Edge Reefs<br />
Bank Edge (see morphology below)<br />
Foreslope - Bypass Sands, Reef Talus, Debris Flows<br />
Bank Edge Morphology<br />
Preserved Steep Margin<br />
Eroded Margin<br />
Low-Angle Margin (Ramp?)<br />
Eroded Foreslope<br />
H<br />
'Healed' Margin<br />
Faulted Margin<br />
Salt<br />
Tilted Fault Block<br />
60 W<br />
o<br />
59 W<br />
o<br />
59 W<br />
o<br />
58 W<br />
o<br />
Plays<br />
1. Bank Edge - Panuke Segment<br />
2. Bank Edge - Acadia Segment<br />
3. Bank Edge - Shelburne Segment<br />
4. Foreslope - Panuke Segment<br />
5. Foreslope - Acadia Segment<br />
6. Foreslope - Shelburne Segment<br />
7. Outer Shelf<br />
8. Platform Interior<br />
58 W<br />
o<br />
57 W<br />
o<br />
57 W<br />
o<br />
56 W<br />
o<br />
<strong>Canada</strong> - <strong>Nova</strong> <strong>Scotia</strong> <strong>Offshore</strong><br />
<strong>Petroleum</strong> <strong>Board</strong><br />
After: Jansa, L.F. and Lake,P.B., 1991:<br />
Lithostratigraphy 9: lithofacies and<br />
depositional environment - Scatarie and<br />
Baccaro members; in East Coast Basin<br />
Atlas Series: <strong>Scotia</strong>n Shelf; Geological<br />
Survey of <strong>Canada</strong> Atlantic, p. 67.<br />
Figure 8. Abenaki Formation morphology, carbonate facies and hydrocarbon plays. Details on the subdivision of the Shelburne, Acadia and<br />
Panuke Segments are detailed in Chapter 7.<br />
TFB<br />
44 N<br />
o<br />
43 N<br />
o<br />
42 N<br />
o<br />
41 N<br />
o<br />
40 N<br />
o<br />
56 W<br />
o<br />
28
5.2 Lithostratigraphy<br />
5.2.1 Abenaki Formation<br />
The Abenaki Formation was first described from<br />
offshore well data by McIver (1972) and<br />
correlated regionally by Jansa and Wade (1974,<br />
1975). Given (1977) described in detail the<br />
Abenaki’s regional setting, stratigraphic<br />
relationships and petroleum systems’ attributes<br />
on the <strong>Scotia</strong>n Shelf. Eliuk has been the most<br />
consistent researcher on the Abenaki, with a<br />
seminal work (1978) providing an extremely<br />
comprehensive description of the formation and<br />
its various members, facies models, diagenesis,<br />
paleontology, etc., followed by a subsequent<br />
update (1981) and studies focusing on various<br />
members and facies (Eliuk, 1989; Ellis, Crevello<br />
and Eliuk, 1985; Eliuk and Levesque, 1998,<br />
Wierzbicki, Harland and Eliuk, 2002). Other<br />
workers such as Pratt and James (1988), Wade<br />
(1990) and Wade and MacLean (1990) have<br />
contributed further knowledge on the Abenaki.<br />
Williams et al. (1985) compiled all historic<br />
information and related stratigraphic details for<br />
the Abenaki and its members. Using well and<br />
seismic datasets, Wiessenberger et al. (2000),<br />
and later Wierzbicki et al. (2002), defined the<br />
Abenaki facies models and further subdivided<br />
the formation into defined third- and fourth-order<br />
depositional sequences based on<br />
biostratigraphy, well log character, stacking<br />
patterns and seismic sequence stratigraphy.<br />
Based on biostratigraphic information from<br />
offshore wells (references cited above), the age<br />
of the Abenaki Formation extends from the<br />
Middle Jurassic (mid Bajocian) to the lowermost<br />
Early Cretaceous (basal Vallanginian); a period<br />
of virtually continuous carbonate deposition<br />
lasting approximately 40 million years.<br />
The Abenaki Formation is a member of the<br />
Western Bank Group as defined McIver (1972)<br />
and later refined by Given (1977) that includes<br />
five formations which for the most part were<br />
laterally equivalent through time: Mohawk<br />
(continental clastics), Mohican (fluvial-strand<br />
plain), Abenaki (carbonate platform and reef<br />
margin), Mic Mac (fluvial-deltaic) and Verrill<br />
Canyon (prodelta and open marine, deepwater<br />
shales). Weissenberger et al. (2000) recognized<br />
this succession as a first order stratigraphic<br />
sequence with the individual formations as<br />
second order events, with attendant hierarchical<br />
subdivisions within the Abenaki.<br />
The Abenaki is divided into four members<br />
representing different stages of the Jurassic<br />
platform and margin facies’ evolution (Figure 7).<br />
In ascending order, these are the Scatarie,<br />
Misaine, Baccaro and Artimon Members. The<br />
informally termed Roseway Unit (Wade, 1977;<br />
Wade and MacLean, 1990) might be considered<br />
as part of the Abenaki. It is Berriasian-<br />
Valanginian (earliest Cretaceous) age with its<br />
distribution limited to the La Have Platform. It<br />
may be the shallow water equivalent to the<br />
deeper water transgressive Artimon Member.<br />
Utilizing newly acquired extensive 2D and 3D<br />
seismic datasets and information from recently<br />
drilled wells, Weissenberger et al. (2000) and<br />
Wierzbicki et al. (2002) defined the Abenaki<br />
within a sequence stratigraphic framework,<br />
particularly for the Bacarro Member within which<br />
over 1 TCF of gas was discovered in 1999 at the<br />
Deep Panuke field (PanCanadian Energy, 2002)<br />
(Figure 9). Their nomenclature for these thirdorder<br />
sequences - Abenaki 1 to Abenaki 7<br />
(oldest to youngest) - is used in this report in<br />
conjunction with the previously defined<br />
nomenclature. Details on the following<br />
Members are sourced from the aforementioned<br />
citations noted previously in this Section 4.3,<br />
above.<br />
29
Cret.<br />
Jurassic<br />
Portlandian<br />
Abenaki 7<br />
Abenaki 6<br />
Kimmeridgian<br />
Abenaki 5<br />
Oxfordian<br />
Callovian<br />
Bathonian<br />
Bajocian<br />
Aalenian<br />
Toarician<br />
Pliensbachian<br />
Sinemurian<br />
Abenaki 4<br />
Abenaki 3<br />
Abenaki 2<br />
Abenaki 1<br />
Artimon<br />
Baccaro<br />
Misaine<br />
Scatarie<br />
Mohican<br />
Iroquois Fm.<br />
Figure 9. Detailed sequence stratigraphic chart for the Abenaki Formation (EnCana).<br />
5.2.2 Scatarie Member (Abenaki 1)<br />
The basal Scatarie Member (Abenaki 1 of<br />
Weissenberger et al. (2000) and Wierzbicki et al.<br />
(2002) is the most areally extensive sequence of<br />
the Abenaki Formation. It is the only member<br />
that can be continuously mapped on the eastern<br />
part of the <strong>Scotia</strong>n Basin (Banquereau Bank),<br />
east of Sable Island. It conformably overlies<br />
Mohican Formation shallow water progradational<br />
coarse clastics and nearer the basin’s seaward<br />
margins may be underlain by Iroquois Formation<br />
anhydritic, peritidal dolomites and minor clastics.<br />
Along the western and northern margins of the<br />
La Have Platform and Canso Ridge respectively,<br />
the Scatarie sits unconformably on early<br />
Paleozoic basement rocks. It is conformably<br />
overlain by, and probably intercalated with Mic<br />
Mac Formation deltaic clastics on the platform<br />
margins and eastern Sable Basin; elsewhere by<br />
Misaine Member transgressive deepwater<br />
shales.<br />
In profile, the Scatarie is a seaward-thickening<br />
wedge of predominantly platformal oolitic lime<br />
grainstones and packstones, with at least four<br />
deepening-upward transgressive sequences<br />
recognized. It thickens to the southeast from its<br />
depositional limit on the platforms to its<br />
Second Order Sequence<br />
Aalenian - Valanginian (50 ma)<br />
Second Order<br />
Sequence<br />
Hett-Aalenian<br />
(30 ma)<br />
Verrill Canyon Fm.<br />
maximum thickness of greater than 600 metres<br />
along the La Have Platform’s seaward margin.<br />
Seismic reveals the Scatarie extending well<br />
beyond the Jurassic platform edge out into<br />
adjacent basinal region opposite the La Have<br />
Platform. This reflection, the interface between<br />
encasing shales, equates to the deepwater J2<br />
seismic horizon / marker. Seaward of the Canso<br />
Ridge (Abenaki and Laurentian Subbasins), the<br />
continental margin was a broad, highly faulted<br />
basement terrain over which deltaic facies of the<br />
Mic Mac Formation were advancing. <strong>Here</strong>, the<br />
Scatarie was deposited in a ramp-like setting<br />
and intercalated with the Mic Mac with the<br />
carbonates shaling-out into deeper waters.<br />
Biostratigraphic studies of Scatarie sediments<br />
suggest an age of about middle Bajocian to<br />
middle Callovian.<br />
5.2.3 Misaine Member (Abenaki 2 equivalent)<br />
The Misaine Member is the only clastic<br />
component of the Abenaki Formation and this<br />
neritic facies is representative of the Callovian<br />
global transgressive event in the Sable Basin. It<br />
is best developed along the Jurassic shelf<br />
margin being conformable with older Scatarie<br />
and younger Bacarro Member limestones<br />
30
espectively, however, it is recognized in the<br />
subsurface only where overlain by the latter (i.e.,<br />
areas west of the Sable Subbasin depocentre).<br />
The sequence stratigraphic nomenclature for the<br />
Abenaki constructed by Weissenberger et al.<br />
(2000) and Wierzbicki et al. (2002) is limited to<br />
its carbonate members, hence the exclusion of<br />
the Misaine from their ranking.<br />
The Misaine is composed predominantly of dark<br />
grey, slightly calcareous shales with minor beds<br />
of pelleted and laminated lime mudstones. It is<br />
thickest along the Abenaki platform margin<br />
(almost 300 metres in the Mohican I-100 well)<br />
and pinches out landward over the platforms<br />
where it becomes interbedded with or coeval to<br />
coarser grain proximal clastic sediments.<br />
The age of the Misaine is dated from about<br />
middle Callovian to possibly early Oxfordian<br />
(Wierzbicki et al.; 2002). The Oxfordian age<br />
supports Wade and MacLean’s (1990)<br />
observation that on the Western La Have<br />
Platform the Misaine could be younger than<br />
Callovian due to continuous shale deposition<br />
that created conditions unsuitable for carbonate<br />
deposition.<br />
5.2.4 Bacarro Member (Abenaki 2, 3, 4, 5, 6)<br />
The Baccaro Member is the thickest and best<br />
developed carbonate unit of the Abenaki<br />
Formation. However, its areal extent is limited<br />
to a variable, narrow, 15-25 km wide belt that<br />
follows the Jurassic hinge line and defines the<br />
seaward limit of the Abenaki platform margin<br />
(Figure 8). It extends along the entire Jurassic<br />
margin and its physiographic expression had a<br />
significant impact on regional depositional<br />
patterns and facies development during the<br />
Jurassic. It conformably overlies the Callovian<br />
Misaine Member shales, and where present is<br />
overlain by deeper water carbonates and<br />
marls/muds of the Artimon Member (Abenaki 7).<br />
Elsewhere, it is buried by prograding and<br />
onlapping fluvial-deltaic siliciclastic successions<br />
of the Early Cretaceous Missisauga Formation<br />
and its equivalents.<br />
The Baccaro Member is composed of numerous<br />
stacked, shoaling-upwards, agrading and<br />
prograding parasequences. Over the width of<br />
Baccaro belt, a number of laterally equivalent<br />
sedimentary facies were developed - lagoonal to<br />
inner shelf, oolitic shoal, coral-stromatoporoid<br />
reef, and beyond this, reef margin foreslope fans<br />
and aprons. The dominant lithology is limestone<br />
with minor shale and sand intervals representing<br />
the reworked remnants of lowstand events.<br />
Dolomite is recognized in a number of wells and<br />
is present in the Abenaki 2 to 5 sequences. It is<br />
of secondary origin, with dolomitization following<br />
post-depositional leaching of existing primary<br />
carbonate porosity<br />
Eliuk (1978) and later Weissenberger et al.<br />
(2000) subdivided the Baccaro into five, thirdorder<br />
sequence stratigraphic units - Abenaki 2 to<br />
6. Each of these sequences is made up of a<br />
number of stacked shallowing-upward<br />
parasequences as defined by the facies models<br />
constructed by the above authors: A-3 (four), A-<br />
4 (one), and A-5 (three). The acquisition of<br />
additional well and seismic data from the Deep<br />
Panuke gas field allowed Wierzbicki et al. (2002)<br />
to further refine their respective tops and ages.<br />
Within this area, each of the sequences range in<br />
thickness from about 100-300 metres.<br />
Maximum thickness of the complete Baccaro<br />
Member is estimated to be almost 1200 metres<br />
along the eastern margin of the La Have<br />
Platform (Figure 8).<br />
The Abenaki 2 is the basal segment of the<br />
Baccaro Member and is transitional from the<br />
underlying transgressive shales of the Misaine<br />
Member (Abenaki 2, senso stricto). This<br />
transition to lime mud- and wackestones and<br />
oolitic grainstones is variable in thickness and<br />
lithologic content depending on location. It is<br />
virtually non-existent in western platformal areas<br />
though where present includes silty oolitic<br />
limestones, and minor marlstone, shale,<br />
siltstone and sandstone interbeds.<br />
The Abenaki 3, 4 and 5 together make up the<br />
bulk of the Baccaro Member. They exhibit a<br />
number of shallowing-upwards sequences and<br />
record the progradation and aggradation of the<br />
Abenaki platform margin during the upper<br />
Jurassic. The Abenaki 2–5 sequences are<br />
dominated by limestones representing lagoonal,<br />
oolitic shoal, reef and reef margin and talus<br />
facies. Siliciclastic content in these rocks is<br />
minor except where proximal to deltaic facies<br />
(northeast): in the Penobscot L-30 well, almost<br />
the entire Abenaki 3 is made up of fine grain<br />
siliciclastics. It is within the Abenaki 4 and 5 reef<br />
and lower reef margin facies that postdepositional<br />
dolomitization has generated<br />
impressive, highly porous reservoirs within<br />
31
which over 1TCF of gas was found at the Deep<br />
Panuke field.<br />
Rocks of the Abenaki 6 record carbonate<br />
deposition in a progressively deeper water<br />
transgressive bank margin setting. Resultant<br />
mud-rich coral-strom rudstones and floatstones<br />
were subsequently overlain by deeper water,<br />
argillaceous upper foreslope limestones, though<br />
shallow water carbonate facies persist along the<br />
southern part of the margin.<br />
The age of the Baccaro Member extends from<br />
early Oxfordian to the latest Portlandian (mid-<br />
Berriassian) age.<br />
5.2.5 Artimon Member (Abenaki 7)<br />
The Artimon Member is the youngest sequence<br />
of the Abenaki Formation. It is also the thinnest<br />
(30-115 metres) with a very modest and patchy<br />
areal distribution limited to the eastern part of<br />
Abenaki platform margin edge. It has been<br />
encountered in a number of well penetrations<br />
confirming its existence in the Cohasset-Panuke<br />
area and eastern limit of the Abenaki margin.<br />
Lithologically, the Artimon is composed of<br />
argillaceous, cherty limestones representing<br />
thrombolitic sponge and stromatoporoid mound<br />
deposition, with occasional interbedded<br />
calcareous shales. The associated fossil<br />
assemblage infers a reef middle foreslope<br />
depositional setting in water depths between<br />
100-200 metres near the limits of the photic<br />
zone (Eliuk, 1978). The presence of these<br />
sponge-stromatoporoid mounds at the top of the<br />
drowned platform margin edge reflects<br />
depositional response to a major sea level rise<br />
during the earliest Cretaceous (Berriasian).<br />
Based on its lithologies and age, Wade and<br />
MacLean (1990) suggest that the Artimon<br />
should be considered a facies of the Verrill<br />
Canyon Formation. The Artimon sponge<br />
mounds were eventually buried by fluvial-deltaic<br />
clastics of the Missisauga Formation, effectively<br />
terminating carbonate deposition in this region,<br />
though coeval deposition of shallow water<br />
carbonates continued on the western portion of<br />
the La Have Platform as recognized in<br />
lithologies of the Roseway Unit.<br />
The Artimon Member is the only part of the<br />
Abenaki Formation that extends into the<br />
Cretaceous and is considered to be upper<br />
Berriasian (Ryanzanian) age. (Wierzbicki et al.,<br />
2002)<br />
5.2.6 Roseway Unit<br />
While not a member of the Jurassic Abenaki<br />
Formation, lithologies of the Roseway Unit are<br />
important as they represent a continuation of<br />
favourable conditions for carbonate deposition<br />
extending well into the Early Cretaceous.<br />
Similar age and younger carbonate sequences<br />
dominate the North American continental margin<br />
south of the Sable Basin.<br />
The Roseway Unit is an informal term used to<br />
define the regressive succession of mixed<br />
shallow water limestones, sandstones, siltstones<br />
and shales. It conformably overlies the Baccaro<br />
Member carbonates on the central and western<br />
portions of the La Have Platform, and in the<br />
proximal setting of these areas, siliciclastics of<br />
the Mic Mac Formation (Wade, 1977; Wade and<br />
MacLean, 1990). The Roseway is considered<br />
the lateral equivalent of the fluvial-deltaic-strand<br />
plain successions of the Missisauga Formation<br />
(ibid.). With a recorded maximum thickness of<br />
270 metres it is quite thin when compared to the<br />
1000s of metres of Missisauga sediments. This<br />
essentially condensed section is the response to<br />
its position on the stable La Have Platform, slow<br />
subsidence, distal position to deltaic<br />
depocentres in the east and northeast, and<br />
marine conditions favourable for carbonate<br />
deposition.<br />
The Roseway is known from a single<br />
penetration; the Mohawk B-93 well. However,<br />
interpretation of seismic data confirms its<br />
significant areal extent, and in profiles, reveals it<br />
as a seaward-tapering wedge of moderate to<br />
high amplitude reflections downlapping onto the<br />
top of the Baccaro Member. In areas of poor<br />
well control, the internal reflections can be<br />
confused with the Missisauga’s ubiquitous ‘O’<br />
Marker”, a highly mappable Barremian age<br />
oolitic limestone facies common throughout the<br />
eastern and central <strong>Scotia</strong>n Basin.<br />
The Roseway’s age extends over the entire<br />
Neocomian - Berriassian to Barremian (Wade<br />
and MacLean, 1990).<br />
5.3 Abenaki Platform Margin Facies Models<br />
The Middle-Late Jurassic-age Abenaki<br />
Formation offshore <strong>Nova</strong> <strong>Scotia</strong> has long been<br />
32
ecognized as a classic trailing margin<br />
carbonate platform and basin margin succession<br />
from early well results and seismic data. McIver<br />
(1972) and his team at Shell <strong>Canada</strong> utilized<br />
data available from the 23 wells drilled on the<br />
<strong>Scotia</strong>n Shelf to establish the basic stratigraphic<br />
framework for the Abenaki Formation and the<br />
remaining Mesozoic and Tertiary sequences.<br />
Further expansion of knowledge on the Abenaki<br />
was presented by Jansa and Wade (1974) and<br />
followed by research from another Shell <strong>Canada</strong><br />
member, M.M. Given (1977). It was during this<br />
period from 1969-1977 that most of the<br />
exploration wells drilled into the Abenaki were<br />
completed.<br />
The most significant contribution to defining<br />
Abenaki facies relationships was made by yet<br />
another Shell <strong>Canada</strong> geoscientist, L. S. Eliuk<br />
(1978). Eliuk’s monumental work remains the<br />
foundation upon which all subsequent research<br />
has been built upon and most of his<br />
interpretations remain valid today. In his study,<br />
Eliuk drew upon results from 22 wells from<br />
which the data were then available (end of 1976)<br />
as well as four subsequent wells, all of which<br />
penetrated Abenaki Formation or its equivalents.<br />
Seismic data was used to assist with well<br />
correlations, areal extent of the Abenaki, internal<br />
facies characteristics and the like. The log,<br />
cuttings and core data were used to determine<br />
stratigraphic relationships, lithologies,<br />
identification, textures, bedding and sedimentary<br />
structures, range and distribution of<br />
macrofossils, microfossils, diagenetic features,<br />
reservoir characteristics, etc. These were all<br />
interpreted in a paleoenvironmental framework<br />
and lithofacies and regional paleographic maps<br />
created. Slightly revised and enlarged copies of<br />
these maps were published by the Geological<br />
Survey of <strong>Canada</strong> (1991).<br />
From his research, Eliuk (1978) defined two<br />
deepening-upward megasequences within which<br />
are 10 facies associations extending from the<br />
open ocean to terrestrial environment: open<br />
marine (bathyal, neritic), fore-reef, open<br />
marine/offshore bank (sponge reef, skeletal-rich,<br />
coralgal reef, mud/pelleted, oolitic), moat,<br />
nearshore ridge, lagoonal/continental, mixed<br />
carbonate-deltaic and deltaic. He interpreted<br />
possible distribution of these various facies<br />
through time in a paleoenvironmental and<br />
paleotectonic context with broad insights on the<br />
development of the Jurassic carbonate bank<br />
margin. Four major transgressive cycles were<br />
also identified within the Baccaro Member.<br />
Additional data and later research by Eliuk and<br />
colleagues refined interpretations of some<br />
aspects of the Abenaki: two types of deep water<br />
carbonate build-ups: thrombolite-stromatolite<br />
bioherms on the upper portion of foreslope<br />
ramps and steep platform margins of the<br />
Baccaro Member, and younger sponge reefs<br />
patchily distributed on the rapidly-drowned and<br />
deepened Baccaro platform (Ellis et al., 1985;<br />
Eliuk and Levesque, 1989; Jansa et al., 1989);<br />
and Baccaro Member shallow water coral and<br />
sponge reef facies (Pratt and Jansa, 1989).<br />
Jansa (1981) and Jansa and Weidmann (1982)<br />
discussed the Abenaki Formation in a circum-<br />
Atlantic context.<br />
Following the discovery of the Deep Panuke<br />
Field by PanCanadian (EnCana) in 1998,<br />
subsequent delineation and exploration wells in<br />
and around the field provided an excellent<br />
database over a geographically confined area.<br />
Based on current sequence stratigraphic<br />
concepts, Weissenberger et al., (2000); and<br />
Wierzbicki et al. (2002) subdivided the Jurassic<br />
carbonate platform succession into two secondorder<br />
depositional sequences (representative<br />
example, Figure 10; Abenaki details in Chapters<br />
4.2 & 5.2). Briefly, the initial sequence contains<br />
four Formations of Early to Middle Jurassic age<br />
lasting about 30 million years and includes Argo<br />
evaporites, Eurydice peritidal siliciclastics,<br />
Iroquois shallow marine carbonates and<br />
Mohican fluvial clastics. The second sequence<br />
lasted about 50 million years and extended from<br />
the Middle Jurassic to earliest Cretaceous<br />
represented by the Abenaki carbonate platform<br />
succession, and Mohican and MicMac fluvialdeltaic<br />
clastics. Within the Abenaki Formation,<br />
six (6) third-order depositional sequences were<br />
defined by Weissenberger et al., (ibid) and later<br />
modified to include a seventh (Wierzbicki et al.,<br />
ibid): Abenaki 7 (Artimon Mbr.), Abenaki 6<br />
(Baccaro Member), Abenaki 5 (Baccaro<br />
Member), Abenaki 4 (Baccaro Member),<br />
Abenaki 3 (Baccaro Member), Abenaki 2<br />
(Misaine and basal Baccaro Members), and<br />
Abenaki 1 (Scatarie Member).<br />
33
Figure 10. Generalized Wilson carbonate sequence stratigraphic model (L.E. Waite, 1997).<br />
The relationship of these sequences (Figure 9)<br />
incorporates new biostratigraphic information<br />
(Wierzbicki, personal communications, 2003;<br />
Wierzbicki et al., 2002). Lithostratigraphic<br />
details are provided in the previous Chapter 5.2.<br />
The excellent quality log data, cuttings, limited<br />
cores and seismic data, coupled with a detailed<br />
review of analogue successions in Europe,<br />
Morocco and North America, permitted<br />
Weissenberger et al., (2000) and later<br />
Wierzbicki et al. (2002) to create a detailed<br />
facies model for the Baccaro Member<br />
carbonates (Figures 11 & 12). Their<br />
representative fourth-order shoaling-upwards<br />
sequence model included 14 facies associations<br />
and closely followed that originally defined by<br />
Eliuk (1978). Each of the Baccaro/Abenaki 2 to<br />
6 carbonate sequences consists of multiple sets<br />
of 10-30 metre thick four-part accretionary lowstand<br />
to high-stand bundles (progradational,<br />
aggradational, progradational and offlapping).<br />
The type of carbonate build-up long the Abenaki<br />
bank margin, within which the Deep Panuke<br />
reservoir facies occur, was initially recognized<br />
by Eliuk (1978) as being dominated by<br />
stromatoporoid-coral-algal framestones,<br />
boundstones and reef debris. The Abenaki<br />
margin profiles ranged from ramp-like to<br />
escarpment. He further noted several<br />
paradoxes in the succession: extensive high<br />
energy oolitic shoal facies inboard of the bank<br />
margin, and the high level of micritic muds within<br />
the reefal sediments. The oolite facies was<br />
thought to represent inboard shoaling.<br />
Microbialite crusts were recognized as<br />
stabilizing the reef in this high-energy zone.<br />
Both were postulated to indicate reef systems<br />
occurring in slightly deeper water near wavebase.<br />
The “knoll-reef ramp” in the Oxfordian<br />
Swiss Jura of Wilson (1975) was considered the<br />
best analogue to describe the Abenaki reef<br />
margin system.<br />
34
Figure 11. Simplified Abenaki Fm. carbonate facies model and associations (Weissenberger et al., 2000)<br />
Weissenberger et al. (2000) and Wierzbicki et al.<br />
(2002) expanded upon Eliuk’s (1978)<br />
interpretation. They considered that data from<br />
newer wells supported Eliuk’s selection of<br />
Wilson’s (1975) knoll-reef model having a broad,<br />
platform-crest oolitic shoal facies with slightly<br />
downslope coralgal debris reefs. The presence<br />
of high levels of micritic muds and evidence of<br />
boring organisms supported the bioerosion<br />
source for the muds, and the reef position below<br />
fair weather wave base would preserve the<br />
muds prior to binding by encrusting organisms<br />
or downslope movement into deeper water.<br />
Detailed core study by Harland and Weirzbicki<br />
(2003) and Eliuk (2003) further refined the facies<br />
definitions, and also the significance of<br />
syndeposition bioerosion and the effects of<br />
future diagenetic events on its products (Eliuk,<br />
ibid.).<br />
Seminal work on global Jurassic reef<br />
ecosystems has been published by Leinfelder<br />
(1993; 2001; 2002). Leinfelder (1993)<br />
recognized that the majority of Jurassic<br />
bioclastic reefs are poorly preserved with little<br />
framework organisms and features observed,<br />
and as such exist mostly as bioclastic piles of<br />
debris: debris reefs. Few frame-building<br />
organisms are present and the associated coral<br />
and siliceous sponge taxa also high amounts of<br />
micritic mud which are interpreted to be the<br />
possible result of an insidious boring epifauna.<br />
Leinfelder (2001; 2002) noted that in areas with<br />
elevated nutrients levels (e.g., proximity to delta<br />
complexes) there are corresponding increases<br />
in bioerosion with the organisms identified as<br />
various filter feeders (boring bivalves, serpulid<br />
worms) and echinoids. They appear to help<br />
preserve the reefs in these settings by feeding<br />
off the biota attracted by elevated nutrient levels.<br />
Furthermore, it is suggested that Jurassic corals<br />
may have been somewhat more tolerant of<br />
elevated nutrient levels, more so than existing<br />
corals.<br />
In the Jurassic, the binding organisms were not<br />
as effective as those existing today for debris<br />
fixation and so steep reef margins assisted in<br />
exporting large quantities of reef debris into<br />
deep water thus permitting the microbial crusts<br />
to stabilize the remaining material (Leinfelder,<br />
1993; 2002). The creation of significant volumes<br />
of reef debris and preservation of finer micritic<br />
sediments infers a near-wave base setting. The<br />
remaining high energy reef limestones are thus<br />
rich in both crusts and debris which seem to be<br />
indicative of bypass margin situations. Such<br />
reefs are also associated with autochthonous<br />
oolite sands (as noted by Eliuk, 1978) indicative<br />
of a shallow water, high energy environment<br />
with the reefs in a slightly deeper downslope<br />
position.<br />
35
FACIES ASSOCIATIONS DEPTH RANGE (m)<br />
1 OPEN MARINE – Deep >200<br />
2 OPEN MARINE – Shallow 100 – 200<br />
3 FORESLOPE<br />
3a Channel – debris flow or turbidite related 10 – 100+<br />
3b Proximal – fore-reef 10 – 70<br />
3c Distal - microbial mud mounds “5c” 70 – 100<br />
4 FORESLOPE – BIOHERMS & BIOSTROMES<br />
4a Siliceous Sponge (hexactinellid,& lithistid) Reef >100<br />
4b Lithistid Sponge-Chaetetid-Stromatoprroid Reef 30 – 100<br />
4c Coral-Demosponge (lithistid- stromatoporoid-chaetetid) ‘Shallow’ Reef 10 – 50<br />
5 OPEN MARINE PLATFORM MARGIN<br />
5a Skeletal-Rich (fore-reef rubble, reef crest & back reef sand flat) 10–50 / 1–2 / 1–5<br />
5b Coral-Stromatoporoid-Chaetetid-Algal Reef 2 – 10<br />
5c Pelleted Mudstone to Grainstone (lagoon, back reef, inter reef) “3c” 5 – 10<br />
5d Oolitic Grainstone Shoals 1 – 5<br />
5e Oncolitic Back-reef (shallow back-reef to shoal margin) 1 – 5<br />
5f Sandstone (by-pass, lowstand, reef infiltrate) 1 – 3<br />
6 CARBONATE PLATFORM INTERIOR – “Moat” 5 – 20<br />
7 MIXED CARBONATE SLICICLASTIC PLATFORM INTERIOR 3 – 10<br />
8 COASTAL DELTAIC SYSTEM (lagoonal to continental) 1 – 5<br />
Figure 12. Detailed Abenaki Fm. carbonate facies model and associations (Weirzbicki et al., 2002)<br />
5.4 Bank Profiles<br />
When evaluating carbonate bank margins the<br />
first objective is to understand their location and<br />
morphology. This is not a simple matter<br />
because the reef-building organisms can follow<br />
very circuitous routes in their quest for survival<br />
followed by subsequent exposure to erosion and<br />
faulting. During deposition a carbonate bank<br />
acquires varying profiles as a function of sea<br />
level, climate, siliciclastic sediment supply, salt<br />
movement, faulting, etc. A facies map of the<br />
Great Bahama Bank, which is a large feature,<br />
measures about 600 km in its long direction and<br />
about 350 km wide (Figure 13). As an ellipse its<br />
uninterrupted perimeter would be approximately<br />
1250 km but if all embayments are measured<br />
with potential for framebuilding the perimeter is<br />
almost doubled to 2500 km.<br />
The block diagrams of Read (1985) display<br />
various styles of carbonate bank edges (Figure<br />
14). The ‘A’ or accretionary rimmed shelf<br />
diagram depicts the general situation offshore<br />
<strong>Nova</strong> <strong>Scotia</strong>. Seismically, this profile is the<br />
familiar sigmoidal bank edge seen along the<br />
36
Panuke Segment and in places along the Acadia<br />
Segment where it has been preserved. The<br />
steeper escarpment style of block ‘C’ and the<br />
erosional margin of block ‘D’ are prevalent along<br />
the Acadia Segment. The degree of faulting<br />
and/or erosion is not clear but can have<br />
significant impact on the preservation,<br />
diagenesis, reservoir formation and hydrocarbon<br />
migration. Seismic examples of these and a<br />
map of occurrence are presented in Chapter 7.<br />
A series of profiles based on seismic profiles<br />
illustrates the major differences in margin<br />
profiles along the circum-North Atlantic (Figure<br />
15). Those profiles off <strong>Nova</strong> <strong>Scotia</strong> grade from a<br />
gently dipping ramp margin with inter-fingered<br />
carbonate and clastic facies at Penobscot to a<br />
steeper sigmoidal bank margin at Deep Panuke,<br />
an eroded margin at Acadia and a<br />
faulted/eroded margin at Bonnet. The profile<br />
from the Baltimore Canyon shows a seaward<br />
aggrading profile. On the conjugate margin the<br />
profiles are similar to Deep Panuke and Acadia<br />
and these will be examined in more detail in<br />
Chapter 6. The Mauritania profile resembles the<br />
Bonnet section but this is a cursory comparison.<br />
The rimmed or barrier shelf edge is not<br />
continuous along the eastern seaboard but<br />
where it does occur is restricted to a narrow belt<br />
as envisioned off <strong>Nova</strong> <strong>Scotia</strong> (Eliuk, 1978) and<br />
in the Baltimore Canyon (Prather, 1991) (Figure<br />
16). Whereas this positive relief may not be a<br />
critical factor in trapping, it is nonetheless a<br />
favourable circumstance.<br />
It is important to accurately map the paleo bank<br />
edge to capture the optimum skeletal reef zone.<br />
On a regional basis the steep bank edge can be<br />
inferred but on a local, i.e. prospect basis, the<br />
bank edge is compromised by faulting, mass<br />
movements, erosion and the ensuing seismic<br />
imaging problems. Accurate mapping for the<br />
narrow play fairway will require 3D seismic<br />
surveying.<br />
Schlee et al (1988) illustrate the different types<br />
of paleoshelf edges interpreted along the U.S.<br />
Atlantic margin in map view (Figure 16). The<br />
main styles are rimmed (or rather preserved rim)<br />
platform, ramp, eroded and faulted/eroded. The<br />
symbol designating a “rimmed” platform along<br />
George’s Bank and to the northeast is<br />
oversimplified. The new map created as a result<br />
of our research annotates the complexities of<br />
the paleo-bank edge and the ensuing difficulty of<br />
tracking what is left of the original belt of reefal<br />
facies, the exploration target for this play (Figure<br />
8). To the list of preserved, faulted and eroded<br />
rim margins, we have added salt disruption and<br />
longitudinal channel erosion. These appear as<br />
destructive influences rather than reservoir or<br />
trap enhancers and as such will add to the play<br />
risk especially in the Acadia and Shelburne<br />
Segments.<br />
5.5 Pre-Platform Geology, Salt Tectonism<br />
and the Montagnais Impact Event<br />
The lithostratigraphy of the pre-Abenaki geologic<br />
succession is detailed in Chapter 4.<br />
Rifting was initiated on the <strong>Nova</strong> <strong>Scotia</strong> and<br />
Moroccan conjugate margins sometime in the<br />
Middle Triassic. Significant thermal doming and<br />
extension permitted reactivation of earlier<br />
Variscan-age compressional features both on a<br />
regional and local scale. On the <strong>Scotia</strong>n margin,<br />
extensional rift basins were formed in the Bay of<br />
Fundy region, Orpheus Graben, La Have<br />
Platform and the regions seaward of the margin<br />
hinge-line out to the future rift axis (Wade and<br />
MacLean, 1990; Wade et al., 1996). The more<br />
inboard (Fundy and Orpheus) and platformal<br />
(Naskapi and Mohican) have little or no<br />
overlying post-rift successions and reveal<br />
significant extensional motion and subsidence<br />
and filled with thick continental fluvial, lacustrine,<br />
aeolian and playa sequences. Rift proximal<br />
basins along the hinge line and beyond are<br />
deeply buried and very poorly if at all imaged,<br />
though most likely had similar stratigraphic<br />
successions with some marine components in<br />
the Late Triassic.<br />
Marine incursion into the proto-Atlantic rift basin<br />
occurred during latest Triassic (Norian) to<br />
earliest Jurassic (Hettangian) time and is<br />
recorded via the presence of variably thick Argo<br />
Formation evaporites (Wade and MacLean,<br />
1990). The Argo was deposited in depositional<br />
lows along the fractured hinge line region that in<br />
some cases extended well inboard onto<br />
platformal regions (e.g. Orpheus Graben,<br />
Mohican Graben). The inboard reach of the<br />
Argo is confirmed through well penetrations and<br />
seismic correlations (e.g. Mohican I-100 well:<br />
(Figure 16) and in MacLean and Wade, 1993).<br />
Maximum thickness of the Argo is estimated to<br />
have been in the order of at least 1800 metres<br />
(Jansa and Wade, 1975) along the seaward<br />
margin of the basin hinge-line.<br />
37
Figure 13. Surface sediment facies of the Florida-Bahamas Plateau (Enos, 1974).<br />
38
Figure 14. Isometric models of carbonate margin types (Tucker and Wright, 1990 in Moore, 2001).<br />
Figure 15. Simplified profiles of the various Jurassic carbonate bank margin types, circum-North and<br />
Central Atlantic region.<br />
39
Figure 16. Jurassic carbonate bank margin types, Eastern North America (Schlee et al., 1988).<br />
Base Tertiary<br />
Roseway<br />
Top Jurassic<br />
Scatarie<br />
Breakup Unc<br />
Glooscap?<br />
Salt<br />
-------- 6 km --------<br />
Mohican I-100<br />
Figure 17. TGS regional seismic line through the mouth of the Mohican Graben and Mohican I-100 well.<br />
Post-salt sedimentation (Heracles Unit) deformed Argo Formation (Hettangian) salt deposits creating<br />
structures that predate the ca. mid-late Sinemurian Breakup Unconformity (BU). Note that in the synclinal<br />
basin northwest (left) of the salt features sediment reflectors appear concordant with the BU. Deeper<br />
high amplitude reflections may be extrusive volcanics encountered in the nearby (35 km NE) Glooscap C-<br />
63 well. Subsequent post-BU Middle Jurassic to Early Cretaceous carbonate deposition built up and over<br />
the stabilized margin. Later tilting and destabilization of the margin may have been triggered by the Early<br />
Eocene Montagnais Impact Event. Line location in Figure 4.<br />
40
Base Tertiary<br />
Top Jurassic<br />
Scatarie<br />
Breakup Unc<br />
Salt<br />
------- 6 km -------<br />
Figure 18. TGS regional seismic line through the mouth of the Mohican Graben about 42 km northeast of<br />
the line shown in Figure 17. Significant faulting of the margin and platform is present with faults soling on<br />
to Argo Formation salt features. There is no evidence of growth in adjacent strata and vertical fault<br />
penetration is limited to small offsets of the Base Tertiary unconformity (yellow). Pre-BU high amplitude<br />
reflections ponded above the salt are thought to be basalts equivalent to the Hettangian Glooscap<br />
volcanics equivalent to the tholeiitic basalts of the North Mountain Formation in the Fundy Basin (Wade<br />
and MacLean, 1990, Wade et al., 1996). Line location in Figure 4.<br />
Seismic data along the carbonate bank margin<br />
reveals an intimate relationship between the<br />
Argo Formation evaporites and deposition of the<br />
Abenaki carbonate back margin. Two phases of<br />
pre-Abenaki salt deformation are observed, both<br />
driven by rapid sediment loading: 1) Post<br />
Salt/Pre-Break-up Unconformity (early<br />
Hettangian to middle Sinemurian), and 2) Post-<br />
Salt/Post-Break-up Unconformity (late<br />
Sinemurian to middle Bajocian). These two<br />
events resulted in the formation of salt swells<br />
and ridges, and provide insights on related<br />
depositional successions and the margin’s<br />
evolution. Several phases of post-Jurassic salt<br />
motion were geographically restricted and<br />
variably deformed the bank margin in defined<br />
locations. Diapiric salt structures on the margin<br />
foreslope, and beyond, show episodic motion<br />
extending from the Middle Jurassic to the<br />
present.<br />
The driving force for the pre-Break-up<br />
Unconformity (BU) salt deformation phase on<br />
the platformal areas of the Acadia Segment (and<br />
probably the hinge line regions as well) was<br />
loading of the Argo strata by a progradational<br />
wedge of interpreted clastics sourced from the<br />
northwest. This as-yet undrilled sequence<br />
appears to conformably overlie the Argo<br />
Formation in the Mohican Graben and its<br />
distribution is probably limited to local<br />
depocentres along and adjacent to the hinge line<br />
area. Maximum thickness is estimated to be<br />
about 1000 metres. Seismic profiles in this<br />
41
egion show the sediments displaying wedgeshaped<br />
geometries with thickening into<br />
evacuated lows and thinning onto salt feature<br />
highs, thus indicating syndepositional salt<br />
motion. This succession is best imaged in the<br />
Mohican Graben (Figures 17 & 18) and along<br />
the corresponding seaward margin. In keeping<br />
with the pedigree and nomenclature of its<br />
related formations, this sequence is herein<br />
informally termed the “Heracles Unit”.<br />
Sediments of the Heracles Unit prograded onto<br />
and rapidly loaded the underlying Argo<br />
evaporites forming salt evacuation synclines<br />
inboard of salt swells and ridges moving to the<br />
seaward edge of the margin. A portion of a<br />
regional strike line from the TGS survey shows a<br />
dramatic juxtaposition of salt penetrating the<br />
Tertiary<br />
Marker<br />
Base Tertiary<br />
Roseway<br />
Top Jurassic<br />
Scatarie<br />
Salt<br />
---- 6 km -----<br />
Albatross B-13<br />
platform beneath the bank margin and in front of<br />
the bank at the mouth of the Mohican Graben<br />
(Figure 19).<br />
On the platforms, high amplitude reflectors at<br />
the Argo Formation stratigraphic interval are<br />
interpreted as evaporite/carbonate/clastic<br />
sequences. These events can be linked to salt<br />
swells and diapers located near the edge of the<br />
platformal areas. It is interpreted that these<br />
amplitude events represent the deflated remains<br />
of the bedded evaporites now lacking salt.<br />
These intervals appear to have acted as salt<br />
welds, with most moveable salts converging<br />
through buoyancy into diapiric structures moving<br />
in a seaward direction towards the Abenaki<br />
platform margin.<br />
Figure 19. TGS regional seismic line through the Albatross B-13 well, southwest <strong>Scotia</strong>n Slope. Margin<br />
subsidence was possibly triggered by the Montagnais Impact Event resulting in deflation of the underlying<br />
margin salt and creation of salt diapirism in the basinal and platformal successions. The platform diapir<br />
(NW) is located at a hinge line location that in similar lines is defined by a basin-dipping normal fault. Line<br />
location in Figure 4.<br />
Relief generated by salt motion acted as baffles<br />
and barriers which further contained and/or<br />
captured these early Jurassic sediments. Both<br />
the salt and the Heracles strata were onlapped,<br />
truncated and/or eroded during the BU event of<br />
approximate Late Sinemurian age (Wade and<br />
42
MacLean, 1990). Based on stratigraphic<br />
relationships, the Heracles Unit probably<br />
extends from the earliest Hettangian to possibly<br />
the Middle Sinemurian.<br />
The mid-late Sinemurian Break-up Unconformity<br />
on the <strong>Scotia</strong>n Margin represents the final phase<br />
of rifting and separation of <strong>Nova</strong> <strong>Scotia</strong> and<br />
Morocco. It is observed as a mappable<br />
erosional event with variable angularity in the<br />
underlying successions depending on the<br />
region. Major faulting occurred at the basin<br />
hinge line along the entire <strong>Nova</strong> <strong>Scotia</strong><br />
continental margin related to the separation of<br />
<strong>Nova</strong> <strong>Scotia</strong> and Morocco. This event had the<br />
additional effect of stranding significant<br />
sequences of salt and related evaporites on the<br />
platformal footwall and down-dropping the<br />
thicker succession on the hanging wall, now at<br />
the newly-formed continental margin.<br />
The Break-up Unconformity has the appearance<br />
of a transgressive surface of erosion and marks<br />
the first phase of global Jurassic sea level rise,<br />
with younger strata displaying onlapping<br />
relationships. This latter succession is made up<br />
mostly of shallow marine dolomites (Iroquois<br />
Formation) and then a major carbonate bank<br />
and platform complex forming along most of the<br />
margin’s length (Abenaki Formation). Along the<br />
Acadia Segment, the first phase of salt<br />
tectonism appears to have ceased at about the<br />
time of the BU with the Argo evaporites<br />
establishing equilibrium with the overlying<br />
sediments.<br />
The post-Break-up Unconformity salt<br />
deformation event is observed in seismic and<br />
wells on the Panuke Segment of the Abenaki<br />
bank margin. In this region, Iroquois Formation<br />
shallow marine dolomites were laid down over<br />
the BU surface followed by southeast to<br />
southwest-directed progradational siliciclastics<br />
of the Mohican Formation, the latter possibly a<br />
precursor succession of the Sable Delta<br />
Complex. Seismic dip profiles on the northeast<br />
extent of the Panuke Segment near the<br />
Kegeshook G-67 well show the Mohican fluvial<br />
sandstones deposited in salt-evacuation<br />
synclines formed by loading of the sediments.<br />
Long linear salt ridges were created by this<br />
process and their shapes may provide clues to<br />
the underlying basement morphology and<br />
original salt distribution (various maps in Wade<br />
and MacLean, 1990 and in GSC, 1991).<br />
Seaward of Kegeshook ridge, Mohican<br />
sediments prograded out into the basin, and<br />
over a probable deep basement hinge line fault.<br />
Salts in this setting were also laterally deformed<br />
and the resultant evacuation syncline probably<br />
formed a temporal local bathymetric low.<br />
The salt structures appeared to reach<br />
equilibrium with the overlying and surrounding<br />
strata by the time of the next sea level rise and<br />
deposition of the Scatarie/Abenaki 1 ramp<br />
margin facies. The margin break appears to<br />
correspond with the underlying Kegeshook ridge<br />
and the seismic profiles show the Baccaro<br />
Member of the Abenaki prograding seaward<br />
from this position. The seismic data indicates<br />
syndepositional salt movement in the post-BU<br />
Middle to Upper Jurassic Iroquois and Abenaki<br />
Formations, however, this appears limited to the<br />
basinal region seaward of the platform margin.<br />
In this setting, only minor post-Jurassic faulting<br />
and deformation by loading of later sediments is<br />
seen.<br />
This post-BU salt motion may have been an<br />
influencing factor in the structural component of<br />
the Deep Panuke field. Time and depth maps<br />
for the top of the Abenaki 5 and 6 sequences<br />
reveal a distinctive long, bank-parallel,<br />
northeast-plunging syncline immediately behind<br />
the eastern half of the Deep Panuke field (see<br />
Figures 26-28, 33-33). The deeper time map on<br />
the Lower Jurassic “Near Basement” infers an<br />
older structure in which deposition of Argo salts<br />
could have been concentrated (see Figure 78).<br />
Along the edge of the margin and especially the<br />
foreslope region, later post-Jurassic diapiric<br />
intrusion and faulting of the Abenaki sequences<br />
did occur sometime during the Cretaceous<br />
(based on observed fault penetrations) though it<br />
is unclear as to what was the regional<br />
extensional tectonic event which triggered the<br />
structuring. Perhaps it was the Early<br />
Cretaceous age Avalon Unconformity, which is<br />
the erosional manifestation of rifting and<br />
separation of Iberia and the Grand Banks – i.e.,<br />
the collapse of its precursor, the “Avalon Uplift”<br />
(AU). MacLean & Wade (1990, p.214) believe<br />
that the AU is of early Cretaceous age, being<br />
short-lived and locally severe. The<br />
unconformity, as traced over the Abenaki<br />
Subbasin and Banquereau Banks, shows little<br />
angularity. Subsidence following the Avalon<br />
Uplift was slow and intermittent creating a series<br />
of smaller unconformities. Similar types of<br />
unconformities and diapirism affecting the Lower<br />
Cretaceous are observed in the Whale and<br />
43
South Whale Basins, though here have<br />
associated salt withdrawal synclines, infill<br />
successions, onlapping relationships and minor<br />
erosion. Similar features appear only at and/or<br />
adjacent to the Abenaki Bank Margin.<br />
SOUTHWEST NORTHEAST<br />
Mean Sea Level<br />
Present-Day<br />
Pleistocene<br />
Miocene<br />
Oligocene<br />
Eocene<br />
BASEMENT<br />
Shelf Break<br />
T<br />
Jr<br />
ARGO<br />
T<br />
K<br />
ROSEWAY<br />
IROQUOIS<br />
HERACLES<br />
?<br />
BACCARO<br />
MISAINE<br />
SCATARIE<br />
BASEMENT<br />
WYANDOT<br />
LOGAN CANYON<br />
MISSISAUGA<br />
MID-CRETACEOUS UNCONFORMITY<br />
MOHICAN<br />
'O' MKR<br />
?<br />
T<br />
T<br />
EURYDICE<br />
Paleo Shelf<br />
Break<br />
BASEMENT<br />
Shelf Break<br />
BASE TERTIARY UNCONFORMITY<br />
K<br />
VERRAL<br />
CANYON<br />
Figure 20. Regional schematic strike section illustrating the stratigraphic relationships of the Abenaki Formation and<br />
related formations. The line of section approximates the trace of the platform margin along the edge of the <strong>Scotia</strong>n<br />
Shelf and extends about 650 km from the Shelburne Subbasin in the southwest to the Gully area northwest of Sable<br />
Island. Given the geometry of the Abenaki shelf margin break and later Tertiary events, is uncertain if the mid-<br />
Cretaceous unconformity reached the top of the Abenaki strata. Where observed on seismic, any physical erosion of<br />
the margin edge is appears minor. Most of the margin edge is intact suggesting possible slope contour current<br />
erosion that swept the shelf edge margin of softer sediments down to the harder carbonates.<br />
In the early Tertiary, the edge of the La Have<br />
Platform (Acadia Segment) west of the Mohican<br />
Graben was subjected to a major bolide impact<br />
event. The Montagnais structure is believed to<br />
be of impact origin and is dated at 50.50±0.76<br />
Ma (Early Eocene), creating a crater complex<br />
approximately 45 km in diameter (Bottomley and<br />
Gates, 1988; Jansa et al., 1989; Wade and Mac<br />
lean, 1990). The <strong>Board</strong>’s mapping, using the<br />
latest TGS seismic dataset, suggests a smaller<br />
diameter of about 35 km. In the outer crater ring<br />
walls, Cretaceous and Jurassic age sediments<br />
were variably tectonized, with Abenaki strata<br />
subjected to significant thrust and reverse<br />
faulting. At the mouth of the Mohican Graben,<br />
ARGO<br />
segments of the continental margin underlain by<br />
salt (up to 30 km in width) were normally faulted<br />
with these faults terminating in lower Tertiary<br />
strata (Figure 18). In addition, since there is no<br />
seismic evidence for post-BU sediment-induced<br />
salt tectonism, it is postulated that the faulting is<br />
related to the Montagnais event. This process is<br />
analogous to the ‘regional shaking’ and<br />
subsequent mass transport event of Late<br />
Cretaceous platform margin reefal sequences<br />
onto the deep water slope and base of slope in<br />
response to the K/T Chicxulub impact in the<br />
Western Gulf of Mexico (Magoon et al., 2001,<br />
p.117).<br />
BU<br />
44
5.6 Overcrop and Unconformities<br />
The carbonate bank has been subjected to<br />
erosion at different times throughout it’s history<br />
and to varying areal extent. A schematic<br />
drawing illustrates the current definition of<br />
unconformities observed in the seismic<br />
interpretation (Figure 20). The Baccaro is<br />
topped by the Roseway in the west which is<br />
believed coeval to the ‘O’ Marker in the east. In<br />
the Sable Subbasin the Mid-Cretaceous<br />
Unconformity truncates the ‘O’ Marker and also<br />
breaches the Baccaro bank edge in isolated<br />
areas. Due to the influx of the Cretaceous Sable<br />
Delta siliciclastics the Tertiary unconformities do<br />
not reach the bank edge. To the west the<br />
situation is very different.<br />
Because of the reduced Cretaceous loading, the<br />
Tertiary unconformities eroded the bank edge<br />
and sometimes merge. The base of Tertiary can<br />
be mapped with some confidence but with a<br />
paucity of well data the ages of the subcrop and<br />
overcrop are speculative. This is best illustrated<br />
by Wade et al (1995) where they confronted the<br />
stratigraphic problem of correlating across the<br />
shelf break. Based on the available seismic<br />
data, Figure 21 delineates those areas of the<br />
Abenaki margin which were affected by of<br />
Tertiary and Middle Cretaceous erosional<br />
events. The Tertiary erosional edge of the<br />
Upper Cretaceous Wyandot chalk is also<br />
mapped.<br />
The carbonate bank edge has functioned as a<br />
hinge line for sedimentation, compaction, and<br />
erosion over time. This has resulted in many<br />
unconformities converging above this bank edge<br />
area. It was very difficult to correlate these<br />
unconformities over an extended area and<br />
across the carbonate bank edge. The Base<br />
Tertiary Unconformity (BTU) appears to be a<br />
fairly reliable pick but the age of the subcrop<br />
beneath this unconformity was often difficult to<br />
interpret.<br />
The Mid-Cretaceous Unconformity (MCU) was<br />
more difficult to correlate on the margin edge but<br />
is conformable over much of the carbonate<br />
shelf. The zone between the (BTU) and the<br />
Jurassic Bank Edge thins towards the west<br />
making it very difficult to correlate the MCU<br />
through this section.<br />
The regional profile across the Bonnet P-23 well<br />
illustrates the high basement block-like<br />
appearance with a faulted bank margin and the<br />
well positioned substantially landward of the<br />
edge (Figure 23). The base Tertiary erosion has<br />
again tagged the faulted bank edge and<br />
preservation of any reservoir-prone facies at the<br />
top of the Jurassic may be compromised.<br />
5.7 Reservoir Development and Diagenesis<br />
Significant hydrocarbon-bearing reservoirs in the<br />
Abenaki Formation are currently restricted to the<br />
bank margin reefal facies of the Baccaro<br />
Member / Abenaki Sequences 4, 5 and 6 (Figure<br />
24). Eliuk (1978) first recognized that Abenaki<br />
reservoirs were best created through the<br />
secondary dolomitization of reefal facies that<br />
existed as a narrow band along the platform<br />
margin. Harvey and MacDonald (1990) and<br />
Harvey (1993) modeled and described the<br />
seismic attributes of porous reef facies. Well<br />
data and 3D seismic data from the Deep Panuke<br />
field confirmed the observations and<br />
interpretations of these researchers.<br />
The Baccaro Member bank margin reefal facies<br />
is best described as an amalgam of debris reefs,<br />
composed of effective but limited numbers of<br />
stabilizing encrusting fauna and having high<br />
levels of silt- and mud-size carbonate material<br />
created by bioeroding organisms (Leinfelder,<br />
1993; 2001; 2002). Preservation of these fine<br />
sediments infers that these reefs existed in a<br />
moderate energy marginal setting at the fair<br />
weather wave base though still subjected to<br />
significant physical erosion. A wide belt of oolitic<br />
shoals occupied the higher energy crestal<br />
position.<br />
Regularly spaced series of two kilometer-wide<br />
promontories and reentrants are common along<br />
the Panuke margin as imaged by 3D seismic<br />
(see Figures 26-28, 33-33). It is most probable<br />
that the same morphology exists along the entire<br />
trend of the Abenaki platform margin but has yet<br />
to be imaged and requiring 3D seismic. The<br />
scalloped and fractured margin strongly<br />
supports the interpretation of a bank margin that<br />
underwent continuous syndepositional biological<br />
and physical erosion, the latter via localized rock<br />
falls, debris flows, turbidites and occasional<br />
larger scale faulting until stabilized by the<br />
transgression of forereef facies during sea level<br />
high stand events. Similar modern features and<br />
processes are documented on the Great<br />
Bahama Bank by Grammer et al. (1993).<br />
45
YARMOUTH ARC H<br />
Montagnais Crater<br />
Roseway Zero Edge<br />
BONNET P-23<br />
MOHAWK B-43<br />
Wyandot Zero Edg e<br />
MONTAGNAIS I-94<br />
SHELBURNE G-29<br />
Abenaki Bank Edge<br />
SAMBRO I-29<br />
MOHICAN I-100<br />
ALBATROSS B-13<br />
Base Tertiary Unconformity<br />
GLOOSCAP C-63<br />
MOHEIDA P-15<br />
Tertiary Erosion of Abenaki Carbonates<br />
Mid Cretaceous Unconformity<br />
Cretaceous Erosion of Abenaki Carbonates<br />
Wyandot Zero Edge<br />
Roseway Zero Edge<br />
OJIBWA E-07<br />
NASKAPI N-30<br />
ACADIA K-62<br />
TORBROOK C-15<br />
ONEIDA O-25<br />
COHASSET D-42<br />
PANUKE FIELD<br />
COMO P-21<br />
MUSQUODOBOIT E-23<br />
DEMASCOTA G-32<br />
KEGESHOOK G-67<br />
SHUBENACADIE H-100<br />
DOVER A-47<br />
ABENAKI J-56<br />
PENOBSCOT L-30<br />
EVANGELINE H-98<br />
NEWBURN H-23<br />
WEYMOUTH A-45<br />
MARQUIS L-35<br />
QUEENSLAND M-88<br />
BALVENIE B-7<br />
Figure 21. Map of regional unconformities and depositional pinch-outs as related to the Abenaki Formation. Most of the effects from the erosional<br />
events are observed converging adjacent to the Early Eocene age Montagnais impact event suggesting that the results of the event significantly<br />
affected later drainage patterns and dispersal in this area. The Roseway Unit ‘zero edge’ may be reflecting the influence of older basement<br />
features related to the Mohican Graben.<br />
46
Tertiary Marker<br />
Base Tertiary<br />
Roseway<br />
Top Jurassic<br />
Scatarie<br />
Salt<br />
Basement<br />
Acadia K-62<br />
----- 6 km ---<br />
Figure 22. Regional TGS seismic line extending 65 km from the edge of the Acadia Segment out into the<br />
diapiric salt province. Note the board belt of Jurassic sediments underlain by thin salt layer of salt<br />
between the platform margin / basin hinge line and salt diapirs. Deep structure beneath the platform<br />
margin may be a basement high, though the geometry of overlying high amplitude reflections of possible<br />
basaltic origin (“Glooscap Volcanics”) suggests a deep-seated salt feature. An enlarged view of the<br />
Acadia K-62 well is presented in Figure 80. Line location in Figure 4.<br />
Diagenesis of Abenaki carbonates is so far<br />
known to be dominantly in the reefal and<br />
adjacent fore- and backreef facies of the<br />
Baccaro Member (Weissenberger et al., 2000).<br />
Several stages of diagenesis are recorded in the<br />
Deep Panuke reservoirs (Baccaro/Abenaki 4, 5<br />
and 6) and include at least three phases of<br />
dolomitization and a later leaching event<br />
(Weissenberger, ibid; PanCanadian, 2002). The<br />
leaching followed the last phase of<br />
dolomitization (hydrothermal) which enhanced<br />
existing dolomitic porosity and profoundly<br />
affected the previously unaltered limestones.<br />
Recorded porosity types in the Baccaro include<br />
inter- and intracrystalline, matrix<br />
microcrystalline, vuggy and cavernous. A dual<br />
porosity system is interpreted for the Deep<br />
Panuke field: high permeability-high porosity,<br />
connected-vug limestone to limy dolomites to<br />
coarse-grained dolomites, and a widespread low<br />
porosity-low permeability partially leached<br />
limestone matrix type (PanCanadian, ibid.). The<br />
presence of micrite muds in the reefal sediments<br />
is believed to have enhanced the effectiveness<br />
of the dolomitization and leaching processes.<br />
Eliuk (1978) originally postulated that the source<br />
of the dolomitic diagenesis was via a ‘mixing<br />
zone’ type process, although no evidence has<br />
been found indicating periods of subaerial<br />
exposure of the Abenaki. It is now thought that<br />
the cause of Abenaki diagenesis was through<br />
the movement of deep basinal and underlying<br />
fluids into the platform margin complex via deepseated<br />
marginal normal faults. Long, linear,<br />
margin-parallel fractures are observed in the 3D<br />
mapping of the Abenaki 5 and 6 sequences and<br />
are most probably precursors to eventual<br />
47
faulting and margin failure (see Figures 26-28,<br />
33-33). Fracture zones are well known to have<br />
profound implications for carbonates in creating<br />
secondary fracture porosity and avenues for<br />
diagenesis and migration. They can be formed<br />
in a variety of ways including loading on<br />
unstable substrates, faults and fractures due to<br />
normal loading (margin parallel), deep-seated<br />
older faults (parallel – listric / normal to margin –<br />
transverse faults), earthquakes, and salt<br />
diapirism / evacuation. Vertical penetration of<br />
faults and fractures into overlying strata affects<br />
the extent of possible diagenesis and also<br />
pathways for hydrocarbons and is especially<br />
true in porous reefal facies at the platform<br />
margin.<br />
The fault-related diagenetic model may be<br />
applicable to other areas beyond the Deep<br />
Panuke field and other facies types.<br />
Dolomitization and creation of vuggy porosity in<br />
Bonnet P-23<br />
Tertiary<br />
Marker<br />
Base Tertiary<br />
Roseway<br />
Top Jurassic<br />
Scatarie<br />
Salt<br />
----- 6 km ----<br />
lagoonal sediments in the Bonnet P-23 and<br />
peloidal-skeletal sand in the Acadia K-62 well<br />
(Weissenberger et al., 2000) suggest that<br />
diagenetic fluids entered into these otherwise<br />
tight rocks through fractures, which in turn may<br />
be related to larger scale, deep-seated platform<br />
margin faults. If correct, then potential<br />
reservoirs could be developed through<br />
diagenesis in carbonates independent of their<br />
depositional facies.<br />
5.8 Play Types<br />
Based on analogues and interpretation of<br />
available well and seismic data, possible play<br />
types associated with the Abenaki carbonate<br />
platform margin are illustrated in Figure 24 over<br />
the three main zones associated with this<br />
carbonate platform.<br />
Figure 23. Regional TGS seismic line extending 65 km from the edge of the Shelburne Segment out into<br />
the diapiric salt province. This bank margin is steeper and more escarpment-like than that of the previous<br />
Figure 22, with an apparently greater offset along the hinge line fault. The location and dimensions<br />
central salt feature (pillow) could infer an underlying Late Triassic – Early Jurassic local depocentre. An<br />
enlarged view of the Bonnet P-23 well is presented in Figure 92. Line location in Figure 4.<br />
48
ABENAKI FORMATION<br />
BACCARO<br />
MISAINE<br />
SCATARIE<br />
JUR/TRI<br />
Identified Plays:<br />
PLATFORM INTERIOR PLATFORM MARGIN<br />
& BANK EDGE<br />
7<br />
PATCH REE F<br />
OOLITE SHOALS<br />
1. Platform Interior Patch Reefs, Oolite Shoals<br />
2. Reef Flat, Back-Reef, Oolite Shoals<br />
3. Rimmed Margin Reef Buildup (Deep Panuke)<br />
4. Fore-Reef,Talus Slope<br />
1<br />
REEF FLAT<br />
BACK REEF<br />
OOLITE SHOALS<br />
2 3<br />
RIMMED MARGIN<br />
REEF BUILDUP<br />
6<br />
FORESLOPE<br />
FORESLOPE<br />
& DEBRIS<br />
4 5<br />
BYPASS SAND S<br />
5. Fore-Slope, Bypass Sands<br />
6. Dolomitized Scatarie<br />
7. Cretaceous Draped Sands (Cohasset-Panuke)<br />
Figure 24. Schematic drawing of <strong>Scotia</strong>n Basin Jurassic carbonate platform play types – Western<br />
<strong>Scotia</strong>n Shelf. 1) rimmed margin reefal buildups (Deep Panuke), 2) foreslope, 3) reef flat/back-reef, 4)<br />
bypass sands, 5) platform interior patch reefs/oolitic shoals, 6) Scatarie Member reefal facies, and 7) Late<br />
Cretaceous draped sands (Cohasset-Panuke).<br />
The platform interior has potential for patch reefs<br />
and oolite shoals that are structured by<br />
underlying basement highs or purely<br />
stratigraphic traps by lateral facies changes.<br />
Drape over basement highs can induce<br />
fracturing and be sites of dolomitization and<br />
enhanced porosity. The platform margin<br />
includes the bank edge, reef flat/oolite shoals<br />
and back-reef. This is the optimal zone as<br />
revealed by the Deep Panuke discovery in<br />
fractured dolomitized skeletal framework<br />
reservoir. The forereef or foreslope includes the<br />
reefal debris that is constantly deposited in front<br />
of an active reef. Where reefal buildups occur<br />
there is typically a rimmed margin but seismic<br />
suggests this is probably not a continuous<br />
situation. Where there is not a rim the margin<br />
will more likely be the site of high energy oolitic<br />
shoals.<br />
Through breaks or channels along the margin<br />
there can be significant deposition of bypass<br />
sands, either siliciclastic and/or carbonate. This<br />
was the objective of EnCana’s Queensland M-<br />
88 well drilled and abandoned in 2002 (see<br />
Section 3.2 for details). The Scatarie Member,<br />
while not at present a sought-after target, could<br />
contain fractured and dolomitized zones.<br />
Overlying Cretaceous sands draped over the<br />
platform margin may create traps like the<br />
Cohasset/Panuke oil discoveries.<br />
The various play types are thus ranked in order<br />
of relative importance by today’s available data<br />
and information (Figure 24; see also Figure<br />
125). With the Deep Panuke discovery, still not<br />
fully delineated, and the overlying Cretaceous oil<br />
discoveries at Cohasset and Panuke, the<br />
petroleum system and controlling success<br />
factors are yet to be completely understood.<br />
The source rocks are expected to be from the<br />
Verrill Canyon marine shales but the potential<br />
for early synrift and postrift sub-platform sources<br />
cannot be dismissed. The predictability of<br />
dolomitization and fracturing is not yet possible<br />
so a detailed description of the petroleum<br />
systems is premature.<br />
49
200 180 160 140 120 100 80 65 60 50 40 30 20 10 0<br />
GEOLOGIC TIME<br />
TR JURASSIC<br />
MESOZOIC<br />
CRETACEOUS<br />
CENOZOIC<br />
TERTIARY<br />
QUAT.<br />
SCALE PETROLEUM<br />
L. EARLY MID. L. EARLY LATE PAL. EOCENE OLIG. MIOCENE PP<br />
SYSTEM EVENTS<br />
1 2 3 4 5<br />
SOURCES<br />
1 2<br />
RESERVOIRS<br />
BU<br />
1 2 3<br />
1<br />
2 3<br />
4<br />
5<br />
6<br />
SEALS<br />
OVERBURDEN & EROSION<br />
1<br />
1 2 3<br />
4<br />
5<br />
2<br />
4<br />
3<br />
5<br />
4<br />
TRAP FORMATION<br />
PRESERVATION<br />
? ?<br />
CRITICAL MOMENT(S)<br />
BU = Break-up Unconformity (~mid-late Sinemurian)<br />
SOURCES<br />
1. Early Synrift (Triassic: Carnian - Norian)<br />
2. Late Synrift (Jurassic: Hettangian - Sinemurian)<br />
3. Mohican (Toarcian – Aalenian)<br />
4. Jurassic Verrill Canyon (Oxfordian - Kimmeridgian)<br />
5. Cretaceous Verrill Canyon (Berriasian - Valanginian)<br />
RESERVOIRS<br />
1. Scatarie / Abenaki 1 (Bajocian – Callovian)<br />
2. Baccaro / Abenaki 4, 5 & 6 (Callovian – Kimmeridigian)<br />
SEALS<br />
1. Misaine / Abenaki 2 for Scatarie / Abenaki 1<br />
2. Top Abenaki 6 for Baccaro / Abenaki 4, 5 & 6<br />
3. Lower Cretaceous Shales for Baccaro / Abenaki 4, 5 & 6<br />
GENERATION GENERATION -- MIGRATION MIGRATION -ACCUMULATION<br />
-ACCUMULATION<br />
OVERBURDEN<br />
Several periods of variable erosion:<br />
1. Early Cretaceous (Aptian?)<br />
2. Early Eocene<br />
3. Late Eocene (Montagnais Impact Event)<br />
4. Late Paleocene<br />
5. Middle Oligocene<br />
6. Middle Miocene<br />
TRAP FORMATION<br />
1. Diagenetic & Subsidence (L. Jur. – E. Cret.)<br />
2. Tectonic & Structural (L. Cret.)<br />
TIMING<br />
Expulsion periods based on previously modelled<br />
deepwater succession (Kidston et al., 2002 – Sites 3-5).<br />
Figure 25. Events Timing Chart – regional Abenaki Formation. This chart does not reflect the differences<br />
for each of the three defined segments. Individual charts for the Panuke and Acadia Segments are<br />
shown in Figures 92 and 109 respectively.<br />
The Abenaki Formation composite events timing<br />
chart (Figure 25) represents the conceptualized<br />
petroleum systems for the entire formation on<br />
the <strong>Scotia</strong>n margin. This figure includes data<br />
and concepts for the Panuke and Acadia<br />
Segments but excludes the Shelburne segment<br />
due to the lack of and/or quality of data. Charts<br />
for the Panuke and Acadia Segments are<br />
presented in Figures 93 & 110 respectively. The<br />
lack and quality of data and information<br />
precluded creation of a similarly detailed events<br />
timing chart for the Shelburne Segment.<br />
The most striking features of the composite<br />
chart are the at least four periods of submarine<br />
erosion of the <strong>Scotia</strong>n Margin throughout the<br />
Tertiary, as well as an earlier one in the Early<br />
Cretaceous. Pointedly, these events occurred<br />
after deposition and probable formation of the<br />
Abenaki reservoirs via diagenesis and do not<br />
appear to have cut deep enough to breech<br />
potential reservoirs. The structural component<br />
of trap formation probably occurred<br />
syndepositionally through subsidence and also<br />
during the Late Cretaceous in proximal delta<br />
settings. The Eocene-age Montagnais impact<br />
event is interpreted to have had an<br />
instantaneous effect on the bank margin in<br />
causing listric faulting, and thrust faulting around<br />
the crater rim. Diagenesis was probably early<br />
post-depositional.<br />
As discussed previously, there exists a number<br />
of potential source rocks for Abenaki<br />
hydrocarbons; pre-, syn- and post-depositional.<br />
The episodic removal of overburden must have<br />
had the effect of delaying the maturation of<br />
those possible source facies adjacent to the<br />
bank margin, though the effects of these events<br />
for each source have yet to be quantified and<br />
modeled. Critical moments for hydrocarbon<br />
expulsion and migration are dependant on the<br />
age of the source rocks and creation of effective<br />
migration pathways.<br />
50
?<br />
?<br />
?<br />
-3504m<br />
Figure 26. Deep Panuke depth structure map, top of the Abenaki 5 sequence. Approximate field<br />
boundary delineated by the -3504 mSS gas/water contact (green line) and facies boundaries, though the<br />
lateral extent of the field is not yet completely defined. Black line shows the location of the cross section<br />
in Figure 29; yellow and white lines the seismic profiles in Figures 30 and 31. Contour interval is 20.0<br />
metres (slightly modifies after PanCanadian, 2002).<br />
5.9 Deep Panuke Gas Field<br />
The following information and related figures are<br />
sourced from PanCanadian’s (EnCana’s) public<br />
document “Deep Panuke <strong>Offshore</strong> Gas<br />
Development – Development Plan: Volume 2”<br />
(2002) unless otherwise indicated. Information<br />
on currently confidential Margaree and MarCoh<br />
wells is from press releases available on the<br />
EnCana corporate web site. Total depths for<br />
these wells are in the public domain and listed in<br />
the 2003 Weekly Activity Reports on the<br />
CNSOPB web site. Additional seismic profiles<br />
through the field are shown in Figures 83-92.<br />
M-88<br />
D-41<br />
F-70<br />
?<br />
The Deep Panuke Gas Field was discovered by<br />
PanCanadian (now EnCana) in 1998 with the<br />
PP-3C discovery well finding gas beneath its<br />
shallow Panuke oil field. The field is located in<br />
about 40 metres of water, and subsequent<br />
drilling along the Jurassic bank margin has<br />
delineated the field as a narrow, northeastsouthwest<br />
trending belt approximately 1-2 km<br />
wide and at least 11 km long (Figures 26 & 27).<br />
Subsequent drilling was undertaken to confirm<br />
the field’s lateral extent (Figure 28). Gas has<br />
been identified within the Abenaki 5 sequence,<br />
and to a much lesser extent in underlying<br />
51
Abenaki 4 and overlying Abenaki 6. Although<br />
the Abenaki 4 has significant reservoir<br />
development, it is mostly present beneath the<br />
field-wide gas/water contact of ~3504 m subsea<br />
(Figures 9 & 29). Further delineation drilling is<br />
planned with development of the field still<br />
pending as of June 2005.<br />
Deep Panuke is a combined stratigraphic /<br />
structural trap. The gas is located in a structural<br />
high along the Abenaki platform margin within<br />
dolomitized and leached limestones of the<br />
Abenaki 5 sequence. It is overlain by tight upper<br />
foreslope limestones of the Abenaki 6 that<br />
provides an excellent and effective top seal<br />
(some thin, modest porosity exists at the base of<br />
this zone) (Figures 30 & 31). Structural closure<br />
is present along strike and facies changes with<br />
tight backreef (oolitic) and forereef (mudstone)<br />
facies provide lateral seals. Listric,<br />
syndepositional faulting has created a scalloped<br />
bank margin which has also aided in the<br />
seaward lateral seal (Figures 26 & 27).<br />
Porous intervals within the Abenaki are<br />
observed and delineated by seismic attribute<br />
analysis of the 3D dataset, with estimation of<br />
porosity and its identification best in those zones<br />
that have vuggy and cavernous porosities<br />
(Figures 32 & 33, 83-92). Calculation of porosity<br />
and permeability in the vuggy and cavernous<br />
zones is hampered by the lack of core recovered<br />
from these intervals, hence their values are<br />
Year Operator Name ID TVD (m) Status Comments<br />
1998 PanCanadian Panuke<br />
1999 PanCanadian Panuke<br />
1999 PanCanadian Panuke<br />
J-99<br />
(PP-3C)<br />
J-99<br />
(PI-1A)<br />
J-99<br />
(PI-1B)<br />
4163.0 Gas<br />
4030.0 Gas<br />
4046.3 Gas<br />
2000 PanCanadian Panuke H-08 3682.0 Gas<br />
2000 PanCanadian Panuke M-79 4598.3 D&A<br />
2000 PanCanadian Panuke M-79A 3934.7 Gas<br />
2000 PanCanadian Panuke F-09 3815.0 D&A<br />
2003 EnCana Margaree F-70 3677.0 Gas<br />
2003 EnCana MarCoh D-41 3625.0 Gas<br />
understated. Calculation of net gas pay is<br />
based log and MDT data using cut-offs for<br />
porosity (>0.05), water saturation (
M-88<br />
Figure 27. North view 3D depth structure of the main Deep Panuke gas reservoir, top Abenaki 5<br />
sequence. Black line shows the location of the cross section in Figure 28; yellow and white lines the<br />
seismic profiles in Figures 29 and 30. Contour interval 20 metres, scale ranges from -3280 mSS (red) to -<br />
4160 mSS (blue) (slightly modified after PanCanadian, 2002).<br />
Well Zone Gross Thickness (M) Net Pay (M) Porosity Sw<br />
Panuke<br />
PP-3C<br />
Panuke<br />
PI-1A<br />
Panuke<br />
PI-1B<br />
Panuke<br />
H-08<br />
Panuke<br />
F-09<br />
Panuke<br />
M-79<br />
Panuke<br />
M-79A<br />
Margaree<br />
F-70<br />
MarCoh<br />
D-41<br />
Abenaki 6 182.7 0.0 -- --<br />
Abenaki 5 125.8 44.6 0.24 0.28<br />
Abenaki 4 87.8 0.0 -- --<br />
Total 396.3 44.6 0.24 0.28<br />
Abenaki 6 193.5 2.0 0.06 0.19<br />
Abenaki 5 133.7 1.5 0.06 0.19<br />
Abenaki 4 39.7 0.0 -- --<br />
Total 366.8 3.5 0.06 0.19<br />
Abenaki 6 192.2 0.0 -- --<br />
Abenaki 5 124.4 13.9 0.07 0.08<br />
Abenaki 4 27.9 10.2 0.06 0.10<br />
Total 344.5 24.2 0.07 0.09<br />
Abenaki 6 131.0 3.2 0.08 0.32<br />
Abenaki 5 145.0 104.7 0.24 0.22<br />
Abenaki 4 108.0 0.0 -- --<br />
Total 383.9 108.0 0.23 0.22<br />
Abenaki 6 151.4 0.0 -- --<br />
Abenaki 5 116.7 0.0 -- --<br />
Abenaki 4 114.7 0.0 -- --<br />
Total 382.8 0.0 -- --<br />
Abenaki 6 195.9 0.0 -- --<br />
Abenaki 5 124.8 0.0 -- --<br />
Abenaki 4 134.8 0.0 -- --<br />
Total 455.6 0.0 -- --<br />
Abenaki 6 177.9 0.0 -- --<br />
Abenaki 5 67.1 11.4 0.10 0.05<br />
Total 245.0 11.4 0.10 0.05<br />
Table 3. Deep Panuke Well Reservoir Data.<br />
Well data confidential until August 6, 2005.<br />
Well data confidential until October 23, 2005.<br />
F-70<br />
D-41<br />
53
Figure 28. Deep Panuke Abenaki 5 structure map. Note the elongate syncline behind and paralleling the<br />
northeastern extension of the field which is interpreted as related to possible pre-Break-up siliciclastic<br />
loading and salt withdrawal. The Margaree F-70 and MarCoh D-41 wells have been drilled and<br />
discovered significant gas pay (~70m and >100m respectively). The Wolfville N-32, Ashen/Dominion A-<br />
14, Baddeck I-07 and Digby P-16 locations are proposed well locations only (Source: Encana website -<br />
http://www.encana.com/investor_hub/pdfs/2003/InvestorDayFoothillsFrontier.pdf).<br />
Well Zone<br />
Depth<br />
(TVD)<br />
Test<br />
No.<br />
Pressure<br />
(Kpa / Psi)<br />
Max. Gas Rate<br />
(E 3 m 3 /D / MMcf/D<br />
Condensate Ratio<br />
m 3 /E 6 m 3 / Bbl/MMcf<br />
Water Ratio<br />
m 3 /E 6 m 3 / Bbl/MMcf<br />
PP-3C Abenaki 5/4 3475.7 2 36510 / 5294 1690 / 59.7 8.1 / 1.4 10.0 / 1.8<br />
PP-3C Abenaki 5/4 3475.9 4 36440 / 5284 1650 / 58.3 12.0 / 2.1 20.0 / 3.6<br />
PI-1B Abenaki 5 3454.6 2 36768 / 5331 1490 / 52.6 12.5 / 2.5 8.3 / 1.5<br />
H-08 Abenaki 5 3448.0 1 36355 / 5271 1450 / 51.2 6.9 / 1.2 17.5 / 3.1<br />
M-79A Abenaki 5 3355.5 1 36310 / 5265 1790 / 63.2 20.0 / 3.6 6.3 / 1.1<br />
Table 4. Deep Panuke Drill Stem Test Data.<br />
Conventional drill stem tests all tested the<br />
Abenaki 5 with one exception (Abenaki 4) with<br />
rates in the former ranging from 50-65 Mmcf/d<br />
AOF. Gas from the Abenaki 5 is normally-<br />
54
pressured and is on a common pressure<br />
system. It is very lean, with a calculated rate of<br />
about 2000 bbls of condensate per day based<br />
on peak gas production of 11.6 E 6 m 3 /d (400<br />
MMscf/d) with low levels of H2S (~2000 ppm /<br />
0.2%) and CO2 (~35,000 ppm / 3.5%).<br />
Reservoir temperature averages 123ºC with<br />
measured DST pressure ranges in the Abenaki<br />
5 zone from 36310-36768 kpa.<br />
PanCanadian’s (2002) probabilistic reserves<br />
calculations for the Abenaki 5 zone estimate an<br />
expected value (EV) of 1.2 Tcf / 33.0 E 9 m 3<br />
OGIP. Recoverable (sales) gas volumes were<br />
similarly calculated at 929 Bcf / 26.3 E 9 m 3 .<br />
Mean (P50) OGIP values are 1.1 Tcf / 31.0<br />
E 9 m 3 , with an upside (P10) of 1.5 Tcf / 43.7<br />
E 9 m 3 and base case (P90) of 777 Bcf / 22.0<br />
E 9 m 3 . The most recent figure for recoverable<br />
(sales) gas volumes is 950 Bcf / 26.9 E 9 m 3<br />
(various EnCana press releases, 2004, 2005).<br />
Additional information related to the Deep<br />
Panuke field can be found elsewhere in this<br />
report including seismically derived 3D isometric<br />
views (Figures 26-28, 33-33) and seismic<br />
profiles through selected Panuke field wells<br />
(Figures 83-92). Complete technical and other<br />
information on the proposed Deep Panuke<br />
development is available in EnCana’s<br />
Development Plan – Volume 2 (2002).<br />
55
Figure 29. Strike-orientated gamma log structural cross section along the Deep Panuke gas field<br />
illustrating the main stratigraphic subdivisions, pay intervals, gas/water contact and conventional and<br />
sidewall core locations. Well depths are measured depths from the KB. Wells drilled since 2002 and not<br />
noted in this figure include EnCana Queensland M-88, Margaree F-70 and MarCoh D-41 though are<br />
shown in Figures 26 and 27 (slightly modifies after PanCanadian, 2002).<br />
56
NW SE<br />
Figure 30. Seismic dip profile (depth) through the Panuke M-79 (vertical) and M-79A (deviated) wells.<br />
Length of section is about 2 kilometers with the location indicated by the yellow line in Figures 26 and 27<br />
(PanCanadian, 2002).<br />
57
1 km<br />
Figure 31. Seismic dip profile (time) through the Panuke B-90 and Panuke PI-1A and PI-1B wells.<br />
Length of section is about 3.5 kilometers with the location indicated by the white line in Figures 26 and 27<br />
(PanCanadian, 2002).<br />
58
Figure 32. Abenaki 5 net pay map with average seismic porosity. Contour interval 20 metres<br />
(PanCanadian, 2002).<br />
59
Figure 33. Abenaki 5 Phi-h map with average seismic porosity. Contour interval 1.0 metres<br />
(PanCanadian, 2002).<br />
60
The proto-North Atlantic Ocean was rimmed by<br />
a carbonate prone shelf from Mid-Jurassic to<br />
Late Jurassic and later. Figure 34 shows the<br />
juxtaposition of northwest Africa with the eastern<br />
seaboard of North America during the Early<br />
Jurassic, with the Moroccan Essaouira and<br />
Aauin-Tarfaya Basins offsetting the <strong>Scotia</strong>n and<br />
CANADA<br />
Gettysburg<br />
Basin<br />
Culpeper<br />
Basin<br />
Richmond<br />
Basin<br />
Deep River<br />
Basin<br />
U.S.A.<br />
Newark<br />
•Basin<br />
Jedburg<br />
Basin<br />
6. ANALOGUE BASINS<br />
Fundy<br />
Basin<br />
<strong>Scotia</strong>n<br />
Basin<br />
•+<br />
•+<br />
•+<br />
•+ •+<br />
•+ •+<br />
•+ •+<br />
•+ •+<br />
•+ •+<br />
•+ •+ •+<br />
•+ •+<br />
•+<br />
•+ •+<br />
•+ •+<br />
•+ •+<br />
•+<br />
•+<br />
•+ •+<br />
•+ •+<br />
•+<br />
Laurentian<br />
Basin<br />
George’s Bank Basins respectively. The<br />
following section offers an overview of several of<br />
the conjugate basins containing Late Jurassic<br />
carbonate margin successions as well as brief<br />
comments on respective historic petroleum<br />
exploration programs.<br />
Essaouira<br />
Basin<br />
High Atlas<br />
Basin<br />
Aaiun-Tarfaya<br />
Basin<br />
Senegal<br />
Basin<br />
Tethys<br />
Ocean<br />
High High Plateau Plateau<br />
Saharan<br />
Atlas<br />
AFRICA<br />
500 Km<br />
Figure 34. North Atlantic Lower Jurassic depositional setting, pre-Break-up unconformity (mid-late<br />
Sinemurian): early synrift basins (brown), uplands (green), ocean waters (blue), future continental<br />
margins (white) (ONAREP, 2000b).<br />
61
6.1 U.S. Atlantic Margin<br />
A total of 54 wells have been drilled off the U.S.<br />
Atlantic coast; 49 industry exploratory wells and<br />
five COST wells (Continental <strong>Offshore</strong><br />
Stratigraphic Test) (Figure 35). The five COST<br />
wells were drilled during 1976 and 1977 in<br />
advance of lease sales to industry. Two of the<br />
wells (G-1 and G-2) were drilled on George’s<br />
Bank, two were drilled in the Baltimore Canyon<br />
(B-2 and B-3) and one (GE-1) in the Georgia<br />
Embayment. Of the 49 exploratory wells, eight<br />
were drilled on George’s Bank, 32 in the<br />
Baltimore Canyon, six in the Southeast Georgia<br />
Embayment and three in the Dry Tortugas off<br />
Florida. Although significant natural gas was<br />
Figure 35. Tectonic elements, eastern North America (Lore et al., 2001).<br />
tested in the Baltimore Canyon area with<br />
individual flow rates up to 19 MMcf/d, none were<br />
deemed commercial (Mattick, 1988).<br />
The 54 wells were mostly drilled on the Late<br />
Jurassic shelf, targeting clastic and carbonate<br />
reservoirs in structural and stratigraphic traps.<br />
The schematic geological cross-section (Figure<br />
36) illustrates the prograding shelf and postbreakup<br />
unconformity. An important aspect is<br />
the position of the present-day shelf edge<br />
relative to the Upper Jurassic shelf edge which<br />
has adversely affected seismic data quality. This<br />
issue will be discussed in detail in Sections 6.1.1<br />
and 6.1.2.<br />
62
In 1983-84, the focus briefly shifted to the<br />
Jurassic bank edge beneath the present-day<br />
deepwater slope in water depths up to 2000 m.<br />
Four wells were drilled without success though<br />
only two were bonafide bank edge wells. It is<br />
interesting to note that during this latter period,<br />
industry in <strong>Canada</strong> had completed five wells<br />
targeting the Abenaki; four in the Panuke<br />
Segment and one in the western Acadia<br />
Segment, Chevron Acadia K-62 (1978). Indeed,<br />
for the entire bank edge play west of Sable<br />
Island, only one well was drilled in the 1000 km<br />
distance between Sable Island and the<br />
Baltimore Canyon.<br />
Available seismic data for the U.S. Atlantic<br />
margin is difficult to obtain. Published seismic<br />
profiles are generally too small and lack<br />
resolution to see any details. Any seismic data<br />
acquired prior to 1975 is not releasable by the<br />
FEET<br />
10,000<br />
20,000<br />
30,000<br />
Upper<br />
Lower<br />
U.S. Minerals Management Service (MMS) and<br />
that seismic shot after 1975 has a 25 year<br />
confidentiality period. Based on available data,<br />
seismic imaging of the steeply dipping carbonate<br />
bank margin is considered inadequate by<br />
today’s standards. While beyond the scope of<br />
this study, much of the interpretations related to<br />
these data are by necessity based on single<br />
widely-spaced lines rather than a regional<br />
survey interpretation.<br />
Along the US Margin there were a total of 10<br />
lease sales from 1959 (Florida Straits), but most<br />
occurred during 1976 to 1983 period. The 433<br />
leased blocks garnered almost US$3 billion in<br />
cash bonuses. Currently there are no existing<br />
active leases, a as 1990 Presidential Executive<br />
Order cancelled any further sales for an<br />
unspecified period.<br />
NORTHWEST SOUTHEAST<br />
Onshore <strong>Offshore</strong><br />
Shelf<br />
Cenozoic<br />
Postrift Unconformity<br />
BASEMENT<br />
Cretaceous<br />
Cretaceous<br />
Upper Jurassic<br />
Middle Jurassic<br />
Clastics<br />
Triassic<br />
0 5 10 15 20 25 miles<br />
SALT<br />
Clastics<br />
Clastics<br />
Clastics<br />
Carbonates<br />
?<br />
Lower Jurassic<br />
?<br />
Reef<br />
Slope<br />
Clastics<br />
Clastics<br />
Figure 36. Geological cross section, U.S. Atlantic Margin. Line of section D-D’ is shown in Figure 27<br />
(Lore et al., 2001).<br />
6.1.1 Baltimore Canyon Trough<br />
The Baltimore Canyon Trough location map<br />
(Figure 37) shows the clustering of wells in that<br />
basin. Major drilling programs were<br />
concentrated in areas of large structural relief on<br />
the continental shelf later attributed to salt and,<br />
sometimes, igneous intrusions (Mattick and<br />
Libby-French, 1988) (Figure 38). Four of the<br />
wells were in deeper water (93-1, 586-1, 587-1<br />
and 372-1), but only 587-1 and 372-1 targeted<br />
the bank edge, the other two were drilled on<br />
back-reef structures. Although a number of<br />
wells on the “Texaco-Tenneco Structure” tested<br />
gas and oil/condensate from Late Jurassic and<br />
Early Cretaceous sands, none were deemed to<br />
be of commercial size. Five wells tested gas at<br />
rates of 1 - 19 MMcf/d and three wells tested<br />
oil/condensate at 18-630 bopd.<br />
A regional seismic line (Figure 39) clearly shows<br />
the prograding carbonate shelf edge and the<br />
present-day shallow depth of burial beneath the<br />
continental slope. Figure 40 is another seismic<br />
profile that illustrates the bank edge test which<br />
indicates that the 587-1 well was testing backreef<br />
facies about 3000 m landward of the main<br />
carbonate buildup. However, given a<br />
progradational carbonate platform setting the<br />
well could have tested earlier and deeper<br />
interpreted bank edges although they do not<br />
appear to have a "rimmed” morphology.<br />
The structure map on the top of Valanginian<br />
carbonates (Figure 41) shows the bank edge<br />
rimming reefal buildups and the overall structural<br />
closure along the platform margin. Based on the<br />
seismic and well data, Prather (1991) notes:<br />
63
“Leached rock fabrics and fossil moldic porosity in the Berriasian reefal limestones suggest that<br />
rising sea level was followed by subaerial exposure and freshwater leaching during a sea level<br />
lowstand in the Late Berriasian. Freshwater leaching may account for the fact that the shelfmargin<br />
limestones consist of approximately 25% reservoir quality rock (φ > 8%). Exposure was<br />
followed by a rapidly rising sea level which drowned the platform.”<br />
Figure 37. Baltimore Canyon well location map (Mattick and Libby-French, 1988).<br />
64
Figure 38. Geological cross-section, Baltimore Canyon (Mattick and Libby-French, 1988).<br />
5 km<br />
10 km<br />
15 km<br />
------------ 25 km --------------<br />
Figure 39. Regional seismic Line 25 through the Baltimore Canyon Trough (Grow et al., 1988).<br />
65
Figure 40. Detailed seismic line, Baltimore Canyon Trough. Shell et al OCS-A 0337 and Shell OCS-A<br />
0336 are company designations and are identified by the MMS as Shell 587-1 and Shell 586-1<br />
respectively (Prather, 1991).<br />
Figure 41 Structure map, top of Early Cretaceous shelf-margin carbonates, Baltimore Canyon defining<br />
possible mound and reef structures (Prather, 1991).<br />
66
Figure 42. Diagrammatic cross sections through Baltimore Canyon wells: A) Shell 372-1 (Edson, 1988)<br />
and B) 586-1 and 587-1 wells (Edson, 1986 and 1987).<br />
Schematics from the MMS well summaries<br />
(Edson, 1986, 1987, 1988) show offlapping<br />
facies during the drowning of the carbonate<br />
platform and bank (Figure 42). However, the<br />
587-1 well is in a contradictory position relative<br />
to the previous figure, hence there is a question<br />
of the diagnosticity of this well. Based on the<br />
then-available data, it was eventually concluded<br />
that while the Baltimore Canyon Trough<br />
contained good reservoirs and top seals, the<br />
lack significant hydrocarbon shows in any of the<br />
wells inferred the absence of adequate and<br />
mature source rocks, and/or migration pathways<br />
(Prather, 1991).<br />
6.1.2 George’s Bank Basin<br />
Up until the 1970’s, the presence of a carbonate<br />
platform in the subsurface of George’s Bank was<br />
largely an assumption based on seismic and<br />
drilling results from the <strong>Scotia</strong>n Basin. In 1977,<br />
the deep diving submersible “Alvin” was able to<br />
collect rock samples from several submarine<br />
canyons confirming age and lithological<br />
correlations with the regional stratigraphy (Ryan<br />
and Miller, 1981).<br />
The George’s Bank drilling program began with<br />
two COST wells G-1 (1976) and G-2 (1977)<br />
followed by eight exploration tests in 1981-1982<br />
drilled during a period of exploration hiatus<br />
offshore <strong>Nova</strong> <strong>Scotia</strong>. The wells were all within<br />
65 km of each other in water depths ranging<br />
from 63 – 138 m (Figure 43). The exploration<br />
targets were Middle/Late Jurassic oolite banks,<br />
reefs and drape structures over basement highs<br />
and/or salt swells. Indicators were high<br />
amplitude reflectors and apparent structural<br />
closures at depths between 2750 – 4875 m.<br />
However, drilling results revealed low-porosity<br />
micrites, wackestones and packstones while<br />
volcanics and halite/anhydrites were responsible<br />
for some “bright spots”. Source rock potential<br />
was discouragingly lean, < 1% TOC:<br />
“In summary, the source rock potential in the currently drilled portion of George’s Bank Basin at<br />
sufficient depths for thermal maturity, 8,000 to nearly 22,000 feet (2440 – 6700 m) (the deepest<br />
drilling), is poor.” (Edson et al., 2000a)<br />
Along the edge of George’s Bank, the inferred<br />
Jurassic bank edge lies at a shallow depth<br />
beneath a channelized slope which results in its<br />
poor imaging by seismic. When Ryan and Miller<br />
(1981) successfully sampled Late Jurassic/Early<br />
Cretaceous outcrops in submarine canyons,<br />
they acknowledged the potential loss of<br />
hydrocarbons through leakage by continental-<br />
margin erosion has significant economic<br />
implications. They also stated that submarine<br />
canyon erosion was active in Mesozoic time as<br />
was the syndepositional mechanical defacement<br />
of high-standing carbonate escarpments. The<br />
steep bank edge thus may also have suffered<br />
faulting and erosion with removal of high-energy<br />
reefal facies.<br />
67
Figure 43. Land parcel and well locations (1982), Georges Bank Basin (U.S.) (Edson et al., 2000a).<br />
Figure 44. Geological cross section based on NW-SE seismic Line 19 through the outer margin of the<br />
Georges Bank Basin (modified from Plate 3A of Poag and Valentine, 1988). The Shell 410 well targeted<br />
a suspected Jurassic (reefal) closure that was not present.<br />
68
NW SE<br />
U.S. George’s Bank – 1974 Digicon<br />
Top Carbonate – Jur/Cret?<br />
Figure 45. Southern Digicon (1974) seismic line through the edge of the George’s Bank Basin. See text<br />
for details. Line location on Figure 4.<br />
Paleo-Bank Edge<br />
---2 km---<br />
1.0 sec<br />
2.0 sec<br />
3.0 sec<br />
4.0 sec<br />
5.0 sec<br />
6.0 sec<br />
69
NW SE<br />
U.S. George’s Bank – 1974 Digicon<br />
Top Carbonate – Jur/Cret?<br />
Figure 46. Central Digicon (1974) seismic line through the edge of the George’s Bank Basin. See text for<br />
details. Line location on Figure 4.<br />
Paleo-Bank Edge<br />
---2 km----<br />
1.0 sec<br />
2.0 sec<br />
3.0 sec<br />
4.0 sec<br />
5.0 sec<br />
6.0 sec<br />
70
NW SE<br />
U.S. George’s Bank – 1974 Digicon<br />
Top Carbonate – Jur/Cret?<br />
Figure 47. Northern Digicon (1974) seismic line through the edge of the George’s Bank Basin. See text<br />
for details. Line location on Figure 4.<br />
Paleo-Bank Edge<br />
---2 km----<br />
1.0 sec<br />
2.0 sec<br />
3.0 sec<br />
4.0 sec<br />
5.0 sec<br />
6.0 sec<br />
71
A geological cross-section (Figure 44) shows the<br />
closest American bank edge well, Shell 410,<br />
located about 20 km from the platform margin.<br />
The well drilled 2895 m (1722 to 4617 m) of<br />
predominantly oolitic limestone with shale<br />
interbeds. The Abenaki interval is age dated as<br />
Early Valanginian to an undetermined Bajocian<br />
or older age below 3474 m. The carbonate<br />
section had generally poor porosity except for<br />
dolomites below 4328 m (Edson et al., 2000b).<br />
Three seismic profiles over George’s Bank typify<br />
the carbonate bank morphology from south to<br />
north (Figures 45-47). Their exact locations and<br />
identity of the data are confidential due to the<br />
petroleum exploration moratorium over the area.<br />
The interpretations are projected from research<br />
on the Canadian side and knowledge of the<br />
adjacent wells but are not directly tied into the<br />
wells. The illustrative point to show with these<br />
lines is the general morphology of the carbonate<br />
bank edge and the clarity of its seismic imaging,<br />
or lack thereof. The Jurassic/Cretaceous bank<br />
edge lies beneath the present-day shelf-slope<br />
break which is very disruptive for seismic<br />
imaging and in particular applies to the mapping<br />
of the shale/carbonate interface and the internal<br />
character.<br />
Figure 45 southwest of the wells shows the<br />
carbonate bank edge, probably of Early<br />
Cretaceous age (Berriasian) dipping seaward<br />
and faulted. The actual paleo reef-prone margin<br />
is thus difficult to pick and any diagnostic<br />
seismic attributes within the carbonate front<br />
probably impossible to extract. The blue horizon<br />
is analogous to the Top Jurassic marker as<br />
interpreted on the Canadian side, especially in<br />
the deepwater, but these ages are not precisely<br />
determined.<br />
Figure 46 illustrates more seismic interference<br />
from the uneven (slumped?) seafloor but an<br />
assumed sigmoidal shape of the margin the<br />
Jurassic shelf break can be interpreted.<br />
Questions of low-angle ramp versus high-angle<br />
rim are not easily addressed unless the water<br />
wedge effect in depth sections is removed.<br />
However, the variability of carbonate platform<br />
edge morphology that occurs along strike is<br />
acknowledged.<br />
Figure 47 is a profile approaching the Canadian<br />
border and reveals a zone of interpreted salt<br />
disruption of the bank edge. The line displays<br />
the interpreted escarpment-like bank edge lying<br />
very close to the seafloor and a steep high<br />
displacement fault extending from the paleoshelf<br />
to the deepwater. Such mechanical<br />
defacement, however accomplished, is<br />
nonetheless destructive to bank edge<br />
preservation.<br />
Mean UCRR<br />
Assessed Plays Probability Oil (BB) Gas (Tcf)<br />
Lower Cretaceous Clastics 1 1.0 0.7 11.8<br />
Upper Jurassic Carbonates 2 1.0 0.2 1.5<br />
Upper Jurassic Clastics 3 1.0 0.8 9.0<br />
Middle Jurassic Carbonates 4 0.64 0.1 0.6<br />
Middle Jurassic Clastics 5 0.90 0.4 4.9<br />
Totals 2.3 27.7<br />
Comments:<br />
1 <strong>Scotia</strong>n Basin analogue; Missisauga Fm. et al. Well 642-2 tested 640 bopd<br />
2 GOM analogues, reef/back-reef porosities, subaerial exposure, 3 wells porosity, no hydrocarbons<br />
3 GOM, <strong>Scotia</strong>n Basin (Mic Mac), 5of 8 wells in Hudson Canyon, gas to 19MMcf/d<br />
4 GOM analogues, shallow water platforms and ramps<br />
5 GOM and <strong>Scotia</strong>n Basin<br />
Table 5. MMS 2000 Assessment, U.S. Atlantic Mesozoic Margin: Ultimate Conventional Recoverable<br />
Reserves (Lore et al., 2001)<br />
72
6.1.3 Minerals Management Service<br />
Resource Assessment<br />
The assessment of the U.S. Atlantic Mesozoic<br />
Margin was based on eleven plays in the<br />
Atlantic Region stretching from Florida to the<br />
Canadian border (Lore et al., 2001). Five plays<br />
were assessed with a total mean value of 2.3 BB<br />
of oil and 27.7 Tcf of gas. The remaining six<br />
plays were described but not assessed. Table 5<br />
lists the results of Ultimate Conventional<br />
Recoverable Reserves (UCRR) with the major<br />
potential predicted in Cretaceous (0.7 BB, 11.8<br />
Tcf) and Jurassic clastics (0.8 BB, 9.0 Tcf)<br />
using the Sable Subbasin as an analogue.<br />
In their assessment, the USGS did not assess<br />
the following conceptual plays based on the<br />
noted restrictions:<br />
Upper Cretaceous Clastics<br />
- Shallow depth, lack of proximity to mature<br />
source<br />
Lower Cretaceous-Upper Jurassic Transitional<br />
- High structural risks<br />
Cretaceous-Jurassic Diapirs<br />
- “Diapir structures off <strong>Nova</strong> <strong>Scotia</strong><br />
unsuccessful” (sic)<br />
Upper Cretaceous-Upper Jurassic Floor Fans<br />
- Source rocks thin and immature<br />
Lower Jurassic-Triassic Rift Carbonates<br />
- Great depth and over-mature source rocks<br />
Lower Jurassic-Triassic Rift Clastics<br />
- a/a<br />
Of most interest is the Atlantic Upper Jurassic<br />
Carbonate (AUJ B1) Play consisting of Late<br />
Jurassic shelf-edge reef complexes with<br />
associated back-reef carbonate platforms and<br />
reef-face carbonate talus. As described by Lore<br />
et al. (2001) in their report:<br />
“Potential reservoirs are located in the reef itself, in the fore-reef talus, and in the back-reef as<br />
oolitic, pelletal, or reef detritus grainstones. Reef and back-reef deposits have the best potential<br />
for enhanced porosity because of subaerial exposure. Traps are mainly stratigraphic on the<br />
carbonate platform. Combination stratigraphic and fault traps occur within the reef complex on<br />
the shelf edge and in reef talus on the slope. Potential source rocks include Jurassic shelf and<br />
slope shales, and possibly lagoonal and platform carbonates.” (p.569-570).<br />
As far as can be determined, the bank edge<br />
proper was never very appealing to industry with<br />
only two bank edge tests in the Baltimore<br />
Canyon area about 35 km apart with one of<br />
these apparently in a back-reef setting. The<br />
1998 Deep Panuke gas discovery confirms that<br />
this play works and a reevaluation of its potential<br />
along the entire American margin is warranted.<br />
6.2 Northwest Africa Margin<br />
6.2.1 Morocco<br />
Prior to the breakup of Pangaea, Northwest<br />
Africa and Eastern North America were<br />
juxtaposed. As a result of rifting, the Aaiun-<br />
Tarfaya Basin was created opposite to the<br />
Baltimore Canyon and George’s Bank Basins<br />
while the Essaoiura Basin formed opposite to<br />
the <strong>Scotia</strong>n Basin (Figure 34). The Moroccan<br />
margin, like the <strong>Scotia</strong>n margin, developed a<br />
thick Jurassic carbonate platform but the<br />
present-day shelf is comparatively very narrow.<br />
Potential carbonate plays offshore Morocco are<br />
much the same as existing offshore <strong>Nova</strong><br />
<strong>Scotia</strong>, i.e. bank margin traps sourced by either<br />
seaward marine shales or underlying synrift Late<br />
Triassic lacustrine facies (Figures 48-50).<br />
A close-up of the Moroccan offshore and<br />
adjacent coastal region geology (Figure 51)<br />
shows the location of the 26 exploratory wells<br />
(now 28) drilled up to 2000 and the seismic<br />
coverage. The wells are clustered north of<br />
Tarfaya and off Agadir and Essaoiura and in<br />
addition are six Deep Sea Drilling Project<br />
(DSDP) bore holes on the continental rise and<br />
slope. Figure 52 illustrates the trace of the<br />
Jurassic shelf edge and several of the ten wells<br />
drilled along it, most of which were drilled in the<br />
1960’s. The carbonate margin lies beneath the<br />
present-day shallow continental shelf which<br />
facilitates good quality seismic imaging.<br />
73
Figure 48. Comparative stratigraphic chart for the <strong>Nova</strong> <strong>Scotia</strong>n and Moroccan offshore successions (via G. Tari / Vanco, 2005). The Breakup<br />
Unconformity on the <strong>Nova</strong> <strong>Scotia</strong> margin and spatial position of the ocean crust is misplaced and should be located above the Argo Salt and below<br />
the carbonates of the Iroquois Formation (Mid to Late Sinemurian time).<br />
74
Figure 49. Stratigraphic chart, tectonic history and petroleum systems for the onshore and offshore portions of the Agadir-Essaouira Basin,<br />
Morocco (via I. Davison, Earthmoves, used with permission).<br />
75
Figure 50. Play concept schematic, offshore Morocco (via D. Hallett, 2003).<br />
76
ExxonMobil (then Esso Exploration – Morocco)<br />
drilled seven wells along the bank edge in the<br />
late 1960’s and early 1970’s looking for closures<br />
incorporating reefal or high energy carbonate<br />
build-ups in the Abenaki-equivalent Puerto<br />
Casando Formation (information from MO-2, -5,<br />
-8, Tan Tan 1 and Cape Juby 1 well composite<br />
logs and related data – via ONAREP). Their<br />
seismic data defined the Jurassic carbonate<br />
margin edge very well with several culminations<br />
interpreted to be potential reefs, and several<br />
wells discovered heavy 10-15º API biodegraded<br />
oil with traces of H2S in the large Cap Juby<br />
Anticline (Figure 53). The MO-2 well tested two<br />
porous dolomitic limestone intervals (karsted?)<br />
at the top of the formation and recovered 12º<br />
heavy oil at a rate of 2300 bopd. The MO-8 well<br />
recovered several barrels of lighter gravity 38º<br />
oil in a DST from carbonates at the top of the<br />
Middle Jurassic (Scatarie / Abenaki 1<br />
equivalent?). Several barrels of 10.5º heavy oil<br />
were also recovered from the Cap Juby 1 well<br />
(twin of the MO-2 well) from strata at the top of<br />
the Jurassic similar to the MO-8 well. Estimated<br />
reserves in the Cap Juby structure are noted as<br />
being between 40-70 MMB heavy oil (Baraka<br />
<strong>Petroleum</strong> Limited:<br />
http://www.barakapetroleum.com/pdf/050524.pdf<br />
).<br />
The seismic line through the MO-8 well (Figure<br />
54), and south of it (Figure 55) reveal an eroded<br />
bank margin very similar to the Tertiary erosion<br />
along the Acadia Segment of the <strong>Scotia</strong>n Basin.<br />
Tertiary lowstand erosional events have cut<br />
through the Cretaceous strata and into or along<br />
the Jurassic carbonate bank. While only<br />
isolated seismic lines off Morocco are available,<br />
some of these Tertiary features could be<br />
submarine canyon cuts. However, on the<br />
southwest <strong>Nova</strong> <strong>Scotia</strong> margin, along-strike<br />
belts exist where the bank edge is beveled off.<br />
It is not clear on the Moroccan seismic exactly<br />
how close the erosion comes to the carbonate<br />
surface. Trap integrity may be compromised by<br />
not only physical breaching but also by<br />
fracturing to negate top seal. While oils are<br />
present at Cap Juby and infer trap seal<br />
preservation, their heavy nature may be the<br />
result of biodegradation due to proximity of the<br />
erosional surface. Whether hydrocarbon<br />
migration pre- or post-dates this erosional event<br />
is not known.<br />
Another seismic profile at a near-by but<br />
unidentified location to the northeast (Figure 56)<br />
shows the bank margin well buried and<br />
landward of the effects of Tertiary erosion like<br />
that of the Sable Subbasin (ONAREP, 2000b).<br />
This setting should be the better environment for<br />
trap preservation and a working petroleum<br />
system. The domal features beneath the bank<br />
appear like the salt features mapped beneath<br />
the Abenaki bank off <strong>Nova</strong> <strong>Scotia</strong> but this has<br />
not been confirmed.<br />
A large prospective lead in the Jurassic<br />
succession has been identified by ROC Oil &<br />
Gas Company of Australia (Figure 53). The<br />
Trident Lead is a large, 19x3km, four-way<br />
closure along the edge of the Jurassic carbonate<br />
reef margin. Reservoirs are predicted to have<br />
been developed in Middle and Lower Jurassic<br />
oolitic and grainstone facies at about 3200<br />
mTVDSS (<strong>Scotia</strong>n Basin Abenaki Formation<br />
Scatarie Member and Iroquois Formation<br />
equivalents?). The structure’s style, dimensions<br />
and setting appear identical to that of the Deep<br />
Panuke Field, offshore <strong>Nova</strong> <strong>Scotia</strong>. ROC has<br />
calculated an estimated volumetric potential for<br />
the Trident Lead of 2.85 BB OOIP with unrisked<br />
potential reserves (UPR) of 700 MMB. (Source:<br />
ROC Oil Company Limited –<br />
http://www.rocoil.com.au-Pages-<br />
Company_Reports-ROC_1999_Prospectus.pdf).<br />
The USGS World <strong>Petroleum</strong> Assessment (2000)<br />
did not assess offshore Morocco although it is<br />
identified as an area for future consideration.<br />
Modern seismic across the Jurassic margin<br />
wells combined with logs are required to make<br />
accurate comparisons with conjugate basins and<br />
successions offshore <strong>Nova</strong> <strong>Scotia</strong> and the<br />
United States.<br />
77
Figure 51. Moroccan Atlantic margin geology (ONAREP, 2000b). With few exceptions, most industry<br />
wells were drilled in water depths of less than 100 m. Legend: Industry exploration wells (well symbols –<br />
D&A), DSDP boreholes (numbered black dots), regional seismic lines (black lines), Figures 53 and 56<br />
(orange line), light grey areas (Canary Islands – Tertiary volcanics).<br />
78
Figure 52. Trace of the Upper Jurassic carbonate bank margin, Puerto Cansado Fm. (ONAREP, 2000b).<br />
79
A B<br />
ROCM98-15A<br />
83MMO-35<br />
Figure 53. A. Location map of the Cap Juby Field and Trident Lead, offshore Morocco. B. Top Jurassic<br />
time structure map of the Top Jurassic, Trident Lead. Seismic line in Figures 54 and 55 indicated by<br />
violet lines. (Source: ROC Oil Company Limited - http://www.rocoil.com.au-Pages-Company_Reports-<br />
ROC_1999_Prospectus.pdf).)<br />
NW SE<br />
Figure 54. Regional seismic line 83MMO-35 through MO-8 and MO-2 (projected) wells, Cap Juby<br />
Anticline. The domal shape to the bank margin suggests deformation via an underlying salt feature similar<br />
to those observed in lines on the Acadia Segment, offshore <strong>Nova</strong> <strong>Scotia</strong>. See Figures 51 and 53 for line<br />
location. Slightly modified after ONAREP, 2000b.<br />
80
Middle Jurassic<br />
Figure 55. Regional seismic line ROCM98-15A through the Cap Juby Anticline, approximately 7 km<br />
southwest of Figure 54. See Figures 51 and 53 for line location. (Source: slightly modified from ROC Oil<br />
Company Limited - http://www.rocoil.com.au-Pages-Company_Reports-ROC_1999_Prospectus.pdf).<br />
Figure 56. Regional seismic line 83MMO-??, exact location unknown (slightly modified after ONAREP,<br />
2000b). The bank margin in this area northeast of the Cap Juby Anticline is deeply buried under<br />
Cretaceous (Tan Tan Fm.) and Tertiary siliciclastics and not affected by later erosional events and is in a<br />
setting analogous to the Panuke Segment offshore <strong>Nova</strong> <strong>Scotia</strong>.<br />
81
6.2.2 Mauritania<br />
The offshore Mauritanian Basin is an extension of the Moroccan Atlas Basin and shares a similar<br />
geologic history (Figure 57). Though details are unavailable, the Jurassic carbonate margin is estimated<br />
to be over 2000 metres thick and has a steep escarpment-like morphology (Figure 58). Adjacent to the<br />
landward edge of the margin, hydrocarbon shows were found by the Autruche-1 well in faulted<br />
Cretaceous sandstone reservoirs. Rich, oil-prone Early Cretaceous (Neocomin) shales are believed to be<br />
the main oil and gas source. While not penetrated offshore Mauritania, deeper early synrift lacustrine<br />
sources are believed to exist that would provide an additional hydrocarbon source for potential carbonate<br />
and younger reservoirs.<br />
Figure 57. Schematic geological cross section through Mauritanian coastal basin, offshore continental<br />
margin (Source: Baraka <strong>Petroleum</strong>, 2005 - http://www.barakapetroleum.com/prospectus.pdf)<br />
6.3 Gulf of Mexico<br />
The Upper Jurassic carbonate platform that<br />
rimmed the North Atlantic from Newfoundland to<br />
the Bahamas continued around the Gulf of<br />
Mexico to the Yucatan Peninsula (Figure 59).<br />
The Smackover Formation is on the American<br />
side of the Gulf and broadly equivalent strata of<br />
the Pimienta-Tamabra(!) on the Mexican. In the<br />
latter region, observations on the influence of<br />
the Chicxulub impact crater on carbonate margin<br />
has some important implications as it relates to<br />
Montagnais impact crater off southwest <strong>Nova</strong><br />
<strong>Scotia</strong>.<br />
82
Figure 58. A 3D isometric view of the top Upper Jurassic-Earliest Cretaceous carbonate platform margin,<br />
offshore Mauritania. The ‘Block 4 Reef Play’ may be a detached block from the margin now resting at the<br />
base of the reef slope, or a carbonate debris fan or apron. The ‘Shafr al Khanjar’ feature appears to be<br />
an isolated structural spur off the main reef trend. Pock-marked deepwater area reflects the effects of<br />
sedimentary loading upon deeper Late Triassic salt (Source: Fusion Oil & Gas Plc website).<br />
6.3.1 United States<br />
The Upper Jurassic Smackover Formation is<br />
age equivalent to the Upper Jurassic Abenaki<br />
Formation offshore <strong>Nova</strong> <strong>Scotia</strong> (Figures 59-61).<br />
The Smackover is a shallow marine carbonate<br />
ramp facies, with oolite shoal and detrital<br />
limestones deposited on bathymetric highs<br />
(Figure 62). The analogy may be appropriate for<br />
the Abenaki ramp facies east of Sable Island<br />
which was not studied for this report, but was<br />
used for evaluating the platform interior region<br />
west of Sable Island. Seismic data over the<br />
interior Abenaki Platform has limited coverage,<br />
large grid sizes and poor quality such that the<br />
delineation of Smackover type plays cannot be<br />
undertaken.<br />
The Upper Jurassic Smackover Formation is<br />
one of the most productive hydrocarbon<br />
reservoirs in the northeastern Gulf of Mexico.<br />
Cumulative production to date is over 1 billion<br />
barrels of oil and 4 trillion cubic feet of gas.<br />
Production comes from three plays; basement<br />
ridge play, regional peripheral fault play and salt<br />
anticline play (Mancini, 2002). The fields are<br />
often relatively small (10-30 MB) but are<br />
numerous and prolific producers. Nevertheless,<br />
there is potential for large fields such as the Jay<br />
Complex with reserves in the 500 MMB and 1<br />
Tcf range. A lower Smackover facies composed<br />
of a transgressive, low-energy sub-tidal<br />
carbonate mudstone sequence is known as an<br />
excellent source rock (Fails, 1990). The trap<br />
types (Figure 63) are both structural and<br />
stratigraphic / facies dependant (Moore, 1984).<br />
83
Chicxulub<br />
impact crater<br />
Figure 59. Map and general stratigraphy of the Jurassic- Cretaceous succession in the Gulf of Mexico<br />
region (slightly modified after Winkler and Buffler, 1988 in Moore, 2001).<br />
A<br />
B<br />
84
Figure 60. Structural setting of the Upper Jurassic, central Gulf of Mexico region (Moore and Heydari,<br />
1993 in Moore, 2001).<br />
Figure 61. Stratigraphic relationships and lithologies of the upper Jurassic in the Central Gulf of Mexico<br />
region (Moore and Heydari, 1993 in Moore, 2001)<br />
85
Figure 62. Areal extent, lithologies and facies distribution of the Smackover Formation. Dark blue<br />
represents basinal facies, lighter blues shelf and slope environments. Most discoveries and production<br />
are concentrated in the shelf and shallow slope facies. (Source unknown, 1986).<br />
Figure 63. Upper Smackover trap types (Source unknown, 1986, after Moore, 1984).<br />
86
6.3.2 USGS Resource Assessment<br />
The USGS evaluated and assessed the<br />
hydrocarbon resources of the onshore<br />
Smackover Formation plays across three<br />
assessment provinces; East Texas Basin,<br />
Louisiana-Mississippi Salt Basin and the<br />
Western Gulf (Schenk and Viger, 1995). Seven<br />
plays were isolated as having correlative value<br />
with the five most significant noted below.<br />
Reserves assessments are presented in Tables<br />
6 and 7.<br />
1) Alabama/Florida Peripheral Fault Zone Oil<br />
and Gas Play (USGS Play No. 4910)<br />
Reservoirs are grainstones and packstones of<br />
the upper Smackover Formation. Porosity<br />
ranges up to 15 percent, permeabilities up to<br />
100 mD and depth to undiscovered reservoirs<br />
between 1800-6000 m. Source rocks are the<br />
organic-bearing carbonate mudstones of the<br />
lower Smackover Formation. Traps occur along<br />
faults within the regional peripheral fault zone.<br />
This play contains 19 oil reservoirs with a<br />
median size of 6.2 MMB and three gas<br />
reservoirs with a median size of 248 Bcf. The<br />
Jay Field, discovered in 1972, is one of the<br />
largest onshore discoveries in the U.S. in the<br />
previous 25 years. The potential for<br />
undiscovered oil and gas in this play is<br />
estimated to be moderate to high.<br />
2) East Texas-Southern Arkansas Peripheral<br />
Fault Zone Oil and Gas Play (USGS No. 4916)<br />
This is a continuation of the above play but with<br />
an increased structural component of anticlines,<br />
faulted anticlines and salt structures along the<br />
peripheral fault zone. Porosities range up to 25<br />
percent, permeabilities up to 150 mD and depth<br />
to undiscovered reservoirs between 1200-3650<br />
m. The play contains 14 oil reservoirs with a<br />
median size of 5 MMB and 12 gas reservoirs<br />
with a median size of 20 Bcf. The probability for<br />
its undiscovered potential is estimated to be<br />
moderate.<br />
3) Alabama/Florida Updip Oil Play (USGS No.<br />
4911)<br />
Reservoirs in this play are carbonate<br />
grainstones and packstones of the upper<br />
Smackover Formation. Porosity ranges up to 15<br />
percent and permeability to 150 mD. Traps are<br />
associated with small basement structures updip<br />
from the regional peripheral fault zone. This<br />
play contains eight oil reservoirs with a median<br />
size of 3.7 MMB and two gas/condensate<br />
reservoirs of 9 and 17 Bcf.<br />
4) East Texas-South Arkansas Updip Oil Play<br />
(USGS No. 4917)<br />
This is a continuation of the previous play but<br />
with reduced porosity range up to 10 percent,<br />
permeabilities up to 10mD and depths from<br />
1200-2750m. The play contains three oil<br />
reservoirs with a median size of 2.5 MMB and<br />
one gas reservoir of 16 Bcf.<br />
5) Salt Basins Gas and Oil Play (USGS No.<br />
4912)<br />
The reservoirs are upper Smackover grainstone,<br />
packstone and boundstone facies with porosities<br />
up to 20 percent and permeabilities up to<br />
100mD. Traps are structural, occurring in salt<br />
structures, anticlines and faulted salt anticlines.<br />
This play contains 58 oil reservoirs with a<br />
median size of 6.4 MMB and 44 gas reservoirs<br />
with a median size of 24 Bcf.<br />
6.3.3 Mexico<br />
One of the most prolific petroleum systems in<br />
the world is the Pimienta-Tamabra(!) in the<br />
southern Gulf of Mexico, both onshore and<br />
offshore. Known reserves, including productionto-date,<br />
are 44.5 BB of oil and 50.8 Tcf of gas<br />
(Magoon and Schmoker, 2000) plus<br />
undiscovered potential of 23.3 BB and 49.3 Tcf<br />
(USGS, 2000) for an EUR of 67.8 BB and 100.1<br />
Tcf (84.5 BOEB).<br />
Play Discovered Resources Mean Field Size No. of Fields<br />
Oil (MMB) Gas (Bcf) Oil (MMB) Gas (Bcf) Oil Gas<br />
1 6.2 248 19 3<br />
2 5.0 20 14 12<br />
3 3.7 13 8 2<br />
4 2.5 16 3 1<br />
5 6.4 24 58 44<br />
Table 6. USGS Assessment, Smackover Formation, Discovered Resources<br />
87
Play Undiscovered Potential Mean Field Size No. of Fields<br />
Oil (MMB) Gas (Bcf) Oil (MMB) Gas (Bcf) Oil Gas<br />
1 91 640 3.9 58 23 11<br />
2 47 424 4.1 23 12 19<br />
3 125 4.3 29<br />
4 88 2.8 32<br />
5 104 960 5.6 31 19 31<br />
Sum 455 2024<br />
Table 7. USGS 2000 Assessment, Smackover Formation - Undiscovered Potential<br />
Figure 64. Map of the Pimienta-Tamabra(!) trend showing components of its total petroleum system<br />
(Magoon et al., 2001). Numbers refer to USGS (2000) assessment areas<br />
88
In the southern Gulf of Mexico, the stratigraphic<br />
nomenclature is not consistent over the entire<br />
area (Figure 59). In northeast Mexico, the<br />
Zuloaga Formation marks the onset of openmarine<br />
conditions and is correlative with the<br />
Smackover of the Northern Gulf Coast<br />
(Goldhammer and Johnson, 2001). The<br />
carbonate regime was interrupted by deposition<br />
of the Cotton Valley (Texas) and La Casita<br />
(Mexico) siliciclastics but reaffirmed itself until<br />
the Mid-Cretaceous (Late Albian)<br />
The petroleum system consists of excellent<br />
Upper Jurassic source rocks and outstanding<br />
Cretaceous carbonate reservoirs was followed<br />
by sufficient Tertiary siliciclastic sedimentation to<br />
thermally mature the source rock (Galicia, 2001;<br />
Magoon et al., 2001) (Figure 64). The Pimienta-<br />
Tamabra(!) petroleum systems events timing<br />
chart reveals that petroleum generationmigration-accumulation<br />
which started in the<br />
Eocene continues to the present-day (Figure<br />
65). Comparatively, the events timing chart for<br />
the Abenaki Formation (Figure 25) relies on<br />
assumptions for the presence of source rocks,<br />
and the effects of Cretaceous and Tertiary<br />
erosion are not completely understood.<br />
The major plays in the Pimienta-Tamabra(!)<br />
petroleum system are Early to Middle<br />
Cretaceous age carbonates, especially<br />
carbonate slope, base-of-slope and basinal<br />
carbonate debris flow facies. The most<br />
significant productive play is the Tamabra<br />
carbonate debris flow breccias and turbidity<br />
Figure 65. Pimienta-Tamabra(!) events timing chart (Magoon et al., 2001).<br />
current facies encompassing the outer perimeter<br />
of the El Abra carbonate platform complexes<br />
(Figure 66). The carbonate traps exist in a nearperfect<br />
setting, but the geological and physical<br />
processes illustrate some degree of similarity to<br />
certain aspects of the Upper Jurassic Abenaki<br />
Formation which are noted elsewhere in this<br />
report.<br />
The eroded profile of the Golden Lane reef<br />
complex (Figure 67) is of particular interest<br />
because the steep profile survived with the<br />
breccia facies apron accumulating downslope.<br />
A representative seismic line run across this<br />
profile (Francisco and Castillo-Tejero, 1970)<br />
might probably reveal a profile and reflection<br />
pattern resembling the steep margin bank<br />
existing along the Acadia Segment off <strong>Nova</strong><br />
<strong>Scotia</strong> (see Figures 94-109) and would infer the<br />
potential for a similar downslope breccia play<br />
here as well. This facies of the Abenaki<br />
formation has yet to be drilled.<br />
There are two reasons for comparing the<br />
Abenaki Formation to the El Abra/Tamabra<br />
margin. The main analogy is the degree of<br />
physical degradation of the Acadia Segment by<br />
syn- or early post-depositional erosion (subaerial<br />
and/or submarine) that has potential for creating<br />
debris flow fans and aprons on the foreslope.<br />
The second is the effect of the Montagnais<br />
impact crater which is somewhat comparable to<br />
the Chicxulub meteor crater on the Yucatan<br />
Peninsula.<br />
89
Figure 66. Map of Tuxpan area oil and gas fields (Magoon et al., 2001). Not the location of the source<br />
rock area and hydrocarbon migration pathways with the majority of fields in the margin-flaking debris flow<br />
breccias (USCG Assessment Units 2, 3, and 4).<br />
90
Figure 67. Schematic of the Mid-Cretaceous Pimienta-Tamabra(!) carbonate reservoir facies (Francisco<br />
and Castillo-Tejero, 1970).<br />
As will be discussed and illustrated in Chapter 7,<br />
the Abenaki platform margin facies along the<br />
Acadia Segment is interpreted as reflecting a<br />
high-energy environment setting with post-<br />
Jurassic with erosion, faulting and disruptive<br />
salt. In Mexico, allochthonous carbonate debris-<br />
flow breccias and carbonate turbidity-flow<br />
deposits can be formed in at least two ways,<br />
either by eustatic sea-level changes that expose<br />
the bank edge to erosion and/or earthquakes<br />
and related tsunamis (Magoon, 2001). Even<br />
extra-terrestrial causes are cited:<br />
“In Pimienta-Tambra, regional shaking from the Chicxulub meteorite impact dislodged and<br />
relocated reef material onto the slope and base of slope.” (Magoon, 2001)<br />
<strong>Offshore</strong> <strong>Nova</strong> <strong>Scotia</strong>, the Montagnais impact of<br />
Eocene age (~50 mya) was too late to influence<br />
later carbonate deposition of the Upper Jurassic<br />
bank edge though appears to have altered the<br />
subsequent local Tertiary drainage pattern and<br />
focus submarine erosion in its locality.<br />
Furthermore, the related “regional shaking”<br />
profoundly disturbed Jurassic carbonates in the<br />
areas immediately adjacent to the impact site<br />
and appears to have released deep salt under<br />
the carbonate platform which further modified<br />
the margin.<br />
6.4 Western <strong>Canada</strong> Sedimentary Basin<br />
There is a global paucity of producing Jurassic<br />
carbonate platform margins. Notwithstanding<br />
the environmental differences between the<br />
Devonian and Jurassic worlds, the Devonian of<br />
the Western <strong>Canada</strong> Sedimentary Basin<br />
(WCSB) was nevertheless affected and<br />
influenced by similar geologic processes and<br />
provides useful information in helping<br />
understand the Abenaki succession.<br />
Figure 68 illustrates divisions within the Western<br />
<strong>Canada</strong> Devonian reef systems which include<br />
the Elk Point, Beaverhill Lake, Woodbend,<br />
Winterburn and Wabamun Groups of central<br />
Alberta and their equivalents. Reefs are most<br />
extensively developed in the Woodbend, to a<br />
lesser degree in the Beaverhill Lake and Elk<br />
Point, and to a minor degree in the Winterburn<br />
and Wabamun. A general transgression of reef<br />
facies progresses from north to south from Elk<br />
Point through Woodbend time. Regressive beds<br />
of the Upper Woodbend and younger Devonian<br />
overlie the older reef-bearing beds. While the<br />
91
Leduc reefs and large bioherms are most<br />
famous there are some bank edge examples to<br />
draw upon and even the “bank” edges of large<br />
bioherms.<br />
The Redwater reef of Central Alberta (Figure 69)<br />
is a large bioherm with an area of 512 km 2 and<br />
thickness of 244 m. It has long been <strong>Canada</strong>’s<br />
second largest oil field with 850 MB of<br />
recoverable oil and in-place gas of 1300 MB<br />
(RF=65%). In section the reef is an atoll with an<br />
exterior rim of skeletal facies and detritus. The<br />
porosity is included in this rim and the oil is<br />
trapped in the updip edge of the reef (Jardine et<br />
al., 1977).<br />
Clarke Lake (Figure 70) is a Mid-Devonian bank<br />
edge gas field in Northeast British Columbia.<br />
The field covers an area of about 115 km 2 and<br />
had marketable gas reserves of 1.5 Tcf. Local<br />
dolomitization has occurred along fracture zones<br />
at the bank edge. Porosity is limited to the<br />
dolomitized intervals which are narrow and<br />
difficult to map, resulting in a poor exploration<br />
and delineation drilling record with a success<br />
rate of 50%. Maximum pay is 106 m and the<br />
better wells deliver up to 30 MMcf/d (Jardine et<br />
al, 1977).<br />
Figure 68. Schematic cross section showing the subdivision of Western <strong>Canada</strong> Sedimentary Basin<br />
Upper Devonian Woodbend-Winterburn Group strata and their relation to key type sections (Figure 12.7<br />
of Switzer et al., 1994).<br />
92
Figure 69. Redwater oil field, central Alberta: maps and cross sections illustrating lithofacies, porosity<br />
and fluid distribution (Jardine et al., 1977)<br />
Figure 70. Clarke Lake gas field, northeast British Columbia: maps and cross sections illustrating<br />
lithofacies, porosity and fluid distribution (Jardine et al., 1977)<br />
93
Figure 71. Location map and cross section of the Devonian Caroline gas field, southwest Alberta (Source<br />
unknown).<br />
The last significant carbonate bank margin<br />
discovery was made by Shell in 1986 at Caroline<br />
in southwest Alberta (well 7-18-34-4W5) in the<br />
Swan Hills Formation (Figure 71). The bank<br />
margin consists of several backstepping cycles<br />
of reefal buildups with porosity in the highenergy<br />
dolomitized reef margin facies.<br />
Recoverable reserves were estimated at 250<br />
MB and 2 Tcf with reservoir-quality porosity<br />
restricted to a 1-2 km belt along the reef margin.<br />
A field size distribution (Figure 72) of the Swan<br />
Hills dolomitized bank margin reservoirs was<br />
used by the Canadian Gas Potential Committee<br />
(2001) in their assessment of Play A331. The<br />
fields include stacked reservoirs in Beaverhill A<br />
and B pools. The distribution is lognormal and<br />
Caroline, the last discovery in 1986, became the<br />
second largest field. In the same figure is a field<br />
size distribution of the Slave Point/Sulphur Point<br />
bank margin, assessed by the CGPC as Play<br />
F337. Clarke Lake, at over 2 Tcf, was ten times<br />
the next largest discovery so it was removed<br />
from the population. The remaining fields were<br />
run through the assessment program and then<br />
Clarke Lake was reinserted with the result that<br />
the distribution does not appear lognormal.<br />
94
4000<br />
3500<br />
3000<br />
2500<br />
2000<br />
1500<br />
1000<br />
500<br />
0<br />
2500<br />
2000<br />
1500<br />
1000<br />
500<br />
0<br />
Clarke Lake<br />
Swan Hills Bank Margin Reservoirs - Mid-Devonian WCSB (CGPC<br />
Play A331)<br />
Kaybob South<br />
Caroline<br />
Hanlan-A<br />
Blackstone<br />
Carson Creek N.<br />
Carson Creek<br />
Rosevear-A<br />
Rosevear-B<br />
Hanlan-B<br />
Minehead<br />
Slave Point/Sulphur Point Bank Margin and Interior Reservoirs -<br />
Mid-Devonian WCSB (CGPC Play F337)<br />
Helmet<br />
Kotcho Lake East<br />
Kotcho Lake<br />
Sextet<br />
Klua<br />
Louise<br />
Tsea<br />
Klua SL-D<br />
GIP (Bcf)<br />
GIP (Bcf)<br />
Figure 72. Field size distribution for the mid-Devonian Swan Hills and Slave Point/Sulfur Point bank<br />
margin and interior plays (Canadian Gas Potential Committee, 2001). Individual field names are along<br />
the horizontal axis.<br />
95
The nature of the carbonate regime along the<br />
<strong>Scotia</strong>n Basin hingeline varies along<br />
depositional strike. West and southwest of<br />
Sable Island, the Abenaki succession existed as<br />
a rimmed shelf with a well developed bank<br />
margin profile. To the east and northeast, the<br />
influx of siliciclastics from the coeval Sable Delta<br />
resulted in the establishment of a low angle<br />
ramp margin of mixed clastic and carbonate<br />
facies. The bank margin from Sable to the<br />
American border, the subject of this study, was<br />
subdivided into three segments based on<br />
geologic and physiographic attributes. The<br />
Panuke, Acadia and Shelburne Segments each<br />
reveal unique variations in structural,<br />
depositional and preservation history (Figure 8).<br />
7.1 Regional Late Jurassic Mapping and<br />
Play Concepts<br />
A detailed time structure regional map on the top<br />
of the Abenaki Formation was created using<br />
7. ABENAKI BANK MARGIN<br />
available seismic data and is correlative with the<br />
top of Jurassic. The map was constructed by<br />
merging three separate internal interpretations<br />
of the TGS-Nopec survey for the Acadia<br />
Segment, the JEBCO survey in the Shelburne<br />
Segment and the PanCanadian/EnCana 3D<br />
surveys in the Panuke Segment. Since the data<br />
with which this map was constructed remains<br />
confidential, horizon maps cannot be included in<br />
this report.<br />
A three-dimensional image of the Top Abenaki<br />
surface (Figure 73), using only the TGS 2D<br />
seismic data, illustrates the rimmed nature of the<br />
margin along the Acadia Segment. The<br />
Shelburne Segment, while mapped, is not part<br />
of this perspective, and the Panuke Segment,<br />
located to the northeast, is discussed later in the<br />
report. Only the well bores that intersected the<br />
bank edge are included which also shows the<br />
paucity of data points.<br />
Panuke 3D<br />
Figure 73. Isometric 3D image of the regional Top Jurassic horizon (~ Abenaki 7) viewed to the<br />
northwest. The relative size and area of the Panuke 3D seismic survey is indicated. Note the<br />
concentration of wells in the Panuke Segment.<br />
96
Figure 74. Isometric 3D image of the Top Jurassic horizon, Panuke Segment, viewed to the west (coarse<br />
gridding).<br />
Figure 75. Isometric 3D image of the Abenaki-6 horizon (depth map), Panuke Segment, viewed to the<br />
north (fine gridding). Note the complexity of the scalloped bank margin with its numerous promontories<br />
and reentrants. The sag behind the margin in the northeast may be related to a subtle salt withdrawal<br />
feature.<br />
97
Figure 76. Isometric 3D image of the Abenaki-6 horizon (depth map), Panuke Segment, viewed to the<br />
west (fine gridding). The rimmed appearance of the margin at its northeastern end may be an<br />
exaggeration due to the back reef low reflecting deeper structural elements.<br />
Figure 77. Isometric 3D image of the Abenaki-6 horizon (depth map) including the Marquis 2D survey to<br />
the northeast (coarse gridding). At its eastern end, definition of the Abenaki bank margin becomes more<br />
difficult and reflects the transition from a rimmed margin to a carbonate ramp.<br />
98
The sinuosity of the bank edge may not be<br />
altogether random but reflecting the underlying<br />
basement architecture as discussed in Section<br />
4.5. The change in strike at the Northeast<br />
Channel / Shelburne Segment (Figure 8) and<br />
the salt features within the subsurface below the<br />
channel imply a failed rift arm (triple junction?).<br />
The mouth of this feature would be the probable<br />
locus for suspected mid-late Jurassic age deltaic<br />
deposition (Wade, 1990); the informally-termed<br />
‘Shelburne Delta’.<br />
The promontory from Albatross B-13 to Acadia<br />
K-62 built across the mouth of the Mohican<br />
Graben forms a large bulge between the Sable<br />
Subbasin and the re-entrant to the southwest.<br />
There are major salt diapiric features that<br />
obliterate the bank edge at the mouth of the<br />
Mohican Graben and in the Shelburne Subbasin<br />
near the American border. These features are<br />
observed on the seismic as being clearly of at<br />
least post-Early Cretaceous and younger<br />
(Eocene) age. Although not visible in Figure 8,<br />
there is a saddle or low in the vicinity of the<br />
Evangeline H-98 well where the top of the<br />
carbonate platform rises both to the southwest<br />
and northeast. On close inspection, the bank<br />
edge seismic pick does not always agree with<br />
the steep contoured gradient which is a function<br />
of erosion and/or faulting where the bank edge<br />
has been disturbed.<br />
Figure 8 illustrates the carbonate platform facies<br />
and the bank edge morphology along with major<br />
features like the Northeast Channel, the<br />
Mohican Graben, several salt features and the<br />
Montagnais Crater. Whereas the bank edge<br />
holds the most current interest, the foreslope<br />
cannot be ignored given its prominence in the<br />
example from the Golden Lane trend of Mexico<br />
(Section 6.3.3). However, while addressed in<br />
the discussions for each of the Segments, little<br />
seismic interpretation has been completed in<br />
this facies except for acknowledging a zone of<br />
foreslope that may capture reefal debris.<br />
7.2 Panuke Segment<br />
The Panuke Segment extends southwest from<br />
Penobscot L-30 to the seaward limit of the Sable<br />
Delta in the vicinity of Evangeline H-98 and is<br />
adjacent to the hydrocarbon-prolific Sable<br />
Subbasin. It is within this subbasin and the<br />
adjacent carbonate bank where all 22 of the<br />
significant oil and gas discoveries off <strong>Nova</strong><br />
<strong>Scotia</strong> have been made. This juxtaposition of<br />
source and reservoir within a prograding delta<br />
complex appears to be the dominant controlling<br />
factor for its successful hydrocarbon system.<br />
The small patch of 3D mapping in the Panuke<br />
Segment attached to the regional 3D image<br />
(Figure 73) is shown on a larger scale (Figure<br />
74) but with the same coarse gridding as the<br />
regional survey (6 X 6 km). The resolution at<br />
this scale is quite poor but when gridded<br />
properly for the 3D coverage the resolution<br />
improves dramatically (Figure 75). The two<br />
opposing views of the Panuke Segment (Figures<br />
76 & 77) show the tremendous degree of detail<br />
along the bank margin and the rimming of the<br />
bank edge with a sag or moat in the back-reef<br />
direction.<br />
The bank edge as seen from the 3D mapping<br />
has a scalloped shape in plan view and these<br />
features are interpreted as syndepositional<br />
slumps and/or gravity slides induced perhaps by<br />
active basement fracture trends. The bank edge<br />
is a highly irregular line much like the presentday<br />
Great Bahama Bank (Figure 13). It is also<br />
interesting to observe the Deep Panuke field is<br />
located on or about the bend in the bank edge.<br />
Unlike the previous map perspectives, the<br />
addition of the Marquis 2D survey to the 3D<br />
survey (Figure 7) yields additional data on the<br />
rimmed margin to the northeast.<br />
7.2.1 Seismic Data and Well Control<br />
The Panuke Segment has the densest well<br />
control and is mostly covered by 3D seismic with<br />
some 2D in-fill data available to fill in the gaps.<br />
The best dataset is amalgamated<br />
PanCanadian/EnCana 3D seismic programs.<br />
Exploration in the Abenaki has been intermittent<br />
as the chronological listing of wells indicate, with<br />
most being drilled following the Deep Panuke<br />
discovery:<br />
99
Year Operator Name ID<br />
FTVD<br />
(m)<br />
1973 Mobil Cohasset D-42 4427.0 Oil<br />
1974 Shell Demascota G-32 4672.0 D&A<br />
1976 Petro<strong>Canada</strong> Penobscot L-30 4267.0 Oil<br />
1978 Mobil Cohasset L-97 4872.0 D&A<br />
1986 Shell Panuke B-90 3445.0 Oil<br />
1998 PanCanadian Panuke<br />
1999 PanCanadian Panuke<br />
1999 PanCanadian Panuke<br />
J-99<br />
PP-3C<br />
J-99<br />
PI-1A<br />
J-99<br />
PI-1B<br />
4163.0 Gas<br />
4030.0 Gas<br />
4046.3 Gas<br />
2000 PanCanadian Panuke H-08 3682.0 Gas<br />
2000 PanCanadian Panuke M-79 4598.3 D&A<br />
2000 PanCanadian Panuke M-79A 3934.7 Gas<br />
2000 PanCanadian Panuke F-09 3815.0 D&A<br />
2001 PanCanadian Musquodoboit E-23 3813.9 D&A<br />
2002 PanCanadian Queensland M-88 4470.0 D&A<br />
2003 EnCana Margaree F-70 3677.0 Gas<br />
2003 EnCana MarCoh D-41 3625.0 Gas<br />
Table 8. Panuke Segment - Wells and Shows<br />
7.2.2 Interpretation<br />
The Abenaki stratigraphy of the Panuke<br />
Segment is best illustrated by EnCana’s<br />
stratigraphic framework (Figure 9). The Baccaro<br />
Member is dominantly an oolite-rich carbonate<br />
platform with a complex reef margin (Eliuk,<br />
2002). The Deep Panuke reservoir consists of<br />
dolomitized and leached reefal limestone in a<br />
combination stratigraphic/structural trap with the<br />
main hydrocarbon-bearing zone the<br />
Kimmeridgian age Abenaki-5. Drilling results<br />
Status Comments<br />
Back Reef – Discovered 38 m light oil pay in thin,<br />
stacked Early Cretaceous Logan Canyon Fm. sands in a<br />
shallow drape closure. Minor mud gas and porosity in the<br />
Abenaki (Bacarro).<br />
Bank Edge - Discovered 168 m of dolomitized and highly<br />
porous limestone (Abenaki 5). Minor mud gas shows,<br />
tested water.<br />
Back Reef – Discovered light oil in shallow drape closure<br />
within Early Cretaceous Missisauga Fm. sands. Minor<br />
mud gas and porosity in the Abenaki (Bacarro).<br />
Back Reef – Some minor porosity and mud gas shows<br />
present. Tested gas-cut mud.<br />
Back Reef – Discovered 10 m light oil pay in several<br />
stacked Early Cretaceous Missisauga Fm. sands in a<br />
shallow drape closure.<br />
Bank Edge – Initial gas discovery. Tested 59.7 MMcf/d<br />
gas from the Abenaki 5/4 zones (also known as PP-3C).<br />
Bank Edge – Thin gas pay. Well plugged and<br />
whipstocked to test adjacent seismic event at PI-1B.<br />
Bank Edge – Whipstocked from PI-1A. Discovered 24.2<br />
m gas pay and tested 52.6 MMcf/d gas in the Abenaki 5.<br />
Bank Edge – Discovered 108 m of net gas pay; tested<br />
51.2 MMcf/d gas from the Abenaki 5.<br />
Bank Edge – No gas pay, well plugged and whipstocked<br />
to test adjacent seismic event at M-79A.<br />
Bank Edge – Whipstocked from M-79. Discovered 11.4<br />
m gas pay, tested 63.2 MMcf/d gas from the Abenaki 5.<br />
Back Reef - Oolitic facies amplitude prospect. Target<br />
was shale. Other limestones were tight with no gas pay.<br />
Bank Edge – Significant porosity encountered within the<br />
Abenaki 5 but was located below the field-wide<br />
gas/water contact.<br />
Bank Slope – Targeted lowstand by-pass sands. One<br />
minor sand present. High amplitude events were thick<br />
foreslope limestones with minor porosity and gas shows.<br />
Bank Edge – Discovered ~70 m gas pay, tested >52<br />
MMcf/d gas. Well data confidential until August 6, 2005.<br />
Bank Edge – Discovered ~100 m gas pay, not tested.<br />
Well data confidential until October 23, 2005.<br />
indicate that a common gas/water contact (ca. -<br />
3504 mSS) exists within the Segment<br />
(PanCanadian, 2002).<br />
Structure maps of the approximate “Lower<br />
Jurassic” marker are believed to ghost the<br />
probable ‘basement’ morphology and reveal a<br />
dominant southwest-northeast trend as shown in<br />
Figure 78. This likely reflects basement highs<br />
and lows associated with Middle-Late Triassic<br />
age rift grabens and half-grabens along with<br />
Early Jurassic salt swells that likely migrated out<br />
100
of the rift basins. The superposition of the Deep<br />
Panuke field with a major high trend is<br />
suggestive of a deeper influence on formation of<br />
bank edge, reservoir diagenesis and gas<br />
accumulation. This suggests that more study<br />
should be directed towards understanding the<br />
pre-platform morphology (basement and pre-<br />
Breakup Unconformity succession) in order to<br />
understand these relationships and assist in<br />
defining similar attributes elsewhere on the<br />
Abenaki margin.<br />
“Lower Jurassic” Time<br />
Figure 78. “Near Basement Morphology”, Lower Jurassic horizon time map. The strong northeastsouthwest<br />
orientation of the horizon infers probable basement faults and related depocentres that were<br />
loci for earliest Jurassic salt deposition. Well cluster to the southeast is the Deep Panuke field. The<br />
Penobscot L-30 well is outboard of the basement trend and may be underlain by a subtle salt feature.<br />
Mapping of the stratigraphically higher Abenaki<br />
6 time structure and the companion depth map<br />
(not included in this report) reveal a striking<br />
similarity of the features seen in the “Lower<br />
Jurassic” marker map due to the relatively<br />
horizontal and uniform overlying sedimentary<br />
section, and the near-flat seabed; i.e. no water<br />
wedge to distort the time/depth conversion.<br />
There is a structural high associated with the<br />
Deep Panuke field with a paralleling long, linear<br />
embayment (moat) on landward side to the<br />
northwest. This combination invariably<br />
contributed to the development of the positive<br />
rimming of reefal facies built up along the bank<br />
edge, and continues further to the northeast.<br />
Near its eastern extremity, the wells at Marquis<br />
and Demascota do not appear to have been<br />
drilled on a positive rim. The intervening<br />
Cohasset L-97 was drilled a structural feature on<br />
a rimmed margin and while encountering tight<br />
limestone with a few modest shows may have<br />
been positioned slightly away from the reef<br />
margin. Time structure and depth maps for the<br />
slightly deeper Abenaki 5 horizon, the closest<br />
horizon to the major pay zones (not included in<br />
this report), also reveal the same observations<br />
but are not quite as distinct.<br />
The very narrow reservoir fairway presents<br />
challenges in a costly offshore setting and a<br />
101
number of wells missed the main reservoir<br />
facies. The following suite of seismic time<br />
profiles through the wells drilled along the trend<br />
is mostly extracted from the<br />
PanCanadian/EnCana 3D data volume. They<br />
A6<br />
A5<br />
A4<br />
Scat<br />
Cohasset D-42<br />
reveal the diversity of seismic responses within<br />
a very small area and are presented in<br />
chronological order of drilling with reservoir<br />
intervals annotated where permitted.<br />
Figure 79. Detailed seismic profile – Cohasset D-42 exploration well. See inset map for location.<br />
Legend: A6, A5 & A4 = Abenaki 6, 5 & 4, Scat = Scatarie (Abenaki 1).<br />
Mobil Cohasset D-42 (1973) (Figure 79) was the<br />
first well drilled to test the carbonate bank edge.<br />
The structural reversal on the Abenaki 6 horizon<br />
is quite obvious with internal amplitude<br />
configurations. The D-42 well penetrated the<br />
entire Abenaki Formation, revealing a thickness<br />
of 1088 m. The Early Cretaceous succession<br />
drapes over the bank margin and light oil within<br />
stacked sands of the Lower Logan Canyon<br />
Formation were developed through the<br />
Cohasset oil field.<br />
102
A6<br />
A5<br />
12 km<br />
Scat<br />
Demascota G-32<br />
Figure 80. Detailed seismic profile – Demascota G-32 exploration well. See inset map for location.<br />
Shell Demascota G-32 (1974) (Figure 80) was<br />
positioned slightly in front of the bank edge with<br />
a possible fault zone just west (left) of the well.<br />
A complex zone of high amplitudes is apparent<br />
at the margin edge and the overall 168 m of<br />
reservoir quality dolomitic porosity is shown<br />
(circled) located just beneath the top of the<br />
Abenaki 5 sequence. The seismic expression<br />
and attributes of this excellent thick porosity was<br />
modeled by Harvey (1990, 1993) which was<br />
utilized by PanCanadian in its exploration along<br />
the trend. EnCana drilled the Musquodoboit E-<br />
23 well in 2001 to investigate the porosity above<br />
the water line in a similar margin setting..<br />
103
Scatarie<br />
Penobscot L-30<br />
Wyandot<br />
‘O’ Marker<br />
Top Jurassic<br />
Figure 81. Detailed seismic profile – Penobscot L-30 exploration well. See Figure 4 for location.<br />
Petro<strong>Canada</strong> Penobscot L-30 (1976) (Figure<br />
81). This well’s objective was a Cretaceous<br />
rollover in front of a down-to-basin listric fault.<br />
Oil pay was defined on logs and RFT’s but no<br />
tests were carried out. Low-angle foreslope<br />
limestones of the Abenaki were intersected near<br />
the well TD, as in this region the steeply dipping<br />
rimmed margin grades into a ramp-like margin.<br />
104
A6<br />
A5<br />
Scat<br />
Cohasset L-97<br />
Figure 82. Detailed seismic profile – Cohasset exploration L-97 well. See inset map for location.<br />
Mobil Cohasset L-97 (1978) (Figure 82) is an<br />
abbreviated profile but shows a fault at or near<br />
the bank edge. This is one of the few wells that<br />
penetrated the entire Abenaki Formation. The<br />
carbonates were mostly tight with some<br />
dolomitic intervals and modest porosity<br />
11 km<br />
development though no significant hydrocarbon<br />
shows were present. The track of the well bore<br />
penetrated the fault and extended basinward in<br />
front of an amplitude anomaly that in hindsight<br />
could have been evaluated via whipstocking.<br />
105
A6<br />
A5<br />
A4<br />
Scat<br />
Panuke PP-3C<br />
Figure 83. Detailed seismic profile – Deep Panuke PP-3C discovery well. See inset map for location.<br />
PanCanadian Panuke (Deep) PP-3C (1999)<br />
(Figure 83) was drilled from the J-99 surface<br />
location of the decommissioned Panuke oil<br />
production platform and was the discovery well<br />
for the Deep Panuke gas field. The main gas<br />
reservoir zone (circled) appears as low<br />
amplitude (blue) events within the Abenaki 5<br />
interval. The reservoir is a dolomitized and<br />
leached vuggy and cavernous limestone reefal<br />
facies with porosities from 3-40+%,<br />
permeabilites from 1 md to several darcies, and<br />
net pay values from 30-100 m. The well tested<br />
flow rates up to 59 MMcf/d which was the limit of<br />
the testing equipment. Traces of H2S were also<br />
encountered at 0.2% (2000 ppm).<br />
106
A6<br />
A5<br />
A4<br />
Scat<br />
Panuke<br />
PP-1A/1B<br />
Figure 84. Detailed seismic profile – Deep Panuke P1-1A/1B, first appraisal well. See inset map for<br />
location.<br />
PanCanadian Panuke (Deep) PI-1A/1B (1999)<br />
(Figure 84) was the first appraisal well<br />
directionally drilled from the J-99 platform about<br />
2.3 kilometres along-strike to the northeast. PI-<br />
1A missed the main reservoir zone and PI-1B<br />
was whipstocked a short distance into the<br />
reservoir zone (circled) and tested gas at 51<br />
MMcf/d.<br />
107
A6<br />
A5<br />
A4<br />
Scat<br />
Panuke H-08<br />
Figure 85. Detailed seismic profile – Deep Panuke H-08, second appraisal well. See inset map for<br />
location.<br />
PanCanadian Panuke (Deep) H-08 (2000)<br />
(Figure 85) was the second appraisal well drilled<br />
about 2.3 km southwest from the discovery well.<br />
It encountered reservoir conditions similar to PP-<br />
3C (circled) and tested gas at 50-57 MMcf/d.<br />
108
A6<br />
A5<br />
A4<br />
Scat<br />
Panuke M-79A<br />
Figure 86. Detailed seismic profile – Deep Panuke M79A, third appraisal well. See inset map for<br />
location.<br />
PanCanadian Panuke (Deep) M-79 and M-79A<br />
(2000) (Figure 86) was the third appraisal well<br />
drilled about 1.3 km northeast from the P1-1B<br />
well and tested gas up to 63 MMcf/d. The M-79<br />
well was vertical and missed the gas zone but<br />
M-79A was whipstocked into the seismic<br />
amplitude horizon (circled) and tested gas up to<br />
63 MMcf/d. This well demonstrated the very<br />
short lateral transition distance between tight<br />
oolitic back reef and reef margin facies<br />
(Wierzbicki et al, 2002).<br />
109
A6<br />
A5<br />
A4<br />
Scat<br />
Porosity ?<br />
Panuke F-09<br />
Shale !<br />
Figure 87. Detailed seismic profile – Panuke F-09 exploration well. See inset map for location.<br />
PanCanadian Panuke F-09 (2000) (Figure 87)<br />
was drilled about 1.8 km landward of the main<br />
gas zone of Deep Panuke in an attempt to<br />
extend the play into the back-stepping Abenaki 6<br />
sequence. No reservoir was encountered in the<br />
Abenaki 6, the target amplitudes were<br />
determined to be due to shale, and further<br />
drilling penetrated tight back-reef facies in the<br />
Abenaki 5.<br />
110
10 km<br />
A6<br />
A5<br />
Scat<br />
Musquodoboit E-23<br />
Figure 88. Detailed seismic profile – Musquodoboit E-23 exploration well. See inset map for location.<br />
PanCanadian Musquodoboit E-23 (2001)<br />
(Figure 88) was drilled updip from Demascota<br />
G-32 to test reservoir above the now established<br />
-3405 mSS gas/water line defined at Deep<br />
Panuke. However, the Abenaki 5 reservoir<br />
(circled) fell beneath the water line and no gas<br />
was encountered.<br />
111
A6<br />
A5<br />
A4<br />
Scat<br />
Bypass<br />
Sand?<br />
Queensland M-88<br />
Gas<br />
Sand<br />
Figure 89. Detailed seismic profile – Queensland M-88 exploration well. See inset map for location.<br />
PanCanadian Queensland M-88 (2002) (Figure<br />
89) was drilled in a fore-reef position to test the<br />
carbonate talus slope and bypass sand play on<br />
the reef margin slope. However, no significant<br />
sands or reservoir were encountered.<br />
112
A6<br />
A5<br />
A4<br />
Marquis L-35<br />
Figure 90. Detailed seismic profile – Marquis L-35 exploration well. See inset map for location.<br />
Canadian Superior Marquis L-35 (2002) (Figure<br />
90) was drilled near the bank edge about 35<br />
kilometres northeast of later MarCoh D-41 well<br />
but encountered tight limestones. A whipstock<br />
(L-35A) also failed to find significant reservoir<br />
27 km<br />
zones above the -3405 mSS structural elevation.<br />
The margin appears sigmoidal in shape and<br />
may be a transitional form between escarpmentlike<br />
and ramping margin profiles.<br />
113
A6<br />
A5<br />
A4<br />
Scat<br />
Margaree F-70<br />
Figure 91. Detailed seismic profile – Margaree F-70, fourth appraisal well. See inset map for location.<br />
EnCana Margaree F-70 (2003) (Figure 91) was<br />
drilled to the northeast of the Deep Panuke field.<br />
Press releases indicated the well discovered<br />
about 70 m of net gas pay which tested >52<br />
MMcf/d gas. Data on this well remains<br />
confidential until August 6, 2005.<br />
114
A6<br />
A5<br />
A4<br />
Scat<br />
MarCoh D-41<br />
Shale<br />
Figure 92. Detailed seismic profile – MarCoh D-41, fifth appraisal well. See inset map for location.<br />
EnCana MarCoh D-41 (2003) (Figure 91) was<br />
the fifth appraisal well and is the furthest<br />
northeast along the Deep Panuke trend.<br />
EnCana press releases stated that the well<br />
7.2.3 Play Concepts<br />
Within the Panuke Segment, hydrocarbons in<br />
the Abenaki Formation are found in combined<br />
structural and stratigraphic traps within<br />
diagenetically-produced porosity formed in the<br />
skeletal framework of debris reefs along the<br />
carbonate bank margin. Maps and 3D images<br />
of the Abenaki 5 and 6 horizons based on 3D<br />
seismic in this segment reveal a highly scalloped<br />
margin composed of an alternating series of<br />
regularly spaced promontories and embayments<br />
about 1-2 kilometers across (Figures 26-28, 31-<br />
33, Figures 72-76). It is believed that these are<br />
natural features related to syndepositional<br />
loading, margin-parallel fracturing and failure on<br />
the margin, with reef talus debris deposited in<br />
deeper water adjacent to the margin as talus<br />
found over 100 m gas pay but was not tested<br />
due to its proximity and close similarity to<br />
adjacent wells. Data on this well is confidential<br />
until October 23, 2005.<br />
cones and aprons, and on the fore-slope in<br />
debris flow and turbidite deposits (Grammer et<br />
al., 1993). Mapping of the Deep Panuke Field<br />
suggests that the main controlling feature of the<br />
play is porosity distribution in the margin.<br />
Narrow amplitude events interpreted as reefrelated<br />
porosity are observed at the head of the<br />
embayments connecting similar events spread<br />
out across the promontories. It is probable that<br />
the scalloping of the margin exists along the<br />
entire Abenaki margin though is not visible due<br />
to the large 6x6 kilometer grid of the latest<br />
regional seismic dataset.<br />
The wells and seismic in the Panuke Segment<br />
indicate a carbonate porosity play existing<br />
across a very narrow 1 - 3 km band along the<br />
bank margin edge. The porosity has been<br />
encountered within the Abenaki 6, 5 and 4<br />
115
intervals though mostly in the 5. The high<br />
porosity, leached, vuggy and cavernous zones<br />
produce a strong amplitude trough which is<br />
evident on the seismic data. The high amplitude<br />
areas are patchy in plan view and mostly occur<br />
right at the bank edge. Areas that may still<br />
contain good matrix porosity appear similar to<br />
tight limestone making it difficult to accurately<br />
map the extent of the productive zones. Often<br />
the highest amplitude areas are associated with<br />
cavernous lost circulation zones during drilling<br />
and are avoided where possible.<br />
The Deep Panuke Field has in-place gas<br />
reserves of approximately 1.2 Tcf<br />
(PanCanadian, 2002) though the full lateral<br />
extent of the field is not yet confirmed. A limiting<br />
factor may be a structural reversal along strike<br />
plunging both to the southwest and the<br />
northeast of Deep Panuke combined with a fieldwide<br />
(regional?) water line (-3405 mSS).<br />
The events timing chart for the Panuke Segment<br />
is presented in (Figure 93). Its proximity to the<br />
prograding Sable Delta during the Late Jurassic<br />
(MicMac Fm.) and Early Cretaceous<br />
(Missisauga and Logan Canyon Fms.),<br />
facilitated rapid burial and preservation of the<br />
bank margin. These successions also<br />
contributed dispersal of volumetrically large<br />
quantities of terrestrial (Type III) organic matter<br />
in thick prodelta sequences which acted as a<br />
seal and potential gas source. Source facies in<br />
adjacent and underlying sediments could also<br />
be contributors of liquid and gaseous<br />
hydrocarbons. The deeper Middle Jurassic<br />
Mohican Formation sediments deposited in<br />
interpreted salt evacuation synclines are unique<br />
to this Segment and could contain possible<br />
source rocks. The reservoir porosity was<br />
probably formed early as combination of faciesrelated<br />
diagenesis and burial subsidence.<br />
Relative to the generic Abenaki chart (Figure<br />
25), the erosional hiatuses, if present, would<br />
have been brief.<br />
EVENT TIMING CHART<br />
PANUKE Segment - Conceptualized <strong>Petroleum</strong> System<br />
TR<br />
200 180 160 140<br />
MESOZOIC<br />
JURASSIC<br />
120 100 80<br />
CRETACEOUS<br />
65 60 50 40 30 20<br />
CENOZOIC<br />
TERTIARY<br />
10 0<br />
QUAT.<br />
GEOLOGIC TIME<br />
SCALE PETROLEUM<br />
L. EARLY MID. L. EARLY LATE PAL. EOCENE OLIG. MIOCENE PP<br />
SYSTEM EVENTS<br />
1 2 3 4<br />
SOURCES<br />
1 2<br />
RESERVOIRS<br />
1 2 3<br />
SEALS<br />
BU<br />
1<br />
2<br />
3<br />
4<br />
5 6<br />
OVERBURDEN & EROSION<br />
1<br />
1 2 3<br />
4<br />
3<br />
4<br />
3<br />
TRAP FORMATION<br />
PRESERVATION<br />
? ?<br />
BU = Break-up Unconformity (~mid-late Sinemurian)<br />
SOURCES<br />
1. Early Synrift (Triassic: Carnian - Norian)<br />
2. Mohican (Jurassic: Toarcian – Aalenian)<br />
3. Jurassic Verrill Canyon (Oxfordian - Kimmeridgian)<br />
4. Cretaceous Verrill Canyon (Berriasian - Valanginian)<br />
RESERVOIRS<br />
1. Scatarie / Abenaki 1 (Bajocian – Callovian)<br />
2. Baccaro / Abenaki 4, 5 & 6 (Callovian – Kimmeridigian)<br />
SEALS<br />
1. Misaine / Abenaki 2 for Scatarie / Abenaki 1<br />
2. Top Abenaki 6 for Baccaro / Abenaki 4, 5 & 6<br />
3. Lower Cretaceous Shales for Baccaro / Abenaki 4, 5 & 6<br />
Figure 93. <strong>Petroleum</strong> system events timing chart – Panuke Segment.<br />
GENERATION GENERATION -- MIGRATION MIGRATION -ACCUMULATION<br />
-ACCUMULATION<br />
CRITICAL MOMENT<br />
OVERBURDEN<br />
Several periods of modest erosion:<br />
1. Early Cretaceous (Aptian?)<br />
2. Late Paleocene<br />
3. Early Eocene (Montagnais Impact Event)<br />
4. Late Eocene<br />
5. Middle Oligocene<br />
6. Middle Miocene<br />
TRAP FORMATION<br />
1. Diagenetic & Subsidence (L. Jur. – E. Cret.)<br />
TIMING<br />
Expulsion periods based on previously modelled<br />
deepwater succession (Kidston et al., 2002, Sites 3-5).<br />
116
7.3 Acadia Segment<br />
The Acadia Segment extends from a structural<br />
saddle or low northwest of the Evangeline H-98<br />
well and southwest to just past the Bonnet P-23<br />
well on the east side of the Northeast Channel<br />
(Figure 8). This segment is characterized by a<br />
steep bank margin which faced a deeper proto-<br />
Atlantic ocean unlike the Panuke segment that<br />
lay adjacent to the embayment where the Sable<br />
Delta formed. In contrast to the Sable Delta<br />
embayment, the carbonate bank in the vicinity of<br />
the Albatross and Acadia wells formed a<br />
promontory out over the mouth of the Mohican<br />
Graben.<br />
The segment was a passively subsiding platform<br />
and margin underlain by the pre-existing rift<br />
topography. The Mohican Graben complex,<br />
orientated at an acute angle with the Abenaki<br />
trend, is mostly inboard of the margin hinge line<br />
and contains significant salt and evaporite<br />
Year Operator Name ID<br />
FTVD<br />
(m)<br />
1978 Chevron Acadia K-62 5287.0 D&A<br />
1985 Petro<strong>Canada</strong> Albatross B-13 4047.0 D&A<br />
1984 Petro<strong>Canada</strong> Bonnet P-23 4336.2 D&A<br />
Table 9. Acadia Segment - Wells and Shows<br />
deposits. There were several periods of<br />
tectonism and erosion, with the most significant<br />
erosion occurring during Tertiary lowstand<br />
events. The question of subaerial versus<br />
submarine erosion is not fully understood but the<br />
latter is favoured. There was also renewed<br />
faulting and salt disruption during this time,<br />
probably triggered by the Montagnais Impact<br />
Event.<br />
7.3.1 Well Control and Seismic Data<br />
There are only two bank edge wells along this<br />
400 km segment: Albatross B-13 and Acadia K-<br />
62. The Bonnet P-23 well is considered a<br />
backreef test as it was located about 6 km<br />
landward of the faulted margin. All three wells<br />
were dry and abandoned but each suffered<br />
individual drilling related problems such as lack<br />
of a mud-gas logging, lost circulation, no testing,<br />
etc. (see Section 3.2).<br />
Status Comments<br />
Bank Edge – Several good porous dolomite zones were<br />
discovered in the Abenaki 6 and 5, and oolitic porosity<br />
common in the Abenaki 5-2 zones but no shows present.<br />
Three DSTs all recovered water.<br />
Bank Edge – Several scattered porous zones in the<br />
Bacarro, minor gas shows in the Abenaki 3 and 2, no tests.<br />
Back Reef – Facies dominated by oolitic shoals. A number<br />
of thick dolomite intervals encountered with good to very<br />
good porosities. A number of loss circulation zones drilled.<br />
Several minor mud gas shows noted, but not tested.<br />
117
Tertiary<br />
Marker<br />
Base Tertiary<br />
Roseway<br />
Top Jurassic<br />
Scatarie<br />
Salt<br />
Acadia K-62<br />
3 km<br />
Figure 94. Detailed seismic profile: Acadia K-62 exploration well. See Figure 4 for location.<br />
Chevron Petro<strong>Canada</strong> Acadia K-62 (1978)<br />
(Figure 94) was located somewhat back from<br />
the rimmed bank edge and missed the prime<br />
skeletal debris reef facies evidenced by an array<br />
of high-amplitude events. The Deep Panuke<br />
seismic examples illustrate how narrow the<br />
reservoir fairway is and how two wells had to be<br />
whipstocked short distances from non-reservoir<br />
to reservoir zones P1/1B (Figure 84) and M-<br />
79/M-79A (Figure 86).<br />
The Base Tertiary unconformity marker is shown<br />
to approach the bank margin at a high angle and<br />
literally bounce up and over the carbonate<br />
“massif”. At the well however, 184 m of Late<br />
Cretaceous was identified from fossils including<br />
thin (remnant?), Wyandot and Petrel limestone<br />
stringers resting unconformably on the Jurassic<br />
(or Roseway) carbonates. Thus, in the GSC’s<br />
the Roseway as tied to other wells is seen to<br />
downlap onto the pronounced Top Jurassic<br />
reflection as a transgressive sequence following<br />
the flooding of the carbonate shelf. As<br />
described in Section 3.2, the well was poorly<br />
interpretation (MacLean and Wade, 1993), a<br />
Mid-Cretaceous unconformity exists across the<br />
western shelf. Even with the improved seismic<br />
data such as the TGS survey used extensively<br />
in this report, the segregation of the Tertiary<br />
unconformities from prior Cretaceous erosion<br />
will require intensive seismic correlations and<br />
reworked biostratigraphy (Crux and Gard, 2003).<br />
The K-62 well drilled a complete Abenaki section<br />
of Roseway (528 m), Baccaro (780 m), Misaine<br />
(218 m), Scatarie Members (648 m) and<br />
bottomed in 337 m of Lower Jurassic Iroquois<br />
Formation dolomites (MacLean and Wade,<br />
1993). The distinction between Roseway and<br />
Baccaro is not seismically evident and this<br />
report places the Top Jurassic seismic marker at<br />
the top of the massive limestone section<br />
resulting in 1308 m of the Abenaki. Seismically,<br />
evaluated: there was no mud gas logging, a lost<br />
circulation zone was encountered from 4677 –<br />
4790 m, and one flow test in the Abenaki<br />
recovered formation water. There was no<br />
mention of hydrocarbons in the cuttings report.<br />
118
Tertiary Marker<br />
Base Tertiary<br />
Roseway<br />
Top Jurassic<br />
Scatarie<br />
Salt<br />
Albatross B-13<br />
3 km<br />
Figure 95. Detailed seismic profile: Albatross B-13 exploration well. See Figure 4 for location<br />
Petro<strong>Canada</strong> Texaco Albatross B-13 (1985)<br />
(Figure 95) was drilled a complete Abenaki<br />
section of Roseway (546 m) and Baccaro<br />
Members (944 m) and bottomed in the Misaine<br />
shale (MacLean and Wade, 1993). To be<br />
consistent with the Acadia K-62 well, the<br />
combined figure of 1490 m of massive limestone<br />
would all fall within the Upper Jurassic section<br />
as defined by regional seismic correlations.<br />
The seismic window shows the overlying<br />
Tertiary unconformities with large-scale slumps<br />
on the seaward side of the bank edge. A<br />
pronounced high amplitude, steeply-dipping<br />
event seen within the bank edge is either a fault<br />
zone (possible lost circulation below 2925 m,<br />
see Section 3.2) or some form of seismic<br />
interference. As described in Section 3.2 the<br />
well encountered scattered porosity with a<br />
partial lost circulation zone below 2925 m, low<br />
mud gas peaks but no DST’s were run.<br />
119
Tertiary Marker<br />
Base Tertiary<br />
Roseway<br />
Top Jurassic<br />
Scatarie<br />
Salt<br />
Bonnet P-23<br />
3 km<br />
Figure 96. Detailed seismic profile: Bonnet P-23 exploration well. See Figure 4 for location.<br />
Petro<strong>Canada</strong> Bonnet P-23 (1984) (Figure 96)<br />
was located about 6 km back from a highly<br />
faulted bank margin and indeed may have drilled<br />
a fault zone due to extensive zones of lost<br />
circulation from 2830 m to TD (see Section 3.2).<br />
As a result this well is a considered a backreef<br />
test in our inventory.<br />
The P-23 well drilled a complete Abenaki section<br />
of Roseway (296 m), Baccaro (1087 m), Misaine<br />
(168 m), Scatarie (179 m) and bottomed in 811<br />
m of Iroquois (MacLean and Wade, 1993). The<br />
distinction between the Roseway and Baccaro is<br />
not seismically evident and this report places the<br />
Top Jurassic seismic marker at the top of the<br />
massive limestone section resulting in 1383 m of<br />
Abenaki strata. The Base Tertiary<br />
unconformities have cut down through the<br />
Cretaceous section much like at the Acadia<br />
location. As detailed in Section 3.2, the well<br />
encountered extensive zones of lost circulation,<br />
incomplete mud-gas logging and several low<br />
mud gas peaks. No DST’s were run.<br />
7.3.2 Interpretation<br />
The basin setting of the Acadia Segment differs<br />
from the Panuke Segment in several significant<br />
ways. Foremost, there is no Sable Delta<br />
equivalent and the carbonate platform now lies<br />
at a higher structural elevation covered by a<br />
thinner Cretaceous section. Secondly, the<br />
Tertiary unconformities were able to erode down<br />
to the top of the Abenaki margin which appears<br />
on seismic as a very steep slope. There are<br />
also suggestions in the data that parts of the<br />
original bank margin may have faulted or<br />
collapsed into the basin (see below). The<br />
assessment of exploration risks must include the<br />
possibility of a lack of preserved reefal facies<br />
through erosion and/or faulting.<br />
The following suite of seismic profiles is included<br />
to illustrate the dramatic changes in morphology<br />
along the 400 km stretch of the Acadia<br />
Segment. The sections are shown both<br />
uninterpreted and interpreted and begin in the<br />
southwest and progress toward the Panuke<br />
Segment in the northeast. The vertical scale is<br />
120
in time; therefore, the overlying water wedge<br />
distorts the structural picture by depressing the<br />
seismic markers as the water column increases.<br />
The changes in the bank edge are annotated in<br />
map form (Figure 8). Unless otherwise<br />
Tertiary Marker<br />
Base Tertiary<br />
Roseway<br />
Top Jurassic<br />
Scatarie<br />
Salt<br />
6 km<br />
indicated, all lines are dip lines and oriented in a<br />
NW (left) to SE (right) direction, and the distance<br />
between seismic cross (strike) lines indicated at<br />
the top of each section is six (6) kilometers.<br />
Figure 97. Seismic profile - southwest of Bonnet P-23 well, southern limit of TGS NOPEC survey. See<br />
Figure 4 for location.<br />
Figure 97 is 40 km southwest of Bonnet P-23<br />
and shows a post-depositional faulted margin<br />
with the preserved rim possibly breached by the<br />
Base Tertiary unconformity. Another indication<br />
for the actual paleo-bank edge is the seaward<br />
side onlapping pinch-out of the Cretaceous<br />
section.<br />
121
Tertiary Marker<br />
Base Tertiary<br />
Roseway<br />
Top Jurassic<br />
Scatarie<br />
Salt<br />
6 km<br />
Figure 98. Seismic profile – rotated fault block on the Abenaki bank margin, east of the Bonnet P-23 well.<br />
See Figure 4 for location.<br />
Figure 98 is 25 km east of Bonnet P-23 and<br />
shows a very steep bank edge with a faulted<br />
morphology that reoccurs in other locations.<br />
The favoured interpretation is the original bank<br />
edge faulted and rotated into the basin. The<br />
Base Tertiary unconformity follows the very<br />
steep fault scarp. Unlike the previous example,<br />
prediction of where the high energy reefal facies<br />
on this line is located is challenging.<br />
122
Tertiary Marker<br />
Base Tertiary<br />
Roseway<br />
Top Jurassic<br />
Scatarie<br />
Salt<br />
3 km<br />
Figure 99. Seismic profile, TGS Line 320 – margin-parallel Base Tertiary erosional trough.<br />
Figure 99 is immediately east of the Montagnais<br />
I-94 well (and crater) and reveals a deep Lower<br />
Tertiary-age erosional channel running subparallel<br />
to the bank margin. The depth of<br />
erosion is close to the top carbonate on the<br />
platform but has cut deeply into the section<br />
basinward. The original bank edge is hard to<br />
determine and the profile is less steep than<br />
previous examples. It is unknown if this feature<br />
is related in some manner to the early Eocene<br />
impact event.<br />
123
Tertiary Marker<br />
Base Tertiary<br />
Roseway<br />
Top Jurassic<br />
Scatarie<br />
Salt<br />
6 km<br />
Figure 100. Seismic profile – eroded platform margin west of the Albatross B-13 well. See Figure 4 for<br />
location.<br />
Figure 100 is 10 km west of Albatross B-13 and<br />
illustrates the Base Tertiary unconformity<br />
incising the bank edge with an apparent fault<br />
and/or slump in front. The foreslope limit is<br />
indicated by seismic amplitude character.<br />
124
Tertiary Marker<br />
Base Tertiary<br />
Roseway<br />
Top Jurassic<br />
Scatarie<br />
Salt<br />
6 km<br />
Figure 101. Seismic profile – upper extent of the margin-parallel Base Tertiary erosional trough and<br />
underlying salt features. See Figure 4 for location.<br />
Figure 101 is immediately east of Albatross B-13<br />
and displays a minor channel in front of the bank<br />
and a mini-basin developed between the bank<br />
and a salt feature. This line crosses the mouth<br />
of the Mohican Graben which intersects the<br />
bank edge at about a 30 degree angle. In this<br />
area significant Argo salt is observed beneath<br />
the bank itself with salt movement probably<br />
coeval with the adjacent Lower Cretaceous minibasin<br />
following similar earlier antecedent motion<br />
in the earliest Jurassic.<br />
125
Tertiary Marker<br />
Base Tertiary<br />
Roseway<br />
Top Jurassic<br />
Scatarie<br />
Salt<br />
6 km<br />
Figure 102. Seismic profile – salt tectonism at the platform margin edge at the mouth of the Mohican<br />
Graben. See Figure 4 for location.<br />
Figure 102 is a strike line across the front of the<br />
Mohican Graben where the salt feature in the<br />
previous figure intersects the bank edge at an<br />
acute angle. The original bank edge should be<br />
located to the left of the salt feature but actual<br />
delineation is difficult.<br />
126
Tertiary Marker<br />
Base Tertiary<br />
Roseway<br />
Top Jurassic<br />
Scatarie<br />
Salt<br />
6 km<br />
Figure 103. Seismic profile – faulted platform margin edge and (older) underlying salt structure. See<br />
Figure 4 for location.<br />
Figure 103 is 20 km east of Albatross B-13 and<br />
profiles a down-faulted margin with erosion<br />
younger overlying erosion. The clearly visible<br />
Cretaceous sedimentary wedge pinches out<br />
against the bank from the seaward side and<br />
facilitates the bank-edge pick. Note the large<br />
salt feature (pillow?) underlying the bank margin.<br />
127
Tertiary Marker<br />
Base Tertiary<br />
Roseway<br />
Top Jurassic<br />
Scatarie<br />
Salt<br />
6 km<br />
Figure 104. Seismic profile – interpreted down-slope carbonate build-up / mound east of the Albatross B-<br />
13 well. See Figure 4 for location.<br />
Figure 104 is 30 km east of Albatross B-13<br />
presents an interesting configuration that could<br />
be a downslope carbonate mound on a<br />
previously faulted and/or eroded bank margin<br />
(Artimon Member?). The Cretaceous wedge<br />
pinch-out indicates the location of the original<br />
bank-edge. Given an earlier failure of the bank<br />
the margin carbonate system would attempt to<br />
heal itself hence the suggestion that this could<br />
be a downslope sponge mound (Eliuk and<br />
Levesque, 1989). Alternate explanations<br />
include a sediment slump or some seismic<br />
imaging artifact.<br />
128
Tertiary Marker<br />
Base Tertiary<br />
Roseway<br />
Top Jurassic<br />
Scatarie<br />
Salt<br />
6 km<br />
Figure 105. Seismic profile – unknown feature variably interpreted as an incipient fault / failure zone,<br />
healed fault or slope mound built within a margin-edge scar zone. See Figure 4 for location.<br />
Figure 105 is midway between the Albatross B-<br />
13 and Acadia K-62 wells and shows a clear<br />
image of a preserved bank edge but with a<br />
feature variably interpreted as an incipient failure<br />
zone, a previously healed failure or an Artimon-<br />
age sponge reef succession infilling the margin<br />
failure scar. Again, the basinal Cretaceous<br />
wedge pinch-out is a good indicator of the paleobank<br />
edge.<br />
129
Tertiary Marker<br />
Base Tertiary<br />
Roseway<br />
Top Jurassic<br />
Scatarie<br />
Salt<br />
6 km<br />
Figure 106. Seismic profile – preserved rimmed platform margin tagged by the Tertiary unconformity<br />
southeast of the Mohican I-100 well. See Figure 4 for location.<br />
Figure 106 goes through the Mohican I-100 well<br />
to the northwest with the bank edge 25 km<br />
southeast of the well. The preserved rimmed<br />
margin is tagged by the Tertiary unconformity<br />
but otherwise the bank margin appears well<br />
preserved with no evidence of post-depositional<br />
faulting.<br />
130
Tertiary Marker<br />
Base Tertiary<br />
Roseway<br />
Top Jurassic<br />
Scatarie<br />
Salt<br />
3 km<br />
Figure 107. Seismic profile TGS – keystone faulted platform margin due to deeper salt withdrawal, west<br />
of the Acadia K-62 well. See Figure 4 for location.<br />
Figure 107 is positioned 15 km west of the<br />
Acadia K-62 well and shows the rimmed margin<br />
with a large down-faulted block in a landward<br />
position. Deep salt evacuation to the southeast<br />
is interpreted as the cause of this feature.<br />
131
Tertiary Marker<br />
Base Tertiary<br />
Roseway<br />
Top Jurassic<br />
Scatarie<br />
Salt<br />
6 km<br />
Figure 108. Seismic profile – high relief platform margin with lowstand slope fan/apron complexes east of<br />
the Acadia K-62 well. See Figure 4 for location.<br />
Figure 108 is located 10 km east of Acadia K-62<br />
and represents a very high relief bank margin.<br />
The bank edge is well preserved but may have<br />
been slightly eroded by Tertiary unconformities.<br />
The high amplitude foreslope reflectors may<br />
represent cyclic deposition of carbonate high<br />
stand foreslope facies.<br />
132
Tertiary Marker<br />
Base Tertiary<br />
Roseway<br />
Top Jurassic<br />
Scatarie<br />
Salt<br />
6 km<br />
Figure 109. Seismic profile – example of imaging the platform margin near the eastern limit of the TGS<br />
survey’s Abenaki coverage, north of the Evangeline H-98 well. See Figure 4 for location.<br />
Figure 109 is the easternmost line in this series<br />
and lies just north of the Evangeline H-98 well.<br />
It displays a rimmed margin profile but the<br />
imaging suffers from the convergence of flatlying<br />
and dipping reflectors. Besides not being<br />
able to locate the position of the bank edge, the<br />
data quality severely limits the interpretation of<br />
internal bank edge attributes.<br />
7.3.3 Play Concepts<br />
The play concepts, in general, are the same as<br />
the Panuke Segment, i.e. reservoir along the<br />
bank edge. However, for the Acadia Segment<br />
the previous profiles indicate that there are<br />
complicating factors in faulting, erosion and salt<br />
disruption and so preservation of the bank edge<br />
reefal facies will be a significant risk factor. In<br />
areas of interpreted faulting and possible<br />
erosion of the Abenaki margin, the potential of<br />
the foreslope is enhanced but undoubtedly 3D<br />
seismic would be required to refine associated<br />
plays. The foreslope along the Acadia segment<br />
reflects a similarity to the Tamabra facies of the<br />
Golden Lane in Mexico (Figure 66).<br />
The conceptualized petroleum system event<br />
timing chart for the Acadia Segment of the<br />
Abenaki margin is illustrated (Figure 110). The<br />
potential reservoir facies are the same as per<br />
the Panuke Segment. However, the Early<br />
Eocene Montagnais impact event created a vast<br />
region of highly fractured platform interior<br />
carbonates heaved as thrust blocks forming the<br />
crater walls. ‘Regional shaking’, analogous to<br />
that observed in regions surrounding the<br />
Chicxulub crater in Mexico, may be the cause of<br />
faulting and partial detachment of adjacent<br />
portions of the Abenaki margin underlain by salt.<br />
Such deep-seated faults could have acted as<br />
conduits for diagenetic fluids to create reservoirs<br />
irrespective of original depositional facies. The<br />
broad fetch of these extensive faults and<br />
fractures along the margin would provide<br />
attractive migration pathways for possible<br />
hydrocarbons sourced from older, deeper<br />
horizons (Late Triassic-Early Jurassic) or<br />
younger sequences in the deep water foreslope<br />
(Late Jurassic – Early Cretaceous).<br />
133
EVENT TIMING CHART<br />
ACADIA Segment - Conceptualized <strong>Petroleum</strong> System<br />
200 180 160 140 120 100 80 65 60 50 40 30 20 10 0<br />
GEOLOGIC TIME<br />
TR JURASSIC<br />
MESOZOIC<br />
CRETACEOUS<br />
CENOZOIC<br />
TERTIARY<br />
QUAT.<br />
SCALE PETROLEUM<br />
L. EARLY MID. L. EARLY LATE PAL. EOCENE OLIG. MIOCENE PP<br />
SYSTEM EVENTS<br />
1 2<br />
3 4<br />
SOURCES<br />
1 2<br />
RESERVOIRS<br />
1 2 3<br />
SEALS<br />
BU<br />
1<br />
2 3<br />
4<br />
5<br />
6<br />
OVERBURDEN & EROSION<br />
1<br />
1 2<br />
3<br />
4<br />
2<br />
3<br />
3<br />
4<br />
3<br />
TRAP FORMATION<br />
PRESERVATION<br />
BU = Break-up Unconformity (~mid-late Sinemurian)<br />
SOURCES<br />
1. Early Synrift (Triassic: Carnian - Norian)<br />
2. Late Synrift (Jurassic: Hettangian - Sinemurian)<br />
3. Jurassic Verrill Canyon (Oxfordian - Kimmeridgian)<br />
4. Cretaceous Verrill Canyon (Berriasian - Valanginian)<br />
RESERVOIRS<br />
1. Scatarie / Abenaki 1 (Bajocian – Callovian)<br />
2. Baccaro / Abenaki 4, 5 & 6 (Callovian – Kimmeridigian)<br />
SEALS<br />
1. Misaine / Abenaki 2 for Scatarie / Abenaki 1<br />
2. Top Abenaki 6 for Baccaro / Abenaki 4, 5 & 6<br />
3. Lower Cretaceous Shales for Baccaro / Abenaki 4, 5 & 6<br />
Figure 110. <strong>Petroleum</strong> system events timing chart – – Acadia Segment.<br />
As seen in many of the seismic profiles,<br />
specifically on the Acadia and Shelburne<br />
Segments, these Cretaceous and Tertiary<br />
erosional events removed significant quantities<br />
of deepwater slope siliciclastic sediments.<br />
However, rarely do the resultant unconformities<br />
appear to cut down into the harder Abenaki<br />
lithologies and where the unconformities reach<br />
the Abenaki they are limited to a very narrow (1-<br />
3 km) band at the bank margin. As described by<br />
Weissenberger et al. (2000) and Wierzbicki et al.<br />
(2002), the main seal for the Abenaki 5 Baccaro<br />
reservoirs are the tight, overlying transgressive<br />
foreslope facies of the Abenaki 6. Furthermore,<br />
the Abenaki 6 is itself overlain by variably<br />
porous fluvial and shallow marine sands of the<br />
Missisauga Formation. Thus, the removal or<br />
sweeping of deepwater fine grained clastic<br />
sediments through the action of contour currents<br />
and upper slope turbidites probably resulted in<br />
modest erosion of the Abenaki 6 top seal and no<br />
breeching of potential reservoirs facies in the<br />
GENERATION GENERATION -- MIGRATION MIGRATION -ACCUMULATION<br />
-ACCUMULATION<br />
CRITICAL MOMENT(S)<br />
OVERBURDEN<br />
Several periods of significant erosion:<br />
1. Early Cretaceous (Aptian?)<br />
2. Late Paleocene<br />
3. Early Eocene (Montagnais Impact Event)<br />
4. Late Eocene<br />
5. Middle Oligocene<br />
6. Pleistocene<br />
TRAP FORMATION<br />
1. Diagenetic & Subsidence (L. Jur. – E. Cret.)<br />
2. Tectonic & Structural (L. Cret.)<br />
3. Montagnais Impact Event (50.5 ±0.76 Ma)<br />
TIMING<br />
Expulsion periods based on previously modelled<br />
deepwater succession (Kidston et al. 2002, Sites 3-5).<br />
underlying Abenaki 5. As previously discussed,<br />
the post-salt pre-BU Heracles Unit, so far only<br />
known in the Mohican Graben area, may<br />
provide an additional potential hydrocarbon<br />
source.<br />
7.4 Shelburne Segment<br />
The Shelburne Segment of the Abenaki<br />
Carbonate Bank Edge (Figure 8) traverses the<br />
remaining distance from the eastern edge of the<br />
Northeast Channel to the U.S. border. This area<br />
has been previously referred to as George’s<br />
Bank Basin but that term is misleading as the<br />
George’s Bank is a seafloor physiographic<br />
feature while the subsurface geology is part of<br />
the overall <strong>Scotia</strong>n Basin and identified in this<br />
study as the Shelburne Subbasin. This segment<br />
is the most difficult to interpret due to the lack of<br />
good seismic data though a regional synthesis<br />
was published by the Geological Survey of<br />
<strong>Canada</strong> (Wade, 1990).<br />
134
7.4.1 Well Control and Seismic Data<br />
There are no wells in the Shelburne Subbasin.<br />
An exploration moratorium declared in 1988 predated<br />
industry drilling plans and will be in effect<br />
to December 31, 2012. Similarly, there has<br />
been no new seismic data recorded since 1984.<br />
The key seismic data sets are:<br />
• Jebco, 1984<br />
• Western, 1972<br />
• GSI, 1978 Line 106 regional line from<br />
the COST G2 well to the ENE across<br />
the southern part of the Jebco data and<br />
into the deep water. The utility of this<br />
line was superceded by the Western<br />
regional line DX-1.<br />
• Digicon, 1974<br />
These datasets are limited to paper sections and<br />
for this study had to be correlated manually. A<br />
digital seismic base was prepared and once the<br />
picked values were entered, computer mapping<br />
was carried out and merged with the digital<br />
maps from the existing TGS dataset.<br />
7.4.2 Interpretation<br />
The structural interpretation shows the distinct<br />
nature of the Shelburne Segment. The<br />
Yarmouth Arch, bordering the basin to the<br />
northwest, is depicted at its shallowest from 0.5<br />
to 1.5 sec in the north to 1.5 to 2.0 sec in the<br />
south. The bank edge is not clear due to poor<br />
seismic imaging because of the channelized and<br />
slumped seafloor topography and coincidence of<br />
the bank edge with the present-day continental<br />
shelf edge. The position of the bank edge is<br />
thus highly speculative and eventually<br />
disappears in an enormous salt diapiric feature<br />
that obliterates (as visualized seismically) any<br />
remnant of the original edge. The paleo-position<br />
of the bank edge is thus dashed to link up with<br />
the defined margin on the American side of the<br />
border.<br />
Northeast of the salt zone is an area of major<br />
down-to-the-basin faulting but landward the<br />
section is generally unbroken except for several<br />
isolated salt piercements and similar listric<br />
faults. Within this structural complex were<br />
Industry’s eight to ten prospects revealed at<br />
various conference presentations in the 1980’s.<br />
Hence, the prospective area is quite limited and<br />
constrained by the above features.<br />
Stratigraphic correlations within the Shelburne<br />
Segment relied on well ties at the Mohawk B-93<br />
(<strong>Canada</strong>) and Exxon 975 (USA) wells using the<br />
long regional strike line DX-1 (Western, 1972)<br />
which intersected both wells. This became the<br />
base line from which the suite of Jebco lines<br />
was correlated. Picks were obtained from the<br />
GSC for Mohawk and the MMS for Exxon 975<br />
wells respectively. This long-distance seismic<br />
correlation has inherent shortcomings and can<br />
result in lateral reflection assumptions where<br />
continuity is affected by faults and/or facies<br />
changes. The resulting maps can best be<br />
viewed as structural form maps and greatly<br />
assist in outlining areas for assessment.<br />
There has been speculation in various papers of<br />
the existence of a Middle to Late Jurassic age<br />
deltaic complex (‘Shelburne Delta’) coeval with<br />
the Sable Delta in this region (Wade, 1990).<br />
This has been invoked indirectly based on<br />
interpretation of progradational reflection<br />
packages, a 120 degree bend in the regional<br />
strike and the presence of salt in the Northeast<br />
Channel.<br />
135
NW SE<br />
<strong>Canada</strong> Georges Bank – 1984 Jebco<br />
Top Carbonate – Jur/Cret?<br />
Paleo-Bank Edge?<br />
---- 2 km ----<br />
Figure 111. Seismic profile of a faulted sigmoidal bank margin profile. See text for details. See Figure 4<br />
for location.<br />
utilizing the well control mentioned above and<br />
Figure 111 displays a faulted sigmoidal bank from the deepwater events used in the TGS<br />
margin where the top carbonate surface is interpretation to connect the horizons in a<br />
difficult to follow and the internal reflectivity is reasonable manner.<br />
poor to absent. Seismic stratigraphic markers<br />
had to be brought in from the landward side<br />
136<br />
1.0 sec<br />
2.0 sec<br />
3.0 sec<br />
4.0 sec
NW SE<br />
Salt?<br />
<strong>Canada</strong> Georges Bank – 1984 Jebco<br />
Top Carbonate – Jur/Cret?<br />
Paleo-Bank Edge?<br />
---- 2 km ------<br />
Figure 112 Seismic profile of a faulted bank margin with salt piercement. See text for details. See<br />
Figure 4 for location.<br />
Figure 112 illustrates a faulted margin and the<br />
large listric growth faults with a piercement salt<br />
feature. The bank margin was inferred in the<br />
same manner as the previous line and the<br />
conclusion is of a faulted margin with only an<br />
approximation as to its actual location.<br />
137<br />
1.0 sec<br />
2.0 sec<br />
3.0 sec<br />
4.0 sec
NW SE<br />
Base Tertiary<br />
Top Iroquois<br />
<strong>Canada</strong> Georges Bank – 1984 Jebco<br />
Salt<br />
Top Carbonate – Jur/Cret?<br />
--------2 km ---------<br />
Figure 113. Seismic profile of an interior platform salt piercement. See text for details. See Figure 4 for<br />
location.<br />
Figure 113 is located on the platform and<br />
reveals a salt piercement feature in front of a<br />
major down-to-basin listric fault. This confirms<br />
the presence of salt within the shelf in this region<br />
with the reflection character of adjacent and<br />
overlying strata inferring early syndepositional<br />
motion. Motion of this feature appears to have<br />
started about the beginning of the Cretaceous.<br />
138<br />
1.0 sec<br />
2.0 sec<br />
3.0 sec
NW SE<br />
Top Carbonate – Jur/Cret?<br />
<strong>Canada</strong> Georges Bank – 1984 Jebco<br />
Salt<br />
Paleo-Bank Edge?<br />
---- 2 km ------<br />
Figure 114. Seismic profile of major disruption by salt tectonism along the edge of the carbonate margin.<br />
See text for details. See Figure 4 for location.<br />
Figure 114 confirms the disruption of the bank<br />
edge by a massive salt feature. This feature<br />
was initially interpreted as a buried seamount<br />
but magnetic maps and correlation with the<br />
known seamount chain indicates the feature is<br />
decidedly salt. This is not a definitive solution,<br />
but the main Argo salt province is known to<br />
pinch out in this direction towards the<br />
southeastern limit of the <strong>Scotia</strong>n Basin. The<br />
disruption of the bank removes a considerable<br />
portion of acreage from this particular play.<br />
7.4.3 Play Concepts<br />
The traditional bank edge plays are affected by<br />
significant post-depositional salt tectonism. On<br />
the Shelburne Segment, this bank edge<br />
disruption diminishes the prospective area. Until<br />
new seismic data is acquired, the bank edge<br />
cannot effectively be explored and the carbonate<br />
platforms prospectivity will be degraded by<br />
analogy to the U.S. George’s Bank Basin. The<br />
foreslope play is poorly delineated except to<br />
assume a band of some unit width, but the lower<br />
angle profile seen on seismic contributes to the<br />
risk.<br />
7.5 Comparative Summary of Bank Edge<br />
Table 10 summarizes some of the salient<br />
observations between the well known Panuke<br />
Segment and the lesser known Shelburne<br />
Segment. The Acadia Segment lies between<br />
these two end members and will benefit from the<br />
proposed TGS infill survey and any future work<br />
in the Panuke and Acadia Segments.<br />
7.6 Platform Interior<br />
Figure 8 outlines a relatively large area of the<br />
back-reef or platform interior and of the nine<br />
wells drilled all targeted structural anomalies<br />
above basement highs or salt swells but did not<br />
encounter hydrocarbons. The Smackover play<br />
onshore Gulf of Mexico is very prolific as<br />
described in Section 3.6.1, and although its key<br />
appears to be the underlying Jurassic source<br />
rock that is not present in the equivalent<br />
Abenaki, the possibility of underlying upper<br />
Triassic/lower Jurassic early synrift basins<br />
containing lacustrine source rocks cannot be<br />
ruled out in the platform setting (e.g. Mohican<br />
Graben).<br />
139<br />
1.0 sec<br />
2.0 sec<br />
3.0 sec
BETTER KNOWN-----------------------------------------------------------------------------------------LESSER KNOWN<br />
Panuke Acadia Shelburne<br />
Bank edge preserved from Tertiary<br />
erosion<br />
Bank edge variably affected by Tertiary<br />
erosion<br />
Bank edge appears not to have been<br />
preserved from erosion<br />
Mostly rimmed margin Mostly rimmed margin More ramp-like margin<br />
No overlying water-wedge to affect<br />
imaging, amplitudes<br />
4-way closures on top carbonate<br />
Overlying water-wedge Overlying water-wedge<br />
No discernible closures on regional<br />
time maps, needs 3D<br />
Poor 2D seismic, 1970s vintage<br />
Non-faulted bank edge Faulted in areas Faulted in areas<br />
Underlying salt “swells”?<br />
Mohican Graben, underlying salt<br />
features, some salt disrupts bank-edge<br />
Main salt trend intersects bank edge<br />
Regional gas/water contact Unknown Unknown<br />
Leached, fractured and dolomitized<br />
reefal limestone<br />
Dolomitized back reef oolitic facies;<br />
attribute of reef margin unknown<br />
Table 10. Comparative Summary of Abenaki Bank Edge Segments<br />
Tertiary Marker<br />
Base Tertiary<br />
Roseway<br />
Top Jurassic<br />
Scatarie<br />
Salt<br />
Basement<br />
Oneida O-25<br />
6 km<br />
Unknown<br />
Figure 115. Regional Seismic Line across Oneida O-25 exploration well. See Figure 4 for location. Box<br />
outline indicates the area zoomed on in Figure 116.<br />
140
Top Jurassic<br />
Scatarie<br />
Salt<br />
Basement<br />
Oneida O-25<br />
Figure 116. Detailed seismic profile- Oneida O-25 exploration well. See Figure 115 for location.<br />
7.6.1 Outer Platform<br />
The outer high-energy platform is a zone<br />
including the Oneida O-25 well and broadest<br />
across the platform promontory overlying the<br />
Mohican Graben. The demarcation of this zone<br />
is from the GSC <strong>Scotia</strong>n Basin Atlas (GSC,<br />
1991). All the wells in this zone were dry and<br />
abandoned.<br />
Figure 115 lies across the Oneida O-25 well<br />
whose objective was carbonate reefal porosity<br />
over a basement high. The parallel reflectors<br />
imply a post-depositional flexure or uplift in Early<br />
Cretaceous time. An enlargement of the seismic<br />
profile through the well location (Figure 116)<br />
shows the evenly distributed band of reflections<br />
with no apparent anomalous amplitudes, typical<br />
of such settings.<br />
141
A6<br />
A5<br />
A4<br />
Scat<br />
Kegeshook G-67 Marquis L-35<br />
Figure 117. Detailed seismic profile – Kegeshook G-67 exploration well. See Figure 4 for location.<br />
A 3D seismic line across the Kegeshook G-67<br />
(Figure 117) and Marquis L-35 wells reveals a<br />
structural high with no apparent amplitude<br />
anomalies. The G-47 well was positioned an a<br />
feature that was later determined to be a salt<br />
27 km<br />
ridge with motion that appears to post-date<br />
carbonate deposition. A seismic line (Figure<br />
118) across the Abenaki J-56 well shows its salt<br />
flank location on the platform.<br />
142
Salt<br />
Abenaki<br />
Figure 118. Seismic profile – Abenaki J-56 exploration well. See Figure 4 for location.<br />
Wyandot<br />
‘O’ Marker<br />
Top Jurassic<br />
Scatarie<br />
143
Tertiary Marker<br />
Base Tertiary<br />
Roseway<br />
Top Jurassic<br />
Scatarie<br />
Salt<br />
Basement<br />
1 km<br />
Mohican I-100<br />
Figure 119. Detailed seismic profile – Mohican I-100 exploration well. See Figure 4 for location.<br />
7.6.2 Inner Platform<br />
The inner, low-energy zone is an extensive area<br />
along the entire platform. All wells were dry and<br />
abandoned. A magnified seismic profile (Figure<br />
119) of the Mohican I-100 well illustrates the<br />
internal seismic response of the feature. The<br />
regional profile (Figure 120) infers pre-Abenaki<br />
salt motion and post-Abenaki faulting.<br />
144
Tertiary Marker<br />
Base Tertiary<br />
Roseway<br />
Top Jurassic<br />
Scatarie<br />
Salt<br />
Basement<br />
Moheida P-13 Glooscap C-63<br />
Figure 120. Regional seismic line across Moheida P-13 and Glooscap C-63 exploration wells. See<br />
Figure 4 for location.<br />
145
Tertiary Marker<br />
Base Tertiary<br />
Roseway<br />
Top Jurassic<br />
Scatarie<br />
Salt<br />
Basement<br />
Moheida P-13<br />
Figure 121. Detailed seismic profile – Moheida P-13 exploration well. See Figure 4 for location.<br />
A regional seismic profile across the Moheida P-<br />
13 and Glooscap C-63 well locations (Figure<br />
120) indicates two low relief structures with the<br />
former related to a fault. A seismic close-up<br />
(Figure 121) of the Moheida P-13 location shows<br />
non-eventful seismic character and a similar<br />
view (Figure 122) of the Glooscap C-63 well<br />
shows very uniform seismic character.<br />
146
Tertiary Marker<br />
Base Tertiary<br />
Roseway<br />
Top Jurassic<br />
Scatarie<br />
Salt<br />
Basement<br />
Glooscap C-63<br />
Figure 122. Detailed seismic profile – Glooscap C-63 exploration well. See Figure 4 for location.<br />
147
Como P-21<br />
Figure 123. Seismic profile – Como P-21 exploration well. See Figure 4 for location.<br />
In the Panuke Segment the Como P-21 seismic<br />
profile (Figure 123) reveals a low relief feature<br />
above a basement high. The nearby Dover A-<br />
Wyandot<br />
‘O’ Marker<br />
Top Jurassic<br />
Scatarie<br />
43 well’s seismic (Figure 124) confirms the well<br />
tested the high side of a tilted fault block.<br />
148
Dover A-43<br />
Figure 124. Seismic profile – Dover A-43 exploration well. See Figure 4 for location.<br />
7.7 Play Summary<br />
The Concept Map (Figure 8) shows, on a<br />
regional basis, the interpretation and results of<br />
this study. Elements of other maps and figures<br />
are all assembled to present a singular<br />
comprehensive map. The fairways correspond<br />
to the plays of Figure 24, i.e. interior platform,<br />
margin and foreslope. The zones of faulting,<br />
erosion and salt disruption are shown on the<br />
map. In summary, the following eight play areas<br />
with the dominant play type were defined and<br />
are listed below.<br />
Wyandot<br />
‘O’ Marker<br />
Top Jurassic<br />
Scatarie<br />
1) Panuke Segment Bank Edge<br />
Bank margin reefal facies with combined<br />
structural/stratigraphic trap similar to Deep<br />
Panuke.<br />
2) Acadia Segment Bank Edge<br />
As above, but with complications due to<br />
faulting, salt tectonism and erosion of the bank<br />
margin.<br />
3) Shelburne Segment Bank Edge<br />
Possible reefal facies but lower-angle<br />
ramp-like margin.<br />
149
4) Panuke Segment Foreslope<br />
Foreslope reef debris and/or bypass<br />
sands are combined into a single stratigraphic<br />
trap potential.<br />
5) Acadia Segment Foreslope<br />
As above but more potential for eroded<br />
reefal debris.<br />
6) Shelburne Segment Foreslope<br />
As above but less likely part of a rimmed<br />
margin profile.<br />
7) Outer Shelf<br />
High energy oolite shoals or patch reefs<br />
along promontory built out over Mohican<br />
Graben.<br />
8) Inner Shelf<br />
Low energy setting but potential for<br />
bioherms and shoals over basement highs.<br />
150
8.1 Cohasset/Panuke Oils<br />
While this report addresses the hydrocarbon<br />
potential of the Late Jurassic Abenaki<br />
Formation, the known occurrences of liquid<br />
hydrocarbons entrapped in younger sediments<br />
overlying the Abenaki merit discussion.<br />
High gravity oil (49º - 52º API) was produced at<br />
the Cohasset/Panuke/Balmoral Fields from<br />
fluvial and shallow marine sand sequences of<br />
the Early Cretaceous Logan Canyon and<br />
Missisauga Formations respectively (CNSOPB,<br />
2000a). These stacked sand reservoirs are<br />
draped over the Baccaro Member carbonate<br />
bank edge forming subtle anticlinal features.<br />
Combined ultimate production from these fields<br />
was 44.445 MMbbls (7.067 x 10 6 m 3 ) when<br />
production ceased in December 1999<br />
(CNSOPB, 2000b). A similar though minor<br />
discovery was made on the northeastern end of<br />
the Abenaki bank margin (Panuke Segment) at<br />
Penobscot L-30 well, however, the pay intervals<br />
are of modest thickness and it remains<br />
undeveloped.<br />
The Cohasset/Panuke/Balmoral oils have been<br />
typed but have yet to be matched to known<br />
source rooks in the <strong>Scotia</strong>n Basin. Analysis of<br />
the oils indicates that they are sourced from<br />
kerogen Types I and II inferring a lacustrine<br />
source (Mukhopadhyay, 1993; Mukhopadhyay<br />
et al., 1995). Such source rocks may be<br />
localized and though volumetrically small,<br />
lacustrine sediments can have high TOC values<br />
and the capacity to generate large volumes of<br />
hydrocarbons. If present in the <strong>Scotia</strong>n Basin,<br />
these sequences would be stratigraphically<br />
deeper of early Jurassic or even late Triassic<br />
age, and would have to rely upon deep-seated<br />
faults for migration into the shallower<br />
sequences.<br />
8.2 Deep Panuke Gas<br />
Hydrocarbons in the Abenaki Formation’s Deep<br />
Panuke field are dominated by a dry and lean<br />
gas composed almost entirely of methane (CH4)<br />
with very low gas liquid volumes and low levels<br />
of hydrogen sulphide (H2S) and associated<br />
gases. The following information is sourced<br />
from PanCanadian’s (EnCana) 2002 Deep<br />
Panuke Development Plan application.<br />
8. PETROLEUM SYSTEMS<br />
Gas was successfully flow-tested in four Panuke<br />
wells (PP3C, PI1B, H-08 and M-79A) over the<br />
Abenaki 5 zone (Baccaro Member) with open<br />
flow rates ranging from 51.2 – 61.1 MMcf/d.<br />
(1.450 – 1790 E 6 m 3 /d) Associated gas liquids<br />
volumes are quite low ranging from 1.2 - 3.6<br />
bbls per E 6 ft 3 . (6.9 - 20.0 m 3 per E 6 m 3 ) In all<br />
DST and MDT tests, hydrogen sulphide gas was<br />
present though in low volumes averaging 0.2%<br />
(2000 ppm) H2S and is considered abiogenic in<br />
origin. The Deep Panuke gas is normallypressured<br />
with a common pressure system and<br />
a single gas/water contact at about -3505<br />
metres subsea elevation.<br />
8.3 Source Rocks<br />
The source for the gas discovered at Deep<br />
Panuke is believed to have been generated from<br />
the shales of the Jurassic-Cretaceous Verrill<br />
Canyon Formation; the basinal equivalent facies<br />
of the Abenaki, MicMac, Missisauga and Logan<br />
Canyon Formations (PanCanadian, 2002). The<br />
Verrill Canyon is found all along the eastern<br />
basinal portion of the <strong>Scotia</strong>n Basin and East<br />
Newfoundland basin, covering a geographically<br />
large area of about 30,000 km 2 (Klemme, 1994).<br />
Thickness of the formation probably exceeds<br />
several thousand metres in the regional<br />
depocentres (Wade and MacLean, 1990).<br />
Verrill Canyon Formation sediments are known<br />
to have varying kerogen types through geologic<br />
time (Mukhopadhyay and Wade, 1993;<br />
Mukhopadhyay et al., 1995; Mukhopadhyay et<br />
al., 2003). Late Jurassic-Early Cretaceous<br />
marine sediments are considered oil- and gasprone<br />
with Types II, II-III and III kerogen types.<br />
The Middle to Late Cretaceous marine Verrill<br />
Canyon contains both terrestrial and marine<br />
sediments that are condensate- to gas-prone<br />
containing Type II-III and III kerogens.<br />
Information on the Early and Middle Jurassicage<br />
Verrill Canyon is unknown due to the lack of<br />
well penetrations and its great depth of burial.<br />
Event timing charts incorporating all known and<br />
speculative source facies have been constructed<br />
for the Abenaki formation in general (Figure 26)<br />
and two of its Segments: Panuke (Figure 93)<br />
and Acadia (Figure 109).<br />
151
1<br />
5<br />
Source Rock, Reservoir, and Migration Schemati c<br />
Abenaki Fm / Baccaro Mb: reef, shoal, and forereef (Ls, Dol)<br />
Abenaki Fm / Baccaro Mb: platform and lagoonal (Ls, Sh)<br />
Abenaki Fm / Misaine Mb: highstand, open marine (Sh)<br />
Abenaki Fm / Scatarie Mb: ramp and platform (Ls, Dol)<br />
Verrill Canyon Fm: prodelta/distal shelf/slope (Sh, Ss )<br />
Mohican Fm: fluvial-lacustrine (Ss, Sh)<br />
Iroquois Fm: ramp and peritidal (Dol, Ss)<br />
Heracles unit: fluvial-lacustrine (Ss, Sh)<br />
Argo Fm: restricted marine (Salt, Anh y, Dol)<br />
Eurydice Fm: restricted marine (Ss, Sh, Dol)<br />
Alluvial fans<br />
Basement<br />
1<br />
6<br />
1<br />
2<br />
3<br />
4<br />
5<br />
6<br />
1<br />
Break-Up Unconformity<br />
2<br />
3<br />
Forereef debris flows / turbidites<br />
Forereef detached blocks / rafts<br />
Lowstand/bypass sand turbidites<br />
Patch reefs<br />
Oolitic shoals<br />
Fluid and Hydrocarbon migration pathways<br />
Source rock facies<br />
Figure 125. Abenaki Formation petroleum systems schematic drawing. See text for details.<br />
Verrill Canyon sediments probably reached<br />
maturity for hydrocarbon generation on the basin<br />
margin slope in the Late Cretaceous and<br />
Tertiary (Mukhopadhyay, 1993; Mukhopadhyay<br />
et al., 1995). However, in those areas with<br />
thicker overburden such as the Laurentian,<br />
Sable and Shelburne Subbasins, maturation of<br />
these sediments occurred earlier in the Early to<br />
Middle Cretaceous and Late Cretaceous<br />
respectively. Those portions of the Verrill<br />
Canyon in proximity to the ancient deltas during<br />
Jurassic and Cretaceous times (e.g. Panuke and<br />
Shelburne Segments) are inferred to have<br />
slightly elevated quantities of terrestrial (gasprone)<br />
organic matter than in those areas<br />
dominated by open marine conditions. In the<br />
latter, normal open ocean conditions with good<br />
circulation patterns prevailed in the Late<br />
Jurassic and Cretaceous on the <strong>Scotia</strong>n margin<br />
(Gradstein et al., 1990). Darker shales with<br />
possible greater organic content may have<br />
formed in local settings during the Callovian-<br />
Oxfordian and Aptian-Cenomanian but have not<br />
been encountered. Organic rich source rocks<br />
reflecting deepwater anoxic conditions may have<br />
formed in localized bathymetric lows associated<br />
with salt structuring on the slope adjacent to the<br />
Abenaki Bank margin though would have<br />
matured later given the thinner overburden<br />
section (e.g., Acadia Segment).<br />
There are other potential sources for<br />
hydrocarbons in the Abenaki. As discussed in<br />
Sections 4.2 and 5.5, progradational clastic<br />
successions of the Early Jurassic Heracles Unit<br />
and Middle Jurassic Mohican Formation rapidly<br />
2<br />
4<br />
152
loaded underlying Argo salts and created salt<br />
ridges and evacuation synclines prior to<br />
deposition of the basal Abenaki Scatarie<br />
Member. Within the adjacent synclines,<br />
lacustrine facies with rich oil-prone Type I and II<br />
kerogens may have formed. While their<br />
maturation may have occurred in the Late<br />
Jurassic (Mukhopadhyay et al., 2003) (Kidston<br />
et al, 2002), given their proximity to salt bodies,<br />
potential lacustrine source rocks would have<br />
been subjected to elevated heat flows causing<br />
earlier maturation. Faults and fractures induced<br />
by later salt motion would provide pathways into<br />
overlying strata. To date, sediments within<br />
these synclines have not been drilled and the<br />
concept remains speculative, although the<br />
lacustrine affinities of the<br />
Cohasset/Panuke/Balmoral oils may offer clues<br />
supporting this source concept.<br />
The possible migration pathways are shown for<br />
various speculative source rock facies into<br />
potential Abenaki Formation carbonate facies<br />
reservoirs (Figure 125). A common denominator<br />
appears to be the presence of underlying salt.<br />
Salt motion, its drivers and resultant structural<br />
expressions would facilitate creation of<br />
pathways for the migration of diagenetic fluids<br />
and later hydrocarbons. They influenced the<br />
formation of deep basin margin-bounding downto-the-basin<br />
listric faults, fractures systems in<br />
overlying strata as a result of salt motion, and<br />
formation of structural lows containing possible<br />
lacustrine source rock facies. Such linkages<br />
may explain the interpreted lacustrine origin of<br />
the liquid hydrocarbons produced from the<br />
Cohasset/Panuke/Balmoral oil fields overlying<br />
the discovered gas at Deep Panuke.<br />
Sub-seismic or buried wrench faults and<br />
fractures normal to the bank margin could also<br />
be considered as potential pathways for fluids<br />
and hydrocarbons. The Early Jurassic plate<br />
reconstruction of Welsink et al. (1990) illustrates<br />
the left-lateral shear couple with secondary<br />
wrenching, normal faulting and folds. Such<br />
faults would have formed in response to<br />
Jurassic rifting and plate motion, and the<br />
secondary features would offer long-lived<br />
linkages to both the deepwater and platform<br />
successions.<br />
153
9.1 Historical Assessments<br />
The only previous assessment of the carbonate<br />
bank was carried out by the GSC and published<br />
in 1989 but based on well results to the end of<br />
1983. The report mentions four wildcats drilled<br />
along the bank margin without success although<br />
by 1989 three more were drilled but were all dry<br />
(Figures 4, 5). Two main play types were<br />
immediately recognized; porosity in bank edge<br />
reefal buildups and other facies-related reservoir<br />
9. RESOURCE ASSESSMENTS<br />
Low (P90) Median (P50) High (P10)<br />
Gas (Bcf) 166 1300 3774<br />
Oil (MMB) 30 321 1097<br />
OEB 58 538 1726<br />
Table 11. GSC 1989 Hydrocarbon Assessment: Carbonate Bank Play<br />
The Canadian Gas Potential Committee (CGPC)<br />
2001 Report, while acknowledging EnCana’s<br />
Deep Panuke discovery, did not have any data<br />
to run a numerical assessment. On a geological<br />
basis, they divided the Baccaro reef trend into<br />
two segments; Panuke and Acadia. The<br />
Panuke Segment was constrained to the flank of<br />
the Sable Subbasin from Penobscot L-30 to the<br />
southwest limit of the sub-basin near the<br />
Evangeline H-98 well. The play was treated as<br />
development on the platform interior.<br />
Seventeen prospects of the bank edge play<br />
were identified, four of which were drilled by the<br />
end of 1983. The GSC analysis expected an oilprone<br />
play due to the predominantly marine<br />
source rocks of the Verrill Canyon Formation.<br />
Their calculations suggested median pool sizes<br />
of 53 MMB and 210 Bcf with the overall<br />
estimates of the resource potential of the bank<br />
edge play in the table below.<br />
‘established’ based on the Deep Panuke gas<br />
discovery and assigned a recoverable gas value<br />
of 929 Bcf (PanCanadian press releases and<br />
PanCanadian Development Plan, 2002).<br />
Recent (2004, 2005) EnCana press releases<br />
have refined this value to 950 Bcf. The Acadia<br />
Segment continued from the end of the Panuke<br />
Segment southwest to the Northeast Channel<br />
and deemed to be a conceptual play and so was<br />
discussed but not assessed.<br />
154
10.1. Basin Evaluation<br />
The Upper Jurassic Abenaki Formation<br />
carbonate bank is a generally rimmed margin<br />
that extends for 650 km from Sable Island to the<br />
U.S. border. It is non-linear, faulted, eroded and,<br />
in places, disrupted by salt intrusions. For<br />
assessment purposes, it has been subdivided<br />
into three segments based on geologic criteria;<br />
Panuke, Acadia and Shelburne.<br />
The bank margin of the Panuke Segment is the<br />
best preserved, has a major gas discovery and<br />
abuts the prolific gas-prone Sable Subbasin.<br />
The 3D seismic surveys, in defining and<br />
understanding the discovery, have proven<br />
indispensable. The bank edge reservoir fairway<br />
exists as narrow as 1-3 km wide fairway and<br />
future exploration well designs should be<br />
prepared for a whipstock.<br />
The Acadia Segment has only three wells over<br />
its 400 km length and the bank margin has<br />
undergone faulting, erosion and salt disruption.<br />
Prospect generation will undoubtedly require 3D<br />
seismic surveys.<br />
The Shelburne Segment is unexplored and<br />
poorly imaged by the vintage seismic from the<br />
1970’s and 1980’s. The margin profile is less<br />
steep than the other segments and in the vicinity<br />
of the Northeast Channel a Jurassic delta may<br />
have existed. New seismic, both regional 2D<br />
and local 3D will be required for future<br />
exploration programs.<br />
The Baccaro Member belongs to a proven<br />
petroleum system with the Deep Panuke<br />
discovery. Whether its attributes can be<br />
extrapolated to the other segments remains<br />
uncertain.<br />
10. CONCLUSIONS<br />
Except for the discovery off <strong>Nova</strong> <strong>Scotia</strong>, there is<br />
only one other significant success in the Upper<br />
Jurassic carbonate platforms of the circum-North<br />
Atlantic, that being the Cap Juby heavy oil field<br />
offshore Morocco.<br />
Productive carbonate petroleum systems from<br />
the Upper Jurassic in the U.S. Gulf of Mexico<br />
(Smackover Formation), the Lower Cretaceous<br />
Pimienta-Tamabra in Mexico (Golden Lane) and<br />
the Middle Devonian Slave Point and Swan Hills<br />
of the WCSB were useful analogues for this<br />
study.<br />
The Abenaki carbonate platform has yielded one<br />
discovery to date on the bank edge at Deep<br />
Panuke. This single discovery is modest when<br />
considering that the 650 km long play fairway is<br />
virtually unexplored. Hence, although one play<br />
area is proven, the others remain conceptual.<br />
Of the remaining 20 exploration wells on the<br />
platform, there is evidence of positive indicators<br />
in mud gas readings and porosities either drilled<br />
or inferred from lost circulation while drilling.<br />
With a single significant commercial<br />
hydrocarbon discovery off <strong>Nova</strong> <strong>Scotia</strong>, a heavy<br />
oil discovery offshore Morocco and none<br />
encountered off the U.S. margins, the success<br />
factors of this play remain to be determined.<br />
The variable quantity and quality of relevant<br />
datasets inhibit a comprehensive numerical<br />
analysis of the entire platform and margin<br />
succession. Additional seismic data, well results<br />
and future discoveries are required to better<br />
understand and more accurately quantify the<br />
resource potential of the Abenaki carbonate<br />
margin and equivalent plays offshore <strong>Nova</strong><br />
<strong>Scotia</strong>, Northwest Africa and the United States.<br />
155
GLOSSARY<br />
Aggradational profile: Vertical accretion resulting in a stationary upright margin. Because carbonate<br />
accumulation rates on the platform are greater than in the basin, the relief between margin and basin will<br />
increase and gullied bypass and erosional margins may develop.<br />
BB: Billion barrels (10 9 )<br />
Bcf: Billion cubic feet (10 9 )<br />
BOE: Barrels of Oil Equivalent<br />
BOEB: Billion Oil Equivalent Barrels<br />
CGPC: Canadian Gas Potential Committee<br />
CNSOPB: <strong>Canada</strong>-<strong>Nova</strong> <strong>Scotia</strong> <strong>Offshore</strong> <strong>Petroleum</strong> <strong>Board</strong>, “the <strong>Board</strong>”.<br />
Carbonate ramp: Shallow wave-agitated facies of the nearshore zone which pass downslope, without a<br />
marked break in slope, into deeper water low energy deposits. A ramp differs from a rimmed shelf in that<br />
continuous reef trends generally are absent, high energy lime sands are located near the shoreline, and<br />
deeper water breccias (if present) generally lack clasts of shallow shelf edge facies. Ramps can be<br />
subdivided on the basis of profile into homoclinal ramps and distally steepened ramps.<br />
Conceptual play: An exploration play that does not yet have discoveries or reserves but which<br />
geological analysis indicates may exist.<br />
Discovery: The term applies to the granting by CNSOPB of a Significant Discovery License (SDL) which<br />
means oil and/or gas was tested to surface in significant quantities that have potential for future<br />
commercial development.<br />
DSDP: Deep Sea Drilling Project<br />
EMR: Energy, Mines and Resources (<strong>Canada</strong>)<br />
Escarpment profile: Shelf margin and slope to basin facies are separated by a submarine escarpment.<br />
The submarine escarpment may result from faulting, margin collapse, or rapid upbuilding of the margin<br />
compared to the basin.<br />
Established play: An exploration play that has been demonstrated to exist by the discovery of one, or<br />
more, pools. Commerciality may or may not be a factor in the definition.<br />
EUR: Estimated Ultimate Recovery equals, at any point in time, the sum of produced, proven reserves<br />
and undiscovered potential.<br />
GIP: Gas-in-place<br />
GOM: Gulf of Mexico<br />
GSC: Geological Survey of <strong>Canada</strong><br />
Isolated platform and oceanic atoll: Shallow water platform detached from continental shelf, normally<br />
with steep slopes and surrounded by deep water. Atolls develop above oceanic volcanoes, and isolated<br />
platforms develop on nonvolcanic crustal blocks.<br />
156
Lacustrine: Pertaining to, produced by, or formed in a lake or lakes.<br />
MB: Thousand barrels (10 3 )<br />
Mcf: Thousand cubic feet (10 3 )<br />
MMB: Million barrels (10 6 )<br />
MMcf: Million cubic feet (10 6 )<br />
MMS: Minerals Management Service, U.S. Department of the Interior<br />
Mya: million years ago<br />
New Field Wildcat (NFW): The first well on a prospect or geological feature that is testing a new<br />
structure or play concept. Such a feature may straddle more than one fault block. As opposed to a<br />
delineation well, step-out, development, injector, etc.<br />
NGL: natural gas liquids<br />
ODP: Ocean Drilling Project (now IODP – International <strong>Offshore</strong> Drilling Program)<br />
OGIP: Original-Gas-In-Place<br />
OIP: Oil-In-Place<br />
ONAREP: Office National de Recherches et d’ Explorations Petrolieres, Kingdom of Morocco (now<br />
ONHYM)<br />
ONHYM: Office National des Hydrocarbures et des Mines.(ex-ONAREP)<br />
OOIP: Original-Oil-In-Place<br />
Open or unrimmed platform: Shallow water platform with a nearly flat or extremely low angle slope<br />
from the shoreline to the break in slope that marks the shelf margin and steeper slope. Elevated rims are<br />
absent at the shelf margin, allowing tidal flushing and swells to extend across most of the shelf.<br />
Play: A geological formation, or structural or stratigraphic trend, which has similar lithologic, reservoir or<br />
other characteristics extending over some distance or extent.<br />
Potential: Unproven quantities of recoverable hydrocarbons that may exist.<br />
Progradational profile: Lateral and basinward accretion resulting in an offlap geometry. Two extreme<br />
cases of progradation profile configuration are recognized: (a) sigmoidal progradation in which the<br />
platform margin accretes basinward and upward, and (b) oblique progradation in which the platform<br />
margin accretes basinward, resulting in a horizontal basinward shift. Sigmoidal to oblique, sigmoidaloblique,<br />
and complex sigmoidal-oblique are examples that range between case (a) and (b). Basinwardsteeping<br />
facies shifts characterize progradational geometries.<br />
Prospect: A singular structure or geologic feature that has the necessary attributes to contain<br />
hydrocarbons and hence be a drilling target.<br />
Reserves: Quantities of oil, gas and related substances that are proven to exist in known accumulations<br />
and are believed recoverable at some point in time.<br />
157
Resources: The total quantity of oil, gas and related substances that are estimated at a particular time to<br />
be contained in, or that have been produced from, known accumulations, plus, those estimated quantities<br />
in accumulations yet to be discovered.<br />
Retrogradional profile: Landward shelf margin shift resulting in an onlap geometry and landwardsteeping<br />
facies. Two cases of onlap profile configuration are recognized: (a) gradual retreat and (b)<br />
backstepping or step-wise retreat.<br />
Rimmed carbonate platform: Shallow water platform whose outer wave-agitated edge has a<br />
semicontinuous to continuous rim or barrier along the shelf margin which restricts circulation and wave<br />
action to form a low energy lagoon. Rims may consist of barrier reefs, skeletal and ooid sands, or islands<br />
(eolianite or reefs) from an earlier depositional phase. The platform margin is market by a pronounced<br />
increase in slope, commonly a few degrees to 60° or more.<br />
Stochastic calculation: Statistical calculation using Monte Carlo (or other) sampling techniques of input<br />
variables to result in a probability output distribution.<br />
Tcf: Trillion cubic feet (10 12 )<br />
TGU: Total gas units as measured from liberated gas in the circulating drilling mud and well cuttings.<br />
USGS: United States Geological Survey<br />
158
REFERENCES<br />
Adams, P.J., 1986<br />
A depositional and diagenetic model for a carbonate ramp: Iroquois Formation (Early Jurassic), <strong>Scotia</strong>n<br />
Shelf, <strong>Canada</strong>.<br />
Unpublished MSc. Thesis, Dalhousie University, Halifax, <strong>Nova</strong> <strong>Scotia</strong>, 150p.<br />
Balkwill, H.R. and Legall, F.D., 1989<br />
Whale Basin, <strong>Offshore</strong> Newfoundland: Extension and Salt Diapirism.<br />
In: A. J. Tankard and J. R. Balkwill (Eds.), “Extensional Tectonics and Stratigraphy of the North Atlantic<br />
Margins”. American Association of <strong>Petroleum</strong> Geologists Memoir 46, pp.233-246.<br />
Barss, J.S., Bujak, J.P., Wade, J.A., and Williams, G.L., 1980<br />
Age, stratigraphy, organic matter type and color, and hydrocarbon occurrences in forty-seven wells<br />
offshore eastern <strong>Canada</strong><br />
Geological Survey of <strong>Canada</strong> Open File Report No.714, 6p.<br />
Bottomley, R.J., and York, D. 1988<br />
Age measurement of the submarine Montagnais impact crater.<br />
Geophysical Research Letters, vol.15, pp. 1409-1412.<br />
<strong>Canada</strong>-<strong>Nova</strong> <strong>Scotia</strong> <strong>Offshore</strong> <strong>Petroleum</strong> <strong>Board</strong>, 2000a<br />
Technical Summaries of <strong>Scotia</strong>n Shelf Significant and Commercial Discoveries<br />
<strong>Canada</strong>-<strong>Nova</strong> <strong>Scotia</strong> <strong>Offshore</strong> <strong>Petroleum</strong> <strong>Board</strong>, Halifax, 257p.<br />
<strong>Canada</strong>-<strong>Nova</strong> <strong>Scotia</strong> <strong>Offshore</strong> <strong>Petroleum</strong> <strong>Board</strong>, 2000b<br />
Annual Report 1999-2000<br />
<strong>Canada</strong>-<strong>Nova</strong> <strong>Scotia</strong> <strong>Offshore</strong> <strong>Petroleum</strong> <strong>Board</strong>, Halifax, 28p.<br />
Canadian Gas Potential Committee, 2001<br />
Natural Gas Potential in <strong>Canada</strong> – 2001<br />
Canadian Gas Potential Committee, Calgary, Alberta, 600p.<br />
Carswell, A.B., Koning, T., and Hibbs, D.C., 1990<br />
Structural and stratigraphic evolution of the East Georges Bank Basin, offshore <strong>Nova</strong> <strong>Scotia</strong>, <strong>Canada</strong>.<br />
Text, references and figures of paper presented at the Annual Convention of the American Association of<br />
<strong>Petroleum</strong> Geologists, San Francisco, California, 32p.<br />
Crux, J.A., and Gard, G., 2003<br />
Enhanced biostratigraphic resolution of the <strong>Scotia</strong>n Margin through the application of Cretaceous<br />
nannofossils.<br />
Abstract, Geological Society of America, Northeastern Section, 38 th Annual Meeting, Halifax, <strong>Nova</strong> <strong>Scotia</strong>,<br />
2003 Abstracts with Programs, Poster 6-11, p.12.<br />
Cummings, D.I, and Arnott, R.W.C., In press:<br />
Shelf-margin deltas: A new (but old) play type, offshore <strong>Nova</strong> <strong>Scotia</strong>, <strong>Canada</strong><br />
Bulletin of Canadian <strong>Petroleum</strong> Geology<br />
Dillon, W.P., and Popenoe, P., 1988:<br />
The Blake Plateau Basin and Caroline Trough.<br />
In: R.E. Sheridan and J.A. Grow (Eds.), The Geology of North America, Volume I-2: The Atlantic<br />
Continental Margin, Geological Society of America, pp.291-328.<br />
159
Edson, G.M., 1986<br />
Shell Wilmington Canyon 586-1 Well – Geological & Operational Summary.<br />
U.S. Department of the Interior, Minerals Management Service, Atlantic OCS Region, Office of Resource<br />
Evaluation, OCS Report MMS 87-0074, 49p.<br />
Edson, G.M., 1987<br />
Shell Wilmington Canyon 587-1 Well – Geological & Operational Summary.<br />
U.S. Department of the Interior, Minerals Management Service, Atlantic OCS Region, Office of Resource<br />
Evaluation, OCS Report MMS 87-0074, 49p.<br />
Edson, G.M., 1988<br />
Shell Wilmington Canyon 372-1 Well – Geological & Operational Summary.<br />
U.S. Department of the Interior, Minerals Management Service, Atlantic OCS Region, Office of Resource<br />
Evaluation, OCS Report MMS 87-0118, 49p.<br />
Edson, G.M., Olson, D.L., and Petty, A.J., 2000a<br />
Georges Bank <strong>Petroleum</strong> Exploration.<br />
In: Atlantic Outer Continental Shelf – Georges Bank: Compilation of Continental <strong>Offshore</strong> Stratigraphic<br />
Test (COST) and Industry exploration drilling, 1976-1982.<br />
U.S. Department of the Interior, Minerals Management Service, Gulf of Mexico OCS Region, Office of<br />
Resource Evaluation, OCS Report MMS 2000-031, 20p.<br />
Edson, G.M., Olson, D.L., and Petty, A.J., 2000b<br />
Shell Lydonia Canyon Block 410 No.1 Well: Geological and Operational Summary.<br />
In: Atlantic Outer Continental Shelf – Georges Bank: Compilation of Continental <strong>Offshore</strong> Stratigraphic<br />
Test (COST) and Industry exploration drilling, 1976-1982.<br />
U.S. Department of the Interior, Minerals Management Service, Gulf of Mexico OCS Region, Office of<br />
Resource Evaluation, OCS Report MMS 2000-031, 20p.<br />
Eliuk, L.S., 1978<br />
The Abenaki Formation, <strong>Nova</strong> <strong>Scotia</strong> Shelf, <strong>Canada</strong> - A depostional and diagenetic model for a Mesozoic<br />
carbonate platform.<br />
Bulletin of Canadian <strong>Petroleum</strong> Geology, vol.26, no.4, pp.424-514.<br />
Eliuk, L.S., 2003<br />
Bioerosion in t he Upper Jurassic Abenaki Margin: A Preliminary Survey.<br />
Conventional Core Workshop, Geological Society of America (Northeastern Section) and Atlantic<br />
Geoscience Society Joint Annual Conference, Halifax, <strong>Nova</strong> <strong>Scotia</strong>, <strong>Canada</strong>, March 27-29, 2003, pp.33-<br />
39.<br />
Eliuk, L.S., and Levesque, R., 1989<br />
Earliest Cretaceous Sponge Reef Mounds, <strong>Nova</strong> <strong>Scotia</strong> Shelf (Shell Demascota G-32).<br />
In: H.H.J. Geldsetzer, N.P. James and G.E. Tebbutt (Eds.), Reefs: <strong>Canada</strong> and Adjacent Area, Canadian<br />
Society of <strong>Petroleum</strong> Geologists, Memoir 13, pp.713-720.<br />
Ellis, P.M., Crevello, P.D., and Eliuk, L.S., 1985<br />
Upper Jurassic and Lower Cretaceous deep-water buildups, Abenaki Formation, <strong>Nova</strong> <strong>Scotia</strong>n Shelf.<br />
In: P.D. Crevello and P.M. Harris (Eds.), Deep-water Carbonates, Society of Economic Paleontologists<br />
and Mineralogists, Special Publication 25 (Core Workshop No. 6), pp.212-248.<br />
Enos, P., 1974<br />
Map of Surface Sediment Facies of the Florida-Bahamas Plateau.<br />
Geological Society of America, Map Series MC-5, No.4.<br />
160
Erlich, R.N., Longo, A.P., and Hyare, S., 1993<br />
Response of Carbonate Platform Margins to Drowning: Evidence of Environmental Collapse.<br />
In: R.G. Loucks and J.F. Sarg (Eds.), Carbonate Sequence Stratigraphy – Recent Developments and<br />
Applications, American Association of <strong>Petroleum</strong> Geologists Memoir 57, pp.241-266.<br />
Fails, T.G., 1990<br />
The Northern Gulf Coast Basin: a classic petroleum province.<br />
In: Brooks, J. (Ed.), Classic <strong>Petroleum</strong> Provinces, Geological Society Special Publication No.50, pp 221-<br />
248.<br />
Francisco, V.O. and Castillo-Tejero, C., 1970<br />
Golden Lane Fields, Veracruz, Mexico.<br />
In: Michel T. Halbouty (ed.), Geology of Giant <strong>Petroleum</strong> Fields, American Association of <strong>Petroleum</strong><br />
Geologists Memoir 14, pp.309-325.<br />
Galicia, J.G., 2001<br />
The offshore Golden Lane: New outline of opportunities from integration of geologic and geophysical<br />
data.<br />
The Leading Edge, Society of Exploration Geophysicists, June 2001, vol.20, no.7, pp.263-264, 282.<br />
Geological Survey of <strong>Canada</strong> (GSC), 1991<br />
East Coast Basin Atlas Series: <strong>Scotia</strong>n Shelf.<br />
Atlantic Geoscience Centre, Geological Survey of <strong>Canada</strong>, Ottawa, 152p.<br />
Given, M.M., 1977<br />
Mesozoic and early Cenozoic geology of <strong>Offshore</strong> <strong>Nova</strong> <strong>Scotia</strong>.<br />
Bulletin of Canadian <strong>Petroleum</strong> Geology, vol.25, no.1, pp.63-91.<br />
Goldhammer, R.K., and Johnson, C.A., 2001<br />
Middle Jurassic-Upper Cretaceous Paleogeographic Evolution and Sequence-Stratigraphic Framework of<br />
the Northwest Gulf of Mexico Rim.<br />
In: C. Bartolini, R.T. Buffler and A. Cantú-Chapa (Eds.), The Western Gulf of Mexico Basin – Tectonics,<br />
Sedimentary Basins and <strong>Petroleum</strong> Systems, American Association of <strong>Petroleum</strong> Geologists Memoir 75,<br />
pp.45-81.<br />
Gradstein, F.M., Jansa, L.F., Srivastava, S.P., Williamson, M.A., Bonham-Carter and Stam, B., 1990<br />
Chapter 8 - Aspects of North American paleo-oceanography.<br />
In: M.J. Keen and G.L. Williams (Eds.), Geology of the continental margin of eastern <strong>Canada</strong>, Geological<br />
Survey of <strong>Canada</strong>, Geology of <strong>Canada</strong> no.2, p.190-238 (Also Geological Society of America, The<br />
Geology of North America, vol.I-1).<br />
Grammer, G.M., Ginsburg, R.N., and Harris, P.M., 1993<br />
Timing of Deposition, Diagenesis and Failure of Steep Carbonate Slopes in Response to a High-<br />
Amplitude/High Frequency Fluctuation of Sea Level, Tongue of the Ocean, Bahamas.<br />
In: R.G. Loucks and J.R. Sarg (Eds.), Carbonate Sequence Stratigraphy – Recent Developments and<br />
Applications, American Association of <strong>Petroleum</strong> Geologists Memoir 57, pp.107-131.<br />
Grow, J.A., Klitgord, K.D., and Schlee, J.S., 1988<br />
Structure and evolution of Baltimore Canyon Trough.<br />
In: R.E. Sheridan and J.A. Grow (Eds.), The Geology of North America, Volume I-2: The Atlantic<br />
Continental Margin, Geological Society of America, p.269-290.<br />
Grow, J.A., Klitgord, K.D., Schlee, J.S., and Dillon, W.P., 1988<br />
Representative Seismic Profiles of U.S. Atlantic Continental Margin.<br />
In: R.E. Sheridan and J.A. Grow (Eds.), The Geology of North America, Volume I-2: The Atlantic<br />
Continental Margin, Geological Society of America, Plate 4 (in separate slipcase).<br />
161
Harvey, P.J., 1993<br />
Porosity identification using amplitude variations with offset in Jurassic carbonate, offshore <strong>Nova</strong> <strong>Scotia</strong>.<br />
The Leading Edge, Society of Exploration Geophysicists, March 1993, vol.12, no.3, pp.180-184.<br />
Harvey, P.J., and MacDonald, D.J., 1990<br />
Seismic Modeling of Porosity within the Jurassic Aged Carbonate Bank, <strong>Offshore</strong> <strong>Nova</strong> <strong>Scotia</strong>.<br />
Canadian Journal of Exploration Geophysicists, vol.26, nos.1&2, pp.54-71.<br />
Harland, N., and Wierzbicki, R., 2003<br />
Deep Panuke and Demascota carbonate cores from the Jurassic Abenaki Formation, <strong>Nova</strong> <strong>Scotia</strong>,<br />
<strong>Canada</strong>.<br />
Conventional Core Workshop, Geological Society of America (Northeastern Section) and Atlantic<br />
Geoscience Society Joint Annual Conference, Halifax, <strong>Nova</strong> <strong>Scotia</strong>, <strong>Canada</strong>, March 27-29, 2003, pp.7-<br />
31.<br />
Haq, B.U., Hardenbol, J. and Vail, P.R., 1987<br />
Chronology of Fluctuating Sea Levels Since the Triassic.<br />
Science, Vol.235, p.1156-1167.<br />
Jansa, L.F., 1981<br />
Mesozoic carbonate platforms and banks off the eastern North American margin.<br />
Marine Geology, vol.44, pp.97-117.<br />
Jansa, L.F., 1986<br />
Paleogeography and evolution of the North Atlantic ocean basin during the Jurassic.<br />
In: P.R. Vogt and B.E. Tucholke (Eds.), The Geology of North America – Volume M: The Western North<br />
Atlantic Region, Geological Society of America, pp.603-616.<br />
Jansa, L.F., 1993<br />
Early Cretaceous Carbonate Platforms of the Northeastern North American Margin<br />
In: J.A.T. Simo, R.W. Scott and J.-P. Masse (Eds.), Cretaceous Carbonate Platforms, American<br />
Association of <strong>Petroleum</strong> Geologists Memoir 56, pp.111-126.<br />
Jansa, L.F., and Lake, P.B., 1991<br />
Lithostratigraphy 9: lithofacies and depositional environment – Scatarie and Baccaro members.<br />
In: East Coast Basin Atlas Series: <strong>Scotia</strong>n Shelf, Geological Survey of <strong>Canada</strong>, Atlantic Geoscience<br />
Centre, p.67.<br />
Jansa, L.F., and Wade, J.A., 1975<br />
Geology of the continental margin off <strong>Nova</strong> <strong>Scotia</strong> and Newfoundland<br />
In: W.J.M. Van Der Linden and J.A. Wade, (Eds.), <strong>Offshore</strong> Geology of Eastern <strong>Canada</strong>, Geological<br />
Survey of <strong>Canada</strong> Paper 74-30, vol.2, pp.51-105.<br />
Jansa, L.F., and Wade, J.A., 1975<br />
Paleogeography and sedimentation in the Mesozoic and Cenozoic, southeastern <strong>Canada</strong>.<br />
In: C.J. Yorath, E.R. Parker and D.J. Glass (Eds.), <strong>Canada</strong>’s <strong>Offshore</strong> Margins and <strong>Petroleum</strong><br />
Exploration, Canadian Society of <strong>Petroleum</strong> Geologists, Memoir 4, pp.79-102.<br />
Jansa, L.F. Pe-Piper, G., Robertson, P.B. and Freidenreich, O. 1989<br />
Montagnais: A submarine impact structure on the <strong>Scotia</strong>n shelf, eastern <strong>Canada</strong>.<br />
Geological Society of America Bulletin, vol.101, pp.450-463.<br />
162
Jansa, L.F., and Weidmann, J., 1982<br />
Mesozoic-Cenozoic development of the eastern North American and northwest African continental<br />
margins; A comparison.<br />
In: U.K von Rad, M. Sarathein, and M. Seibold (Eds.), Geology of the Northwest African Continental<br />
Margin, Springer-Verlag, Berlin, p.215-269.<br />
Jansa, L.F., Pratt, B.R., and Droumart, G., 1989<br />
Deep Water Thrombolite Mounds from the Upper Jurassic of <strong>Offshore</strong> <strong>Nova</strong> <strong>Scotia</strong><br />
In: H.H.J. Geldsetzer, N.P. James and G.E. Tebbutt (Eds.), Reefs – <strong>Canada</strong> and Adjacent Areas,<br />
Canadian Society of <strong>Petroleum</strong> Geologists Memoir 13, pp.725-735.<br />
Jardine, D., Andrews, D.P., Wishart, J.W., and Young, J.W., 1977<br />
Distribution and Continuity of Carbonate Reservoirs<br />
Journal of <strong>Petroleum</strong> Technology, July, vol.29, np.4, pp. 873-885<br />
Keen, C.E., MacLean, B.C. & Kay, W.A., 1991<br />
A deep seismic reflection profile across the <strong>Nova</strong> <strong>Scotia</strong> continental margin, offshore eastern <strong>Canada</strong>.<br />
Canadian Journal of Earth Sciences, vol.28, no.7, pp.1112-1120.<br />
Kidston, A.G., Brown, D.E., Altheim, B., and Smith, B.M., 2002<br />
Hydrocarbon Potential of the Deepwater <strong>Scotia</strong>n Slope.<br />
<strong>Canada</strong>-<strong>Nova</strong> <strong>Scotia</strong> <strong>Offshore</strong> <strong>Petroleum</strong> <strong>Board</strong>, Halifax, CD-ROM, 111p.<br />
(Also: http://www.cnsopb.ns.ca/Whatsnew/Hydrocarbon_Potential_<strong>Scotia</strong>n_Slope.pdf )<br />
Klemme, H.D., 1994<br />
<strong>Petroleum</strong> Systems of the World Involving Upper Jurassic Source Rocks.<br />
In: L.B. Magoon, and W.G. Dow (Eds.), The <strong>Petroleum</strong> System – From Source to Trap. American<br />
Association of <strong>Petroleum</strong> Geologists Memoir 60, pp.51-72.<br />
Leinfelder, R.R., 1993<br />
Distribution of Jurassic reef types: A mirror of structural and environmental changes during the breakup<br />
of Pangaea<br />
In: A.F. Embry, B. Beauchamp and D.J. Glass, (Eds.), Pangaea: Global Environments and Resources.<br />
Canadian Society of <strong>Petroleum</strong> Geologists Memoir 17, Calgary, pp.677-700.<br />
Leinfelder, R.R., 2001<br />
Jurassic Reef Ecosystems.<br />
In: G.D. Stanley, Jr., (Ed.), The History and Sedimentology of Ancient Reef Systems, Kluwer Academic /<br />
Plenum Publishers, New York, pp.251-309.<br />
Leinfelder, R.R., Schmid, D.U., Nose, M., and Werner, W., 2002<br />
Jurassic Reef Patterns: The Expression of a Changing Globe.<br />
In: W. Kiessling, E. Flügel, and J. Golonka (Eds.), Phanerozoic Reef Patterns. Society of Economic<br />
Paleontologists and Mineralogists Special Publication No.72, pp.465-520.<br />
Lore, G.L., Marin, D.A., Batchelder, E.C., Courtwright, W.C., Desselles, Jr., R.P., and Klazynski, R.J.,<br />
2001<br />
2000 Assessment of Conventionally Recoverable Hydrocarbon Resources of the Gulf of Mexico and<br />
Atlantic Outer Continental Shelf as of January 1, 1999.<br />
OCS Report MMS 2001-087, United States Department of the Interior, Minerals Management Service,<br />
Gulf of Mexico OCS Region, Office of Resource Assessment, CD-ROM.<br />
163
MacLean, B.C., and Wade, J.A., 1993<br />
Seismic Markers and Stratigraphic Picks in the <strong>Scotia</strong>n Basin Wells.<br />
East Coast Basin Atlas Series, Geological Survey of <strong>Canada</strong>, 276p.<br />
Magoon, L.B., and Schmoker, 2000<br />
The total petroleum system – The natural fluid network that constrains the assessment unit.<br />
In: U.S. Geological Survey World <strong>Petroleum</strong> Assessment 2000 – Description and Results<br />
United States Department of the Interior, U.S. Geological Survey, USGS Digital data Series DDS-60,<br />
Multi Disc Set, Version 1.0, 2 CD-ROM set.<br />
Magoon, L.B., Hudson, T.L., and Cook, H.E., 2001<br />
Pimienta-Tamabra(!) – A Giant Supercharged <strong>Petroleum</strong> System in the Southern Gulf of Mexico, Onshore<br />
and <strong>Offshore</strong> Mexico.<br />
In: C. Bartolini, R.T. Buffler and A. Cantú-Chapa (Eds.), The Western Gulf of Mexico Basin – Tectonics,<br />
Sedimentary Basins and <strong>Petroleum</strong> Systems, American Association of <strong>Petroleum</strong> Geologists Memoir 75,<br />
pp.83-125.<br />
Mancini, E.A., 2002<br />
Integrated Geologic-Engineering Model for Reef and Carbonate Shoal Reservoirs Associated with<br />
Paleohighs: Upper Jurassic Smackover Formation, Northeastern Gulf of Mexico – Technical Progress<br />
Report for Year 2.<br />
Department of Geological Sciences, University of Alabama, 233p. (Website:<br />
http://egrpttc.geo.ua.edu/reports/geo_eng_model2/title.html)<br />
Mattick, R.E., 1981<br />
U.S. Atlantic Continental Margin, 1976-81.<br />
Oil & Gas Journal, Nov. 9, 1981, pp.357-368.<br />
Mattick, R.E., and Libby-French, J., 1988<br />
<strong>Petroleum</strong> geology of the United States Atlantic continental margin.<br />
In: R.E. Sheridan and J.A. Grow (Eds.), The Geology of North America, Volume I-2: The Atlantic<br />
Continental Margin, Geological Society of America, pp.445-462.<br />
McIver, N.L., 1972<br />
Cenozoic and Mesozoic Stratigraphy of the <strong>Nova</strong> <strong>Scotia</strong> Shelf.<br />
Canadian Journal of Earth Sciences, vol.9, pp.54-70 (1972).<br />
Moore, C.H., 1984<br />
The Upper Smackover of the Gulf Rim: Depositional Systems, Diagenesis, Porosity Evolution and<br />
Hydrocarbon Production.<br />
Proceedings, Third Annual Reservoir Conference, Gulf Coast Section-Society of Economic<br />
Palaeontologists and Mineralologists, pp.283-307.<br />
Moore, C.H., 2001<br />
Carbonate Reservoirs: Porosity Evolution and Diagenesis in a Sequence Stratigraphic Framework.<br />
Developments in Sedimentology 55, Elsevier, Amsterdam, 444p. (includes CD-ROM of figures and<br />
captions).<br />
Moore, C.H., and Heydari, E., 1993<br />
Burial diagenesis and hydrocarbon migration in platform limestones; a conceptual model based on the<br />
Upper Jurassic of the Gulf Coast of the USA.<br />
In: A.D. Horbury and A. Robinson (Eds.), Diagenesis and basin development. American Association of<br />
<strong>Petroleum</strong> Geologists Studies in Geology, 36, p.213-229.<br />
164
Mukhopadhyay, P.K. 1993<br />
Analyses and interpretation of geochemical and source rock data from <strong>Scotia</strong>n Shelf wells. Geological<br />
Survey of <strong>Canada</strong> Open File Report No.2804.<br />
Mukhopadhyay, P.K., Wade, J.A. and Kruge M.A. 1995<br />
Organic facies and maturation of Jurassic/Cretaceous rocks, possible oil-source rock correlation based on<br />
pyrolysis of asphaltenes, <strong>Scotia</strong>n Basin, <strong>Canada</strong>.<br />
Organic Geochemistry, vol.22, no.1, pp.85-104.<br />
Mukhopadhyay (Muki), P.K., Bowman, T.D., Faber, J., Brown, D.E., Kidston, A.C., and Harvey, P.J., 2003<br />
<strong>Petroleum</strong> Systems of Deepwater <strong>Scotia</strong>n Basin: Challenges for Finding Oil versus Gas Provinces.<br />
<strong>Offshore</strong> Technology Conference, Houston, Texas, Paper OTC 15304, 11p.<br />
ONAREP, 2000a<br />
Rabat-Safi Atlatic <strong>Offshore</strong> Licensing Round – Presentations to the Oil Industry, London 23 rd October 200<br />
& Houston 26 th October 2000<br />
Kingdom of Morocco, Office National des Recherches et d’Exploitations Petrolieres (ONAREP), IHS<br />
Energy Group, CD-ROM<br />
ONAREP, 2000b<br />
Hydrocarbon Exploration Opportunities in Morocco - 2000 Edition<br />
Kingdom of Morocco, Office National des Recherches et d’Exploitations Petrolieres (ONAREP), CD-ROM<br />
Palmer, A.R. and Geissman, J., 1999<br />
1999 Geologic Time Scale.<br />
Geological Society of America Website: http://www.geosociety.org/science/timescale/timescl.htm<br />
PanCanadian Energy Corporation (EnCana), 2002<br />
Deep Panuke <strong>Offshore</strong> Gas Development<br />
Development Plan - Volume 2, 145p.<br />
Poag, C.W., 1982<br />
Stratigraphic Reference Section for Georges Bank Basin-Depositional Model for New England Passive<br />
Margin<br />
American Association of <strong>Petroleum</strong> Geologists Bulletin, vol.66, no.8 (August 1982), pp.1021-1041.<br />
Poag, C.W., and Valentine, P.C., 1988<br />
Mesozoic and Cenozoic Stratigraphy of the United States Atlantic continental shelf and slope.<br />
In: R.E. Sheridan and J.A. Grow (eds.), The Geology of North America, Volume I-2, The Atlantic<br />
Continental Margin, U.S., Geological Society of America, pp.67-85 and Plate 3 (in separate slipcase).<br />
Prather, B.E., 1991<br />
<strong>Petroleum</strong> Geology of the Upper Jurassic and Lower Cretaceous, Baltimore Canyon Trough, Western<br />
Atlantic Ocean.<br />
American Association of <strong>Petroleum</strong> Geologists Bulletin, vol.75, no.2, pp.258-277.<br />
Pratt, B.R. and Jansa, L.F. 1989<br />
Late Jurassic Shallow Water Reefs of <strong>Offshore</strong> <strong>Nova</strong> <strong>Scotia</strong>.<br />
In: H.H.J. Geldsetzer, N.P. James and G.E. Tebbutt (Eds.), Reefs: <strong>Canada</strong> and Adjacent Areas,<br />
Canadian Society of <strong>Petroleum</strong> Geologists, Memoir 13, pp.741-747.<br />
Read, J.F., 1985<br />
Carbonate Platform Facies Models.<br />
American Association of <strong>Petroleum</strong> Geologists Bulletin, vol. 69, no.1 (January 1985), pp.1-21.<br />
165
Ryan, W.B.F. and Miller, E.L., 1981<br />
Evidence of a Carbonate Platform Beneath George’s Bank.<br />
Marine Geology, vol. 44, issues 1 & 2, pp. 213-228.<br />
Saller, A.H., DicksonJ.A.D., and F. Matsuda, F., 1999<br />
Evolution and Distribution of Porosity Associated with Subaerial Exposure in Upper Paleozoic Platform<br />
Limestones, West Texas.<br />
American Association of <strong>Petroleum</strong> Geologists Bulletin, vol. 83, no. 11 (November 1999), pp.1835-1854.<br />
Schlee, J.S., and Klitgord, K.M., 1988<br />
Georges Bank Basin – A regional synthesis.<br />
In: R.E. Sheridan and J.A. Grow (Eds.), The Geology of North America, Volume I-2: The Atlantic<br />
Continental Margin, Geological Society of America, pp.243-268.<br />
Schlee, J.S., Manspeizer, W., and Riggs, S.R., 1988<br />
Paleoenvironments – <strong>Offshore</strong> Atlantic U.S. margin.<br />
In: R.E. Sheridan and J.A. Grow (Eds.), The Geology of North America, Volume I-2: The Atlantic<br />
Continental Margin, Geological Society of America, pp.365-385.<br />
Sherwin, D.F., 1973<br />
<strong>Scotia</strong>n Shelf and Grand Banks.<br />
In: R.G. McCrossan (Ed.), Future <strong>Petroleum</strong> Provinces of <strong>Canada</strong>, Canadian Society of <strong>Petroleum</strong><br />
Geologists Memoir 1, pp.519-559.<br />
Simo, J.A.T., Scott, R.W., and Masse, J.-P., 1993<br />
Cretaceous Carbonate Platforms: An Overview.<br />
In: J.A.T. Simo, R.W. Scott and J.-P. Masse (Eds.), Cretaceous Carbonate Platforms, American<br />
Association of <strong>Petroleum</strong> Geologists Memoir 56, pp.1-14.<br />
Swift, S.A., 1987<br />
Late Cretaceous-Cenozoic Development of Outer Continental Margin, Southwestern <strong>Nova</strong> <strong>Scotia</strong>.<br />
American Association of <strong>Petroleum</strong> Geologists Bulletin, vol.71, no.6 (June 1987), pp.678-701.<br />
Swift, B.A., D.S. Sawyer, J.A. Grow and K.D. Klitgord, 1987<br />
Subsidence, Crustal Structure and Thermal Evolution of Georges Bank Basin.<br />
American Association of <strong>Petroleum</strong> Geologists Bulletin, vol.71, no.6 (June 1987), pp.702-718.<br />
Switzer, S.B., W.G. Holland, W.G., Christie, D.S., Graf, G.C., Hedinger, A.S., McAuley, R.J., Wierzbicki,<br />
R.A., and Packard, J.J., 1994<br />
Chapter 12: Devonian Woodbend - Winterburn Strata of the Western <strong>Canada</strong> Sedimentary Basin<br />
In: G.D. Mossop and I. Shetsen, I (Comp.), Geological Atlas of the Western <strong>Canada</strong> Sedimentary Basin<br />
Canadian Society of <strong>Petroleum</strong> Geologists and Alberta Research Council, Calgary, Alberta<br />
(Also: http://www.ags.gov.ab.ca/publications/ATLAS_WWW/ATLAS.shtml)<br />
Texaco <strong>Canada</strong> <strong>Petroleum</strong>, 1993<br />
<strong>Canada</strong> Georges Bank Asset Appraisal Study<br />
Confidential Report, 54p.<br />
Tucker, M.E. and Wright, V.P., 1990.<br />
Carbonate Sedimentology.<br />
Blackwell Science Publications, Oxford, 482p.<br />
United States Geological Survey, 2000<br />
U.S. Geological Survey World <strong>Petroleum</strong> Assessment 2000 – Description and Results<br />
United States Department of the Interior, U.S. Geological Survey, USGS Digital data Series DDS-60,<br />
Multi Disc Set, Version 1.0, 2 CD-ROM set.<br />
166
Wade, J.A. (with contributions by Brown, D.E., Durling, P., MacLean, B.C. and Marillier, F.), 2000<br />
Depth to Pre-Mesozoic and Pre-Carboniferous Basements.<br />
Geological Survey of <strong>Canada</strong> Open File Report No.3842 (1:1,250,000 Map of <strong>Scotia</strong>n Shelf & Adjacent Areas).<br />
Wade, J. A., 1990<br />
Chapter 4 - The geology of the southeastern margin of <strong>Canada</strong>, Part 1: The stratigraphy of Georges Bank<br />
Basin and relationships to the <strong>Scotia</strong>n Basin.<br />
In: M.J. Keen and G.L. Williams (Eds.), Geology of the continental margin of eastern <strong>Canada</strong>, Geological<br />
Survey of <strong>Canada</strong>, Geology of <strong>Canada</strong> No.2, pp.167-190. (Also Geological Society of America, The<br />
Geology of North America, Vol. I-1).<br />
Wade, J.A. and MacLean, B.C., 1990<br />
Chapter 5 - The geology of the southeastern margin of <strong>Canada</strong>, Part 2: Aspects of the geology of the<br />
<strong>Scotia</strong>n Basin from recent seismic and well data.<br />
In: M. J. Keen and G.L. Williams (Eds.), Geology of the continental margin of eastern <strong>Canada</strong>, Geological<br />
Survey of <strong>Canada</strong>, Geology of <strong>Canada</strong> No.2, pp.190-238 (Also Geological Society of America, The<br />
Geology of North America, Vol.I-1).<br />
Wade, J.A., MacLean, B.C. and Williams, G.L.; 1995<br />
Mesozoic and Cenozoic stratigraphy, eastern <strong>Scotia</strong>n Shelf: new interpretations.<br />
Canadian Journal of Earth Sciences, Vol.32, No.9, pp.1462-1473.<br />
Wade, J.A., Brown, D.E., Fensome, R.A. and Traverse, A., 1996<br />
The Triassic-Jurassic Fundy Basin, Eastern <strong>Canada</strong>: regional setting, stratigraphy and hydrocarbon<br />
potential.<br />
Atlantic Geology, vol.32, no.3, p.189-231.<br />
Wierzbicki, R., Harland, N, and Eliuk, L., 2002<br />
Deep Panuke and Demascota core from the Jurassic Abenaki Formation, <strong>Nova</strong> <strong>Scotia</strong>: Facies Model,<br />
Deep Panuke, Abenaki Formation<br />
In: Diamond Jubilee Convention, Canadian Society of <strong>Petroleum</strong> Geologists Annual Convention, Calgary,<br />
Alberta, Conference CD-ROM disc: Abstracts of Technical Talks, Posters and Coder Displays, Paper<br />
No.12345678, 31 pages with figures.<br />
Weissenberger, J., Harland, N., Hogg, J., and Sylonyk, G., 2000<br />
Sequence stratigraphy of Mesozoic Carbonates, <strong>Scotia</strong>n Shelf, <strong>Canada</strong>.<br />
In: Geo<strong>Canada</strong> 2000 – The Millenium Geoscience Summit, Joint Convention of the CSPG, CSEG, GAC,<br />
MAC, CGU & CWLS, Conference CD-ROM disk, Paper No.1262 (5 pages, 4 figures).<br />
Welsink, H.J., Dwyer, J.D., and Knight, R.J., 1990<br />
Tectono-Stratigraphy of Passive Margin Off <strong>Nova</strong> <strong>Scotia</strong>.<br />
In: A. J. Tankard and J. R. Balkwill (Eds.), Extensional Tectonics and Stratigraphy of the North Atlantic<br />
Margins, American Association of <strong>Petroleum</strong> Geologists, Memoir 46, pp.215-231.<br />
Wierzbicki, R, Harland, N. and Eliuk, L, 2002<br />
Deep Panuke and Demascota core from the Jurassic Abenaki Formation, <strong>Nova</strong> <strong>Scotia</strong> – Facies Model,<br />
Deep Panuke, Abenaki Formation.<br />
Canadian Society of <strong>Petroleum</strong> Geologist Diamond Jubilee Convention, CD-ROM of Abstracts, Technical<br />
Talks, Posters & Core Displays, Paper No.12345678, 31p.<br />
Williams, G.L., Fyffe, L. R., Wardle, R. J., Colman-Sadd, S.P., and Boehner, R. C., 1985<br />
Lexicon of Canadian Stratigraphy Volume VI - Atlantic Region.<br />
Canadian Society of <strong>Petroleum</strong> Geologists, 572p.<br />
167
Wilson, J.L., 1975<br />
Carbonate Facies in Geologic History<br />
Springer-Verlag, Heidelberg, 471p.<br />
Winkler, C.D., and R.T. Buffler, 1988<br />
Paleogeographic evolution of early deep-water Gulf of Mexico and margins, Jurassic to middle<br />
Cretaceous (Cenomanian)<br />
American Association of <strong>Petroleum</strong> Geologists Bulletin, vol.72, pp.318-346.<br />
Withjack, M.O., Olsen.P.E., and Schlische, R.W., 1995<br />
Tectonic evolution of the Fundy rift basin, <strong>Canada</strong>: evidence of extension and shortening during passive<br />
margin development.<br />
Tectonics, vol.14, pp.390-405.<br />
Withjack, M.O., Schlische, R.W., and Olsen, P.E., 1998<br />
Diachronous rifting, drifting and inversion on the passive margin of Central Eastern North America: an<br />
analog for other passive margins.<br />
American Association of <strong>Petroleum</strong> Geologists Bulletin, vol.82, no.5A, pp.817-835.<br />
168