The Keynesian Cross
The Keynesian Cross
The Keynesian Cross

Create successful ePaper yourself
Turn your PDF publications into a flip-book with our unique Google optimized e-Paper software.
<strong>The</strong> <strong>Keynesian</strong> <strong>Cross</strong> 4<br />
total income; and (2) “propensity to consume” refers to how much you tend to spend on consumer<br />
goods and services out of your additional income.<br />
Marginal Propensity to Save<br />
<strong>The</strong> flip side of the marginal propensity to consume is the marginal propensity to save (MPS),<br />
which is the proportion of an addition to your income that you would save or not spend on goods<br />
and services today. That is, MPS is equal to the change in savings ((S) divided by the change in<br />
disposable income ( DY).<br />
MPS = S/ DY.<br />
In the earlier lottery example, your marginal propensity to save is 0.25, or 25 percent,<br />
because you decided to save 25 percent of your additional disposable income (0.25 $1,000 =<br />
$250). Since your additional disposable income must be either consumed or saved, the marginal<br />
propensity to consume plus the marginal propensity to save must add up to 1, or 100 percent.<br />
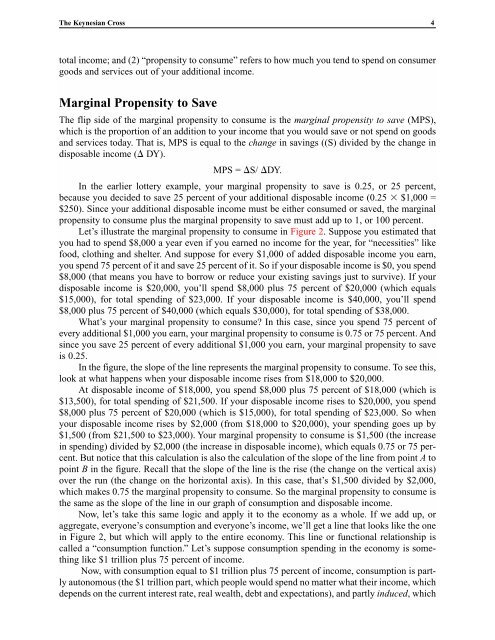
Let’s illustrate the marginal propensity to consume in Figure 2. Suppose you estimated that<br />
you had to spend $8,000 a year even if you earned no income for the year, for “necessities” like<br />
food, clothing and shelter. And suppose for every $1,000 of added disposable income you earn,<br />
you spend 75 percent of it and save 25 percent of it. So if your disposable income is $0, you spend<br />
$8,000 (that means you have to borrow or reduce your existing savings just to survive). If your<br />
disposable income is $20,000, you’ll spend $8,000 plus 75 percent of $20,000 (which equals<br />
$15,000), for total spending of $23,000. If your disposable income is $40,000, you’ll spend<br />
$8,000 plus 75 percent of $40,000 (which equals $30,000), for total spending of $38,000.<br />
What’s your marginal propensity to consume? In this case, since you spend 75 percent of<br />
every additional $1,000 you earn, your marginal propensity to consume is 0.75 or 75 percent. And<br />
since you save 25 percent of every additional $1,000 you earn, your marginal propensity to save<br />
is 0.25.<br />
In the figure, the slope of the line represents the marginal propensity to consume. To see this,<br />
look at what happens when your disposable income rises from $18,000 to $20,000.<br />
At disposable income of $18,000, you spend $8,000 plus 75 percent of $18,000 (which is<br />
$13,500), for total spending of $21,500. If your disposable income rises to $20,000, you spend<br />
$8,000 plus 75 percent of $20,000 (which is $15,000), for total spending of $23,000. So when<br />
your disposable income rises by $2,000 (from $18,000 to $20,000), your spending goes up by<br />
$1,500 (from $21,500 to $23,000). Your marginal propensity to consume is $1,500 (the increase<br />
in spending) divided by $2,000 (the increase in disposable income), which equals 0.75 or 75 percent.<br />
But notice that this calculation is also the calculation of the slope of the line from point A to<br />
point B in the figure. Recall that the slope of the line is the rise (the change on the vertical axis)<br />
over the run (the change on the horizontal axis). In this case, that’s $1,500 divided by $2,000,<br />
which makes 0.75 the marginal propensity to consume. So the marginal propensity to consume is<br />
the same as the slope of the line in our graph of consumption and disposable income.<br />
Now, let’s take this same logic and apply it to the economy as a whole. If we add up, or<br />
aggregate, everyone’s consumption and everyone’s income, we’ll get a line that looks like the one<br />
in Figure 2, but which will apply to the entire economy. This line or functional relationship is<br />
called a “consumption function.” Let’s suppose consumption spending in the economy is something<br />
like $1 trillion plus 75 percent of income.<br />
Now, with consumption equal to $1 trillion plus 75 percent of income, consumption is partly<br />
autonomous (the $1 trillion part, which people would spend no matter what their income, which<br />
depends on the current interest rate, real wealth, debt and expectations), and partly induced, which