The Keynesian Cross
The Keynesian Cross
The Keynesian Cross

You also want an ePaper? Increase the reach of your titles
YUMPU automatically turns print PDFs into web optimized ePapers that Google loves.
<strong>The</strong> <strong>Keynesian</strong> <strong>Cross</strong> 9<br />
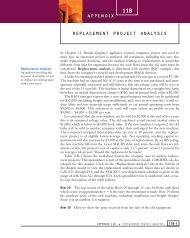
Suppose, as in Figure 7, that we are initially in equilibrium at point A, with output of $8 trillion.<br />
Just as in the example above, let’s suppose that the government increases spending by $500<br />
billion, so we know that we’ll eventually get to a new equilibrium at point Z in the figure, with<br />
output of $10 trillion. Now let’s see how we get from point A to point Z, with just induced consumer<br />
spending propelling the economy along.<br />
Figure 8 shows what happens along the way. We begin at point A, with output of $8 trillion.<br />
<strong>The</strong> increase in government purchases of $500 billion directly increases aggregate expenditure by<br />
that amount, represented by point B. Firms observe the increase in aggregate expenditure (perhaps<br />
because they see their inventories declining), so over the next few months they produce more output,<br />
moving the economy to point C, with output of $8.5 trillion. But now consumers have an<br />
extra $500 billion in income and they wish to spend 3/4 of it (since the marginal propensity to<br />
consume is .75). Since 3/4 of $500 billion is $375 billion, consumers now spend an additional<br />
$375 billion, increasing aggregate expenditure to $8.875 trillion at point D. Again, firms observe<br />
the increase in expenditure, so over the next few months they increase output, bringing the economy<br />
to point E. This process continues until the economy eventually reaches point Z, at which<br />
output is $10 trillion. Notice that the process is not accomplished immediately, but over several<br />
quarters of time.<br />
You can see on the graph how the economy reaches its new equilibrium at point Z. We can<br />
also calculate it numerically by adding up an infinite series of numbers in the following way.<br />
<strong>The</strong> first increase in output was $500 billion, which comes directly from the increase in government<br />
purchases. <strong>The</strong>n consumers, with higher incomes of $500 billion, want to spend 3/4 of<br />
it, so they increase spending by $500 billion 3/4 equals $375 billion. Now, with incomes<br />
higher by $375 billion, consumers want to spend an additional 3/4 of it, which is $375 billion<br />
3/4 equals $281.25 billion. Again, incomes are higher, so consumers will spend more, this<br />
time in the amount $281.25 3/4 equals $210.94 billion. <strong>The</strong> process continues indefinitely.<br />
To find the total increase in output (or income) we simply need to add up all these amounts.<br />
<strong>The</strong>y total $500 billion + $375 billion + $281.25 billion + $210.94 billion + . . . . <strong>The</strong> process<br />
goes on infinitely, but fortunately, the sum of the numbers is finite, as we can see using algebra.<br />
Notice that to get these numbers, we started with $500 billion, then took 3/4 $500 billion<br />
(to get $375 billion), then took 3/4 times that (to get $281.25 billion), and so on. So the<br />
increase in output is equal to $500 billion + (3/4 $500 billion) + (3/4 3/4 $500 billion)<br />
+ (3/4 3/4 3/4 $500 billion) + . . . . It turns out that an infinite sum with this pattern is<br />
equal to exactly $500 billion / (1 – 3/4) = $2 trillion. So output increases by $2 trillion, from<br />
$8 trillion to $10 trillion.<br />
This calculation of the sum of all the increases to output can be written in a very convenient<br />
way. Following the same process we used above, whenever an autonomous element of spending<br />
increases by some amount, output in the economy rises by that amount times a number called the<br />
multiplier. As you saw in this example, the multiplier depends on how much consumers spend out<br />
of any additions to their income. So in this model in which consumption spending is the only<br />
component of aggregate expenditure that depends on income, the multiplier is equal to 1 / (1 –<br />
MPC), where MPC is the marginal propensity to consume. In the example above, MPC = 3/4, so<br />
the multiplier is 1 / (1 – 3/4) = 4. <strong>The</strong> same multiplier holds whether the increase in aggregate<br />
expenditures arises from an increase in government purchases, as in the example above, or from<br />
an increase in other autonomous elements of spending, such as investment, net exports, or the<br />
autonomous portion of consumption spending. <strong>The</strong> multiplier just developed was designed to provide<br />
insights into the process of how it works. <strong>The</strong> actual multiplier for the United States economy<br />
is thought to be about half this size, around 2. We will see why shortly.