reconstruction of sri lanka‟s fisheries catches - Sea Around Us Project
reconstruction of sri lanka‟s fisheries catches - Sea Around Us Project
reconstruction of sri lanka‟s fisheries catches - Sea Around Us Project

You also want an ePaper? Increase the reach of your titles
YUMPU automatically turns print PDFs into web optimized ePapers that Google loves.
<strong>of</strong> the analysis. We assumed that the consumption rate in 1950 was the same as that in the 1980s, and<br />
therefore carried the 1981 rate <strong>of</strong> 19.39 kg∙person -1∙year -1 back, unaltered to 1950. The 2007 estimate was<br />
carried forward to 2008. Years between anchor points were interpolated linearly. Finally, we subtracted<br />
the per capita marine supply (FAO landings adjusted for imports and exports) from the total per capita<br />
seafood demand to determine the per capita subsistence catch rate. Human population data were then<br />
used to convert per capita subsistence catch rates into total subsistence catch amounts. This calculation<br />
was not done for 2005 since, although the 2005 consumption estimate was thought to be reasonable, the<br />
reported landings were low due to the tsunami, which was likely the result <strong>of</strong> both fewer <strong>catches</strong> and poor<br />
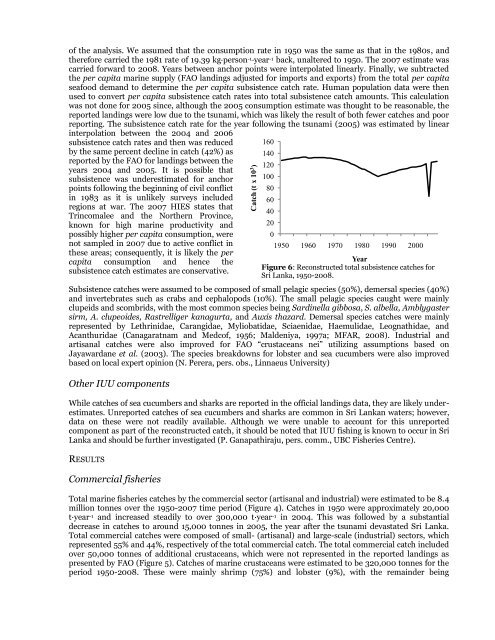
reporting. The subsistence catch rate for the year following the tsunami (2005) was estimated by linear<br />
interpolation between the 2004 and 2006<br />
subsistence catch rates and then was reduced<br />
by the same percent decline in catch (42%) as<br />
reported by the FAO for landings between the<br />
years 2004 and 2005. It is possible that<br />
subsistence was underestimated for anchor<br />
points following the beginning <strong>of</strong> civil conflict<br />
in 1983 as it is unlikely surveys included<br />
regions at war. The 2007 HIES states that<br />
Trincomalee and the Northern Province,<br />
known for high marine productivity and<br />
possibly higher per capita consumption, were<br />
not sampled in 2007 due to active conflict in<br />
these areas; consequently, it is likely the per<br />
capita consumption and hence the<br />
subsistence catch estimates are conservative.<br />
Subsistence <strong>catches</strong> were assumed to be composed <strong>of</strong> small pelagic species (50%), demersal species (40%)<br />
and invertebrates such as crabs and cephalopods (10%). The small pelagic species caught were mainly<br />
clupeids and scombrids, with the most common species being Sardinella gibbosa, S. albella, Amblygaster<br />
sirm, A. clupeoides, Rastrelliger kanagurta, and Auxis thazard. Demersal species <strong>catches</strong> were mainly<br />
represented by Lethrinidae, Carangidae, Myliobatidae, Sciaenidae, Haemulidae, Leognathidae, and<br />
Acanthuridae (Canagaratnam and Medc<strong>of</strong>, 1956; Maldeniya, 1997a; MFAR, 2008). Industrial and<br />
artisanal <strong>catches</strong> were also improved for FAO “crustaceans nei” utilizing assumptions based on<br />
Jayawardane et al. (2003). The species breakdowns for lobster and sea cucumbers were also improved<br />
based on local expert opinion (N. Perera, pers. obs., Linnaeus University)<br />
Other IUU components<br />
While <strong>catches</strong> <strong>of</strong> sea cucumbers and sharks are reported in the <strong>of</strong>ficial landings data, they are likely underestimates.<br />
Unreported <strong>catches</strong> <strong>of</strong> sea cucumbers and sharks are common in Sri Lankan waters; however,<br />
data on these were not readily available. Although we were unable to account for this unreported<br />
component as part <strong>of</strong> the reconstructed catch, it should be noted that IUU fishing is known to occur in Sri<br />
Lanka and should be further investigated (P. Ganapathiraju, pers. comm., UBC Fisheries Centre).<br />
RESULTS<br />
Commercial <strong>fisheries</strong><br />
Catch (t x 10 3 )<br />
Total marine <strong>fisheries</strong> <strong>catches</strong> by the commercial sector (artisanal and industrial) were estimated to be 8.4<br />
million tonnes over the 1950-2007 time period (Figure 4). Catches in 1950 were approximately 20,000<br />
t∙year -1 and increased steadily to over 300,000 t∙year -1 in 2004. This was followed by a substantial<br />
decrease in <strong>catches</strong> to around 15,000 tonnes in 2005, the year after the tsunami devastated Sri Lanka.<br />
Total commercial <strong>catches</strong> were composed <strong>of</strong> small- (artisanal) and large-scale (industrial) sectors, which<br />
represented 55% and 44%, respectively <strong>of</strong> the total commercial catch. The total commercial catch included<br />
over 50,000 tonnes <strong>of</strong> additional crustaceans, which were not represented in the reported landings as<br />
presented by FAO (Figure 5). Catches <strong>of</strong> marine crustaceans were estimated to be 320,000 tonnes for the<br />
period 1950-2008. These were mainly shrimp (75%) and lobster (9%), with the remainder being<br />
160<br />
140<br />
120<br />
100<br />
80<br />
60<br />
40<br />
20<br />
0<br />
1950 1960 1970 1980 1990 2000<br />
Year<br />
Figure 6: Reconstructed total subsistence <strong>catches</strong> for<br />
Sri Lanka, 1950-2008.


![Nacion.com, San José, Costa Rica [Nacionales] - Sea Around Us ...](https://img.yumpu.com/26166123/1/190x245/nacioncom-san-josac-costa-rica-nacionales-sea-around-us-.jpg?quality=85)