Boiling point distribution of crude oils based on TBP and ASTM D-86 ...
Boiling point distribution of crude oils based on TBP and ASTM D-86 ...
Boiling point distribution of crude oils based on TBP and ASTM D-86 ...

Create successful ePaper yourself
Turn your PDF publications into a flip-book with our unique Google optimized e-Paper software.
Petroleum & Coal<br />
ISSN 1337-7027<br />
Available <strong>on</strong>line at www.vurup.sk/petroleum-coal<br />
Petroleum & Coal 53 (4) 275-290, 2011<br />
BOILING POINT DISTRIBUTION OF CRUDE OILS BASED<br />
ON <strong>TBP</strong> AND <strong>ASTM</strong> D-<strong>86</strong> DISTILLATION DATA<br />
Angel Nedelchev, Dicho Stratiev, Atanas Ivanov, Georgy Stoilov<br />
Lukoil Neftochim Bourgas – Chief Process Engineer Department, 8104 Bourgas,<br />
Bulgaria, Nedelchev.Angel.D@neftochim.bg, Stratiev.Dicho@neftochim.bg<br />
Abstract<br />
Received July 4, 2011, Accepted October 15, 2011<br />
The True <str<strong>on</strong>g>Boiling</str<strong>on</strong>g> Point (<strong>TBP</strong>) analysis according to <strong>ASTM</strong> D-2892 st<strong>and</strong>ard is the single<br />
reliable tool for characterizati<strong>on</strong> <str<strong>on</strong>g>of</str<strong>on</strong>g> <str<strong>on</strong>g>crude</str<strong>on</strong>g> oil <strong>and</strong> petroleum mixtures in terms <str<strong>on</strong>g>of</str<strong>on</strong>g> their boiling<br />
<str<strong>on</strong>g>point</str<strong>on</strong>g> <str<strong>on</strong>g>distributi<strong>on</strong></str<strong>on</strong>g>. However, the analytical procedure is expensive <strong>and</strong> time c<strong>on</strong>suming, which<br />
is inappropriate for quick estimati<strong>on</strong> <str<strong>on</strong>g>of</str<strong>on</strong>g> <str<strong>on</strong>g>crude</str<strong>on</strong>g> oil distillati<strong>on</strong> characteristics. Thirty three<br />
<str<strong>on</strong>g>crude</str<strong>on</strong>g> oil samples were characterized by means <str<strong>on</strong>g>of</str<strong>on</strong>g> <strong>TBP</strong> distillati<strong>on</strong> <strong>and</strong> <strong>ASTM</strong> D-<strong>86</strong>. This<br />
paper presents an attempt to test the applicability <str<strong>on</strong>g>of</str<strong>on</strong>g> the major methods available in the<br />
open literature for c<strong>on</strong>verting <strong>ASTM</strong> D-<strong>86</strong> to <strong>TBP</strong> for the whole range <str<strong>on</strong>g>of</str<strong>on</strong>g> the distillati<strong>on</strong><br />
curve. The whole distillati<strong>on</strong> curve was obtained by using the Riazi’s <str<strong>on</strong>g>distributi<strong>on</strong></str<strong>on</strong>g> model<br />
((Ti-To)/To=[А T/В T.Ln( 1/(1-x i))] 1/BT ), which dem<strong>on</strong>strated high accuracy with r 2 ≥ 0.99.<br />
All methods dem<strong>on</strong>strated lower accuracy in c<strong>on</strong>verting the <strong>ASTM</strong> D-<strong>86</strong> into <strong>TBP</strong> than the<br />
reproducibility <str<strong>on</strong>g>of</str<strong>on</strong>g> the <strong>ASTM</strong> D-2892.<br />
Key words: <str<strong>on</strong>g>crude</str<strong>on</strong>g> oil, true boiling <str<strong>on</strong>g>point</str<strong>on</strong>g>, distillati<strong>on</strong>, <strong>ASTM</strong> D-2892, <strong>ASTM</strong> D-<strong>86</strong>.<br />
1. Introducti<strong>on</strong><br />
Having in mind that <str<strong>on</strong>g>crude</str<strong>on</strong>g> oil cost accounts for more than 80% <str<strong>on</strong>g>of</str<strong>on</strong>g> refinery<br />
expenditure the proper operati<strong>on</strong> <str<strong>on</strong>g>of</str<strong>on</strong>g> <str<strong>on</strong>g>crude</str<strong>on</strong>g> distillati<strong>on</strong> unit has great impact <strong>on</strong><br />
refinery pr<str<strong>on</strong>g>of</str<strong>on</strong>g>itability. In order to find the adequate technological regime that<br />
provides maximum yields <str<strong>on</strong>g>of</str<strong>on</strong>g> high value products in a <str<strong>on</strong>g>crude</str<strong>on</strong>g> distillati<strong>on</strong> unit the<br />
process engineer needs to have laboratory analyses data <str<strong>on</strong>g>of</str<strong>on</strong>g> <str<strong>on</strong>g>crude</str<strong>on</strong>g> oil that is<br />
processed in the unit. The True boiling <str<strong>on</strong>g>point</str<strong>on</strong>g> distillati<strong>on</strong> (<strong>TBP</strong>) is the single most<br />
important informati<strong>on</strong> for any <str<strong>on</strong>g>crude</str<strong>on</strong>g> oil for modeling <str<strong>on</strong>g>of</str<strong>on</strong>g> a <str<strong>on</strong>g>crude</str<strong>on</strong>g> distillati<strong>on</strong> column.<br />
The <strong>TBP</strong> distillati<strong>on</strong> tends to separate the individual mixture comp<strong>on</strong>ents relatively<br />
sharply in order <str<strong>on</strong>g>of</str<strong>on</strong>g> boiling <str<strong>on</strong>g>point</str<strong>on</strong>g> <strong>and</strong> is a good approximati<strong>on</strong> <str<strong>on</strong>g>of</str<strong>on</strong>g> the separati<strong>on</strong><br />
that may be expected in the plant. Unfortunately the <strong>TBP</strong> analyses are costly <strong>and</strong><br />
time c<strong>on</strong>suming, a <strong>TBP</strong> analysis takes about 48 hours. That is why it is impractical<br />
to use it as a tool for daily m<strong>on</strong>itoring <str<strong>on</strong>g>of</str<strong>on</strong>g> the <str<strong>on</strong>g>crude</str<strong>on</strong>g> distillati<strong>on</strong> unit operati<strong>on</strong>. For<br />
refineries, which <str<strong>on</strong>g>of</str<strong>on</strong>g>ten switch the <str<strong>on</strong>g>crude</str<strong>on</strong>g> <str<strong>on</strong>g>oils</str<strong>on</strong>g> the lack <str<strong>on</strong>g>of</str<strong>on</strong>g> informati<strong>on</strong> about the <str<strong>on</strong>g>crude</str<strong>on</strong>g><br />
oil quality could negatively impact the optimum operati<strong>on</strong> <strong>and</strong> in this way the<br />
pr<str<strong>on</strong>g>of</str<strong>on</strong>g>itability <str<strong>on</strong>g>of</str<strong>on</strong>g> the <str<strong>on</strong>g>crude</str<strong>on</strong>g> distillati<strong>on</strong> unit. It was found that boiling <str<strong>on</strong>g>point</str<strong>on</strong>g> <str<strong>on</strong>g>distributi<strong>on</strong></str<strong>on</strong>g><br />
<str<strong>on</strong>g>of</str<strong>on</strong>g> <str<strong>on</strong>g>crude</str<strong>on</strong>g> <str<strong>on</strong>g>oils</str<strong>on</strong>g> <strong>and</strong> oil fracti<strong>on</strong>s obey the Riazi’s <str<strong>on</strong>g>distributi<strong>on</strong></str<strong>on</strong>g> model [1] :<br />
Ti<br />
T<br />
T<br />
0<br />
0<br />
A<br />
B<br />
T<br />
T<br />
1<br />
1 x<br />
i<br />
1/<br />
BT<br />
ln (1)<br />
Equati<strong>on</strong> 1 can be c<strong>on</strong>verted into a linear form :<br />
where:<br />
Y C C . X<br />
1 2<br />
(2)<br />
T T<br />
T<br />
0<br />
Y ln ;<br />
0<br />
X<br />
1<br />
ln ln ;<br />
1 x<br />
i<br />
1<br />
C<br />
BT ; A<br />
B exp( C . B )<br />
2<br />
T<br />
T . 1 T
To = initial boiling <str<strong>on</strong>g>point</str<strong>on</strong>g> in K; Ti = temperature at which i per cent is distilled in<br />
K; xi = volume or weight part <str<strong>on</strong>g>of</str<strong>on</strong>g> distillate.<br />
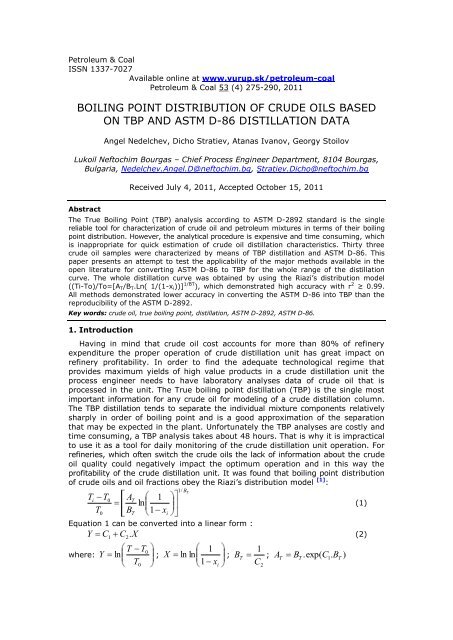
Equati<strong>on</strong> 2 has been tested <strong>on</strong> several hundreds samples <str<strong>on</strong>g>of</str<strong>on</strong>g> different <str<strong>on</strong>g>crude</str<strong>on</strong>g> <str<strong>on</strong>g>oils</str<strong>on</strong>g>,<br />
gas c<strong>on</strong>densates, bitumen <strong>and</strong> oil fracti<strong>on</strong>s in the Lukoil Neftochim research laboratory<br />
<strong>and</strong> has been proved to be valid for all tested samples. Figure 1 is an illustrati<strong>on</strong><br />
<str<strong>on</strong>g>of</str<strong>on</strong>g> validity <str<strong>on</strong>g>of</str<strong>on</strong>g> equati<strong>on</strong> 2 applied to different distillati<strong>on</strong> data <str<strong>on</strong>g>of</str<strong>on</strong>g> <str<strong>on</strong>g>crude</str<strong>on</strong>g> oil, straight<br />
run atmospheric residue, visbreaker residue, <strong>and</strong> visbreaker diesel. Regardless <str<strong>on</strong>g>of</str<strong>on</strong>g><br />
the distillati<strong>on</strong> method used (<strong>TBP</strong>, <strong>ASTM</strong> D-1160, <strong>ASTM</strong>D-5236, <strong>ASTM</strong> D-<strong>86</strong>,<br />
<strong>ASTM</strong> D-2887 <strong>and</strong> distillati<strong>on</strong> according to Bogdanov – GOST 10120) the boiling<br />
<str<strong>on</strong>g>point</str<strong>on</strong>g> <str<strong>on</strong>g>distributi<strong>on</strong></str<strong>on</strong>g> is perfectly approximated by equati<strong>on</strong>s 1 <strong>and</strong> 2. It could be inferred<br />
from these data that <strong>on</strong>e can safely extrapolate distillati<strong>on</strong> curve from a set <str<strong>on</strong>g>of</str<strong>on</strong>g><br />
data that does not cover the full distillati<strong>on</strong> range <str<strong>on</strong>g>of</str<strong>on</strong>g> an oil. For example data <str<strong>on</strong>g>of</str<strong>on</strong>g><br />
<strong>TBP</strong> distillati<strong>on</strong> <str<strong>on</strong>g>of</str<strong>on</strong>g> vacuum residue obtained in <strong>on</strong>e <str<strong>on</strong>g>of</str<strong>on</strong>g> the Lukoil vacuum distillati<strong>on</strong><br />
units is given in Table 1. Due to known limitati<strong>on</strong> <str<strong>on</strong>g>of</str<strong>on</strong>g> the equipment the distillati<strong>on</strong><br />
was performed for temperature not higher than 540 0 C. Figure 2 presents graph <str<strong>on</strong>g>of</str<strong>on</strong>g><br />
equati<strong>on</strong> 2 applied for the data <str<strong>on</strong>g>of</str<strong>on</strong>g> Table 1. It is evident from these data that eq.2<br />
perfectly describes the boiling <str<strong>on</strong>g>point</str<strong>on</strong>g> <str<strong>on</strong>g>distributi<strong>on</strong></str<strong>on</strong>g> <str<strong>on</strong>g>of</str<strong>on</strong>g> the vacuum residue (r 2 = 0.9977).<br />
Taking into account the pro<str<strong>on</strong>g>of</str<strong>on</strong>g> <str<strong>on</strong>g>of</str<strong>on</strong>g> validity <str<strong>on</strong>g>of</str<strong>on</strong>g> equati<strong>on</strong> 2 for the whole distillati<strong>on</strong> range<br />
we can build the vacuum residue <strong>TBP</strong> distillati<strong>on</strong> curve (Figure 3) <str<strong>on</strong>g>based</str<strong>on</strong>g> <strong>on</strong> the<br />
data for AT <strong>and</strong> BT extracted from Figure 2.<br />
Table 1 Distillati<strong>on</strong> characteristics <str<strong>on</strong>g>of</str<strong>on</strong>g> Atmospheric Residue from Ural Crude Oil<br />
Properties Atmospheric Residue<br />
1. Density @ 20 °С, g /сm 3 0.9489<br />
2. <strong>TBP</strong> Distillati<strong>on</strong> % ∑ %<br />
Ln((Ti-To)/To)<br />
A. Nedelchev, D. Stratiev, A.Ivanov, G. Stoilov/Petroleum & Coal, 53(4) 275-290, 011 276<br />
315-380°С 9.57 9.57<br />
360-400°С<br />
380-400°С 5.02 14.59<br />
400-430°С 10.77 25.36<br />
430-470°С 11.65 37.01<br />
470-490°С 5.98 42.99<br />
490- 540 °С 13.65 56.64<br />
> 540 °С 42.34<br />
Losses 1.02<br />
0<br />
-2.5 -2 -1.5 -1 -0.5 0<br />
y = 0.5806x - 0.8782<br />
R 2 = 0.9977<br />
Ln(Ln(1/(1-xi))<br />
Fig. 2 Applicati<strong>on</strong> <str<strong>on</strong>g>of</str<strong>on</strong>g> the Riazi’s model<br />
(eq.2) for approximati<strong>on</strong> <str<strong>on</strong>g>of</str<strong>on</strong>g> <strong>TBP</strong> distillati<strong>on</strong><br />
curve <str<strong>on</strong>g>of</str<strong>on</strong>g> Atmospheric Residue from Ural<br />
Crude Oil<br />
-0.5<br />
-1<br />
-1.5<br />
-2<br />
-2.5<br />
<str<strong>on</strong>g>Boiling</str<strong>on</strong>g> Temperature, oC<br />
1000<br />
900<br />
800<br />
700<br />
600<br />
500<br />
400<br />
300<br />
200<br />
100<br />
0<br />
0 20 40 60 80 100<br />
Distillate, wt.%<br />
Fig. 3 Full range <strong>TBP</strong> distillati<strong>on</strong> curve<br />
<str<strong>on</strong>g>of</str<strong>on</strong>g> Atmospheric Residue from Ural<br />
Crude Oil obtained by the use <str<strong>on</strong>g>of</str<strong>on</strong>g> the<br />
Riazi’s model (eq.2)<br />
Following this way <str<strong>on</strong>g>of</str<strong>on</strong>g> thinking we decided to test applicability <str<strong>on</strong>g>of</str<strong>on</strong>g> equati<strong>on</strong>s 1 <strong>and</strong> 2<br />
<strong>on</strong> <strong>ASTM</strong> D-<strong>86</strong> distillati<strong>on</strong> <str<strong>on</strong>g>of</str<strong>on</strong>g> 33 <str<strong>on</strong>g>crude</str<strong>on</strong>g> oil samples with the aim to build the whole<br />
range (from 0 to 99%) <str<strong>on</strong>g>crude</str<strong>on</strong>g> <strong>ASTM</strong> D-<strong>86</strong> distillati<strong>on</strong> curve <str<strong>on</strong>g>based</str<strong>on</strong>g> <strong>on</strong> distillati<strong>on</strong> data
oiling up to 300 0 C. The <strong>ASTM</strong> D-<strong>86</strong> distillati<strong>on</strong> is performed within 45 minutes<br />
<strong>and</strong> for that reas<strong>on</strong> it could be used for daily m<strong>on</strong>itoring <str<strong>on</strong>g>of</str<strong>on</strong>g> the <str<strong>on</strong>g>crude</str<strong>on</strong>g> distillati<strong>on</strong><br />
unit operati<strong>on</strong> if the whole <str<strong>on</strong>g>crude</str<strong>on</strong>g> oil curve is available <strong>and</strong> it could be c<strong>on</strong>verted<br />
into <strong>TBP</strong>. Further we tested the ability <str<strong>on</strong>g>of</str<strong>on</strong>g> the methods available in the open literature<br />
for c<strong>on</strong>versi<strong>on</strong> <str<strong>on</strong>g>of</str<strong>on</strong>g> <strong>ASTM</strong> D-<strong>86</strong> into <strong>TBP</strong> distillati<strong>on</strong> <str<strong>on</strong>g>of</str<strong>on</strong>g> the <str<strong>on</strong>g>crude</str<strong>on</strong>g> oil samples investigated<br />
in this study. The aim <str<strong>on</strong>g>of</str<strong>on</strong>g> this paper is to discuss the obtained results<br />
2. Experimental<br />
A. Nedelchev, D. Stratiev, A.Ivanov, G. Stoilov/Petroleum & Coal, 53(4) 275-290, 011 277<br />
<strong>TBP</strong> distillati<strong>on</strong> <str<strong>on</strong>g>of</str<strong>on</strong>g> all 33 investigated <str<strong>on</strong>g>crude</str<strong>on</strong>g> oil samples was carried out in the<br />
AUTODEST 800 Fisher column according to АSTM-D 2892 for the atmosphere part<br />
<str<strong>on</strong>g>of</str<strong>on</strong>g> the test <strong>and</strong> according to АSTM-D 5236 for the vacuum <strong>on</strong>e. The <strong>TBP</strong> distillati<strong>on</strong><br />
was performed in the AUTODEST 800 Fisher column at pressure drop from 760 to<br />
2 mmHg <strong>and</strong> in the AUTODEST <strong>86</strong>0 Fisher column from 1 to 0, 2 mmHg. The results<br />
<str<strong>on</strong>g>of</str<strong>on</strong>g> the <strong>TBP</strong> distillati<strong>on</strong> <str<strong>on</strong>g>of</str<strong>on</strong>g> the studied <str<strong>on</strong>g>crude</str<strong>on</strong>g> oil samples are presented in Table 2.<br />
Distillati<strong>on</strong> <str<strong>on</strong>g>of</str<strong>on</strong>g> the 33 <str<strong>on</strong>g>crude</str<strong>on</strong>g> oil samples up to 300 0 C was performed in accordance<br />
with <strong>ASTM</strong> D-<strong>86</strong> <strong>and</strong> the results <str<strong>on</strong>g>of</str<strong>on</strong>g> the distillati<strong>on</strong> are given in Table 3. The density at<br />
20 0 C was analyzed according to АSTM-D 1298.<br />
3. Results <strong>and</strong> Discussi<strong>on</strong>s<br />
Table 4 presents data <str<strong>on</strong>g>of</str<strong>on</strong>g> <strong>TBP</strong> distillati<strong>on</strong> <str<strong>on</strong>g>of</str<strong>on</strong>g> the 33 <str<strong>on</strong>g>crude</str<strong>on</strong>g> oil samples estimated<br />
<strong>on</strong> the base <str<strong>on</strong>g>of</str<strong>on</strong>g> the parameters AT <strong>and</strong> BT computed by eq.2 <strong>and</strong> assuming T0 =-11.7 0 C,<br />
which is the boiling <str<strong>on</strong>g>point</str<strong>on</strong>g> <str<strong>on</strong>g>of</str<strong>on</strong>g> isobutane. The isobutane is assumed to be the lightest<br />
compound in a <str<strong>on</strong>g>crude</str<strong>on</strong>g> oil [1]. The squared correlati<strong>on</strong> coefficient r 2 for all <str<strong>on</strong>g>crude</str<strong>on</strong>g> oil<br />
samples except that <str<strong>on</strong>g>of</str<strong>on</strong>g> the Light Siberian <str<strong>on</strong>g>crude</str<strong>on</strong>g> oil is above 0.99. For the Light<br />
Siberian <str<strong>on</strong>g>crude</str<strong>on</strong>g> the r 2 = 0.9898 which is also high enough. This implies that the<br />
Riazi’s <str<strong>on</strong>g>distributi<strong>on</strong></str<strong>on</strong>g> model describes very well the <strong>TBP</strong> distillati<strong>on</strong> curve <str<strong>on</strong>g>of</str<strong>on</strong>g> <str<strong>on</strong>g>crude</str<strong>on</strong>g> oil.<br />
Table 5 presents data <str<strong>on</strong>g>of</str<strong>on</strong>g> <strong>ASTM</strong> D-<strong>86</strong> distillati<strong>on</strong> <str<strong>on</strong>g>of</str<strong>on</strong>g> the 33 <str<strong>on</strong>g>crude</str<strong>on</strong>g> oil samples<br />
estimated <strong>on</strong> the base <str<strong>on</strong>g>of</str<strong>on</strong>g> the parameters AT <strong>and</strong> BT computed by eq.2. The squared<br />
correlati<strong>on</strong> coefficient r 2 for all <str<strong>on</strong>g>crude</str<strong>on</strong>g> oil samples except that <str<strong>on</strong>g>of</str<strong>on</strong>g> the Buzachinmski<br />
<str<strong>on</strong>g>crude</str<strong>on</strong>g> oil is above 0.99. For the Buzachinmski <str<strong>on</strong>g>crude</str<strong>on</strong>g> the r 2 = 0.9751 which is also<br />
high. This indicates that the Riazi’s <str<strong>on</strong>g>distributi<strong>on</strong></str<strong>on</strong>g> model also describes very well the<br />
<strong>ASTM</strong> D-<strong>86</strong> distillati<strong>on</strong> curve <str<strong>on</strong>g>of</str<strong>on</strong>g> <str<strong>on</strong>g>crude</str<strong>on</strong>g> oil. It may be c<strong>on</strong>cluded that by the use <str<strong>on</strong>g>of</str<strong>on</strong>g><br />
calculated AT <strong>and</strong> BT <strong>and</strong> the initial boiling <str<strong>on</strong>g>point</str<strong>on</strong>g> the distillati<strong>on</strong> curve could be<br />
safely extrapolated to 99 vol.%. In other words by applying the Riazi’s <str<strong>on</strong>g>distributi<strong>on</strong></str<strong>on</strong>g><br />
model from <strong>ASTM</strong> D-<strong>86</strong> distillati<strong>on</strong> data <str<strong>on</strong>g>of</str<strong>on</strong>g> a <str<strong>on</strong>g>crude</str<strong>on</strong>g> oil boiling up to 300 0 C it can be<br />
estimated the amount <str<strong>on</strong>g>of</str<strong>on</strong>g> compounds boiling above this temperature <strong>and</strong> build the<br />
full range distillati<strong>on</strong> curve.<br />
In order to examine the capabilities <str<strong>on</strong>g>of</str<strong>on</strong>g> the available in the open literature<br />
correlati<strong>on</strong>s for c<strong>on</strong>versi<strong>on</strong> <str<strong>on</strong>g>of</str<strong>on</strong>g> <strong>ASTM</strong> D-<strong>86</strong> into <strong>TBP</strong> distillati<strong>on</strong> we had to c<strong>on</strong>vert<br />
the <strong>TBP</strong> distillati<strong>on</strong> data from weight % in volume % because all correlati<strong>on</strong>s<br />
c<strong>on</strong>vert <strong>ASTM</strong> D-<strong>86</strong> into <strong>TBP</strong> vol.%. Table VI presents data <str<strong>on</strong>g>of</str<strong>on</strong>g> <strong>TBP</strong> distillati<strong>on</strong> <str<strong>on</strong>g>of</str<strong>on</strong>g><br />
the 33 <str<strong>on</strong>g>crude</str<strong>on</strong>g> oil samples in vol.% assuming c<strong>on</strong>stant Kw factor for all <str<strong>on</strong>g>crude</str<strong>on</strong>g><br />
fracti<strong>on</strong>s <strong>and</strong> using the data from Table 5. The squared correlati<strong>on</strong> coefficient r 2<br />
for this data set is above 0.99.<br />
There is number <str<strong>on</strong>g>of</str<strong>on</strong>g> empirical approaches for c<strong>on</strong>verting <strong>ASTM</strong> D <strong>86</strong> distillati<strong>on</strong>s<br />
to true boiling <str<strong>on</strong>g>point</str<strong>on</strong>g> (<strong>TBP</strong>) distillati<strong>on</strong>s. Three <str<strong>on</strong>g>of</str<strong>on</strong>g> them are the most applicable for<br />
engineering purposes.<br />
From chr<strong>on</strong>ological <str<strong>on</strong>g>point</str<strong>on</strong>g> <str<strong>on</strong>g>of</str<strong>on</strong>g> view the earliest method for c<strong>on</strong>versi<strong>on</strong> <str<strong>on</strong>g>of</str<strong>on</strong>g> the<br />
distillati<strong>on</strong> curves is the method <str<strong>on</strong>g>of</str<strong>on</strong>g> Edmister [2] . It is a graphical approach, which<br />
was developed in the period 1948÷1961. First step in applicati<strong>on</strong> <str<strong>on</strong>g>of</str<strong>on</strong>g> the method is<br />
definiti<strong>on</strong> <str<strong>on</strong>g>of</str<strong>on</strong>g> the <strong>TBP</strong> 50% as a functi<strong>on</strong> <str<strong>on</strong>g>of</str<strong>on</strong>g> D <strong>86</strong> 50% in Fahrenheit using the<br />
graph that is illustrated in Figure 3.
A. Nedelchev, D. Stratiev, A.Ivanov, G. Stoilov/Petroleum & Coal, 53(4) 275-290, 011 278<br />
Figure 3 Relati<strong>on</strong>ship between <strong>ASTM</strong> D <strong>86</strong> <strong>and</strong> <strong>TBP</strong> distillati<strong>on</strong> curves developed<br />
by Edmister <strong>and</strong> al. [2]<br />
Next step requires making a graphical definiti<strong>on</strong> <str<strong>on</strong>g>of</str<strong>on</strong>g> the temperature differences<br />
between the segments <str<strong>on</strong>g>of</str<strong>on</strong>g> <strong>ASTM</strong> D <strong>86</strong> distillati<strong>on</strong> curve (0%÷10%; 10%÷30%;<br />
30%÷50%; 50%÷70%; 70%÷90% <strong>and</strong> 90%÷100%) by means <str<strong>on</strong>g>of</str<strong>on</strong>g> the same graph.<br />
These values are needed in order to define the corresp<strong>on</strong>dent temperature differences<br />
in <strong>TBP</strong>. By means <str<strong>on</strong>g>of</str<strong>on</strong>g> defined temperature differences in <strong>TBP</strong> <strong>and</strong> <strong>TBP</strong>50%, which<br />
is available in advance, it is easy to draw the <strong>TBP</strong> curve. Table VII illustrates the<br />
corresp<strong>on</strong>ding values from Figure 3, which facilitate c<strong>on</strong>versi<strong>on</strong> procedure.<br />
Riazi-Daubert method for the interc<strong>on</strong>versi<strong>on</strong> <str<strong>on</strong>g>of</str<strong>on</strong>g> <strong>ASTM</strong> D <strong>86</strong> distillati<strong>on</strong>s to <strong>TBP</strong><br />
distillati<strong>on</strong>s is <str<strong>on</strong>g>based</str<strong>on</strong>g> <strong>on</strong> the generalized correlati<strong>on</strong> in the following form [3] :<br />
<strong>TBP</strong> a<br />
)<br />
b<br />
( <strong>ASTM</strong> D<strong>86</strong><br />
(3)<br />
where both <strong>TBP</strong> <strong>and</strong> <strong>ASTM</strong> temperatures are for the same vol.% distilled <strong>and</strong><br />
are in Kelvin. C<strong>on</strong>stants a <strong>and</strong> b at various <str<strong>on</strong>g>point</str<strong>on</strong>g>s al<strong>on</strong>g the distillati<strong>on</strong> curve with<br />
the range <str<strong>on</strong>g>of</str<strong>on</strong>g> applicati<strong>on</strong> are given in Table 8.<br />
Table 8 Correlati<strong>on</strong> c<strong>on</strong>stants in eq. 3<br />
vol% a b range a, o C<br />
0 0.9177 1.0190 20-320<br />
10 0.5564 1.0900 35-305<br />
30 0.7617 1.0425 50-315<br />
50 0.9013 1.0176 55-320<br />
70 0.8821 1.0226 65-330<br />
90 0.9552 1.0110 75-345<br />
95 0.8177 1.0355 75-400
Daubert <strong>and</strong> his group developed a different set <str<strong>on</strong>g>of</str<strong>on</strong>g> equati<strong>on</strong>s to c<strong>on</strong>vert <strong>ASTM</strong><br />
to <strong>TBP</strong>, which is also known as a Daubert’s method [3] . The following equati<strong>on</strong> is<br />
used to c<strong>on</strong>vert an <strong>ASTM</strong> D <strong>86</strong> distillati<strong>on</strong> at 50% <str<strong>on</strong>g>point</str<strong>on</strong>g> temperature to a <strong>TBP</strong><br />
distillati<strong>on</strong> 50% <str<strong>on</strong>g>point</str<strong>on</strong>g> temperature.<br />
1.<br />
0258<br />
<strong>TBP</strong> ( 50%)<br />
255.<br />
4 0.<br />
8851[<br />
<strong>ASTM</strong> D<strong>86</strong>(<br />
50%)<br />
255.<br />
4]<br />
(4)<br />
where <strong>ASTM</strong> (50%) <strong>and</strong> <strong>TBP</strong> (50%) are temperatures at 50% volume distilled<br />
in Kelvin. Equati<strong>on</strong> (4) can also be used in a reverse form to estimate <strong>ASTM</strong> from<br />
<strong>TBP</strong>. The following equati<strong>on</strong> is used to determine the difference between two cut<br />
<str<strong>on</strong>g>point</str<strong>on</strong>g>s:<br />
Y<br />
i<br />
Where:<br />
AX<br />
B<br />
i<br />
Yi = difference in <strong>TBP</strong> temperature between two cut <str<strong>on</strong>g>point</str<strong>on</strong>g>s, K;<br />
Xi = observed difference in <strong>ASTM</strong> D <strong>86</strong> temperature between two cut <str<strong>on</strong>g>point</str<strong>on</strong>g>s, K;<br />
A, B = c<strong>on</strong>stants varying for each cut <str<strong>on</strong>g>point</str<strong>on</strong>g> <strong>and</strong> are given in Table IX.<br />
Table 9 Correlati<strong>on</strong> c<strong>on</strong>stants in eq. 5<br />
i<br />
Cut <str<strong>on</strong>g>point</str<strong>on</strong>g> range,<br />
%<br />
A B<br />
1 100-90 0.1403 1.6606<br />
2 90-70 2.6339 0.7550<br />
3 70-50 2.2744 0.8200<br />
4 50-30 2.6956 0.8008<br />
5 10-30 4.1481 0.7164<br />
6 10-0 5.8589 0.6024<br />
To determine the true boiling <str<strong>on</strong>g>point</str<strong>on</strong>g> temperature at any percent distilled, calculati<strong>on</strong><br />
should begin with 50% <strong>TBP</strong> temperature <strong>and</strong> additi<strong>on</strong> or subtracti<strong>on</strong> <str<strong>on</strong>g>of</str<strong>on</strong>g> the proper<br />
temperature difference Yi.<br />
<strong>TBP</strong> (0%) = <strong>TBP</strong> (50%) - Y4 - Y5 - Y6<br />
<strong>TBP</strong> (10%) = <strong>TBP</strong> (50%) - Y4 - Y5<br />
<strong>TBP</strong> (30%) = <strong>TBP</strong> (50%) - Y4<br />
<strong>TBP</strong> (70%) = <strong>TBP</strong> (50%) + Y3<br />
<strong>TBP</strong> (90%) = <strong>TBP</strong> (50%) + Y3+Y2<br />
<strong>TBP</strong> (100%) = <strong>TBP</strong> (50%) + Y3 + Y2 + Y1<br />
The three approaches for c<strong>on</strong>versi<strong>on</strong> <str<strong>on</strong>g>of</str<strong>on</strong>g> <strong>ASTM</strong> D <strong>86</strong> distillati<strong>on</strong>s to <strong>TBP</strong> distillati<strong>on</strong>s<br />
were applied to the experimental data for 33 <str<strong>on</strong>g>crude</str<strong>on</strong>g> oil samples. Tables 10-12<br />
present data <str<strong>on</strong>g>of</str<strong>on</strong>g> absolute deviati<strong>on</strong> calculated as measured value – estimated<br />
value. The data in tables X-XII indicate that all three methods <str<strong>on</strong>g>of</str<strong>on</strong>g> c<strong>on</strong>versi<strong>on</strong> <str<strong>on</strong>g>of</str<strong>on</strong>g><br />
<strong>ASTM</strong> D <strong>86</strong> distillati<strong>on</strong> to <strong>TBP</strong> <strong>on</strong>e used in this work: the Riazi-Daubert C<strong>on</strong>versi<strong>on</strong><br />
Method, the Daubert C<strong>on</strong>versi<strong>on</strong> Method <strong>and</strong> the Edmister C<strong>on</strong>versi<strong>on</strong> Method do<br />
not adequately predict <strong>TBP</strong> distillati<strong>on</strong> from data <str<strong>on</strong>g>of</str<strong>on</strong>g> <strong>ASTM</strong> D-<strong>86</strong> distillati<strong>on</strong> data.<br />
The maximum deviati<strong>on</strong> in the boiling temperature for each per cent evaporate<br />
should not go bey<strong>on</strong>d 10 0 C. No <strong>on</strong>e <str<strong>on</strong>g>of</str<strong>on</strong>g> the c<strong>on</strong>versi<strong>on</strong> method used do not achieve<br />
this requirement. Therefore, a new method for c<strong>on</strong>versi<strong>on</strong> <str<strong>on</strong>g>of</str<strong>on</strong>g> <strong>ASTM</strong> D <strong>86</strong> distillati<strong>on</strong> to<br />
<strong>TBP</strong> distillati<strong>on</strong> applicable for <str<strong>on</strong>g>crude</str<strong>on</strong>g> <str<strong>on</strong>g>oils</str<strong>on</strong>g> should be developed.<br />
4. C<strong>on</strong>clusi<strong>on</strong>s<br />
A. Nedelchev, D. Stratiev, A.Ivanov, G. Stoilov/Petroleum & Coal, 53(4) 275-290, 011 279<br />
It was found in this work that <str<strong>on</strong>g>distributi<strong>on</strong></str<strong>on</strong>g> <str<strong>on</strong>g>of</str<strong>on</strong>g> boiling <str<strong>on</strong>g>point</str<strong>on</strong>g> <str<strong>on</strong>g>of</str<strong>on</strong>g> the compounds<br />
c<strong>on</strong>taining in 33 <str<strong>on</strong>g>crude</str<strong>on</strong>g> oil samples measured by <strong>TBP</strong> or <strong>ASTM</strong> D-<strong>86</strong> can be approximated<br />
by the Riazi’s <str<strong>on</strong>g>distributi<strong>on</strong></str<strong>on</strong>g> model:<br />
(5)
Ti<br />
T<br />
T<br />
0<br />
0<br />
A<br />
B<br />
T<br />
T<br />
ln<br />
1<br />
1 x<br />
i<br />
1/<br />
BT<br />
This <str<strong>on</strong>g>distributi<strong>on</strong></str<strong>on</strong>g> model allows from incomplete distillati<strong>on</strong> data the entire distillati<strong>on</strong><br />
curve <str<strong>on</strong>g>of</str<strong>on</strong>g> a <str<strong>on</strong>g>crude</str<strong>on</strong>g> oil to be built regardless <str<strong>on</strong>g>of</str<strong>on</strong>g> the method used for measuring <str<strong>on</strong>g>of</str<strong>on</strong>g> the<br />
distillati<strong>on</strong> characteristics. On this base the entire distillati<strong>on</strong> curve can be c<strong>on</strong>structed<br />
by the use <str<strong>on</strong>g>of</str<strong>on</strong>g> <strong>ASTM</strong> D-<strong>86</strong> method for measuring <str<strong>on</strong>g>of</str<strong>on</strong>g> the evaporate boiling up to<br />
300ºC. An attempt to apply the Riazi-Daubert C<strong>on</strong>versi<strong>on</strong> Method, the Daubert<br />
C<strong>on</strong>versi<strong>on</strong> Method <strong>and</strong> the Edmister C<strong>on</strong>versi<strong>on</strong> Method for c<strong>on</strong>verting <strong>ASTM</strong> D-<br />
<strong>86</strong> into <strong>TBP</strong> <str<strong>on</strong>g>of</str<strong>on</strong>g> the investigated <str<strong>on</strong>g>crude</str<strong>on</strong>g> <str<strong>on</strong>g>oils</str<strong>on</strong>g> was found to be unsuccessful. Therefore<br />
a new method for c<strong>on</strong>versi<strong>on</strong> <str<strong>on</strong>g>of</str<strong>on</strong>g> <strong>ASTM</strong> D <strong>86</strong> distillati<strong>on</strong> to <strong>TBP</strong> distillati<strong>on</strong> applicable<br />
for <str<strong>on</strong>g>crude</str<strong>on</strong>g> <str<strong>on</strong>g>oils</str<strong>on</strong>g> should be developed.<br />
Reference<br />
A. Nedelchev, D. Stratiev, A.Ivanov, G. Stoilov/Petroleum & Coal, 53(4) 275-290, 011 280<br />
[1] Riazi, M.R., “A C<strong>on</strong>tinuous Model for C7+ Fracti<strong>on</strong> Characterizati<strong>on</strong> <str<strong>on</strong>g>of</str<strong>on</strong>g><br />
Petroleum Fluids”, Ind. Eng. Chem. Res., vol. 36 (10), 1997, pp 4299–4307.<br />
[2] Edmister, W.C., Pollock, D.H., “Phase Relati<strong>on</strong>s for Petroleum Fracti<strong>on</strong>s”,<br />
Chem. Eng. Progr., vol. 44, 1948, pp. 905-926.<br />
[3] Riazi, M.R., “Characterizati<strong>on</strong> <strong>and</strong> Properties <str<strong>on</strong>g>of</str<strong>on</strong>g> Petroleum Fracti<strong>on</strong>s”,<br />
American Society for Testing <strong>and</strong> Materials, 2005.
<strong>ASTM</strong> D-1160 <str<strong>on</strong>g>of</str<strong>on</strong>g> Atm.Residue<br />
<strong>ASTM</strong> D-5236 <str<strong>on</strong>g>of</str<strong>on</strong>g> Atm.Residue<br />
<strong>ASTM</strong> D-2892 <str<strong>on</strong>g>of</str<strong>on</strong>g> Crude Oil<br />
0<br />
-3.5 -3 -2.5 -2 -1.5 -1 -0.5 0 0.5<br />
-0.5<br />
0.00<br />
-3.00 -2.50 -2.00 -1.50 -1.00 -0.50 0.00<br />
1.000<br />
-0.50<br />
-1<br />
y = 0.7303x - 1.1788<br />
R 2 = 0.9993<br />
0.500<br />
y = 0.4828x + 0.5452<br />
R 2 = 0.999<br />
Ln((Ti-To)/T0)<br />
y = 0.5797x - 0.7879<br />
R 2 = 0.9998<br />
Ln((Ti-To)/To)<br />
Ln((Ti-To)/To)<br />
-1.5<br />
-1.00<br />
-2<br />
-2.5<br />
-1.50<br />
0.000<br />
-4.000 -3.000 -2.000 -1.000 0.000 1.000<br />
-0.500<br />
A. Nedelchev, D. Stratiev, A.Ivanov, G. Stoilov/Petroleum & Coal, 53(4) 275-290, 011 281<br />
-3<br />
-2.00<br />
-1.000<br />
-3.5<br />
-4<br />
-2.50<br />
-1.500<br />
Ln(Ln(1/(1-xi)))<br />
Ln(Ln(1/1-xi))<br />
Ln(Ln(1/1-xi))<br />
<strong>ASTM</strong> D-<strong>86</strong> <str<strong>on</strong>g>of</str<strong>on</strong>g> Visbreaker Diesel<br />
GOST 10120 (Bogdanov) <str<strong>on</strong>g>of</str<strong>on</strong>g><br />
Visbreaker Residue<br />
<strong>ASTM</strong> D-1160 <str<strong>on</strong>g>of</str<strong>on</strong>g> Visbreaker Residue<br />
0<br />
-4 -3 -2 -1 0 1 2<br />
-0.5<br />
0<br />
-3.5 -3 -2.5 -2 -1.5 -1<br />
0<br />
-3.5 -3 -2.5 -2 -1.5 -1 -0.5 0<br />
-0.5<br />
y = 0.5053x - 1.6827<br />
R 2 = 0.9897<br />
Ln((Ti-To)/To)<br />
-0.5<br />
-1<br />
y = 0.6338x - 0.0972<br />
R 2 = 0.9925<br />
Ln((Ti-To)/To)<br />
-1<br />
y = 0.8195x + 0.4739<br />
R 2 = 0.9934<br />
Ln((Ti-To)/To))<br />
-1<br />
-1.5<br />
-2<br />
-1.5<br />
-1.5<br />
-2.5<br />
-2<br />
-3<br />
-2<br />
-3.5<br />
-2.5<br />
Ln(Ln(1/(1-xi)))<br />
-2.5<br />
Ln(LN(1/(1-xi))<br />
Ln(Ln(1/(1-xi)))<br />
Figure 1 Applicati<strong>on</strong> <str<strong>on</strong>g>of</str<strong>on</strong>g> the Riazi’s model (eq.2) for approximati<strong>on</strong> <str<strong>on</strong>g>of</str<strong>on</strong>g> distillati<strong>on</strong> curves <str<strong>on</strong>g>of</str<strong>on</strong>g> different <str<strong>on</strong>g>crude</str<strong>on</strong>g> <strong>and</strong> <str<strong>on</strong>g>crude</str<strong>on</strong>g> oil fracti<strong>on</strong>s by<br />
the use <str<strong>on</strong>g>of</str<strong>on</strong>g> different methods for measuring <str<strong>on</strong>g>of</str<strong>on</strong>g> distillati<strong>on</strong> characteristics
Table 2 <strong>TBP</strong> distillati<strong>on</strong> <str<strong>on</strong>g>of</str<strong>on</strong>g> 33 <str<strong>on</strong>g>crude</str<strong>on</strong>g> oil samples<br />
A. Nedelchev, D. Stratiev, A.Ivanov, G. Stoilov/Petroleum & Coal, 53(4) 275-290, 011 282<br />
<strong>ASTM</strong> D 2892 / D 5236, wt.%<br />
Crude Oil Sample<br />
IBP-70 70-100 100-180 180-240 240-360 360-540 540+<br />
TUN 3.1 3.0 9.9 8.0 23.5 27.8 24.8<br />
TUAP 4.4 4.2 14.1 10.9 23.0 26.2 17.2<br />
BUZ 1.9 2.8 6.1 8.0 23.0 29.5 28.7<br />
LIB1 2.3 2.8 8.1 7.3 22.4 29.6 27.6<br />
LIB2 8.5 6.3 17.9 10.9 22.5 21.7 14.3<br />
GOS 3.5 3.1 11.0 8.6 22.8 31.4 19.6<br />
SYR 4.2 2.4 9.5 6.4 15.8 29.1 32.4<br />
LIR 4.3 4.3 13.8 10.4 21.8 25.0 20.6<br />
LAR 4.0 3.1 13.0 9.9 24.5 25.8 19.8<br />
HIR 6.0 6.8 9.1 9.1 20.0 23.8 26.7<br />
AMCO 4.3 2.7 11.9 9.3 23.4 25.7 22.8<br />
LSYR 4.5 3.6 13.8 11.0 27.7 30.8 9.5<br />
KUW 4.6 3.1 11.8 9.2 20.6 23.7 27.1<br />
IRQ 6.6 5.2 13.9 10.9 21.4 23.3 18.7<br />
LSIB 7.0 5.1 15.0 11.6 22.1 29.0 12.8<br />
ZAIK 11.0 8.1 21.7 12.9 25.7 18.3 5.3<br />
TENG 9.4 7.4 24.0 16.1 24.6 16.2 2.4<br />
HUR 3.9 5.3 4.8 9.0 20.0 32.0 25.0<br />
UOR 2.7 4.8 5.5 9.0 19.0 33.0 26.0<br />
KUM 7.5 7.1 20.7 10.2 22.4 21.6 13.3<br />
URL 3.9 6.9 6.2 11.0 22.0 27.0 23.0<br />
REM 3.0 3.5 11.4 8.1 23.3 28.2 22.5<br />
LAZ 5.5 5.5 14.7 11.2 22.9 23.5 16.7<br />
REBCO1 3.2 3.8 13.5 7.5 17.4 27.9 28.2<br />
REBCO2 3.0 3.8 13.1 7.9 18.2 28.5 26.8<br />
REBCO3 3.0 3.8 14.4 7.8 18.7 29.2 24.6<br />
ABCO1 3.3 3.0 11.5 9.1 22.1 27.1 23.9<br />
ABCO2 3.3 3.2 11.6 9.6 22.2 26.3 23.9<br />
ABCO3 2.9 3.2 10.9 9.2 22.1 28.1 23.7<br />
ABCO4 3.2 3.0 10.9 9.0 22.4 27.7 23.8<br />
ABCO5 3.2 3.1 11.4 8.9 22.0 28.0 23.4<br />
ABCO6 3.3 3.9 11.5 8.9 20.6 28.8 23.1<br />
ABCO7 2.6 2.9 12.2 10.7 20.9 27.2 23.5
Table 3 <strong>ASTM</strong> D-<strong>86</strong> distillati<strong>on</strong> <str<strong>on</strong>g>of</str<strong>on</strong>g> 33 <str<strong>on</strong>g>crude</str<strong>on</strong>g> oil samples<br />
A. Nedelchev, D. Stratiev, A.Ivanov, G. Stoilov/Petroleum & Coal, 53(4) 275-290, 011 283<br />
<strong>ASTM</strong> D <strong>86</strong><br />
Crude Oil<br />
Up to Up to Up to Up to Up to Up to Up to Up to Up to<br />
IBP,<br />
Sample<br />
62ºC, 85ºC, 120ºC, 150ºC, 180ºC, 200ºC, 240ºC, 250ºC, 300ºC,<br />
ºC<br />
%vol. %vol. %vol. %vol. %vol. %vol. %vol. %vol. %vol.<br />
TUN 62.0 - 1.0 4.0 10.0 14.0 17.0 23.0 25.0 39.0<br />
TUAP 40.0 3.0 7.0 13.0 20.0 26.0 29.0 37.0 40.0 50.0<br />
BUZ 60.0 - 2.0 7.0 8.0 15.0 17.0 18.5 26.0 35.0<br />
LIB1 61.0 - 1.5 5.0 10.0 14.0 17.0 18.0 25.0 36.0<br />
LIB2 40.0 3.0 8.5 18.0 27.0 33.0 39.0 46.0 48.0 58.5<br />
GOS 61.0 - 3.0 10.0 15.0 20.0 24.0 30.0 32.0 41.0<br />
SYR 55.0 1.0 5.0 10.0 14.0 19.0 21.0 25.0 26.0 34.0<br />
LIR 33.0 3.5 6.0 12.5 19.0 25.5 30.0 37.0 38.5 48.0<br />
LAR 30.0 2.0 4.0 11.0 17.0 23.0 29.0 36.0 39.0 48.0<br />
HIR 46.0 2.0 6.0 12.0 19.0 25.0 28.0 35.0 37.0 45.0<br />
AMCO 51.0 1.5 5.0 10.0 16.0 21.0 25.5 32.5 34.0 43.0<br />
LSYR 30.0 2.0 5.0 10.0 16.0 23.0 27.0 35.0 37.0 48.0<br />
KUW 30.0 3.0 6.0 12.0 18.0 23.0 26.5 34.0 35.5 45.0<br />
IRQ 44.0 2.0 7.0 14.0 21.0 28.0 32.0 41.0 43.0 54.0<br />
LSIB 28.0 3.0 5.0 13.0 20.0 27.0 31.0 38.0 40.0 50.0<br />
ZAIK 40.0 4.0 9.0 19.0 30.0 40.0 43.0 51.0 53.0 65.0<br />
TENG 35.0 7.0 14.0 25.0 34.0 44.0 49.0 60.0 62.0 74.0<br />
HUR 50.0 1.5 4.0 9.0 13.5 18.0 22.0 27.0 29.0 38.0<br />
UOR 47.0 2.0 5.0 9.0 14.0 18.0 21.0 27.0 29.0 39.0<br />
KUM 50.0 2.0 6.0 11.0 20.0 26.0 29.0 37.0 40.0 50.0<br />
URL 51.0 2.0 5.0 11.0 17.0 22.0 26.0 34.0 36.0 46.0<br />
REM 47.0 1.0 4.0 10.0 15.0 20.0 24.0 30.0 32.0 42.0<br />
LAZ 60.0 1.0 13.0 20.0 28.0 32.0 35.0 40.0 42.0 53.0<br />
REBCO1 53.0 0.5 2.5 9.0 13.0 19.0 23.0 31.0 33.0 44.0<br />
REBCO2 30.0 1.5 3.0 8.0 13.0 18.0 21.5 28.0 30.5 42.0<br />
REBCO3 25.0 2.5 4.5 9.5 14.5 19.5 23.0 29.5 31.0 43.0<br />
ABCO1 62.0 - 2.0 8.0 13.0 18.0 22.0 28.5 30.5 43.5<br />
ABCO2 60.0 - 2.0 7.0 12.0 17.0 21.0 27.5 30.0 41.0<br />
ABCO3 51.0 0.5 4.0 10.0 15.0 20.0 24.0 32.0 34.0 44.0<br />
ABCO4 53.0 1.0 4.0 9.0 14.0 16.0 22.0 30.0 32.0 43.0<br />
ABCO5 47.0 1.5 3.5 8.5 14.0 19.0 22.5 29.0 31.0 42.5<br />
ABCO6 58.0 - 3.0 8.0 13.0 18.0 22.0 30.0 32.0 43.0<br />
ABCO7 62.0 - 2.0 8.0 13.0 17.0 21.0 30.0 31.0 43.0
Table 4 <strong>TBP</strong> distillati<strong>on</strong> data (wt.%) <str<strong>on</strong>g>of</str<strong>on</strong>g> the <str<strong>on</strong>g>crude</str<strong>on</strong>g> <str<strong>on</strong>g>oils</str<strong>on</strong>g> under study<br />
A. Nedelchev, D. Stratiev, A.Ivanov, G. Stoilov/Petroleum & Coal, 53(4) 275-290, 011 284<br />
Crude Oil Sample 5%wt., 10%wt, 30%wt, 50%wt, 70%wt, 90%wt, 95%wt, R² AT BT SG<br />
Tunesian 92 ºC 138 ºC 267 ºC 380 ºC 507 ºC 710 ºC 813 ºC 0.998 6.255 1.963 0.836<br />
Tuapse 74 112 222 319 428 605 695 0.9985<br />
4.3459<br />
1.9221<br />
0.8490<br />
Buzachinmski 115 165 302 416 542 738 836 0.9912<br />
8.8227<br />
2.1373<br />
0.8910<br />
Libyan1 105 155 290 406 536 740 843 0.9978<br />
7.7157<br />
2.0462<br />
0.8930<br />
Libyan2 45 79 187 293 424 650 773 0.9949<br />
2.8443<br />
1.5502<br />
0.8150<br />
Gulf <str<strong>on</strong>g>of</str<strong>on</strong>g> Suetz 85 131 264 383 521 745 <strong>86</strong>1 0.9971<br />
5.7000<br />
1.8459<br />
0.8720<br />
Syrian 83 132 279 416 577 845 987 0.9943<br />
5.8045<br />
1.7244<br />
0.9070<br />
Light Iranian 72 113 233 341 466 671 777 0.9952<br />
4.5133<br />
1.8177<br />
0.8510<br />
Light Arabian 81 122 237 337 451 633 725 0.9991<br />
4.9749<br />
1.9582<br />
0.8560<br />
Heavy Iranian 61 103 235 362 517 782 924 0.9935<br />
4.0660<br />
1.5941<br />
0.<strong>86</strong>30<br />
Arabian AMCO 79 122 249 362 494 708 819 0.9998<br />
5.0982<br />
1.8334<br />
0.8710<br />
Light Syrian 75 116 238 347 473 679 7<strong>86</strong> 0.9851<br />
4.70<strong>86</strong><br />
1.8302<br />
0.8400<br />
Kuwaitian 75 118 245 360 494 715 830 0.9996<br />
4.8492<br />
1.7908<br />
0.<strong>86</strong>80<br />
Iraqi 54 91 207 320 455 688 812 0.9977<br />
3.3937<br />
1.6072<br />
0.8400<br />
Light Siberrian 56 95 217 335 479 725 857 0.9897<br />
3.6174<br />
1.5952<br />
0.8432<br />
Zaikinski 36 64 157 248 361 557 664 0.9808<br />
2.1903<br />
1.5324<br />
0.7925<br />
Tengiz 44 70 150 221 304 440 511 0.9972<br />
2.1157<br />
1.8098<br />
0.7930<br />
Heavy Ural 97 146 2<strong>86</strong> 409 550 776 892 0.9994<br />
6.8894<br />
1.9163<br />
0.8920<br />
Ural + Oil Residue 102 153 295 419 559 783 898 0.9993<br />
7.4871<br />
1.9568<br />
0.8727<br />
Kumkol 50 84 189 290 411 616 725 0.9874<br />
2.9872<br />
1.6396<br />
0.8204<br />
Ural 82 126 255 371 503 720 831 0.9971<br />
5.3948<br />
1.8501<br />
0.8557<br />
REM 90 135 262 373 499 700 803 0.9950<br />
5.9776<br />
1.9518<br />
0.8700<br />
Light Azerski 62 99 207 305 420 610 708 0.9979<br />
3.6369<br />
1.7852<br />
0.8420<br />
REBCO 02.12.09 91 136 262 372 497 695 796 0.9917<br />
6.0659<br />
1.9704<br />
0.8748<br />
REBCO 30.11.09 93 137 261 368 488 678 774 0.9923<br />
6.1652<br />
2.0131<br />
0.8715<br />
REBCO 10.11.09 93 136 255 357 469 647 736 0.9909<br />
6.0474<br />
2.0663<br />
0.<strong>86</strong>90<br />
Average Blend Sept. 88 133 260 371 506 703 807 0.9982<br />
5.8125<br />
1.9271<br />
0.<strong>86</strong>60<br />
2007 Average Blend Oct.<br />
87 131 257 366 491 690 792 0.99<strong>86</strong><br />
5.7242<br />
1.9399<br />
0.<strong>86</strong>36<br />
2007 Average Blend Apr.<br />
91 137 265 376 502 703 806 0.9972<br />
6.1280<br />
1.9619<br />
0.<strong>86</strong>58<br />
2006 Average Blend May<br />
89 135 263 376 504 710 816 0.9985<br />
5.9697<br />
1.9312<br />
0.<strong>86</strong>80<br />
2006 Average Blend June 88 133 261 374 503 709 815 0.9988<br />
5.8582<br />
1.9216<br />
0.<strong>86</strong>70<br />
2006 Average Blend July<br />
84 129 258 373 505 719 829 0.9950<br />
5.5543<br />
1.8702<br />
0.<strong>86</strong>78<br />
2006 Average Blend Sept. 95 140 262 366 482 665 757 0.9948<br />
6.3620<br />
2.0626<br />
0.<strong>86</strong>78<br />
2006<br />
2 8 7 8
Table 5 <strong>ASTM</strong> D-<strong>86</strong> distillati<strong>on</strong> data <str<strong>on</strong>g>of</str<strong>on</strong>g> the <str<strong>on</strong>g>crude</str<strong>on</strong>g> <str<strong>on</strong>g>oils</str<strong>on</strong>g> under study<br />
A. Nedelchev, D. Stratiev, A.Ivanov, G. Stoilov/Petroleum & Coal, 53(4) 275-290, 011 285<br />
Crude Oil Sample IBP, ºC 5%, ºC 10%, ºC 30%, ºC 50%, ºC 70%, ºC 90%, ºC 95%, ºC R² AT BT Tunesian 62.0 125 159 266 367 488 694 804 0.9947 2.0310 1.6455<br />
Tuapse 40.0 74 101 200 312 462 746 910 0.99<strong>86</strong> 1.5188 1.2577<br />
Buzachinmski 60.0 113 151 288 436 630 991 1195 0.9751 2.2415 1.3242<br />
Libyan1 61.0 118 156 283 414 579 875 1038 0.9872 2.2370 1.4355<br />
Libyan2 40.0 79 107 205 310 447 698 839 0.9973 1.5987 1.3510<br />
Gulf <str<strong>on</strong>g>of</str<strong>on</strong>g> Suetz 61.0 96 125 234 361 533 <strong>86</strong>4 1058 0.9975 1.5365 1.2167<br />
Syrian 55.0 88 121 272 470 767 1394 1787 0.9982 1.8817 1.0249<br />
Light Iranian 33.0 74 103 205 313 453 709 854 0.9956 1.7393 1.3613<br />
Light Arabian 30.0 88 118 211 298 402 576 668 0.9962 1.9856 1.6909<br />
Heavy Iranian 46.0 80 107 210 329 489 797 976 0.9994 1.5258 1.2285<br />
Arabian AMCO 51.0 85 113 229 366 557 935 1159 0.9974 1.6233 1.1633<br />
Light Syrian 30.0 <strong>86</strong> 118 216 309 423 615 718 0.9995 2.0544 1.6252<br />
Kuwaitian 30.0 77 108 218 332 478 741 888 0.9996 2.0048 1.3994<br />
Iraqi 44.0 80 105 194 290 415 645 774 0.9984 1.3819 1.3464<br />
Light Siberrian 28.0 78 107 200 291 401 590 693 0.9927 1.8311 1.5755<br />
Zaikinski 40.0 82 113 222 339 492 775 935 0.9970 1.8076 1.3342<br />
Tengiz 35.0 77 108 226 357 533 <strong>86</strong>4 1055 0.9985 1.9420 1.2711<br />
Heavy Ural 50.0 89 123 260 425 656 1116 1391 0.9955 1.9658 1.14<strong>86</strong><br />
Ural + Oil Residue 47.0 85 119 261 435 683 1182 1483 0.9937 2.0027 1.1188<br />
Kumkol 50.0 79 104 202 317 477 791 977 0.9938 1.3566 1.1762<br />
Ural 51.0 81 108 221 358 555 951 1190 0.9909 1.5198 1.1178<br />
REM 47.0 93 124 233 346 492 756 904 0.9985 1.8309 1.3926<br />
Light Azerski 60.0 71 <strong>86</strong> 165 285 482 947 1259 0.9897 0.8934 0.8740<br />
REBCO 02.12.09 53.0 100 131 234 340 474 712 844 0.9979 1.7322 1.4438<br />
REBCO 30.11.09 30.0 99 135 244 346 467 669 776 0.9970 2.6454 1.7065<br />
REBCO 10.11.09 25.0 <strong>86</strong> 122 239 354 495 739 871 0.9978 2.6001 1.5489<br />
Average Blend Sept. 2007 62.0 106 136 240 349 490 746 889 0.9969 1.6127 1.3837<br />
Average Blend Oct. 2007 60.0 108 139 248 360 502 758 900 0.9993 1.7620 1.4194<br />
Average Blend Apr. 2006 51.0 98 127 224 321 443 657 775 0.9929 1.6335 1.4850<br />
Average Blend May 2006 53.0 91 123 246 389 585 967 1192 0.9928 1.7925 1.1992<br />
Average Blend June 2006 47.0 91 124 244 376 551 877 1064 0.9924 1.9437 1.2987<br />
Average Blend July 2006 58.0 100 130 240 359 515 805 969 0.9973 1.6822 1.3222<br />
Average Blend Sept. 2006 62.0 106 136 240 350 491 747 890 0.9966 1.6208 1.3<strong>86</strong>4
Table 6 <strong>TBP</strong> distillati<strong>on</strong> data (vol.%) <str<strong>on</strong>g>of</str<strong>on</strong>g> the <str<strong>on</strong>g>crude</str<strong>on</strong>g> <str<strong>on</strong>g>oils</str<strong>on</strong>g> under study<br />
A. Nedelchev, D. Stratiev, A.Ivanov, G. Stoilov/Petroleum & Coal, 53(4) 275-290, 011 2<strong>86</strong><br />
Crude Oil Sample 5%, ºC 10%, ºC 30%, ºC 50%, ºC 70%, ºC 90%, ºC 95%, ºC R² AT BT<br />
Tunesian 80 123 246 356 482 685 790 1.0000 5.1384 1.8779<br />
Tuapse 64 100 205 298 406 581 671 1.0000 3.6644 1.8525<br />
Buzachinmski 104 152 282 391 513 704 799 0.9996 7.4595 2.0921<br />
Libyan1 92 139 268 381 509 713 817 1.0000 6.2917 1.9608<br />
Libyan2 37 67 167 267 392 612 732 1.0000 2.3729 1.4928<br />
Gulf <str<strong>on</strong>g>of</str<strong>on</strong>g> Suetz 73 115 241 356 490 712 827 1.0000 4.6798 1.7734<br />
Syrian 70 114 251 380 534 795 933 0.9999 4.7000 1.6628<br />
Light Iranian 62 100 212 316 439 642 748 1.0000 3.7380 1.7434<br />
Light Arabian 71 110 219 316 427 607 699 1.0000 4.1985 1.8936<br />
Heavy Iranian 50 88 209 329 477 735 875 1.0000 3.3067 1.5298<br />
Arabian AMCO 68 108 227 336 464 675 7<strong>86</strong> 1.0000 4.2019 1.7627<br />
Light Syrian 64 103 217 322 446 649 756 1.0000 3.9014 1.7581<br />
Kuwaitian 64 103 222 333 464 683 798 1.0000 3.9778 1.7153<br />
Iraqi 45 78 1<strong>86</strong> 292 422 647 769 1.0000 2.8213 1.5506<br />
Light Siberrian 46 81 194 305 443 682 812 1.0000 2.97<strong>86</strong> 1.5347<br />
Zaikinski 29 55 141 227 335 525 629 1.0000 1.<strong>86</strong>72 1.4815<br />
Tengiz 39 64 140 209 290 423 492 0.9999 1.8922 1.7721<br />
Heavy Ural 83 129 262 380 518 741 857 1.0000 5.5911 1.8392<br />
Ural + Oil Residue 89 136 270 390 527 749 <strong>86</strong>3 1.0000 6.0835 1.8801<br />
Kumkol 42 73 171 267 383 583 691 1.0000 2.5227 1.5818<br />
Ural 70 111 233 344 474 688 800 1.0000 4.4260 1.7749<br />
REM 79 121 241 349 472 671 773 1.0000 4.9609 1.8808<br />
Light Azerski 53 87 188 281 392 576 673 0.9991 3.0262 1.7241<br />
REBCO 02.12.09 79 122 242 348 470 667 768 1.0000 5.0154 1.8950<br />
REBCO 30.11.09 82 124 242 346 463 651 748 1.0000 5.1327 1.9410<br />
REBCO 10.11.09 82 123 237 336 447 624 713 1.0000 5.0744 1.9924<br />
Average Blend Sept. 2007 75 117 238 347 472 677 783 1.0000 4.7382 1.8389<br />
Average Blend Oct. 2007 75 117 236 342 465 664 767 1.0000 4.7031 1.8570<br />
Average Blend Apr. 2006 79 122 244 352 475 676 779 1.0000 5.0436 1.8825<br />
Average Blend May 2006 73 115 238 351 482 697 810 0.9991 4.6220 1.7879<br />
Average Blend June 2006 75 116 239 349 477 6<strong>86</strong> 794 0.9999 4.7156 1.8205<br />
Average Blend July 2006 73 114 235 344 472 680 789 0.9999 4.5539 1.8064<br />
Average Blend Sept. 2006 84 126 243 345 459 642 434 1.0000 5.2928 1.9829
Table 7 Edmister c<strong>on</strong>versi<strong>on</strong> data for transforming <str<strong>on</strong>g>of</str<strong>on</strong>g> <strong>ASTM</strong> D-<strong>86</strong> into <strong>TBP</strong><br />
A. Nedelchev, D. Stratiev, A.Ivanov, G. Stoilov/Petroleum & Coal, 53(4) 275-290, 011 287<br />
Segment <str<strong>on</strong>g>of</str<strong>on</strong>g> Destillati<strong>on</strong> Curve, Volume Percent D-<strong>86</strong> 50% to <strong>TBP</strong> 50%<br />
0 to 10% 10 to 30% 30 - 50% 50 - 70% 70 - 90% 90 to 100%<br />
D-<strong>86</strong> 50% ºF <strong>TBP</strong> 50% ºF<br />
D-<strong>86</strong> ºF <strong>TBP</strong> ºF D-<strong>86</strong> ºF <strong>TBP</strong> ºF D-<strong>86</strong> ºF <strong>TBP</strong> ºF D-<strong>86</strong> ºF <strong>TBP</strong> ºF D-<strong>86</strong> ºF <strong>TBP</strong> ºF D-<strong>86</strong> ºF <strong>TBP</strong> ºF<br />
0.27 0.27 0.27 0.55 0.27 0.27 0.55 1.09 0.28 0.82 0.55 1.09 101.70 -9.87<br />
1.37 4.37 2.74 4.64 1.99 4.89 3.58 8.16 4.13 7.34 6.32 7.61 141.50 -8.75<br />
3.01 8.19 5.21 11.74 5.78 13.05 3.30 7.07 12.10 17.66 14.29 16.30 199.15 -7.62<br />
6.03 13.92 10.14 20.74 10.45 18.21 7.97 12.50 17.87 25.00 22.26 26.08 258.17 -5.66<br />
8.49 19.65 16.71 31.93 13.75 23.92 20.89 31.52 23.09 30.43 30.23 33.41 310.33 -4.26<br />
11.23 25.11 21.10 38.76 18.70 30.44 29.14 42.12 28.31 36.95 36.00 39.66 359.75 -2.32<br />
14.52 30.29 26.03 46.13 22.55 36.69 33.54 46.74 32.98 41.30 41.77 44.82 416.04 -0.10<br />
18.08 36.57 29.59 51.04 27.22 42.94 38.21 52.99 39.03 48.09 46.16 50.25 464.10 2.11<br />
22.19 42.85 33.15 56.50 31.62 48.10 45.35 59.50 43.97 54.07 51.11 54.87 501.18 4.05<br />
27.12 49.95 38.36 62.24 36.02 53.81 53.32 67.65 51.12 61.40 55.23 60.31 553.37 7.35<br />
30.96 55.14 42.74 66.61 40.14 58.70 58.82 73.36 59.36 69.00 59.08 63.84 595.95 10.37<br />
35.07 60.33 46.85 72.07 44.53 63.04 64.<strong>86</strong> 79.88 64.30 73.08 65.12 70.90 631.67 13.38<br />
39.73 66.61 50.69 75.90 48.93 67.12 71.45 85.31 69.52 78.51 69.52 75.24 685.26 18.31<br />
43.56 71.79 54.52 80.26 55.52 73.91 77.22 90.47 76.12 85.30 73.37 81.50 725.13 22.96<br />
47.12 76.44 58.90 84.09 60.47 78.79 87.11 98.88 83.26 91.27 78.04 88.83 755.39 27.33<br />
50.69 81.35 63.01 88.19 65.14 83.41 92.88 104.59 90.95 98.88 82.99 96.44 787.03 32.51<br />
56.16 87.90 68.49 92.29 69.81 87.49 99.20 110.02 96.45 102.68 85.74 101.88 818.68 38.23<br />
61.10 93.09 72.05 95.84 74.48 91.83 105.79 116.54 98.92 105.94 89.32 108.40 847.60 44.50<br />
66.03 99.65 75.34 98.57 80.25 96.99 113.76 123.60 104.69 111.10 92.34 114.38 <strong>86</strong>9.64 49.67<br />
70.41 105.65 75.34 98.84 85.47 102.42 120.35 129.84 111.01 117.35 94.82 119.82 897.23 58.37<br />
75.62 111.39 90.14 111.68 91.24 106.77 125.30 134.73 118.70 124.68 97.02 125.80<br />
81.37 117.94 94.25 115.23 95.36 110.84 131.07 140.17 125.57 131.47<br />
85.21 123.40 97.81 117.42 103.60 118.17 135.46 145.05 130.24 135.81<br />
89.04 128.04 102.47 122.06 108.54 122.52 140.68 149.40 137.11 143.96<br />
106.85 125.62 114.59 127.95 144.81 154.56 142.60 148.85<br />
110.41 128.90 120.63 133.38 150.58 161.08 147.00 153.47<br />
114.79 132.45 127.23 139.90 157.72 167.33 150.30 156.73<br />
119.45 137.09 131.35 143.43 162.39 173.85 153.87 160.80<br />
124.93 141.74 137.12 149.68 167.62 182.00 156.34 163.79
Table 10 <strong>ASTM</strong> D-<strong>86</strong> to <strong>TBP</strong> volume fracti<strong>on</strong> according to Riazi-Daubert C<strong>on</strong>versi<strong>on</strong> Method<br />
A. Nedelchev, D. Stratiev, A.Ivanov, G. Stoilov/Petroleum & Coal, 53(4) 275-290, 011 288<br />
10%, ºC 30%, ºC 50%, ºC 70%, ºC 90%, ºC 95%, ºC<br />
Crude Oil Sample<br />
Δ abs Δ abs Δ abs Δ abs Δ abs Δ abs<br />
Tunesian 17 11 11 13 27 65<br />
Tuapse 15 14 13 62 185 300<br />
Buzachinmski 20 3 46 130 317 483<br />
Libyan1 2 6 34 81 187 293<br />
Libyan2 24 29 42 61 105 161<br />
Gulf <str<strong>on</strong>g>of</str<strong>on</strong>g> Suetz 8 16 5 52 177 305<br />
Syrian 10 12 92 252 647 1003<br />
Light Iranian 13 16 4 20 <strong>86</strong> 162<br />
Light Arabian 9 17 19 21 17 9<br />
Heavy Iranian 3 8 1 19 84 167<br />
Arabian AMCO 12 7 30 103 288 457<br />
Light Syrian 2 10 14 18 19 6<br />
Kuwaitian 11 13 2 21 78 149<br />
Iraqi 11 1 3 2 15 54<br />
Light Siberrian 10 3 15 38 77 77<br />
Zaikinski 41 72 112 164 271 369<br />
Tengiz 28 77 148 252 466 637<br />
Heavy Ural 23 11 46 152 411 641<br />
Ural + Oil Residue 34 18 46 171 471 736<br />
Kumkol 15 22 49 101 230 353<br />
Ural 19 21 14 91 292 477<br />
REM 15 17 3 27 106 191<br />
Light Azerski 16 32 3 97 399 679<br />
REBCO 02.12.09 9 17 8 11 64 131<br />
REBCO 30.11.09 7 7 0 10 35 77<br />
REBCO 10.11.09 18 7 18 55 135 215<br />
Average Blend Sept. 2007 1 7 2 25 89 165<br />
Average Blend Oct. 2007 4 3 18 45 115 193<br />
Average Blend Apr. 2006 13 29 32 27 2 45<br />
Average Blend May 2006 9 1 38 114 299 469<br />
Average Blend June 2006 10 4 27 84 217 345<br />
Average Blend July 2006 2 4 15 51 148 246<br />
Average Blend Sept. 2006 8 12 5 39 125 515<br />
Abs. average deviati<strong>on</strong>, 0 C 13 16 28 73 187 308
Table 11 <strong>ASTM</strong> D-<strong>86</strong> to <strong>TBP</strong> volume fracti<strong>on</strong> according to Daubert C<strong>on</strong>versi<strong>on</strong> Method<br />
A. Nedelchev, D. Stratiev, A.Ivanov, G. Stoilov/Petroleum & Coal, 53(4) 275-290, 011 289<br />
10%, ºC 30%, ºC 50%, ºC 70%, ºC 90%, ºC 95%, ºC<br />
Crude Oil Sample<br />
Δ abs Δ abs Δ abs Δ abs Δ abs Δ abs<br />
Tunesian 30 25 23 13 43 197<br />
Tuapse 8 2 23 54 66 644<br />
Buzachinmski 12 23 62 110 144 1009<br />
Libyan1 23 27 48 70 59 617<br />
Libyan2 29 40 52 56 6 406<br />
Gulf <str<strong>on</strong>g>of</str<strong>on</strong>g> Suetz 8 2 17 38 26 795<br />
Syrian 38 52 109 197 277 2992<br />
Light Iranian 6 4 6 14 16 423<br />
Light Arabian 7 9 10 18 69 95<br />
Heavy Iranian 13 6 10 8 51 582<br />
Arabian AMCO 7 13 42 83 105 1115<br />
Light Syrian 3 1 4 17 81 121<br />
Kuwaitian 1 1 9 14 28 414<br />
Iraqi 12 8 6 5 70 257<br />
Light Siberrian 12 5 6 37 138 41<br />
Zaikinski 53 87 123 155 152 690<br />
Tengiz 45 95 160 237 314 1106<br />
Heavy Ural 10 18 61 120 167 1628<br />
Ural + Oil Residue 3 14 61 134 198 1917<br />
Kumkol 22 35 59 89 92 807<br />
Ural 2 2 26 69 96 1233<br />
REM 2 3 8 21 1 461<br />
Light Azerski 14 20 12 74 162 2010<br />
REBCO 02.12.09 1 4 3 7 26 339<br />
REBCO 30.11.09 4 6 11 10 33 199<br />
REBCO 10.11.09 4 8 30 50 40 417<br />
Average Blend Sept. 2007 12 7 13 20 12 415<br />
Average Blend Oct. 2007 17 18 30 39 14 437<br />
Average Blend Apr. 2006 6 18 21 27 77 207<br />
Average Blend May 2006 14 21 52 93 112 1130<br />
Average Blend June 2006 10 15 40 69 68 791<br />
Average Blend July 2006 13 12 27 42 24 584<br />
Average Blend Sept. 2006 4 2 16 34 24 765<br />
Abs. average deviati<strong>on</strong>, 0 C 13 18 36 61 85 753
Table 12 <strong>ASTM</strong> D-<strong>86</strong> to <strong>TBP</strong> volume fracti<strong>on</strong> according to Edmister C<strong>on</strong>versi<strong>on</strong> Method<br />
A. Nedelchev, D. Stratiev, A.Ivanov, G. Stoilov/Petroleum & Coal, 53(4) 275-290, 011 290<br />
10%, ºC 30%, ºC 50%, ºC 70%, ºC 90%, ºC 95%, ºC<br />
Crude Oil Sample<br />
Δ abs Δ abs Δ abs Δ abs Δ abs Δ abs<br />
Tunesian 21 32 38 83 341 557<br />
Tuapse 26 11 32 192 1152 2135<br />
Buzachinmski 123 35 90 488 2646 4682<br />
Libyan1 51 4 72 282 1362 2311<br />
Libyan2 20 37 60 154 726 1279<br />
Gulf <str<strong>on</strong>g>of</str<strong>on</strong>g> Suetz 36 23 31 273 1852 3554<br />
Syrian 359 220 147 1846 14812 31528<br />
Light Iranian 22 10 15 121 757 1384<br />
Light Arabian 3 2 2 18 141 246<br />
Heavy Iranian 16 10 20 1<strong>86</strong> 1374 2646<br />
Arabian AMCO 67 31 57 427 2925 5677<br />
Light Syrian 1 4 4 33 215 375<br />
Kuwaitian 31 9 20 141 828 1478<br />
Iraqi 14 9 13 64 459 850<br />
Light Siberrian 13 10 1 6 137 275<br />
Zaikinski 21 74 134 307 1241 2130<br />
Tengiz 21 62 173 492 2159 3821<br />
Heavy Ural 184 99 87 808 5584 10944<br />
Ural + Oil Residue 241 138 90 1016 7247 14418<br />
Kumkol 3 22 68 266 1599 3083<br />
Ural 72 47 40 452 3368 6770<br />
REM 28 10 20 149 <strong>86</strong>7 1545<br />
Light Azerski 32 42 18 449 5436 13497<br />
REBCO 02.12.09 11 5 14 101 5<strong>86</strong> 1035<br />
REBCO 30.11.09 11 9 23 77 327 527<br />
REBCO 10.11.09 43 0 43 165 719 1181<br />
Average Blend Sept. 2007 3 4 26 134 767 1364<br />
Average Blend Oct. 2007 5 14 44 158 797 1382<br />
Average Blend Apr. 2006 8 14 12 38 347 638<br />
Average Blend May 2006 83 33 70 474 3058 5848<br />
Average Blend June 2006 58 17 56 322 1831 3343<br />
Average Blend July 2006 20 1 41 207 1207 2171<br />
Average Blend Sept. 2006 12 1 29 148 803 1714<br />
Abs. average deviati<strong>on</strong>, 0 C 50 32 48 305 2051 4072