ChemCom Unit 3: Boiling Point Trends of Alkanes
ChemCom Unit 3: Boiling Point Trends of Alkanes
ChemCom Unit 3: Boiling Point Trends of Alkanes

You also want an ePaper? Increase the reach of your titles
YUMPU automatically turns print PDFs into web optimized ePapers that Google loves.
Name _____________________________ Period _______<br />
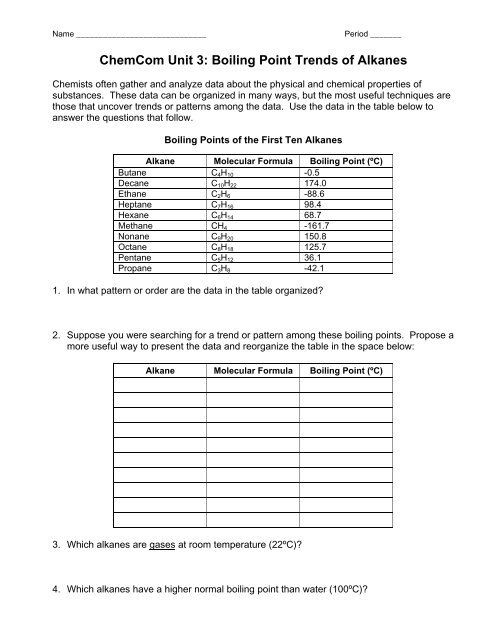
<strong>ChemCom</strong> <strong>Unit</strong> 3: <strong>Boiling</strong> <strong>Point</strong> <strong>Trends</strong> <strong>of</strong> <strong>Alkanes</strong><br />
Chemists <strong>of</strong>ten gather and analyze data about the physical and chemical properties <strong>of</strong><br />
substances. These data can be organized in many ways, but the most useful techniques are<br />
those that uncover trends or patterns among the data. Use the data in the table below to<br />
answer the questions that follow.<br />
<strong>Boiling</strong> <strong>Point</strong>s <strong>of</strong> the First Ten <strong>Alkanes</strong><br />
Alkane Molecular Formula <strong>Boiling</strong> <strong>Point</strong> (ºC)<br />
Butane C4H10 -0.5<br />
Decane C10H22 174.0<br />
Ethane C2H6 -88.6<br />
Heptane C7H16 98.4<br />
Hexane C6H14 68.7<br />
Methane CH4 -161.7<br />
Nonane C9H20 150.8<br />
Octane C8H18 125.7<br />
Pentane C5H12 36.1<br />
Propane C3H8 -42.1<br />
1. In what pattern or order are the data in the table organized?<br />
2. Suppose you were searching for a trend or pattern among these boiling points. Propose a<br />
more useful way to present the data and reorganize the table in the space below:<br />
Alkane Molecular Formula <strong>Boiling</strong> <strong>Point</strong> (ºC)<br />
3. Which alkanes are gases at room temperature (22ºC)?<br />
4. Which alkanes have a higher normal boiling point than water (100ºC)?
5. On a sheet <strong>of</strong> graph paper, prepare a graph <strong>of</strong> boiling point (y-axis) vs. number <strong>of</strong> carbons<br />
(x-axis). The x-axis should range from 1 to 13 carbons and the y-axis should extend from<br />
-200ºC to +250ºC. Choose an appropriate scale so that the whole sheet <strong>of</strong> graph paper is<br />
used. Label your axes and give the graph a descriptive title.<br />
6. Draw a best-fit line through your points. From the graph, estimate the average change in<br />
boiling point (in ºC) when one carbon atom and two hydrogen atoms (CH2) are added to<br />
an alkane chain.<br />
Average change in <strong>Boiling</strong> <strong>Point</strong> = _____________ ºC<br />
7. Using your graph, estimate the boiling points <strong>of</strong> undecane (C11H24), dodecane (C12H26),<br />
and tridecane (C13H28). To do this, continue the trend <strong>of</strong> your graph by drawing a dashed<br />
line from the best fit line you drew for the first 10 alkanes. This is called extrapolation.<br />
Then, read your predicted boiling points on the y-axis:<br />
C11H24 = _____________ C12H26 =_____________ C13H28 =_____________<br />
8. The actual boiling points for undecane, dodecane, and tridecane are listed below. How<br />
do your predicted boiling points compare?<br />
Alkane Molecular Formula <strong>Boiling</strong> <strong>Point</strong> (ºC)<br />
Undecane C11H24 196<br />
Dodecane C12H26 216<br />
Tridecane C13H28 235<br />
9. Intermolecular Forces are the attractive forces between molecules. Out <strong>of</strong> the 13<br />
alkanes discussed in this assignment, which has the strongest intermolecular forces?<br />
Explain your answer carefully.<br />
Don’t forget to attach your graph!