Newfoundland balsam fir and black spruce forests described by the ...
Newfoundland balsam fir and black spruce forests described by the ...
Newfoundland balsam fir and black spruce forests described by the ...

Create successful ePaper yourself
Turn your PDF publications into a flip-book with our unique Google optimized e-Paper software.
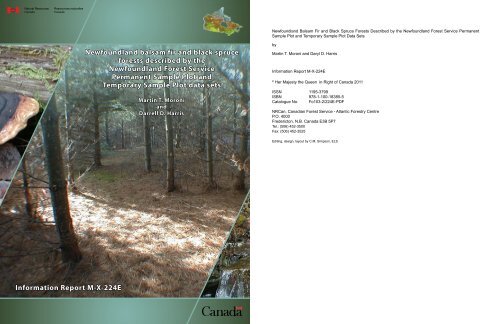
Information Report M-X-224E<br />
<strong>Newfoundl<strong>and</strong></strong> <strong>balsam</strong> <strong>fir</strong> <strong>and</strong> <strong>black</strong> <strong>spruce</strong><br />
<strong>forests</strong> <strong>described</strong> <strong>by</strong> <strong>the</strong><br />
<strong>Newfoundl<strong>and</strong></strong> Forest Service<br />
Permanent Sample Plot <strong>and</strong><br />
Temporary Sample Plot data sets<br />
Martin T. Moroni<br />
<strong>and</strong><br />
Darrell D. Harris<br />
<strong>Newfoundl<strong>and</strong></strong> Balsam Fir <strong>and</strong> Black Spruce Forests Described <strong>by</strong> <strong>the</strong> <strong>Newfoundl<strong>and</strong></strong> Forest Service Permanent<br />
Sample Plot <strong>and</strong> Temporary Sample Plot Data Sets<br />
<strong>by</strong><br />
Martin T. Moroni <strong>and</strong> Daryl D. Harris<br />
Information Report M-X-224E<br />
© Her Majesty <strong>the</strong> Queen in Right of Canada 2011<br />
ISSN 1195-3799<br />
ISBN 978-1-100-18385-5<br />
Catalogue No. Fo103-2/224E-PDF<br />
NRCan, Canadian Forest Service - Atlantic Forestry Centre<br />
P.O. 4000<br />
Fredericton, N.B. Canada E3B 5P7<br />
Tel.: (506) 452-3500<br />
Fax: (506) 452-3525<br />
Editing, design, layout <strong>by</strong> C.M. Simpson, ELS
Moroni <strong>and</strong> Harris (2010) M-X-224E <strong>Newfoundl<strong>and</strong></strong> <strong>balsam</strong> <strong>fir</strong> <strong>and</strong> <strong>black</strong> <strong>spruce</strong> <strong>forests</strong>....<br />
4<br />
Abstract<br />
The <strong>Newfoundl<strong>and</strong></strong> Forest Service (NFS) has collected<br />
extensive data on <strong>the</strong> <strong>forests</strong> of <strong>Newfoundl<strong>and</strong></strong> over <strong>the</strong><br />
past 30 years from intensive measurements of permanent<br />
(PSP) <strong>and</strong> temporary (TSP/TPS) sample plots. The NFS<br />
<strong>and</strong> <strong>the</strong> Canadian Forest Service cooperated to examine<br />
<strong>black</strong> <strong>spruce</strong> (Picea mariana (Mill.) B.S.P.; <strong>spruce</strong>) <strong>and</strong><br />
<strong>balsam</strong> <strong>fir</strong> (Abies <strong>balsam</strong>ea (L.) Mill; <strong>fir</strong>) dominated <strong>forests</strong><br />
<strong>described</strong> <strong>by</strong> <strong>the</strong> NFS PSP <strong>and</strong> TSP/TPS data sets from<br />
<strong>the</strong> central <strong>and</strong> western regions of insular <strong>Newfoundl<strong>and</strong></strong>.<br />
Spruce <strong>forests</strong> tend to be denser (more stems/ha) than <strong>fir</strong><br />
<strong>forests</strong> <strong>and</strong> composed of smaller diameter trees than <strong>fir</strong>.<br />
Fur<strong>the</strong>rmore, <strong>fir</strong> <strong>forests</strong> tend to contain higher densities<br />
of both 19–25 <strong>and</strong> >25 cm diameter-at-breast-height<br />
(dbh) trees. Although <strong>spruce</strong> density was not affected<br />
<strong>by</strong> region, <strong>the</strong> density of >9 cm dbh trees in central <strong>fir</strong><br />
st<strong>and</strong>s tended to rank higher than in western <strong>fir</strong>, but<br />
western <strong>fir</strong> <strong>forests</strong> tended to contain higher densities of<br />
larger trees (19–25, <strong>and</strong> >25 cm dbh). The PSPs were<br />
designed to calibrate <strong>and</strong> validate st<strong>and</strong> growth projection<br />
models, which predict how st<strong>and</strong> structure (diameter<br />
distributions, average st<strong>and</strong> height, density, self thinning)<br />
changes with st<strong>and</strong> development. The PSPs thus target<br />
fully stocked portions of forest st<strong>and</strong>s, avoiding regions<br />
with poor growth, large numbers of non-target species,<br />
<strong>and</strong> gaps. Conversely, TSPs <strong>and</strong> TPSs were designed<br />
to sample average forest conditions to provide structural<br />
descriptions of <strong>Newfoundl<strong>and</strong></strong>’s forest populations. Thus,<br />
PSPs tended to represent denser st<strong>and</strong> conditions with a<br />
greater proportion of <strong>the</strong> dominant species than TSP or<br />
TPS plots. Thus, <strong>the</strong> sampling design for <strong>the</strong> various NFS<br />
sample plots should be considered when <strong>the</strong>y are used<br />
to examine variables or questions o<strong>the</strong>r than those <strong>the</strong>y<br />
were designed to answer.<br />
Résumé<br />
Les mesures intensives menées depuis 30 ans par le<br />
<strong>Newfoundl<strong>and</strong></strong> Forest Service (NFS) dans les placettes<br />
d’échantillonnage permanentes (PEP) et les placettes<br />
d’échantillonnage temporaires (PET/PEPT) lui ont permis<br />
d’amasser d’abondantes données sur les forêts de Terre-<br />
Neuve. Le NFS et le Service canadien des forêts ont uni<br />
leurs efforts pour faire un examen des forêts dominées par<br />
l’épinette noire (Picea mariana (Mill.) B.S.P.; épinette) et<br />
le sapin baumier (Abies <strong>balsam</strong>ea (L.) Mill; sapin) visées<br />
par les séries de données que le NFS a recueillies dans<br />
ses PEP et ses PET/PEPT du centre et de l’ouest de l’île<br />
de Terre-Neuve. Les pessières (forêts d’épinettes) sont<br />
généralement plus denses (tiges/ha) que les sapinières,<br />
et elles sont composées d’arbres de moindre diamètre.<br />
En outre, les sapinières présentaient généralement de<br />
plus gr<strong>and</strong>es densités d’arbres de diamètre à hauteur de<br />
poitrine (DHP) de 19–25 cm ou de >25 cm. La densité<br />
des pessières ne variait pas selon les régions, t<strong>and</strong>is<br />
que les sapinières du centre de la province présentaient<br />
généralement une plus forte densité d’arbres de DHP<br />
>9 cm que les sapinières de l’ouest, même si celles-ci<br />
présentaient généralement une plus forte densité de gros<br />
arbres (DHP de 19–25 cm ou de >25 cm). Les PEP ont été<br />
conçues de façon à permettre l’étalonnage et la validation<br />
de modèles de projection de croissance visant à prédire<br />
l’évolution de la structure des peuplements (distribution<br />
des diamètres, hauteur moyenne du peuplement, densité,<br />
éclaircie naturelle) au fil de leur développement. Ainsi, les<br />
PEP ciblent les portions de peuplement ayant une densité<br />
relative adéquate et évitent les secteurs présentant une<br />
faible croissance, un gr<strong>and</strong> nombre d’essences non ciblées<br />
et des trouées. À l’inverse, les PET et les PEPT ont été<br />
conçues en fonction de conditions forestières moyennes,<br />
pour offrir une description de la structure des populations<br />
forestières de Terre-Neuve. Ainsi, comparativement<br />
aux PET ou aux PEPT, les PEP étaient établies dans<br />
des peuplements généralement plus denses, et les<br />
essences dominantes y étaient proportionnellement plus<br />
nombreuses. C’est pourquoi le plan d’échantillonnage<br />
des diverses placettes d’échantillonnage du NFS doit<br />
être pris en compte lorsqu’on se sert de ces placettes<br />
pour examiner des variables ou des questions autres que<br />
celles pour lesquelles elles ont été conçues.<br />
Introduction<br />
O<br />
ver <strong>the</strong> past 14 years, <strong>the</strong> Government of <strong>Newfoundl<strong>and</strong></strong> <strong>and</strong> Labrador Forest Service (NFS) has<br />
developed a valuable data set based on Permanent Sample Plots (PSP) <strong>and</strong> Temporary Sample Plots<br />
(TSP <strong>and</strong> TPS) that provide information on <strong>the</strong> boreal <strong>forests</strong> covering insular <strong>Newfoundl<strong>and</strong></strong> (hereafter<br />
<strong>Newfoundl<strong>and</strong></strong>). The NFS has used <strong>the</strong>se sample plots to conduct extensive measurements of <strong>the</strong>se <strong>forests</strong> for<br />
diameter, density (stems ha-1 ), <strong>and</strong> species composition. These data are a valuable resource for l<strong>and</strong> managers<br />
interested in a range of disciplines, including wildlife (Smith et al. 2009) <strong>and</strong> carbon cycling (Kurz et al. 2009).<br />
The <strong>Newfoundl<strong>and</strong></strong> boreal forest is dominated <strong>by</strong> <strong>balsam</strong> <strong>fir</strong> (Abies <strong>balsam</strong>ea (L.) Mill.; hereafter <strong>fir</strong>) <strong>and</strong><br />
<strong>black</strong> <strong>spruce</strong> (Picea mariana (Mill.) B.S.P.; hereafter <strong>spruce</strong>) <strong>and</strong> represents <strong>the</strong> eastern extent of <strong>the</strong> Canadian<br />
Boreal Forest Region (Rowe 1972). However, <strong>the</strong>se species have a much wider distribution. In Canada, <strong>fir</strong><br />
extends its range from <strong>Newfoundl<strong>and</strong></strong> <strong>and</strong> Labrador to Alberta <strong>and</strong> is present in <strong>the</strong> nor<strong>the</strong>astern states of <strong>the</strong><br />
USA, including Minnesota, Iowa, Wisconsin, Michigan, New York, <strong>and</strong> many of <strong>the</strong> New Engl<strong>and</strong> states. Black<br />
<strong>spruce</strong> ranges in a broad b<strong>and</strong> from nor<strong>the</strong>rn Massachusetts to nor<strong>the</strong>rn Labrador on <strong>the</strong> Atlantic coast <strong>and</strong><br />
west across Canada to <strong>the</strong> west coast of Alaska (Burns <strong>and</strong> Honkala 1990).<br />
Fir is <strong>the</strong> climax tree species throughout most of <strong>Newfoundl<strong>and</strong></strong>, but its distribution is concentrated in<br />
<strong>the</strong> western portion of <strong>the</strong> isl<strong>and</strong>. This is largely because of <strong>the</strong> prevailing, moisture-laden, westerly winds from<br />
<strong>the</strong> Gulf of St. Lawrence that bring 1.0–1.5 m of annual precipitation to western <strong>Newfoundl<strong>and</strong></strong>, reducing <strong>the</strong><br />
occurrence of <strong>fir</strong>e (Wilton <strong>and</strong> Evans 1974). In contrast, central <strong>Newfoundl<strong>and</strong></strong> is characterized <strong>by</strong> an inl<strong>and</strong>,<br />
quasi-continental climate, with warm dry summers that result in a high <strong>fir</strong>e danger; regular burning has led to<br />
<strong>the</strong> establishment of extensive st<strong>and</strong>s of <strong>spruce</strong> in this region (Wilton <strong>and</strong> Evans 1974).<br />
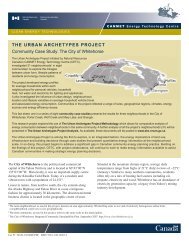
<strong>Newfoundl<strong>and</strong></strong> is divided into four forest management regions: central, western, nor<strong>the</strong>rn (nor<strong>the</strong>rn<br />
peninsula), <strong>and</strong> eastern (Fig. 1). The largest regions, with <strong>the</strong> most sample plots, are <strong>the</strong> western <strong>and</strong> central<br />
regions. Although <strong>fir</strong> is most prevalent in <strong>the</strong> west <strong>and</strong> <strong>spruce</strong> most prevalent in <strong>the</strong> central region, significant<br />
amounts of both species occur in both regions; <strong>fir</strong> dominates <strong>the</strong> nor<strong>the</strong>rn <strong>and</strong> eastern regions. In addition,<br />
diameter distributions of dead trees from PSPs are larger in western than central <strong>Newfoundl<strong>and</strong></strong>, indicating<br />
live diameter distributions are larger in western Newfound<strong>and</strong> (Moroni <strong>and</strong> Harris 2010).<br />
This report examines <strong>black</strong> <strong>spruce</strong> <strong>and</strong> <strong>balsam</strong> <strong>fir</strong> live-tree data sets of <strong>the</strong> NFS PSPs <strong>and</strong> TSPs/<br />
TPSs, focusing on: (1) describing diameter distributions <strong>and</strong> tree species compositions in <strong>the</strong>se <strong>forests</strong>, (2)<br />
comparing diameter distribution <strong>and</strong> species composition between central <strong>and</strong> western NL to determine if<br />
<strong>the</strong>se <strong>forests</strong> vary regionally, <strong>and</strong> (3) comparing <strong>black</strong> <strong>spruce</strong> <strong>and</strong> <strong>balsam</strong> <strong>fir</strong> forest diameter distributions <strong>and</strong><br />
species compositions.<br />
5
Moroni <strong>and</strong> Harris (2010) M-X-224E <strong>Newfoundl<strong>and</strong></strong> <strong>balsam</strong> <strong>fir</strong> <strong>and</strong> <strong>black</strong> <strong>spruce</strong> <strong>forests</strong>....<br />
6<br />
14<br />
15<br />
13<br />
16<br />
17<br />
12<br />
9<br />
18<br />
7<br />
Figure 1. Locations of <strong>the</strong> <strong>Newfoundl<strong>and</strong></strong> Forest Service districts <strong>and</strong> regions. Districts are numbered 1 to<br />
18, regions are composed of districts. The central region comprises districts 3–13, <strong>and</strong> <strong>the</strong> western<br />
region comprises districts 14–16. The eastern region is represented <strong>by</strong> districts 1 <strong>and</strong> 2, <strong>and</strong> <strong>the</strong><br />
nor<strong>the</strong>rn region <strong>by</strong> districts 17 <strong>and</strong> 18.<br />
10<br />
11<br />
6<br />
8<br />
4<br />
3<br />
5<br />
2<br />
1<br />
Description of Data Programs<br />
Permanent Sample Plots<br />
Materials <strong>and</strong> Methods<br />
In 1985, <strong>the</strong> NFS implemented a PSP program for <strong>Newfoundl<strong>and</strong></strong> to provide growth data for calibration<br />
<strong>and</strong> validation of st<strong>and</strong>-growth projection models. The initial focus was predominently on immature<br />
st<strong>and</strong> types in natural <strong>and</strong> managed <strong>forests</strong> throughout <strong>Newfoundl<strong>and</strong></strong>. In 1992, <strong>the</strong> program was<br />
exp<strong>and</strong>ed to include st<strong>and</strong>s in all developmental stages (i.e., regenerating, immature, semimature, mature,<br />
<strong>and</strong> overmature) with approximately 1000 PSPs currently established in natural <strong>and</strong> managed st<strong>and</strong>s of all<br />
developmental stages <strong>and</strong> scheduled for remeasurement every 4–5 years. In this report, we examine stem<br />
densities in mature <strong>and</strong> older (>60-year-old) <strong>forests</strong> only.<br />
The exp<strong>and</strong>ed PSP program was designed to examine <strong>the</strong> eight major softwood-producing st<strong>and</strong><br />
types in <strong>Newfoundl<strong>and</strong></strong>. These eight major st<strong>and</strong> types were distinguished on <strong>the</strong> basis of development<br />
stage (or age class) <strong>and</strong> management status (Vanguard Forest Management Services 1992). Each st<strong>and</strong> type<br />
was ranked for sampling based on relative importance to commercial timber supply <strong>and</strong> level of financial<br />
investment. For example, precommercially thinned st<strong>and</strong>s received a very high sampling priority because<br />
<strong>the</strong>y contribute significantly to wood supply <strong>and</strong> have received substantial financial investment.<br />
The allocation of plots within <strong>the</strong> eight major st<strong>and</strong> types was based on two main criteria: <strong>the</strong> sampling<br />
priority assigned to <strong>the</strong> st<strong>and</strong> type <strong>and</strong> <strong>the</strong> inherent variability within each st<strong>and</strong> type. From a list of potential<br />
PSP locations, st<strong>and</strong>s were selected to ensure <strong>the</strong>y were: characteristic of <strong>the</strong> targeted st<strong>and</strong> type, well<br />
distributed across ecoregion(s) (Meads <strong>and</strong> Moores 1994), <strong>and</strong> not scheduled for management treatment in<br />
<strong>the</strong> near term. Selected st<strong>and</strong>s were verified <strong>by</strong> field crews, <strong>and</strong> if suitable, <strong>the</strong> field crew selected <strong>the</strong> location<br />
for plot establishment to ensure <strong>the</strong> plot would fall wholly within <strong>the</strong> targeted st<strong>and</strong> type.<br />
Following site validation, a path was marked on a bearing from an easily located l<strong>and</strong>mark to <strong>the</strong><br />
selected st<strong>and</strong>. Permanent sample plots form a rectangle, with four corner posts labeled A–D (Fig. 2). Corner<br />
A is established in <strong>the</strong> targeted forest at <strong>the</strong> st<strong>and</strong> end of <strong>the</strong> marked path. Facing into <strong>the</strong> plot, away from<br />
<strong>the</strong> l<strong>and</strong>mark in <strong>the</strong> direction of <strong>the</strong> marked path, Corner D is located 14.00 m on a bearing 90° to <strong>the</strong> right<br />
of Corner A. Corners B <strong>and</strong> C are located on <strong>the</strong> bearing of <strong>the</strong> path from Corners A <strong>and</strong> D, respectively, at<br />
a distance, or plot length, depending on <strong>the</strong> examined st<strong>and</strong> type <strong>and</strong> density. Plot length of mature <strong>and</strong><br />
overmature st<strong>and</strong>s was 28.57 m, creating 0.04-ha plots. Immature <strong>and</strong> semimature st<strong>and</strong> plot length was<br />
determined <strong>by</strong> <strong>the</strong> plot length required to tag a minimum of 75 trees that met minimum tagging criteria;<br />
however, plot size was restricted to seven st<strong>and</strong>ard plot sizes ranging from 0.002 to 0.1 ha. Minimum tagging<br />
criteria varied <strong>by</strong> st<strong>and</strong> development stage. For mature <strong>and</strong> overmature st<strong>and</strong>s, trees with a diameter at breast<br />
height (dbh) ≥8.0 cm were tagged. The dbh of tagged trees drops with st<strong>and</strong> age until <strong>the</strong> st<strong>and</strong> contains<br />
<strong>the</strong> smallest trees considered for tagging that exceed 1.3 m in height. This variable tagging threshold was<br />
developed as a practical response to dealing with <strong>the</strong> wide variability in tree density associated with typical<br />
st<strong>and</strong> development. This report examines <strong>the</strong> density of live trees with dbh >9 cm in >60-year-old st<strong>and</strong>s only.<br />
7
Moroni <strong>and</strong> Harris (2010) M-X-224E <strong>Newfoundl<strong>and</strong></strong> <strong>balsam</strong> <strong>fir</strong> <strong>and</strong> <strong>black</strong> <strong>spruce</strong> <strong>forests</strong>....<br />
8<br />
Corner C Corner D<br />
Corner B<br />
Figure 2. PSP plot layout<br />
Temporary Sample Plots<br />
Plot length<br />
Corner A<br />
L<strong>and</strong>mark<br />
In 1975, <strong>the</strong> NFS began implementing a temporary sample plot program to provide data to develop new<br />
timber volume estimates, <strong>and</strong> refine existing ones, on a district-<strong>by</strong>-district basis (<strong>Newfoundl<strong>and</strong></strong> <strong>and</strong><br />
Labrador Department of Forest Resources <strong>and</strong> Agrifoods 2004b). The initial design was a single, r<strong>and</strong>omly<br />
located, fixed-area plot (referred to as a TSP), which was replaced in 2001 with a line transect point sampling<br />
methodology (referred to as TPS). The new approach provided <strong>the</strong> same basic mensuration data as <strong>the</strong> original<br />
plot design but added information on individual st<strong>and</strong> conditions, exp<strong>and</strong>ing <strong>the</strong> utility of <strong>the</strong> temporary plots<br />
for validating growth <strong>and</strong> yield projections. By 2004, 8271 TSPs/TPSs had been measured in <strong>Newfoundl<strong>and</strong></strong>.<br />
To determine <strong>the</strong> locations of <strong>the</strong>se temporary plots, <strong>the</strong> <strong>forests</strong> of <strong>Newfoundl<strong>and</strong></strong> were stratified <strong>by</strong><br />
observations from aerial photographs that divided <strong>the</strong> productive forest l<strong>and</strong>base on <strong>the</strong> basis of st<strong>and</strong> type,<br />
productivity class, <strong>and</strong> crown density class (<strong>Newfoundl<strong>and</strong></strong> <strong>and</strong> Labrador Department of Forest Resources <strong>and</strong><br />
Agrifoods 2004b). The number of plots <strong>the</strong>n allocated to individual strata was based on <strong>the</strong> area occupied <strong>by</strong><br />
each stratum, commercial importance of <strong>the</strong> stratum, <strong>and</strong> <strong>the</strong> level of variability associated with <strong>the</strong> stratum.<br />
C<strong>and</strong>idate st<strong>and</strong>s were selected for sampling based on accessibility (e.g., slopes 9 cm determined to be within <strong>the</strong> variable area<br />
plot (trees were determined to be in or out based on dbh <strong>and</strong> distance to st<strong>and</strong>ing stem center), were scored<br />
for species, dbh to <strong>the</strong> nearest cm, <strong>and</strong> total tree height (to <strong>the</strong> nearest 0.5 m). A selected number of trees are<br />
aged <strong>by</strong> increment bore (or felling <strong>and</strong> ring count). A minimum of six points to a maximum of 12 points were<br />
established in each st<strong>and</strong>. The distance between points varied depending on <strong>the</strong> size <strong>and</strong> orientation of <strong>the</strong><br />
forest st<strong>and</strong> being measured. The data collected from all points were pooled <strong>and</strong> averaged to produce plot<br />
statistics.<br />
For <strong>the</strong> purposes of this study, <strong>the</strong> TSP/TPS <strong>and</strong> PSP data sets were categorized into subsets to include<br />
only plots that were measured within <strong>the</strong> western <strong>and</strong> central regions, which are <strong>the</strong> largest regions with <strong>the</strong><br />
most sample plots <strong>and</strong> with abundant sample plots of both <strong>fir</strong> <strong>and</strong> <strong>spruce</strong>. In addition, only TSP/TPSs <strong>and</strong> PSPs<br />
located in <strong>the</strong> major st<strong>and</strong> types of <strong>balsam</strong> <strong>fir</strong> or <strong>black</strong> <strong>spruce</strong> were examined. To remove variation in diameter<br />
distributions <strong>and</strong> species associated with immature st<strong>and</strong>s, only sample plots supporting mature <strong>forests</strong> (>60<br />
years average age) were examined here. PSPs <strong>and</strong> TSP/TPSs contain o<strong>the</strong>r data than is <strong>described</strong> here, such as<br />
dead wood in PSPs, <strong>and</strong> both record
Moroni <strong>and</strong> Harris (2010) M-X-224E <strong>Newfoundl<strong>and</strong></strong> <strong>balsam</strong> <strong>fir</strong> <strong>and</strong> <strong>black</strong> <strong>spruce</strong> <strong>forests</strong>....<br />
10<br />
Results<br />
By far <strong>the</strong> most abundant plot type measured <strong>by</strong> <strong>the</strong> NFS that met our subset requirements was <strong>the</strong><br />
fixed area pre-2001 TSPs, with 263–2030 plots per species <strong>and</strong> region combination (Table 1). These<br />
TSPs were relatively evenly distributed in <strong>fir</strong>-dominated st<strong>and</strong>s between <strong>the</strong> central <strong>and</strong> western<br />
regions but, in <strong>spruce</strong>-dominated st<strong>and</strong>s, were far more common in <strong>the</strong> central region, where <strong>spruce</strong> is <strong>the</strong><br />
dominant forest type. The TPS plots were limited to ≤30 plots per species <strong>and</strong> region combination in all but<br />
<strong>the</strong> <strong>fir</strong>-dominated st<strong>and</strong>s in <strong>the</strong> central region, which contained 144 plots (Table 1). The PSPs were dominated<br />
<strong>by</strong> <strong>fir</strong>-dominated st<strong>and</strong>s in <strong>the</strong> western regions (n = 71 vs. 24 in <strong>the</strong> central region) <strong>and</strong> <strong>spruce</strong>-dominated<br />
st<strong>and</strong>s in <strong>the</strong> central region (n = 116 vs. 16 in <strong>the</strong> western region; Table 1). Due to <strong>the</strong> low numbers of TPS plots,<br />
emphasis will be placed on TSP data for fur<strong>the</strong>r discussion <strong>and</strong> comparison with <strong>the</strong> PSP data set.<br />
Tree densities <strong>and</strong> diameter distributions (>9cm dbh only)<br />
Densities of >9 cm dbh stems ranked PSP > TSP > TPS for all species <strong>and</strong> region combinations except for<br />
<strong>fir</strong>-dominated st<strong>and</strong>s in <strong>the</strong> western region where <strong>the</strong> ranking was PSP > TPS > TSP (Table 1).<br />
Although both TSPs <strong>and</strong> PSPs rank >9 cm dbh tree density as <strong>spruce</strong> > <strong>fir</strong> in both central <strong>and</strong> western<br />
regions, both TSPs <strong>and</strong> PSPs indicated <strong>the</strong> abundance of 19–25 cm dbh <strong>and</strong> >25cm dbh trees to be higher<br />
in <strong>fir</strong>-dominated <strong>forests</strong> than in <strong>spruce</strong>-dominated <strong>forests</strong> in both regions (Table 1). In contrast, densities of<br />
>9–19 cm dbh trees were higher in <strong>spruce</strong>-dominated <strong>forests</strong> than in <strong>fir</strong>-dominated <strong>forests</strong> for both regions.<br />
The density of all trees with >9 cm dbh ranked higher (8%–12%) in <strong>the</strong> central region for <strong>fir</strong>-dominated<br />
<strong>forests</strong> in both TSPs <strong>and</strong> PSPs (Table 1). In addition, both TSPs <strong>and</strong> PSPs indicate <strong>the</strong> density of 19–25 cm dbh<br />
trees <strong>and</strong> >25 cm dbh trees in <strong>fir</strong>-dominated <strong>forests</strong> in <strong>the</strong> western region to be larger than in <strong>the</strong> central region.<br />
The density of 19–25 cm dbh trees in <strong>fir</strong>-dominated <strong>forests</strong> in <strong>the</strong> western region was 1.4 times densities in <strong>the</strong><br />
central region, <strong>and</strong> <strong>the</strong> density of >25 cm dbh trees in <strong>fir</strong>-dominated <strong>forests</strong> in <strong>the</strong> western region was 1.8–3.6<br />
times <strong>the</strong> densities in <strong>the</strong> central region. However, <strong>the</strong> density of 9–19 cm dbh trees in <strong>fir</strong>-dominated <strong>forests</strong><br />
in <strong>the</strong> western region was 0.7–0.8 times <strong>the</strong> densities in <strong>the</strong> central region.<br />
Although TSPs ranked >9 cm dbh tree density in <strong>spruce</strong>-dominated <strong>forests</strong> in <strong>the</strong> central region above<br />
densities in <strong>the</strong> western region, PSPs indicated <strong>the</strong> opposite ranking (Table 1). In addition, TSPs ranked <strong>the</strong><br />
density of 19–25 cm dbh <strong>and</strong> >25cm dbh trees in <strong>spruce</strong>-dominated <strong>forests</strong> from <strong>the</strong> western region above<br />
densities in <strong>the</strong> central region, but ranked densities of 9–19 cm dbh trees in <strong>spruce</strong>-dominated <strong>forests</strong> of <strong>the</strong><br />
western region below densities in <strong>the</strong> central region; with PSPs indicating <strong>the</strong> opposite for all dbh classes.<br />
However, <strong>the</strong> density of >25 cm dbh trees in <strong>spruce</strong>-dominated <strong>forests</strong> was low, <strong>and</strong> st<strong>and</strong>ard deviations of<br />
<strong>the</strong>se means were large.<br />
St<strong>and</strong>ard deviations for <strong>the</strong> density of larger diameter stems (19–25 cm dbh) were large compared<br />
with <strong>the</strong> mean (Table 1). This is partially attributed to <strong>the</strong> inclusion of data from all plots, including those that<br />
did not have any larger diameter stems.<br />
Tree species assemblages<br />
Not surprisingly, <strong>the</strong> dominant species in all plots was <strong>the</strong> species defining <strong>the</strong> St<strong>and</strong> Type (ei<strong>the</strong>r <strong>fir</strong> or<br />
<strong>spruce</strong>) sampled (Table 2). However, <strong>the</strong>re was a trend for PSPs to be populated with a larger proportion<br />
of stems of <strong>the</strong> dominant species. For both <strong>fir</strong>- <strong>and</strong> <strong>spruce</strong>-dominated <strong>forests</strong>, <strong>the</strong> second most<br />
Table 1. Average density of live stems per hectare <strong>by</strong> diameter range recorded for mature (>60-year-old)<br />
<strong>balsam</strong> <strong>fir</strong> <strong>and</strong> <strong>black</strong> <strong>spruce</strong> in <strong>the</strong> central <strong>and</strong> western regions of <strong>Newfoundl<strong>and</strong></strong> within PSP, TSP <strong>and</strong><br />
TPS plots. St<strong>and</strong>ard deviations in paren<strong>the</strong>ses<br />
Forest, region,<br />
<strong>and</strong> plot type<br />
Number of<br />
TSPs<br />
Stem diameter range (cm)<br />
9–19 19–25 >25 Total >9<br />
Balsam Fir<br />
Central Region<br />
TSP 991 119 (670) 175 (135) 60 (79) 1355 (652)<br />
TPS 3 897 (622) 121 (78) 46 (76) 1064 (501)<br />
PSP 24 1647 (804) 163 (117) 32 (72) 1842 (747)<br />
Western Region<br />
TSP 907 907 (579) 240 (148) 107 (109) 1253 (562)<br />
TPS 144 1127 (545) 195 (111) 61 (56) 1383 (526)<br />
PSP 71 1193 (896) 226 (145) 116 (119) 1535 (765)<br />
Black Spruce<br />
Central Region<br />
TSP 2030 1516 (832) 124 (136) 20 (46) 1660 (798)<br />
TPS 25 1076 (365) 143 (83) 35 (31) 1254 (353)<br />
PSP 116 1749 (681) 138 (139) 17 (34) 1903 (636)<br />
Western Region<br />
TSP 263 1249 (725) 138 (124) 28 (50) 1415 (704)<br />
TPS 30 1049 (458) 101 (64) 19 (19) 1169 (458)<br />
PSP 16 2198 (1011) 94 (86) 13 (24) 2305 (942)<br />
abundant species recorded in <strong>the</strong> PSPs <strong>and</strong> TSPs was clearly <strong>the</strong> o<strong>the</strong>r softwood species, except for western<br />
NL <strong>fir</strong> PSPs, in which <strong>the</strong> abundance of white birch (Betula papyrifera) ranked just above <strong>black</strong> <strong>spruce</strong>. The only<br />
o<strong>the</strong>r species with an average >25 stems/ha were white birch in both <strong>fir</strong>- <strong>and</strong> <strong>spruce</strong>-dominated <strong>forests</strong>, <strong>and</strong><br />
white <strong>spruce</strong> (Picea glauca) in <strong>fir</strong> <strong>forests</strong>. White birch abundance in <strong>fir</strong>-dominated <strong>forests</strong> was similar in <strong>the</strong><br />
western <strong>and</strong> central regions (67–76 stems/ha), whereas white birch was more abundant in <strong>spruce</strong>-dominated<br />
<strong>forests</strong> in <strong>the</strong> central region.<br />
Densities were low (0 stems/ha<br />
in <strong>the</strong> western region (9 stems/ha; Table 2). Poplar species density in <strong>spruce</strong>-dominated <strong>forests</strong> (0–12 stems/<br />
ha) ranked above densities in <strong>fir</strong>-dominated <strong>forests</strong> (0–4 stems/ha) <strong>and</strong> trembling larch densities in <strong>spruce</strong>dominated<br />
<strong>forests</strong> (3–24 stems/ha) ranked above densities in <strong>fir</strong>-dominated <strong>forests</strong> (0–6 stems/ha). White<br />
<strong>spruce</strong> density in <strong>fir</strong>-dominated <strong>forests</strong> (8–50 stems/ha) ranked above densities in <strong>black</strong> <strong>spruce</strong>-dominated<br />
<strong>forests</strong> (1–13 stems/ha). Notably, white pine occurred in <strong>fir</strong>- <strong>and</strong> <strong>spruce</strong>-dominated <strong>forests</strong> in low abundances<br />
(≤1 stem/ha) in both <strong>the</strong> central <strong>and</strong> western regions.<br />
11
Moroni <strong>and</strong> Harris (2010) M-X-224E <strong>Newfoundl<strong>and</strong></strong> <strong>balsam</strong> <strong>fir</strong> <strong>and</strong> <strong>black</strong> <strong>spruce</strong> <strong>forests</strong>....<br />
12<br />
Table 2. Average density of live stems ha -1 recorded for individual species in mature (>60-year-old) <strong>balsam</strong> <strong>fir</strong> <strong>and</strong> <strong>black</strong> <strong>spruce</strong> located in <strong>the</strong> central <strong>and</strong> western regions of <strong>Newfoundl<strong>and</strong></strong> within<br />
PSP, TSP, <strong>and</strong> TPS plots. St<strong>and</strong>ard deviations in paren<strong>the</strong>ses.<br />
Forest type, region,<br />
<strong>and</strong> plot type<br />
Balsam Fir Black<br />
Spruce<br />
Discussion<br />
White<br />
Spruce<br />
White Birch Trembling<br />
Larch<br />
While <strong>spruce</strong>-dominated <strong>forests</strong> tended to be denser than <strong>fir</strong>-dominated <strong>forests</strong>, <strong>the</strong> former tended<br />
to be composed of smaller diameter trees than <strong>the</strong> latter (Table 1). Fir-dominated <strong>forests</strong> tended to<br />
contain higher densities of both 19–25 <strong>and</strong> >25 cm trees, which are most valuable to wildlife (Smith<br />
et al. 2008); this con<strong>fir</strong>ms <strong>the</strong> finding of Moroni <strong>and</strong> Harris (2010), who reported denser 19–25 <strong>and</strong> >25 cm<br />
dead trees in <strong>fir</strong>-dominated <strong>forests</strong> than in <strong>spruce</strong>-dominated <strong>forests</strong>. However, <strong>the</strong> research of Moroni <strong>and</strong><br />
Harris (2010) was based on PSP data, likely reporting snag abundance higher than <strong>the</strong> average abundances<br />
that would be found on <strong>the</strong> l<strong>and</strong>scape because PSPs target fully stocked portions of <strong>the</strong> l<strong>and</strong>scape only.<br />
Interestingly, <strong>the</strong> density of >9 cm dbh trees in <strong>fir</strong>-dominated <strong>forests</strong> in <strong>the</strong> central region tended to rank lower<br />
than densities in <strong>the</strong> western region, but <strong>fir</strong>-dominated <strong>forests</strong> in <strong>the</strong> western region tended to contain higher<br />
densities of larger trees (19–25 <strong>and</strong> >25 cm dbh); however, <strong>the</strong> st<strong>and</strong>ard deviations of live-tree densities were<br />
large when compared with means (Table 1). This is consistent with higher expected merchantable volumes<br />
of <strong>fir</strong>-dominated <strong>forests</strong> in <strong>the</strong> western region when compared with <strong>the</strong> central region (Meades <strong>and</strong> Moores<br />
1994) as tree volumes are strongly positively correlated with dbh (Smith et al. 2009). Tree densities in <strong>spruce</strong>dominated<br />
<strong>forests</strong> were not affected <strong>by</strong> region (Table 1), with relatively small differences in densities between<br />
<strong>the</strong> central <strong>and</strong> western regions for any diameter range <strong>and</strong> large st<strong>and</strong>ard deviations of estimated tree<br />
densities in <strong>forests</strong> from <strong>the</strong>se regions.<br />
Species<br />
White Pine Poplar sp. Yellow Birch O<strong>the</strong>r<br />
Conifers<br />
O<strong>the</strong>r<br />
Hardwood<br />
Total >9 cm<br />
Balsam Fir<br />
Central<br />
TSP 991 960(634) 310 (376) 8 (35) 69 (106) 2 (19) 0 (5) 4 (31) 1 (15) 0 (0) 2 (17) 1355 (652)<br />
TPS 3 659 (276 357 (298) 11 (19) 37 (55) 0 (0) 0 (0) 0 (0) 0 (0) 0 (0) 0 (0) 1064 (501)<br />
PSP 24 1442 (790) 304 (315) 18 (47) 70 (117) 6 (26) 0 (0) 0(0) 0 (0) n.a. 2 (10) 1842 (747)<br />
Western<br />
TSP 907 966 (556) 189 (257) 27 (69) 67 (86) 2 (37) 0 (6) 0 (0) 0 (5) 0 (0) 2 (13) 1253 (562)<br />
TPS 144 1081 (522) 172 (208) 35 (53) 78 (108) 3 (16) 0 (5) 0 (4) 9 (33) 0 (0) 4 (18) 1383 (526)<br />
PSP 71 1330 (793) 73 (135) 50 (81) 76 (88) 0 (3) 0 (0) 0 (0) 1 (9) n.a. 4 (20) 1535 (765)<br />
Black Spruce<br />
Central<br />
TSP 2030 149 (256) 1421 (850) 2 (24) 49 (106) 24 (79) 1 (7) 10 (45) 0 (10) 0 (0) 4 (28) 1660 (798)<br />
TPS 25 161 (152) 1011 (356) 1 (3) 59 (79) 4 (12) 1 (1) 12 (27) 0 (0) 0 (0) 6 (29) 1254 (353)<br />
PSP 116 116 (201) 1733 (679) 0 (0) 34 (67) 13 (31) 1 (7) 5 (20) 0 (0) n.a. 2 (11) 1903 (636)<br />
Western<br />
TSP 263 356 (320) 1000 (773) 5 (26) 33 (60) 15 (57) 1 (10) 3 (26) 0 (0) 0 (0) 2 (14) 1415 (704)<br />
TPS 30 378 (223) 751 (312) 9 (26) 20 (18) 3 (8) 1 (4) 0 (0) 0 (0) 0 (0) 7 (22) 1169 (458)<br />
PSP 16 118 (245) 2048 (1072) 13 (50) 23 (41) 17 (38) 0 (0) 9 (20) 0 (0) n.a. 6 (19) 2305 (942)<br />
Yellow birch is largely restricted to southwestern <strong>Newfoundl<strong>and</strong></strong> on sites growing in association with<br />
<strong>balsam</strong> <strong>fir</strong> <strong>and</strong>/or o<strong>the</strong>r hardwood-dominated <strong>forests</strong> on rich moist soils (Bearns 1968). Yellow birch was<br />
more common in <strong>fir</strong>-dominated <strong>forests</strong> in this study, likely because <strong>fir</strong>-dominated <strong>forests</strong> are more prevalent<br />
in western <strong>Newfoundl<strong>and</strong></strong> than are <strong>spruce</strong>-dominated <strong>forests</strong>. White pine is located throughout insular<br />
<strong>Newfoundl<strong>and</strong></strong>, except on <strong>the</strong> Great Nor<strong>the</strong>rn Peninsula, most commonly growing with o<strong>the</strong>r conifers (Bearns<br />
1968) as suggested <strong>by</strong> <strong>the</strong> data sets examined, although in low densities (Table 2). Bearns (1968) indicates that<br />
white <strong>spruce</strong> is scattered throughout <strong>Newfoundl<strong>and</strong></strong> in moist, gravelly, well-drained sites in <strong>fir</strong>- <strong>and</strong> <strong>spruce</strong>dominated<br />
<strong>forests</strong>, but <strong>the</strong> data sets examined here ranked white <strong>spruce</strong> density in <strong>fir</strong> above <strong>spruce</strong> (Table<br />
2). Larch tends to favor wet areas in both <strong>fir</strong>- <strong>and</strong> <strong>spruce</strong>-dominated <strong>forests</strong> (Bearns 1968), but <strong>the</strong> data sets<br />
examined ranked larch density in <strong>spruce</strong>-dominated <strong>forests</strong> above densities in <strong>fir</strong>-dominated <strong>forests</strong>. Also,<br />
although Bearns (1968) indicated poplar species occur in rich moist soils preferentially in <strong>fir</strong> <strong>forests</strong>, <strong>the</strong> data<br />
sets examined ranked poplar densities higher in <strong>spruce</strong>-dominated <strong>forests</strong> than in <strong>fir</strong>-dominated <strong>forests</strong> (Table<br />
2).<br />
13
Moroni <strong>and</strong> Harris (2010) M-X-224E <strong>Newfoundl<strong>and</strong></strong> <strong>balsam</strong> <strong>fir</strong> <strong>and</strong> <strong>black</strong> <strong>spruce</strong> <strong>forests</strong>....<br />
14<br />
The PSPs were designed to calibrate <strong>and</strong> validate st<strong>and</strong>-growth projection models, which predict<br />
how st<strong>and</strong> structure (diameter distributions, average st<strong>and</strong> height, density, self thinning) changes with st<strong>and</strong><br />
development. Thus, PSPs targeted fully stocked portions of forest st<strong>and</strong>s identified for plot establishment,<br />
avoiding regions with poor growth, large numbers of non-target species, <strong>and</strong> gaps. Conversely, TSPs <strong>and</strong> TPSs<br />
were designed to sample average conditions of targeted forest st<strong>and</strong>s from strata that are used to characterize<br />
structural descriptions of <strong>Newfoundl<strong>and</strong></strong>’s forest populations. As TPSs sample from multiple points along a<br />
transect running through <strong>the</strong> measured forest’s polygon ra<strong>the</strong>r than one r<strong>and</strong>omly located fixed-area plot, TPS<br />
plots have greater individual utility than individual TSPs. The TPS database will grow in value as it is populated<br />
with observations. It is not surprising that PSPs tended to represent denser st<strong>and</strong>s with a larger proportion<br />
of <strong>the</strong> dominant species than TSP or TPS plots (Tables 1 <strong>and</strong> 2). TSP <strong>and</strong> TPS plots are more representative of<br />
average forest conditions. Lower stem densities in TPS plots compared with densities in TPS plots may be due<br />
to <strong>the</strong> limited distribution of TPS plots because of <strong>the</strong>ir recent implementation. Alternatively, intensive forest<br />
management may have preferentially removed denser st<strong>and</strong>s from <strong>the</strong> l<strong>and</strong>scape, which reduces <strong>the</strong> density<br />
measured in more recently established TPSs compared with longer established TSPs.<br />
The <strong>Newfoundl<strong>and</strong></strong> Forest Service has collected extensive data on <strong>the</strong> <strong>forests</strong> of <strong>Newfoundl<strong>and</strong></strong> in <strong>the</strong><br />
past 20 years from intensive measurements of permanent <strong>and</strong> temporary sample plots. The permanent <strong>and</strong><br />
temporary sample plot programs differ in <strong>the</strong>ir objectives <strong>and</strong> sampling methodologies, with PSPs located<br />
in fully stocked regions of selected st<strong>and</strong>s avoiding st<strong>and</strong> openings <strong>and</strong> TSP/TPSs designed to be more<br />
representative of average forest conditions. Therefore, it was not unexpected that all live <strong>and</strong> dead biomass<br />
measurements in PSPs were greater than for similar measurements in TSPs. In addition, individual TSPs may<br />
not represent <strong>the</strong> average conditions of <strong>the</strong> individual st<strong>and</strong> in which <strong>the</strong>y are measured because a TSP is<br />
measured in a single r<strong>and</strong>om location within a targeted forest polygon, thus average forest conditions require<br />
data from multiple TSPs. Thus, <strong>the</strong> nature of <strong>the</strong> various <strong>Newfoundl<strong>and</strong></strong> Forest Service sample plot data sets<br />
should be considered when <strong>the</strong>y are used to examine variables or questions o<strong>the</strong>r than those <strong>the</strong>y were<br />
designed to answer.<br />
Acknowledgments<br />
Thanks to <strong>the</strong> <strong>Newfoundl<strong>and</strong></strong> <strong>and</strong> Labrador Department of Natural Resources for <strong>the</strong> use of <strong>the</strong>ir<br />
permanent <strong>and</strong> temporary sample plot data, especially Chris Cohlmeyer for help <strong>and</strong> advice with <strong>the</strong><br />
procedures <strong>and</strong> data issues.<br />
References<br />
Burns, R. M., <strong>and</strong> Honkala, B.M., technical coordinators. 1990. Silvics of North America: 1. Conifers; 2. Hardwoods. Agriculture<br />
H<strong>and</strong>book 654. USDA Forest Service, Washington, D.C., USA.<br />
Bearns, E.R. 1967. Native Trees of <strong>Newfoundl<strong>and</strong></strong> <strong>and</strong> Labrador. Department of Forestry <strong>and</strong> Agriculture, St. John’ s (Terre-Neuve)<br />
Canada.<br />
Husch, B., Miller, C.I., <strong>and</strong> Beers, T.W. 1982. Forest Mensuration. Third edition. John Wiley, New York, New York, USA.<br />
Kurz, W.A., <strong>and</strong> Apps, M.J. 1993. Contribution of nor<strong>the</strong>rn <strong>forests</strong> to <strong>the</strong> global C cycle: Canada as a case study. Water, Air <strong>and</strong> Soil<br />
Pollution 70: 163–176.<br />
Meades, W.J., <strong>and</strong> Moores, L. 1994. Forest site classification manual: a field guide to <strong>the</strong> Damman forest types of <strong>Newfoundl<strong>and</strong></strong>,<br />
2nd ed. Canada–<strong>Newfoundl<strong>and</strong></strong> Forest Resource Development Agreement, FRDA Report No. 003, St. John’s, <strong>Newfoundl<strong>and</strong></strong>.<br />
Moroni, M.T., <strong>and</strong> Harris, D.D. 2010. Snag frequency, diameter <strong>and</strong> species distribution <strong>and</strong> input rate in <strong>Newfoundl<strong>and</strong></strong> boreal<br />
<strong>forests</strong>. Forestry 83: 229–244.<br />
<strong>Newfoundl<strong>and</strong></strong> <strong>and</strong> Labrador Department of Natural Resources. 2004a. Production specifications for aerial photo interpretation.<br />
<strong>Newfoundl<strong>and</strong></strong> <strong>and</strong> Labrador Department of Natural Resources, St. John’s, <strong>Newfoundl<strong>and</strong></strong> <strong>and</strong> Labrador, Canada.<br />
<strong>Newfoundl<strong>and</strong></strong> <strong>and</strong> Labrador Department of Natural Resources. 2004b. Temporary Sample Plot Program. Unpublished report.<br />
<strong>Newfoundl<strong>and</strong></strong> Forest Service, St. John’s, <strong>Newfoundl<strong>and</strong></strong> <strong>and</strong> Labrador, Canada.<br />
<strong>Newfoundl<strong>and</strong></strong> Department of Forest Resources <strong>and</strong> Agrifoods. 1998. 20-Year Forestry Development Plan 1996–2015. NLDFRA,<br />
<strong>Newfoundl<strong>and</strong></strong> Forest Service, St. John’s, <strong>Newfoundl<strong>and</strong></strong> <strong>and</strong> Labrador, Canada.<br />
Rowe, J.S. 1972. Forest Regions of Canada. Publ. 1300. Canadian Department of <strong>the</strong> Environment, Canada Forest Service, Ottawa,<br />
Ontario, Canada.<br />
Smith, C.Y., Moroni, M.T., <strong>and</strong> Warkentin, I.G. 2009. Snag dynamics in post-harvest l<strong>and</strong>scapes of western <strong>Newfoundl<strong>and</strong></strong> <strong>balsam</strong><br />
<strong>fir</strong>-dominated boreal <strong>forests</strong>. Forest Ecology <strong>and</strong> Management 258: 832–839.<br />
Smith, C.Y., Warkentin, I.G., <strong>and</strong> Moroni, M.T. 2008. Snag availability for cavity nesters across a chronosequence of post-harvest<br />
l<strong>and</strong>scapes in western <strong>Newfoundl<strong>and</strong></strong>. Forest Ecology <strong>and</strong> Management 256: 641–647<br />
Vanguard Forest Management Services. 1992. Recommendations on Permanent Sampling Systems for <strong>Newfoundl<strong>and</strong></strong>. Final report.<br />
Vanguard Forest Mangaement Services Ltd., Fredericton, New Brunswick, Canada.<br />
Wilton, W.C., <strong>and</strong> Evans, C.H. 1974. <strong>Newfoundl<strong>and</strong></strong> forest <strong>fir</strong>e history 1619–1960. Information Report N-X-116. Natural Resources<br />
Canada, Canadian Forest Service – Atlantic Forestry Centre, Corner Brook, <strong>Newfoundl<strong>and</strong></strong> <strong>and</strong> Labrador, Canada.<br />
15