Cooling Airflow Design Calculations for UFAD - Center for the Built ...
Cooling Airflow Design Calculations for UFAD - Center for the Built ...
Cooling Airflow Design Calculations for UFAD - Center for the Built ...

Create successful ePaper yourself
Turn your PDF publications into a flip-book with our unique Google optimized e-Paper software.
©2007, American Society of Heating, Refrigerating and Air-Conditioning Engineers, Inc. (www.ashrae.org). Published in ASHRAE Journal,<br />
Vol. 49, Oct. 2007. This posting is by permission of ASHRAE. Additional reproduction, distribution, or transmission in ei<strong>the</strong>r print or digital<br />
<strong>for</strong>m is not permitted without ASHRAE’s prior written permission.<br />
<strong>Cooling</strong> <strong>Airflow</strong> <strong>Design</strong><br />
<strong>Calculations</strong> <strong>for</strong> <strong>UFAD</strong><br />
By Fred Bauman, P.E., Member ASHRAE; Tom Webster, P.E., Member ASHRAE, and Corinne Benedek, Student Member ASHRAE<br />
During <strong>the</strong> past ten years as underfloor air distribution (<strong>UFAD</strong>)<br />
has begun to demonstrate significant growth in new commercial<br />
office building construction in North America, design engineers<br />
have often cited methods <strong>for</strong> airside design sizing as one of <strong>the</strong> most<br />
important unanswered questions regarding <strong>UFAD</strong> system design.<br />
The challenge in this regard has been how to accurately account <strong>for</strong><br />
differences between a stratified <strong>UFAD</strong> environment and <strong>the</strong> familiar<br />
well-mixed environment produced by a conventional overhead (OH)<br />
variable air volume (VAV) air-distribution system.<br />
In this article, we present new guidance<br />
from a recently developed practical and<br />
simplified design procedure to determine<br />
cooling airflow design requirements <strong>for</strong><br />
interior occupied spaces of a building with<br />
a <strong>UFAD</strong> system. Preliminary design guidance<br />
<strong>for</strong> perimeter zones is also provided.<br />
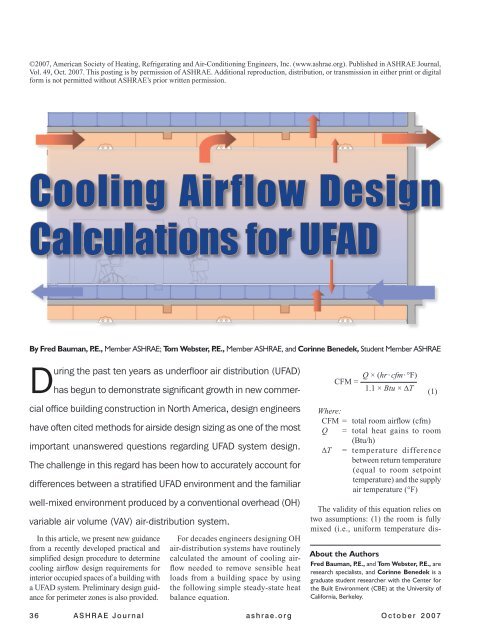
For decades engineers designing OH<br />
air-distribution systems have routinely<br />
calculated <strong>the</strong> amount of cooling airflow<br />
needed to remove sensible heat<br />
loads from a building space by using<br />
<strong>the</strong> following simple steady-state heat<br />
balance equation.<br />
Q × (hr · cfm · °F)<br />
CFM =<br />
1.1 × Btu × DT (1)<br />
Where:<br />
CFM = total room airflow (cfm)<br />
Q = total heat gains to room<br />
(Btu/h)<br />
DT = temperature difference<br />
between return temperature<br />
(equal to room setpoint<br />
temperature) and <strong>the</strong> supply<br />
air temperature (°F)<br />
The validity of this equation relies on<br />
two assumptions: (1) <strong>the</strong> room is fully<br />
mixed (i.e., uni<strong>for</strong>m temperature dis-<br />
About <strong>the</strong> Authors<br />
Fred Bauman, P.E., and Tom Webster, P.E., are<br />
research specialists, and Corinne Benedek is a<br />
graduate student researcher with <strong>the</strong> <strong>Center</strong> <strong>for</strong><br />
<strong>the</strong> <strong>Built</strong> Environment (CBE) at <strong>the</strong> University of<br />
Cali<strong>for</strong>nia, Berkeley.<br />
3 6 A S H R A E J o u r n a l a s h r a e . o r g O c t o b e r 2 0 0 7
tribution) and (2) 100% of <strong>the</strong> net heat gain is removed from<br />
<strong>the</strong> space by airflow through <strong>the</strong> room. However, <strong>the</strong>re are<br />
two key aspects of <strong>the</strong> design and cooling operation of <strong>UFAD</strong><br />
systems that invalidate <strong>the</strong> assumptions of Equation 1 and have<br />
important implications <strong>for</strong> <strong>the</strong> determination of <strong>UFAD</strong> cooling<br />
airflow quantities. These issues are room air stratification<br />
and <strong>the</strong> existence of a cool underfloor air supply plenum, as<br />
discussed fur<strong>the</strong>r below.<br />
Room Air Stratification<br />
Properly controlled <strong>UFAD</strong> systems produce temperature<br />
stratification in <strong>the</strong> conditioned space resulting in higher temperatures<br />
at <strong>the</strong> ceiling level that change <strong>the</strong> dynamics of heat<br />
transfer within a room, as well as between floors of a multistory<br />
building. Under <strong>the</strong>se conditions, <strong>the</strong> temperature at <strong>the</strong> ceiling<br />
can no longer be assumed to be equal to <strong>the</strong> room setpoint<br />
temperature. Figure 1 shows an example room air temperature<br />
profile <strong>for</strong> an interior zone <strong>for</strong> purposes of identifying key<br />
features in a stratified profile. 1 Previously, most concepts of<br />
<strong>UFAD</strong> cooling airflow design sizing followed guidelines developed<br />
<strong>for</strong> stratified displacement ventilation (DV) systems, as<br />
described by Chen and Glicksman. 2 This procedure attempted<br />
to account <strong>for</strong> stratification by determining <strong>the</strong> contribution of<br />
each load component to <strong>the</strong> occupied zone (<strong>the</strong> region below<br />
67 in. [1.7 m] <strong>for</strong> standing and 42 in. [1.1 m] <strong>for</strong> seated occupants)<br />
and <strong>the</strong>n assigning a design temperature difference to<br />
determine <strong>the</strong> airflow requirements (see discussions <strong>for</strong> <strong>UFAD</strong><br />
systems3,4 ). However, as will be described later, although this<br />
load-assignment methodology works <strong>for</strong> traditional DV system<br />
designs, it does not fully characterize <strong>the</strong> <strong>the</strong>rmal per<strong>for</strong>mance<br />
of any stratified system (<strong>UFAD</strong> or DV) that uses an underfloor<br />
air supply plenum. Fur<strong>the</strong>rmore, since stratified conditions of<br />
various magnitudes can exist in <strong>the</strong> occupied zone, <strong>the</strong> concept<br />
of determining <strong>the</strong> airflow quantity required to maintain <strong>the</strong><br />
temperature at a 4 ft (1.2 m) high <strong>the</strong>rmostat, which is assumed<br />
to represent a uni<strong>for</strong>m well-mixed occupied zone temperature,<br />
is no longer valid. For purposes of allowing a comparison between<br />
cooling airflow quantities used by <strong>UFAD</strong> vs. well-mixed<br />
OH systems, we have defined an equivalent acceptable com<strong>for</strong>t<br />
condition <strong>for</strong> standing occupants in a stratified room as follows<br />
(refer to Figure 1):<br />
• The average occupied zone temperature (Toz,avg ), calculated<br />
as <strong>the</strong> average of <strong>the</strong> measured temperature profile from<br />
ankle level (4 in. [0.1 m]) to head level (67 in. [1.7 m]), is<br />
equal to <strong>the</strong> desired setpoint temperature (as measured in a<br />
well-mixed OH system).<br />
• The occupied zone temperature difference (DToz ), calculated<br />
as <strong>the</strong> head-ankle temperature difference, does not exceed <strong>the</strong><br />
maximum limit of 5°F (3°C), as specified by ANSI/ASHRAE<br />
Standard 55-2004, Thermal Environmental Conditions <strong>for</strong><br />
Human Occupancy.<br />
Underfloor Air Supply Plenums<br />
A distinguishing feature of any <strong>UFAD</strong> system is <strong>the</strong> use<br />
of an underfloor plenum to deliver supply air through floor<br />
diffusers into <strong>the</strong> conditioned space. Cool supply air flowing<br />
through <strong>the</strong> underfloor plenum is exposed to heat gain from<br />
both <strong>the</strong> concrete slab (in a multistory building) and <strong>the</strong> raised<br />
floor panels. The magnitude of this heat gain can be quite high,<br />
resulting in undesirable temperature gain to <strong>the</strong> supply air in<br />
<strong>the</strong> plenum (sometimes referred to as <strong>the</strong>rmal decay). While <strong>the</strong><br />
amount of heat entering <strong>the</strong> underfloor plenum will not change<br />
<strong>the</strong> magnitude of <strong>the</strong> cooling load that must be removed at <strong>the</strong><br />
system level, it does directly influence <strong>the</strong> required cooling<br />
airflow quantity by reducing <strong>the</strong> amount of heat gain to <strong>the</strong> room<br />
that must be removed by room air extraction, defined as heat<br />
gain removed by airflow through <strong>the</strong> room. A recent modeling<br />
study found that <strong>for</strong> a range of typical operating conditions,<br />
this supply plenum heat gain can amount to 30% to 40% of <strong>the</strong><br />
total system heat gain (including 100% of overhead lights). This<br />
results in a reduction in <strong>the</strong> amount of heat load needing to be<br />
accounted <strong>for</strong> by <strong>the</strong> room air extraction rate. 5 More recently,<br />
full-scale laboratory experiments have verified <strong>the</strong> magnitude<br />
of this plenum heat gain. 6<br />
Figure 2 is a diagram that summarizes <strong>the</strong> results of an<br />
ongoing modeling study (using both a whole-building energy<br />
model and a first-law model 6,7 that includes a more detailed heat<br />
transfer analysis of <strong>the</strong> return plenum than was previously done.<br />
As indicated, <strong>the</strong> model is representative of a middle floor of a<br />
multistory building with <strong>UFAD</strong> and a hung ceiling.<br />
The figure shows <strong>the</strong> calculated distribution of total system<br />
heat gain <strong>for</strong> <strong>the</strong> room, supply plenum and return plenum. For<br />
a hung ceiling, some portion of <strong>the</strong> system heat gain will be<br />
removed via airflow through <strong>the</strong> room where this airflow gains<br />
heat, and after exiting through <strong>the</strong> ceiling return grille, will lose<br />
heat to <strong>the</strong> slab in <strong>the</strong> return plenum. (It may be helpful here to<br />
recall that heat gain to <strong>the</strong> airflow represents positive extraction<br />
and heat loss, negative extraction.) In addition, although not<br />
shown explicitly, radiation plays an important role in <strong>the</strong> energy<br />
balance of <strong>the</strong> system. The results indicate that <strong>the</strong> room cooling<br />
load ratio, RCLR (defined as <strong>the</strong> room air extraction divided by<br />
<strong>the</strong> total system heat gain) is estimated to be 60% to 70%.<br />
Figure 2 also illustrates how warmer temperatures at <strong>the</strong><br />
ceiling and in <strong>the</strong> return plenum drive conductive heat transfer<br />
through <strong>the</strong> slab into <strong>the</strong> supply plenum <strong>for</strong> <strong>the</strong> floor above, as<br />
well as radiative heat transfer from <strong>the</strong> ceiling to <strong>the</strong> floor (and<br />
subsequently conduction through <strong>the</strong> raised floor into <strong>the</strong> supply<br />
plenum). Not indicated, but equally important, is <strong>the</strong> radiant<br />
contribution of <strong>the</strong> room loads. The calculated net heat gain to<br />
<strong>the</strong> supply plenum is 35% to 45% and net heat loss from <strong>the</strong><br />
return plenum is 10% to 15%. This diagram depicts a typical<br />
interior zone configuration in which a common underfloor<br />
plenum serves both interior and perimeter spaces. Although<br />
<strong>the</strong> load distribution will remain about <strong>the</strong> same, <strong>the</strong> magnitude<br />
of <strong>the</strong> average temperature gain in <strong>the</strong> supply plenum will be<br />
based on <strong>the</strong> total airflow within <strong>the</strong> plenum. However, this<br />
airflow is governed by <strong>the</strong> demands of <strong>the</strong> room to control its<br />
temperature.<br />
The results presented below are based on a preliminary design<br />
tool developed as part of a larger research ef<strong>for</strong>t focusing<br />
O c t o b e r 2 0 0 7 A S H R A E J o u r n a l 3 7
Advertisement <strong>for</strong>merly in this space.<br />
Height<br />
Head<br />
(67 in.)<br />
T stat<br />
(48 in.)<br />
Ankle<br />
(4 in.)<br />
From<br />
Perimeter<br />
Zone<br />
To<br />
Ceiling<br />
SAT<br />
Temperature Near<br />
<strong>the</strong> Floor<br />
Total System<br />
Heat Gain<br />
100%<br />
Heat Gain into (Loss From) Return Plenum – (10% to 15%)<br />
3 8 A S H R A E J o u r n a l a s h r a e . o r g O c t o b e r 2 0 0 7<br />
65°F<br />
DT room<br />
T oz,avg<br />
Room Air<br />
Extraction<br />
60% to 70%<br />
Ceiling-Slab<br />
Radiation<br />
Ceiling-Floor<br />
Radiation<br />
Through<br />
Slab<br />
Through<br />
Floor<br />
Heat Gain into Supply Plenum 35% to 45%<br />
Through<br />
Ceiling<br />
Figure 2: Predicted distribution of room cooling load in multistory building with <strong>UFAD</strong>:<br />
interior zone, total system heat gain = 2.8 W/ft 2 (31 W/m 2 ), room airflow = 0.6 – 0.7 cfm/ft 2 ,<br />
(3.1 – 3.6 L/s·m 2 ), diffuser discharge temperature = 65°F (18°C).<br />
T stat<br />
DT oz<br />
RAT<br />
Temperature at<br />
Head Height<br />
Occupied<br />
Zone (OZ)<br />
Temperature<br />
Figure 1: Example room air temperature profile in stratified <strong>UFAD</strong> system: SAT = room supply<br />
air temperature (diffuser discharge temperature); RAT = return air temperature at ceiling.<br />
on developing energy simulation models<br />
<strong>for</strong> <strong>UFAD</strong> systems. 6 The design tool accounts<br />
<strong>for</strong> <strong>the</strong> key issues described previously:<br />
(1) room air stratification alters<br />
<strong>the</strong> assumption of well-mixed conditions,<br />
(2) <strong>the</strong> conventionally calculated room<br />
cooling load must be reduced by <strong>the</strong> net<br />
amount of system heat gain transferred to<br />
both <strong>the</strong> supply and return plenums and<br />
(3) <strong>the</strong> supply temperature to <strong>the</strong> room<br />
is greater than that <strong>for</strong> conventional OH<br />
design and depends on heat gain to <strong>the</strong><br />
plenum.<br />
Description of <strong>Design</strong> Tool<br />
A design tool has been developed as<br />
a spreadsheet-based calculation procedure<br />
that in its final <strong>for</strong>m will be easy<br />
to use by practicing design engineers.<br />
The tool is intended to allow <strong>the</strong> user<br />
to apply various commercially available<br />
To<br />
AHU<br />
From<br />
cooling load calculation methods <strong>for</strong><br />
conventional overhead systems, including<br />
<strong>the</strong> ASHRAE radiant time series<br />
(RTS) procedure. Figure 3 shows a flow<br />
diagram of <strong>the</strong> anticipated process <strong>for</strong> using<br />
<strong>the</strong> design tool. In addition to <strong>the</strong> load<br />
calculation, users will input several o<strong>the</strong>r<br />
parameters that define <strong>the</strong> design and<br />
desired operation of <strong>the</strong> <strong>UFAD</strong> system.<br />
Be<strong>for</strong>e proceeding to <strong>the</strong> main modeling<br />
engine, <strong>the</strong> calculated total system heat<br />
gain is modified based on an estimated<br />
room cooling load ratio, RCLR, defined<br />
as <strong>the</strong> percentage of <strong>the</strong> total system heat<br />
gain (including 100% of lighting) that is<br />
to be assigned to <strong>the</strong> room in <strong>the</strong> <strong>UFAD</strong><br />
airflow calculation. To date, most of <strong>the</strong><br />
design tool development has focused<br />
on interior zone configurations. In this<br />
article, we will highlight recommendations<br />
<strong>for</strong> interior zone cooling airflow
Standard<br />
Overhead<br />
Load Calculation<br />
Example<br />
<strong>UFAD</strong> User<br />
Inputs<br />
Diffuser Type<br />
Diffuser Supply<br />
Temp.<br />
Desired T oz,avg<br />
Room<br />
<strong>Cooling</strong> Load<br />
Ratio<br />
Lookup<br />
Figure 3: <strong>Design</strong> tool flow diagram.<br />
Modeling<br />
Engine<br />
(Empirical<br />
Correlations)<br />
Example Outputs<br />
<strong>Airflow</strong><br />
Occupied Zone DT<br />
Thermostat Setting<br />
Plenum Inlet Temp.<br />
Equivalent OH <strong>Airflow</strong><br />
calculations and will also provide preliminary guidance <strong>for</strong><br />
perimeter zones. Research is ongoing to complete <strong>the</strong> design<br />
tool, including perimeter zone airflow calculations. 7<br />
The design tool uses a combination of a room energy balance<br />
and empirical correlations based on experimental data from<br />
a full-scale laboratory 6 to simulate a simplified temperature<br />
profile constructed of two line segments as shown in Figure 4.<br />
This assumes, <strong>for</strong> design purposes, that a controlled temperature<br />
profile passes through <strong>the</strong> <strong>the</strong>rmostat setpoint. It also reflects<br />
<strong>the</strong> observation that most experimentally measured temperature<br />
profiles exhibit a change in slope between <strong>the</strong> lower and upper<br />
regions of <strong>the</strong> room. Beginning with <strong>the</strong> assumed diffuser<br />
discharge temperature (e.g., 65°F [18°C]) and an assumed<br />
airflow rate, <strong>the</strong> model calculates <strong>the</strong> air temperature at <strong>the</strong><br />
ceiling using a heat balance equation based on <strong>the</strong> modified<br />
cooling load assigned to <strong>the</strong> room. The current design tool assumes<br />
a constant value of 0.7 <strong>for</strong> RCLR (i.e., 70% of <strong>the</strong> total<br />
system heat gain must be removed by room air extraction).<br />
Temperatures at <strong>the</strong> 4 in. (0.1 m) and 67 in. (1.7 m) heights are<br />
determined through empirical correlations. Using <strong>the</strong> simple<br />
profile, <strong>the</strong> tool derives <strong>the</strong> two com<strong>for</strong>t parameters, T oz,avg and<br />
DT oz , and <strong>the</strong>n determines <strong>the</strong> airflow that matches most closely<br />
<strong>the</strong> design conditions.<br />
Comparison to Test Data<br />
The experiments used to develop <strong>the</strong> design tool were conducted<br />
in a full-scale test chamber set up to represent an open<br />
plan office with realistic workstations and internal loads. 6<br />
The applicability of <strong>the</strong> design calculations to real buildings<br />
is not currently known but is <strong>the</strong> subject of ongoing research.<br />
We do not expect that <strong>the</strong> profile correlations will be affected<br />
significantly by changes in system characteristics. RCLR<br />
correlations still need to be determined <strong>for</strong> different system<br />
configurations, but <strong>the</strong> model can easily accommodate changes<br />
in this parameter.<br />
The accuracy of <strong>the</strong> empirical temperature profile was<br />
verified by comparison with <strong>the</strong> full-scale test data. This was<br />
done <strong>for</strong> interior zone loads and two types of diffusers, as<br />
described below.<br />
Swirl (SW) diffuser: These round floor diffusers are one<br />
of <strong>the</strong> most commonly installed diffusers in <strong>UFAD</strong> systems;<br />
more models are commercially available than any o<strong>the</strong>r design.<br />
The swirl diffuser used in our tests is representative of typical<br />
<strong>UFAD</strong> applications, providing a design airflow of 80 cfm<br />
Return at Ceiling<br />
T setpoint at 48 in.<br />
SW VA<br />
Number of Tests 18 8<br />
T oz,avg Average Error (°F) 0.01 0.18<br />
T oz,avg Standard Deviation (°F) 0.32 0.37<br />
DT oz Average Error (°F) 0.02 0.02<br />
DT oz Standard Deviation (°F) 0.52 0.24<br />
Table 1: Comparison to test data.<br />
(38 L/s) at a plenum pressure of 0.05 in. H 2 O (12.5 Pa). Since<br />
<strong>the</strong> stratification per<strong>for</strong>mance of swirl diffusers can change at<br />
different airflow rates, <strong>the</strong> concept of a diffuser design ratio<br />
(DDR) is introduced. DDR is defined as <strong>the</strong> ratio of actual<br />
airflow to design airflow (80 cfm [38 L/s]). As discussed below,<br />
<strong>for</strong> design calculations <strong>the</strong> use of DDR = 1.0 assumes that all<br />
diffusers are operating at <strong>the</strong>ir design airflow.<br />
Variable-area (VA) diffuser: This square diffuser is designed<br />
<strong>for</strong> variable-air-volume operation. The unit we tested used an<br />
automatic internal damper to adjust <strong>the</strong> active area of <strong>the</strong> diffuser<br />
to maintain a nearly constant discharge velocity, even<br />
at reduced air volumes. The adjustable grilles were set in <strong>the</strong><br />
manufacturer’s recommended “spread” position <strong>for</strong> all tests. The<br />
VA diffuser provides a maximum design airflow of 150 cfm (71<br />
L/s) at a plenum pressure of 0.05 in. H 2 O (12.5 Pa).<br />
Table 1 shows <strong>the</strong> calculated errors when comparing <strong>the</strong> design<br />
tool calculations of <strong>the</strong> two key com<strong>for</strong>t parameters (T oz,avg ,<br />
DT oz ) with <strong>the</strong> full-scale experimental data. The model predictions<br />
were based on <strong>the</strong> measured airflow rate. The range of test<br />
conditions covered were <strong>the</strong> following: 1.9 W/ft 2 (20 W/m 2 )<br />
≤cooling load ≤3.4 W/ft 2 (37 W/m 2 ); 0.30 cfm/ft 2 (1.5 L/s·m 2 )<br />
≤room airflow ≤0.85 cfm/ft 2 (4.3 L/s·m 2 ); 60.8°F (16.0°C)<br />
≤room SAT ≤68.2°F (20.1°C); 72°F (22.2°C) ≤T setpoint ≤76°F<br />
(24.4°C); 0.3 ≤DDR ≤2.0. Figure 4 shows a representative<br />
comparison between <strong>the</strong> predicted and measured temperature<br />
profiles <strong>for</strong> one specific swirl diffuser test.<br />
O c t o b e r 2 0 0 7 A S H R A E J o u r n a l 3 9<br />
Height (in.)<br />
120<br />
100<br />
80<br />
60<br />
40<br />
20<br />
4 in.<br />
67 in.<br />
Measured<br />
Modeled<br />
0<br />
70 71 72 73 74 75 76 77<br />
Temperature (°F)<br />
Figure 4: Simplified temperature profile vs. measured data: Swirl<br />
diffusers, cooling load = 3.1 W/ft 2 (33 W/m 2 ), SAT = 65.6°F (18.7°C),<br />
T setpoint = 74.8°F (23.8°C), airflow = 0.60 cfm/ft 2 (3.1 L/s·m 2 ).
<strong>UFAD</strong><br />
Diffuser<br />
Discharge<br />
Temp. (°F)<br />
Swirl<br />
65°F<br />
Swirl<br />
67°F<br />
VA<br />
65°F<br />
VA<br />
67°F<br />
<strong>UFAD</strong><br />
or OH<br />
<strong>Cooling</strong><br />
Load *<br />
(W/ft 2 )<br />
2.0<br />
3.0<br />
4.0<br />
2.0<br />
3.0<br />
4.0<br />
Diffuser<br />
<strong>Design</strong><br />
Ratio †<br />
<strong>UFAD</strong> OH with SAT = 57°F<br />
T oz,avg ‡ = 73°F T oz,avg ‡ = 74°F T oz,avg ‡ = 75°F T setpoint †† = 73°F Tsetpoint †† = 75°F<br />
<strong>Airflow</strong> §<br />
(cfm/ft 2 )<br />
DT oz **<br />
(°F)<br />
<strong>Airflow</strong> §<br />
(cfm/ft 2 )<br />
4 0 A S H R A E J o u r n a l a s h r a e . o r g O c t o b e r 2 0 0 7<br />
DT oz **<br />
(°F)<br />
<strong>Airflow</strong> §<br />
(cfm/ft 2 )<br />
DT oz **<br />
(°F)<br />
1.0 0.43 2.7 0.38 3.1 0.34 3.6<br />
0.5 0.40 4.5 0.36 5.2 0.32 5.8<br />
1.0 0.65 2.6 0.58 3.0 0.52 3.4<br />
0.5 0.61 4.4 0.54 5.0 0.48 5.6<br />
1.0 0.87 2.5 0.77 2.9 0.69 3.3<br />
0.5 0.81 4.3 0.72 5.0 0.64 5.6<br />
1.0 0.58 1.9 0.49 2.3 0.43 2.7<br />
0.5 0.54 3.3 0.46 3.9 0.40 4.5<br />
1.0 0.87 1.8 0.75 2.2 0.65 2.6<br />
0.5 0.81 3.2 0.69 3.8 0.61 4.4<br />
1.0 1.17 1.7 1.00 2.1 0.87 2.5<br />
0.5 1.09 3.2 0.93 3.7 0.81 4.3<br />
<strong>Airflow</strong> (cfm/ft 2 ) <strong>Airflow</strong> (cfm/ft 2 )<br />
0.39 0.35<br />
0.59 0.53<br />
0.79 0.70<br />
0.39 0.35<br />
0.59 0.53<br />
0.79 0.70<br />
2.0 1.0 0.46 1.8 0.40 2.0 0.36 2.2 0.39 0.35<br />
3.0 1.0 0.70 1.9 0.62 2.1 0.55 2.3 0.59 0.53<br />
4.0 1.0 0.94 2.0 0.83 2.2 0.75 2.4 0.79 0.70<br />
2.0 1.0 0.62 1.5 0.53 1.6 0.46 1.8 0.39 0.35<br />
3.0 1.0 0.93 1.5 0.80 1.7 0.70 1.9 0.59 0.53<br />
4.0 1.0 1.25 1.6 1.07 1.8 0.94 2.0 0.79 0.70<br />
*Total cooling load (system heat gain), including 100% of overhead lighting, as used <strong>for</strong> sizing conventional overhead (OH) systems.<br />
†Diffuser design ratio (DDR) = (actual diffuser airflow)/(diffuser design airflow).<br />
‡T oz,avg = average temperature in occupied zone (between head height, 67 in. [1.7 m], and ankle height, 4 in. [0.1 m]).<br />
§<strong>Airflow</strong> = Total room airflow, including Category 2 leakage from supply plenum to room.<br />
**DT oz = temperature difference between head height, 67 in. (1.7 m), and ankle height, 4 in. (0.1 m).<br />
††T setpoint = setpoint temperature measured at 4 ft (1.2 m) height.<br />
Table 2: <strong>Design</strong> cooling airflow per<strong>for</strong>mance <strong>for</strong> <strong>UFAD</strong> and OH systems: Interior zones.<br />
<strong>Design</strong> Tool Results: Interior Zones<br />
Table 2 presents design tool predictions<br />
of <strong>UFAD</strong> cooling airflow rates and associated<br />
occupied zone temperature differences<br />
(DT oz ) <strong>for</strong> a range of typical interior<br />
zone design conditions. Also shown <strong>for</strong><br />
comparison are predicted airflow rates<br />
<strong>for</strong> a conventional overhead (OH) system<br />
with a supply air temperature (SAT) of<br />
57°F (14°C) and setpoint temperatures<br />
of 73°F (23°C) and 75°F (24°C).<br />
To use <strong>the</strong> table, select <strong>the</strong> following<br />
design conditions: diffuser type and discharge<br />
temperature, cooling load, room<br />
setpoint temperature (<strong>for</strong> <strong>UFAD</strong> systems,<br />
this is equal to T oz,avg ) and DDR equal to<br />
1.0. Table 2 also includes in<strong>for</strong>mation <strong>for</strong><br />
swirl diffusers with DDR = 0.5, represent-<br />
ing a design case where <strong>the</strong> airflow through<br />
each diffuser is 50% of design airflow (80<br />
cfm [38 L/s]). Since <strong>the</strong> VA diffuser automatically<br />
maintains a consistent throw<br />
height, and a similar room temperature<br />
profile (if <strong>the</strong>re is no significant Category 2<br />
leakage [see below]), VA results are shown<br />
only <strong>for</strong> DDR = 1.0. The user should exercise<br />
care when extrapolating <strong>the</strong> airflow<br />
data in <strong>the</strong> table to o<strong>the</strong>r design conditions.<br />
It is recommended that <strong>the</strong> table not be<br />
used <strong>for</strong> airflow calculations outside of <strong>the</strong><br />
following ranges of design conditions in<br />
interior zones: cooling load, up to 4 W/ft 2<br />
(43 W/m 2 ); room 4 ft (1.2 m) setpoint temperature,<br />
73°F to 76°F (22.8°C to 24.4°C);<br />
and diffuser discharge temperature, 63°F<br />
to 68°F (17°C to 20°C).<br />
Air Leakage<br />
Supply plenum leakage is one of <strong>the</strong><br />
most important issues facing <strong>the</strong> <strong>UFAD</strong><br />
industry. Experience in <strong>the</strong> field has<br />
shown that Category 2 leakage (from<br />
<strong>the</strong> plenum into <strong>the</strong> room) can often be<br />
in <strong>the</strong> range of 10% to 20% of design<br />
airflow. To account <strong>for</strong> leakage in design<br />
calculations, <strong>the</strong> predicted airflow from<br />
Table 2 should include <strong>the</strong> estimated<br />
(or measured) air leakage rate at design<br />
conditions. Although <strong>the</strong> results of Table<br />
2 were developed assuming no leakage,<br />
additional full-scale experiments were<br />
conducted to investigate <strong>the</strong> impact of<br />
leakage on stratification. 6 These experiments<br />
demonstrated that <strong>for</strong> swirl and<br />
VA diffusers with DDR close to 1.0, <strong>the</strong>
increase in DT oz and decrease in T oz,avg<br />
will be minimal. These guidelines are<br />
applicable <strong>for</strong> Category 2 design air<br />
leakage rates up to about 20%. Category<br />
2 leakage rates above 20% may impact<br />
<strong>the</strong> amount of stratification in <strong>the</strong> occupied<br />
zone, as well as <strong>the</strong> system’s ability<br />
to control room temperature. Note that<br />
while Category 1 leakage (from <strong>the</strong> plenum<br />
to <strong>the</strong> outside or o<strong>the</strong>r zones in <strong>the</strong><br />
building) will not impact room air temperature<br />
profiles, it will directly impact<br />
<strong>the</strong> airflow (and, <strong>the</strong>re<strong>for</strong>e, energy use)<br />
of <strong>the</strong> air handler.<br />
Comparison to Overhead (OH) System<br />
For standard room operating conditions<br />
(<strong>UFAD</strong> T oz,avg = OH T setpoint =<br />
74°F [23.3°C]; <strong>UFAD</strong> SAT = 65°F) at<br />
all load levels, Table 2 shows that airflow<br />
quantities <strong>for</strong> swirl and VA diffusers are<br />
predicted to range from 0% to 10% higher<br />
than OH airflows. At <strong>the</strong> higher room<br />
SAT of 67°F (19.4°C), <strong>UFAD</strong> airflows<br />
range from 32% to 43% higher than OH<br />
(using 57°F [14°C] SAT). The maximum<br />
predicted DT oz <strong>for</strong> all design conditions<br />
shown in <strong>the</strong> table <strong>for</strong> swirl (DDR = 1.0)<br />
and VA diffusers is 3.6°F (2.0°C), indicating<br />
that excessive stratification will not<br />
be a problem at design load. The impact<br />
of increasing stratification (produced by<br />
raising <strong>the</strong> room setpoint <strong>for</strong> a given room<br />
SAT) on reducing airflow rates is demonstrated<br />
by <strong>the</strong> values <strong>for</strong> a higher design<br />
setpoint temperature of 75°F (24°C). At<br />
this setpoint and with room SAT = 65°F<br />
(18°C), predicted <strong>UFAD</strong> airflow rates<br />
are equal <strong>for</strong> swirl diffusers and slightly<br />
higher (7%) <strong>for</strong> VA diffusers, compared<br />
to OH airflow rates at all load levels.<br />
Diffuser Type<br />
The design tool results allow a comparison<br />
between <strong>the</strong> two types of diffusers.<br />
VA diffusers, with <strong>the</strong>ir higher<br />
vertical throw were previously thought<br />
to require higher airflow rates due to reduced<br />
stratification, while swirl diffusers<br />
with throws that vary with airflow were<br />
thought to provide excessive stratification<br />
at low load conditions. The design tool<br />
shows that under design flow conditions<br />
(swirl DDR = 1.0), airflow quantities are<br />
quite similar, with swirl airflows slightly<br />
less than VA (7% less at room SAT =<br />
65°F [18°C], load = 4 W/ft 2 [13 W/m 2 ],<br />
T oz,avg = 74°F [23°C]). VA diffusers,<br />
with <strong>the</strong>ir variable air volume control,<br />
produce consistent stratification (DT oz ),<br />
although approximately 1°F (0.5°C) less<br />
than that <strong>for</strong> swirls, over all load levels<br />
<strong>for</strong> <strong>the</strong> same room SAT and T oz,avg . Swirl<br />
diffusers exhibit higher stratification<br />
under part load conditions (DDR = 0.5),<br />
although nearly all predicted values <strong>for</strong><br />
DT oz are less than or equal to 5°F (3°C)<br />
(maximum limit specified by Standard<br />
55-2004), except at room SAT = 65°F<br />
(18°C) and T oz,avg = 75°F (24°C).<br />
Example <strong>Design</strong> Tool Calculation<br />
Figure 5 presents design tool results<br />
from Table 2 <strong>for</strong> swirl diffusers supplying<br />
65°F (18°C) air with DDR = 1.0 in<br />
an interior zone with a cooling load of<br />
3 W/ft 2 (32 W/m 2 ) and an RCLR = 0.7.<br />
The figure plots predicted cooling airflow<br />
rates and DT oz as a function of T oz,avg<br />
over <strong>the</strong> range of 72°F to 76°F (22.2°C<br />
to 24.4°C). <strong>Calculations</strong> are highlighted<br />
<strong>for</strong> two design conditions that cover <strong>the</strong><br />
range of T oz,avg between 73°F (23°C)<br />
and 75°F (24°C). At each setpoint temperature<br />
(read on <strong>the</strong> left-hand y-axis),<br />
<strong>the</strong> first step is to read <strong>the</strong> airflow rate<br />
on <strong>the</strong> x-axis, and <strong>the</strong>n <strong>for</strong> <strong>the</strong> same airflow<br />
<strong>the</strong> second step is to read <strong>the</strong> DT oz<br />
on <strong>the</strong> right-hand y-axis, as shown. The<br />
results indicate that to design <strong>the</strong> system<br />
to maintain <strong>the</strong> average occupied zone<br />
temperature in <strong>the</strong> range of 74 ±1°F, <strong>the</strong><br />
system must be designed <strong>for</strong> an airflow<br />
in <strong>the</strong> range of 0.52 to 0.65 cfm/ft 2 (2.6<br />
to 3.3 L/s·m 2 ), resulting in an occupied<br />
zone temperature difference in <strong>the</strong> range<br />
of 2.6°F to 3.4°F (1.4°C to 1.9°C).<br />
Thermostat Setting<br />
In conventional overhead systems that<br />
aim to maintain a uni<strong>for</strong>m well-mixed<br />
environment, <strong>the</strong> assumption is made<br />
by building operators that <strong>the</strong> 4 ft (1.2<br />
m) <strong>the</strong>rmostat setpoint is <strong>the</strong> same as <strong>the</strong><br />
average temperature experienced in <strong>the</strong><br />
occupied zone. However, as indicated in<br />
Figure 1, depending on <strong>the</strong> amount of<br />
stratification that produces cooler temperatures<br />
near <strong>the</strong> floor, <strong>the</strong> average temperature<br />
in <strong>the</strong> occupied zone (T oz,avg )<br />
Advertisement <strong>for</strong>merly in this space.<br />
O c t o b e r 2 0 0 7 A S H R A E J o u r n a l 4 1
T oz,avg (°F)<br />
77<br />
76<br />
75<br />
74<br />
73<br />
72<br />
T oz,avg<br />
71<br />
1.0<br />
<strong>Airflow</strong> (cfm/ft2 0.40 0.50 0.60<br />
)<br />
0.70 0.80<br />
Figure 5: Example design cooling airflow per<strong>for</strong>mance: interior<br />
zone, cooling load = 3.0 W/ft 2 (32 W/m 2 ), swirl diffusers with DDR<br />
= 1.0, diffuser discharge temperature = 65°F (18°C).<br />
will be lower than <strong>the</strong> single point <strong>the</strong>rmostat temperature. To<br />
maintain equivalent com<strong>for</strong>t conditions in a stratified environment<br />
(e.g., <strong>UFAD</strong> T oz,avg = OH T setpoint ), it is recommended to<br />
raise <strong>the</strong> 4 ft (1.2 m) <strong>the</strong>rmostat setpoint by 1°F (0.5°C) <strong>for</strong> DT oz<br />
values around 3°F (2°C) and by 0.5°F (0.3°C) <strong>for</strong> DT oz values<br />
around 2°F (1°C). For example, to maintain an average occupied<br />
zone temperature of 74°F (23.3°C) <strong>for</strong> swirl diffusers (DDR =<br />
1.0) supplying 65°F (18°C) air to <strong>the</strong> space at any load level,<br />
<strong>the</strong> 4 ft (1.2 m) <strong>the</strong>rmostat should be set at 75°F (24°C). When<br />
<strong>the</strong> final design tool is released, it will include an automatic<br />
calculation <strong>for</strong> <strong>the</strong> 4 ft (1.2 m) <strong>the</strong>rmostat setting.<br />
Plenum Inlet Temperature<br />
Figure 6 shows <strong>the</strong> predicted plenum inlet temperature as a<br />
function of total plenum airflow <strong>for</strong> two different average diffuser<br />
discharge temperatures (65°F, 67°F [18.3°C, 19.4°C]) <strong>for</strong> a cooling<br />
load of 3.0 W/ft 2 (32 W/m 2 ). The predictions are based on a simple<br />
steady state energy balance assuming that 40% of <strong>the</strong> cooling load<br />
enters <strong>the</strong> supply plenum. Note that while results are shown <strong>for</strong> an<br />
average room supply temperature, measured diffuser discharge<br />
temperatures across <strong>the</strong> floor plate will be both higher and lower,<br />
depending on <strong>the</strong> airflow distribution within <strong>the</strong> plenum. 6,8 Actual<br />
DT oz<br />
4.0<br />
3.5<br />
3.0<br />
2.5<br />
2.0<br />
1.5<br />
Advertisement <strong>for</strong>merly in this space.<br />
DT oz (°F)<br />
Average Diffuser<br />
Discharge = 67°F<br />
Average Diffuser<br />
Discharge = 65°F<br />
Figure 6: Predicted plenum inlet temperature vs. total plenum airflow<br />
<strong>for</strong> different average diffuser discharge temperatures: <strong>Cooling</strong> load<br />
= 3.0 W/ft 2 (32 W/m 2 ).<br />
per<strong>for</strong>mance in <strong>the</strong> field may vary, but <strong>the</strong> trends are very clear. The<br />
results show that plenum <strong>the</strong>rmal decay can be a problem at lower<br />
plenum airflow rates. If coil leaving temperatures in <strong>the</strong> air handling<br />
unit (AHU) have to be reduced to maintain room supply temperatures,<br />
potential economizer energy savings (in suitable climates)<br />
may be eroded. As illustrated in Figure 2, an underfloor plenum<br />
serving an interior zone is typically configured as a larger open<br />
plenum that also serves perimeter spaces, thus increasing <strong>the</strong> total<br />
airflow through <strong>the</strong> plenum and reducing <strong>the</strong> temperature gain. The<br />
above considerations point to <strong>the</strong> importance of ongoing research<br />
to develop improved plenum design guidelines and to assess <strong>the</strong><br />
energy impact of <strong>the</strong>rmal decay on economizer per<strong>for</strong>mance.<br />
Perimeter Zones<br />
Perimeter zones differ from interior zones due to <strong>the</strong> type and<br />
magnitude of <strong>the</strong> heat sources. In cooling mode, <strong>the</strong> dominant<br />
heat source creates a large <strong>the</strong>rmal plume that rises vertically<br />
at <strong>the</strong> window and under peak load conditions <strong>the</strong> perimeter<br />
heat gain is several times that of total internal gains. Research<br />
is ongoing to complete <strong>the</strong> development of a perimeter zone<br />
cooling airflow design tool that will be modeled after <strong>the</strong> interior<br />
zone tool described earlier. 6,7 Interim guidance is discussed<br />
4 2 A S H R A E J o u r n a l a s h r a e . o r g O c t o b e r 2 0 0 7<br />
Plenum Inlet Temperature (°F)<br />
68<br />
66<br />
64<br />
62<br />
60<br />
58<br />
56<br />
54<br />
52<br />
50 0.0 0.5 1.0 1.5 2.0 2.5 3.0<br />
<strong>Airflow</strong> (cfm/ft 2 )<br />
briefly below.<br />
Figure 7 presents <strong>the</strong> results of three<br />
full-scale laboratory experiments investigating<br />
room air stratification in a<br />
perimeter zone. The 26 ft (7.9 m) square<br />
test room was configured to simulate an<br />
open plan office containing six workstations<br />
with linear bar grilles next to<br />
<strong>the</strong> perimeter window/wall and swirl<br />
diffusers elsewhere. A solar simulator<br />
in a wea<strong>the</strong>r chamber provided direct<br />
solar gain through windows on one wall<br />
with a window to wall ratio of 0.74. The<br />
simulated perimeter zone load <strong>for</strong> all<br />
tests in Figure 7, including an interior<br />
load level of 3.5 W/ft 2 (38 W/m 2 ), was
Height (ft)<br />
20.0<br />
10<br />
21.1 22.2<br />
Peak Solar Load<br />
23.3 24.4 25.6 26.7 27.8 28.9<br />
3.0<br />
9<br />
2.7<br />
8<br />
7<br />
6<br />
5<br />
4<br />
3<br />
2<br />
1<br />
Room Temperature (°C)<br />
Blinds Open,<br />
8 Linear Bar Grilles<br />
Vanes at 90°<br />
2.4 cfm/ft2 Blinds Closed,<br />
8 Linear Bar Grilles<br />
Vanes at 90°<br />
1.4 cfm/ft2 0<br />
0.0<br />
68 70 72 74 76 78 80 82 84<br />
Room Temperature (°F)<br />
14.8 W/ft2 (159 W/m2 ), based on <strong>the</strong> 15 ft<br />
(4.6 m) wide floor area near <strong>the</strong> window.<br />
These test conditions are representative of<br />
a west-facing zone in 40° north latitude on<br />
July 21 with a window with solar heat gain<br />
coefficient (SHGC) = 0.37. All tests used a<br />
diffuser supply temperature of 65°F (18°C)<br />
and were controlled to a 4 ft (1.2 m) <strong>the</strong>rmostat<br />
setpoint of 76°F (24.4°C), meaning<br />
that average occupied zone temperatures<br />
were 75°F (24°C) or below. Key findings<br />
are summarized below.<br />
The test producing <strong>the</strong> least amount<br />
of stratification required <strong>the</strong> highest<br />
airflow rate: 2.4 cfm/ft2 (12.2 L/s·m2 ),<br />
based on <strong>the</strong> 15 ft (4.6 m) wide perimeter<br />
zone. This test used 8 bar grilles<br />
with vertical vanes, producing <strong>the</strong><br />
highest throw and mixing.<br />
When <strong>the</strong> number of bar grilles was<br />
increased to 10 and <strong>the</strong> vanes were<br />
inclined to 53°, <strong>the</strong>reby reducing <strong>the</strong><br />
throw and mixing of <strong>the</strong> diffusers,<br />
stratification increased and <strong>the</strong> required<br />
airflow decreased to 1.9 cfm/ft2 (9.7<br />
L/s·m2 ). This demonstrates <strong>the</strong> potential<br />
benefits of using lower-throw diffusers,<br />
although care must be taken to maintain<br />
acceptable com<strong>for</strong>t conditions.<br />
The lowest airflow requirements were<br />
obtained <strong>for</strong> <strong>the</strong> test when window blinds<br />
were closed, producing <strong>the</strong> highest stratification<br />
with an airflow rate of only 1.4<br />
cfm/ft2 (7.1 L/s·m2 •<br />
•<br />
•<br />
). This reduction in<br />
•<br />
Blinds Open,<br />
10 Linear Bar Grilles<br />
Vanes at 53°<br />
1.9 cfm/ft 2<br />
Figure 7: Room air stratification temperature profiles <strong>for</strong> perimeter zones at constant<br />
perimeter zone load of 14.8 W/ft 2 (159 W/m 2 ), supply temperature of 65°F (18°C), and control<br />
setpoint of 76°F (24.4°C) at 4 ft (1.2 m).<br />
airflow rate is <strong>the</strong> result of several factors,<br />
including attenuation of <strong>the</strong> incident solar<br />
radiation entering <strong>the</strong> space, <strong>for</strong>mation<br />
of a stronger <strong>the</strong>rmal plume around<br />
<strong>the</strong> blinds, and changes in <strong>the</strong> radiant<br />
energy distribution (more diffuse). The<br />
use of blinds at peak load has profound<br />
implications <strong>for</strong> design although considerable<br />
difference of opinion exists about<br />
whe<strong>the</strong>r to assume blinds open or closed<br />
<strong>for</strong> design calculations.<br />
For comparison, an overhead system<br />
supplying 55°F (12.8°C) air and maintaining<br />
a setpoint temperature of 75°F<br />
(24°C) would require 2.3 cfm/ft 2 (11.7<br />
L/s·m 2 ) <strong>for</strong> this same load condition. If<br />
<strong>UFAD</strong> supply air temperatures increase<br />
above 65°F (18°C) due to <strong>the</strong>rmal<br />
decay in <strong>the</strong> plenum, required <strong>UFAD</strong><br />
airflow rates would also increase.<br />
Summary<br />
In this article we have presented new<br />
design guidance <strong>for</strong> <strong>UFAD</strong> cooling airflow<br />
calculations in interior zones based on a<br />
recently developed design tool. The design<br />
tool predicts required cooling airflow rates<br />
and <strong>the</strong> amount of stratification in <strong>the</strong> occupied<br />
zone <strong>for</strong> a range of design conditions.<br />
Results are shown <strong>for</strong> swirl and variablearea<br />
diffusers, two of <strong>the</strong> most frequently<br />
installed diffusers in interior zones. The<br />
design tool also compares <strong>UFAD</strong> airflows<br />
with conventional overhead (OH) airflows<br />
O c t o b e r 2 0 0 7 A S H R A E J o u r n a l 4 3<br />
2.4<br />
2.1<br />
1.8<br />
1.5<br />
1.2<br />
0.9<br />
0.6<br />
0.3<br />
Height (m)<br />
Advertisement <strong>for</strong>merly in this space.
<strong>for</strong> equivalent design and com<strong>for</strong>t conditions. The design tool<br />
accounts <strong>for</strong> heat transfer to <strong>the</strong> underfloor supply plenum, which<br />
can be a significant portion of <strong>the</strong> total cooling load. This allows<br />
<strong>the</strong> calculation of <strong>the</strong> plenum inlet temperature (air handler leaving<br />
temperature) to maintain a desired diffuser supply temperature.<br />
Preliminary guidance <strong>for</strong> perimeter zones is presented based<br />
on full-scale testing results. Ongoing research is scheduled to<br />
complete <strong>the</strong> development of <strong>the</strong> cooling airflow design software<br />
tool in 2008. In particular, <strong>the</strong> research will investigate <strong>the</strong><br />
development of improved models <strong>for</strong> predicting RCLR and <strong>the</strong><br />
effects of air leakage. The completed design tool will include a<br />
perimeter zone model, user interface and fur<strong>the</strong>r validation.<br />
Acknowledgments<br />
This work was supported by <strong>the</strong> Cali<strong>for</strong>nia Energy Commission<br />
(CEC) Public Interest Energy Research (PIER) Buildings<br />
Program under Contract 500-01-035. Partial funding was also<br />
provided by <strong>the</strong> <strong>Center</strong> <strong>for</strong> <strong>the</strong> <strong>Built</strong> Environment, University of<br />
Cali<strong>for</strong>nia, Berkeley (www.cbe.berkeley.edu). We would like to<br />
thank Norman Bourassa of <strong>the</strong> CEC PIER Buildings Program,<br />
who served as our Commission Project Manager. We would also<br />
like to express our sincere appreciation to Paul Linden and Anna<br />
Liu of <strong>the</strong> Department of Mechanical and Aerospace Engineering,<br />
University of Cali<strong>for</strong>nia, San Diego, who provided valuable<br />
Advertisement <strong>for</strong>merly in this space.<br />
contributions on <strong>the</strong> model <strong>for</strong>mulation and calculation methods.<br />
We also thank o<strong>the</strong>r members of our research team <strong>for</strong> <strong>the</strong>ir<br />
technical advice and insights: Allan Daly of Taylor Engineering<br />
and Hui Jin of University of Cali<strong>for</strong>nia, Berkeley.<br />
References<br />
1. Webster, T., and F. Bauman. 2006. “<strong>Design</strong> guidelines <strong>for</strong><br />
stratification in underfloor air distribution (<strong>UFAD</strong>) systems.” HPAC<br />
Engineering (6).<br />
2. Chen, Q., and L. Glicksman. 2003. System Per<strong>for</strong>mance Evaluation<br />
and <strong>Design</strong> Guidelines <strong>for</strong> DisplacementVentilation. Atlanta: ASHRAE.<br />
3. Loudermilk, K. 1999. “Underfloor air distribution solutions <strong>for</strong><br />
open office applications.” ASHRAE Transactions 105(1):605–613.<br />
4. Bauman, F. 2003. Underfloor Air Distribution (<strong>UFAD</strong>) <strong>Design</strong><br />
Guide. Atlanta: ASHRAE.<br />
5. Bauman, F., H. Jin, and T. Webster. 2006. “Heat transfer pathways<br />
in underfloor air distribution (<strong>UFAD</strong>) systems.” ASHRAETransactions<br />
112(2):567–580.<br />
6. Bauman, F., T. Webster, et al. 2007. “Energy Per<strong>for</strong>mance of <strong>UFAD</strong><br />
Systems.” Final Report to CEC PIER Program. CEC Contract No.<br />
500-01-035. <strong>Center</strong> <strong>for</strong> <strong>the</strong> <strong>Built</strong> Environment, University of Cali<strong>for</strong>nia,<br />
Berkeley. www.cbe.berkeley.edu/research/briefs-ufadmodel.htm.<br />
7. CBE. 2007. “Improvement and Refinement of EnergyPlus/<strong>UFAD</strong><br />
and <strong>Design</strong> Tool.” <strong>Center</strong> <strong>for</strong> <strong>the</strong> <strong>Built</strong> Environment, University of Cali<strong>for</strong>nia,<br />
Berkeley. www.cbe.berkeley.edu/research/ufad_designtool.htm.<br />
8. Jin, H., F. Bauman, and T. Webster. 2006. “Testing and modeling of<br />
underfloor air supply plenums.” ASHRAETransactions (112)2:581–591.<br />
4 4 A S H R A E J o u r n a l a s h r a e . o r g O c t o b e r 2 0 0 7