heydar aliyev cultural center - Kreysler & Associates
heydar aliyev cultural center - Kreysler & Associates
heydar aliyev cultural center - Kreysler & Associates

You also want an ePaper? Increase the reach of your titles
YUMPU automatically turns print PDFs into web optimized ePapers that Google loves.
<br />
<br />
ARCHITECTURAL<br />
FAÇADES for the<br />
HEYDAR ALIYEV<br />
CULTURAL CENTER:<br />
A Life Cycle Assessment<br />
Aaron Goldin<br />
Adam Jongeward<br />
Lauren Scammell<br />
Cris Wise<br />
CEE 226 – Term Project<br />
Autumn 2009<br />
1
<br />
Table of Contents<br />
ABSTRACT................................................................................................................................ 3 <br />
INTRODUCTION ....................................................................................................................... 3 <br />
PROBLEM SCOPE...................................................................................................................... 4 <br />
PROCESS ........................................................................................................................................4 <br />
ASSUMPTIONS ................................................................................................................................5 <br />
INVENTORY ANALYSIS.............................................................................................................. 6 <br />
FRP PANELS ...................................................................................................................................6 <br />
GFRC PANELS ................................................................................................................................6 <br />
MOUNTING HARDWARE ...................................................................................................................7 <br />
SHIPPING .......................................................................................................................................7 <br />
REPLACEMENT RATE ........................................................................................................................7 <br />
RECYCLING RATES............................................................................................................................7 <br />
SIMAPRO .......................................................................................................................................7 <br />
ANALYSIS................................................................................................................................. 8 <br />
SENSITIVITY ANALYSIS – INITIAL..........................................................................................................8 <br />
SENSITIVITY ANALYSIS ‐ REFINED .......................................................................................................9 <br />
LIFE CYCLE ANALYSIS RESULTS.................................................................................................. 9 <br />
INITIAL – BASELINE LCA RESULTS .......................................................................................................9 <br />
LCA RESULTS – TRANSPORTATION COMPARISON................................................................................10 <br />
LCA RESULTS – PRIMARY DRIVERS AND MITIGATION STRATEGIES..........................................................11 <br />
LIFE CYCLE COSTS ................................................................................................................... 11 <br />
CONCLUSIONS ....................................................................................................................... 12 <br />
REFERENCES........................................................................................................................... 13 <br />
APPENDIX A: SIMAPRO RESULTS – BASELINE ......................................................................... 14 <br />
APPENDIX B: SIMAPRO RESULTS – TRANSPORTATION ANALYSIS............................................ 16 <br />
APPENDIX C: INITIAL SENSITIVITY ANALYSIS RESULTS ............................................................ 17 <br />
APPENDIX D: FINAL SENSITIVITY ANALYSIS RESULTS .............................................................. 27 <br />
APPENDIX E: LIFE CYCLE COST BREAKDOWN .......................................................................... 38 <br />
<br />
2
<br />
Abstract <br />
The country of Azerbaijan is in the process of constructing a state of the art <strong>cultural</strong> <br />
<strong>center</strong> in the nation’s capital, Baku. The Heydar Aliyev Cultural Center will be covered in <br />
a large façade consisting of 18,000 separate panels. Each panel will be approximately 1 <br />
m by 2 m. The façade panels will be made out of either Fiber Reinforced Polymer (FRP) <br />
or Glass Fiber Reinforced Concrete (GFRC). To determine which panel has the lowest <br />
environmental impact a life cycle assessment (LCA) and an inventory analysis were <br />
performed for each panel type. <br />
The LCA for each panel were largely based on the manufacturing and transportation <br />
processes. Little was known about the yearly maintenance for each panel, so no panel <br />
maintenance was assumed. A replacement rate of 0.5% was chosen for each panel type. <br />
The disposal scenario for FRP was 100% land filled and for GFRC a 50% recycling rate. <br />
Due to the uncertainty of some of the required information a sensitivity analysis was <br />
performed. This analysis included variations in the manufacturing processes of FRP and <br />
GFRC, and also changing the transportation scenarios for each panel type. <br />
From the baseline analysis of FRP, the total impact was 1,760 Pt. For the GFRC panels <br />
the baseline impact was 6,450 Pt. GFRC has a 266% bigger impact than FRP. GFRC had <br />
higher impacts in all major categories except solid waste. The impacts categories that <br />
GFRC was higher in include Greenhouse Gases, Ozone Depletion, Acidification, <br />
Eutrophication, Heavy Metals, Carcinogens, Summer Smog, Winter Smog, and Energy <br />
Resources. <br />
Introduction <br />
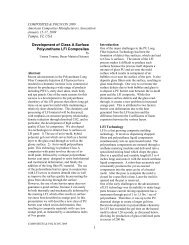
The country of Azerbaijan is currently <br />
constructing a new <strong>cultural</strong> <strong>center</strong> to house <br />
a conference hall, museum and <strong>cultural</strong> <br />
library. The building, to be known as the <br />
Heydar Aliyev Cultural Center, is of particular <br />
importance since Azerbaijan hopes to use it <br />
as part of their bid for the 2016 Olympics. <br />
The building, as seen in the architectural <br />
renderings, has an extensive façade covering <br />
its exterior. This façade will be consist of <br />
18,000 panels, approximately 1 m by 2 m. <br />
Fiber Reinforced Polymer (FRP) and Glass <br />
Fiber Reinforced Concrete (GFRC) have both <br />
been proposed as potential materials for the <br />
façade. If FRP is chosen, the panels will be <br />
manufactured in Istanbul, Turkey and <br />
transported to Baku via truck. GRFC panels <br />
Figure 1: Architectural Renderings ‐ Heydar Aliyev <br />
Cultural Center <br />
3
<br />
will be manufactured in Stuttgart, Germany and also transported to Baku via truck. To <br />
help determine the choice of material, the following report has been compiled to <br />
compare the environmental impacts of each panel type using a Life Cycle Assessment <br />
(LCA) and Inventory Analysis. This analysis was performed using SimaPro v. 7.0. Data for <br />
FRP manufacturing and transportation was obtained through the FRP manufacturer <br />
<strong>Kreysler</strong> & <strong>Associates</strong>. Data for the GFRC manufacturing process was compiled from <br />
industry standards. Material data for both FRP and GFRC were collected on a square‐<br />
foot basis. The life cycle analysis was conducted using the full building with an estimated <br />
lifespan of 50 years. The building has a total area of façade equal to 420,446 sq.ft. <br />
Problem Scope <br />
Process <br />
The following two figures present the process flow diagrams for FRP and GFRC, <br />
respectively. <br />
<br />
Figure 2: Process Flow Diagram ‐ Fiber Reinforced Polymer <br />
Figure 3: Process Flow Diagram ‐ Glass Fiber Reinforced Concrete <br />
4 <br />
<br />
There are a series of steps involved in the FRP manufacturing process: <br />
1. Apply gel‐coat as the first layer in a mold. <br />
2. Lay woven fiberglass mat in the mold. <br />
3. Cover the fiberglass with a vacuum bag and <br />
seal it with tape. <br />
4. Attach a hose to the vacuum bag and pump <br />
out the air. <br />
5. While continuing to pump the air, allow <br />
unsaturated polyester resin (UPR) and filler to <br />
enter the bag and surround the fiberglass. <br />
6. Continue to run pump until polymer sets, creating a panel. <br />
The GFRC manufacturing process is similar, except cement slurry is used as the <br />
composite matrix instead of UPR. The fiberglass is either chopped or woven, as well as <br />
alkali resistant to prevent it from reacting negatively with the concrete. The mixture can <br />
either be sprayed or poured into the mold. <br />
Assumptions <br />
Figure 4: Panel in vacuuming stage <br />
Both the FRP and GFRC manufacturing processes require use of a similar type of mold. <br />
As such, it has been chosen to neglect the mold in the analysis since their environmental <br />
effect would be the same for each material and therefore have minimal impact on our <br />
comparison. <br />
In Figure 2 and Figure 3 (above), maintenance and construction equipment are shown <br />
with hatched coloring and dotted lines. While these two items are part of the life cycle <br />
of both façade materials, it has been chosen to also neglect these aspects of the process <br />
for several reasons. Firstly, it is challenging to predict exactly what maintenance will be <br />
required for either façade throughout its life. While some cleaning, such as pressure <br />
washing, will be required, quantifying this would be extremely subjective as it is based <br />
on the desires of building owners. Secondly, according to Kresyler & <strong>Associates</strong>, FRP and <br />
GFRC are often considered “maintenance‐free.” While this may too optimistic, it leads <br />
one to believe maintenance should be minimal. <br />
Construction was also omitted from the analysis due to quantifying difficulties. Currently <br />
the specific type of equipment that will be used for each material is unknown. Most <br />
likely, due to the minimal weight of FRP, a crane will not be required. However, the use <br />
of a crane is a likely scenario for the GFRC due to its higher weight. Nonetheless, these <br />
assumptions are contingent upon many variables, including, but not limited to, <br />
construction equipment already on site, available work force, and construction cost <br />
restraints. As well, throughout the construction process, some equipment will be used <br />
for other tasks in addition to mounting the façade. As such, allocating specific <br />
equipment directly to the façade would prove too complex. Initial sensitivity analysis <br />
showed that environmental impact was highly contingent on the input value of <br />
5
<br />
construction equipment. Taking all of the above factors into account, it was decided that <br />
the construction equipment should be left out of the analysis. <br />
The manufacturing location of both materials has not yet been finalized. The proposed <br />
location for fabrication of the FRP panels is Istanbul, Turkey. Stuttgart, Germany has <br />
been proposed for the GFRC, but this is still uncertain. There is also the possibility that <br />
either material could be manufactured more locally in Azerbaijan, particularly in Baku. <br />
Based on the likelihood of these scenarios, Istanbul and Stuttgart have been chosen for <br />
the manufacturing locations for the base case analysis. In addition analysis has been <br />
conducted considering only minimal transportation, to determine the level of effect of <br />
choosing local manufacturing. Details of each of these analyses can be found in results <br />
below. <br />
Inventory Analysis <br />
FRP Panels <br />
According to the manufacturer, the composition (per square foot) of the FRP panel is: <br />
0.25 lb. gelcoat (NPG gelcoat), 1.0 lb polyester resin (Hetron 814A), 0.67 lb. alumina <br />
trihydrate filler, and 0.72 lb glass (alternating layers of 24 oz woven roving and 1.5 oz <br />
CSM). Additional materials required in the manufacturing process are vacuum bag <br />
plastic (product # RBG 2601‐MCF), which may be reused for approximately 50 parts, and <br />
rubber tape (product # GS 43 MR 1/8"x1/2"x25'), which is not reused. The <br />
manufacturing process also requires 2 hours of vacuum pumping with an 816.5 W <br />
pump. A mold is also required in the process, but since the same type of mold is use for <br />
both the FRP and GFRC, it was not included in the model. <br />
GFRC Panels <br />
Data on the specific design or manufacturing process of the GFRC panels was not <br />
available, and therefore industry standards were used to generate an approximate <br />
design. Initially, the model included a GFRC panel thickness of 3” (a verbal <br />
recommendation from an industry professional). However, after performing the <br />
sensitivity analysis (described in Section 4), it was clear a refined thickness should be <br />
determined. This updated thickness was calculated such that the GFRC and FRP panels <br />
would have equal flexural strength based on industry‐tabulated values. The average <br />
value of maximum stress for FRP is 20,000 psi, and for GFRC is from 1,300 to 2,000 psi. <br />
Flexural strength is defined as: σ = 3FL / 2bd^2, where F is the force applied in a three‐<br />
point loading test, L is the length of the specimen, b is the width, and d is the thickness. <br />
Using an average of 1650 psi for the flexural strength of GFRC, a thickness of <br />
approximately 1.5" was calculated to match the flexural strength of 0.433" (11mm) thick <br />
FRP. The estimate for the glass content of the GFRC, suggested by Bill <strong>Kreysler</strong>, was 8% <br />
by volume, and is within the normal range of industry standards. <br />
6
<br />
Mounting Hardware <br />
A conservative initial estimate of the mounting bolts for the FRP panels was set at (6) <br />
3/4”ϕ x 8” for both the FRP and GFRC. However, after the sensitivity analysis (detailed in <br />
Section 4), bolt sizing for FRP was sharpened by <strong>Kreysler</strong> & <strong>Associates</strong> to (6) 1/2"ϕ x 6" <br />
steel bolts per panel. A similar mounting configuration of (6) 1.2"ϕ x 6"steel bolts per <br />
panel was assumed for the GFRC. The 1.2" diameter bolt was determined by scaling the <br />
cross sectional area of the bolt to the weight of the GFRC panel in order to account for <br />
the additional load. <br />
Shipping <br />
Trucking mileage was estimated by measuring the direct distance from the location of <br />
manufacture to Baku, Azerbaijan in Google Earth, and multiplying by a factor of 1.5 to <br />
approximate a road path length. Shipping from Istanbul was estimated to be 1500 mi, <br />
while shipping from Stuttgart was estimated to be 2100 mi. <br />
Replacement Rate <br />
Since no hard data on the replacement rate of the paneling was available, we assumed a <br />
0.5% per year baseline in order to model this factor's impact. This is an average value <br />
over the full life span (approximately 50 years); replacement is not expected every year. <br />
Recycling Rates <br />
We assumed a 0% recycling rate for the FRP panels, as there is currently no method <br />
known to recycle FRP. A base recycling rate of concrete was assumed to be 50% in order <br />
to model that factor's sensitivity. While some reports say that almost all concrete can be <br />
recycled, it is usually is ground and reused for aggregate. Because the GFRC requires a <br />
cement slurry mixture, no aggregate is used, thus potentially changing the effective <br />
recycling rate. <br />
SimaPro <br />
A number of the aforementioned raw materials and processes were not found directly <br />
in the SimaPro database, and therefore surrogates were used, as described below. <br />
Alumina Trihydrate (ATH), a typical filler material for pigments and plastics, was not <br />
found in SimaPro. According to the Huber Materials data sheet (as provided by <strong>Kreysler</strong> <br />
& <strong>Associates</strong>), ATH is 64.9% aluminum oxide (Al2O3), and 34.6% is loss on ignition, <br />
making ATH 98.6% aluminum oxide after ignition. Therefore, it was determined that <br />
aluminum oxide, a material available in the SimaPro database, is a satisfactory <br />
surrogate. <br />
The GFRC concrete matrix was modeled using the basic concrete available in the <br />
SimaPro database. Although this is likely to be accurate, it exists as a surrogate for an <br />
unknown mix design used by the manufacturer. <br />
The alkali resistant glass (AR glass) used in the GFRC was modeled using the fiberglass <br />
material available in the SimaPro database. Although the addition of zirconia could <br />
7
<br />
make the process more energy and resource intensive, it was determined that the high <br />
uncertainty in the percentage of glass used, and the low sensitivity of that variable do <br />
not warrant a more accurate surrogate. <br />
Analysis <br />
Sensitivity Analysis – Initial <br />
As discussed in the above inventory analysis, many assumptions and estimations were <br />
made in order to obtain SimaPro inputs. As such, sensitivity analyses were conducted to <br />
determine which variables had the most acute effect. This analysis was performed by <br />
running the model with all estimated variables scaled by ± 25%. The results of these <br />
analyses were then compiled to create tornado diagrams for each environmental impact <br />
category. <br />
Figure 5: Example FRP Sensitivity Diagram <br />
8 <br />
<br />
Figure 6: Example GFRC Sensitivity Diagram<br />
Figure 5 and Figure 6 above are examples from the initial analysis showing sensitivity to <br />
emissions of CO2 equivalents. (A complete set of impact category tornado diagrams are <br />
given in Appendix C). These diagrams demonstrate the high sensitivity of the <br />
construction equipment. The decision to omit this equipment from the final analysis was <br />
based on these results as well as the high level of uncertainty in the original <br />
construction equipment value estimate. <br />
Figure 5 and Figure 6 also show the high level of sensitivity of the bolts. At this stage of <br />
analysis, the bolts were estimated to be the same size for both panel types. Since the <br />
bolts were found to have substantial effects on the final results, it <br />
was determined that the estimated bolt contribution should be refined to include the <br />
fact that the GFRC panels will require larger bolts to account for their heavier weight. <br />
Thickness of the concrete panel at this stage had been estimated at 3” based on <br />
industry recommendations. However, the sensitivity analysis showed that GFRC panel <br />
thickness is highly sensitive and therefore it was decided that the panel thickness would <br />
be refined based on the comparison of the flexural strength of the FRP panels (see <br />
inventory analysis, Section 3.0) <br />
<br />
Sensitivity Analysis ‐ Refined <br />
Following the initial round of sensitivity analysis, as well as the omission of the <br />
construction equipment and the modification of the bolt and GRFC panel thickness data, <br />
the sensitivity analysis was re‐conducted, this time also incorporating more variables. <br />
Figure 7 and Figure 8 below show the results of the sensitivity analysis for SimaPro’s <br />
single point value for FRP and GFRC respectively. From these figures, it can be seen that <br />
the Panel Size as well as the Trucking Mileage are highly sensitive for both materials.<br />
Figure 7: Example Refined FRP Sensitivity Graph <br />
9 <br />
<br />
Figure 8: Example Refined GFRC Sensitivity Graph<br />
It was interesting to note that the Alumina Trihydrate filler is very sensitive (more so <br />
than any other raw material for FRP). Although the filler is known to a high degree of <br />
certainty, this does show that Alumina Trihydrate is a potential target for further <br />
optimization. <br />
Glass percentage is shown reversed in the above figure for GFRC. In order to keep the <br />
panel thickness constant as well as the increase the glass fiber content, the amount of <br />
concrete is decreased. This reverse relationship shows that concrete is more impactful. <br />
Life Cycle Analysis Results <br />
Initial – Baseline LCA Results <br />
As mentioned previously, the baseline case <br />
was chosen with manufacturing of the FRP <br />
panels occurring in Istanbul and <br />
manufacturing of the GFRC in Stuttgart. Using <br />
SimaPro’s single score impact evaluation, FRP <br />
(single point = 1761) was found to have less <br />
environmental impact than GFRC (single <br />
point = 6447). The following figure shows the <br />
weighting of each impact category for both <br />
FRP and GFRC using SimaPro’s single point <br />
weighting system. It can be seen from this <br />
figure that GFRC has higher impact than FRP <br />
<br />
Figure 9: Baseline Individual Impact Categories <br />
<br />
in every category except solid waste. A particularly significant discrepancy is in the <br />
heavy metals and winter smog categories. It can be reasoned that these high values are <br />
the result of the high level of transportation from Stuttgart required for the GFRC and <br />
the production process of Portland cement, respectively. The highest impact category <br />
for the FRP is heavy metals, which is likely attributable to the transportation <br />
requirement from Istanbul, but it is still significantly lower than the impact from heavy <br />
metals for the GFRC. <br />
LCA Results – Transportation Comparison <br />
The sensitivity analysis determined that the results are highly dependent on the amount <br />
of transportation used for both the FRP and GFRC. Since the location of fabrication for <br />
both materials is uncertain, it was decided that the best way to compare both materials <br />
was to conduct additional analyses for minimal transportation. The value of <br />
transportation for these cases was set to 200 miles, approximately 10% of the distance <br />
required for original transportation of the GFRC from Stuttgart. Transportation was not <br />
set to zero since it would be highly likely that even if the materials were fabricated <br />
locally they would still need to be transported a minimal distance. <br />
<br />
Figure 10: Transportation Analysis Summary <br />
Figure 10 shows that regardless of transportation, GFRC still has a large impact on <br />
winter smog. Reduction of transportation for the GFRC however, decreases its heavy <br />
metals impact to a value approximately equal to the FRP fabricated in Istanbul. On the <br />
other hand, the FRP without transportation has the lowest impact from heavy metals. <br />
For most impact categories the level of difference between each of the four scenarios is <br />
minimal, making a final conclusion between the materials difficult. <br />
10
<br />
LCA Results – Primary Drivers and Mitigation Strategies <br />
Reviewing each stage of the LCA, weight appears to be a common thread for <br />
performance of both materials. Weight depends on the amount of material used, and <br />
subsequently has an effect on the steel mounting brackets, construction equipment <br />
requirements, transportation emissions, as well as the building’s structural system. <br />
FRP’s reduced weight helps to make it more competitive than GFRC. <br />
Heavy metals were a high impact category for both GFRC and FRP. These emissions are <br />
primarily caused by use of diesel trucks for the panel’s transportation. The steel <br />
mounting brackets are also partly contributable. One method of reducing environmental <br />
impact from heavy metals is to produce the chosen material locally. This is more likely a <br />
possible scenario for the GFRC since its manufacturing location is less certain. However, <br />
choosing to produce GFRC locally creates another important decision that needs to be <br />
made. Winter Smog, another high impact category for GFRC, is a local pollutant. If the <br />
manufacturing of GFRC is completed in Azerbaijan, the pollutant would have most effect <br />
on the local area. As such, Azerbaijan will need to decide whether or not that they are <br />
willing to accept the higher local environmental impact in return for a lower global <br />
environmental impact. <br />
A second strategy for reducing heavy metal impact would be to use an alternative mode <br />
of transportation. For instance, both trains and barges are known to be more efficient <br />
than diesel trucks. However, this strategy depends on the availability of equipment and <br />
specific location of the project. <br />
A third strategy for reducing heavy metals is to simply use FRP instead of GFRC. <br />
Producing GRFC in Stuttgart had an impact for heavy metals approximately five and half <br />
times greater than the FRP produced in Istanbul. Both transportation and bolt <br />
requirements are less for the FRP than the GFRC, so FRP is the best option for this <br />
category. <br />
A large portion of GFRC’s environmental impact was found to be the result of winter <br />
smog. There are several potential alternatives that could be used to reduce this impact. <br />
Firstly, use of fly ash in the concrete mix would reduce the overall Portland cement <br />
content, which is the primary cause of the high winter smog of concrete. Furthermore, <br />
currently in Italy, a specialized concrete that claims to be ‘smog eating’ is under <br />
development. This concrete, known as TX Active, and claims to convert NOx and SOx <br />
into harmless nitrates and sulfates, respectively, when the concrete is exposed to smog. <br />
This concrete is currently experimental, but the option of its use still exists. Finally, and <br />
most obvious, choosing the FRP panels can easily minimize winter smog because no <br />
Portland cement is required. <br />
Life Cycle Costs <br />
The cost for the FRP panels is $26.16 per square foot and the total cost is $11.0 million. <br />
These cost figures were directly from the manufacturer, <strong>Kreysler</strong> & <strong>Associates</strong>. The total <br />
transportation cost for FRP from Turkey is $260,000. The end of life disposal cost of FRP <br />
11
<br />
will be $1000, this will make the total life cycle cost $11.2 million. GFRC panels will cost <br />
$30.9 per square foot making the total manufacturing cost $13.0 million. Due to the <br />
weight of GFRC and the longer distance of shipping from Stuttgart, the shipping cost will <br />
be $4.2 million. The end of life disposal will cost $1,400, this makes the total life cycle <br />
cost of GFRC $17.3 million. Due to the international nature of the project there is more <br />
uncertainty in the cost of GFRC since we were not in contact with the manufacturer. <br />
Therefore less emphasis was placed on the life cycle cost analysis for the two panels. <br />
Overall, it is safe to say that the heavier GFRC will make the construction, <br />
transportation, and tipping more expensive than FRP. <br />
Conclusions <br />
In conclusion, initially assumptions found FRP to be more environmentally friendly with <br />
a single score value from SimaPro 72% less than the GFRC. Minimizing transportation <br />
requirements for both materials showed that the FRP still remained higher than the <br />
GFRC in all impact categories except for summer smog. However, the GFRC did become <br />
significantly more competitive when the transportation was minimized. Taking this <br />
information into consideration, along with the fact that FRP is highly durable and has a <br />
higher strength per unit weight, we recommend the use of FRP for the Heydar Aliyev <br />
Cultural Center. However, if GFRC is chosen, we highly recommend that it be produced <br />
locally such that the environmental impact due to transportation are minimized. <br />
<br />
<br />
<br />
<br />
<br />
<br />
<br />
<br />
<br />
<br />
<br />
<br />
<br />
<br />
<br />
<br />
<br />
<br />
<br />
<br />
<br />
12
<br />
References <br />
Research and Innovative Technology Administration, Bureau of Transportation<br />
Statistics. "Average Freight Revenue Per Ton‐mile." Web. 3 Nov 2009. <br />
. <br />
Hypertextbook. "Density of Glass." Web. 3 Nov 2009. <br />
. <br />
GFRC Recommended Practice for Glass Fiber Reinforced Concrete Panels. 3rd ed. <br />
Pre‐Cast Pre‐Stressed. Concrete Institute, Print. <br />
GFRC Recommended Practice for Glass Fiber Reinforced Concrete Panels. 3rd <br />
ed. Pre‐Cast Pre‐Stressed. Concrete Institute, Print. <br />
SkyScraper City. "Heydar Aliyev Cultural Center." Web. 3 Nov 2009. <br />
. <br />
<strong>Kreysler</strong>, Bill. Personal Interview. 29 Sept 2009. <br />
Miller, Lia. “Smog‐Eating Cement.” New York Times. Dec 9, 2007. <br />
Portland Bolt and Manufacturing Company. "Portland Bolt Calculator." Web. 11 <br />
Nov 2009. . <br />
RS Means Building Construction Cost Data. 67th ed. RS Means, 2009. Print. <br />
Airtech Advanced Materials Group. "Vacuum Bagging Materials." Web. 11 Nov <br />
2009. <br />
. <br />
Fibre Glast Development Corporation. "Vacuum Bagging Supplies." Web. 15 Nov <br />
2009. . <br />
<br />
<br />
<br />
<br />
<br />
<br />
<br />
<br />
<br />
<br />
<br />
13
<br />
Appendix A: SimaPro Results – Baseline <br />
14 <br />
<br />
<br />
<br />
<br />
<br />
<br />
<br />
<br />
<br />
<br />
<br />
<br />
<br />
<br />
<br />
<br />
<br />
<br />
<br />
15 <br />
<br />
Appendix B: SimaPro Results – Transportation Analysis <br />
<br />
16 <br />
<br />
<br />
Appendix C: Initial Sensitivity Analysis Results <br />
<br />
17 <br />
<br />
<br />
<br />
<br />
18 <br />
<br />
<br />
<br />
<br />
19 <br />
<br />
<br />
<br />
<br />
20 <br />
<br />
<br />
<br />
<br />
21 <br />
<br />
<br />
<br />
<br />
22 <br />
<br />
<br />
<br />
<br />
23 <br />
<br />
<br />
<br />
<br />
24 <br />
<br />
<br />
<br />
<br />
25 <br />
<br />
<br />
<br />
<br />
26 <br />
<br />
<br />
Appendix D: Final Sensitivity Analysis Results <br />
<br />
27 <br />
<br />
<br />
<br />
<br />
28 <br />
<br />
<br />
<br />
<br />
29 <br />
<br />
<br />
<br />
<br />
30 <br />
<br />
<br />
<br />
<br />
31 <br />
<br />
<br />
<br />
<br />
32 <br />
<br />
<br />
<br />
<br />
33 <br />
<br />
<br />
<br />
<br />
34 <br />
<br />
<br />
<br />
<br />
35 <br />
<br />
<br />
<br />
<br />
36 <br />
<br />
<br />
<br />
<br />
37 <br />
<br />
<br />
Appendix E: Life Cycle Cost Breakdown <br />
38 <br />