Monitoring the Mode and Tempo of Concerted Evolution ... - Genetics
Monitoring the Mode and Tempo of Concerted Evolution ... - Genetics
Monitoring the Mode and Tempo of Concerted Evolution ... - Genetics

Create successful ePaper yourself
Turn your PDF publications into a flip-book with our unique Google optimized e-Paper software.
Copyright Ó 2005 by <strong>the</strong> <strong>Genetics</strong> Society <strong>of</strong> America<br />
DOI: 10.1534/genetics.105.047670<br />
<strong>Monitoring</strong> <strong>the</strong> <strong>Mode</strong> <strong>and</strong> <strong>Tempo</strong> <strong>of</strong> <strong>Concerted</strong> <strong>Evolution</strong> in <strong>the</strong><br />
Drosophila melanogaster rDNA Locus<br />
Karin Tetzlaff Averbeck <strong>and</strong> Thomas H. Eickbush 1<br />
Department <strong>of</strong> Biology, University <strong>of</strong> Rochester, Rochester, New York 14627-0211<br />
Manuscript received July 1, 2005<br />
Accepted for publication August 25, 2005<br />
ABSTRACT<br />
Non-LTR retrotransposons R1 <strong>and</strong> R2 have persisted in rRNA gene loci (rDNA) since <strong>the</strong> origin <strong>of</strong><br />
arthropods despite <strong>the</strong>ir continued elimination by <strong>the</strong> recombinational mechanisms <strong>of</strong> concerted<br />
evolution. This study evaluated <strong>the</strong> short-term evolutionary dynamics <strong>of</strong> <strong>the</strong> rDNA locus by measuring <strong>the</strong><br />
divergence among replicate Drosophila melanogaster lines after 400 generations. The total number <strong>of</strong> rDNA<br />
units on <strong>the</strong> X chromosome <strong>of</strong> each line varied from 140 to 310, while <strong>the</strong> fraction <strong>of</strong> units inserted with<br />
R1 <strong>and</strong> R2 retrotransposons ranged from 37 to 65%. This level <strong>of</strong> variation is comparable to that found in<br />
natural population surveys. Variation in locus size <strong>and</strong> retrotransposon load was correlated with large<br />
changes in <strong>the</strong> number <strong>of</strong> uninserted <strong>and</strong> R1-inserted units, yet <strong>the</strong> numbers <strong>of</strong> R2-inserted units were<br />
relatively unchanged. Intergenic spacer (IGS) region length variants were also used to evaluate changes in<br />
<strong>the</strong> rDNA loci. All IGS length variants present in <strong>the</strong> lines showed significant increases <strong>and</strong> decreases <strong>of</strong><br />
copy number. These studies, combined with previous data following specific R1 <strong>and</strong> R2 insertions in <strong>the</strong>se<br />
lines, help to define <strong>the</strong> type <strong>and</strong> distribution, both within <strong>the</strong> locus <strong>and</strong> within <strong>the</strong> individual units, <strong>of</strong><br />
recombinational events that give rise to <strong>the</strong> concerted evolution <strong>of</strong> <strong>the</strong> rDNA locus.<br />
TANDEMLY repeated multigene families frequently<br />
undergo concerted evolution, a phenomenon in<br />
which genes in a gene family show more sequence homogeneity<br />
within a species than between species. It has<br />
been suggested that homogenization occurs most rapidly<br />
within a chromosome (Schlötterer <strong>and</strong> Tautz 1994)<br />
by recombinational mechanisms such as gene conversion,<br />
intrachromosomal loop deletions, <strong>and</strong> unequal<br />
crossovers between sister chromatids (Dover 1994; Elder<br />
<strong>and</strong> Turner 1995; Liao 1999). New sequence variants<br />
within an array can also increase in frequency <strong>and</strong><br />
spread through a population by segregation <strong>and</strong> recombination<br />
between homologs <strong>and</strong> can eventually become<br />
fixed in <strong>the</strong> species by natural selection, molecular<br />
drive, or drift.<br />
The ribosomal RNA gene locus (rDNA) is <strong>of</strong> particular<br />
interest for <strong>the</strong> study <strong>of</strong> concerted evolution. In<br />
eukaryotes, <strong>the</strong> rDNA locus is composed <strong>of</strong> hundreds to<br />
thous<strong>and</strong>s <strong>of</strong> t<strong>and</strong>emly repeated rRNA genes interspersed<br />
with noncoding, intergenic spacer (IGS) regions<br />
(Long <strong>and</strong> Dawid 1980). High redundancy <strong>of</strong> rRNA<br />
genes is critical for fitness because <strong>the</strong> ribosomal translational<br />
machinery <strong>of</strong> <strong>the</strong> cell is necessary in large quantities<br />
for growth <strong>and</strong> <strong>the</strong> RNA components <strong>of</strong> <strong>the</strong><br />
ribosome structure do not benefit from translational<br />
amplification. Homogenization <strong>of</strong> <strong>the</strong> repeats within<br />
species is thought to be beneficial to <strong>the</strong> organism by<br />
1 Corresponding author: University <strong>of</strong> Rochester, Hutchison Hall,<br />
Rochester, NY 14627-0211. E-mail: eick@mail.rochester.edu<br />
<strong>Genetics</strong> 171: 1837–1846 (December 2005)<br />
ensuring that all ribosomal subunits are equally compatible<br />
with o<strong>the</strong>r components <strong>of</strong> <strong>the</strong> translational<br />
machinery. On <strong>the</strong> basis <strong>of</strong> population genetic studies,<br />
various recombinational models for explaining <strong>the</strong><br />
homogeneity <strong>of</strong> <strong>the</strong> t<strong>and</strong>emly repeated rRNA genes<br />
have been proposed (Coen et al. 1982; Lyckegaard <strong>and</strong><br />
Clark 1991; Schlötterer <strong>and</strong> Tautz 1994; Polanco<br />
et al. 1998, 2000).<br />
An added complexity to underst<strong>and</strong>ing <strong>the</strong> evolution<br />
<strong>of</strong> <strong>the</strong> rDNA loci is that in many animal phyla <strong>the</strong>se loci<br />
are home to specialized transposable elements (Eickbush<br />
2002; Burke et al. 2003; Kojima <strong>and</strong> Fujiwara 2004;<br />
Penton <strong>and</strong> Crease 2004). Best studied are <strong>the</strong> R1 <strong>and</strong><br />
R2 non-LTR retrotransposable elements <strong>of</strong> arthropods.<br />
These elements insert into <strong>the</strong> 28S gene <strong>and</strong> render <strong>the</strong><br />
inserted genes nonfunctional (Long <strong>and</strong> Dawid 1979;<br />
Kidd <strong>and</strong> Glover 1981; Eickbush <strong>and</strong> Eickbush<br />
2003). R1 <strong>and</strong> R2 have persisted via vertical descent in<br />
arthropods since <strong>the</strong> origin <strong>of</strong> <strong>the</strong> phylum, suggesting<br />
that occasional retrotransposition has been an effective<br />
strategy to evade elimination from <strong>the</strong> rDNA locus by<br />
<strong>the</strong> recombinational mechanisms <strong>of</strong> concerted evolution<br />
(Burke et al. 1998; Malik et al. 1999; Gentile et al.<br />
2001).<br />
To derive a comprehensive population genetics model<br />
for <strong>the</strong> evolution <strong>of</strong> <strong>the</strong> rDNA locus <strong>and</strong> its R1 <strong>and</strong> R2<br />
inhabitants, one must measure changes in multiple properties<br />
<strong>of</strong> <strong>the</strong> locus over time. These properties include<br />
<strong>the</strong> number <strong>of</strong> rDNA units, <strong>the</strong> sequence <strong>of</strong> <strong>the</strong> units,<br />
IGS length variation, <strong>the</strong> fraction <strong>of</strong> <strong>the</strong> units inserted
1838 K. T. Averbeck <strong>and</strong> T. H. Eickbush<br />
with R1 <strong>and</strong> R2, <strong>the</strong> frequency <strong>of</strong> R1 <strong>and</strong> R2 retrotransposition,<br />
<strong>and</strong>, finally, <strong>the</strong> distribution <strong>of</strong> this variation<br />
across <strong>the</strong> locus. To acquire <strong>the</strong>se data, we are conducting<br />
a long-term study <strong>of</strong> <strong>the</strong> rDNA loci in <strong>the</strong> Harwich<br />
mutation-accumulation lines <strong>of</strong> Drosophila melanogaster.<br />
The Harwich lines are replicate stocks derived from a<br />
highly inbred line, separated over 400 generations ago<br />
(Mackay et al. 1992). Using <strong>the</strong> highly variable 59 ends<br />
<strong>of</strong> R1 <strong>and</strong> R2 that are generated during insertion, <strong>the</strong><br />
rates <strong>of</strong> R1 <strong>and</strong> R2 retrotransposition <strong>and</strong> elimination<br />
in <strong>the</strong>se lines have been previously estimated (Pérez-<br />
González <strong>and</strong> Eickbush 2002; Pérez-González et al.<br />
2003). This report continues our characterization <strong>of</strong> <strong>the</strong><br />
evolutionary dynamics <strong>of</strong> <strong>the</strong> Harwich rDNA loci, this<br />
time with an emphasis on locus structure. We quantitated<br />
differences in <strong>the</strong> X-chromosome-linked rDNA<br />
loci, including <strong>the</strong> number <strong>of</strong> units in each locus, <strong>the</strong><br />
load <strong>of</strong> transposable element insertions, <strong>and</strong> variation<br />
in <strong>the</strong> IGS. Our results show a remarkably dynamic locus<br />
with significant changes in its size <strong>and</strong> composition in<br />
only 400 generations. The combined analysis <strong>of</strong> R1, R2,<br />
<strong>and</strong> IGS markers in <strong>the</strong>se lines provides insights into <strong>the</strong><br />
properties <strong>of</strong> <strong>the</strong> recombinational mechanisms that<br />
drive <strong>the</strong> concerted evolution <strong>of</strong> <strong>the</strong> rDNA locus.<br />
MATERIALS AND METHODS<br />
Fly stocks <strong>and</strong> DNA isolation: The Harwich stocks were a<br />
gift from T. F. C. Mackay. Line number designations were consistent<br />
with line numbers in Mackay et al. (1992), <strong>and</strong> flies<br />
were collected at various times from <strong>the</strong> 395th to <strong>the</strong> 415th<br />
generation. Genomic DNA was isolated from 50 females <strong>and</strong><br />
75 males per line as described in Eickbush <strong>and</strong> Eickbush<br />
(1995).<br />
Sou<strong>the</strong>rn genomic blots: For <strong>the</strong> genomic blots, 3 mg DNA<br />
was restriction digested <strong>and</strong> separated on 1.0% agarose gels.<br />
After transfer <strong>of</strong> <strong>the</strong> genomic DNA to nitrocellulose paper, <strong>the</strong><br />
paper was hybridized in 23 SSC, 53 Denhardt’s at 65° for<br />
14 hr as described in Eickbush <strong>and</strong> Eickbush (1995). Final<br />
washing <strong>of</strong> <strong>the</strong> filters was in 0.53 SSC at 65°. Gene sequences<br />
used for <strong>the</strong> hybridization probes were amplified via PCR from<br />
genomic DNA. PCR primers 59-TTAGTGGGAGATATTAGA<br />
CCTC-39 <strong>and</strong> 59-TGAACACCGAGATCAAGTC-39, which amplified<br />
a region extending from position 6100 to 6521 (Tautz<br />
et al. 1988), were used to generate <strong>the</strong> 28S probe, <strong>and</strong><br />
59-GCCGACCTCGCATTGTTC-39 <strong>and</strong> 59-TTTGTATTATACC<br />
GTAACG-39, which amplified a region extending from position<br />
10881 to 11184 (Tautzet al. 1988), were used to generate<br />
<strong>the</strong> external transcribed spacer (ETS) probe. Primers were<br />
syn<strong>the</strong>sized by Invitrogen Custom Primers. Final PCR products<br />
to be used as probes were gel purified <strong>and</strong> r<strong>and</strong>om primer<br />
labeled with [a- 32 P]dCTP as described for <strong>the</strong> Rediprime II<br />
R<strong>and</strong>om Prime labeling system (Amersham Biosciences).<br />
Hybridized <strong>and</strong> washed filters were exposed to a Phosphor-<br />
Imager screen for 36–72 hr, <strong>and</strong> <strong>the</strong> images were scanned<br />
with a Molecular Dynamics PhosphorImager scanner. The<br />
image was analyzed with ImageQuant s<strong>of</strong>tware to produce<br />
signal traces <strong>and</strong> to quantitate b<strong>and</strong> intensities.<br />
Quantitation <strong>of</strong> full-length R2 elements: The number <strong>of</strong><br />
full-length R2 elements was determined by PCR amplification<br />
using <strong>the</strong> 59 end-labeled primer 59-GTTTAGCATTACCGG<br />
GACCAC-39, which anneals to bases 145–165 <strong>of</strong> full-length<br />
R2 elements, <strong>and</strong> <strong>the</strong> primer 59-TGCCCAGTGCTCTGAAT<br />
GTC-39, which anneals to <strong>the</strong> 28S gene sequence 60–80 bp<br />
upstream <strong>of</strong> <strong>the</strong> R2 insertion site. End labeling <strong>of</strong> <strong>the</strong> R2 primer,<br />
PCR amplification <strong>of</strong> both male <strong>and</strong> female genomic DNA,<br />
<strong>and</strong> separation <strong>of</strong> <strong>the</strong> PCR products on 8% high-voltage denaturing<br />
polyacrylamide gels are described in Pérez-González<br />
<strong>and</strong> Eickbush (2002). PCR amplifications <strong>of</strong> 59 ends <strong>of</strong> fulllength<br />
R2 elements produced multiple distinct product<br />
lengths (see Pérez-González <strong>and</strong> Eickbush 2002, Figure 3A).<br />
The relative intensity <strong>of</strong> each b<strong>and</strong> was quantitated from <strong>the</strong><br />
PhosphorImager scan. To adjust for <strong>the</strong> increased PCR amplification<br />
efficiency <strong>of</strong> shorter DNA fragments, <strong>the</strong> expected<br />
intensity per copy was calculated with a regression analysis<br />
using single copy variants as reference markers. PCR amplification<br />
<strong>of</strong> <strong>the</strong> full-length R2 elements in males produced 11–16<br />
different PCR fragments, representing variants in both <strong>the</strong><br />
X- <strong>and</strong> <strong>the</strong> Y-linked rDNA locus. Within each amplification<br />
reaction, b<strong>and</strong>s were defined as representing single copy or<br />
multicopy variants. The copy numbers <strong>of</strong> more intense, multicopy<br />
b<strong>and</strong>s were <strong>the</strong>n determined. Female DNA in all stocks<br />
produced ei<strong>the</strong>r four or five fragments (X-linked locus only).<br />
Comparison <strong>of</strong> <strong>the</strong> b<strong>and</strong>s generated from male <strong>and</strong> female<br />
DNA from each line was used to confirm which <strong>of</strong> <strong>the</strong> X-linked<br />
b<strong>and</strong>s represented single copies <strong>and</strong> to provide data for <strong>the</strong><br />
linear regression.<br />
RESULTS<br />
Variation in <strong>the</strong> fraction <strong>of</strong> 28S genes containing R1<br />
<strong>and</strong> R2: The fraction <strong>of</strong> X-chromosome-linked 28S<br />
rRNA genes inserted with R1 <strong>and</strong> R2 was determined<br />
for each Harwich line by quantitative Sou<strong>the</strong>rn analysis<br />
<strong>of</strong> genomic DNA. This approach was possible because <strong>of</strong><br />
<strong>the</strong> high level <strong>of</strong> sequence uniformity <strong>of</strong> <strong>the</strong> 28S rRNA<br />
gene, <strong>the</strong> R1 <strong>and</strong> R2 elements, <strong>and</strong> <strong>the</strong> 39 junction <strong>of</strong><br />
<strong>the</strong>se elements with <strong>the</strong> 28S gene (Eickbush <strong>and</strong><br />
Eickbush 1995; La<strong>the</strong> et al. 1995; La<strong>the</strong> <strong>and</strong> Eickbush<br />
1997). To conduct <strong>the</strong> analysis, Sou<strong>the</strong>rn blots <strong>of</strong> triple<br />
restriction digested (ClaI, BamHI, <strong>and</strong> PstI) female DNA<br />
from each stock was probed with a 28S gene fragment<br />
located downstream <strong>of</strong> <strong>the</strong> R1 <strong>and</strong> R2 insertion sites.<br />
A diagram <strong>of</strong> <strong>the</strong> 28S gene indicating <strong>the</strong> locations <strong>of</strong><br />
restriction sites <strong>and</strong> <strong>the</strong> probe used in <strong>the</strong> analysis is<br />
shown in Figure 1A, <strong>and</strong> an example <strong>of</strong> a resulting genomic<br />
blot is shown in Figure 1B. The restriction digest<br />
produced three fragment types: uninserted 28S genes<br />
(2.3-kb ClaI-ClaI), 28S genes inserted with R2 (1.5-kb<br />
PstI-ClaI), <strong>and</strong> 28S genes inserted with R1 (0.7-kb<br />
BamHI-ClaI). The rare 28S genes with both R1 <strong>and</strong> R2<br />
insertions (double insertions) were scored only as R1inserted<br />
genes in this blot because <strong>the</strong> R1 insertion site<br />
is located on <strong>the</strong> 28S gene between <strong>the</strong> hybridization<br />
probe region <strong>and</strong> <strong>the</strong> R2 insertion site. The relative intensity<br />
<strong>of</strong> <strong>the</strong> hybridization to <strong>the</strong>se three b<strong>and</strong>s represented<br />
<strong>the</strong> relative proportions <strong>of</strong> <strong>the</strong> three types <strong>of</strong><br />
rDNA units in <strong>the</strong> locus. This Sou<strong>the</strong>rn analysis was<br />
repeated multiple times for each Harwich line, <strong>and</strong> <strong>the</strong><br />
mean fractions <strong>of</strong> rDNA units that were uninserted, R1<br />
inserted, <strong>and</strong> R2 inserted were calculated (Table 1).<br />
The fraction <strong>of</strong> uninserted rDNA units among <strong>the</strong><br />
Harwich lines ranged from 35 to 63%, <strong>the</strong> fraction <strong>of</strong> <strong>the</strong>
Figure 1.—Retrotransposable element insertions in <strong>the</strong><br />
rRNA gene (rDNA) loci <strong>of</strong> D. melanogaster. (A) The t<strong>and</strong>emly<br />
repeated rDNA units (top) are shown with no insertion, an R1<br />
element, an R2 element, or both R1 <strong>and</strong> R2 elements in <strong>the</strong><br />
28S gene. An exp<strong>and</strong>ed diagram <strong>of</strong> an rDNA unit includes<br />
both full-length R1 <strong>and</strong> R2 insertions. Solid bars represent<br />
<strong>the</strong> 18S, 5.8S, <strong>and</strong> 28S rRNA genes, <strong>and</strong> thin open bars represent<br />
<strong>the</strong> ETS, internal transcribed spacers (ITS), <strong>and</strong> IGS.<br />
The locations <strong>of</strong> restriction enzyme cleavage sites <strong>and</strong> <strong>the</strong><br />
probe used in B are indicated. (B) A sample Sou<strong>the</strong>rn blot<br />
used to determine <strong>the</strong> fraction <strong>of</strong> inserted <strong>and</strong> uninserted<br />
rDNA units in <strong>the</strong> Harwich lines. Genomic DNA from females<br />
<strong>of</strong> each line was digested with BamHI, ClaI, <strong>and</strong> PstI, fractioned<br />
through a 1% agarose gel, <strong>and</strong> transferred to nitrocellulose.<br />
The resulting blot was probed with <strong>the</strong> 28S gene<br />
segment indicated in A. Uninserted rDNA units were represented<br />
by a 2.2-kb ClaI-ClaI fragment, R1-inserted <strong>and</strong> doubly<br />
inserted units by a 0.6-kb BamHI-ClaI fragment, <strong>and</strong> R2inserted<br />
units by a 1.4-kb PstI-ClaI fragment. DNA markers<br />
were run in <strong>the</strong> first <strong>and</strong> last lanes with <strong>the</strong> fragment sizes indicated<br />
on <strong>the</strong> left.<br />
units inserted with R1 elements ranged from 25 to 53%,<br />
<strong>and</strong> <strong>the</strong> fraction inserted with only an R2 element<br />
ranged from 8 to 17%. These tw<strong>of</strong>old differences suggested<br />
that significant changes had occurred in <strong>the</strong><br />
rDNA loci <strong>of</strong> <strong>the</strong> Harwich lines.<br />
Variation in <strong>the</strong> size <strong>of</strong> <strong>the</strong> rDNA locus: Unlike <strong>the</strong><br />
highly uniform sequence found at <strong>the</strong> 39 ends <strong>of</strong> <strong>the</strong> R1<br />
<strong>and</strong> R2 elements, <strong>the</strong> 59 ends are variable. This variation<br />
includes large deletions <strong>of</strong> <strong>the</strong> 59 end <strong>of</strong> <strong>the</strong> element <strong>and</strong><br />
small duplications <strong>and</strong>/or deletions <strong>of</strong> <strong>the</strong> 28S sequences<br />
upstream <strong>of</strong> <strong>the</strong> insertion site. Variation <strong>of</strong> R1 <strong>and</strong><br />
R2 59 junctions is similar to that found in o<strong>the</strong>r non-LTR<br />
retrotransposons <strong>and</strong> is <strong>the</strong> result <strong>of</strong> <strong>the</strong> retrotranspo-<br />
<strong>Evolution</strong> <strong>of</strong> <strong>the</strong> rDNA Locus 1839<br />
sition mechanism used by <strong>the</strong>se elements (Luan et al.<br />
1993). PCR amplification has previously been used to<br />
score all 59 variants <strong>of</strong> R1 <strong>and</strong> R2 in <strong>the</strong> Harwich lines<br />
(see Pérez-González <strong>and</strong> Eickbush 2002; Pérez-<br />
González et al. 2003 for a complete description <strong>of</strong> <strong>the</strong><br />
R1 <strong>and</strong> R2 59 variants found in <strong>the</strong>se lines).<br />
The size <strong>of</strong> <strong>the</strong> rDNA locus on <strong>the</strong> X chromosome in<br />
each <strong>of</strong> <strong>the</strong> Harwich lines was calculated by counting <strong>the</strong><br />
total number <strong>of</strong> R2 elements <strong>and</strong> dividing that number<br />
by <strong>the</strong> fraction <strong>of</strong> <strong>the</strong> rDNA units represented by those<br />
elements. R2-inserted units provided better accuracy<br />
because <strong>the</strong> R2 elements were present in lower numbers,<br />
<strong>the</strong>y showed less variation between lines, <strong>and</strong> <strong>the</strong>ir<br />
retrotransposition machinery is particularly prone to<br />
generating 59-end variation. In contrast, R1 elements<br />
were two to four times more abundant <strong>and</strong> .70% <strong>of</strong> <strong>the</strong><br />
copies were full-length elements with similar 59 ends,<br />
making it more difficult to quantitate <strong>the</strong>ir absolute<br />
numbers. The number <strong>of</strong> 59-truncated R2 elements<br />
identified on <strong>the</strong> X chromosome <strong>of</strong> each stock varied<br />
from 7 to 10 (Pérez-González et al. 2003, Figure 3B). To<br />
determine <strong>the</strong> number <strong>of</strong> full-length R2 elements on<br />
<strong>the</strong> X chromosome, PCR amplifications <strong>of</strong> <strong>the</strong> 59 ends <strong>of</strong><br />
full-length R2 elements were separated on high-voltage<br />
denaturing gels (see example in Pérez-González <strong>and</strong><br />
Eickbush 2002, Figure 2A). One primer was end labeled<br />
with 32 P, which allowed quantitation <strong>of</strong> b<strong>and</strong>s from<br />
a phosphorimage scan <strong>of</strong> <strong>the</strong> gel. Separation on <strong>the</strong> gel<br />
resulted in a dominant b<strong>and</strong> representing <strong>the</strong> canonical<br />
full-length R2 elements <strong>and</strong> a series <strong>of</strong> variant b<strong>and</strong>s<br />
ranging from 20 bp longer to 43 bp shorter than <strong>the</strong><br />
canonical b<strong>and</strong>. B<strong>and</strong> intensities were quantitated, <strong>and</strong><br />
<strong>the</strong> copy number for each b<strong>and</strong> was determined using a<br />
regression analysis to compensate for differential PCR<br />
amplification <strong>of</strong> different length DNA fragments (see<br />
materials <strong>and</strong> methods for a description <strong>of</strong> this quantitation).<br />
The total number <strong>of</strong> full-length <strong>and</strong> 59-truncated<br />
R2 elements scored in each <strong>of</strong> <strong>the</strong> Harwich stocks by<br />
<strong>the</strong>se PCR approaches ranged from 27 to 32 elements.<br />
Occasionally, both R1 <strong>and</strong> R2 elements can insert in<br />
one rDNA unit. Such units were scored as R1-inserted<br />
units in <strong>the</strong> Sou<strong>the</strong>rn blots <strong>and</strong>, subsequently, in <strong>the</strong><br />
fractions presented in Table 1. To calculate locus size on<br />
<strong>the</strong> basis <strong>of</strong> <strong>the</strong> fraction <strong>of</strong> singly inserted R2 units, it was<br />
necessary to subtract those R2 elements that are part <strong>of</strong><br />
double insertions from <strong>the</strong> total number <strong>of</strong> R2 elements<br />
determined above. The number <strong>of</strong> doubly inserted<br />
units was scored with a series <strong>of</strong> PCR amplifications in<br />
which one primer annealed to R2 sequences near <strong>the</strong> 39<br />
end <strong>of</strong> <strong>the</strong> element <strong>and</strong> a series <strong>of</strong> primers annealed to<br />
different regions within <strong>the</strong> R1 element (Pérez-González<br />
<strong>and</strong> Eickbush 2002). Five rDNA units on <strong>the</strong> X chromosome<br />
were found to be inserted with both R1 <strong>and</strong><br />
R2 in each <strong>of</strong> <strong>the</strong> Harwich lines. Subtracting <strong>the</strong> five<br />
double-inserted units from <strong>the</strong> total number <strong>of</strong> R2 insertions,<br />
<strong>the</strong> number <strong>of</strong> R2-only inserted rDNA units was<br />
found to vary from 22 to 27 (Table 1). Dividing <strong>the</strong>se
1840 K. T. Averbeck <strong>and</strong> T. H. Eickbush<br />
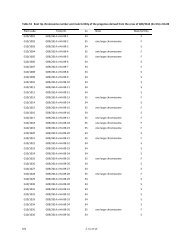
TABLE 1<br />
Fraction <strong>of</strong> units in <strong>the</strong> rDNA locus inserted with transposable elements<br />
Harwich stock no. N a % uninserted % R1 inserted % R2 inserted b Counted R2 elements b<br />
1 5 34.8 6 1.6 53.3 6 1.8 12.0 6 0.6 27<br />
2 8 63.2 6 2.1 24.6 6 1.9 12.3 6 1.1 26<br />
3 5 61.9 6 4.6 28.3 6 3.9 9.9 6 1.1 26<br />
4 6 59.0 6 1.7 28.7 6 2.0 12.3 6 0.6 25<br />
5 5 50.7 6 2.6 32.1 6 2.9 17.2 6 0.3 24<br />
7 4 58.8 6 3.2 29.3 6 3.6 11.9 6 0.7 26<br />
8 5 62.2 6 2.5 29.3 6 2.3 8.4 6 0.4 26<br />
14 5 52.3 6 2.2 37.9 6 2.4 9.8 6 0.4 25<br />
15 6 60.6 6 3.6 29.7 6 3.7 9.7 6 1.1 24<br />
17 5 45.2 6 2.7 41.3 6 3.4 13.5 6 1.0 25<br />
18 5 50.4 6 2.8 36.7 6 3.0 13.0 6 0.7 24<br />
21 3 56.9 6 6.1 34.0 6 6.3 9.1 6 0.8 22<br />
22 5 38.5 6 3.2 48.3 6 3.4 13.0 6 0.9 24<br />
23 4 53.2 6 4.1 32.2 6 5.2 14.7 6 1.1 25<br />
24 6 54.5 6 4.0 32.0 6 4.1 13.5 6 0.5 24<br />
25 6 53.5 6 2.5 32.8 6 2.8 13.7 6 0.8 22<br />
Mean 53.5 34.4 12.1 24.7<br />
SD 8.3 7.6 2.3 1.4<br />
St<strong>and</strong>ard errors were calculated as st<strong>and</strong>ard deviation divided by <strong>the</strong> square root <strong>of</strong> N.<br />
a Number <strong>of</strong> gels quantitated for each Harwich stock.<br />
b Does not include <strong>the</strong> five R2 elements that are inserted in 28S genes also containing an R1 element.<br />
numbers by <strong>the</strong> percentage <strong>of</strong> <strong>the</strong> locus containing R2<br />
insertions, <strong>the</strong> total rDNA locus sizes <strong>of</strong> <strong>the</strong> Harwich<br />
lines were calculated to range from 140 to 310 units.<br />
These values are graphed in Figure 2A in order <strong>of</strong><br />
increasing total locus size. The st<strong>and</strong>ard error for locus<br />
size was calculated from <strong>the</strong> error associated with <strong>the</strong><br />
Sou<strong>the</strong>rn blot determinations <strong>of</strong> <strong>the</strong> fraction <strong>of</strong> rDNA<br />
units with R2 insertions <strong>and</strong> ranged from 2 to 11%<br />
(mean 6%). On <strong>the</strong> basis <strong>of</strong> <strong>the</strong>se determinations, <strong>the</strong><br />
number <strong>of</strong> uninserted rDNA units in <strong>the</strong> Harwich lines<br />
was estimated to range from 70 to 195 <strong>and</strong> <strong>the</strong> number<br />
<strong>of</strong> R1-inserted units was estimated to range from 45<br />
to 120.<br />
In Figure 2B, <strong>the</strong> numbers <strong>of</strong> uninserted, R1-inserted,<br />
<strong>and</strong> R2-inserted units in each <strong>of</strong> <strong>the</strong> Harwich lines are<br />
plotted vs. <strong>the</strong> total size <strong>of</strong> <strong>the</strong> rDNA locus. The changes<br />
in total locus size were strongly correlated with changes<br />
in <strong>the</strong> number <strong>of</strong> uninserted <strong>and</strong> R1-inserted units,<br />
while <strong>the</strong> number <strong>of</strong> R2-inserted units remained relatively<br />
unchanged. A few lines, in particular lines 1 <strong>and</strong><br />
22, exhibited atypical increases in <strong>the</strong> number <strong>of</strong> R1inserted<br />
units. The implications <strong>of</strong> <strong>the</strong>se findings with<br />
respect to <strong>the</strong> likely changes that have occurred within<br />
<strong>the</strong> rDNA locus are discussed below.<br />
Intergenic spacer length variants: The IGS region <strong>of</strong><br />
<strong>the</strong> D. melanogaster rDNA unit is highly variable in length<br />
with any chromosome containing an assortment <strong>of</strong> IGS<br />
length variants (Tautz et al. 1988; Williams et al. 1989;<br />
Polanco et al. 1998, 2000). This IGS length variation<br />
results from different multiples <strong>of</strong> t<strong>and</strong>emly repeated<br />
95-, 330-, <strong>and</strong> 240-bp sequences (Figure 3A). As an in-<br />
dependent means to monitor changes in <strong>the</strong> rDNA<br />
locus <strong>of</strong> <strong>the</strong> Harwich lines, <strong>the</strong> IGS length variants<br />
present in each line were cataloged <strong>and</strong> <strong>the</strong> copy numbers<br />
<strong>of</strong> each variant were determined.<br />
IGS length pr<strong>of</strong>iles were generated by Sou<strong>the</strong>rn<br />
analysis using genomic DNA restriction digested with<br />
HaeIII or HinfI, enzymes that cleave in <strong>the</strong> highly conserved<br />
regions flanking <strong>the</strong> IGS but not within <strong>the</strong> 95-,<br />
240-, <strong>and</strong> 330-bp repeats (Figure 3A). Fragments generated<br />
with HaeIII included <strong>the</strong> IGS <strong>and</strong> 1.3 kb <strong>of</strong><br />
flanking ETS <strong>and</strong> 28S gene, while HinfI included only<br />
0.3 kb <strong>of</strong> flanking DNA. The Sou<strong>the</strong>rn blots were<br />
probed with a DNA fragment from <strong>the</strong> ETS sequence.<br />
By using a probe outside <strong>of</strong> <strong>the</strong> repetitive IGS region,<br />
<strong>the</strong> hybridization signal would be independent <strong>of</strong> length<br />
<strong>and</strong> thus similar for all IGS fragment sizes. To show that<br />
<strong>the</strong> observed length variation was due to differences in<br />
<strong>the</strong> number <strong>of</strong> 95-, 330-, or 240-bp repeats <strong>and</strong> not restriction<br />
site polymorphisms within <strong>the</strong> IGS lengths,<br />
independent blots <strong>of</strong> three lines digested with HaeIII or<br />
HinfI are shown in Figure 3B. The relative intensity <strong>of</strong> all<br />
b<strong>and</strong>s seen in <strong>the</strong> HinfI digest was reproduced with <strong>the</strong><br />
HaeIII digest. HinfI was used in <strong>the</strong> final quantitation <strong>of</strong><br />
IGS pr<strong>of</strong>iles from each Harwich line because <strong>the</strong> smaller<br />
fragment sizes gave better resolution <strong>of</strong> length variants.<br />
The HinfI-generated IGS pr<strong>of</strong>iles for all <strong>the</strong> Harwich<br />
stocks are shown in Figure 4A. In general, all stocks<br />
shared <strong>the</strong> same predominant set <strong>of</strong> IGS length variants<br />
in <strong>the</strong> size range <strong>of</strong> 2.5–5.3 kb. This pr<strong>of</strong>ile is highly<br />
diagnostic <strong>of</strong> <strong>the</strong> Harwich lines when compared to o<strong>the</strong>r<br />
D. melanogaster stocks (Coen et al. 1982; Williams et al.
Figure 2.—Variation in X chromosome rDNA locus size<br />
<strong>and</strong> load <strong>of</strong> R1 <strong>and</strong> R2 elements in 16 Harwich replicate lines.<br />
(A) The total number <strong>of</strong> rDNA units in each line is indicated<br />
by <strong>the</strong> total height <strong>of</strong> each bar. The numbers <strong>of</strong> uninserted,<br />
R1-inserted, <strong>and</strong> R2-inserted units are indicated by <strong>the</strong> shading.<br />
The total number <strong>of</strong> rDNA units in each line was determined<br />
by counting all R2 elements via a series <strong>of</strong> PCR<br />
reactions <strong>and</strong> dividing that number by <strong>the</strong> fraction <strong>of</strong> <strong>the</strong> total<br />
rDNA units containing R2 insertions (Table 1). Five R2 elements<br />
in each line were inserted upstream <strong>of</strong> an R1 <strong>and</strong>, thus,<br />
were not scored as R2 inserted by <strong>the</strong> Sou<strong>the</strong>rn assay approach<br />
in Figure 1B. On <strong>the</strong> basis <strong>of</strong> <strong>the</strong> total number <strong>of</strong> units,<br />
<strong>the</strong> numbers <strong>of</strong> uninserted <strong>and</strong> R1-inserted units were also<br />
calculated. (B) The numbers <strong>of</strong> uninserted, R1-inserted,<br />
<strong>and</strong> R2-inserted units for each line are plotted relative to total<br />
locus size.<br />
1989; Polanco et al. 1998). The Harwich IGS lengths<br />
were designated with letters A–O. Most <strong>of</strong> <strong>the</strong> hybridizing<br />
b<strong>and</strong>s suggest a precise fragment length, indicating<br />
multiple copies <strong>of</strong> identical length variants. However, it<br />
was possible that some <strong>of</strong> <strong>the</strong>se b<strong>and</strong>s represented<br />
several variants <strong>of</strong> similar length. Indeed, <strong>the</strong> weaker<br />
b<strong>and</strong>s (D, E, H–K) appeared less distinct in size,<br />
indicating that <strong>the</strong>y may represent multiple variants.<br />
While IGS variants ,2.5 kb were rare, longer variants up<br />
to 15 kb were found in many <strong>of</strong> <strong>the</strong> stocks. These longer<br />
IGS variants were not shared among <strong>the</strong> different<br />
Harwich lines.<br />
<strong>Evolution</strong> <strong>of</strong> <strong>the</strong> rDNA Locus 1841<br />
Figure 3.—IGS length pr<strong>of</strong>iles reproduced with two different<br />
restriction enzymes. (A) A diagram <strong>of</strong> <strong>the</strong> IGS region<br />
showing restriction sites <strong>and</strong> probe location. The IGS is mostly<br />
composed <strong>of</strong> t<strong>and</strong>em repeats <strong>of</strong> 95, 330, <strong>and</strong> 240 bp. (B) Genomic<br />
DNA was digested with HinfI or HaeIII, fractioned<br />
through a 1% agarose gel, <strong>and</strong> transferred to nitrocellulose.<br />
The resulting Sou<strong>the</strong>rn blot was probed with a region <strong>of</strong> <strong>the</strong><br />
ETS, marked with a shaded bar in A. The position <strong>of</strong> DNA<br />
st<strong>and</strong>ards in kilobases is indicated on <strong>the</strong> left <strong>and</strong> right. Lanes<br />
labeled a contain DNA from Harwich line 3, lanes labeled b<br />
contain DNA from line 20, <strong>and</strong> lanes labeled c contain DNA<br />
from line 2. Several corresponding b<strong>and</strong>s in <strong>the</strong>se last two lanes<br />
are connected with lines. The pattern <strong>of</strong> IGS b<strong>and</strong>s is identical<br />
between <strong>the</strong> HinfI digests <strong>and</strong> HaeIII digests, with HinfI producing<br />
smaller fragments that are better separated on <strong>the</strong> gel.<br />
Changes in <strong>the</strong> relative abundance <strong>and</strong> copy number<br />
<strong>of</strong> IGS variants: Although <strong>the</strong> Harwich stocks shared<br />
<strong>the</strong> same basic set<strong>of</strong>IGSlengthvariants,<strong>the</strong> relativeintensity<br />
<strong>of</strong> <strong>the</strong> b<strong>and</strong>s corresponding to <strong>the</strong>se lengths varied<br />
significantly among lines, indicating dramatic changes in<br />
copy number. This can be seen in <strong>the</strong> hybridization<br />
density tracings for three <strong>of</strong> <strong>the</strong> Harwich lines shown in<br />
Figure 4B. On <strong>the</strong> basis <strong>of</strong> <strong>the</strong>se tracings, <strong>the</strong> IGS variants<br />
C, F, <strong>and</strong> G were most abundant in line 1, while variant L<br />
was clearly most abundant in line 23. In some instances,<br />
all copies <strong>of</strong> a particular variant were eliminated from a<br />
line (e.g., <strong>the</strong> loss <strong>of</strong> variants A <strong>and</strong> B in line 21).<br />
The fraction <strong>of</strong> <strong>the</strong> total hybridization signal attributed<br />
to each variant was determined by quantitating<br />
b<strong>and</strong> intensities from each IGS pr<strong>of</strong>ile. The copy number<br />
for each IGS variant was <strong>the</strong>n calculated by multiplying<br />
<strong>the</strong> fraction <strong>of</strong> hybridization signal per variant<br />
by <strong>the</strong> total number <strong>of</strong> units in <strong>the</strong> locus (Figure 2). The<br />
error associated with <strong>the</strong>se estimates is larger because it
1842 K. T. Averbeck <strong>and</strong> T. H. Eickbush<br />
Figure 4.—IGS pr<strong>of</strong>iles <strong>of</strong> all Harwich lines. (A) Genomic<br />
DNA was digested with HinfI, fractionated through 1% agarose<br />
gel, transferred to a nitrocellulose filter, <strong>and</strong> hybridized<br />
with <strong>the</strong> ETS probe (see Figure 3A). The blot reveals a similar<br />
set <strong>of</strong> length variants present in all Harwich lines but significant<br />
differences in <strong>the</strong> abundance <strong>of</strong> each variant. Predominant<br />
b<strong>and</strong>s have been labeled with letters A–O. (B) Signal<br />
tracings <strong>of</strong> three Harwich lines from a phosphorimage <strong>of</strong><br />
<strong>the</strong> probed filter show that <strong>the</strong> relative intensities <strong>of</strong> <strong>the</strong> variant<br />
b<strong>and</strong>s are significantly different across <strong>the</strong> lines.<br />
includes both <strong>the</strong> error associated with <strong>the</strong> determination<br />
<strong>of</strong> locus size (mean 6%, Table 1) <strong>and</strong> <strong>the</strong> error <strong>of</strong><br />
detecting <strong>the</strong> relative percentage <strong>of</strong> each IGS length<br />
variant. St<strong>and</strong>ard errors for IGS blots were calculated for<br />
two Harwich lines on three blots <strong>and</strong> ranged from 0.1 to<br />
5% (data not shown). In Figure 5, each IGS length<br />
variant is represented by a vertical bar with hatch marks<br />
indicating <strong>the</strong> copy number found in <strong>the</strong> Harwich lines.<br />
Variants G <strong>and</strong> L were generally <strong>the</strong> most abundant IGS<br />
type, ranging from an estimated 20 to 60 <strong>and</strong> 30 to 75<br />
copies, respectively. All o<strong>the</strong>r variants also showed a<br />
wide distribution in copy number, many ranging from<br />
an estimated 0 to 20–30 copies.<br />
In Figure 6, <strong>the</strong> number <strong>of</strong> rDNA units containing <strong>the</strong><br />
most abundant IGS variant types is shown arranged in<br />
order <strong>of</strong> increasing locus size. All IGS variant types exhibited<br />
a positive correlation between abundance <strong>and</strong><br />
Figure 5.—Range <strong>of</strong> copy number for each IGS length variant.<br />
Variants are labeled A–O <strong>and</strong> correspond to <strong>the</strong> b<strong>and</strong>s<br />
shown in Figure 4. Copy number for each IGS variant was calculated<br />
for each Harwich line from <strong>the</strong> fraction <strong>of</strong> hybridization<br />
signal quantitated per b<strong>and</strong> multiplied by <strong>the</strong> total<br />
number <strong>of</strong> units in <strong>the</strong> locus. For all IGS variants, a set <strong>of</strong> horizontal<br />
hatch marks indicates <strong>the</strong> copy numbers determined<br />
for <strong>the</strong> 16 Harwich lines. Lines that have <strong>the</strong> same copy number<br />
for a particular variant (e.g., 0 copies) are represented by a<br />
single hatch mark. Vertical lines represent <strong>the</strong> range <strong>of</strong> copy<br />
numbers observed.<br />
locus size, although this correlation was not always<br />
highly significant. In addition, many Harwich lines contained<br />
idiosyncratic expansions or reductions <strong>of</strong> particular<br />
variants that did not correlate with locus size. For<br />
example, IGS variant A was unusually abundant in<br />
Harwich 7, while all copies were lost in Harwich 21.<br />
IGS variants C <strong>and</strong> F were unusually abundant in<br />
Harwich 1. IGS variant L was reduced in copy number<br />
in Harwich 1, 7, 18, <strong>and</strong> 22.<br />
DISCUSSION<br />
Population genetic approaches have frequently been<br />
used to infer from extant genetic variation <strong>the</strong> recombinational<br />
processes that drive concerted evolution<br />
<strong>of</strong> <strong>the</strong> D. melanogaster rDNA locus (Hillis et al. 1991;<br />
Lyckegaard <strong>and</strong> Clark 1991; Jakubczak et al. 1992;<br />
Schlötterer <strong>and</strong> Tautz 1994; Polanco et al. 1998,<br />
2000; Pérez-González <strong>and</strong> Eickbush 2001). These<br />
studies have provided insights into <strong>the</strong> possible mechanisms<br />
responsible for concerted evolution but do not<br />
allow for <strong>the</strong> estimation <strong>of</strong> <strong>the</strong> rates <strong>of</strong> such events. In an<br />
attempt to directly measure rates <strong>of</strong> change, Coen et al.<br />
(1982) followed changes in <strong>the</strong> structure <strong>of</strong> <strong>the</strong> rDNA<br />
locus <strong>of</strong> D. melanogaster is<strong>of</strong>emale lines over time. They<br />
estimated that <strong>the</strong> rDNA loci could remain stable in <strong>the</strong>
laboratory for .1000 generations. Previous studies in<br />
our laboratory using <strong>the</strong> Harwich mutation-accumulation<br />
lines have estimated <strong>the</strong> rate <strong>of</strong> insertion <strong>and</strong> deletion <strong>of</strong><br />
marked R1 <strong>and</strong> R2 elements within <strong>the</strong> rDNA loci<br />
(Pérez-González <strong>and</strong> Eickbush 2002; Pérez-González<br />
et al. 2003). Although 300 new insertions <strong>and</strong> deletions<br />
were scored after 400 generations, most events (74%)<br />
occurred on <strong>the</strong> Y chromosomes. The limited number<br />
<strong>of</strong> events detected on <strong>the</strong> X chromosomes (0–9/line)<br />
<strong>Evolution</strong> <strong>of</strong> <strong>the</strong> rDNA Locus 1843<br />
Figure 6.—Copy number for eight major<br />
IGS variants arranged by rDNA locus<br />
size from smallest to largest. Across <strong>the</strong><br />
lines, <strong>the</strong> copy number <strong>of</strong> variants is positively<br />
correlated with <strong>the</strong> size <strong>of</strong> <strong>the</strong><br />
rDNA locus, but <strong>the</strong> strength <strong>of</strong> <strong>the</strong> correlation<br />
(P-values are shown) varies from<br />
very strong (G <strong>and</strong> O) to weak (L <strong>and</strong> N).<br />
suggested that significant structural changes had not<br />
occurred in <strong>the</strong> X-linked rDNA loci.<br />
As described in this report, <strong>the</strong> X chromosome rDNA<br />
locus in <strong>the</strong>se Harwich lines had in fact changed<br />
dramatically in <strong>the</strong> 400 generations since <strong>the</strong> lines were<br />
separated. The size <strong>of</strong> <strong>the</strong> locus varied from 140 rDNA<br />
units to 310 units, a range similar to <strong>the</strong> 110–280 units<br />
found in <strong>the</strong> X chromosomes from a natural population<br />
<strong>of</strong> D. melanogaster (Lyckegaard <strong>and</strong> Clark 1991). The
1844 K. T. Averbeck <strong>and</strong> T. H. Eickbush<br />
range <strong>of</strong> uninserted units among <strong>the</strong> Harwich lines<br />
varied from 35 to 63% <strong>and</strong> was consistent with levels<br />
seen in a survey <strong>of</strong> 27 geographical stocks <strong>of</strong> D.<br />
melanogaster (23–68%) (Jakubczak et al. 1992). The<br />
average proportion <strong>of</strong> uninserted rDNA units among<br />
<strong>the</strong> Harwich lines was 54%, also similar to <strong>the</strong> 51% mean<br />
seen in <strong>the</strong> survey <strong>of</strong> geographical stocks ( Jakubczak<br />
et al. 1992). It is remarkable that fluctuations in locus<br />
size <strong>and</strong> level <strong>of</strong> element insertion as a consequence <strong>of</strong><br />
recombination events, retrotransposition, selection,<br />
<strong>and</strong> drift could so rapidly reproduce from a single inbred<br />
laboratory stock <strong>the</strong> wide variation seen in natural<br />
populations.<br />
Recombination within <strong>the</strong> rDNA locus: The dramatic<br />
differences in locus size among <strong>the</strong> Harwich lines suggest<br />
frequent expansion <strong>and</strong> contraction in <strong>the</strong> number<br />
<strong>of</strong> rDNA units as a result <strong>of</strong> unequal crossovers. As<br />
shown in Figure 2B, with only a few exceptions (e.g.,<br />
lines 1 <strong>and</strong> 21, which will be discussed below) <strong>the</strong> copy<br />
number <strong>of</strong> R1-inserted <strong>and</strong> uninserted units changed<br />
uniformly relative to <strong>the</strong> overall size <strong>of</strong> <strong>the</strong> locus (Figure<br />
2B). The slope <strong>of</strong> each correlation indicated <strong>the</strong> proportion<br />
<strong>of</strong> <strong>the</strong> changes in locus size that could be attributed<br />
to that unit type. Uninserted units, which<br />
averaged 54% <strong>of</strong> <strong>the</strong> units, accounted for 73% <strong>of</strong> <strong>the</strong><br />
change in locus size (i.e., slope ¼ 0.73); R1-inserted<br />
units, which averaged 34% <strong>of</strong> <strong>the</strong> locus, accounted for<br />
26% <strong>of</strong> <strong>the</strong> change; <strong>and</strong> R2-inserted units, which<br />
averaged 12% <strong>of</strong> <strong>the</strong> locus, accounted for ,1% <strong>of</strong> <strong>the</strong><br />
change. Therefore, uninserted units were overrepresented<br />
in <strong>the</strong> recombinational activity <strong>of</strong> <strong>the</strong> locus, R1inserted<br />
units were underrepresented, <strong>and</strong> R2-inserted<br />
units were essentially excluded from <strong>the</strong> recombinational<br />
expansions <strong>and</strong> contractions <strong>of</strong> <strong>the</strong> locus. This<br />
recombinational bias suggests that population genetic<br />
models to explain <strong>the</strong> concerted evolution <strong>of</strong> <strong>the</strong> rDNA<br />
locus should not assume that recombination events are<br />
evenly nor r<strong>and</strong>omly distributed across <strong>the</strong> locus if<br />
insertions are present in that locus.<br />
One model for explaining <strong>the</strong> relative participation<br />
<strong>of</strong> inserted <strong>and</strong> uninserted units in <strong>the</strong> recombinational<br />
events within <strong>the</strong> rDNA locus is that R2 insertions <strong>and</strong><br />
many R1 insertions are clustered in <strong>the</strong> rDNA locus in regions<br />
<strong>of</strong> low recombination. For example, McAllister<br />
<strong>and</strong> Werren (1999) have shown that <strong>the</strong> edges <strong>of</strong><br />
t<strong>and</strong>em arrays undergo less frequent recombination. A<br />
second model is that unequal crossovers are short (i.e.,<br />
involve <strong>of</strong>fsets <strong>of</strong> only a small number <strong>of</strong> units) <strong>and</strong><br />
require multiple contiguous units to be similar in type.<br />
In this model, R1- <strong>and</strong> R2-inserted elements could be<br />
dispersed throughout <strong>the</strong> locus, but <strong>the</strong> low frequency<br />
<strong>of</strong> R2-inserted units <strong>and</strong> <strong>of</strong> 59-truncated R1 elements in<br />
<strong>the</strong> locus would reduce <strong>the</strong> probability <strong>of</strong> successful<br />
<strong>of</strong>fset alignments involving <strong>the</strong>se units. In contrast, <strong>the</strong><br />
high frequency <strong>of</strong> uninserted units or units with fulllength<br />
R1 elements would provide many opportunities<br />
for <strong>of</strong>fset alignment <strong>and</strong> subsequent recombination.<br />
Ultimate resolution <strong>of</strong> <strong>the</strong> patterns <strong>of</strong> unequal crossover<br />
across <strong>the</strong> rDNA locus in <strong>the</strong> Harwich lines will require<br />
knowledge <strong>of</strong> <strong>the</strong> distribution <strong>of</strong> <strong>the</strong> insertions across<br />
<strong>the</strong> locus.<br />
The similar number <strong>of</strong> R2-inserted units in all lines<br />
was consistent with <strong>the</strong> low level <strong>of</strong> insertion <strong>and</strong> deletion<br />
<strong>of</strong> marked R2 elements previously detected in <strong>the</strong>se<br />
lines (Pérez-González <strong>and</strong> Eickbush 2002). Surprisingly,<br />
<strong>the</strong> number <strong>of</strong> R1-inserted units characterized<br />
here varied from 45 to 120 units, a range far larger than<br />
expected given our previous detection <strong>of</strong> only limited<br />
numbers <strong>of</strong> marked R1 insertions <strong>and</strong> deletions on each<br />
X chromosome (Pérez-González et al. 2003). This difference<br />
is explained by <strong>the</strong> PCR approach used in our<br />
previous study, which scored <strong>the</strong> appearance <strong>of</strong> only new<br />
(unique) 59 variants, not insertions or duplications <strong>of</strong><br />
identical-in-length elements. Similarly, <strong>the</strong> previous<br />
PCR survey detected deletions only if all copies <strong>of</strong> that<br />
length variant were deleted. The large changes in R1<br />
copy number that we observed are mostly associated<br />
with full-length copies, many <strong>of</strong> which are associated<br />
with identical-in-length 59 ends (Pérez-González <strong>and</strong><br />
Eickbush 2002).<br />
Our analysis <strong>of</strong> IGS length variation among <strong>the</strong> replicate<br />
Harwich lines also provides insights into <strong>the</strong><br />
distribution <strong>of</strong> <strong>the</strong> recombination events within <strong>the</strong><br />
rDNA locus. All Harwich lines contained similar IGS<br />
length variants in <strong>the</strong> size range from 2.5 to 5.3 kb<br />
(Figure 4). Such long-term stability in IGS pr<strong>of</strong>iles in<br />
laboratory-maintained lines has also been observed by<br />
Coen et al. (1982). However, as shown in Figures 5 <strong>and</strong> 6,<br />
this apparent stability belies <strong>the</strong> many recombination<br />
events that have occurred in <strong>the</strong> locus. Each <strong>of</strong> <strong>the</strong> IGS<br />
length variants exhibited significant differences in copy<br />
number among <strong>the</strong> Harwich lines. Because all IGS<br />
length variants experienced changes in number <strong>of</strong><br />
units, our results suggest that most <strong>of</strong> <strong>the</strong> IGS variant<br />
types are interspersed <strong>and</strong> that recombination events<br />
associated with <strong>the</strong> changes in locus size have occurred<br />
at many locations throughout <strong>the</strong> locus. Williams et al.<br />
(1989) have previously suggested that many IGS variants<br />
are widely distributed across <strong>the</strong> loci, on <strong>the</strong> basis <strong>of</strong> an<br />
analysis <strong>of</strong> <strong>the</strong> rare recombinations that can be scored<br />
between <strong>the</strong> X <strong>and</strong> Y chromosome loci. Presumably,<br />
those IGS variants we observed whose abundance best<br />
correlate with locus size (e.g., variants G, Figure 6) are<br />
widely distributed across <strong>the</strong> X chromosome locus, while<br />
variant types whose abundance only weakly correlates<br />
with locus size (e.g., variants L) are more localized in<br />
<strong>the</strong> locus, perhaps in regions with lower rates <strong>of</strong><br />
recombination.<br />
The IGS analysis <strong>of</strong> <strong>the</strong> Harwich lines can also be used<br />
to address <strong>the</strong> question <strong>of</strong> whe<strong>the</strong>r recombination<br />
events between rDNA units occur within <strong>the</strong> genic<br />
(transcribed) regions or intergenic (IGS) regions. Unequal<br />
crossovers within <strong>the</strong> genes would change <strong>the</strong> IGS<br />
copy number but not <strong>the</strong>ir lengths, while crossovers
within <strong>the</strong> IGS could produce new length variants.<br />
Polanco et al. (2000) have shown that individual IGS<br />
variants in D. melanogaster contain variable numbers <strong>of</strong><br />
<strong>the</strong> 95-, 330-, <strong>and</strong> 240-bp repeats. Repeated recombination<br />
between <strong>the</strong>se repeats would give rise to a continuous<br />
spread <strong>of</strong> IGS length variants. However, <strong>the</strong> IGS<br />
pr<strong>of</strong>iles observed for <strong>the</strong> Harwich lines have a distinctive<br />
pattern that changed little among <strong>the</strong> lines. The<br />
dramatic changes in IGS variant copy number without<br />
dispersing <strong>the</strong> common pr<strong>of</strong>ile <strong>of</strong> IGS variants support<br />
recombination models in which crossovers seldom<br />
occur in <strong>the</strong> intergenic region <strong>of</strong> <strong>the</strong> rDNA units.<br />
Many Harwich lines contained longer, unique IGS<br />
variants (i.e., not shared between lines) from 6 to 15 kb<br />
in length. It is unlikely that <strong>the</strong>se long variants were<br />
imported from <strong>the</strong> Y chromosome because <strong>the</strong> rate <strong>of</strong><br />
recombination between <strong>the</strong> rDNA arrays on <strong>the</strong> X <strong>and</strong> Y<br />
chromosomes is extremely low (Williams et al. 1989)<br />
<strong>and</strong> our previous studies did not detect <strong>the</strong> movement<br />
<strong>of</strong> marked R1 or R2 elements from <strong>the</strong> Y to <strong>the</strong> X<br />
chromosome in <strong>the</strong> Harwich lines (Pérez-González<br />
et al. 2003). Thus, <strong>the</strong> long IGS variants detected on <strong>the</strong><br />
X chromosome appeared to have been produced by<br />
recombination. Unlike <strong>the</strong> common IGS variants, <strong>the</strong>se<br />
longer variants appeared to be sites <strong>of</strong> recombination,<br />
as most Harwich lines contained <strong>the</strong>ir own distinct<br />
pattern <strong>of</strong> long variants. Some <strong>of</strong> <strong>the</strong>se long variants<br />
also became as abundant as <strong>the</strong> more common shorter<br />
types. Determining <strong>the</strong> distribution <strong>of</strong> <strong>the</strong>se long<br />
variants in <strong>the</strong> locus would provide valuable insights<br />
into <strong>the</strong> recombination mechanisms that have<br />
occurred.<br />
Possible effects <strong>of</strong> R1 retrotransposition on <strong>the</strong> rDNA<br />
locus: While most <strong>of</strong> <strong>the</strong> changes observed on <strong>the</strong> X<br />
chromosome rDNA locus appear to have been <strong>the</strong> result<br />
<strong>of</strong> unequal crossovers, several lines have undergone<br />
dramatic shifts in <strong>the</strong> relative abundance <strong>of</strong> R1-inserted<br />
units compared to uninserted units. In <strong>the</strong> two most<br />
extreme examples, R1-inserted units represented 53%<br />
<strong>of</strong> <strong>the</strong> rDNA units in line 1 <strong>and</strong> 48% in line 22 compared<br />
with 30% in most o<strong>the</strong>r lines. It is possible that<br />
<strong>the</strong>se increases in <strong>the</strong> fraction <strong>of</strong> R1-inserted units were<br />
a result <strong>of</strong> unequal crossover events, which preferentially<br />
duplicated R1-inserted units or eliminated<br />
uninserted units from <strong>the</strong> locus. However, no Harwich<br />
lines showed <strong>the</strong> opposite scenario—preferential duplication<br />
<strong>of</strong> uninserted units or deletion <strong>of</strong> R1-inserted<br />
units—even though such events would likely confer a<br />
selective advantage in <strong>the</strong>se laboratory populations.<br />
Consistent with a model that active R1 retrotransposition<br />
increased <strong>the</strong> number <strong>of</strong> R1 elements at <strong>the</strong><br />
expense <strong>of</strong> uninserted units, Harwich lines 1 <strong>and</strong> 22<br />
were shown to contain X chromosomes with <strong>the</strong> greatest<br />
number <strong>of</strong> new 59 R1 junctions (six in line 1, four in line<br />
22) (Pérez-González et al. 2003). Only a small fraction<br />
<strong>of</strong> R1 retrotransposition events produce new 59 junctions<br />
that were scored by our PCR assay (Pérez-González<br />
<strong>Evolution</strong> <strong>of</strong> <strong>the</strong> rDNA Locus 1845<br />
<strong>and</strong> Eickbush 2002), suggesting that many more retrotransposition<br />
events occurred in <strong>the</strong>se lines.<br />
In conclusion, this study revealed that one can follow<br />
changes in <strong>the</strong> size <strong>and</strong> composition <strong>of</strong> <strong>the</strong> rDNA locus in<br />
inbred lines maintained in <strong>the</strong> laboratory. While <strong>the</strong> focus<br />
<strong>of</strong> this study was <strong>the</strong> X-linked rDNA loci <strong>of</strong> <strong>the</strong> Harwich<br />
lines, we expect that even more extensive changes have<br />
occurred in <strong>the</strong> Y-linked rDNA loci, on <strong>the</strong> basis <strong>of</strong> <strong>the</strong><br />
threefold higher level <strong>of</strong> new insertions detected on <strong>the</strong> Y<br />
chromosomes (Pérez-González et al. 2003) <strong>and</strong> greater<br />
variation in Y-linked IGS variants between lines (K. T.<br />
Averbeck, unpublished data). The differences in rDNA<br />
loci that we observed strongly support population genetic<br />
models <strong>of</strong> frequent unequal crossovers widely spread<br />
across <strong>the</strong> locus but suggest that <strong>the</strong>se recombinations are<br />
not distributed evenly or r<strong>and</strong>omly. New questions concerning<br />
<strong>the</strong> evolution <strong>of</strong> <strong>the</strong> rDNA locus have arisen out<br />
<strong>of</strong> this study, such as why R2 elements are preferentially<br />
excluded from recombination events, whe<strong>the</strong>r long IGS<br />
variants stimulate recombination, <strong>and</strong> whe<strong>the</strong>r R1 activity<br />
has contributed to changes in <strong>the</strong> locus in some lines.<br />
These questions can be adequately addressed only with a<br />
physical map <strong>of</strong> <strong>the</strong> distribution <strong>of</strong> R1 <strong>and</strong> R2 insertions<br />
<strong>and</strong> IGS variants across <strong>the</strong> rDNA locus <strong>of</strong> <strong>the</strong> Harwich<br />
lines. A BAC cloning project is currently under way, <strong>and</strong><br />
significant portions <strong>of</strong> <strong>the</strong> X chromosome locus <strong>of</strong><br />
Harwich line 21 have been recovered (W. D. Burke, K.<br />
T. Averbeck <strong>and</strong>T.H.Eickbush, unpublished results).<br />
With a map <strong>of</strong> <strong>the</strong> distribution <strong>of</strong> variation along large<br />
segments <strong>of</strong> <strong>the</strong> rDNA locus from this line, we will be able<br />
to use <strong>the</strong> variation scored in all 16 Harwich lines to<br />
provide new insights into <strong>the</strong> relentless forces that rapidly<br />
shape <strong>the</strong> l<strong>and</strong>scape <strong>of</strong> <strong>the</strong> rDNA locus.<br />
We thank D. G. Eickbush <strong>and</strong> W. D. Burke for helpful discussions<br />
<strong>and</strong> comments on <strong>the</strong> manuscript. We thank T. F. C. Mackay for<br />
originally supplying <strong>the</strong> Harwich lines. This research was supported by<br />
National Science Foundation grant MCB-9974606 to T.H.E.<br />
LITERATURE CITED<br />
Burke, W. D., H. S. Malik, W.C.La<strong>the</strong> III <strong>and</strong> T. H. Eickbush,<br />
1998 Are retrotransposons long-term hitchhikers? Nature 392:<br />
141–142.<br />
Burke, W. D., D. Singh <strong>and</strong> T. H. Eickbush, 2003 R5 retrotransposons<br />
insert into a family <strong>of</strong> infrequently transcribed 28S rRNA<br />
genes <strong>of</strong> Planaria. Mol. Biol. Evol. 20: 1260–1270.<br />
Coen, E. S., J. M. Thoday <strong>and</strong> G. Dover, 1982 Rate <strong>of</strong> turnover<br />
<strong>of</strong> structural variants in <strong>the</strong> rDNA gene family <strong>of</strong> Drosophila<br />
melanogaster. Nature 295: 564–568.<br />
Dover, G., 1994 <strong>Concerted</strong> evolution, molecular drive <strong>and</strong> natural<br />
selection. Curr. Biol. 4: 1165–1166.<br />
Eickbush, T. H., 2002 R2 <strong>and</strong> related site-specific non-long<br />
terminal repeat retrotransposons, pp. 813–835 in Mobile DNA II,edited<br />
by N. L. Craig,R.Craigie,M.Gellart <strong>and</strong> A. M. Lambowitz.<br />
American Society for Microbiology, Washington, DC.<br />
Eickbush, D. G., <strong>and</strong> T. H. Eickbush, 1995 Vertical transmission <strong>of</strong><br />
<strong>the</strong> retrotransposable elements R1 <strong>and</strong> R2 during <strong>the</strong> evolution<br />
<strong>of</strong> <strong>the</strong> Drosophila melanogaster species subgroup. <strong>Genetics</strong> 139:<br />
671–684.<br />
Eickbush, D. G., <strong>and</strong> T. H. Eickbush, 2003 Transcription <strong>of</strong> endogenous<br />
<strong>and</strong> exogenous R2 elements in <strong>the</strong> rRNA gene locus <strong>of</strong><br />
Drosophila melanogaster. Mol. Cell Biol. 23: 3825–3836.
1846 K. T. Averbeck <strong>and</strong> T. H. Eickbush<br />
Elder J. F., Jr., <strong>and</strong> B. J. Turner, 1995 <strong>Concerted</strong> evolution <strong>of</strong> repetitive<br />
DNA sequences in eukaryotes. Quart. Rev. Biol. 70: 297–<br />
320.<br />
Gentile, K. L., W. D. Burke <strong>and</strong> T. H. Eickbush, 2001 Multiple lineages<br />
<strong>of</strong> R1 retrotransposable elements can coexist in <strong>the</strong> rDNA<br />
loci <strong>of</strong> Drosophila. Mol. Biol. Evol. 18: 235–245.<br />
Hillis, D. M., C. Moritz, C. A. Porter <strong>and</strong> R. J. Baker,<br />
1991 Evidence for biased gene conversion in concerted evolution<br />
<strong>of</strong> ribosomal DNA. Science 251: 308–310.<br />
Jakubczak, J., M. Zenni, R. Woodruff <strong>and</strong> T. H. Eickbush,<br />
1992 Turnover <strong>of</strong> R1 (Type I) <strong>and</strong> R2 (Type II) retrotransposable<br />
elements in <strong>the</strong> ribosomal DNA <strong>of</strong> Drosophila melanogaster.<br />
<strong>Genetics</strong> 131: 129–142.<br />
Kidd, S. J., <strong>and</strong> D. M. Glover, 1981 Drosophila melanogaster ribosomal<br />
DNA containing type II insertions is variably transcribed<br />
in different strains <strong>and</strong> tissues. J. Mol. Biol. 151: 645–662.<br />
Kojima, K. K., <strong>and</strong> H. Fujiwara, 2004 Cross-genome screening <strong>of</strong><br />
novel sequence-specific non-LTR retrotransposons: various multicopy<br />
RNA genes <strong>and</strong> microsatellites are selected as targets. Mol.<br />
Biol. Evol. 21: 207–217.<br />
La<strong>the</strong>, W. C., III, <strong>and</strong> T. H. Eickbush, 1997 A single lineage <strong>of</strong> R2<br />
retrotransposable element is an active, evolutionarily stable component<br />
<strong>of</strong> <strong>the</strong> Drosophila rDNA locus. Mol. Biol. Evol. 14: 1232–<br />
1241.<br />
La<strong>the</strong>, W. C., III, W. D. Burke, D.G.Eickbush <strong>and</strong> T. H. Eickbush,<br />
1995 <strong>Evolution</strong>ary stability <strong>of</strong> <strong>the</strong> R1 retrotransposable element<br />
in <strong>the</strong> genus Drosophila. Mol. Biol. Evol. 12: 1094–1105.<br />
Liao, D. Q., 1999 <strong>Concerted</strong> evolution: molecular mechanism <strong>and</strong><br />
biological implications. Am. J. Hum. Genet. 64: 24–30.<br />
Long, E. O., <strong>and</strong> I. B. Dawid, 1979 Expression <strong>of</strong> ribosomal DNA<br />
insertions in Drosophila melanogaster. Cell 18: 1185–1196.<br />
Long, E. O., <strong>and</strong> I. B. Dawid, 1980 Repeated genes in eukaryotes.<br />
Annu. Rev. Biochem. 49: 727–764.<br />
Luan, D. D., M. H. Korman, J.L.Jakubczak <strong>and</strong> T. H. Eickbush,<br />
1993 Reverse transcription <strong>of</strong> R2Bm is primed by a nick at<br />
<strong>the</strong> chromosomal target site: a mechanism for non-LTR retrotransposition.<br />
Cell 72: 595–605.<br />
Lyckegaard, E. M. S., <strong>and</strong> A. G. Clark, 1991 <strong>Evolution</strong> <strong>of</strong> ribosomal<br />
RNA gene copy number on <strong>the</strong> sex chromosomes <strong>of</strong><br />
Drosophila melanogaster. Mol. Biol. Evol. 8: 458–474.<br />
Mackay, T. F. C., R. F. Lyman, M.S.Jackson, C.Terzian <strong>and</strong> W. G.<br />
Hill, 1992 Polygenic mutation in Drosophila melanogaster: esti-<br />
mates from divergence among inbred strains. <strong>Evolution</strong> 46:<br />
300–316.<br />
Malik, H. S., W. D. Burke <strong>and</strong> T. H. Eickbush, 1999 The age <strong>and</strong><br />
evolution <strong>of</strong> non-LTR retrotransposable elements. Mol. Biol.<br />
Evol. 16: 793–805.<br />
McAllister, B. F, <strong>and</strong> J. H. Werren, 1999 <strong>Evolution</strong> <strong>of</strong> t<strong>and</strong>emly<br />
repeated sequences: What happens at <strong>the</strong> end <strong>of</strong> an array? J.<br />
Mol. Biol. 48: 469–481.<br />
Penton, E. H., <strong>and</strong> T. J. Crease, 2004 <strong>Evolution</strong> <strong>of</strong> <strong>the</strong> transposable<br />
element Pokey in <strong>the</strong> ribosomal DNA <strong>of</strong> species in <strong>the</strong> subgenus<br />
Daphnia (Crustacea: Cladocera). Mol. Biol. Evol. 21: 1727–1739.<br />
Pérez-González, C. E., <strong>and</strong> T. H. Eickbush, 2001 Dynamics <strong>of</strong><br />
R1 <strong>and</strong> R2 elements in <strong>the</strong> rDNA locus <strong>of</strong> Drosophila simulans.<br />
<strong>Genetics</strong> 158: 1557–1567.<br />
Pérez-González, C. E., <strong>and</strong> T. H. Eickbush, 2002 Rates <strong>of</strong> R1 <strong>and</strong><br />
R2 retrotransposition <strong>and</strong> elimination from <strong>the</strong> rDNA locus <strong>of</strong><br />
Drosophila melanogaster. <strong>Genetics</strong> 162: 799–811.<br />
Pérez-González, C. E., W. D. Burke <strong>and</strong> T. H. Eickbush, 2003 R1<br />
<strong>and</strong> R2 retrotransposition <strong>and</strong> deletion in <strong>the</strong> rDNA loci on <strong>the</strong> X<br />
<strong>and</strong> Y chromosomes <strong>of</strong> Drosophila melanogaster. <strong>Genetics</strong> 165: 675–<br />
685.<br />
Polanco, C., A. I. González, Á. de la Fuente <strong>and</strong> G. A. Dover,<br />
1998 Multigene family <strong>of</strong> ribosomal DNA in Drosophila melanogaster<br />
reveals contrasting patterns <strong>of</strong> homogenization for IGS<br />
<strong>and</strong> ITS spacer regions: a possible mechanism to resolve this paradox.<br />
<strong>Genetics</strong> 149: 243–256.<br />
Polanco, C., A. I. González <strong>and</strong> G. A. Dover, 2000 Patterns <strong>of</strong> variation<br />
in <strong>the</strong> intergenic spacers <strong>of</strong> ribosomal DNA in Drosophila<br />
melanogaster support a model for genetic exchanges during X-Y<br />
pairing. <strong>Genetics</strong> 155: 1221–1229.<br />
Schlötterer, C., <strong>and</strong> D. Tautz, 1994 Chromosomal homogeneity<br />
<strong>of</strong> Drosophila ribosomal DNA arrays suggests intrachromosomal<br />
exchanges drive concerted evolution. Curr. Biol. 4: 777–783.<br />
Tautz, D., J. M. Hancock, D.A.Webb, C.Tautz <strong>and</strong> G. A. Dover,<br />
1988 Complete sequences <strong>of</strong> <strong>the</strong> rRNA genes <strong>of</strong> Drosophila<br />
melanogaster. Mol. Biol. Evol. 5: 366–376.<br />
Williams, S. M., J. A. Kennison, L.G.Robbins <strong>and</strong> C. Strobeck,<br />
1989 Reciprocal recombination <strong>and</strong> <strong>the</strong> evolution <strong>of</strong> <strong>the</strong> ribosomal<br />
gene family <strong>of</strong> Drosophila melanogaster. <strong>Genetics</strong> 122: 617–<br />
624.<br />
Communicating editor: R. S. Hawley