Bioelectrical impedance analysisFpart I: review of principles ... - espen
Bioelectrical impedance analysisFpart I: review of principles ... - espen
Bioelectrical impedance analysisFpart I: review of principles ... - espen

Create successful ePaper yourself
Turn your PDF publications into a flip-book with our unique Google optimized e-Paper software.
vectors in the R–Xc plane. An individual vector can<br />
then be compared with the reference 50%, 75%,<br />
and 95% tolerance ellipses calculated in the healthy<br />
population <strong>of</strong> the same gender and race (R–Xc<br />
graph method) (Fig. 4). The ellipse varies with age<br />
and body size. 50<br />
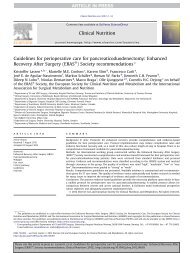
Clinical validation studies (renal patients, critical<br />
care patients and obese subjects) 17–19 showed that<br />
vectors falling outside the 75% tolerance ellipse<br />
indicate an abnormal tissue <strong>impedance</strong>, which can<br />
be interpreted as follows: (1) vector displacements<br />
parallel to the major axis <strong>of</strong> tolerance ellipses<br />
indicate progressive changes in tissue hydration<br />
(dehydration with long vectors, out <strong>of</strong> the upper<br />
pole, and hyperhydration with short vectors, out <strong>of</strong><br />
the lower pole); and (2) vectors falling above (left)<br />
or below (right) the major axis <strong>of</strong> tolerance ellipses<br />
indicate more or less BCM, respectively, contained<br />
in lean body tissues. Long-term monitoring <strong>of</strong><br />
patients has shown combined changes in hydration<br />
and s<strong>of</strong>t tissue mass. Fig. 4 shows an example <strong>of</strong><br />
BIVA follow-up with the RXc path graph in a female<br />
patient following lung transplantation, using the<br />
50th, 75th and 95th tolerance percentiles <strong>of</strong> a<br />
healthy Swiss reference population (data unpublished).<br />
However, Cox-Reijven et al. 51 found a low<br />
sensitivity (but high specificity) <strong>of</strong> BIVA in detecting<br />
depletion in gastrointestinal patients. Further<br />
validation seems necessary.<br />
Body compartments<br />
Fat-free mass<br />
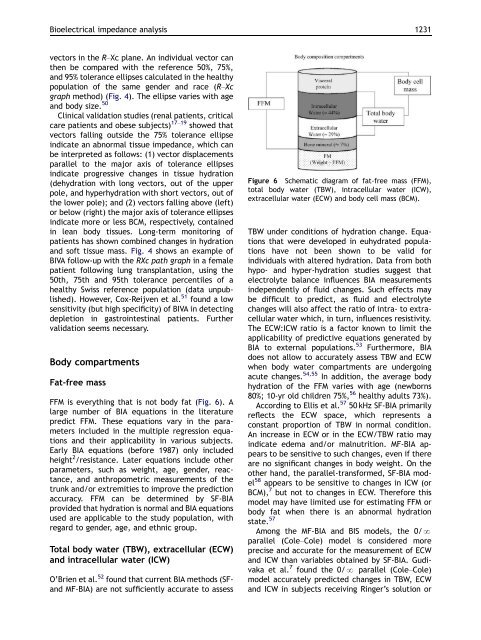
FFM is everything that is not body fat (Fig. 6). A<br />
large number <strong>of</strong> BIA equations in the literature<br />
predict FFM. These equations vary in the parameters<br />
included in the multiple regression equations<br />
and their applicability in various subjects.<br />
Early BIA equations (before 1987) only included<br />
height 2 /resistance. Later equations include other<br />
parameters, such as weight, age, gender, reactance,<br />
and anthropometric measurements <strong>of</strong> the<br />
trunk and/or extremities to improve the prediction<br />
accuracy. FFM can be determined by SF-BIA<br />
provided that hydration is normal and BIA equations<br />
used are applicable to the study population, with<br />
regard to gender, age, and ethnic group.<br />
Total body water (TBW), extracellular (ECW)<br />
and intracellular water (ICW)<br />
O’Brien et al. 52 found that current BIA methods (SFand<br />
MF-BIA) are not sufficiently accurate to assess<br />
ARTICLE IN PRESS<br />
<strong>Bioelectrical</strong> <strong>impedance</strong> analysis 1231<br />
Figure 6 Schematic diagram <strong>of</strong> fat-free mass (FFM),<br />
total body water (TBW), intracellular water (ICW),<br />
extracellular water (ECW) and body cell mass (BCM).<br />
TBW under conditions <strong>of</strong> hydration change. Equations<br />
that were developed in euhydrated populations<br />
have not been shown to be valid for<br />
individuals with altered hydration. Data from both<br />
hypo- and hyper-hydration studies suggest that<br />
electrolyte balance influences BIA measurements<br />
independently <strong>of</strong> fluid changes. Such effects may<br />
be difficult to predict, as fluid and electrolyte<br />
changes will also affect the ratio <strong>of</strong> intra- to extracellular<br />
water which, in turn, influences resistivity.<br />
The ECW:ICW ratio is a factor known to limit the<br />
applicability <strong>of</strong> predictive equations generated by<br />
BIA to external populations. 53 Furthermore, BIA<br />
does not allow to accurately assess TBW and ECW<br />
when body water compartments are undergoing<br />
acute changes. 54,55 In addition, the average body<br />
hydration <strong>of</strong> the FFM varies with age (newborns<br />
80%; 10-yr old children 75%, 56 healthy adults 73%).<br />
According to Ellis et al. 57 50 kHz SF-BIA primarily<br />
reflects the ECW space, which represents a<br />
constant proportion <strong>of</strong> TBW in normal condition.<br />
An increase in ECW or in the ECW/TBW ratio may<br />
indicate edema and/or malnutrition. MF-BIA appears<br />
to be sensitive to such changes, even if there<br />
are no significant changes in body weight. On the<br />
other hand, the parallel-transformed, SF-BIA model<br />
58 appears to be sensitive to changes in ICW (or<br />
BCM), 7 but not to changes in ECW. Therefore this<br />
model may have limited use for estimating FFM or<br />
body fat when there is an abnormal hydration<br />
state. 57<br />
Among the MF-BIA and BIS models, the 0/N<br />
parallel (Cole–Cole) model is considered more<br />
precise and accurate for the measurement <strong>of</strong> ECW<br />
and ICW than variables obtained by SF-BIA. Gudivaka<br />
et al. 7 found the 0/N parallel (Cole–Cole)<br />
model accurately predicted changes in TBW, ECW<br />
and ICW in subjects receiving Ringer’s solution or