The reopening of a collapsed fluid-filled elastic tube - School of ...
The reopening of a collapsed fluid-filled elastic tube - School of ...
The reopening of a collapsed fluid-filled elastic tube - School of ...

Create successful ePaper yourself
Turn your PDF publications into a flip-book with our unique Google optimized e-Paper software.
J. Fluid Mech. (2007), vol. 572, pp. 287–310. c○ 2007 Cambridge University Press<br />
doi:10.1017/S0022112006003612 Printed in the United Kingdom<br />
<strong>The</strong> <strong>reopening</strong> <strong>of</strong> a <strong>collapsed</strong> <strong>fluid</strong>-<strong>filled</strong><br />
<strong>elastic</strong> <strong>tube</strong><br />
By ANNE JUEL AND ALEXANDRA HEAP<br />
<strong>School</strong> <strong>of</strong> Mathematics, <strong>The</strong> University <strong>of</strong> Manchester, Manchester M13 9PL, UK<br />
anne.juel@manchester.ac.uk<br />
(Received 27 October 2005 and in revised form 14 July 2006)<br />
We present an experimental study <strong>of</strong> the <strong>reopening</strong> mechanics <strong>of</strong> a <strong>collapsed</strong> liquid<strong>filled</strong><br />
<strong>elastic</strong> <strong>tube</strong>. <strong>The</strong> experiment is a simple mechanical model <strong>of</strong> pulmonary airway<br />
<strong>reopening</strong> and aims to assess the robustness <strong>of</strong> existing theoretical models. A metrelong<br />
horizontal <strong>elastic</strong> <strong>tube</strong> <strong>of</strong> inner radius Ri =4.88 ± 0.14 mm is <strong>filled</strong> with silicone<br />
oil and is carefully <strong>collapsed</strong> mechanically. <strong>The</strong> injection <strong>of</strong> nitrogen at a constant<br />
flow rate results in the steady propagation <strong>of</strong> an air finger, after the decay <strong>of</strong><br />
initial transients. This behaviour is observed over the realizable range <strong>of</strong> the capillary<br />
numbers Ca, which measures the ratio <strong>of</strong> viscous and capillary forces. With increasing<br />
Ca, the transition region between the <strong>collapsed</strong> and reopened sections <strong>of</strong> the <strong>tube</strong><br />
shortens, and the height <strong>of</strong> the <strong>tube</strong> behind the bubble tip increases. We also find<br />
that air fingers can propagate in partially reopened <strong>tube</strong>s, in which the transmural<br />
pressure is negative far behind the finger tip.<br />
<strong>The</strong> effect <strong>of</strong> viscosity on the <strong>reopening</strong> dynamics was explored by performing<br />
experiments using three different grades <strong>of</strong> silicone oil, with kinematic viscosities <strong>of</strong><br />
1000 cS, 200 cS and 100 cS. A direct comparison between the experimental pressure<br />
dependence on Ca and numerical simulations <strong>of</strong> the zero-gravity three-dimensional<br />
airway-<strong>reopening</strong> model <strong>of</strong> Hazel & Heil (Trans. ASME: J. Biomech. Engng, vol. 128,<br />
2006, p. 473) highlights some significant differences. Within the experimental parameter<br />
range, gravity pr<strong>of</strong>oundly influences the <strong>reopening</strong> mechanics in several ways.<br />
<strong>The</strong> <strong>reopening</strong> <strong>tube</strong> is supported by a rigid base, which induces an asymmetry about<br />
the horizontal mid-plane <strong>of</strong> the <strong>collapsed</strong> <strong>tube</strong>, resulting in distinct phases <strong>of</strong> <strong>reopening</strong><br />
as Ca increases. In addition, buoyancy forces act on the air finger, which is observed<br />
to propagate near the top <strong>of</strong> the cross-section <strong>of</strong> the <strong>tube</strong>, leaving a thicker <strong>fluid</strong>-lining<br />
below. In the limit <strong>of</strong> small Ca, the height <strong>of</strong> the reopened <strong>tube</strong> increases significantly<br />
with viscosity. Experimental evidence suggests that this increase in viscosity leads to<br />
significant changes in the film configuration behind the propagating finger, caused by<br />
the increased contribution <strong>of</strong> buoyancy forces. <strong>The</strong> altered film configuration changes<br />
the mechanical load on the <strong>tube</strong> walls and, hence, the shape <strong>of</strong> the reopened <strong>tube</strong>.<br />
1. Introduction<br />
<strong>The</strong> airways <strong>of</strong> the lungs form a branched network <strong>of</strong> <strong>fluid</strong>-lined <strong>elastic</strong> vessels linking<br />
the trachea to the alveoli, where gas exchange takes place. A number <strong>of</strong> pulmonary<br />
conditions are known to trigger the collapse <strong>of</strong> the smaller airways (Perun & Gaver III<br />
1995b; Grotberg 2001). <strong>The</strong> collapse may occur through a <strong>fluid</strong>-<strong>elastic</strong> instability,<br />
which causes the <strong>tube</strong> to buckle and eventually leads to a configuration in which<br />
a liquid bridge occludes the airway (Kamm & Schroter 1989; Halpern & Grotberg<br />
287
288 A. Juel and A. Heap<br />
1992; White & Heil 2005; Hazel & Heil 2005). Once <strong>collapsed</strong>, the airway must be<br />
reopened quickly with minimal damage to the lining tissues. When long sections are<br />
occluded, <strong>reopening</strong> is believed to occur through the propagation <strong>of</strong> an air finger<br />
(Macklem, Proctor & Moss 1970; Naureckas et al. 1994). Thus, in the last 15 years,<br />
significant efforts have been focused on understanding the mechanics <strong>of</strong> this process.<br />
<strong>The</strong> first experimental model <strong>of</strong> airway <strong>reopening</strong>, by Gaver III, Samsel & Solway<br />
(1990), comprised a thin-walled polyethylene <strong>tube</strong> that was mechanically <strong>collapsed</strong><br />
to a ribbon-like configuration and contained a thin liquid film to hold the walls in<br />
apposition. An air finger was injected at constant pressure and propagated in an<br />
approximately steady fashion by ‘peeling’ apart the walls. <strong>The</strong> <strong>tube</strong> had minimal<br />
bending stiffness and the <strong>fluid</strong>–structure interaction arose essentially through the<br />
large tension imposed on the end <strong>of</strong> the <strong>tube</strong>, relative to the viscous and capillary<br />
forces inside the <strong>tube</strong>. <strong>The</strong> radius <strong>of</strong> the <strong>tube</strong>, R, was identified as the dominant<br />
length scale and the dimensionless bubble pressure, P = P ∗ R/σ ∗ , was found to scale<br />
approximately linearly with the capillary number, Ca = µU/σ ∗ ;hereP ∗ denotes the<br />
dimensional bubble pressure (the pressure <strong>of</strong> the air finger relative to the external<br />
pressure), U the propagation speed <strong>of</strong> the air finger, µ the dynamic viscosity <strong>of</strong> the<br />
lining <strong>fluid</strong> and σ ∗ the surface tension at the air–liquid interface. <strong>The</strong> capillary number<br />
is a measure <strong>of</strong> the viscous forces relative to the capillary forces in the system and<br />
provides a non-dimensional measure <strong>of</strong> the propagation speed <strong>of</strong> the finger. Gaver III<br />
et al. (1990) also demonstrated the existence <strong>of</strong> a yield pressure, P ∗ y ∼ 8 σ ∗ /R, as<br />
Ca → 0, which must be exceeded for an air finger to propagate.<br />
A subsequent study by Perun & Gaver III (1995a) concentrated on a twodimensional<br />
analogue <strong>of</strong> this experiment, where both the <strong>collapsed</strong> and reopened ends<br />
<strong>of</strong> the airway were constrained to a planar configuration. <strong>The</strong> results <strong>of</strong> this study were<br />
qualitatively similar to those <strong>of</strong> Gaver III et al. (1990), although the airway geometry<br />
was found to influence the bubble pressures significantly. For air injected at a constant<br />
flow rate, the pressure <strong>of</strong> <strong>reopening</strong> was observed to reach a steady state for Ca > 0.5,<br />
following a short unsteady transient. Increasingly unsteady <strong>reopening</strong> processes were<br />
observed for Ca < 0.5. Furthermore, the yield pressure was reduced by a factor <strong>of</strong><br />
approximately 2 compared with that estimated by Gaver III et al. (1990). Additionally,<br />
the effect <strong>of</strong> tethering was addressed by Perun & Gaver III (1995b), who found that<br />
the asymmetric loading on the <strong>tube</strong> caused a change in the <strong>reopening</strong> pressures.<br />
Experiments with non-Newtonian <strong>fluid</strong>s by Low, Chew & Zhou (1997) revealed that<br />
the presence <strong>of</strong> a yield stress leads to increased yield pressures and <strong>reopening</strong> times.<br />
Gaver III et al. (1996) proposed a two-dimensional theoretical model for the<br />
experiments <strong>of</strong> Perun & Gaver III (1995b). Using a combination <strong>of</strong> a lubrication<br />
analysis and the boundary-element method, they considered the propagation <strong>of</strong> an air<br />
finger into a <strong>fluid</strong>-<strong>filled</strong> channel whose flexible walls were placed under tension and<br />
supported by linearly <strong>elastic</strong> springs. <strong>The</strong>ir analysis showed a two-branch behaviour<br />
in the P –Ca relationship. For low Ca, the ‘pushing branch’ results from the coupling<br />
between surface tension and <strong>elastic</strong> stresses, P decreasing as Ca increases. In the<br />
high-Ca limit, the ‘peeling branch’ results from the balance between viscous and<br />
longitudinal wall tension forces, and P increases monotonically with Ca. Twodimensional<br />
airway <strong>reopening</strong> was also addressed by Jensen et al. (2002), whose<br />
asymptotic analysis relied on the assumption that the membrane slope is uniformly<br />
small, so that the bubble pressures could be predicted analytically over a wide<br />
range <strong>of</strong> Ca. A comparison between the experimental measurements <strong>of</strong> Perun &<br />
Gaver III (1995b) and boundary-element simulations <strong>of</strong> an asymmetric <strong>tube</strong> with<br />
a symmetrically separated liquid layer yielded good agreement to within 10 % over
<strong>The</strong> <strong>reopening</strong> <strong>of</strong> a <strong>collapsed</strong> <strong>fluid</strong>-<strong>filled</strong> <strong>elastic</strong> <strong>tube</strong> 289<br />
the peeling branch. <strong>The</strong> <strong>reopening</strong> pressures obtained numerically for the asymmetric<br />
<strong>tube</strong> were a factor <strong>of</strong> approximately 1.6 larger than in the symmetric case. <strong>The</strong> effect<br />
<strong>of</strong> inertial forces on the <strong>reopening</strong> dynamics was addressed numerically by Heil (2000)<br />
using a finite-element method. Inertial forces were quantified by the speed-independent<br />
parameter Re/Ca = ρσ ∗ R/µ 2 ,whereRe = ρUR/µ is the Reynolds number and ρ<br />
is the density <strong>of</strong> the liquid. In the presence <strong>of</strong> finite bending stiffness <strong>of</strong> the walls,<br />
Heil found that even for relatively small Re/Ca, i.e. values between 5 and 10, the<br />
transition region <strong>of</strong> the <strong>reopening</strong> <strong>tube</strong> is significantly altered, resulting in steepening<br />
<strong>of</strong> the P –Ca curves. Finally, a detailed study <strong>of</strong> the physiologically relevant influence<br />
<strong>of</strong> surfactant was performed recently by Naire & Jensen (2005).<br />
A fundamental shortcoming <strong>of</strong> some two-dimensional models is that a change in<br />
transmural pressure is equivalent to a rescaling <strong>of</strong> the transverse length scale, unless<br />
the use <strong>of</strong> a nonlinear <strong>tube</strong> law provides a natural length scale (Naire & Jensen<br />
2005). Thus Hazel & Heil (2003) developed a three-dimensional numerical model <strong>of</strong><br />
airway <strong>reopening</strong> in which the radius <strong>of</strong> the <strong>tube</strong> provides a natural transverse length<br />
scale, so that the transmural pressure becomes a significant variable <strong>of</strong> the system.<br />
<strong>The</strong>y considered the steady motion <strong>of</strong> an inviscid air finger <strong>reopening</strong> a <strong>fluid</strong>-<strong>filled</strong><br />
<strong>collapsed</strong> <strong>elastic</strong> <strong>tube</strong> <strong>of</strong> infinite length by coupling nonlinear Kirchh<strong>of</strong>f–Love shell<br />
theory to the free–surface Stokes equations. <strong>The</strong> level <strong>of</strong> <strong>fluid</strong>-structure interaction was<br />
measured by the non-dimensional surface tension, σ = σ ∗ /(RK), which corresponds<br />
to the ratio <strong>of</strong> capillary and <strong>elastic</strong> forces; K is the bending stiffness <strong>of</strong> the <strong>tube</strong>. <strong>The</strong><br />
initial level <strong>of</strong> <strong>tube</strong> collapse was characterized by the reduced cross-sectional area,<br />
A∞ = A ∗ ∞/(4R 2 ), where A ∗ ∞ is the dimensional cross-sectional area <strong>of</strong> the <strong>tube</strong> far<br />
ahead <strong>of</strong> the bubble. This model <strong>of</strong> airway <strong>reopening</strong> was developed in the limit <strong>of</strong><br />
zero gravity, so that the <strong>fluid</strong> lining left behind the advancing finger on the <strong>tube</strong> walls<br />
retained the up–down symmetry <strong>of</strong> the cross-section. Thus, far behind the finger tip,<br />
the <strong>tube</strong> reopened approximately according to the cross-sectional shapes predicted by<br />
the ‘<strong>tube</strong> law’ (Shapiro 1977). <strong>The</strong> qualitative behaviour <strong>of</strong> the system was found to<br />
be very similar to the two-dimensional predictions <strong>of</strong> Gaver III et al. (1996) and Heil<br />
(2000), with a two-branch behaviour <strong>of</strong> the P –Ca relationship. <strong>The</strong> pressure required<br />
to drive the finger at a given speed was found to increase with both σ and A∞, sothat<br />
higher-pressure bubbles were required to reopen less strongly <strong>collapsed</strong> <strong>tube</strong>s. If σ<br />
were sufficiently small, steady airway <strong>reopening</strong> could occur for pressures lower than<br />
the external (pleural) pressure, i.e. the airway remained buckled after the passage <strong>of</strong><br />
the air finger. This is the limit investigated in the present experiments.<br />
Hazel & Heil (2006) recently extended the three-dimensional Stokes model to finite<br />
Reynolds numbers, so that the air-finger propagation was governed by Re, Ca, σ<br />
and A∞. <strong>The</strong>y showed that, as in the two-dimensional model <strong>of</strong> Heil (2000), inertial<br />
forces have a significant effect on the bubble pressures, strongly influencing the<br />
<strong>fluid</strong> dynamics and wall shape in the vicinity <strong>of</strong> the advancing finger tip, through a<br />
mechanism consistent with the Bernoulli effect.<br />
Thus far, airway <strong>reopening</strong> in <strong>tube</strong>s <strong>of</strong> significant bending stiffness has been<br />
addressed exclusively by theoretical and numerical studies and, invariably, the models<br />
are based on several approximations, for instance, steady-state propagation and zero<br />
gravity (Hazel & Heil 2003, 2006). As reported in this paper, we chose to perform a<br />
detailed laboratory investigation <strong>of</strong> the mechanics <strong>of</strong> airway <strong>reopening</strong>, which enabled<br />
us to assess the robustness <strong>of</strong> these theoretical approximations. In addition to the<br />
<strong>fluid</strong> parameters Ca and Re, the presence <strong>of</strong> gravity forces can be quantified relative<br />
to the capillary forces by the Bond number, Bo = ρgR 2 /σ ∗ . We chose the mid-wall<br />
radius, R = Ri + h/2, where Ri is the inner radius and h the wall thickness <strong>of</strong> the
290 A. Juel and A. Heap<br />
<strong>tube</strong>, as the experimental length scale. Our experimental setup is described in § 2.1,<br />
with a strong emphasis on experimental control and reproducibility. We focus on a<br />
simple laboratory model <strong>of</strong> air-finger propagation in a long, horizontal, <strong>fluid</strong>-<strong>filled</strong>,<br />
partially <strong>collapsed</strong> <strong>tube</strong>. In contrast with the earlier experiments <strong>of</strong> Gaver III et al.<br />
(1990), where the large tension applied to the end <strong>of</strong> the <strong>tube</strong> dominated the <strong>fluid</strong>–<br />
structure interaction and the small bending stiffness <strong>of</strong> the polyethylene <strong>tube</strong> played<br />
a negligible role, our <strong>elastic</strong> silicone <strong>tube</strong> was chosen for its finite bending stiffness,<br />
with σ =3.6 × 10⁻² . This yields ratios <strong>of</strong> viscous and <strong>elastic</strong> forces σ Ca <strong>of</strong> up to<br />
0.4, a significant <strong>fluid</strong>–structure interaction. Our value <strong>of</strong> σ , however, is much smaller<br />
than estimates for the deep lung <strong>of</strong> approximately σ = 50 (Hazel & Heil 2003), and<br />
thus a direct comparison with pulmonary behaviour should be made with caution.<br />
<strong>The</strong> low value <strong>of</strong> σ results in airway-<strong>reopening</strong> pressures that are largely negative,<br />
in contrast with the experiments <strong>of</strong> Gaver III et al. (1990) and Perun & Gaver III<br />
(1995a,b). <strong>The</strong> <strong>tube</strong> collapses with two-fold symmetry according to a classical ‘<strong>tube</strong><br />
law’, which, as reported in § 2.2, we measured in order to determine the value <strong>of</strong> the<br />
dimensional bending stiffness <strong>of</strong> the <strong>tube</strong>. Thus, our experiment models an idealized<br />
isolated airway and, in the interest <strong>of</strong> simplicity, we neglect tethering and do not add<br />
surfactants, although both are important in the lung.<br />
<strong>The</strong> effect <strong>of</strong> viscosity on the <strong>reopening</strong> dynamics is explored in § 3 by presenting<br />
experiments using three different grades <strong>of</strong> silicone oil, with kinematic viscosities<br />
<strong>of</strong> 1000 cS, 200 cS and 100 cS. We attempt a direct comparison between the<br />
experimental pressures and the computational results <strong>of</strong> Hazel & Heil (2006) in<br />
§ 3.1, which highlights significant differences in the P –Ca relationship. We attribute<br />
these differences to the presence <strong>of</strong> gravity in the experiment, whose dual effect on<br />
the <strong>reopening</strong> mechanics is discussed in § 3.2. In essence, buoyancy affects the level <strong>of</strong><br />
<strong>reopening</strong> behind the finger tip through changes to the flow configuration inside the<br />
<strong>tube</strong>, while gravity acting on the <strong>reopening</strong> <strong>tube</strong> breaks the symmetry <strong>of</strong> the transition<br />
region, which results in distinct phases <strong>of</strong> <strong>reopening</strong> with increasing Ca.<br />
2. Experimental methods<br />
2.1. Description <strong>of</strong> the apparatus and experimental procedure<br />
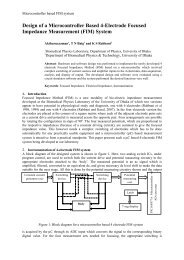
A schematic diagram <strong>of</strong> the experimental apparatus is shown in figure 1. <strong>The</strong> working<br />
part <strong>of</strong> the apparatus consisted <strong>of</strong> a piece <strong>of</strong> translucent extruded silicone tubing<br />
(Primasil Silicones Ltd) 1.0 m long positioned on a solid base plate. <strong>The</strong> tubing had<br />
an inner radius Ri =4.88 ± 0.14 mm and wall thickness h =0.48 ± 0.07 mm. <strong>The</strong><br />
downstream end was connected to a two-way valve, which was operated manually.<br />
At the upstream end, a three-way pneumatic solenoid valve was used to switch the<br />
gas flow from exiting into the atmosphere to entering the <strong>tube</strong> at the start <strong>of</strong> each<br />
experiment.<br />
<strong>The</strong> flow source was a compressed nitrogen cylinder, whose flow rate was controlled<br />
by a fine needle valve and was accurately monitored using a 0–5000 cm 3 min −1 massairflow<br />
meter (AWM5000 microbridge mass-airflow sensor, Honeywell) to range<br />
between 50 and 1400 cm 3 min −1 . <strong>The</strong> air-mass flow meter was powered by a 10.000 ±<br />
0.001 V stabilised direct current supply and readings were made with a five-digitaccuracy<br />
voltmeter. At 1400 cm 3 min −1 , the Reynolds number <strong>of</strong> the air jet flowing out<br />
<strong>of</strong> the solenoid valve nozzle into the <strong>tube</strong> was approximately equal to 340. Beyond this<br />
value the recorded pressure traces showed increasing levels <strong>of</strong> fluctuations, believed<br />
to be due to instabilities in the injected air. A differential pressure sensor (Honeywell,<br />
±5 ′′ H2O) was attached to the line immediately upstream <strong>of</strong> the solenoid valve, via
Air<br />
flow<br />
Needle<br />
valve<br />
<strong>The</strong> <strong>reopening</strong> <strong>of</strong> a <strong>collapsed</strong> <strong>fluid</strong>-<strong>filled</strong> <strong>elastic</strong> <strong>tube</strong> 291<br />
Mass-airflow<br />
meter<br />
Solenoid<br />
three-way valve<br />
Pressure<br />
sensor<br />
T-junction<br />
(b)<br />
(a)<br />
Translation stage<br />
Silicone tubing<br />
Base plate<br />
1.0 m<br />
Manual<br />
two-way valve<br />
Figure 1. Schematic diagram <strong>of</strong> the experimental apparatus. (a) <strong>The</strong> vertical dashed arrow<br />
shows motion <strong>of</strong> the upper plate; (b) the diagonal dashed arrows show the horizontal motion<br />
<strong>of</strong> the support plate; (c) the curved arrow at the night shows the 25 ◦ tilt <strong>of</strong> the support plate.<br />
a T-junction connected to one <strong>of</strong> its ports, while the second port <strong>of</strong> the pressure<br />
sensor was left open to the atmosphere. <strong>The</strong> pressure sensor was powered by the<br />
same power supply as the mass-airflow meter and was calibrated in situ against a<br />
water-<strong>filled</strong> U-<strong>tube</strong> manometer. <strong>The</strong> bubble pressure in the <strong>elastic</strong> <strong>tube</strong> was obtained<br />
by subtracting from the sensor measurements the small pressure drop due to the rigid<br />
gas line between the sensor and the inlet <strong>of</strong> the flexible <strong>tube</strong>, which was measured<br />
for an open circuit. <strong>The</strong> pressure was sampled on a personal computer via an RS232<br />
serial connection from a high-resolution voltmeter at a rate <strong>of</strong> 25 Hz.<br />
In addition to the pressure measurements, two analogue CCD cameras were used to<br />
monitor the <strong>reopening</strong> process, as shown in figure 2. One camera captured a side view<br />
<strong>of</strong> the <strong>tube</strong> over a length <strong>of</strong> 13 cm, starting at least 50 cm downstream <strong>of</strong> the inlet. Its<br />
position was chosen, depending on the flow rate, to ensure that all transient behaviour<br />
had decayed. It was used to record the propagation speed <strong>of</strong> the air bubble <strong>reopening</strong><br />
the <strong>tube</strong> and also to capture images <strong>of</strong> the transition region between the <strong>collapsed</strong><br />
and reopened sections <strong>of</strong> the <strong>tube</strong>. In order to obtain a quantitative measure <strong>of</strong> the<br />
deformation <strong>of</strong> the top half <strong>of</strong> the <strong>tube</strong>, a laser sheet was shone onto the <strong>tube</strong> at an<br />
angle <strong>of</strong> 50 ◦ from the vertical and the second camera was placed vertically above the<br />
illuminated region to provide a top view <strong>of</strong> a section <strong>of</strong> the <strong>tube</strong> approximately 2.5 cm<br />
long by 2.0 cm wide. As shown schematically in figure 2, the laser sheet illuminated<br />
the <strong>tube</strong> wall at different horizontal positions depending on the local height <strong>of</strong> the<br />
<strong>tube</strong>, thus outlining local deformations relative to the horizontal base plate. <strong>The</strong> local<br />
height <strong>of</strong> the <strong>tube</strong> was given by D = d/tan 50 ◦ ,whered is the displacement <strong>of</strong> the<br />
laser line from its position on the flat base plate. An example <strong>of</strong> the aerial visualization<br />
is shown in figure 3, where the laser line outlines the deformation <strong>of</strong> the top half <strong>of</strong><br />
the <strong>collapsed</strong> <strong>tube</strong>. <strong>The</strong> images <strong>of</strong> the two cameras were combined using an image<br />
inserter (Kramer, PIP-200) and sampled simultaneously onto a personal computer at<br />
arate<strong>of</strong>25framess −1 . <strong>The</strong> resolutions <strong>of</strong> the side and aerial-view images were 0.18<br />
and 0.09 mm per pixel respectively. <strong>The</strong> values <strong>of</strong> the maximum height <strong>of</strong> the <strong>tube</strong><br />
were the same, within the experimental resolution, when measured with the aerial<br />
and side-view cameras.<br />
<strong>The</strong> base plate, on which the <strong>tube</strong> and valves were positioned, was accurately<br />
levelled and its vertical position was held fixed. It was mounted rigidly beneath a<br />
facing parallel plate on a vertical translation stage whose purpose was to collapse the<br />
(c)
292 A. Juel and A. Heap<br />
d<br />
Laser<br />
diode<br />
Laser<br />
sheet<br />
D<br />
Aerial<br />
camera<br />
Sideview<br />
camera<br />
Figure 2. Schematic diagram <strong>of</strong> the visualisation setup. A laser sheet, oriented at 50 ◦ from<br />
the vertical, is shone onto the deformed <strong>tube</strong>. <strong>The</strong> <strong>tube</strong> is illuminated at different horizontal<br />
positions depending on its local height. Thus, the laser sheet outlines local deformations<br />
relative to the horizontal base plate, which are captured by the aerial camera. A sideview<br />
camera monitors the <strong>reopening</strong> process over a section <strong>of</strong> <strong>tube</strong> 13 cm long.<br />
14.4 mm<br />
4.2 mm<br />
Figure 3. Aerial view <strong>of</strong> the <strong>collapsed</strong> liquid-<strong>filled</strong> <strong>tube</strong> prior to an experimental run. <strong>The</strong><br />
experimental visualization technique, depicted in figure 2, provides a quantitative measure <strong>of</strong><br />
the outline <strong>of</strong> the top half <strong>of</strong> the deformed <strong>tube</strong>. <strong>The</strong> schematic diagram on the right-hand side<br />
depicts the full cross-sectional area <strong>of</strong> the <strong>collapsed</strong> <strong>tube</strong>, under the assumption <strong>of</strong> a symmetric<br />
<strong>collapsed</strong> cross-section.<br />
<strong>tube</strong> mechanically prior to an experiment, as shown in figure 1. <strong>The</strong> base plate was<br />
mounted on bearings so that it could slide forward from under the main frame to<br />
facilitate the filling <strong>of</strong> the <strong>tube</strong>. It was hinged at the upstream end so that it could<br />
be tilted upward by 25 ◦ , and supported by a hinged arm at the downstream end.<br />
<strong>The</strong> <strong>tube</strong> was then slowly <strong>filled</strong> with liquid via the downstream two-way valve. This<br />
method eliminated any handling <strong>of</strong> the <strong>tube</strong> during the experimental process and<br />
allowed all air bubbles to rise and be expelled.
<strong>The</strong> <strong>reopening</strong> <strong>of</strong> a <strong>collapsed</strong> <strong>fluid</strong>-<strong>filled</strong> <strong>elastic</strong> <strong>tube</strong> 293<br />
h<br />
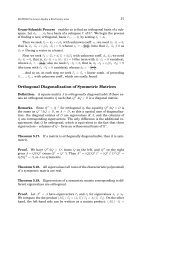
Figure 4. Schematic diagram <strong>of</strong> the strained shape adopted by the cross-section <strong>of</strong> the <strong>tube</strong>,<br />
after collapse but while still in contact with both plates. This shape can be closely approximated<br />
by a rectangle <strong>of</strong> height H capped by two semicircles, each <strong>of</strong> radius H/2.<br />
Silicone oil grade µ ρ σ ∗<br />
(cS) (kg m −1 s −1 ) (kg m −3 ) (N m −1 ) Re/Ca = ρσ ∗ R/µ 2<br />
100 0.111 961 2.04 × 10 −2 8.2<br />
200 0.216 962 2.05 × 10 −2 2.2<br />
1000 1.065 966 2.07 × 10 −2 0.1<br />
Table 1. Physical properties <strong>of</strong> the silicone <strong>fluid</strong>s at 18 ◦ C, where µ denotes the dynamic<br />
viscosity, ρ the density and σ ∗ the surface tension with air. <strong>The</strong> ratio <strong>of</strong> the Reynolds number<br />
and the capillary number, Re/Ca, is also given for each <strong>fluid</strong>.<br />
After the filling procedure, the base plate was returned to its initial position so that<br />
the silicone <strong>tube</strong> could be <strong>collapsed</strong>. This was achieved mechanically by lowering the<br />
upper plate onto the liquid-<strong>filled</strong> <strong>tube</strong> while carefully letting the excess liquid escape<br />
through the downstream valve. <strong>The</strong> position <strong>of</strong> the upper plate could be adjusted to<br />
within 0.02 mm, which was less than 1 % <strong>of</strong> the height <strong>of</strong> the <strong>collapsed</strong> <strong>tube</strong>. Hence, the<br />
height <strong>of</strong> the <strong>collapsed</strong> <strong>tube</strong> H could be uniformly and reproducibly attained. All the<br />
experiments presented in this paper were conducted with <strong>tube</strong>s <strong>collapsed</strong> to a height<br />
H =2.92 ± 0.02 mm, which corresponds to a reduction <strong>of</strong> 73 % from the undeformed<br />
state. During this mechanical collapse the cross-section <strong>of</strong> the <strong>tube</strong> adopted a strained<br />
shape, which could be closely approximated by a rectangle <strong>of</strong> height H capped by<br />
two semicircles, each <strong>of</strong> radius H/2, as shown in figure 4. After the collapse was<br />
completed, the downstream valve was closed and the upper plate was lifted <strong>of</strong>f the<br />
<strong>tube</strong>. <strong>The</strong> <strong>tube</strong> then relaxed into its equilibrium shape, which consisted <strong>of</strong> two end<br />
lobes separated by a thinner central region, as shown schematically in figure 3. Here,<br />
we have assumed that the <strong>collapsed</strong> cross-section is symmetric, although the top-view<br />
visualization yields measurements <strong>of</strong> only the top half-section <strong>of</strong> the <strong>tube</strong>.<br />
<strong>The</strong> working liquid was silicone oil, which was chosen for its stable interfacial<br />
properties and because it fully wets the <strong>tube</strong>. Experiments were carried out with<br />
oils <strong>of</strong> three different viscosities. <strong>The</strong> experiments were conducted in a temperaturecontrolledroomat18±<br />
1 ◦ C; the physical properties <strong>of</strong> the oils at this temperature<br />
are given in table 1. <strong>The</strong> dynamic viscosity µ and the density ρ were measured in the<br />
laboratory and the value <strong>of</strong> the surface tension σ ∗ was determined on the basis <strong>of</strong> the<br />
the manufacturer’s data and the temperature coefficient <strong>of</strong> surface tension quoted by<br />
Schatz et al. (1995) for silicone oil.<br />
H<br />
H/2
294 A. Juel and A. Heap<br />
P * (Pa)<br />
600<br />
500<br />
400<br />
300<br />
200<br />
100<br />
0<br />
–100<br />
Ca = 0.8 (150 cm 3 min –1 )<br />
1.7 (300 cm 3 min –1 )<br />
2.7 (600 cm 3 min –1 )<br />
4.7 (1200 cm 3 min –1 )<br />
–200<br />
0 2 4 6 8<br />
Time (s)<br />
10 12 14 16<br />
Figure 5. Pressure time series measured for 150, 300, 600 and 1200 cm 3 min −1 , with 200 cS<br />
silicone oil. In each case, the approximately constant pressure trace that follows short initial<br />
transients linked to the switching <strong>of</strong> the solenoid valve indicates the steady propagation <strong>of</strong> an<br />
air finger. <strong>The</strong> pairs <strong>of</strong> markers on each curve delimit the region in which the propagating<br />
air finger is captured by the side-view camera. An average pressure value is calculated in this<br />
interval. <strong>The</strong> sharp rise in pressure at the end <strong>of</strong> the experiment corresponds to the time at<br />
which the air finger reaches the end <strong>of</strong> the <strong>tube</strong> and the associated inflation <strong>of</strong> the reopened<br />
<strong>tube</strong> takes place. <strong>The</strong> duration <strong>of</strong> the experiments reduces with increasing flow rate, because<br />
the finger propagates with increasing speed.<br />
Once the <strong>tube</strong> had been <strong>filled</strong> and <strong>collapsed</strong>, the nitrogen flow into the atmosphere<br />
was adjusted with the needle valve. <strong>The</strong> solenoid valve was then triggered to direct<br />
the nitrogen flow into the <strong>collapsed</strong>, liquid-<strong>filled</strong>, <strong>tube</strong> and the sampling <strong>of</strong> both the<br />
pressure and video footage was initiated. In most cases, an air finger <strong>of</strong> approximately<br />
constant pressure was observed to propagate steadily down the <strong>tube</strong>. Four typical<br />
pressure traces sampled at flow rates <strong>of</strong> 150, 300, 600 and 1200 cm 3 min −1 with<br />
200 cS silicone oil are shown in figure 5. <strong>The</strong> steady state was established within<br />
approximately 1 s <strong>of</strong> the opening <strong>of</strong> the solenoid valve. When the air finger was<br />
within approximately 5 cm from the end <strong>of</strong> the <strong>tube</strong> the pressure rose rapidly, as the<br />
injected flow continued to inflate the reopened <strong>tube</strong> and saturated the pressure sensor.<br />
At this point the experiment was discontinued, by opening the end valve, to avoid<br />
permanent deformation <strong>of</strong> the silicone <strong>tube</strong>. <strong>The</strong> pressure <strong>of</strong> <strong>reopening</strong> was determined<br />
by averaging the recorded pressure trace over the section 13 cm long monitored by<br />
the side-view camera, delimited by markers on the pressure traces in figure 5.<br />
2.2. Experimental parameters and <strong>elastic</strong> properties <strong>of</strong> the <strong>tube</strong>s<br />
<strong>The</strong> <strong>fluid</strong> parameters required to describe the steady propagation <strong>of</strong> an air finger<br />
in the experiment are Ca, the ratio <strong>of</strong> viscous and capillary forces, Re, the ratio<br />
<strong>of</strong> inertial and viscous forces and Bo, the ratio <strong>of</strong> gravity and capillary forces. <strong>The</strong><br />
ratios Ca = µU/σ ∗ and Re = ρUR/µ depend on the finger speed, which is accurately<br />
determined using the side-view images <strong>of</strong> the <strong>reopening</strong> <strong>tube</strong>. <strong>The</strong> ratio Re/Ca, given<br />
in table 1, depends exclusively on the physical properties <strong>of</strong> the <strong>fluid</strong>s and the radius<br />
<strong>of</strong> the <strong>tube</strong>, as does Bo = ρgR 2 /σ ∗ =12.1, which remains constant in the experiments.
<strong>The</strong> <strong>reopening</strong> <strong>of</strong> a <strong>collapsed</strong> <strong>fluid</strong>-<strong>filled</strong> <strong>elastic</strong> <strong>tube</strong> 295<br />
<strong>The</strong> cross-sectional area <strong>of</strong> the <strong>collapsed</strong> <strong>tube</strong>, A∗ ∞, was calculated by approximating<br />
the shape <strong>of</strong> the cross-section <strong>of</strong> the <strong>tube</strong> held between the plates <strong>of</strong> the translation<br />
stage at the end <strong>of</strong> the collapse procedure by a rectangle capped by two semicircles,<br />
as mentioned above (see figure 4). Thus, assuming negligible stretching during the collapse<br />
procedure, the circumference <strong>of</strong> the <strong>tube</strong> remains constant and the cross-sectional<br />
area <strong>of</strong> the <strong>collapsed</strong> <strong>tube</strong>, estimated midway through the wall thickness, is given by<br />
A ∗ 2 <br />
H h<br />
2 π R − π (H − h)<br />
∞ = π − +(H − h)<br />
,<br />
2 2<br />
2<br />
where R =5.12 mm is the midwall radius <strong>of</strong> the undeformed <strong>tube</strong>, h =0.48 mm is<br />
the wall thickness and H =2.92 mm is the height <strong>of</strong> the <strong>collapsed</strong> <strong>tube</strong> held between<br />
the plates <strong>of</strong> the translation stage. Hence<br />
A∞ = A∗∞ =0.33<br />
4R2 for all the experiments presented in this paper.<br />
<strong>The</strong> final non-dimensional group <strong>of</strong> parameters involves the <strong>elastic</strong> properties <strong>of</strong><br />
the <strong>tube</strong>; it is the non-dimensional surface tension σ = σ ∗ /(RK), which measures the<br />
relative effect <strong>of</strong> capillary and <strong>elastic</strong> forces and requires knowledge <strong>of</strong> the bending<br />
stiffness K <strong>of</strong> the <strong>tube</strong>. Using thin-shell theory, Flaherty, Keller & Rubinow (1972)<br />
predicted that the pressure <strong>of</strong> opposite-wall contact in a buckled <strong>elastic</strong> <strong>tube</strong> <strong>of</strong> tw<strong>of</strong>old<br />
symmetry and undeformed circular cross-section, in the absence <strong>of</strong> gravity, is<br />
P ∗ owc<br />
= −5.25.<br />
K<br />
A. L. Hazel (2005, personal communication) estimated numerically that the pressure<br />
<strong>of</strong> opposite-wall contact <strong>of</strong> a silicone ring with h/R =0.09, deforming under its<br />
own weight on a rigid surface, is reduced by less than 1.5 % compared with the<br />
zero-gravity case. In order to determine the pressure <strong>of</strong> opposite-wall contact and<br />
hence the value <strong>of</strong> K experimentally, measurements were made <strong>of</strong> the dependence<br />
<strong>of</strong> the transmural pressure on the cross-sectional area, commonly referred to as the<br />
‘<strong>tube</strong> law’. An empty <strong>tube</strong> was fully <strong>collapsed</strong> and slowly reopened by injecting air<br />
at a flow rate <strong>of</strong> 50 cm3 min−1 . <strong>The</strong> <strong>tube</strong> reopened uniformly along its entire length,<br />
suggesting that its cross-sectional area is proportional to the time elapsed since<br />
the opening <strong>of</strong> the solenoid valve. An example <strong>of</strong> this experimental ‘<strong>tube</strong> law’ is<br />
shown in figure 6. <strong>The</strong> dimensional transmural pressure P ∗<br />
t is plotted against the<br />
cross-sectional area <strong>of</strong> the <strong>tube</strong> A normalized by the undeformed cross-sectional area,<br />
A0 = πR 2 i . <strong>The</strong> transmural pressure goes through zero slightly below A/A0 =1.This<br />
small discrepancy is due to the effect <strong>of</strong> gravity, which reduced the inflated height<br />
<strong>of</strong> the <strong>tube</strong> by less than 5 %. <strong>The</strong> point <strong>of</strong> opposite-wall contact is clearly visible as<br />
a kink in the curve. <strong>The</strong> pressure at this point was found to be independent <strong>of</strong> the<br />
flow rate at which the <strong>collapsed</strong> <strong>tube</strong> reopened, and measurements performed in four<br />
non-contiguous lengths <strong>of</strong> <strong>tube</strong> gave P ∗ owc = −591 ± 12 Pa. Thus, the value <strong>of</strong> the<br />
bending stiffness is K = 112 ± 2N m −2 , and the non-dimensional surface tension has<br />
the same value, σ =(3.6 ± 0.2) × 10 −2 , for all three grades <strong>of</strong> silicone oil.<br />
2.3. Experimental reproducibility<br />
Silicone oil slowly diffuses into the wall <strong>of</strong> the tubing, altering its <strong>elastic</strong> properties.<br />
In order to minimize this effect, <strong>tube</strong>s were discarded after six experiments and a<br />
system was instigated to check the reproducibility <strong>of</strong> the results. For each <strong>tube</strong> used,
296 A. Juel and A. Heap<br />
P t * (Pa)<br />
1500<br />
1000<br />
500<br />
0<br />
–591<br />
–1000<br />
(a) •<br />
(b)<br />
•<br />
73% collapse<br />
Point <strong>of</strong> opposite-wall contact<br />
–1500<br />
0 0.2 0.4 0.6<br />
A/A0 0.8 1.0 1.2<br />
Figure 6. Experimental ‘<strong>tube</strong> law’: dependence <strong>of</strong> the transmural pressure P ∗<br />
t on the<br />
cross-sectional area <strong>of</strong> an empty <strong>tube</strong> (solid line). <strong>The</strong> measurements were obtained by fully<br />
collapsing an empty <strong>tube</strong> and subsequently <strong>reopening</strong> it ‘quasi-statically’ (with air injected at a<br />
flow rate <strong>of</strong> 50 cm 3 min −1 ). <strong>The</strong> insets are images <strong>of</strong> the top half <strong>of</strong> the <strong>tube</strong> for different levels <strong>of</strong><br />
collapse. <strong>The</strong> laser line outlines the shape <strong>of</strong> the <strong>tube</strong>: (a) the fully <strong>collapsed</strong> <strong>tube</strong> with minimal<br />
lobes at the side boundaries; (b) the buckled shape near the point <strong>of</strong> opposite-wall contact, with<br />
increasingly large side lobes; (c) the buckled <strong>tube</strong> with approximately elliptical cross-section;<br />
(d) the inflated <strong>tube</strong> with circular cross section. <strong>The</strong> point <strong>of</strong> opposite-wall contact corresponds<br />
to the kink in the curve. <strong>The</strong> pressure measured at this point is P ∗ owc = −591 Pa. <strong>The</strong> point<br />
<strong>of</strong> 73 % collapse, which corresponds to the initial level <strong>of</strong> collapse in the bubble propagation<br />
experiments, is highlighted with a marker.<br />
three flow rates were applied and for each flow rate the experiments were conducted<br />
twice, the same flow rate being selected for the first and last experiments on a given<br />
<strong>tube</strong>. In addition, rather than monotonically incrementing the flow rate its values<br />
were selected randomly, in order to avoid systematic patterns <strong>of</strong> bubble pressure due<br />
to unavoidable fluctuations in the wall thickness along the length <strong>of</strong> a <strong>tube</strong>. Finally,<br />
in order to ensure a sufficient sample <strong>of</strong> data, between two and 13 experiments were<br />
performedateachflowrate.<br />
An example <strong>of</strong> a pressure data set gathered at a flow rate <strong>of</strong> 300 cm 3 min −1 , with<br />
200 cS silicone oil, over three experiments is presented in figure 7. Experiments 1 and 2<br />
were conducted with the same <strong>tube</strong> on the same day, whereas experiment 3 was carried<br />
out two weeks later with a different, non-contiguous, section <strong>of</strong> <strong>tube</strong>. <strong>The</strong> comparison<br />
between these three pressure traces demonstrates a good experimental reproducibility<br />
during the steady-state propagation phase, since the third experimental trace lies<br />
between the two traces measured using the same <strong>tube</strong>. <strong>The</strong> fluctuations observed in<br />
these pressure traces are believed to be due to small variations in wall thickness along<br />
the length <strong>of</strong> the <strong>tube</strong>, as well as unavoidable perturbations in the ambient pressure.<br />
<strong>The</strong> fluctuations within each set <strong>of</strong> measurements at a given flow rate are less than<br />
40 Pa. <strong>The</strong> total pressure range <strong>of</strong> interest, 400 Pa, is also small, however, so that the<br />
experimental error at each flow rate is approximately 10 % <strong>of</strong> the investigated-pressure<br />
range.<br />
(c)<br />
•<br />
• (d)
P * (Pa)<br />
600<br />
500<br />
400<br />
300<br />
200<br />
100<br />
0<br />
–100<br />
<strong>The</strong> <strong>reopening</strong> <strong>of</strong> a <strong>collapsed</strong> <strong>fluid</strong>-<strong>filled</strong> <strong>elastic</strong> <strong>tube</strong> 297<br />
Experiment 1<br />
Experiment 2<br />
Experiment 3<br />
–200<br />
0 1 2 3 4 5 6 7 8 9<br />
Time (s)<br />
Figure 7. Three pressure traces recorded at the same value <strong>of</strong> the flow rate, 300 cm 3 min −1 ,<br />
and with 200 cS silicone oil. Experiments 1 and 2 were performed with the same piece <strong>of</strong><br />
silicone tubing on the same day. Experiment 3 was carried out two weeks later with a different<br />
<strong>tube</strong> from the same batch.<br />
In addition, the experiments were extremely sensitive to small imperfections in<br />
the <strong>tube</strong>s. <strong>The</strong> slightly adhesive nature <strong>of</strong> the silicone created storage difficulties, as<br />
the <strong>tube</strong>s tended to stick together, causing permanent deformations. This issue was<br />
resolved by coating the outer walls <strong>of</strong> the <strong>tube</strong>s with talcum powder and storing them<br />
carefully in a box 1 m long. To probe the sensitivity <strong>of</strong> the <strong>reopening</strong> dynamics to imperfections<br />
arising during the experimental setup procedure, a minimal twisting strain<br />
was introduced prior to one test experiment performed with 200 cS silicone oil at a flow<br />
rate <strong>of</strong> 300 cm 3 min −1 . A comparison between the resulting pressure trace (the dashed<br />
line) and that from an unperturbed experiment (the solid line) is shown in figure 8. <strong>The</strong><br />
significant variation <strong>of</strong> the perturbed pressure indicates that the air finger does not<br />
propagate uniformly. <strong>The</strong> perturbed pressure trace exhibits fluctuations <strong>of</strong> 48 Pa compared<br />
with 7 Pa for the normal pressure over the measurement section. This example<br />
highlights the quality <strong>of</strong> experimental control achieved in the results shown in figure 7.<br />
<strong>The</strong> experiments shown in figure 8 were carried out with a <strong>tube</strong> from a batch<br />
different from the single batch <strong>of</strong> 150 m <strong>of</strong> tubing used for the remainder <strong>of</strong><br />
the experiments presented in this paper. <strong>The</strong> pressure level during steady finger<br />
propagation is approximately −500 Pa, which may be compared with −100 Pa for<br />
the experiments shown in figure 7. This significant difference is due to variations in<br />
the <strong>elastic</strong> properties <strong>of</strong> the silicone rubber as well as changes in the wall thickness<br />
between batches, both <strong>of</strong> which altered the bending stiffness and thus reduced σ<br />
by approximately 25 %. <strong>The</strong>se results are in agreement with the computations <strong>of</strong><br />
Hazel & Heil (2003), which indicate significant reductions in the bubble pressure with<br />
decreasing σ , for the small values <strong>of</strong> σ investigated experimentally.<br />
3. Results<br />
We present experimental results obtained for three different grades <strong>of</strong> silicone oil,<br />
as shown in table 1. A total <strong>of</strong> 47, 111 and 74 experiments were performed for the
298 A. Juel and A. Heap<br />
P * (Pa)<br />
100<br />
0<br />
–100<br />
–200<br />
–300<br />
–400<br />
–500<br />
–600<br />
Normal experiment<br />
Perturbed experiment<br />
0 1 2 3 4 5<br />
Time (s)<br />
6 7 8 9 10<br />
Figure 8. Effect <strong>of</strong> small experimental perturbations on the pressure traces. In the perturbed<br />
experiment, a minimal twisting strain was applied to the <strong>tube</strong> during setup. Both experiments<br />
were performed for 300 cm 3 min −1 with 200 cS silicone oil. <strong>The</strong> pressure level during the steady<br />
finger propagation is approximately −500 Pa compared with −100 Pa in the experiments shown<br />
in figure 7. This difference is due to the use <strong>of</strong> a <strong>tube</strong> from a different batch to that used for<br />
the remainder <strong>of</strong> the experiments presented in this paper.<br />
1000 cS, 200 cS and 100 cS silicone oils respectively. Between two and 13 realizations<br />
<strong>of</strong> the experiment were performed at each flow rate, so that significant trends could<br />
be reliably extracted in spite <strong>of</strong> the difficulties associated with the smallness <strong>of</strong> the<br />
pressure range <strong>of</strong> interest and the unavoidable fluctuations present in the system. For<br />
each value <strong>of</strong> the imposed flow rate, the same (P,Ca) state was detected during each<br />
realization <strong>of</strong> the experiment. Thus we present the results averaged for each flow rate,<br />
with upper and lower error bars each corresponding to one standard deviation from<br />
the mean <strong>of</strong> the data set. <strong>The</strong>se error bars are larger than any error estimated from<br />
the variations within a single experiment. Particular attention is focused on the 200 cS<br />
experiments (there were 111 such experiments, and up to 13 measurements per flow<br />
rate), because they exhibited the most complex dynamics.<br />
3.1. Pressure measurements: comparison with numerical simulations<br />
<strong>The</strong> dependence <strong>of</strong> the bubble pressure on Ca is shown in figure 9 for the three grades<br />
<strong>of</strong> silicone oil investigated. <strong>The</strong> pressure is non-dimensionalized on the capillary scale,<br />
P = P ∗ R/σ ∗ ,whereP ∗ is the dimensional bubble pressure (the pressure <strong>of</strong> the air<br />
finger relative to the external pressure). Experimental pressure measurements are<br />
shown by symbols and the numerical simulations <strong>of</strong> Hazel & Heil (2006) are plotted<br />
using lines. <strong>The</strong>se correspond to steady solutions <strong>of</strong> the three-dimensional fully<br />
coupled <strong>fluid</strong>–structure interaction problem calculated in the limit <strong>of</strong> zero gravity<br />
using a finite-element method. <strong>The</strong> choice <strong>of</strong> zero gravity yielded symmetries about<br />
the principal axes <strong>of</strong> the cross-section, so that the computational domain could be<br />
reduced to a quarter <strong>of</strong> this cross-section over a chosen length <strong>of</strong> <strong>tube</strong>. <strong>The</strong> numerical<br />
computations were performed using the code described by Hazel & Heil (2006) for
P = P * R/σ *<br />
40<br />
20<br />
0<br />
–20<br />
–40<br />
–60<br />
–80<br />
<strong>The</strong> <strong>reopening</strong> <strong>of</strong> a <strong>collapsed</strong> <strong>fluid</strong>-<strong>filled</strong> <strong>elastic</strong> <strong>tube</strong> 299<br />
1000 cS, Re/Ca = 0.1<br />
200 cS, Re/Ca = 2.2<br />
100 cS, Re/Ca = 8.2<br />
Experiments<br />
Numerical simulations<br />
Re/Ca = 8.2<br />
0 2 4 6<br />
Ca<br />
8 10 12<br />
Figure 9. Comparison between the experimental and numerical bubble-pressure dependences<br />
on Ca for Re/Ca =0.1, 2.2 and8.2. <strong>The</strong> experimental measurements are plotted with symbols<br />
and the numerical results, computed with the code <strong>of</strong> Hazel & Heil (2006) for A∞ =0.33,<br />
σ =3.6 × 10 −2 and h/R =0.09, are plotted with lines. <strong>The</strong> experimental variation in Re/Ca<br />
was achieved by using silicone oils <strong>of</strong> different viscosities (see table 1). <strong>The</strong> experimental results<br />
are averaged over the flow-rate values from 47 experiments at Re/Ca =0.1, 111 experiments<br />
at Re/Ca =2.2 and 74 experiments at Re/Ca =8.2. <strong>The</strong> error bars correspond to the standard<br />
deviations <strong>of</strong> each group <strong>of</strong> data.<br />
experimental parameter values A∞ =0.33, σ =3.6 × 10 −2 and h/R =0.09. <strong>The</strong><br />
Poisson ratio was set to 0.49 in the calculations, which is suitable for silicone as it is<br />
nearly incompressible.<br />
In the experiment the range <strong>of</strong> attainable finger velocities was limited, since the<br />
maximum achievable flow rate was 1400 cm 3 min −1 . Thus, the maximum experimental<br />
capillary number varied from Ca =5.6 for the 200 cS oil down to Ca =2.9 for the<br />
100 cS oil. For the 1000 cS oil the maximum flow rate investigated was 550 cm 3 min −1 ,<br />
which limited the capillary-number range to Ca 11. It is clear from all three sets<br />
<strong>of</strong> experimental data that the bubble pressure exhibits an overall growth with Ca,<br />
so that the <strong>tube</strong> is inflated with increasing driving force. Note that negative bubble<br />
pressures are recorded for Ca < 4, indicating that an air finger can ‘partially reopen’<br />
a <strong>tube</strong>, so that its pressure remains less than the external pressure, as suggested by<br />
Hazel & Heil (2003). We shall further show in § 3.2.1 that in our experiments the <strong>tube</strong><br />
never actually reaches its fully reopened cross-sectional area, estimated from the ‘<strong>tube</strong><br />
law’, and remains partially buckled even for positive bubble pressures.<br />
For Ca 3, the experimental bubble pressure P does not exhibit a measurable<br />
dependence on Re/Ca but, for larger Ca, P exhibits steeper growth with Ca for<br />
Re/Ca =2.2 thanforRe/Ca =0.1. Similarly, in the numerical simulations, when<br />
Ca 3.2 the difference in pressure between Re/Ca =0.1 and 8.2 is within the<br />
magnitude <strong>of</strong> the experimental uncertainty. For Ca > 3.2 the steepening <strong>of</strong> the<br />
pressure curves due to inertia as Ca increases results in a growing divergence between<br />
the values <strong>of</strong> the bubble pressure at a given Ca.<br />
2.2<br />
0.1
300 A. Juel and A. Heap<br />
P = P * R/σ *<br />
50<br />
25<br />
0<br />
–25<br />
–50<br />
–75<br />
–85.3<br />
2<br />
Experimental data at 1000 cS<br />
Linear fit<br />
Numerical simulation<br />
2 4<br />
6<br />
3<br />
6<br />
4<br />
–100<br />
0 2 4 6<br />
Ca<br />
8 10 12<br />
Figure 10. Bubble-pressure dependence on Ca for Re/Ca =0.1. <strong>The</strong> number <strong>of</strong> experiments<br />
performed for each flow rate is indicated next to the experimental data points on the graph.<br />
<strong>The</strong> dashed line is a least-squares fit to the experimental data and the solid line represents the<br />
numerical results for A∞ =0.33 and σ =3.6 × 10 −2 .<br />
P = P * R/σ *<br />
50<br />
25<br />
0<br />
–25<br />
–50<br />
–75<br />
–84.8<br />
2<br />
Experimental data at 200 cS<br />
Linear fits<br />
Numerical simulation<br />
2 6 8<br />
4 8<br />
4 12<br />
–100<br />
0 1 2 3<br />
Ca<br />
4 5 6<br />
4<br />
6<br />
8 13 8<br />
Figure 11. Bubble-pressure dependence on Ca for Re/Ca =2.2. <strong>The</strong> number <strong>of</strong> experiments<br />
performed for each flow rate is indicated next to the experimental data points on the graph.<br />
<strong>The</strong> dashed line is a least-squares fit to the experimental data and the solid line represents the<br />
numerical results for A∞ =0.33 and σ =3.6 × 10 −2 .<br />
<strong>The</strong> pressure curves shown collectively in figure 9 are presented individually in<br />
figures 10, 11, 12 for Re/Ca =0.1, 2.2and8.2 respectively. <strong>The</strong> number <strong>of</strong> experiments<br />
performed at each flow rate is indicated next to each data point on the graphs.<br />
2<br />
4<br />
12 6<br />
2<br />
8<br />
6<br />
2<br />
4
P = P * R/σ *<br />
50<br />
25<br />
0<br />
–25<br />
–50<br />
–75<br />
–83.5<br />
<strong>The</strong> <strong>reopening</strong> <strong>of</strong> a <strong>collapsed</strong> <strong>fluid</strong>-<strong>filled</strong> <strong>elastic</strong> <strong>tube</strong> 301<br />
2 4 4<br />
Experimental data at 100 cS<br />
Linear fit<br />
Numerical simulation<br />
4 44<br />
4<br />
4<br />
8<br />
4 6<br />
4<br />
4<br />
6<br />
4<br />
2<br />
2 2<br />
–100<br />
0 1 2 3<br />
Ca<br />
4 5 6<br />
Figure 12. Bubble-pressure dependence on Ca for Re/Ca =8.2. <strong>The</strong> number <strong>of</strong> experiments<br />
performed for each flow rate is indicated next to the experimental data points on the graph.<br />
<strong>The</strong> dashed line is a least-squares fit to the experimental data and the solid line represents the<br />
numerical results for A∞ =0.33 and σ =3.6 × 10 −2 .<br />
<strong>The</strong> three sets <strong>of</strong> experimental data exhibit significant qualitative differences. For<br />
Re/Ca =0.1 (figure 10), the pressure increases approximately linearly, with a leastsquares-fitted<br />
slope dP/dCa =7.2 ± 1.0. For Re/Ca =2.2 (figure 11), a linear increase<br />
is followed by a region <strong>of</strong> constant and approximately zero average bubble pressure<br />
between Ca =3.0 and3.9, with a subsequent linear increase for Ca > 3.9. A large<br />
number <strong>of</strong> experiments (111) was performed in this case to resolve the nonlinear<br />
dependence <strong>of</strong> the pressure on Ca. Least-squares fits to the regions <strong>of</strong> linear increase<br />
yield similar slopes: dP/dCa =18.0 ± 1.0 forCa 2.6 anddP/dCa =19.0 ± 2.9 for<br />
Ca 4.4, while the average slope <strong>of</strong> the bubble-pressure curve over the experimental<br />
range <strong>of</strong> Ca investigated is approximately 15.4. In addition, small-amplitude periodic<br />
pressure oscillations (with approximate period 0.3 s) were reproducibly detected for<br />
3.0 Ca 3.9, where the averaged pressure remained constant. <strong>The</strong>se may indicate<br />
the existence <strong>of</strong> a transition region between two steady ‘peeling’ states. Owing to the<br />
limited Ca range over which the oscillations occurred, as well as their small amplitude,<br />
the unexpected qualitative features <strong>of</strong> the pressure curve could not be investigated in<br />
further detail. <strong>The</strong> existence <strong>of</strong> the constant-pressure region, however, is confirmed<br />
by independent measurements presented in § 3.2.2. Finally, for Re/Ca =8.2 (figure<br />
12), the pressure remains approximately constant for Ca < 0.8. Indeed, for flow rates<br />
between 50 and 250 cm 3 min −1 , similar bubble pressures were measured while the<br />
speed <strong>of</strong> the air finger underwent a tenfold increase. For Ca > 0.8, the pressure grows<br />
approximately linearly, with a least-squares-fitted slope dP/dCa =16.4 ± 2.6 within<br />
the limited range <strong>of</strong> Ca attainable.<br />
In the limit <strong>of</strong> small Ca, the experimental bubble pressure P shown in figure 9 tends<br />
to a value <strong>of</strong> about −50 in all three experiments, which is considerably lower than the<br />
yield pressure measured by Gaver III et al. (1990) in a <strong>tube</strong> <strong>of</strong> negligible bending stiffness.<br />
This result emphasizes the importance <strong>of</strong> the bending stiffness in determining the<br />
yield pressure. <strong>The</strong> region <strong>of</strong> minimum bubble pressure in the numerical simulations<br />
2
302 A. Juel and A. Heap<br />
(a)<br />
Ca = 0.5<br />
(b)<br />
Ca = 1.7<br />
(c)<br />
Ca = 2.5<br />
(d)<br />
Ca = 3.9<br />
(e)<br />
Ca = 5.0<br />
l<br />
θ<br />
Figure 13. A series <strong>of</strong> side-view snapshots <strong>of</strong> <strong>reopening</strong> <strong>tube</strong>s <strong>filled</strong> with 200 cS oil, for<br />
increasing capillary numbers between Ca =0.5 and5.0. <strong>The</strong> horizontal solid lines in (a) and<br />
(c) denote the horizontal mid-plane far ahead <strong>of</strong> the finger tip and illustrate the asymmetry<br />
in the <strong>reopening</strong> <strong>tube</strong>. <strong>The</strong> outline <strong>of</strong> each <strong>tube</strong> is digitally traced (the white solid lines), in<br />
order to extract quantitative measures from the images: δ, the height <strong>of</strong> the reopened <strong>tube</strong>; θ,<br />
the upper-surface <strong>reopening</strong> angle; l, the length <strong>of</strong> <strong>tube</strong> which has lifted <strong>of</strong>f the bottom rigid<br />
support, as shown in (e). <strong>The</strong> height <strong>of</strong> each snapshot is 10.9 mm.<br />
marks the transition between the ‘pushing’ regime, where the pressure decreases with<br />
Ca and the air finger displaces a plug <strong>of</strong> <strong>fluid</strong> ahead <strong>of</strong> its tip, and the ‘peeling’ regime,<br />
where the pressure increases with Ca (Hazel & Heil 2003). <strong>The</strong> minimum pressure<br />
predicted by the computations remains approximately constant, at between −85.3 and<br />
−83.5 for increasing Re/Ca, which is smaller than the experimental minimum pressure<br />
by a factor <strong>of</strong> approximately 1.7. In the limit <strong>of</strong> small σ , the numerical calculations <strong>of</strong><br />
Hazel & Heil (2003) showed that the <strong>reopening</strong> pressure varies significantly with σ .<br />
<strong>The</strong> effect <strong>of</strong> the experimental error in σ =(3.6 ± 0.2) × 10 −2 was assessed by performing<br />
calculations for the maximum and minimum experimental values <strong>of</strong> σ respectively.<br />
<strong>The</strong> resulting numerical pressure curves are shifted up and down by approximately six<br />
units on the capillary scale, which is insufficient to explain the discrepancy between<br />
the experimental and numerical pressures. <strong>The</strong> results <strong>of</strong> Jensen et al. (2002), however,<br />
show that at small Ca the pressure <strong>of</strong> a bubble <strong>reopening</strong> a channel asymmetrically is<br />
a factor <strong>of</strong> approximately 1.6 larger than in the symmetric configuration. This increase<br />
in the <strong>reopening</strong> pressure is likely to be due to the reduced radius <strong>of</strong> curvature at<br />
the interface, which in turn increases the pressure difference, causing adhesion. In the<br />
present experiments, we also observed asymmetric <strong>reopening</strong> configurations which<br />
arise owing to the coupling <strong>of</strong> gravity with <strong>elastic</strong> forces, which determines the <strong>tube</strong>’s<br />
overall shape, as discussed in § 3.2. Thus, we speculate that the quantitative difference<br />
between the experimental and numerical <strong>reopening</strong> pressures originates in the gravityinduced<br />
asymmetric <strong>reopening</strong> configurations observed experimentally (see figure 13).<br />
Also, the increasing length <strong>of</strong> the transition region between the <strong>collapsed</strong> and<br />
reopened regions <strong>of</strong> the <strong>tube</strong>, visible in figure 13 for decreasing Ca, is suggestive<br />
<strong>of</strong> the existence <strong>of</strong> a ‘pushing’ regime in the experiments. For Re/Ca =8.2, where<br />
detailed data was sampled in the limit <strong>of</strong> small Ca, the saturation <strong>of</strong> the pressure<br />
for small Ca could further indicate the vicinity <strong>of</strong> a ‘pushing’ branch. <strong>The</strong> recent<br />
δ
<strong>The</strong> <strong>reopening</strong> <strong>of</strong> a <strong>collapsed</strong> <strong>fluid</strong>-<strong>filled</strong> <strong>elastic</strong> <strong>tube</strong> 303<br />
theoretical results <strong>of</strong> Halpern et al. (2005) support this notion as they demonstrate<br />
that at a constant, low, flow rate, steady pushing behaviour, although unstable, may<br />
be experimentally realizable for a significant period <strong>of</strong> time, at least until the bubble<br />
has advanced far enough for the compliance <strong>of</strong> the inflated section to destabilize the<br />
pushing motion.<br />
<strong>The</strong> large discrepancy between experimental and numerical minimum pressures is<br />
accompanied by a discrepancy in the rate <strong>of</strong> growth <strong>of</strong> the bubble pressure with Ca.<br />
<strong>The</strong> average rates <strong>of</strong> growth <strong>of</strong> the numerical bubble pressure over the experimental<br />
ranges <strong>of</strong> Ca are dP/dCa =5.2, 6.6 and9.2 forRe/Ca =0.1, 2.2 and8.2, respectively.<br />
Thus, the net effect <strong>of</strong> inertia is small over this limited range <strong>of</strong> Ca. <strong>The</strong> much larger<br />
increase in growth rates from dP/dCa =7.2 for 1000 cS oil to dP/dCa =15.4 and<br />
dP/dCa =16.4for 200 cS and 100 cS oils, respectively, suggests that in the presence<br />
<strong>of</strong> gravity the reduction in the viscosity has additional consequences which dominate<br />
over the purely inertial pressure steepening.<br />
3.2. Effect <strong>of</strong> gravity on the <strong>reopening</strong> dynamics<br />
<strong>The</strong> differences between the experiments and the simulations appear to be closely<br />
linked to the presence <strong>of</strong> gravity in the experiment. Because <strong>of</strong> gravity, a rigid<br />
plate is necessary to support the bottom boundary <strong>of</strong> the <strong>reopening</strong> <strong>tube</strong> in the<br />
experiments, which leads to asymmetrical <strong>reopening</strong> <strong>of</strong> the <strong>tube</strong>, to be discussed in<br />
§ 3.2.2. <strong>The</strong> second effect <strong>of</strong> gravity is to induce buoyancy pressures inside the <strong>tube</strong>.<br />
Experimentally, we observe that the steadily propagating air finger is located toward<br />
the top <strong>of</strong> the <strong>tube</strong>, so that the liquid film left behind on the walls <strong>of</strong> the <strong>tube</strong> is thicker<br />
below the finger. Evidence presented in § 3.2.1 suggests that the relative importance<br />
<strong>of</strong> gravity compared with inertia, enhanced through the increase in viscosity, is the<br />
key to determining the shape <strong>of</strong> the reopened <strong>tube</strong> far behind the finger tip.<br />
A series <strong>of</strong> side-view snapshots <strong>of</strong> <strong>reopening</strong> <strong>tube</strong>s, <strong>filled</strong> with 200 cS oil, is shown<br />
in figure 13 for values <strong>of</strong> the capillary number Ca between 0.5 and5.0. <strong>The</strong> air<br />
finger is propagating from the right to the left <strong>of</strong> each picture (i.e. from the reopened<br />
air-<strong>filled</strong> <strong>tube</strong> to the <strong>collapsed</strong> liquid-<strong>filled</strong> <strong>tube</strong>). <strong>The</strong> consecutive snapshots indicate<br />
that the height <strong>of</strong> the reopened <strong>tube</strong> increases with Ca, in accord with the pressure<br />
measurements presented in § 3.1. Also, the transition region between the uniformly<br />
<strong>collapsed</strong> <strong>tube</strong> and the uniformly reopened <strong>tube</strong> shortens significantly with increasing<br />
Ca. Both these findings were observed in the numerical simulations <strong>of</strong> Hazel & Heil<br />
(2003). A closer inspection <strong>of</strong> the images in figure 13, however, reveals that the<br />
experimentally reopened <strong>tube</strong> is inherently asymmetric about the horizontal midplane<br />
far ahead <strong>of</strong> the finger tip, as illustrated in snapshots (a) and(c), where the<br />
black horizontal line denotes the mid-plane. For small values <strong>of</strong> Ca (figure 13a,b),<br />
the <strong>tube</strong> lies flat on the rigid base and the deformation <strong>of</strong> the <strong>tube</strong> between the<br />
<strong>collapsed</strong> and reopened states is characterized solely by the upper-surface <strong>reopening</strong><br />
angle θ. ForCa > 2.0, the <strong>tube</strong> lifts <strong>of</strong>f the bottom plate over a length l, thusreducing<br />
the asymmetry in the transition region. A Matlab program was developed to extract<br />
quantitative measures from the snapshots. Firstly, an edge-finding algorithm was<br />
applied to trace digitally the outline <strong>of</strong> the <strong>tube</strong> (the solid white lines in figure 13).<br />
<strong>The</strong> contour data was then used to extract the quantitative measures illustrated in<br />
figure 13(e): δ is the height <strong>of</strong> the reopened <strong>tube</strong>; l isthelength<strong>of</strong><strong>tube</strong>whichhas<br />
lifted <strong>of</strong>f the rigid plate and θ is the upper-boundary <strong>reopening</strong> angle. <strong>The</strong> angle θ was<br />
determined by calculating the average slope <strong>of</strong> the upper boundary in the transition<br />
region. Group averages <strong>of</strong> θ, l and δ were calculated for each value <strong>of</strong> the flow rate,
304 A. Juel and A. Heap<br />
δ–<br />
D<br />
1.0<br />
0.95<br />
0.90<br />
0.85<br />
0.80<br />
0.75<br />
0.70<br />
0.65<br />
0.60<br />
Outer diameter <strong>of</strong> the <strong>tube</strong>, D = 2 (R + h/2)<br />
Height <strong>of</strong> the open empty <strong>tube</strong><br />
1000 cS<br />
200 cS<br />
100 cS<br />
0 2 4 6<br />
Ca<br />
8 10 12<br />
Figure 14. Dependence <strong>of</strong> the height <strong>of</strong> the reopened <strong>tube</strong> on Ca. <strong>The</strong> initial height <strong>of</strong> the<br />
<strong>collapsed</strong> <strong>tube</strong> is 3.69 mm, i.e. δ/D =0.34, where D =2(R + h/2) is the outer diameter <strong>of</strong> the<br />
<strong>tube</strong>. <strong>The</strong> upper and lower thick horizontal lines represent the outer diameter and the in-situ<br />
height <strong>of</strong> the open empty <strong>tube</strong>, respectively.<br />
with upper and lower error estimates equal to one standard deviation about the mean<br />
data.<br />
3.2.1. <strong>The</strong> reopened <strong>tube</strong> behind the propagating air finger<br />
We begin by presenting the scaled height <strong>of</strong> the reopened <strong>tube</strong> δ/D against Ca<br />
in figure 14. <strong>The</strong> scaling factor, D =2(R + h/2) = 10.7 mm, corresponds to the outer<br />
diameter <strong>of</strong> the <strong>tube</strong>. <strong>The</strong> upper thick horizontal line on the graph is for δ/D =1.0<br />
and is approximately equal to the height expected in the zero-gravity <strong>fluid</strong>-<strong>filled</strong><br />
configuration for P = 0. <strong>The</strong> effect <strong>of</strong> gravity on the open empty <strong>tube</strong> is to reduce<br />
its height by approximately 5 %, as indicated by the lower horizontal line. Over the<br />
range <strong>of</strong> Ca investigated, the <strong>reopening</strong> height appears to saturate at approximately<br />
δ/D =0.89, which is 7 % less than the height <strong>of</strong> empty <strong>tube</strong> at P = 0 in the experiment.<br />
For the 100 cS and 200 cS oils, δ/D grows faster with Ca than for the 1000 cS oil.<br />
This trend is expected from the behaviour <strong>of</strong> the pressure with Ca (see figure 9). With<br />
Bo =12.1, viscous forces become comparable to buoyancy forces as Ca increases;<br />
Ca/Bo =0.9 for the largest value reached by Ca in the experiment. Thus, the height<br />
measurements taken with oils <strong>of</strong> different viscosities tend to a similar value as Ca<br />
increases.<br />
An unexpected result, however, is that for small values <strong>of</strong> Ca the <strong>tube</strong> reopens<br />
to larger heights with 1000 cS oil than with the lower-viscosity <strong>fluid</strong>s, with up to<br />
10 % difference between the <strong>reopening</strong> heights at 100 cS and 1000 cS even though the<br />
bubble pressure does not exhibit a measurable dependence on viscosity for Ca 3,<br />
as shown in figure 9. <strong>The</strong> height <strong>of</strong> <strong>reopening</strong>, however, is linked to the distribution<br />
<strong>of</strong> the transmural pressure within the <strong>tube</strong>. Even when the bubble pressure remains<br />
constant, the transmural pressure distribution may be non-uniform and may vary<br />
through changes in the liquid film configurations, which result in different load<br />
distributions on the <strong>tube</strong> walls and thus in variations in the height <strong>of</strong> <strong>reopening</strong>. <strong>The</strong>
P = P * R/σ *<br />
40<br />
30<br />
20<br />
10<br />
0<br />
–10<br />
–20<br />
–30<br />
–40<br />
–50<br />
<strong>The</strong> <strong>reopening</strong> <strong>of</strong> a <strong>collapsed</strong> <strong>fluid</strong>-<strong>filled</strong> <strong>elastic</strong> <strong>tube</strong> 305<br />
1000 cS<br />
200 cS<br />
100 cS<br />
fit to 1000 cS data<br />
fit to 200 cS data<br />
fit to 100 cS data<br />
–60<br />
0.55 0.60 0.65 0.70 0.75 0.80 0.85<br />
δ/D<br />
Figure 15. Modified experimental ‘<strong>tube</strong> law’ for the liquid-lined configuration: the<br />
dimensionless pressure <strong>of</strong> <strong>reopening</strong>, P , is plotted against the scaled height <strong>of</strong> the reopened<br />
<strong>tube</strong>, δ/D, whereD =2(R + h/2) is the outer diameter <strong>of</strong> the <strong>tube</strong>, for all three values <strong>of</strong><br />
viscosity investigated.<br />
ratio <strong>of</strong> buoyancy and viscous forces, Bo/Ca, depends on the viscosity only through<br />
Ca. <strong>The</strong> ratio <strong>of</strong> buoyancy and inertial forces, Bo/(Ca Re), however, is proportional<br />
to the square <strong>of</strong> the dynamic viscosity at a given Ca value, so that when Ca =0.5,<br />
Bo/(Ca Re) 5.9, 22 and 539, for the 100 cS, 200 cS and 1000 cS oils respectively.<br />
Given the variation by a factor 100 in Bo/(Ca Re), it is likely that the competition<br />
between buoyancy and inertial forces in the experiment results in widely different film<br />
configurations, particularly in the 1000 cS experiments, compared with the other two<br />
cases.<br />
In addition, for the 100 cS and 200 cS oils, the reopened height did not vary after<br />
the passage <strong>of</strong> the bubble on the time scale <strong>of</strong> the experiment. For 1000 cS, a minor<br />
reduction in δ <strong>of</strong> less than 5 % was detected, which may indicate the redistribution <strong>of</strong><br />
the load on the <strong>tube</strong> walls through drainage. Indeed, in the presence <strong>of</strong> gravity, the<br />
final film configuration is only expected to be reached at very large times, because<br />
<strong>of</strong> the increasing time scales associated with the drainage <strong>of</strong> thin liquid films left on<br />
the <strong>tube</strong> walls after the passage <strong>of</strong> the bubble. <strong>The</strong> experimental evidence, however,<br />
suggests that the effect <strong>of</strong> drainage on δ is very small for the grades <strong>of</strong> silicone oil<br />
investigated.<br />
To demonstrate further the dependence <strong>of</strong> the scaled <strong>reopening</strong> height on viscosity,<br />
P is plotted against δ/D in figure 15 for the three values <strong>of</strong> viscosity investigated. <strong>The</strong><br />
pressure-versus-scaled-height data is approximately linear within the experimental<br />
range investigated, suggesting the proportional growth <strong>of</strong> both quantities. <strong>The</strong><br />
significantly different slope <strong>of</strong> the (P , δ/D)-curve for the 1000 cS oil compared to<br />
those for the 100 and 200 cS oils confirms that different heights <strong>of</strong> <strong>reopening</strong> can<br />
occur for the same bubble pressure, depending on the viscosity <strong>of</strong> the liquid used<br />
in the experiment. Thus when P = 0, for instance, the height <strong>of</strong> <strong>reopening</strong> increases<br />
monotonically with increasing viscosity. We were also able to reproduce this result
306 A. Juel and A. Heap<br />
Height (mm)<br />
8<br />
6<br />
4<br />
2<br />
0<br />
1000 cS<br />
200 cS<br />
100 cS<br />
1 2 3 4 5 6 7 8 9 10 11 12 13 14<br />
Width (mm)<br />
Figure 16. Outline <strong>of</strong> the top section <strong>of</strong> the reopened <strong>tube</strong> measured with the aerial camera<br />
for 1000 cS, 200 cS and 100 cS silicone oil at P = −44 ± 1.<br />
independently by measuring the height <strong>of</strong> the <strong>fluid</strong>-<strong>filled</strong> reopened <strong>tube</strong>s from the<br />
video footages recorded at 50 cm 3 min −1 , once the <strong>reopening</strong> experiment was over and<br />
the end two-way valve had been released to let air flow through the system.<br />
In figure 16 a further comparison may be made <strong>of</strong> the outline <strong>of</strong> the <strong>tube</strong><br />
captured by the aerial camera for different-viscosity oils, at a constant bubble pressure<br />
P = −44 ± 1. <strong>The</strong> curves were obtained by digitally tracing the deformed laser line<br />
outlining the upper section <strong>of</strong> the reopened <strong>tube</strong> in the aerial view snapshots (see<br />
figure 2). <strong>The</strong>se results clearly demonstrate that the shape <strong>of</strong> the cross-section, as well<br />
as its height, are strongly dependent on viscosity, with increasingly reopened <strong>tube</strong>s<br />
observed for larger-viscosity oils. Note that all the reopened <strong>tube</strong> pr<strong>of</strong>iles exhibit a<br />
small asymmetry about the mid-width <strong>of</strong> the <strong>tube</strong>. This asymmetry is linked to the<br />
manufacturing process <strong>of</strong> the silicone tubing, where a large piece <strong>of</strong> solid silicone<br />
is extruded into a coil, resulting in slightly curved <strong>tube</strong>s with a natural transverse<br />
distortion <strong>of</strong> less than 3 % <strong>of</strong> their length.<br />
3.2.2. <strong>The</strong> transition region <strong>of</strong> the <strong>reopening</strong> <strong>tube</strong><br />
In figure 17, the angle <strong>of</strong> <strong>reopening</strong>, θ, and the length <strong>of</strong> lift-<strong>of</strong>f, l, are plotted against<br />
Ca for each value <strong>of</strong> viscosity. <strong>The</strong> upper <strong>reopening</strong> angles are shown in the left-hand<br />
column, while the length <strong>of</strong> lift-<strong>of</strong>f is plotted in the right-hand column. Figures 17(a),<br />
(b) are for the 1000 cS silicone oil, figures 17(c), (d) are for the 200 cS silicone oil and<br />
figure 17(e) is for the 100 cS silicone oil. Starting with figures 17(c), (d), the angle <strong>of</strong><br />
<strong>reopening</strong> grows approximately linearly up to Ca 1.9 and, within this range, the<br />
<strong>tube</strong> does not lift <strong>of</strong>f the base plate. <strong>The</strong> onset <strong>of</strong> lift-<strong>of</strong>f occurs between Ca =1.7<br />
and Ca =1.9, and l then grows linearly up to Ca 3.0, which is the lower bound for<br />
the region <strong>of</strong> constant pressure seen in figure 11. <strong>The</strong> upper-surface <strong>reopening</strong> angle<br />
remains constant within this range <strong>of</strong> Ca. For3.0 Ca 3.9, which corresponds<br />
to the region <strong>of</strong> constant pressure, the trend reverses so that θ grows linearly while<br />
l remains constant, and vice versa for Ca 3.9. Hence, in the 200 cS experiments,<br />
successive phases in the <strong>reopening</strong> process are identified which are dominated by
θ (deg.)<br />
θ (deg.)<br />
θ (deg.)<br />
10<br />
8<br />
6<br />
4<br />
2<br />
0<br />
10<br />
8<br />
6<br />
4<br />
2<br />
0<br />
10<br />
8<br />
6<br />
4<br />
2<br />
0<br />
<strong>The</strong> <strong>reopening</strong> <strong>of</strong> a <strong>collapsed</strong> <strong>fluid</strong>-<strong>filled</strong> <strong>elastic</strong> <strong>tube</strong> 307<br />
(a) (b)<br />
40<br />
(c)<br />
(e)<br />
1000 cS oil<br />
2 4 6 8 10 12<br />
200 cS oil<br />
2 4 6<br />
100 cS oil<br />
2 4 6<br />
Ca<br />
l (mm)<br />
l (mm)<br />
30<br />
20<br />
10<br />
0<br />
0<br />
40<br />
30<br />
20<br />
10<br />
(d)<br />
1000 cS oil<br />
2 4 6 8 10 12<br />
200 cS oil<br />
0<br />
0 2 4 6<br />
Ca<br />
Figure 17. Correlation between the angle <strong>of</strong> <strong>reopening</strong>, θ (left-hand column) and the length<br />
<strong>of</strong> lift-<strong>of</strong>f, l, (right-hand column): (a), (b) 1000 cS oil; (c), (d) 200 cS oil; (e) 100 cS oil. In<br />
the last case, lift-<strong>of</strong>f was detected only at the largest achievable value <strong>of</strong> Ca, 2.9, and thus the<br />
dependence <strong>of</strong> l on Ca is not shown. <strong>The</strong> solid lines are local linear fits to the data, which have<br />
been plotted as a guide to the eye. <strong>The</strong> vertical dotted lines in (a)–(d) give the approximate<br />
value <strong>of</strong> Ca for which lift-<strong>of</strong>f first occurs (left-hand line), and beyond which the length <strong>of</strong><br />
lift-<strong>of</strong>f is observed suddenly to drop (right-hand line). <strong>The</strong> vertical dashed lines in (c) and(d)<br />
delimit the range <strong>of</strong> Ca where a constant bubble pressure <strong>of</strong> approximately zero is observed.<br />
the deformation <strong>of</strong> either the upper or lower boundary <strong>of</strong> the <strong>tube</strong>. In figures 17(a),<br />
(b), which are for 1000 cS oil, lift-<strong>of</strong>f again does not occur for small values <strong>of</strong> Ca,<br />
and θ increases sharply for Ca 2.0. <strong>The</strong> lift-<strong>of</strong>f occurs between Ca =0.6 and<br />
Ca =2.0, but the sparse measurements at low Ca in this case do not allow us to<br />
resolve the threshold further. This is followed by a region <strong>of</strong> approximately constant
308 A. Juel and A. Heap<br />
θ (slow growth), with significant growth <strong>of</strong> l for 2.0 Ca 5.3. As in the case<br />
<strong>of</strong> the 200 cS oil, this indicates the successive phases <strong>of</strong> <strong>reopening</strong> with Ca. <strong>The</strong>re<br />
does not appear to be any additional feature in the angle and length <strong>of</strong> lift-<strong>of</strong>f for<br />
2.0 Ca 5.3, in accord with the pressure results shown in figure 10, although the<br />
smaller number <strong>of</strong> experiments (47) performed with this viscosity grade and the wider<br />
range <strong>of</strong> Ca covered do not permit us to ascertain this conclusively. For Ca =6.4, l<br />
drops sharply from approximately 38 mm to 24 mm. For Ca 6.4, it resumes linear<br />
growth, and θ also sharply increases. This indicates a rearrangement <strong>of</strong> the transition<br />
region <strong>of</strong> the <strong>tube</strong>, which appears to occur at a critical value <strong>of</strong> Ca. Evidence for this<br />
behaviour is also seen in figures 17(c), (d) forCa =5.6 (the last experimental point).<br />
Finally, in the 100 cS experiments, lift-<strong>of</strong>f is delayed, as we detected it only in the last<br />
experimental measurement at Ca =2.9. Thus, we show only the variation in θ with<br />
Ca in figure 17(e). It appears to increase in an approximately linear manner, similarly<br />
to the pressure presented in figure 12. <strong>The</strong> angle <strong>of</strong> <strong>reopening</strong>, however, does not<br />
appear to saturate in the limit <strong>of</strong> small Ca, indicating that evolution <strong>of</strong> the transition<br />
region is significant even in the initial constant-pressure region (Ca < 0.8).<br />
<strong>The</strong> different configurations <strong>of</strong> the transition region described above for increasing<br />
Ca are a consequence <strong>of</strong> the gravity-induced asymmetry <strong>of</strong> the <strong>reopening</strong> <strong>tube</strong>. Note<br />
that such features are not expected in the model <strong>of</strong> Hazel & Heil (2003, 2006), where<br />
symmetries about the principal axes <strong>of</strong> the cross-section are enforced.<br />
4. Conclusion<br />
<strong>The</strong> results <strong>of</strong> an experimental investigation into the mechanics <strong>of</strong> airway <strong>reopening</strong><br />
have been presented. <strong>The</strong> injection <strong>of</strong> nitrogen at a constant flow rate into a liquid<strong>filled</strong><br />
<strong>collapsed</strong> <strong>tube</strong> <strong>of</strong> finite bending stiffness resulted in the steady propagation <strong>of</strong> an<br />
air finger after initial transients had decayed. We have demonstrated that gravity has<br />
a pr<strong>of</strong>ound effect on the <strong>reopening</strong> mechanics and is closely linked to the significant<br />
differences from the three-dimensional zero-gravity model <strong>of</strong> Hazel & Heil (2006).<br />
<strong>The</strong> ratio <strong>of</strong> gravity and inertial forces increases as the square <strong>of</strong> the viscosity <strong>of</strong> the<br />
liquid for a given value <strong>of</strong> Ca. Thus, an increase in viscosity yields changes in the film<br />
configuration behind the propagating finger, which in turn alters the mechanical load<br />
on the <strong>tube</strong> walls. As a result, differing <strong>tube</strong> heights and cross-sectional shapes are<br />
found for different values <strong>of</strong> the viscosity at the same bubble pressure. <strong>The</strong> presence <strong>of</strong><br />
gravity also requires the <strong>tube</strong> to be supported, and this induces an asymmetry about<br />
the horizontal mid-plane. <strong>The</strong> different phases <strong>of</strong> <strong>reopening</strong> observed for increasing<br />
Ca are linked to this asymmetry. In order to avoid the need for a rigid support plate,<br />
the experiments could conceivably be carried out by immersing the <strong>tube</strong> in silicone<br />
oil. Because <strong>of</strong> buoyancy, however, the <strong>reopening</strong> <strong>fluid</strong> would also need to be densitymatched<br />
to silicone oil, and significant practical difficulties would be associated with<br />
this setup.<br />
<strong>The</strong> liquid lining in a healthy lung has a viscosity µ 10 −3 kg m −1 s −1 (Kamm &<br />
Schroter 1989), which is much lower than in the experiments. Thus with Ca =0.05,<br />
which corresponds to propagation speeds <strong>of</strong> 1 m s −1 in the lungs (Halpern, Jensen &<br />
Grotberg 1998), and considering the smallest airways <strong>of</strong> radius 0.29 mm (Kamm &<br />
Schroter 1989), we have Bo/(Ca Re) 3 × 10 −3 , which suggests that buoyancy will<br />
have a minimal influence on the dynamics. Mucous secretions in a diseased lung can,<br />
however, result in viscosities equal to the lowest value investigated in the experiment,<br />
µ =10 −1 kg m −1 s −1 (Gaver III, Samsel & Solway 1990). In this case, the relative<br />
importance <strong>of</strong> buoyancy could be significantly increased. For potentially smaller
<strong>The</strong> <strong>reopening</strong> <strong>of</strong> a <strong>collapsed</strong> <strong>fluid</strong>-<strong>filled</strong> <strong>elastic</strong> <strong>tube</strong> 309<br />
propagation speeds, <strong>of</strong> the order <strong>of</strong> 10 −2 ms −1 , inertial forces become negligible and<br />
the relevant force balance, Bo/Ca, is approximately 82 in the healthy lung and 0.8 in<br />
the diseased lung, suggesting that gravity may significantly influence the <strong>reopening</strong><br />
process. Finally, the bending stiffness in the experiments is approximately a factor 10 2<br />
larger than in the terminal bronchioles <strong>of</strong> the lungs, whereas the radius <strong>of</strong> the <strong>tube</strong> is<br />
approximately 16 times that <strong>of</strong> these airways. A typical value for the ratio <strong>of</strong> surface<br />
tension and bending forces in the lung is σ = 50 (Hazel & Heil 2003), which may be<br />
compared with σ =3.6×10 −2 in the experiment. Thus, the ratio <strong>of</strong> gravity and <strong>elastic</strong><br />
forces, Boσ = ρgR/K is approximately equal to 0.4 in the experiments, whereas it is<br />
2 in the lungs. It is therefore likely that gravity may influence the <strong>reopening</strong> process<br />
in the lungs.<br />
<strong>The</strong> authors wish to thank Dr M. Heil and Dr A. L. Hazel for kindly providing the<br />
numerical data shown in § 3.1 and for many useful discussions and valuable comments<br />
during the preparation <strong>of</strong> this manuscript. <strong>The</strong>y also thank the three referees for their<br />
constructive comments, which have helped to improve the manuscript. This work was<br />
funded by the EPSRC (AH) and an EPSRC ‘Advanced Research Fellowship’ (AJ).<br />
REFERENCES<br />
Flaherty,J.E.,Keller,J.B.&Rubinow,S.I.1972 Post-buckling behaviour <strong>of</strong> <strong>elastic</strong> <strong>tube</strong>s and<br />
rings with opposite sides in contact. SIAM J. Appl. Maths 23, 446–455.<br />
Gaver III, D. P., Halpern, D., Jensen, O. E. & Grotberg, J. B. 1996 <strong>The</strong> steady motion <strong>of</strong> a<br />
semi-infinite bubble through a flexible-walled channel. J. Fluid Mech. 319, 25–65.<br />
Gaver III, D. P., Samsel, R. W. & Solway, J. 1990 Effects <strong>of</strong> surface tension and viscosity on<br />
airway <strong>reopening</strong>. J. Appl. Physiol. 69, 74–85.<br />
Grotberg, J. B. 2001 Respiratory <strong>fluid</strong> mechanics and transport processes. Annu. Rev. Biomech.<br />
Eng. 3, 421–457.<br />
Halpern, D. & Grotberg, J. B. 1992 Fluid-<strong>elastic</strong> instabilities <strong>of</strong> liquid-lined flexible <strong>tube</strong>s. J. Fluid<br />
Mech. 244, 615–632.<br />
Halpern, D., Jensen, O. E. & Grotberg, J. B. 1998 A theoretical study <strong>of</strong> surfactant and liquid<br />
delivery into the lung. J. Appl. Physiol. 85, 333–352.<br />
Halpern, D., Naire, S., Jensen, O. E. & Gaver III, D. P. 2005 Unsteady bubble propagation in a<br />
flexible channel: predictions <strong>of</strong> a viscous stick-slip instability. J. Fluid Mech. 528, 53–86.<br />
Hazel, A. L. & Heil, M. 2003 Three-dimensional airway <strong>reopening</strong>: <strong>The</strong> steady propagation <strong>of</strong> a<br />
semi-infinite bubble into a buckled <strong>elastic</strong> <strong>tube</strong>. J. Fluid Mech. 478, 47–70.<br />
Hazel, A. L. & Heil, M. 2005 Surface-tension-induced buckling <strong>of</strong> liquid-lined <strong>elastic</strong> <strong>tube</strong>s: a<br />
model for pulmonary airway closure. Proc. R. Soc. A 461, 1847–1868.<br />
Hazel, A. L. & Heil, M. 2006 Finite Reynolds number effects in steady, three-dimensional airway<br />
<strong>reopening</strong>. Trans. ASME: J. Biomech. Engng 128, 473–478.<br />
Heil, M. 2000 Finite Reynolds number effects in the propagation <strong>of</strong> an air finger into a liquid-<strong>filled</strong><br />
flexible-walled channel. J. Fluid Mech. 424, 21–44.<br />
Jensen, O. E., Horsburgh, M. K., Halpern, D. & Gaver III, D. P. 2002 <strong>The</strong> steady propagation<br />
<strong>of</strong> a bubble in a flexible-walled channel: asymptotic and computational models. Phys. Fluids<br />
14, 443–457.<br />
Kamm,R.D.&Schroter,R.C.1989 Is airway closure caused by a liquid film instability? Resp.<br />
Physiol. 75, 141–156.<br />
Low, H., Chew, Y. & Zhou, C. 1997 Pulmonary airway <strong>reopening</strong>: effects <strong>of</strong> non-Newtonian <strong>fluid</strong><br />
viscosity. Trans. ASME: J. Biomech. Engng 119, 298–308.<br />
Macklem, P. T., Proctor, D. F. & Moss, J. C. 1970 <strong>The</strong> stability <strong>of</strong> peripheral airways. Resp.<br />
Physiol. 8, 191–203.<br />
Naire, S. & Jensen, O. 2005 Epithelial cell deformation during surfactant-mediated airway<br />
<strong>reopening</strong>: a theoretical model. J. Appl. Physiol. 99, 458–471.
310 A. Juel and A. Heap<br />
Naureckas, E. T., Dawson, C. A., Gerber, B. S., Gaver III, D. P., Gerber, H. L., Lineran, J. M.,<br />
Solway, J. & Samsel, R. W. 1994 Airway <strong>reopening</strong> pressure in isolated rat lungs. J. Appl.<br />
Physiol. 76, 1372–1377.<br />
Perun, M. L. & Gaver III, D. P. 1995a An experimental model investigation <strong>of</strong> the opening <strong>of</strong> a<br />
<strong>collapsed</strong> untethered pulmonary airway. Trans. ASME: J. Biomech. Engng 117, 245–253.<br />
Perun, M. L. & Gaver III, D. P. 1995b Interaction between airway lining <strong>fluid</strong> forces and<br />
parenchymal tethering during pulmonary airway <strong>reopening</strong>. J. Appl. Physiol. 79, 1717–1728.<br />
Schatz, M. F., VanHook, S. J., McCormick, W., Swift, J. B. & Swinney, H. L. 1995 Onset <strong>of</strong><br />
surface-tension-driven Bénard convection. Phys. Rev. Lett. 75, 1938–1941.<br />
Shapiro, A. H. 1977 Steady flow in collapsible <strong>tube</strong>s. Trans. ASME: J. Biomech. Engng 99, 126–147.<br />
White, J. P. & Heil, M. 2005 Three-dimensional instabilities <strong>of</strong> liquid-lined <strong>elastic</strong> <strong>tube</strong>s: A thin-film<br />
<strong>fluid</strong>-structure interaction model. Phys. Fluids 17, 031506.