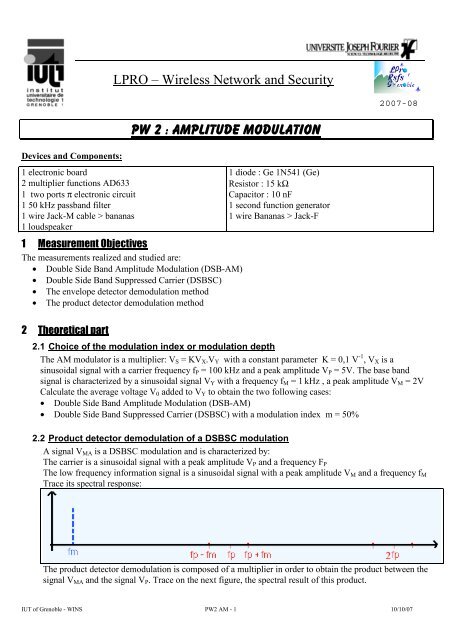
PW 2 : Amplitude Modulation
PW 2 : Amplitude Modulation
PW 2 : Amplitude Modulation

You also want an ePaper? Increase the reach of your titles
YUMPU automatically turns print PDFs into web optimized ePapers that Google loves.
Devices and Components:<br />
1 electronic board<br />
2 multiplier functions AD633<br />
1 two ports π electronic circuit<br />
1 50 kHz passband filter<br />
1 wire Jack-M cable > bananas<br />
1 loudspeaker<br />
LPRO – Wireless Network and Security<br />
<strong>PW</strong> 2 : <strong>Amplitude</strong> <strong>Modulation</strong><br />
1 Measurement Objectives<br />
The measurements realized and studied are:<br />
• Double Side Band <strong>Amplitude</strong> <strong>Modulation</strong> (DSB-AM)<br />
• Double Side Band Suppressed Carrier (DSBSC)<br />
• The envelope detector demodulation method<br />
• The product detector demodulation method<br />
2 Theoretical part<br />
1 diode : Ge 1N541 (Ge)<br />
Resistor : 15 kΩ<br />
Capacitor : 10 nF<br />
1 second function generator<br />
1 wire Bananas > Jack-F<br />
2007-08<br />
2.1 Choice of the modulation index or modulation depth<br />
The AM modulator is a multiplier: VS = KVX.VY with a constant parameter K = 0,1 V -1 , VX is a<br />
sinusoidal signal with a carrier frequency fP = 100 kHz and a peak amplitude VP = 5V. The base band<br />
signal is characterized by a sinusoidal signal VY with a frequency fM = 1 kHz , a peak amplitude VM = 2V<br />
Calculate the average voltage V0 added to VY to obtain the two following cases:<br />
• Double Side Band <strong>Amplitude</strong> <strong>Modulation</strong> (DSB-AM)<br />
• Double Side Band Suppressed Carrier (DSBSC) with a modulation index m = 50%<br />
2.2 Product detector demodulation of a DSBSC modulation<br />
A signal VMA is a DSBSC modulation and is characterized by:<br />
The carrier is a sinusoidal signal with a peak amplitude VP and a frequency FP<br />
The low frequency information signal is a sinusoidal signal with a peak amplitude VM and a frequency fM<br />
Trace its spectral response:<br />
The product detector demodulation is composed of a multiplier in order to obtain the product between the<br />
signal VMA and the signal VP. Trace on the next figure, the spectral result of this product.<br />
IUT of Grenoble - WINS <strong>PW</strong>2 AM - 1 10/10/07
At the following of the multiplier, band-pass filter is added. Trace on the previous figure the filter design<br />
intended in order to obtain the demodulation.<br />
Trace on the next figure the spectral response after demodulation.<br />
3 Measurement part<br />
3.1 <strong>Amplitude</strong> <strong>Modulation</strong> using a multiplier function<br />
Insert the multiplier function circuit on the holes<br />
board. The circuit inputs are characterized by the<br />
following letters X, Y et Z. The output S gives the<br />
next voltage signal:<br />
S = K . (X . Y) + Z<br />
K is a constant parameter.<br />
3.1.1 The multiplier.<br />
Measure the constant parameter K with the following input signals:<br />
- At the two inputs X and Y, a dc voltage signal with an amplitude of 1 V<br />
- At the input Z, a null voltage signal.<br />
Measure at the output S the voltage signal. Deducing the constant parameter K.<br />
Now, only the signal relied at the two inputs is replaced by a sinusoidal signal with an effective amplitude<br />
V = 2 V and a frequency F = 1 kHz. Its average value is null.<br />
Acquire the input and output voltage signal.<br />
Justify the frequency, the average and the peak amplitude values obtained at the output signal S.<br />
3.1.2 The DSBSC modulation<br />
• Apply at the input X a sinusoidal carrier signal (⇒<br />
HAMEG 8030 source generator) with a peak<br />
amplitude of 5 V and a frequency of 100 kHz. Its<br />
average value is null.<br />
• Apply at the input Y a sinusoidal signal with a lower<br />
frequency of 1 kHz and a peak amplitude of 2V (⇒ used the second source generator) Record the<br />
DSBSC modulation and the low frequency information signal together.<br />
Important remark: to observe the AM signal, it is necessary to trig the oscilloscope with the lower<br />
frequency signal. The trace is perfect with analog mode which is not the case with numerical mode.<br />
To get the screen copy of the oscilloscope, select the mode acquire/Envelope ON. Then, come back<br />
to the normal mode. Give the characteristics of the modulated signal.<br />
IUT of Grenoble - WINS <strong>PW</strong>2 AM - 2 10/10/07
3.1.3 The DSB-AM<br />
Use the offset voltage of the second generator to modify the<br />
modulation index. To measure the offset voltage, use a<br />
multimeter at the position “V=” .<br />
• Control and record this value in order to have a<br />
modulation index m = 100%<br />
(Measurement method is described at the following address http://www.t14 at the heading<br />
“Technical help/Measurement methods”)<br />
Acquire this AM and the low frequency information signal together. Give the characteristic<br />
parameters of the lower frequency signal<br />
• Acquire the trapezoidal figure with the X-Y mode selecting the DISPLAY / X-DEFL / ON function.<br />
In this case the source chosen is AM signal.<br />
• Repeat the same measurements with a modulation index m = 50%.<br />
3.1.4 <strong>Amplitude</strong> <strong>Modulation</strong> spectral response<br />
Due to a weak resolution of the FFT module of the oscilloscope, the lower frequency will be multiplied by<br />
10 in order to reach a frequency of 10 kHz. In this case, the different frequency peaks in the spectral<br />
response is sufficiently different to be observed.<br />
To acquire the spectral response read at the next address http://www.t14 at the heading “Technical<br />
help/Measurement methods”.<br />
- Reduce the time base to observe only about ten periods of the signal<br />
- Select the button MATH<br />
- Select FFT on CH2 if the AM signal is connected to this channel (CH1 if AM signal is connected to<br />
the other channel)<br />
- Activate ON<br />
- Do not observe the source, Param = ABS<br />
- Increase the time base until to see two or three peaks.<br />
- Display the frequency activating the cursors function<br />
• Acquire the DSBSC-modulation spectral response<br />
• Acquire the DSB-AM spectral response with a modulation depth m = 50%.<br />
• To conclude, which is the frequency band of this amplitude modulation ? And which is the<br />
parameter associated to this frequency band ?<br />
3.2 Envelope detector<br />
Band-Pass High-Pass<br />
IUT of Grenoble - WINS <strong>PW</strong>2 AM - 3 10/10/07
Be careful : do not forget to replace the old frequency of the low frequency<br />
information signal by the previous value 1 kHz !<br />
Set the V0 in order to have a DSB-AM with a modulation depth m = 50%.<br />
Using the circuit shown in the following figure realize the envelope detector<br />
defined in the previous theoretical part with a circuit composed of a diode<br />
1N451 (Germanium => low threshold).<br />
• Check that this detector demodulates the amplitude modulation signal<br />
acquiring simultaneously the low frequency information signal and the<br />
modulated signal.<br />
• Find the maximum frequency fMAX of the low frequency information<br />
signal which gives a correct envelope detection the defect appears clearly using the X-Y mode<br />
(modulated and low frequency signals). Explain that comparing the envelope slow with the exponential<br />
evolution of the capacitance discharge.<br />
• Which do appear if a DSBSC modulation is applied at the input of the envelope detector?<br />
3.3 Product demodulation<br />
Insert a second multiplier circuit on the holes board.<br />
• Apply at the input X the carrier signal (⇒ HAMEG<br />
8030 source generator) with a frequency of 100 kHz<br />
and peak amplitude of 5V.<br />
• Apply at the input Y, the previous DSBSC modulated<br />
signal.<br />
Using the filter function, realize at the output of the<br />
multiplier the pass-band filter defined in the theoretical<br />
part.<br />
3.4 Low-Pass filter<br />
Low-Pass filter<br />
• Acquire the modulated signal and the low frequency information signal together.<br />
Measure the cut-off frequency at -3 dB of the transfer function associated to the base band signal used for<br />
the modulation and the signal obtained with the product demodulation module. For that, decrease the<br />
frequency value of the low frequency signal to 500 Hz and apply the demodulated signal at the input of the<br />
voltmeter Ferisol. Read the amplitude with dB scale and then increase the frequency value until a decrease<br />
of 3 dB of the level.<br />
• Which is this cut-off frequency?<br />
3.5 Audio application<br />
Replace the low frequency signal from the second generator by the signal coming from the audio card of<br />
the PC with the cable (bananas and Jack-M connector).<br />
Chose a music file, as an example AmeliePoulain.wav (Intranet , Heading : TP / En GTR 1A / Cycles1 /<br />
AM).<br />
Apply the demodulated signal on the loudspeaker with the cable (bananas and Jack-F connector).<br />
The demodulated signal could restore the music chosen previously.<br />
IUT of Grenoble - WINS <strong>PW</strong>2 AM - 4 10/10/07