Rapid Watershed Assessment Resource Profile Chippewa (MN ...
Rapid Watershed Assessment Resource Profile Chippewa (MN ...
Rapid Watershed Assessment Resource Profile Chippewa (MN ...

You also want an ePaper? Increase the reach of your titles
YUMPU automatically turns print PDFs into web optimized ePapers that Google loves.
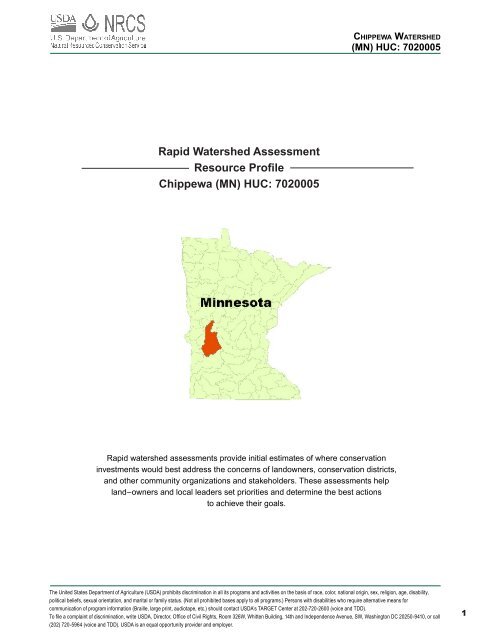
<strong>Rapid</strong> <strong>Watershed</strong> <strong>Assessment</strong><br />
<strong>Resource</strong> <strong>Profile</strong><br />
<strong>Chippewa</strong> (<strong>MN</strong>) HUC: 7020005<br />
Ch i p p e wa wat e r s h e d<br />
(<strong>MN</strong>) hUC: 7020005<br />
<strong>Rapid</strong> watershed assessments provide initial estimates of where conservation<br />
investments would best address the concerns of landowners, conservation districts,<br />
and other community organizations and stakeholders. These assessments help<br />
land–owners and local leaders set priorities and determine the best actions<br />
to achieve their goals.<br />
The United States Department of Agriculture (USDA) prohibits discrimination in all its programs and activities on the basis of race, color, national origin, sex, religion, age, disability,<br />
political beliefs, sexual orientation, and marital or family status. (Not all prohibited bases apply to all programs.) Persons with disabilities who require alternative means for<br />
communication of program information (Braille, large print, audiotape, etc.) should contact USDA’s TARGET Center at 202-720-2600 (voice and TDD).<br />
To file a complaint of discrimination, write USDA, Director, Office of Civil Rights, Room 326W, Whitten Building, 14th and Independence Avenue, SW, Washington DC 20250-9410, or call<br />
(202) 720-5964 (voice and TDD). USDA is an equal opportunity provider and employer.<br />
1
Introduction<br />
The <strong>Chippewa</strong> 8-digit Hydrological Unit Code (HUC) Subbasin is located in<br />
the Prarie Parkland Ecological Province of Southwestern Minnesota. This<br />
agriculturally dominated watershed is 1,333,517 acres in size. Excluding<br />
open water, nearly ninety percent of the acres within the HUC are owned<br />
by private landholders.<br />
There are 2,293 farms in the subbasin. Approximately 50 percent of the<br />
operations are less than 180 acres in size, nearly 40 percent are 180 to<br />
1000 acres in size, and the remaining farms are larger than 1000 acres.<br />
Sixty four percent of the producers are full time operators and do not rely<br />
on off farm income.<br />
The main resource concerns on the cropland are wind and water erosion<br />
and flooding resulting in cropland runoff. Associated with the cropland<br />
runoff are increased sediment and pollutant loadings to surface water.<br />
Additional resource concerns include surface and groundwater<br />
quality (Mercury, Turbidity, and Fecal Coliform), agricultural waste<br />
management and declining wildlife habitat.<br />
County Acres in HUC % HUC<br />
<strong>Chippewa</strong> 180,191.70 13.5<br />
Douglas 185,819.97 13.9<br />
Grant 25,762.27 1.9<br />
Kandiyohi 95,502.65 7.2<br />
Otter Tail 25,744.63 1.9<br />
Pope 393,337.17 29.5<br />
Stearns 61.49 0.0<br />
Stevens 53,609.44 4.0<br />
Swift 373,516.95 28.0<br />
Total acres: 1,333,517.2 100<br />
Ch i p p e wa wat e r s h e d<br />
(<strong>MN</strong>) hUC: 7020005<br />
The United States Department of Agriculture (USDA) prohibits discrimination in all its programs and activities on the basis of race, color, national origin, sex, religion, age, disability,<br />
political beliefs, sexual orientation, and marital or family status. (Not all prohibited bases apply to all programs.) Persons with disabilities who require alternative means for<br />
communication of program information (Braille, large print, audiotape, etc.) should contact USDA’s TARGET Center at 202-720-2600 (voice and TDD).<br />
To file a complaint of discrimination, write USDA, Director, Office of Civil Rights, Room 326W, Whitten Building, 14th and Independence Avenue, SW, Washington DC 20250-9410, or<br />
call (202) 720-5964 (voice and TDD). USDA is an equal opportunity provider and employer.<br />
2
Physical Description<br />
The <strong>Chippewa</strong> <strong>Watershed</strong> is situated in the Northern Glaciated Plains<br />
and North Central Hardwood Forest Ecoregions of Minnesota. Soils<br />
in this HUC are generally loamy clays and sands, with considerable<br />
deposits of glacial till and outwash.<br />
Average elevation in the watershed is 1174 feet above sea level. This<br />
HUC includes Inspiration Peak located in Lake Carlos state park.<br />
Rising to 1,750 feet above sea level, Inspiration Peak boasts the<br />
second highest elevation in the state.<br />
Precipitation in the watershed averages between 25 to 29 inches<br />
annually. Most lands within this watershed are not highly erodible, and<br />
are well to moderately well suited to agricultural uses. Predominate<br />
land uses / land covers are row crops (61%), followed by grass and<br />
pasture (18%), and wetlands (8%).<br />
Land use within the <strong>Chippewa</strong> watershed is primarily agricultural,<br />
accounting for approximately 68% of the available acres. Corn and<br />
soybeans are grown on approximately 66% of cropped lands; small<br />
grains, hay, and grasslands enrolled in the Conservation Reserve<br />
Program (CRP) make up the majority of the balance.<br />
Crop lands are generally classified as moderately productive (68%),<br />
although nearly 25% are ranked as low production acres.<br />
Development pressure is moderate, with occasional farms being<br />
parceled out for recreation or country homes.<br />
Ownership* /1<br />
Ownership Type Acres % of HUC<br />
Conservancy 1,274.57 0.10<br />
County 237.24 0.02<br />
Federal 28,958.83 2.17<br />
Private Major 1,280.81 0.10<br />
State-Misc. 37,391.34 2.80<br />
Tribal 0.00 0.00<br />
Private 1,197,393.00 89.79<br />
Other Public 139.97 0.01<br />
*Open Water 73,492.60 5.51<br />
Ownership Totals: 1,333,517.20 100<br />
* ownership undetermined / not reflected<br />
Relief<br />
Ch i p p e wa wat e r s h e d<br />
(<strong>MN</strong>) hUC: 7020005<br />
Average Precipitation (inches)<br />
* Ownership totals derived from 2007 <strong>MN</strong> DNR GAP Stewardship data and are the best suited estimation of land stewardship<br />
available on a statewide scale at time of publication. See the bibliography section of this document for further information.<br />
3
Ownership / Land Use<br />
Ch i p p e wa wat e r s h e d<br />
(<strong>MN</strong>) hUC: 7020005<br />
The <strong>Chippewa</strong> watershed covers an area of 1,333,517 acres. Nearly ninety percent of the land in the watershed<br />
is owned by private landholders (1,197,393 acres). The second largest ownership type is State, with just over<br />
37,900 acres (2.8%), followed by Federal with approximately 28,960 acres (2.17%). Privately administered<br />
Conservancy lands amount to slightly less than 1,275 acres (0.10%), followed closely by Private-Major<br />
holdings of 1,200 acres (0.10%). County land totals comprise the smallest ownership class in the region,<br />
amounting to slightly less than 240 acres (0.02%). Ownership data indicates no major Tribal land holdings in<br />
the sub basin. Land use by ownership type is represented in the table below.<br />
Ownership / Land Use /3<br />
Public Private** Tribal<br />
Landcover/Use Acres Percent Acres Percent Acres Percent Total Acres Percent<br />
Forest 4,487.0 0.34 65,046.26 4.88 0.0 0.00 69533.30 5.21%<br />
Grain Crops 2,674.8 0.20 28,966.22 2.17 0.0 0.00 31641.01 2.37%<br />
Grass, etc 17,938.9 1.35 217,958.63 16.34 0.0 0.00 235897.55 17.69%<br />
Orchards 0.0 0.00 0.00 0.00 0.0 0.00 0.00 0.00%<br />
Row Crops 19,014.0 1.43 789,778.46 59.23 0.0 0.00 808792.45 60.65%<br />
Shrub etc 47.6 0.00 624.44 0.05 0.0 0.00 672.07 0.05%<br />
Wetlands 18,400.4 1.38 88,235.97 6.62 0.0 0.00 106636.33 8.00%<br />
Residential/Commercial 113.38 6,783.08 0.51 6896.46 0.52%<br />
Open Water* -- -- -- -- -- -- 73492.60 5.51%<br />
* ownership undetermined ** includes private-major<br />
Land Use / Land Cover /2<br />
Totals: 62,562.73 4.69% 1,197,393 89.79% 0 0.00% 1333517.20 100.00%<br />
4
Physical Description (continued)<br />
Stream Flow Data<br />
Stream Data /4<br />
(*Percent of Total HUC<br />
Stream Miles)<br />
Riparian<br />
Land Cover/Land Use /5<br />
(Based on a 100-foot buffer on<br />
both sides of all streams in the<br />
100K Hydro GIS Layer)<br />
Crop and Pastureland<br />
Land Capability Class /6<br />
(Croplands & Pasturelands Only)<br />
(1997 NRI Estimates for Non-<br />
Federal Lands Only)<br />
Irrigated Lands /7<br />
(1997 NRI Estimates for Non-<br />
Federal Lands Only)<br />
USGS 05304500 CHIPPEWA RIVER NEAR<br />
MILAN, <strong>MN</strong><br />
Total Miles – Major (100K Hydro GIS<br />
Layer)<br />
Total Miles –303d/TMDL Listed<br />
Streams<br />
Ch i p p e wa wat e r s h e d<br />
(<strong>MN</strong>) hUC: 7020005<br />
cu. ft/sec<br />
Total Avg. 380.2<br />
May – Sept. Avg. 466.2<br />
ACRES/MILES PERCENT<br />
2,648 ---<br />
255 12%*<br />
Dev/Barren 104 0.2<br />
Fallow 0 0<br />
Forest 6,430 10.0<br />
Grain Crops 355 0.6<br />
Grass/Pasture 9,169 14.0<br />
Orchards/Vine 0 0<br />
Row Crops 20,036 31.0<br />
Shrub/Range 5 0.01<br />
Water 14,258 22.0<br />
Wetlands 13,398 21.0<br />
Total Buffer Acres 63,755 ---<br />
1 – slight limitations 70,700 7.0<br />
2 – moderate limitations 516,300 52.0<br />
3 – severe limitations 268,100 27.0<br />
4 – very severe limitations 79,500 8.0<br />
5 – no erosion hazard, but other limitations 7,700 1.0<br />
6 – severe limitations; unsuitable for<br />
cultivation; limited to pasture, range, forest 35,000 4.0<br />
7 – very severe limitations; unsuitable<br />
for cultivation; limited to grazing, forest,<br />
wildlife habitat<br />
8 – miscellaneous areas; limited to<br />
recreation, wildlife habitat, water supply<br />
19,700 2.0<br />
0 0.0<br />
Total Crop & Pastureland 996,700 ---<br />
TYPE OF LAND ACRES<br />
% of<br />
Irrigated % of HUC<br />
Lands<br />
Cultivated Cropland 19,600 100 0.47<br />
Uncultivated Cropland 0 0 0<br />
Pastureland 0 0 0<br />
Total Irrigated Lands 19,600 --- 1.47%<br />
5
<strong>Assessment</strong> of Waters<br />
Ch i p p e wa wat e r s h e d<br />
(<strong>MN</strong>) hUC: 7020005<br />
Section 303(d) of the Clean Water Act states that water bodies with impaired use(s) must be placed on<br />
a state’s impaired waters list. A water body is “Impaired” or polluted when it fails to meet one or more of<br />
the Federal Clean Water Act’s water quality standards. Federal Standards exist for basic pollutants such<br />
as sediment, bacteria, nutrients, and mercury. The Clean Water Act requires the Minnesota Pollution<br />
Control Agency (MPCA) to identify and restore impaired waters.<br />
Minnesota’s impaired waters list, updated every two years, identifies assessed waters that do not meet<br />
water quality standards. The primary tool for addressing impaired waters is a pollution reduction plan<br />
called a Total Maximum Daily Load, or TMDL. After impaired use(s) have been identified, the TMDL<br />
process identifies all sources of each pollutant. The plan then determines how much each source must<br />
reduce it’s contribution in order to meet the applicable water quality standard. The Clean Water Act<br />
requires a completed TMDL for each water quality violation identified on a state’s impaired waters list.<br />
Lakes or river reaches with multiple impairments require multiple TMDLs.<br />
2006 Minnesota TMDL Listed Streams - <strong>Chippewa</strong> River <strong>Watershed</strong><br />
Listed Stream / Reach /8 Impairment Affected Use<br />
<strong>Chippewa</strong> River; Watson Sag Diversion to Minnesota R<br />
Mercury, Ammonia,<br />
Fecal Coliform, Turbidity<br />
Aquatic Life, Aquatic Recreation,<br />
Aquatic Consumption<br />
<strong>Chippewa</strong> River; Dry Weather Cr to Watson Sag Diversion Mercury Aquatic Consumption<br />
<strong>Chippewa</strong> River; Headwaters to Little <strong>Chippewa</strong> R Mercury Aquatic Consumption<br />
<strong>Chippewa</strong> River; Little <strong>Chippewa</strong> R to Unnamed Cr Mercury Aquatic Consumption<br />
<strong>Chippewa</strong> River; Unnamed Cr to East Br <strong>Chippewa</strong> R Mercury Aquatic Consumption<br />
<strong>Chippewa</strong> River; East Br <strong>Chippewa</strong> R to Shakopee Cr Mercury Aquatic Consumption<br />
<strong>Chippewa</strong> River; Shakopee Cr to Cottonwood Cr Mercury Aquatic Consumption<br />
<strong>Chippewa</strong> River; Cottonwood Cr to Dry Weather Cr Mercury Aquatic Consumption<br />
<strong>Chippewa</strong> River; Headwaters to Little <strong>Chippewa</strong> R Mercury Aquatic Consumption<br />
<strong>Chippewa</strong> River; Watson Sag Diversion to Minnesota R<br />
Mercury, Ammonia,<br />
Fecal Coliform, Turbidity<br />
Aquatic Life, Aquatic Recreation,<br />
Aquatic Consumption<br />
Judicial Ditch 8; Unnamed Cr to Unnamed Ditch Fish IBI Aquatic Life<br />
6
<strong>Assessment</strong> of Waters (continued)<br />
2006 Minnesota TMDL Listed Lakes - <strong>Chippewa</strong> River <strong>Watershed</strong><br />
Listed Lake Impairment Affected Use<br />
Ch i p p e wa wat e r s h e d<br />
(<strong>MN</strong>) hUC: 7020005<br />
Maple Mercury Aquatic Consumption<br />
<strong>Chippewa</strong> Mercury Aquatic Consumption<br />
Whiskey Mercury Aquatic Consumption<br />
Andrew Mercury Aquatic Consumption<br />
Florida Mercury Aquatic Consumption<br />
Norway Mercury Aquatic Consumption<br />
Scandinavian Mercury Aquatic Consumption<br />
Leven Excess nutrients Aquatic Recreation<br />
Gilchrist Excess nutrients Aquatic Recreation<br />
Reno Excess nutrients Aquatic Recreation<br />
Pelican Excess nutrients Aquatic Recreation<br />
Ann Excess nutrients Aquatic Recreation<br />
Strandness Excess nutrients Aquatic Recreation<br />
Minnewaska Mercury Aquatic Consumption<br />
Signalness Mercury Aquatic Consumption<br />
Malmedal Excess nutrients Aquatic Recreation<br />
Emily Excess nutrients Aquatic Recreation<br />
7
Common <strong>Resource</strong> Areas<br />
91A - Central Minnesota Outwash : Nearly level to gently sloping well<br />
drained sandy soils on outwash plains and stream terraces. There are<br />
also numerous poorly and very poorly drained mineral and organic soils.<br />
Irrigated crop land, pasture and hayland are the major land uses. Forest<br />
land is common in parts. Corn, soybeans, edible beans and potatoes<br />
are the primary irrigated crops. Forage crops are also extensively grown.<br />
<strong>Resource</strong> concerns are wind erosion water quality, nutrient management,<br />
improperly managed grazing.<br />
102A - Rolling Till Prairie: Gently sloping to steep, loamy glacial till soils<br />
with scattered sandy outwash soils and silty alluvial flood plains soils. This<br />
area is part of the Prairie Pothole region of the upper Midwest. Predominantly<br />
cropped to corn and soybeans with increasing hayland and pasture<br />
and small grains in the western part. <strong>Resource</strong> concerns are water and<br />
wind erosion, nutrient management and water quality.<br />
Ch i p p e wa wat e r s h e d<br />
(<strong>MN</strong>) hUC: 7020005<br />
<strong>Chippewa</strong> <strong>Watershed</strong> is located within three common resource areas, CRA 91A, 102A.1, and 103.1 /9<br />
103 – Iowa and Minnesota Till Prairies: Primarily loamy glacial till soils with scattered lacustrine areas,<br />
potholes, outwash and flood plains. Nearly level to gently undulating with relatively short slopes. Most of<br />
the wet soils have been artificially drained to maximize crop production. Primary land use is cropland. Corn,<br />
soybeans, sugar beets, peas and sweet corn are the major crops. Native vegetation was dominantly tall<br />
grass prairie. <strong>Resource</strong> concerns are water and wind erosion, nutrient management, and water quality.<br />
Soils / Geology /10<br />
Only the major CRA units are described above.<br />
For further information, go to:<br />
http://soils.usda.gov/survey/geography/cra.html<br />
The eastern half of the <strong>Chippewa</strong> River <strong>Watershed</strong>, extending from approximately Evansville in the north to<br />
just below the town of DeGraff in the south, lies within the North Central Hardwood Forest Ecoregion. More<br />
specifically, with the exception of a long, narrow section of the Belgrade-Glenwood outwash plain along the<br />
east-central edge of the basin, the eastern half of the watershed falls within the geomorphic setting of the<br />
Alexandria Moraine Complex. This morainal complex is composed of well drained, loamy, silty, sandy and mucky<br />
soils with moderate to steep sloping landscapes (6- 45%), producing a large potential for sediment delivery to<br />
streams. As such, water erosion potential within this section of the watershed is classified as moderate to high.<br />
The section of the watershed situated in the Belgrade-Glenwood outwash plain, lying east of the line from Glenwood<br />
in the north to Lake Johanna in the south, is characterized by nearly level to gently sloping (2-6%), well drained<br />
landscapes with sandy-loamy soils of moderate water and wind erosion potential. Lands in the western half of the<br />
<strong>Chippewa</strong> River <strong>Watershed</strong> fall within the Northern Glaciated Plains Ecoregion, primarily within three geomorphic<br />
settings, the Big Stone Moraine on the far western edge, the Appleton-Clontarf Outwash Plain along the lower<br />
<strong>Chippewa</strong> River, and the Benson Lacustrine Plain within the south-central section of the watershed. Landscapes<br />
within the Big Stone moraine are characterized as rolling (6-12 %), with well drained, silty and loamy soils.<br />
Water erosion potential within the moraine is generally classified as moderate. Lands within the Appleton-<br />
Clontarf outwash are characterized as being nearly level to gently sloping (2-6%), poorly drained, and<br />
extensively tiled. Water and wind erosion potentials are classified as<br />
moderate for this region. The Benson Lacustrine Plain is also<br />
nearly level (0-2%), poorly drained and extensively tiled. Soil textures<br />
in the lacustrine plain range from silty clay to silt loam, water erosion<br />
potentials are high for lands adjacent to streams and much of the<br />
plain has the potential for significant wind erosion.<br />
Visit the online Web Soil Survey at<br />
http://websoilsurvey.nrcs.usda.gov for official and<br />
current USDA soil information as viewable maps and<br />
tables. Visit the Soil Data Mart at<br />
http://soildatamart.usda.gov to download SSURGO<br />
certified soil tabular and spatial data.<br />
8
Drainage Classification<br />
Drainage class (natural) refers to the frequency and duration of<br />
wet periods under conditions similar to those under which the<br />
soil formed. Alterations of the water regime by human activities,<br />
either through drainage or irrigation, are not a consideration un-<br />
less they have significantly changed the morphology of the soil.<br />
Seven classes of natural soil drainage are recognized–exces-<br />
sively drained, somewhat excessively drained, well drained,<br />
moderately well drained, somewhat poorly drained, poorly<br />
drained, and very poorly drained. These classes are defined in<br />
the “Soil Survey Manual.”<br />
Ch i p p e wa wat e r s h e d<br />
(<strong>MN</strong>) hUC: 7020005<br />
Visit the online Web Soil Survey at<br />
http://websoilsurvey.nrcs.usda.gov for official and<br />
current USDA soil information as viewable maps and<br />
tables. Visit the Soil Data Mart at<br />
http://soildatamart.usda.gov to download SSURGO<br />
certified soil tabular and spatial data.<br />
9
Farmland Classification<br />
Farmland classification identifies map units as prime farmland,<br />
farmland of statewide importance, farmland of local importance,<br />
or unique farmland.<br />
Farmland classification identifies the location and extent of the<br />
most suitable land for producing food, feed, fiber, forage, and<br />
oilseed crops.<br />
NRCS policy and procedures on prime and unique farmlands<br />
are published in the Federal Register, Vol. 43, No 21,<br />
January 31, 1978.<br />
Ch i p p e wa wat e r s h e d<br />
(<strong>MN</strong>) hUC: 7020005<br />
Visit the online Web Soil Survey at<br />
http://websoilsurvey.nrcs.usda.gov for official and<br />
current USDA soil information as viewable maps and<br />
tables. Visit the Soil Data Mart at<br />
http://soildatamart.usda.gov to download SSURGO<br />
certified soil tabular and spatial data.<br />
10
Hydric Soils<br />
This rating provides an indication of the proportion of the map<br />
unit that meets criteria for hydric soils. Map units that are domi-<br />
nantly made up of hydric soils may have small areas, or inclu-<br />
sions of nonhydric soils in the higher positions on the landform.<br />
Map units of dominantly non–hydric soils may therefore have<br />
inclusions of hydric soils in the lower positions on the landform.<br />
Hydric soils are defined by the National Technical Committee for<br />
Hydric Soils (NTCHS) as “soils that formed under conditions of<br />
saturation, flooding, or ponding long enough during the growing<br />
season to develop anaerobic conditions in the upper part” (Fed-<br />
eral Register 1994).<br />
Ch i p p e wa wat e r s h e d<br />
(<strong>MN</strong>) hUC: 7020005<br />
Visit the online Web Soil Survey at<br />
http://websoilsurvey.nrcs.usda.gov for official and<br />
current USDA soil information as viewable maps and<br />
tables. Visit the Soil Data Mart at<br />
http://soildatamart.usda.gov to download SSURGO<br />
certified soil tabular and spatial data.<br />
11
Highly Erodible Land (HEL)<br />
The erodibility index (EI) for a soil map unit is determined by<br />
dividing the potential erodibility for the soil map unit by the soil<br />
loss tolerance (T) value established for the soil in the FOTG as<br />
of January 1, 1990.<br />
A soil map unit with an EI of 8 or greater is considered to be<br />
highly erodible land (HEL).<br />
Potential erodibility is based on default values for rainfall amount<br />
and intensity, percent and length of slope, surface texture and<br />
organic matter, permeability, and plant cover. Actual erodibility<br />
and EI for any specific map unit depends on the actual values for<br />
these properties.<br />
Ch i p p e wa wat e r s h e d<br />
(<strong>MN</strong>) hUC: 7020005<br />
Visit the online Web Soil Survey at<br />
http://websoilsurvey.nrcs.usda.gov for official and<br />
current USDA soil information as viewable maps and<br />
tables. Visit the Soil Data Mart at<br />
http://soildatamart.usda.gov to download SSURGO<br />
certified soil tabular and spatial data.<br />
12
Land Capability Classification<br />
Land capability classification shows, in a general way, the suitabil-<br />
ity of soils for most kinds of field crops. Crops that require special<br />
management are excluded. The soils are grouped according to<br />
their limitations for field crops, the risk of damage if they are used<br />
for crops, and the way they respond to management.<br />
The criteria used in grouping the soils does not include major and<br />
generally expensive land forming that would change slope, depth,<br />
or other characteristics of the soils, nor do they include possible<br />
but unlikely major reclamation projects. Capability classification<br />
is not a substitute for interpretations designed to show suitability<br />
and limitations of groups of soils for rangeland, for forestland, or<br />
for engineering purposes.<br />
Ch i p p e wa wat e r s h e d<br />
(<strong>MN</strong>) hUC: 7020005<br />
Visit the online Web Soil Survey at<br />
http://websoilsurvey.nrcs.usda.gov for official and<br />
current USDA soil information as viewable maps and<br />
tables. Visit the Soil Data Mart at<br />
http://soildatamart.usda.gov to download SSURGO<br />
certified soil tabular and spatial data.<br />
13
Performance Results System and Other Data<br />
Conservation Treatment Acres<br />
Waste Management (Number)<br />
NRCS<br />
Practice<br />
Code<br />
313, 317,<br />
359<br />
Ch i p p e wa wat e r s h e d<br />
(<strong>MN</strong>) hUC: 7020005<br />
In the three year reporting period NRCS Conservation treatment practices applied or prescribed<br />
within the <strong>Chippewa</strong> watershed in the last three years have primarily concentrated on Conservation<br />
tillage (12,446 acres/yr average), Conservation Crop Rotations (4,928 acres/yr), Nutrient<br />
Management (2,599 acres/yr), Prescribed Grazing (1,866 acres/yr), and Wildlife Habitat (1342<br />
acres/yr). Other notable efforts have been made in areas of air quality/ wind erosion management,<br />
with the addition of an average 143,541 feet of windbreak annually.<br />
FY 04 FY 05 FY 06 Avg/Year Total<br />
0 0 0 0 0<br />
Buffers (Acres) 391, 393 356 403 287 349 1046<br />
Erosion Control (Acres)<br />
311, 332,<br />
589, 386,<br />
412, 600,<br />
601, 603,<br />
380, 650<br />
422 74 33 176 529<br />
Irrigation Water Management (Acres) 449 0 363 2,070 811 2433<br />
Wind Break (ft) 380 185,313 148,897 96,414 143541 430624<br />
Atmospheric <strong>Resource</strong> Quality Management<br />
(Acres)<br />
370 0 0 0 0 0<br />
Nutrient Management (Acres) 590 933 2,288 4,576 2599 7797<br />
Pest Management (Acres) 595 0 145 187 111 332<br />
Prescribed Grazing (Acres)<br />
528, 472,<br />
528A<br />
2,158 1,323 2,118 1866 5599<br />
Prescribed Burning (Acres) 338 76 92 195 121 363<br />
Trees & Shrubs (Acres) 612, 666 742 32 35 270 809<br />
Conservation Tillage (Acres)<br />
329A,<br />
329B,<br />
329C<br />
5,061 14,945 17,331 12446 37337<br />
Conservation Crop Rotations (Acres) 328 4,492 3,147 7,145 4928 14784<br />
Cover Crops (Acres) 340 106 0 144 83 250<br />
Wildlife Habitat (Acres) 644, 645 1,406 478 2,142 1342 4026<br />
Brush Management (Acres) 314 0 0 0 0 0<br />
Restoration of Declining Habitat (Acres) 643 1,049 140 962 717 2151<br />
Wetland Wildlife Habitat Management (Acres) 644 27 41 219 96 287<br />
Wetlands (Acres)<br />
657, 658,<br />
659<br />
1,358 535 961 951 2854<br />
LANDS REMOVED FROM PRODUCTION THROUGH FARM BILL PROGRAMS /11<br />
Program Acres<br />
Conservation Reserve Program (CRP) 64,099<br />
Wetland Restoration Program (WRP) 1,017<br />
Conservation Reserve Enhancement Program (CREP) 10,661<br />
14
Socioeconomic and Agricultural Data (Relevant)<br />
Estimates for the <strong>Chippewa</strong> subbasin show a population of just under<br />
42,300 people. Median household income throughout the district is $31,201<br />
yearly, roughly 67% of the national average. Sixty seven percent of the<br />
population over the age of 18 is active in the workforce, and approximately<br />
8% of the residents in the watershed are below the national poverty level.<br />
There are 2,293 farms in the subbasin. Approximately 50 percent of the<br />
operations are less than 180 acres in size, nearly 40 percent are 180 to<br />
1000 acres in size, and the remaining farms are larger than 1000 acres.<br />
Sixty four percent of the producers are full time operators and do not rely on<br />
off farm income.<br />
Population Data<br />
Farms<br />
Farm Size<br />
Livestock & Poultry<br />
Chem (Acres Applied)<br />
<strong>Chippewa</strong> (<strong>MN</strong>) HUC#7020005 /12<br />
<strong>Watershed</strong> Population 42,283<br />
Unemployment Rate 4.11%<br />
Median Household Income 31,201<br />
% below poverty level 8%<br />
Median Value of Home 64,232<br />
# of Farms 2,293<br />
# of Operators 2293<br />
# of Full Time Operators 1476<br />
# of Part Time Operators 817<br />
Total Crop/Pasturelands 996,700<br />
1 to 49 Acres 485<br />
50 to 179 Acres 671<br />
180 to 499 Acres 629<br />
500 to 999 Acres 274<br />
1,000 Acres or more 234<br />
Cattle - Beef 65,155<br />
Cattle - Dairy 52,708<br />
Chicken 127,994<br />
Swine 122,376<br />
Turkey 2,180,644<br />
Other 39,867<br />
Animal Count Total: 2,588,745<br />
Total Permitted AFOs 889<br />
Insecticides 11,709.16<br />
Herbicides 167,744.10<br />
Wormicides 116.76<br />
Fruiticides 4,727.28<br />
Total Chemicals 184,297.30<br />
% State Chemical Totals 1.29%<br />
Ch i p p e wa wat e r s h e d<br />
(<strong>MN</strong>) hUC: 7020005<br />
15
e s o U r C e Co N C e r N s<br />
County Soil and Water Conservation Districts in the <strong>Watershed</strong> have identi-<br />
fied the following resource concerns as top priorities for conservation and cost<br />
sharing efforts:<br />
• Soil Quality, Excessive Sheet and Rill Erosion. Soil Erosion and Deposition<br />
has ranked as a top concern in each county within the watershed.<br />
Ch i p p e wa wat e r s h e d<br />
(<strong>MN</strong>) hUC: 7020005<br />
• Soil Quality, Excessive Wind Erosion. Topography makes wind erosion a<br />
major conservation issue. Wind erosion physically removes the lighter, less<br />
dense soil constituents such as organic matter, clays, silts, thus removing the<br />
fertile part of the soil and lowering productivity.<br />
• Surface Water Quality, Nutrients. Reduction of priority pollutants and sediments in surface waters is a pri-<br />
ority issue throughout the watershed. Excessive amounts of sediments, nutrients, and bacteria degrade the<br />
water quality causing an unbalanced fish community with depressed populations and limited diversity.<br />
• Ground Water Quality, Nutrients, Organics, Animal and Human Waste. Aging septic systems, feedlot run-<br />
off, cropland nutrient runoff, tilling practices, and abandoned wells all pose significant threats to groundwater<br />
quality throughout the region. Sealing of abandoned wells is a priority in addressing ground water quality.<br />
• Surface Water Management, Flood Control, Drainage Management. Drained wetlands, crop production in<br />
flood prone areas, and aging dams all diminish surface water quality and productivity. Restoration of wet-<br />
lands, dam repair and placing flood-prone lands in CRP/RIM all serve to lessen the impact of flooding and<br />
improve drainage.<br />
• NRI estimates for sheet and rill erosion by<br />
water on the cropland and pastureland declined<br />
by approximately 612,000 tons of soil (24.21%)<br />
between the years 1982 and 1997.<br />
• NRI trends indicate wind erosion rates on<br />
agricultural lands in the subbasin decreased by<br />
2,232,000 tons of soil (37.19%) between the years<br />
1982 and 1997.<br />
Federally Listed Threatened And Endangered Species /14<br />
ENDANGERED SPECIES CANDIDATE SPECIES<br />
Fish – Topeka Shiner<br />
Insect – Dakota Skipper<br />
THREATENED SPECIES PROPOSED SPECIES<br />
Plants – Western Prairie Fringed Orchid, Prairie Bush Clover None<br />
Essential Habitat - Prairie river and stream habitat for the Topeka Shiner, Native Prairie for Dakota Skipper<br />
Soil Loss (1000 tons/yr)<br />
7000<br />
6000<br />
5000<br />
4000<br />
3000<br />
2000<br />
1000<br />
0<br />
1982 1987 1992 1997<br />
Wind<br />
Erosion<br />
Water<br />
Erosion<br />
/13<br />
16
<strong>Watershed</strong> Projects, Plans and Monitoring*<br />
• <strong>Chippewa</strong> River <strong>Watershed</strong> Project. The <strong>Chippewa</strong> River <strong>Watershed</strong> Project<br />
seeks to improve water quality and flooding problems within the <strong>Chippewa</strong> River<br />
watershed while promoting a healthy agricultural, industrial, and recreationbased<br />
economy for the region.<br />
• Friends of The Minnesota Valley <strong>Watershed</strong> Initiative. Puts an exciting twist<br />
on traditional approaches to watershed management within the Minnesota River<br />
Valley. This creative grass-roots program is the culmination of years of planning,<br />
and is based on the input of many individuals representing a variety of interests<br />
and possessing significant expertise on Minnesota River issues<br />
Ch i p p e wa wat e r s h e d<br />
(<strong>MN</strong>) hUC: 7020005<br />
• Shakopee Creek Headwaters Project. Project is a locally based effort to cooperatively monitor and<br />
identify sources of polluted run-off in the Shakopee Creek Headwaters <strong>Watershed</strong> and to promote<br />
conservation practices which target water quality improvement and flood reduction through education and<br />
incentive-based programs<br />
• Greater Minnesota River Turbidity TMDL Work Plan, MPCA. This project concerns turbidity impairments<br />
in the Minnesota River Basin. The project area begins near Lac Qui Parle, and ends at Jordan. The effort<br />
involves 18 reaches on the mainstem and lower tributaries.<br />
• Trappers Run <strong>Watershed</strong> Project. The purpose of the Trapper’s Run Project is to investigate poor water<br />
quality conditions in Trapper’s Run Creek and offer solutions to improve it. Elements of this project include<br />
water quality monitoring, feedlot inventory, septic inventory, fish and vegetative survey, and restorable<br />
wetland inventory.<br />
• Minnesota River <strong>Assessment</strong> Project (MRAP) Land Use <strong>Assessment</strong>. Inventories non-point source<br />
as well as small-point sources of pollution within the 37 select minor watersheds in the Minnesota<br />
River Basin. Potential small-point pollution sources include: dumps, wells, septic systems, tile intakes<br />
and outlets, feedlots, unique areas (such as auto body shops and golf courses), and gravel pits.<br />
• Minnesota River <strong>Assessment</strong> Project (MRAP) Biological and Toxicological <strong>Assessment</strong>. The study adapts<br />
and calibrates the Index of Biotic Integrity (IBI) for application in the basin; evaluates stream quality using<br />
IBI within select minor watersheds; and assesses the biological conditions of watersheds using the IBI. Fish<br />
communities are analyzed at 116 sites along the Minnesota River mainstem and tributaries.<br />
* Have a watershed project you’d like to see included? Submit suggestions online @ http://www.mn.nrcs.usda.gov/technical/rwa/<br />
Conservation Districts, Organizations & Partners<br />
• <strong>Chippewa</strong> County SWCD<br />
629 N. 11TH ST, Suite 7, Montevideo <strong>MN</strong> 56265<br />
Phone: 320-269-2139 EXT 101<br />
• <strong>Chippewa</strong> River <strong>Watershed</strong> Project<br />
629 North 11th Street Montevideo, <strong>MN</strong> 56265<br />
Phone 320-269-2139<br />
• Coalition for a Clean Minnesota River<br />
P.O. Box 488 New Ulm , <strong>MN</strong> 56073<br />
Phone 507-359-2346<br />
• Clean Up River Environment (CURE)<br />
114 1ST ST West, Montevideo <strong>MN</strong> 56265<br />
Phone: 320-236-2984<br />
• Douglas County SWCD<br />
900 Robert Street Suite 102 Alexandria, <strong>MN</strong> 56308<br />
Phone 320-763-3191 Ext. 3<br />
• Grant County SWCD<br />
17 Central Avenue N #177 Elbow Lake, <strong>MN</strong> 56531<br />
Phone 218-685-5395<br />
• Kandiyohi County SWCD<br />
1005 High Avenue NE; Willmar, <strong>MN</strong> 56201<br />
Phone 320-231-2844<br />
• Minnesota River Basin Joint Powers Board<br />
600 E. 4th St #14 Chaska, <strong>MN</strong> 55318-2108<br />
Phone 952-361-6590 Fax 952-361-6594<br />
• Ottertail County SWCD<br />
655 3rd Avenue SE Perham, <strong>MN</strong> 56573<br />
Phone 218-346-2050<br />
• Pope County SWCD<br />
160 Franklin St N, Glenwood, <strong>MN</strong> 56336<br />
Phone 320-634-5327<br />
• Prairie Country RC&D<br />
1005 High Avenue NE Willmar, <strong>MN</strong> 56201-4817<br />
Phone 320-231-0008 Fax 320-235-8151<br />
• Stevens County SWCD<br />
12 Hwy 28 E Suite 2 Morris <strong>MN</strong> 56267<br />
Phone (320) 589-4886 ext. 3<br />
• Stearns County SWCD<br />
110 2nd Street S, Suite 128 Waite Park, <strong>MN</strong> 56387<br />
Phone 320-251-7800, Ext. 3<br />
• Swift County SWCD<br />
1430 Utah Ave. Benson, <strong>MN</strong> 56215<br />
Phone 320 843-7201<br />
17
Footnotes / Bibliography<br />
Ch i p p e wa wat e r s h e d<br />
(<strong>MN</strong>) hUC: 7020005<br />
1. Ownership Layer – Source: <strong>MN</strong> Stewardship Data: Minnesota Department of Natural <strong>Resource</strong>s, Section of Wildife,<br />
BRW, Inc, 2007. This is the complete GAP Stewardship database containing land ownership information for the entire<br />
state of Minnesota. Date of source material is varable and ranges from 1976 to 2007, although a date range of 1983 to<br />
1985 predominates. Land interest is expressed only when some organization owns or administers more than 50% of<br />
a forty except where DNR could create sub-forty accuracy polygons.<br />
2. National Land Cover Dataset (NLCD) - Originator: U.S. Geological Survey (USGS); Publication date: 19990631;<br />
Title: Minnesota Land Cover Data Set, Edition: 1; Geospatial data presentation form: Raster digital data; Publisher: U.S.<br />
Geological Survey, Sioux Falls, SD, USA.<br />
3. Ownership layer classes grouped to calculate Public ownership vs. Private and Tribal ownership by Minnesota NRCS<br />
<strong>Rapid</strong> <strong>Watershed</strong> <strong>Assessment</strong> Staff.Land cover / Land use data was then extracted from the National Landcover Dataset<br />
Classification System and related to ownership class polygons.<br />
4. USGS 1:100,000 Hydrography Layer .This data set represents all features coded as ‘rivers’ on the USGS 1:100,000-<br />
scale DLG Hydrography data set. This current version was converted to ARC/INFO by the Land Management Information<br />
Center and edge-matched across map sheet boundaries. Minnesota DNR made further modifications to the files, verified<br />
lake feature identifiers, and created a state layer from the separate 100k data. The Hydro 100k layer was compared to<br />
MPCA’s 303(d) data to derive percentage of listed waters.<br />
5. Land Cover / Land Use / Hydro 100k Buffer. Using the 100k Hydrology dataset, All streams within HUC were spatially<br />
buffered to a distance of 100 ft. National Landcover Dataset attributes were extracted for the spatial buffer to demonstrate<br />
the vegetation and landuse in vulnerable areas adjacent to waterways.<br />
6. Land Capability Class. ESTIMATES FROM THE 1997 NRI DATABASE (REVISED DECEMBER 2000) REPLACE<br />
ALL PREVIOUS REPORTS AND ESTIMATES. Comparisons made using data published for the 1982, 1987, or 1992<br />
NRI may produce erroneous results. This is because of changes in statistical estimation protocols and because all<br />
data collected prior to 1997 were simultaneously reviewed (edited) as 1997 NRI data were collected. All definitions are<br />
available in the glossary. In addition, this December 2000 revision of the 1997 NRI data updates information released in<br />
December 1999 and corrects a computer error discovered in March 2000. For more information: http://www.nrcs.usda.<br />
gov/technical/NRI/<br />
7. 1997 NRI Irrigated Land Estimates. Irrigated land: Land that shows evidence of being irrigated during the year of the<br />
inventory or during two or more years out of the last four years. Water is supplied to crops by ditches, pipes, or other<br />
conduits. Water spreading is not considered irrigation; it is recorded as a conservation practice. [NRI-97] For more<br />
information: http://www.nrcs.usda.gov/technical/NRI/<br />
8. 303(d) Stream data. Minnesota’s Final Impaired Waters (per Section 303(d) Clean Water Act), 2006. Data obtained<br />
from Minnesota Pollution Control Agency (MPCA). The Minnesota Pollution Control Agency (MPCA) helps protect state<br />
water by monitoring quality, setting standards and controlling inputs through the development of TMDL plans. http://www.<br />
pca.state.mn.us/water/tmdl/index.html#maps.<br />
All data is provided “as is.” There are no warranties, express or implied, including the warranty of fitness<br />
for a particular purpose, accompanying this document. Use for general planning purposes only.<br />
18
Footnotes / Bibliography (continued)<br />
Ch i p p e wa wat e r s h e d<br />
(<strong>MN</strong>) hUC: 7020005<br />
9. National Coordinated Common <strong>Resource</strong> Area (CRA) Geographic Database. A Common <strong>Resource</strong> Area (CRA)<br />
map delineation is defined as a geographical area where resource concerns, problems, or treatment needs are similar.<br />
It is considered a subdivision of an existing Major Land <strong>Resource</strong> Area (MLRA) map delineation or polygon. Landscape<br />
conditions, soil, climate, human considerations, and other natural resource information are used to determine the<br />
geographic boundaries of a Common <strong>Resource</strong> Area<br />
10. Soil Survey Geographic Database (SSURGO) Tabular and spatial data obtained from NRCS Soil Data Mart at<br />
http://soildatamart.nrcs.gov. Publication dates vary by county. Component and layer tables were linked to the spatial<br />
data via SDV 5.1 and ARCGIS 9.1 to derive the soil classifications presented in these examples. Highly Erodible Land<br />
Classification Data obtained from USDA/NRCS EFOTG Section II, County Soil Data. HEL classifications were appended<br />
to SSURGO spatial data via an ARCEdit session. Addendum and publication dates vary by county.<br />
11. Lands removed from production through farm bill programs. County enrollment derived from the following: CRP<br />
Acres: www.fsa.usda.gov/crpstorpt/07Approved/r1sumyr/mn.htm (7/30/04). CREP Acres: http://www.bwsr.state.mn.us/<br />
easements/crep/easementsummary.html (7/31/03). WRP Acres: NRCS (8/16/04). Data were obtained by county and<br />
adjusted by percent of HUC in the county.<br />
12. Socioeconomic and Agricultural Census Data were taken from the U.S. Population Census, 2000 and 2002<br />
Agricultural Census and adjusted by percent of HUC in the county or by percent of zip code area in the HUC, depending<br />
on the level of data available. Unemployment statistics obtained from the Bureau of Labor Statistics - Labor Force Data<br />
by County, 2006 Annual Averages http://www.bls.gov Data were also taken from MPCA AFO/CAFO counts provided by<br />
county for 2005.<br />
13. 1997 NRI Estimates for sheet and rill erosion (WEQ & USLE). The NRI estimates sheet and rill erosion together<br />
using the Universal Soil Loss Equation (USLE). The Revised Universal Soil Loss Equation (RUSLE) was not used in the<br />
1997 NRI. RUSLE was not available for previous inventories, therefore the use of USLE was continued to preserve the<br />
trending capacity of the NRI database. Wind erosion is estimated using the Wind Erosion Equation (WEQ). For further<br />
information visit http://www.mn.nrcs.usda.gov/technical/nri/findings/erosion.htm<br />
14. Federally listed endangered and threatened species counts obtained from NRCS Field Office Technical Guide,<br />
Section II, Threatened and Endangered List. http://www.nrcs.usda.gov/Technical/efotg/. Essential fish habitat as<br />
established by Magnuson-Stevens Fishery Conservation and Management Act, Public Law 94-265, as amended through<br />
October 11, 1996 http://www.nmfs.noaa.gov/sfa/magact/<br />
15. <strong>Watershed</strong> Projects, Plans, Monitoring. Natural <strong>Resource</strong>s Conservation Service, <strong>Watershed</strong> Projects Planned and<br />
Authorized, http://www.nrcs.usda.gov/programs/watershed/Purpose.<br />
All data is provided “as is.” There are no warranties, express or implied, including the warranty of fitness<br />
for a particular purpose, accompanying this document. Use for general planning purposes only.<br />
19