Vol 32 No 4 - AF Logistics Management Agency
Vol 32 No 4 - AF Logistics Management Agency
Vol 32 No 4 - AF Logistics Management Agency

Create successful ePaper yourself
Turn your PDF publications into a flip-book with our unique Google optimized e-Paper software.
Air Force Munitions ISO <strong>Management</strong><br />
Strategic Energy Lessons<br />
Integrating Air and Ground<br />
Enterprise Architecture<br />
Transforming Army Supply Chains<br />
Leaning the DoD Supply Chain<br />
also in in this this edition:<br />
Air Force Journal of <strong>Logistics</strong> Annual<br />
http://www.aflma.hq.af.mil/lgj/Afjlhome.html<br />
<strong>Vol</strong>ume XXXII,<br />
Number 4 and<br />
Journal Annual,<br />
<strong>Vol</strong>ume XXXIII,<br />
Number 1
<strong>Vol</strong>ume XXXII, Number 4 and Journal Annual, <strong>Vol</strong>umen XXXIII, Number 1 <strong>AF</strong>RP 25-1<br />
THINKING ABOUT LOGISTICS FEATURED ARTICLES<br />
2 Air Force Munitions ISO <strong>Management</strong>: <strong>Logistics</strong> Enterprise<br />
for Containers<br />
Edward O. Bennett Jr, Senior Master Sergeant, US<strong>AF</strong><br />
8 Strategic Energy Lessons: A Historical Perspective Applied<br />
to America’s Oil Source Issues<br />
Michael E. Puckett, US<strong>AF</strong><br />
24 Integrating Air and Ground<br />
David Anderson, DBA, Army Command and Staff College<br />
Timothy W. Gillaspie, Major, US<strong>AF</strong><br />
21st CENTURY LOGISTICS CHALLENGES<br />
38 Transforming the Aircraft Inspection Process<br />
Donald A. Van Patten, Colonel, US<strong>AF</strong><br />
CONTEMPORARY ISSUES<br />
54 Enterprise Architecture: Origins, Tools, and Insights<br />
Alice Marie Long, Captain US<strong>AF</strong><br />
64 Transforming Army Supply Chains: An Analytical<br />
Architecture for <strong>Management</strong> Innovation<br />
Greg H. Parlier, PhD, Colonel, USA (Retired)<br />
78 Leaning the DoD Supply Chain: The DoD Activity<br />
Address Code<br />
Jay Barber, Global <strong>Logistics</strong> Support Center, US<strong>AF</strong><br />
Michael Werneke, Global <strong>Logistics</strong> Support Center, US<strong>AF</strong><br />
Kevin P. Duffy, PhD, Wright State University<br />
SPECIAL IN THIS EDITION<br />
89 Journal of <strong>Logistics</strong> Annual<br />
General <strong>No</strong>rton A. Schwartz<br />
Air Force Chief of Staff<br />
Deputy Chief of Staff, Installations,<br />
<strong>Logistics</strong>, and Mission Support<br />
Roger D. Golden, DPA<br />
Director<br />
Air Force <strong>Logistics</strong> <strong>Management</strong> <strong>Agency</strong><br />
Editor-in-Chief<br />
James C. Rainey<br />
Air Force <strong>Logistics</strong> <strong>Management</strong> <strong>Agency</strong><br />
Editor<br />
Cynthia J. Young<br />
Air Force <strong>Logistics</strong> <strong>Management</strong> <strong>Agency</strong><br />
Contributing Editor<br />
Roger D. Golden, DPA<br />
Air Force <strong>Logistics</strong> <strong>Management</strong> <strong>Agency</strong><br />
Journal Telephone Numbers - DSN 596-2335/2357 or Commercial (334) 416-2335/2357<br />
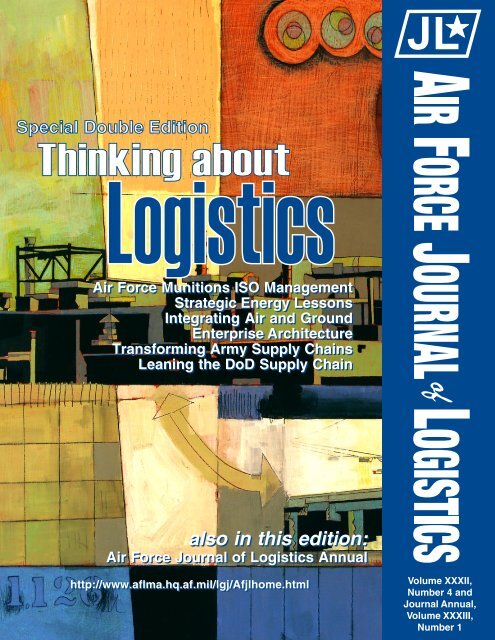
Cover artwork for this edition of the Journal was graciously supplied by Stephen Dickerson. Mr Dickerson is a full time<br />
visual artist living in Houston, Texas. His paintings balance an interest in the abstract elements of shape, line, and<br />
color with the narrative possibilities of recognizable objects. He shows his work regularly in galleries, shows and<br />
exhibitions.<br />
The cover art, Lateral Movement, is a painting about the numerous indirect movements required to complete a road<br />
trip from Houston to Chicago. The number in the lower left hand corner (1,126) is the distance from a certain industrial site<br />
in Chicago to exit 743 in west Houston (acrylic and pencil 24 x 24 inches).<br />
The Air Force Journal of <strong>Logistics</strong> (<strong>AF</strong>JL), published quarterly, is the professional logistics publication of the United States Air Force. It provides an open forum<br />
for presenting research, innovative thinking, and ideas and issues of concern to the entire Air Force logistics community. It is a nondirective publication. The<br />
views and opinions expressed in the Journal are those of the author and do not necessarily represent the established policy of the Department of Defense,<br />
Department of the Air Force, the Air Force <strong>Logistics</strong> <strong>Management</strong> <strong>Agency</strong>, or the organization where the author works.<br />
The Journal is a refereed journal. Manuscripts are subject to expert and peer review, internally and externally, to ensure technical competence, accuracy,<br />
reflection of existing policy, and proper regard for security.<br />
The publication of the Journal, as determined by the Secretary of the Air Force, is necessary in the transaction of the public business as required by the<br />
law of the department. The Secretary of the Air Force approved the use of funds to print the Journal, 17 July 1986, in accordance with applicable directives.<br />
US Government organizations should contact the <strong>AF</strong>JL editorial staff for ordering information: DSN 596-2335/2357 or Commercial (334) 416-2335/2357.<br />
Journal subscriptions are available through the Superintendent of Documents, US Government Printing Office, Washington DC 20402. Annual rates are<br />
$15.00 domestic and $18.75 outside the United States. Electronic versions of the Journal are available via the World Wide Web at: http://www.aflma.hq.af.mil/<br />
lgj/Afjlhome.html. The Journal editorial staff maintains a limited supply of back issues.<br />
Unsolicited manuscripts are welcome from any source (civilian or military). They should be from 1,500 to 5,500 words. The preferred method of submission<br />
is via electronic mail (e-mail) to: editor-<strong>AF</strong>JL@maxwell.af.mil. Manuscripts can also be submitted in hard copy. They should be addressed to the Air Force<br />
Journal of <strong>Logistics</strong>, 501 Ward Street, Maxwell <strong>AF</strong>B, Gunter Annex AL 36114-<strong>32</strong>36. If hard copy is sent, a zip disk or compact disk containing an electronic<br />
version of the manuscript should accompany it. Regardless of the method of submission, the basic manuscript should be in Microsoft Word or WordPerfect<br />
format, and all supporting tables, figures, graphs, or graphics must be provided in separate files (preferably created in Microsoft Office® products; if Microsoft<br />
Excel is used to create any of the charts or figures, the original Excel file must be supplied). They should not be embedded in the manuscript. All submissions<br />
will be edited in accordance with the <strong>AF</strong>JL submission guidelines.<br />
Articles in this edition may be reproduced in whole or in part without permission. If reproduced or reprinted, the courtesy line “Originally published in the Air<br />
Force Journal of <strong>Logistics</strong>” should be included.
Air Force Munitions ISO <strong>Management</strong>: <strong>Logistics</strong> Enterprise for Containers<br />
Strategic Energy Lessons: A Historical Perspective Applied to America’s Source Issues<br />
Integrating Air and Ground: Joint Theater Distribution System<br />
This speial double edition of the Journal<br />
presents three featured articles: “Air Force<br />
Munitions ISO <strong>Management</strong>: <strong>Logistics</strong><br />
Enterprise for Containers,” “Strategic Energy<br />
Lessons: A Historical Perspective Applied to<br />
America’s Source Issues,” and “Integrating Air<br />
and Ground: Joint Theater Distribution System.”<br />
In “Air Force Munitions ISO <strong>Management</strong>:<br />
<strong>Logistics</strong> Enterprise for Containers,” the author<br />
presents the results of an Air Force <strong>Logistics</strong><br />
<strong>Management</strong> <strong>Agency</strong> (<strong>AF</strong>LMA) analysis<br />
comparing the use of the common commercial<br />
ISO (International Organization for<br />
Standardization) pool to total ownership of ISO<br />
containers to meet Air Force contingency<br />
munitions needs. This article documents the<br />
relevant background information, problem,<br />
<strong>Vol</strong>ume XXXII, Number 4<br />
Oil is the lifeblood of war in our times. Without it a nation cannot<br />
fight. It is the basic munition. There is nothing else the deprivation<br />
of which would have so damaging an effect upon a country’s<br />
prospect of achieving victory. The loss of it would mean, indeed,<br />
the certainty of defeat. However great the reserve of manpower<br />
and machine-power, however ample the armaments that have<br />
been amassed, a nation could not hope for victory if it lacked the<br />
oil-power without which its men, its machines, and armaments<br />
would be immobilized and powerless.<br />
—James Molony Spaight, C.B., C.B.E., The War of Oil<br />
objectives, methodology, research, and findings<br />
associated with this effort.<br />
The second featured article investigates a<br />
past coal-to-liquids program (German efforts<br />
during WWII) to determine whether there are<br />
strategic lessons for the United States that can<br />
be applied to today’s energy situation, seen<br />
particularly from the perspective of national<br />
security.<br />
In the concluding article the authors make the<br />
case that a single command structure<br />
responsible for the movement control of the<br />
theater could better utilize available assets to<br />
meet mission requirements by selecting the<br />
mode that would be most effective for the<br />
mission.<br />
1
2<br />
Edward O. Bennett Jr, Senior Master Sergeant, US<strong>AF</strong><br />
Air Force Journal of <strong>Logistics</strong>
<strong>Vol</strong>ume XXXII, Number 4<br />
Introduction<br />
Since inception, the Air Force munitions Afloat<br />
Prepositioned Fleet (APF) has been, and will remain<br />
a key pillar of the Department of Defense (DoD)<br />
Global Force <strong>Management</strong> and prepositioning. The Global<br />
Force <strong>Management</strong> construct supplements prepositioned<br />
theater munitions with war reserve materiel (WRM) swing<br />
stocks to meet a variety of<br />
missions throughout multiple<br />
theaters. Prepositioning<br />
provides the bridge<br />
between the early warfighting<br />
requirements in a particular<br />
theater and the strategic<br />
mobility assets required to<br />
move these requirements. The<br />
primary purpose of Air Force<br />
munitions prepositioning is to provide responsive and<br />
effective agile combat support (ACS) by positioning<br />
munitions where the combatant commander (CCDR) needs<br />
them to accomplish the mission. 1<br />
The Air Force Munitions APF has undergone drastic<br />
changes over the last few years; specifically, going from a<br />
four-ship construct to a two-ship construct. Another change<br />
was allowing each CCDR to utilize both vessels for<br />
planning purposes. The transformation that APF has<br />
undergone was not only driven by fiscal realities but, more<br />
importantly, enhanced ACS will be provided to the CCDRs<br />
by enabling an end-to-end enterprise distribution system<br />
utilizing the inherent movement capacity of the APF. 2 This<br />
transformation caused an excess in International<br />
Organization for Standardization (ISO) containers<br />
throughout the major commands (MAJCOM) and the APF.<br />
Headquarters Air Force/A4MW, Munitions and Missile<br />
Maintenance Division, requested a study from the Air Force<br />
<strong>Logistics</strong> <strong>Management</strong> <strong>Agency</strong> (<strong>AF</strong>LMA) to recommend<br />
an economic strategy comparing the use of the common<br />
commercial ISO pool to total ownership of ISO containers<br />
to meet Air Force contingency munitions needs.<br />
Additionally, the <strong>AF</strong>LMA was asked to make<br />
recommendations that would effectively reduce APF<br />
excess ISO container investment. This article documents<br />
the relevant background information, problem, objectives,<br />
methodology, research, and findings associated with this<br />
effort. It concludes with recommendations to realize the<br />
cost savings associated with <strong>AF</strong>LMA’s findings.<br />
Let’s begin with some background on what ISO really<br />
means. ISO is the world’s largest developer and publisher<br />
of international standards for a large majority of products<br />
and services. ISO is a network of the national standards<br />
institutes of 157 countries, with one member per country.<br />
A central secretariat in Geneva, Switzerland coordinates<br />
the system. It is a nongovernmental organization that forms<br />
a bridge between the public and private sectors. On one<br />
hand, many of its member institutes are part of the<br />
governmental structure of their countries or are mandated<br />
by their government. On the other hand, other members<br />
have their roots uniquely in the private sector, having been<br />
3
Rapid response swing stocks are<br />
used to help fill the differences<br />
between the theater’s minimum<br />
munitions stockpile requirements and<br />
on-hand stocks.<br />
Currently, the Air Force has ownership of 5,428, 20foot<br />
ISO containers to support Afloat Prepositioned<br />
Fleet (APF), retrograde, and refresh operations. With<br />
APF operations now at a two-ship construct, the need for<br />
containers has been significantly reduced. Current operations<br />
would require 200 at each major depot: Tooele Army Depot,<br />
Crane Army Activity, Bluegrass Army Depot, and McAlester<br />
Army Ammunitions Plant. The two remaining vessels (MV<br />
Fisher and MV Bennett), will carry 1,301 containers, which<br />
includes the 391 empty containers currently loaded on the<br />
MV Bennett. Thirty containers will be kept at Kadena Air<br />
Base to carry out refresh operations and an additional 100<br />
at Military Ocean Terminal Sunny Point as spares. The total<br />
number of containers required to carry out these operations<br />
is approximately 2,231, a difference of 3,197 containers from<br />
current total ownership.<br />
Annual cost of repair for the current balance of 5,428 is<br />
approximately $52K annually. Reducing the on-hand number<br />
of containers to 2,231 would reduce the annual cost of repair<br />
to $22K annually, a savings of $30K. Excess containers,<br />
approximately 3,197, could then be transferred to the Army<br />
Intermodal Distribution Platform <strong>Management</strong> Office<br />
(AIDPMO) to be utilized by any Department of Defense (DoD)<br />
agency requiring these type containers. AIDPMO will pay<br />
for transportation costs to locations that possess the<br />
capability to inspect, repair, and maintain serviceable<br />
containers. AIDPMO will also accept unserviceable<br />
containers and transport them to a repair facility for<br />
inspection and repair. Containers deemed not repairable<br />
could be turned in to Defense Reutilization and Marketing<br />
Service for resale or scrap.<br />
AIDPMO has agreed to accept responsibility of all excess<br />
containers turned over to their agency to include all<br />
transportation costs. The APF and Air Force Materiel<br />
Command should coordinate this directly through AIDPMO.<br />
The DoD gain of the approximate 3,197 excess containers<br />
transferred from APF operations to AIDPMO will reduce the<br />
number of containers that the DoD currently leases, while<br />
creating significant cost avoidance for the Air Force. Since<br />
September 2006 the Air Force has leased 1,874 containers.<br />
With the additional 3,197 ISO containers turned in by APF<br />
4<br />
set up by national partnerships with industry associations.<br />
Therefore, ISO enables a consensus to be reached on solutions<br />
that meet both the requirements of business and the broader needs<br />
of society. 3<br />
These standards are used when selecting containers for<br />
transporting munitions over international waters, thereby<br />
conforming to worldwide safety standards.<br />
Since APF’s inception in 1997, there have been considerable<br />
changes to the APF structure. Fiscal realities and Pacific<br />
Command concerns prompted accelerated consideration of the<br />
two-ship APF construct. <strong>AF</strong>/A4MW conducted a detailed value<br />
analysis of APF costs and benefits and concluded that a two-ship<br />
APF fleet in the short-term is best served by Motor Vessel (MV)<br />
Fisher and MV Bennett. This analysis was validated by Military<br />
Sealift Command planners and <strong>AF</strong>/A4/7 (<strong>Logistics</strong> and<br />
Installations). The decision was made to take an additional APF<br />
vessel off-lease at the end of fiscal year (FY) 2008. The MV<br />
Chapman went off-lease in FY07. The MV Pitsenbarger<br />
discharged select assets in-theater, picked up retrograde, and<br />
sailed to the Military Ocean Terminal Sunny Point (MOTSU) and<br />
discharged in mid-September 2008. 4<br />
The US Air Force APF carries required munitions assets in a<br />
forward-based environment. This gives theater commanders<br />
greater deployment flexibility by reducing early munitions airlift<br />
requirements and allowing rapid movement from region to region<br />
as priorities or circumstances change. This supports the Air Force<br />
policy of global engagement, enabling quick response to needs<br />
of an engaged theater commander or an air component<br />
commander worldwide. Rapid response swing stocks are used to<br />
help fill the differences between the theater’s minimum munitions<br />
stockpile requirements and on-hand stocks. The APF program is<br />
a component of rapid swing stock. The APF weapons mix<br />
provides both bomber and tactical fighter support for a variety<br />
of missions. The APF program is part of the Global Asset<br />
Positioning program. From lessons learned in the Gulf War, the<br />
munitions community began working on ways to enhance port<br />
handling and intratheater transportation capabilities. The effort<br />
centered on the use of ISO 20-foot side opening containers to<br />
transport and store munitions earmarked for contingencies. To<br />
support this effort, the APF began working with Military Sealift<br />
Command to replace bulk cargo vessels with vessels capable of<br />
handling containerized munitions. 5<br />
The Air Force munitions logistics enterprise owns 5,428 ISO<br />
containers and treats them as WRM assets. These containers are<br />
prepositioned at various munitions hubs to load immediately to<br />
meet any global contingency tasking. The containers also<br />
represent a very large inventory investment that essentially<br />
doesn’t move except on infrequent occasions (see Figure 1). From<br />
a cost and effort perspective, should the Air Force continue to<br />
maintain ownership of intermodal ISO containers or use a lease<br />
option through the Army Intermodal Distribution Platform<br />
<strong>Management</strong> Office (AIDPMO)? What is the best course of action<br />
to deal with excess containers generated from the discharge of<br />
two APF vessels?<br />
Objectives<br />
This article will address the following objectives:<br />
Identify the major sources of costs associated with ISO<br />
container ownership and management with leasing options.<br />
Air Force Journal of <strong>Logistics</strong>
Identify areas to exploit cost savings by reducing inventory.<br />
Provide recommended changes to achieve cost savings.<br />
To the extent possible, quantify potential savings realized<br />
through the adoption of the recommended changes.<br />
Assumptions<br />
This article will assume the following:<br />
Data collected is accurate and complete.<br />
Historical data is representative of future operations.<br />
Methodology was based on personal interviews conducted by<br />
<strong>AF</strong>LMA with APF program management personnel, both past and<br />
present, via telephone and e-mail. Interviews were also conducted<br />
with AIDPMO, Air Force item managers, and equipment specialists<br />
associated with ISO containers. Summaries of the interview<br />
responses are given in this report. Container data is extracted from<br />
the Combat Ammunition System, Agile Munitions Support Tool,<br />
and Asset Inventory <strong>Management</strong> System.<br />
APF, 2,045, 38%<br />
ACP, 4, 0%<br />
CENTCOM, 561, 10%<br />
<strong>Vol</strong>ume XXXII, Number 4<br />
Research and Findings<br />
The discharge of the MV Chapman and the MV Pitsenbarger left<br />
an excess of approximately 3,100 Air Force-owned, 20-foot ISO<br />
containers throughout four MAJCOMs.<br />
This resulted in excess containers left static at numerous<br />
locations throughout the Air Force utilizing precious space,<br />
manpower, equipment, and consumables in an attempt to maintain<br />
serviceable containers. Required container certifications are not<br />
properly managed due to lack of qualified personnel at container<br />
locations and lack of funding to secure contractors. This has<br />
resulted in 643 unserviceable containers to date. 6 Locations with<br />
empty containers do not have certified personnel capable of<br />
inspecting or repairing current stocks.<br />
Future requirements for the MV Fisher and MV Bennett require<br />
approximately 910 containers. 7<br />
The lease cost for these containers is based on a maximum lease<br />
period of 5 years with an approximate cost of $3.3M for both vessels<br />
with container repair as part of the lease. This equates to $3,636<br />
per container over a 5-year period. The initial purchase cost of a<br />
single container is $6,684; 8 therefore two 5-year leases would<br />
exceed the original purchase price of a container. The cost required<br />
to manage and maintain all Air Force owned ISO containers, based<br />
Figure 1. ISO Distribution<br />
US<strong>AF</strong>E, 1,349, 25%<br />
PAC<strong>AF</strong>, 1,469, 27%<br />
to DoD stockpile (controlled by AIDPMO), leasing<br />
containers for munitions movements would be virtually<br />
eliminated.<br />
In accordance with Air Force instructions, units will<br />
maintain containers in serviceable condition for munitions<br />
redistribution or storage at all times. The Convention for<br />
Safe Containers certification on all Air Force-owned<br />
containers must be kept current. The cost to manage and<br />
maintain Air Force-owned ISO containers is minor<br />
compared to the cost of leasing containers to support these<br />
operations. It would be in the best interest of the Air Force<br />
to maintain total ownership of sufficient containers to<br />
support APF operations and any required retrograde. It is<br />
also recommended that the Air Force turn over all excess<br />
containers to AIDPMO to manage and maintain. This<br />
significantly reduces the storage space, manpower,<br />
equipment, and consumables required to maintain<br />
serviceable containers.<br />
By reducing the ISO container inventory by 57 percent<br />
the repair savings is approximately $150K over the first 5<br />
years. Additionally, transferring excess containers to<br />
AIDPMO will allow DoD to utilize over 3,000 ISO<br />
containers it would have otherwise had to lease<br />
commercially. Furthermore, maintaining ownership of<br />
containers required to support the APF mission will help<br />
provide responsive and effective ACS by allowing the<br />
flexibility total ownership provides and cost avoidance of<br />
approximately $16M.<br />
Article Acronyms<br />
ACS – Agile Combat Support<br />
<strong>AF</strong>LMA – Air Force <strong>Logistics</strong> <strong>Management</strong> <strong>Agency</strong><br />
<strong>AF</strong>MC – Air Force Materiel Command<br />
AIDPMO – Army Intermodal Distribution Platform<br />
<strong>Management</strong> Office<br />
AMST – Agile Munitions Support Tool<br />
APF – Afloat Prepositioned Fleet<br />
CENTCOM – Central Command<br />
CCDR – Combatant Commander<br />
DoD – Department of Defense<br />
FY – Fiscal Year<br />
ISO – International Organization for Standardization<br />
MAJCOM – Major Command<br />
MOTSU – Military Ocean Terminal Sunny Point<br />
MV – Motor Vessel<br />
PAC<strong>AF</strong> – Pacific Air Forces<br />
PEC – Program Element Code<br />
US – United States<br />
US<strong>AF</strong>E – United States Air Forces in Europe<br />
WRM – War Reserve Materiel<br />
5
on 2 years’ worth of data from the APF office equates to<br />
approximately $9K annually which is $45K over a 5-year period.<br />
This cost is primarily attributed to damage the containers may<br />
receive during loading and unloading operations. The vessels<br />
are climate controlled; therefore no additional weathering<br />
damage is incurred.<br />
6<br />
Conclusions and Recommendations<br />
Recommendations<br />
Currently, the Air Force has ownership of 5,428, 20-foot ISO<br />
containers to support APF, retrograde, and refresh operations.<br />
With APF operations now at a two-ship construct, the need for<br />
containers has been significantly reduced. Current operations<br />
would require 200 at each major depot: Tooele Army Depot,<br />
Crane Army Activity, Bluegrass Army Depot, and McAlester<br />
Army Ammunitions Plant. The two remaining vessels (MV Fisher<br />
and MV Bennett), will carry 1,301 containers, which includes<br />
the 391 empty containers currently loaded on the MV Bennett.<br />
Thirty containers will be kept at Kadena Air Base to carry out<br />
refresh operations and an additional 100 at MOTSU as spares. 9<br />
The total number of containers required to carry out these<br />
Location Container Quantity Required<br />
APF Ships, two 1,301<br />
Tooele 200<br />
Crane 200<br />
McAlester 200<br />
Bluegrass 200<br />
MOTSU 100<br />
Kadena 30<br />
Total 2,231<br />
Table 1. Containers Required for APF Mission<br />
Location of<br />
Container<br />
Quantity<br />
of<br />
Containers<br />
Purchased<br />
Cost<br />
operations is approximately 2,231, a difference of 3,197<br />
containers from current total ownership (see Table 1).<br />
Annual cost of repair for current balance of 5,428 is<br />
approximately $52K annually. 10 Reducing the on-hand number<br />
of containers to 2,231 would reduce the annual cost of repair to<br />
$22K annually, a savings of $30K. Excess containers,<br />
approximately 3,197, could then be transferred to AIDPMO to<br />
be utilized by any DoD agency requiring these type containers.<br />
AIDPMO will pay for transportation costs to locations that<br />
possess the capability to inspect, repair, and maintain serviceable<br />
containers. AIDPMO will also accept unserviceable containers<br />
and transport them to a repair facility for inspection and repair.<br />
Containers deemed not repairable could be turned in to Defense<br />
Reutilization and Marketing Service for resale or scrap. See Table<br />
2 for current container quantities, locations, serviceability, and<br />
associated value.<br />
AIDPMO has agreed to accept responsibility of all excess<br />
containers turned over to their agency to include all<br />
transportation costs. 11 The APF and Air Force Materiel Command<br />
should coordinate this directly through AIDPMO. The DoD gain<br />
of the approximate 3,197 excess containers transferred from APF<br />
operations to AIDPMO will reduce the number of containers that<br />
the DoD currently leases, while creating significant cost<br />
avoidance for the Air Force. Since September 2006 the Air Force<br />
has leased 1,874 containers. 12 With the additional 3,197 ISO<br />
containers turned in by APF to DoD stockpile (controlled by<br />
AIDPMO), leasing containers for munitions movements would<br />
be virtually eliminated.<br />
In accordance with Air Force instructions, units will maintain<br />
containers in serviceable condition for munitions redistribution<br />
or storage at all times. The Convention for Safe Containers<br />
certification on all Air Force-owned containers must be kept<br />
current. Maintenance, repair, and inspection of ISO containers<br />
is a program element code (PEC) 28030 expense (PEC 55396F<br />
for Air Force Reserve Command). 13 The cost to manage and<br />
Quantity<br />
Serviceable Purchased<br />
Cost<br />
Table 2. Breakout of Air Force Owned ISO Assets (data derived from AMST on 25 July 2008)<br />
Quantity<br />
Unserviceable Purchased<br />
Cost<br />
US<strong>AF</strong>E 1,349 $9,016,716 1,163 $7,773,492 186 $1,243,224<br />
APF/<strong>AF</strong>MC 2,045 $13,668,780 2,045 $13,668,780 0 $0<br />
PAC<strong>AF</strong> 1,469 $9,818,796 1,053 $7,038,252 416 $2,780,544<br />
ACP/<strong>AF</strong>MC 4 $26,736 4 $26,736 0 $0<br />
CENTCOM 561 $3,749,724 520 $3,475,680 41 $274,044<br />
Totals 5,428 $36,280,752 4,785 $31,982,940 643 $4,297,812<br />
Owned/Leased<br />
Air Force Owns<br />
Containers Cost 4<br />
Leased Cost 5<br />
Number of<br />
Years<br />
Ownership Cost Versus Lease Cost<br />
Per<br />
Container<br />
910 1<br />
Containers<br />
2,231 2<br />
Containers<br />
5,428 3<br />
Containers<br />
5 year $48.55 $44,180.50 $108,315.05 $263,529.40<br />
10 Year $97.10 $88,361.00 $216,630.10 $527,058.80<br />
5 Year $3,636.00 $3,308,760.00 $8,111,916.00 $19,736,208.00<br />
10 Year $7,270.00 $6,615,700.00 $16,223,8<strong>32</strong>.00 $39,461,560.00<br />
Table 3. Cost Comparison; <strong>No</strong>tes: 1 projected requirements for the MV Fisher and Bennett, 2 total number of containers to fully support<br />
APF missions, 3 current on-hand balance of containers, 4 Air Force owns containers and only needs to pay for maintenance and<br />
upkeep, and 5 leases containers from a commercial ISO pool and includes maintenance and upkeep<br />
Air Force Journal of <strong>Logistics</strong>
maintain Air Force-owned ISO containers is minor compared to<br />
the cost of leasing containers to support these operations. It would<br />
be in the best interest of the Air Force to maintain total ownership<br />
of sufficient containers to support APF operations and any<br />
required retrograde. It is also recommended that the Air Force<br />
turn over all excess containers to AIDPMO to manage and<br />
maintain. This significantly reduces the storage space,<br />
manpower, equipment, and consumables required to maintain<br />
serviceable containers. See Table 3 for owning versus leasing<br />
cost analysis breakdown.<br />
Benefits<br />
By reducing the ISO container inventory by 57 percent the repair<br />
savings is approximately $150K over the first 5 years.<br />
Additionally, transferring excess containers to AIDPMO will<br />
allow DoD to utilize over 3,000 ISO containers it would have<br />
otherwise had to lease commercially. Furthermore, maintaining<br />
ownership of containers required to support the APF mission will<br />
help provide responsive and effective ACS by allowing the<br />
flexibility total ownership provides and cost avoidance of<br />
approximately $16M.<br />
<strong>Vol</strong>ume XXXII, Number 4<br />
<strong>No</strong>tes<br />
1. FY2008–2019, US Air Force Directorate of Installations, <strong>Logistics</strong>,<br />
and Mission Support, Afloat Prepositioned Fleet Strategic Overview,<br />
(2008).<br />
2. Ibid.<br />
3. International Standards for Business, Government and Society,<br />
[Online] Available: International Organization for Standardization:<br />
http://www.iso.org/iso/about.htm, August 2008.<br />
4. Afloat Prepositioned Fleet Strategic Overview.<br />
5. 784 th Combat Sustainment Group, 505 th Combat Sustainment<br />
Squadron, Readiness Division, Afloat Prepositioned Fleet Battle book,<br />
(2008).<br />
6. US<strong>AF</strong> Combat Ammunitions System and Agile Munitions Support<br />
Tool, CAS and AMST.<br />
7. R. O’Conner, (July–August 2008), 2 d Lt, US<strong>AF</strong>, <strong>AF</strong>MC 505/CBSS/<br />
GBLA, OIC APF Operations, (E. Bennett, Interviewer).<br />
8 US<strong>AF</strong> Combat Ammunitions System and Agile Munitions Support<br />
Tool.<br />
9 R. O’Conner.<br />
10. Ibid.<br />
11. S. Gorba, (July–August 2008), Chief, Army Intermodal and<br />
Distribution Platform <strong>Management</strong> Office, (E. Bennett, Interviewer).<br />
12. D. Rumford, (July–August 2008), <strong>Logistics</strong> Analyst, III-SAIC,<br />
AIDPMO, (E. Bennett, Interviewer).<br />
13. <strong>AF</strong>I21-201, Conventional Munitions Maintenance <strong>Management</strong>, 23<br />
<strong>No</strong>v 2007.<br />
Senior Master Sergeant Edward O. Bennett Jr, is currently<br />
the Weapons Systems Superintendent for the Air Force<br />
<strong>Logistics</strong> <strong>Management</strong> <strong>Agency</strong> at Maxwell <strong>AF</strong>B, Gunter<br />
Annex, Alabama. Additionally, he occupies a key position<br />
in support of the Chief of Staff of the Air Force Title X and<br />
Joint wargames and is one of the Air Force <strong>Logistics</strong><br />
<strong>Management</strong> <strong>Agency</strong>’s Expeditionary Combat Support<br />
System focal points.<br />
Lots of organizations have catchy mottoes. Likewise, many have catchy vision statements. We do,<br />
too. But there’s a big difference—we deliver on what we promise. Generating Transformational<br />
Solutions Today; Focusing the <strong>Logistics</strong> Enterprise of the Future aren’t just words to us; they’re our<br />
organizational culture. We use a broad range of functional, analytical, and scientific expertise to<br />
produce innovative solutions to problems and design new or improved concepts, methods, systems,<br />
or policies that improve peacetime readiness and build war-winning logistics capabilities. Our key<br />
strength is our people. They’re all professionals from logistics functions, operational analysis<br />
sections, and computer programming shops. Virtually all of them have advanced degrees. But more<br />
important, virtually all of them have recent field experience. They’ve been there and done that. They<br />
have the kind of experience that lets us blend innovation and new technology with real-world<br />
common sense and moxie. Our special blend of problem-solving capabilities is available to every<br />
logistician in the Air Force.<br />
501 Ward Street<br />
Maxwell <strong>AF</strong>B, Gunter Annex,<br />
Alabama 36114-<strong>32</strong>36<br />
DSN: 596-4511<br />
Commercial: (334) 416-4511<br />
http://www.aflma.hq.af.mil<br />
7
8<br />
Extending hope and opportunity depends on a stable<br />
supply of energy that keeps America’s economy running<br />
and America’s environment clean. For too long our nation<br />
has been dependent on foreign oil. And this dependence<br />
leaves us more vulnerable<br />
to hostile regimes and to<br />
terrorists—who could cause huge<br />
disruptions of oil shipments, and<br />
raise the price of oil, and do great<br />
harm to our economy.<br />
—President George W.<br />
Bush, State of the Union Address, January 23, 20071 Introduction<br />
Energy is arguably the greatest national security issue<br />
for the United States (US). By late 2007, oil broke the<br />
$100 a barrel mark. Climate change is being blamed<br />
on ever increasing levels of energy usage, resulting in the<br />
inevitable conclusion that American national security strategy<br />
is being affected by long-term energy considerations. 2<br />
Energy was a major section of the President’s State of the<br />
Union speech in January 2007, where he outlined a proposal<br />
to reduce gasoline usage 20 percent in the next 10 years<br />
(Twenty in Ten). 3 This position was reemphasized in the 2008<br />
State of the Union. According to the US Department of<br />
Energy’s Annual Energy Outlook for 2008, oil prices are high<br />
enough to trigger the initiation of alternative energy<br />
processes in the $30 to $60 range (2006 dollars). These<br />
Air Force Journal of <strong>Logistics</strong>
<strong>Vol</strong>ume XXXII, Number 4<br />
Michael E. Puckett, US<strong>AF</strong><br />
9
Instead of debating what the<br />
parameters of a comprehensive<br />
energy security strategy should be,<br />
considerable time has been spent<br />
by the American government<br />
discussing the tactical details of<br />
industrial processes.<br />
This article will focus primarily on the issues<br />
surrounding replacing imported crude oil as the<br />
strategic imperative. Alternative or synthetic fuel<br />
manufacturing is not a novel approach. The technical<br />
work started nearly a century ago in Germany was<br />
advanced considerably in the period of 1924 to 1945.<br />
The United States’ own shortages in domestic oil<br />
sources indicate sufficient similarity of circumstances<br />
to warrant seriously considering the lessons to be<br />
learned from the German experience over 60 years<br />
ago. They are simple, but still viable in today’s world.<br />
10<br />
Recognize and admit you have a problem<br />
Commit to a course of action<br />
Support the existing developmental and technology<br />
efforts<br />
Emphasize conservation<br />
Establish a strategic framework focused on<br />
successful results<br />
When a comparison is made to the actions taken to<br />
date it indicated that America may have admitted it had<br />
a problem over 30 years ago, but has been very slow<br />
to commit to a long-term course of action to address<br />
the problem. The extensive current activity around<br />
biofuels is foundational, but the nation’s resources have<br />
not been sufficiently committed. Congressional funding<br />
does not appear to be robust enough to encourage the<br />
capital investment needed to ensure long-term success.<br />
The current administration’s efforts and those of<br />
Congress are a good start, but a start only. America<br />
imports nearly 66 percent of its petroleum needs every<br />
day. Biofuels will replace about 30 percent of current<br />
US petroleum consumption. The remaining 36 percent<br />
will have to be addressed as well—renewable sources<br />
may be preferred, but if those renewable sources are<br />
incapable of freeing the US from its imported oil<br />
include oil sands, ultra-heavy oils, gas-to-liquids, and coal-toliquids<br />
(CTL). 4 This article investigates a past CTL program to<br />
determine whether there are strategic lessons for the United States<br />
that can be applied to today’s energy situation, seen particularly<br />
from the perspective of national security.<br />
Given energy’s ability to touch everybody and everything in<br />
modern life, there are a myriad of topics to consider in the energy<br />
realm—social, economic, strategic, ecological, and political.<br />
Some are very personal, such as when people are told they may<br />
not be able to drive their favorite vehicle, or the prospect of a<br />
new energy production plant being considered for construction<br />
in the neighborhood. Energy issues also affect the ability of the<br />
state to project power in order to protect and defend its citizens<br />
or influence its relationships within the global community.<br />
Instead of debating what the parameters of a comprehensive<br />
energy security strategy should be, considerable time has been<br />
spent by the American government discussing the tactical details<br />
of industrial processes. Discussions today are reminiscent of the<br />
Japanese debate regarding the decision to attack Pearl Harbor—<br />
allowing the argument itself to divert from the central issue of<br />
“what should be done” to “how it should be done.” 5 The debate<br />
approach taken by America has allowed for recurring politicized<br />
arguments covering the same issues such as the oil peak question,<br />
greenhouse gas (CO 2 ) emissions, climate impacts, and economic<br />
impacts to local constituents.<br />
Meanwhile, the American and world economy continues to<br />
be affected by the surging price of oil. Energy prices have a direct<br />
impact on the consumer price index (CPI), and are a key cause of<br />
inflation. Long-term and sustained price increases impact other<br />
commodity prices and further impact the economy through a<br />
lagging effect on CPI inflation. Historically, the pressures of<br />
energy prices on aggregate prices in the economy have created<br />
problems for the economy as a whole, occasionally driving a<br />
downward adjustment to expected growth projections.<br />
Continued economic recession is a distinct possibility in the<br />
current economic climate due in part to the cost of oil. 6 According<br />
to the Energy Information <strong>Agency</strong>, a $25 per barrel increase in<br />
the price of crude oil results in a 1 percent drop in American Gross<br />
Domestic Product. The trade imbalance provides oil supplying<br />
countries potential leverage over US capital markets. Energy<br />
dependency influences foreign affairs and reduces American<br />
freedom of action; and it can empower countries such as Iran and<br />
Venezuela to pursue policies hostile to the US. 7 This dependency<br />
will be a continuing issue as the energy demands of China, India,<br />
and the rapidly industrializing third world continue to accelerate.<br />
US oil imports started exceeding oil production in the 1990s<br />
(see Figure 1). A General Accountability Office (GAO) report in<br />
February 2007 yet again articulated a policy perspective repeated<br />
from the Nixon administration on imports that in some respects<br />
dates back to Franklin Delano Roosevelt’s administration—the<br />
requirement for a cohesive approach to meeting the oil needs of<br />
the United States.<br />
With respect to the peak oil issue, the report stated the<br />
following:<br />
While the consequences of a peak would be felt globally, the United<br />
States, as the largest consumer of oil and one of the nations most<br />
heavily dependent on oil for transportation, may be particularly<br />
vulnerable. Therefore, to better prepare the United States for a peak<br />
and decline in oil production, we are recommending that the Secretary<br />
Air Force Journal of <strong>Logistics</strong>
of Energy take the lead, in coordination with other relevant federal<br />
agencies, to establish a peak oil strategy. Such a strategy should include<br />
efforts to reduce uncertainty about the timing of a peak in oil production<br />
and provide timely advice to Congress about cost-effective measures<br />
to mitigate the potential consequences of a peak. In commenting on a<br />
draft of the report, the Departments of Energy and the Interior generally<br />
agreed with the report and recommendations. 9<br />
From a strategic perspective it is irrelevant whether the oil peak<br />
is 1 or 10 years away. It is prudent for the US as the biggest global<br />
consumer to develop a policy to account for the issues that can be<br />
anticipated on the other side of peak oil, whenever it might come.<br />
Indeed one can take from the failure to find significant oil fields<br />
since the 1960s, combined with drastically increased demand in<br />
Asia, that the peak is now an academic point and strategically<br />
irrelevant in terms of justification for policy planning action.<br />
This article will focus primarily on the issues surrounding<br />
replacing imported crude oil as the strategic imperative. Alternative<br />
or synthetic fuel manufacturing is not a novel approach. The<br />
technical work started nearly a century ago in Germany was<br />
advanced considerably in the period of 1924 to 1945. It was<br />
strongly considered by the Allies both before and during the<br />
Second World War and actually used by the British at a Billingham<br />
plant to produce 100,000 tons of high quality synthetic gasoline<br />
a year for the Royal Air Force. 10 Much can be learned from the<br />
German experience which should be investigated when discussing<br />
any synthetic fuel approach to changing the source of US energy<br />
supplies.<br />
Put to one side the character of the Nazi regime and its atrocities.<br />
There is a great deal to be learned from some of the strategic<br />
decisions and the scientific or engineering accomplishments of<br />
German synthetic fuel programs. This study will therefore identify<br />
the German causes for action, examine the impact that action had<br />
on Germany’s ability to pursue its national goals and objectives,<br />
and outline several strategic lessons that can be applied to the<br />
current energy situation. It will then look at American policy efforts<br />
over the past few decades and compare those efforts to the lessons<br />
and observations regarding their effectiveness in meeting the needs<br />
of US energy policy. The huge difference in the political nature of<br />
the national system of wartime Germany and that of modern US<br />
government urge caution in such an analysis. This article seeks to<br />
learn from the German technical capabilities and the role of the<br />
state in planning and pursuing energy policy for strategic purposes.<br />
<strong>Vol</strong>ume XXXII, Number 4<br />
Assumptions<br />
The following assumptions are used in this article:<br />
Access to oil is the number 1 critical, strategic, and economic<br />
imperative of the United States.<br />
The United States is not self-sufficient in oil. Coal and nuclear<br />
fuel reserves exist for US use into the foreseeable future.<br />
Technical and ecological concerns in coal and nuclear power<br />
generation can be overcome with emerging technologies and<br />
processes.<br />
The worldwide oil peak is not an accurate trigger for action. The<br />
peak discussion is almost immaterial at this point. Oil reserve<br />
data is extremely questionable. 11 Worldwide demand is<br />
ballooning due to China, India, and the developing third world. 12<br />
Global oil demand is accelerating (see Figure 2).<br />
dependency, other methods are clearly available and<br />
in most cases commercially viable with today’s volatile<br />
oil prices. Also remaining are residential and<br />
commercial power issues and whether this will be<br />
addressed by clean-coal technology or by nuclear<br />
power stations.<br />
Timing is also an issue. The extended time frame<br />
being used with the current efforts, especially<br />
conservation, may only cover future growth in national<br />
energy demands. This means current plans would<br />
only preclude additional large crude oil import<br />
requirements—not necessarily drive import<br />
reductions in the near term. Building a new<br />
infrastructure for biomass based fuels may take some<br />
time, but conservation efforts in the transportation<br />
sector would be of greater immediate benefit. New<br />
corporate average fuel economy standards were<br />
overdue, but are not aggressive enough to be of any<br />
near-term assistance to alleviating oil importimbalance-driven<br />
inflation on America’s economy or<br />
improving national security.<br />
Finally, improving current processes, exploring<br />
other existing technologies, and developing new ones<br />
should be continued and nurtured. Biomass fuels<br />
need cheaper enzymes to help break down the<br />
cellulose for processing. Nanotechnology might be<br />
used to develop artificial enzymatic biomass factory<br />
processes to manufacture ethanol or other petroleum<br />
products. Some commercial use could be found for<br />
all the carbon dioxide to be produced by clean-coal<br />
technology. Other energy renewables such as wind,<br />
tidal, and solar show potential as the technology<br />
evolves.<br />
Article Acronyms<br />
C<strong>AF</strong>E – Corporate Average Fuel Economy<br />
CO – Carbon Dioxide<br />
2<br />
CPI – Consumer Price Index<br />
CTL – Coal-to-Liquids<br />
FT – Fischer Tropsch<br />
GAO – Government Accountability Office<br />
GWOT – Global War on Terror<br />
H.R. – House Resolution<br />
MYPP – Multi-Year Program Plan<br />
R&D – Research and Development<br />
STL – Solid-to-Liquid<br />
US – United States<br />
11
Million Barrels per Day<br />
12<br />
25<br />
20<br />
Consumption<br />
15<br />
10<br />
Production<br />
5<br />
Net Imports<br />
0<br />
1950 1960 1970 1980 1990 2000<br />
300<br />
History Projections<br />
250<br />
Liquids<br />
200<br />
150<br />
38%<br />
26%<br />
Coal<br />
Natural Gas<br />
100<br />
50<br />
23%<br />
7%<br />
Renewables<br />
6%<br />
Nuclear<br />
0<br />
1980 1985 1990 1995 2000 2005 2010 2015 2020 2025 2030<br />
Global warming and climate change is a real issue.<br />
Solid-to-liquid (STL) alternatives must be part of the energy<br />
supply solution. The technology is mature enough to be used<br />
as a midterm solution and then retained as part of a diverse<br />
energy policy. Continuity of supply is vital. STL does come<br />
at an environmental cost from a CO output perspective which<br />
2<br />
has to be addressed to achieve viability. An attempt at<br />
addressing this is in the recently signed Energy Independence<br />
and Security Act of 200714 and other pending legislation. 15<br />
The German<br />
Historical<br />
Perspective<br />
In the early years of the twentieth<br />
century, German scientists and<br />
engineers recognized that<br />
Germany’s energy requirements<br />
were changing for two reasons:<br />
1. Germany was becoming<br />
increasingly dependent on<br />
internal combustion engines<br />
and 2. Germany’s continuing<br />
industrialization and<br />
urbanization magnified the<br />
shortcomings of coal as an<br />
energy source. Petroleum was<br />
clearly the fuel of the future and<br />
Germany needed to ensure that<br />
it was never without it.<br />
Oil alternatives, such as shale oil/sand show promise, but they<br />
are beyond the scope of this investigation.<br />
Renewable energy is a better all-around, long-term solution.<br />
The technology and manufacturing processes are quickly<br />
evolving to both manufacture and utilize the resultant<br />
products in vehicles. At worst it is environmentally neutral<br />
with regard to atmospheric carbon emissions—essentially<br />
recycling existing carbon.<br />
Time terminology used: near-term, 3 to 5 years; midterm, 5 to<br />
10 years; long-term, greater than 10 years.<br />
16 The<br />
breakthrough came in 1914 with<br />
the development of a continuous<br />
hydrogenization of coal process<br />
by Frederich Bergius. The start of<br />
World War I revealed Germany’s<br />
critical need for petroleum as<br />
nearly all oil was imported.<br />
Bergius did attempt to establish<br />
a commercial hydrogenization<br />
facility at Rheinau during the<br />
period of 1915 to 1918, but<br />
technical start-up issues, along<br />
with Germany obtaining access<br />
to the Romanian oil fields<br />
resulted in minimizing the<br />
importance of converting coal<br />
to petroleum. The first<br />
hydrogenization plant was not<br />
completed until 1924 following<br />
research and development by<br />
Bergius and other German scientists. 17 Frederick Bergius and Carl<br />
Bosch received the <strong>No</strong>bel Prize in 1931 for their contributions<br />
to high-pressure methods in chemistry—a key methodology in<br />
hydrogenization’s success. 18<br />
Research and development did not stop with the success of<br />
Bergius’ method. During the 1920s and 1930s, another CTL<br />
petroleum process was developed in Germany by Franz Fischer<br />
and Hans Tropsch (FT)—the indirect synthesis of petroleum from<br />
carbon monoxide and hydrogen, known as the FT method. The<br />
two methods were not in direct competition, as coal<br />
hydrogenization was more advanced and better suited to high<br />
quality aviation and motor fuel, while the FT process gave high<br />
quality diesel, lubricating oil, waxes, and lower quality motor<br />
fuel. 19<br />
Figure 1. US Consumption, Production, and Imports of Oil, 1949-2005<br />
Following the First World War in the early 1930s, Germany<br />
was struggling with rebuilding its economy, suffering from the<br />
worldwide depression, and continued looking for alternatives<br />
that either limited or eliminated their dependency in imported<br />
resources. The Allied blockade and attacks on critical resources<br />
during the war had taught them how dependent they were for<br />
8<br />
Figure 2. World Marketed Energy Fuel Use by Fuel Type 1980-203013 Quadrillion Btu<br />
Air Force Journal of <strong>Logistics</strong>
critical materials such as oil. Increasing their concerns was an<br />
imbalance of trade, leaving them with a severe shortage of hard<br />
currency, and rumors that worldwide oil reserves were about to<br />
run out. 20 Germany was dependent on fuel imports for greater than<br />
90 percent of their national requirements. 21 They had a strategic<br />
problem of the first order.<br />
Onto the stage stepped Adolph Hitler. Obsessed with many<br />
things following the Great War, Hitler outlined his beliefs in his<br />
book Mein Kampf.<br />
The foreign policy of a People’s State must first of all bear in mind<br />
the duty of securing the existence of the race which is incorporated<br />
in this State. And this must be done by establishing a healthy and<br />
natural proportion between the number and growth of the population<br />
on the one hand and the extent and resources of the territory they<br />
inhabit, on the other. That balance must be such that it accords with<br />
the vital necessities of the people.<br />
What I call a healthy proportion is that in which the support of a<br />
people is guaranteed by the resources of its own soil and subsoil.<br />
Any situation which falls short of this condition is none the less<br />
unhealthy even though it may endure for centuries or even a thousand<br />
years. Sooner or later, this lack of proportion must of necessity lead<br />
to the decline or even annihilation of the people concerned. 22<br />
One of his eight key goals for Germany was identified as<br />
economic sufficiency through a large area autarky. 23 German selfsufficiency<br />
was not the goal.<br />
Sensible autarky called for a fundamental turn in foreign-trade<br />
policy; in the final analysis it implied that no more should be exported<br />
than was required for the importation of indispensable raw materials<br />
and foodstuffs and of such commodities as were ‘unavailable or<br />
available in insufficient measure’ or could not be manufactured in<br />
Germany in sufficient quantity. 24<br />
Hitler essentially wanted reciprocal-bilateral economic<br />
agreements with his trade partners to establish a barter<br />
mechanism—to eliminate trade imbalances creating hard cash<br />
issues. 25 The desire was for a friendly and neutral ring of trade<br />
partners within easy reach of Germany. Being close made it<br />
possible for the Nazis to easily reach out and negotiate with their<br />
military should a partner decide to terminate their trade agreement<br />
before Germany was ready to do so.<br />
The role of oil and fuel cannot be understated when talking<br />
about German and Nazi views regarding their national economy<br />
or their military plans for the future. Hitler was obsessed with<br />
oil. To Hitler, it was the vital commodity of the industrial age<br />
and for economic power. 26 The Germans had a large growing<br />
population and needed mechanical farming systems fueled by<br />
oil products to help feed them. They also knew they had a crucial<br />
need for oil products to rebuild and fuel German military forces<br />
for the upcoming struggle Hitler had planned to achieve his<br />
expansionist aims. The war of 1914 to 1918 taught him that it<br />
was imperative to have sufficient economic resources. In 1934,<br />
Hitler assigned Wilhelm Keppler, his personal economic advisor,<br />
to find replacements for imported resources. Keppler had been<br />
working closely with big business since Hitler’s rise to power,<br />
creating a working group known as the Keppler Circle whose<br />
task was to develop alternative economic programs. 27 The result<br />
was the inclusion in a Secret Four Year Plan memorandum of a<br />
strategic objective to increase domestic mineral oil production<br />
to self sufficiency within 18 months and to satisfy lubricant<br />
requirements by processing coal. 28<br />
<strong>Vol</strong>ume XXXII, Number 4<br />
The Nazis never quite reached the 3.8M ton goal they set for<br />
themselves as can be seen in Table 1. 30 Contrary to the almost<br />
mythological stories of Teutonic efficiency, the Germans were<br />
not a totalitarian state in regard to everything in their economy.<br />
The business economy was capitalistic in nature, although<br />
strongly monitored, encouraged and incentivized by supportive<br />
government contracts.<br />
The economic system introduced step by step after 1933 may be<br />
assigned to the ‘guided-market economy’ or ‘organized capitalism’<br />
type: the state set the economic goals, it laid down the economic<br />
priorities, it even acted on a considerable scale as the customer, i.e.<br />
generally as a directing agency, while entrepreneurs managed their<br />
business on their own responsibility in line with the state’s directives.<br />
The National Socialists felt under an obligation to ‘observe the<br />
intrinsic laws of all economic matters’ because they feared that any<br />
violation of these might have to be paid for dearly in economic<br />
terms. 31<br />
By the time the war started in 1939, the incentives allowed<br />
the development of an additional 14 FT and Bergius plants, with<br />
6 more under construction. <strong>32</strong> These plants provided a key edge<br />
to the German economy and to the Luftwaffe in particular. 33<br />
About 95 percent of Germany’s total aviation gasoline for the<br />
Luftwaffe was provided by the Bergius hydrogenization plants<br />
during the war. Without them the Luftwaffe could not have gotten<br />
off the ground. 34 Toward the end of the war, these plants were<br />
key in keeping Germany in the war. By 1943, synthetic fuel<br />
production had doubled from 1942 levels, producing 124K<br />
barrels a day. By early 1944 it was providing 57 percent of the<br />
total oil supply and 92 percent of aviation fuel. All told,<br />
synthetic fuels would account for half of all of Germany’s oil<br />
production. 35<br />
Another interesting myth regards Germany’s total war effort;<br />
namely that they sacrificed everything for the fatherland. During<br />
the war, all the Allies made this assumption because of their own<br />
conservation efforts. While some sacrifices were made by the<br />
Germans, analysis after the war revealed a very different picture.<br />
Germany did not fight a total war; despite all the propaganda talk,<br />
she made no serious attempt to exploit her own war potential fully,<br />
except perhaps for a brief period in August and September 1944,<br />
when it was too late to be of any consequence. Whatever<br />
ruthlessness she may have shown towards vanquished enemies,<br />
there is no evidence of ruthless sacrifices having been imposed upon<br />
her own people for the sake of victory; in terms of the thoroughness<br />
of the war effort, Germany lagged well behind not only Britain or<br />
Russia in the present war, but also behind her own showing in the<br />
First World War. Whatever else may be said about the German<br />
economy it certainly was not totalitarian. 36<br />
Some of the potential to conserve can be seen in the split<br />
between civilian and military consumption (see Table 2). The<br />
military would never have been given 100 percent, as some<br />
amount is always needed in the logistical tail supporting<br />
production and transportation, not to mention essential civilian<br />
Years<br />
Tons (millions)<br />
1939 1,091.8<br />
1940 1,430.2<br />
1941 1,994.0<br />
1942 2,603.2<br />
1943 2,913.7<br />
1944 1.673.4<br />
Table 1. German Synthetic Oil Production 1939-1944 29<br />
13
usage. <strong>No</strong>netheless, there was a considerable amount available<br />
to further bolster the military war machine in its strategic and<br />
operational efforts. It can only be imagined what Germany would<br />
have done and what battles could have been changed with more<br />
fuel for its blitzkrieg style of warfare. The military constantly<br />
adjusted its pattern of behavior and consumption to match the<br />
available fuel supply situation of the moment. This meant<br />
reducing its usage of fully motorized units and heavy bomber<br />
forces, thus reducing its strategic and operational capability. 38<br />
Destruction of Germany’s oil production capability played a<br />
crucial role in the demise of the Third Reich. Once the Allies<br />
had destroyed much of the German airpower, it turned its<br />
attention to oil production facilities, making them a priority<br />
target. Starting in April 1944, the attacks grew. On May 12, the<br />
Eighth Air Force attack with 935 planes hit the fuel plants in<br />
central and eastern Germany. The bombing results rocked the<br />
Nazi production czar Albert Speer. “The enemy has struck us at<br />
one of our weakest points. If they persist at it this time, we will<br />
soon no longer have any fuel production worth mentioning. Our<br />
one hope is that the other side has an Air Force staff as<br />
scatterbrained as ours!” 39 On June 8, 1944, attacks on the German<br />
oil industry commenced with a vengeance when General Carl A.<br />
Spaatz sent his historic cable to his Air Force commanders:<br />
“Primary strategic aim of US Strategic Air Forces is now to deny<br />
oil to enemy air forces.” 40 German synthetic production dropped<br />
from its average 316K ton monthly production before the start<br />
of Allied bombing in April 1944 to 5K tons in September. 41 The<br />
loss of fuel during this time period seriously hampered everything<br />
from pilot training to the movement of Panzer divisions in the<br />
field. “[Speer’s] visit to the Ruhr during early <strong>No</strong>vember, coming<br />
on the heels of a new wave of allied air strikes against Germany’s<br />
synthetic fuel plants and its railways and canals, rocked his<br />
confidence.” 42 By December, Albert Speer, the Nazi Minister of<br />
Armaments, stated that the fuel shortage had reached catastrophic<br />
proportions. The lack of fuel continued hampering the German<br />
army for the rest of the war, debilitating their ability to either<br />
attack (Battle of the Bulge) or defend (Baronov bridgehead at<br />
the Vistula). 43 After the surrender, Field Marshal Milch stated “If<br />
the synthetic oil plants had been attacked 6 months earlier<br />
Germany would have been defeated 6 months earlier.” 44<br />
The Allies saw synthetic fuel as so vital to Germany’s ability<br />
to wage war that German synthetic fuel production was<br />
prohibited by the Potsdam Conference on 16 July 1945. 45 Fuel<br />
processing facilities were a critical vulnerability for Germany’s<br />
support of its center of gravity—the Wehrmacht. 46 The<br />
14<br />
Years<br />
Gross-<br />
Deutschland<br />
and<br />
Occupied<br />
Countries*<br />
Production<br />
(000 tons)<br />
Total<br />
German<br />
Consumption<br />
(000 tons)<br />
Portion<br />
Used by<br />
Armed<br />
Forces<br />
(000 tons)<br />
1049 3,963 5,856 3,005<br />
1941 4,839 7,305 4,567<br />
1942 5,520 6,483 4,410<br />
1943 6,563 6,971 4,762<br />
1944 4,684 - -<br />
* does not include the Axis satellites, such as Romania<br />
Table 2. German Petroleum Production and Use 1940-1944 37<br />
investment in synthetic fuels undertaken by Germany allowed<br />
it to continue fighting years longer than reasonably expected<br />
for such an isolated and resource poor nation.<br />
Strategic Lessons<br />
There are five key lessons that can be learned from the German<br />
experience. They should be recognized as paramount to<br />
developing an alternate energy strategy.<br />
1. Recognize and admit you have a problem. The earlier the<br />
better, especially if technology is involved. It takes time for<br />
a new technology to mature to the point where it is both<br />
dependable and economically viable.<br />
It became apparent to Frederich Bergius and others at the start<br />
of World War I that oil and oil products were becoming a<br />
necessity for the machines of modern warfare. Bergius came to<br />
the conclusion that his coal hydrogenization process would<br />
address this critical requirement. As a result, he organized a group<br />
of investors to start commercial development. As noted earlier,<br />
technical difficulties, gaining access to the Romanian oil fields,<br />
and the end of the war prevented this enterprise from succeeding<br />
during the war. 47<br />
As Hitler came to power in 19<strong>32</strong>, a discussion with I. G. Farben<br />
(who controlled Bergius’ hydrogenization process) brought the<br />
availability of a German domestic oil alternative to his attention.<br />
He immediately grasped the impact to his center of gravity—the<br />
Wehrmacht. Synthetic fuel production became one of the<br />
keystones of German economic plans between 1936 and 1945. 48<br />
Hydrogenization and the FT process both had sufficient time<br />
to develop and mature into viable commercial processes, capable<br />
of having a national strategic impact. Early problem recognition<br />
allowed this to occur.<br />
2. Commit to a course of action. General George Patton’s famous<br />
quote “A good plan violently executed now is better than a<br />
perfect plan executed next week” 49 could not be more true.<br />
Waiting until you are having a perfect plan to deal with an<br />
emergency before you take action will obviously put you<br />
behind the power curve. When a process must be done on a<br />
large commercial scale, it requires considerable capital<br />
investment and may take several years to build. Spending time<br />
arguing over the benefits of any particular technology is time<br />
wasted.<br />
Hitler’s 19<strong>32</strong> commitment to commercial synthetic oil<br />
development was critical in the construction of 14 plants by<br />
September 1939 (6 more under construction). Were the processes<br />
involved perfect? Far from it! They were very inefficient using<br />
about 5 tons of hard coal or 10 tons of lignite to produce 1 ton of<br />
synthetic fuel. 50 More importantly, the processes worked on a<br />
commercial scale (Germany had plenty of coal). The synthetic<br />
fuel plants were vital to the German war economy supporting<br />
the Wehrmacht and Blitzkrieg. Blitzkrieg was a new warfare<br />
concept built on mechanical speed to outmaneuver its often<br />
numerically superior opponents, striking a knockout blow before<br />
their enemy was prepared. 51<br />
Before invading Russia in 1941, sufficient fuel reserves were<br />
available to allow the German military significant freedom of<br />
action and maneuver. As the war progressed, Allied attention<br />
began to focus more and more on the oil resource areas. When<br />
Air Force Journal of <strong>Logistics</strong>
Germany started losing the ability to maneuver freely due to lack<br />
of fuel, they lost their ability to take tactical advantage of a given<br />
set of circumstances. Oil became a critical limiting factor.<br />
Without the additional operational capability that 11,706.3M<br />
tons 52 of synthetic fuel brought to the German war machine from<br />
1939 to 1944, the war could arguably have been over much<br />
sooner.<br />
3. Support existing developmental and technology efforts.<br />
Everybody looks for the silver bullet to solve their problem—<br />
that one thing that makes the problem disappear. Mankind<br />
has been lucky with two energy sources—coal and oil. Both<br />
have worked in a fairly universal manner to meet mankind’s<br />
energy needs in many ways. Future developments may not<br />
be so universal, but that is not necessarily bad. It just requires<br />
adaptation to what works for a particular set of circumstances.<br />
Just as the Germans supported both the FT and<br />
hydrogenization in their quest to replace oil, the US should<br />
support multiple solution alternatives. Encouraging multiple<br />
techniques simplifies goal achievement by allowing a simpler<br />
technique to satisfy a simpler requirement. It diversifies the risk<br />
by isolating the possibility of failure to individual processes.<br />
Finally, diversification allows for increased opportunities to<br />
identify and implement tailored process efficiencies for a<br />
particular energy product.<br />
The Germans did not launch a program to find a single<br />
replacement for oil. They moved forward from where they found<br />
themselves, taking advantage of both FT and hydrogenization<br />
processes to meet their strategic needs. Sounding similar in<br />
capability, the processes were actually complementary in that<br />
hydrogenization was better suited to the manufacture of high<br />
octane aviation fuel and FT for diesel and heavier petroleum<br />
products. 53 Each supported a highly important niche for the<br />
German Wehrmacht—aviation fuel for the Luftwaffe and diesel<br />
for the Panzer divisions and general transportation.<br />
4. Conservation can make a difference. Conservation is<br />
recognized by most experts as the first course of action to<br />
increase availability of any scarce resource. It is usually the<br />
only alternative that can have nearly immediate results. In the<br />
short-term, rationing is typically the instrument used—ration<br />
books, limiting use to key people and industries, or some type<br />
of luxury tax. Long-term solutions to stretch existing supply<br />
levels or reduce overall consumption levels are usually<br />
associated with finding more efficient ways to utilize the<br />
resource or limit (or eliminate) the need for the resource.<br />
Germany did not seriously begin considering conservation<br />
until 1942. 54 Considerably more fuel could have been made<br />
available to the German military (see Table 2). Some was<br />
certainly needed for military support infrastructure, but more<br />
could have been made available for direct military operations.<br />
Studying the German fuel picture during World War II is<br />
fascinating. At most points in time, they never had more than a<br />
few months strategic reserve. Captured fuel from countries such<br />
as France (785K tons) and purchased fuel from their allies such<br />
as Russia (900K tons with the 1939 pact) allowed them to take<br />
the next operational or tactical step. 55 The Germans lived just<br />
ahead of their oil demand curve all through the war. Hitler did<br />
not believe in the necessity of stockpiling and “emphatically<br />
demanded that full economic mobilization should neglect long-<br />
<strong>Vol</strong>ume XXXII, Number 4<br />
term stockpiling and confine itself to sufficient armaments,<br />
equipment, and food supplies.” 56 Hitler did not expect to fight a<br />
protracted war, but a series of small ones—if he could not<br />
intimidate his opponents by military threats alone. 57 The<br />
Wehrmacht also learned to live with this shortage, taking it into<br />
account in their tactical and strategic battle planning as any army<br />
would do. Although subject to much speculation, the lack of<br />
readily available fuel has to be assumed to have resulted in missed<br />
opportunities for battlefield success.<br />
The situation changed in 1941 with the German attack on Russia,<br />
an attack launched with the objective of obtaining the Russian oil<br />
resources for Germany. This attack failed mainly because of the<br />
slender nature of the German liquid combustible resources which<br />
only allowed for the concentration of three and a half million<br />
Germans for the initial attack. Had the Germans had the means in<br />
1941 to throw against the Soviet Union at least 5 million men with<br />
their equipment, the German campaign in Russia in 1941, given the<br />
almost total Russian unpreparedness for the attack, would have<br />
achieved its purpose (another short war). 58<br />
The US is a major oil consumer with very (energy) inefficient<br />
cars and houses. American oil consumption history shows the<br />
effect of conservation after the start of corporate average fuel<br />
economy (C<strong>AF</strong>E) vehicle mileage standards in 1975. By about<br />
1983 (see Figure 1), just a few years after the start of C<strong>AF</strong>E<br />
requirements, a 20 to 25 percent reduction in consumption was<br />
achieved. Unfortunately, this success was not followed by<br />
additional conservation accomplishments because of a lack of<br />
political support for continued C<strong>AF</strong>E mileage reductions. 59<br />
5. Establish a strategic framework focused on successful results.<br />
It is easy to get lost in the details, such as discussing how a<br />
technology works, arguing pros and cons, arguing the benefits<br />
or lack thereof for a particular constituency, location, or<br />
industry. It is just as easy when the next new technology or<br />
process comes along to repeat the same discussions all over<br />
again—hopefully reaching new decisions that do not<br />
contradict earlier efforts. What is more difficult, yet more<br />
beneficial, is developing and implementing a strategic<br />
framework focused on the desired results, not a desired<br />
technology. As an example, this framework must contain the<br />
following:<br />
Identify the desired outcomes: internally sourced,<br />
renewable fuels<br />
Establish desired control limits or mechanisms: minimized<br />
CO 2 emissions<br />
Cultivate emerging technologies, encouraging source and<br />
process diversity: invest in research and development—<br />
multiple specialized processes for multiple materials<br />
Nurture initial life cycle start-up success with economic<br />
support: research and development grants, tax incentives,<br />
purchase guarantees<br />
Because of the economic and wartime nature of their oil<br />
requirement, Nazi Germany did not recognize the need for several<br />
of the elements of this framework. They were not concerned about<br />
the environment and, although cost was an issue, they recognized<br />
that Germany needed an internal source of oil. Further, higher<br />
than competitive costs within Germany helped with their balance<br />
of trade (hard currency) issues and assured a fuel supply in time<br />
of war or conflict.<br />
15
16<br />
Current US Energy Efforts<br />
What has the US done to reduce its strategic dependency on<br />
foreign oil? The first significant national activity occurred after<br />
the 1973 Arab oil embargo. A public car mileage framework was<br />
established under C<strong>AF</strong>E standards in 1975. This did achieve<br />
improvements in overall consumption as was noted earlier, but<br />
continuing progress was not achieved after 1984. Congress did<br />
not require additional increases in vehicle mileage until 2008. 60<br />
Overall consumption has continued to rise.<br />
President Bush’s administration has been formulating energy<br />
policy and supporting legislation since early in his first term.<br />
The President released his energy policy in 2001 and it included<br />
three principles:<br />
The policy is a long-term, comprehensive strategy. Our energy<br />
crisis has been years in the making, and will take years to put<br />
fully behind us.<br />
The policy will advance new, environmentally friendly<br />
technologies to increase energy supplies and encourage<br />
cleaner, more efficient energy use.<br />
The policy seeks to raise the living standards of the American<br />
people, recognizing that to do so our country must fully<br />
integrate its energy, environmental, and economic policies. 61<br />
The energy effort slowed down after 11 September 2001 as<br />
the United States found itself embroiled in the Global War on<br />
Terror (GWOT). Although Congress did try to develop energy<br />
bills in 2002 and 2003, the nation’s focus was on the GWOT and<br />
the US-led invasion of Iraq. The bills died in conference before<br />
being offered to Congress for their consideration and the effort<br />
had to start over.<br />
In 2005, Congress did pass a fairly comprehensive energy bill<br />
which was signed into law by President Bush on August 8 th . The<br />
bill which provides for $88.9B over 10 years 62 was primarily<br />
focused on continued use of fossil fuels, but it did include several<br />
provisions totaling nearly $13.8B regarding the area of renewable<br />
fuels, including about $5.3B for hydrogen-related production<br />
research. Although some provision was made for fuel efficiency<br />
tax credits, the bill failed to strengthen fuel economy standards<br />
(C<strong>AF</strong>E). It has been noted by the Union of Concerned Scientists<br />
that this decision will increase US gas consumption by 10 billion<br />
gallons through 2015 and will ironically wipe out the gains to<br />
be realized by the President’s proposed changes to the fuel<br />
economy regulation. 63<br />
The President continued to push energy in his 2006 State of<br />
the Union address with the Advanced Energy Initiative proposal.<br />
This initiative called for reduced dependence on foreign energy,<br />
improvement in energy efficiency, and enhanced energy security<br />
by changing the way America fuels its vehicles. 64 The Initiative’s<br />
goals covered vehicles and homes-business energy usage.<br />
Fueling Our Vehicles<br />
Develop advanced battery technologies that will allow a plugin<br />
hybrid-electric vehicle to have a 40-mile range operating<br />
solely on battery charge<br />
Foster the breakthrough technologies needed to make<br />
cellulosic ethanol cost-competitive with corn-based ethanol<br />
by 2012<br />
Accelerate progress towards the President’s goal of enabling<br />
large numbers of Americans to choose hydrogen fuel cell<br />
vehicles by 2020<br />
Powering Our Homes and Businesses<br />
Complete the President’s commitment to $2B in clean coal<br />
technology research funding, and move the resulting<br />
innovations into the marketplace<br />
Develop a new Global Nuclear Energy Partnership to address<br />
spent nuclear fuel, eliminate proliferation risks, and expand<br />
the promise of clean, reliable, and affordable nuclear energy<br />
Reduce the cost of solar photovoltaic technologies so that<br />
they become cost-competitive by 2015, and expand access<br />
to wind energy through technology 65<br />
This initiative was followed in early 2007 with Executive<br />
Order 13423, mandating US agencies to decrease petroleum<br />
consumption 2 percent each year through 2015 and increase<br />
alternative fuel use by 10 percent each year. At the 2007 State of<br />
the Union speech, the President announced his 20 in 10 goal.<br />
Recognizing America’s addiction to oil, he asked that the US<br />
reduce its gasoline use by 20 percent over the next 10 years. 66 A<br />
major part of the program is to increase the supply of renewable<br />
and alternative fuels by 35 billion gallons per year by 2017. The<br />
effort includes additional requests for research and development<br />
funding to evaluate the Biomass Program and intermediate<br />
ethanol-gasoline blends such as E15 (15 percent ethanol) and<br />
E20 (20 percent ethanol) to accelerate gasoline displacement. 67<br />
The President continued pushing the Energy Security<br />
Program with his 2008 budget submission. His request to<br />
Congress included provisions for alternative fuels for cars and<br />
trucks, improving and reforming C<strong>AF</strong>E standards, accelerating<br />
the Advanced Energy Initiative, expanding the Strategic<br />
Petroleum Reserve, accelerating the American Competitiveness<br />
Initiative (supports basic research to enable future technology<br />
breakthroughs), and strengthening American nuclear weapons<br />
storage and nonproliferation capabilities. 68<br />
In <strong>No</strong>vember 2007, The US Department of Energy’s Energy<br />
Efficiency and Renewable Energy Division, Office of the Biomass<br />
Program, released a comprehensive plan regarding the<br />
development of a renewable energy source, the “Biomass Multi-<br />
Year Program Plan.” The comprehensive nature of the plan<br />
should not be understated. It covers all aspects from production<br />
of feedstocks (raw material inputs), feedstock logistics, biofuel<br />
production, distribution, and biofuels end use technologies.<br />
The approach pictured in Figure 3 allows for a lot of flexibility<br />
and diversity of use, yet each supply chain element must be<br />
addressed to meet the target outcomes. Each element is<br />
summarized as follows:<br />
Feedstock Production. Produce large, sustainable supplies of<br />
regionally available biomass<br />
Feedstock <strong>Logistics</strong>. Implement cost-effective biomass<br />
feedstock infrastructure, equipment, and systems (biomass<br />
harvesting, collection, storage, preprocessing and<br />
transportation)<br />
Biofuels Production. Deploy cost-effective, integrated,<br />
biomass-to-biofuels conversion facilities<br />
Biofuels Distribution. Implement biofuels distribution<br />
infrastructure (storage, blending, transportation, and<br />
dispensing)<br />
Biofuels End Use. Expand public availability of biofuelscompatible<br />
vehicles offering the same performance as vehicles<br />
using traditional fuels 70<br />
Air Force Journal of <strong>Logistics</strong>
Feedstock Feedstock Biofuels Biofuels Biofuels<br />
Production <strong>Logistics</strong><br />
Production Distribution End Use<br />
What might seem to be government overkill in such a<br />
comprehensive plan is, in this writer’s opinion, a well thought<br />
out approach to covering all the critical aspects of standing up a<br />
new, emerging fuel source to start replacing a highly entrenched<br />
supply and utilization chain for imported oil related products.<br />
As noted in the Multi-Year Program Plan’s (MYPP) executive<br />
summary:<br />
This approach ensures development of required technological<br />
foundation, leaves room for pursuing solutions to technical barriers<br />
as they emerge, enables demonstration activities that are critical to<br />
proof of performance, and lays the groundwork for future<br />
commercialization without competing with or duplicating work in<br />
the private sector. The plan addresses important technological<br />
advances to produce biofuels, as well as the underlying infrastructure<br />
needed to ensure that feedstocks are available and the products can<br />
be distributed safely with the quality and performance demanded<br />
by end consumers.<br />
The Biomass Program’s MYPP is designed to allow the program<br />
to progressively enable increasing amounts of biofuels, bioproducts,<br />
and biopower to be deployed across the nation from a widening<br />
array of feedstocks. This approach will not only have a significant<br />
impact on oil displacement at the earliest opportunity, but will also<br />
facilitate the paradigm shift to renewable, sustainable energy in the<br />
long-term. 71<br />
December 2007 saw considerable energy related activity in<br />
the US capital. The House of Representatives initiated House<br />
Resolution (H.R. 6), a bill that would have considerable impact<br />
on the US energy source structure and which supported many of<br />
the President’s biofuel efforts. But, proposed financing for the<br />
effort would come from seriously restructuring current tax law<br />
to tax American oil companies at a higher rate, due to the very<br />
high profit level they have been experiencing in recent years. It<br />
also proposed a Renewable Energy Portfolio Standard (RPS) that<br />
required electric utilities to provide a minimum amount of<br />
electricity from renewable energy resources—15 percent by<br />
2020. While the President mostly welcomed the proposed bill,<br />
he would not support such changes. The Senate, through Senate<br />
Amendment 3850, designed a compromise essentially<br />
eliminating both oil company taxation and the RPS to ensure<br />
the bill was not vetoed by the President. The House approved<br />
the Senate bill on 18 December 2007 and the President signed<br />
the bill into law (Public Law 110-140) on 19 December 2007.<br />
The highlights of key provisions enacted into law are as<br />
follows:<br />
Corporate Average Fuel Economy (C<strong>AF</strong>E). The law sets a<br />
target of 35 miles per gallon for the combined fleet of cars<br />
and light trucks by model year 2020.<br />
Renewable Fuels Standard. The law sets a modified standard<br />
that starts at 9 billion gallons in 2008 and rises to 36 billion<br />
gallons by 2022.<br />
Energy Efficiency Equipment Standards. The adopted bill<br />
includes a variety of new standards for lighting and for<br />
residential and commercial appliance equipment. The<br />
<strong>Vol</strong>ume XXXII, Number 4<br />
Figure 3. Biomass to Biofuels Supply Chain 69<br />
equipment includes residential refrigerators, freezers,<br />
refrigerator-freezers, metal halide lamps, and commercial<br />
walk-in coolers and freezers.<br />
Repeal of Oil and Gas Tax Incentives. The enacted law<br />
includes repeal of two tax subsidies in order to offset the<br />
estimated cost to implement the C<strong>AF</strong>E provision. 72<br />
While the signed bill left much of what the democratic House<br />
of Representatives and environmental advocates wanted on the<br />
table, it was a big step in the right direction for the United States<br />
and was landmark legislation. The bill’s impact regarding fuel<br />
economy and biofuel are designed to weaken the country’s<br />
exposure to volatile oil prices. 73<br />
Comparisons and Observations<br />
Are the actions being taken by the United States in its pursuit of<br />
synthetic fuel to replace oil appropriate? Looking at the activities<br />
to date with regard to the five strategic lessons identified earlier,<br />
the following observations can be made.<br />
Recognize and admit you have a problem. The United States<br />
recognized the imported oil problem in 1975, but failed to<br />
continue C<strong>AF</strong>E-like efforts that would have provided some<br />
relief. Between the early 1980s and 2001, little significant<br />
activity affecting change on a national level can be noted.<br />
President Bush’s administration recognized in 2001 through<br />
the National Energy Policy that the US had energy issues that<br />
needed to be addressed as a strategic imperative. 74<br />
Problem recognition has intensified as oil prices have<br />
increased since 2001. Foreign energy dependency has<br />
become an ongoing topic of discussion within the current<br />
government and among the 2008 presidential candidates. The<br />
need to reduce or eliminate American dependency on foreign<br />
oil by finding domestic alternatives—preferably renewable<br />
and environmentally friendly has been publicly admitted.<br />
Commit to a course of action. Although the President’s<br />
energy policy covers all aspects of America’s energy usage<br />
profile, considerable progress has been made with regard to<br />
the potential reduction of oil imports and the strategic impact<br />
it has on the US. The President set a strategic goal for the<br />
United States in his 2007 State of the Union Address to reduce<br />
gasoline consumption by 20 percent in 10 years (20 in 10).<br />
Supporting this strategic goal, he has also set other objectives<br />
that must be achieved in order to be successful.<br />
To reach this goal, we must increase the supply of alternative fuels<br />
by setting a mandatory fuels standard to require 35 billion gallons<br />
of renewable and alternative fuels in 2017—nearly five times the<br />
current target. At the same time, we need to reform and modernize<br />
fuel economy standards for cars the way we did for light trucks—<br />
and conserve up to 8.5 billion more gallons of gasoline by 2017. 75<br />
The renewable fuels goal of the President’s program appears<br />
to be most challenging as it is an emerging technology. To<br />
that end, the Department of Energy released the Biomass<br />
17
18<br />
Multi-Year Program Plan in <strong>No</strong>vember 2007 to enable the<br />
deployment of biomass as a renewable energy source. A good<br />
question on renewables is “How much of current American<br />
needs can it replace?” The Department of Energy and<br />
Department of Agriculture in their Biomass as Feedstock study<br />
is looking at about 30 percent replacement and the renewable<br />
biomass raw material is potentially there; over a billion tons<br />
annually with judicious use of technology and agricultural<br />
acumen (see Figure 4).<br />
The other synthetic fuel source, coal, is also a potential, albeit<br />
a nonrenewable alternative, but has not been included in a<br />
similarly detailed plan at this time. Funding has been<br />
provided for continued research and development into the FT<br />
hydrogenization process as it is expected to be used in both<br />
Forest Resources<br />
Agricultural<br />
Resources<br />
Total Resource<br />
Potential<br />
Crude Oil<br />
Imports<br />
10.10<br />
Crude Oil<br />
Production<br />
5.14<br />
Crude Oil<br />
Supply<br />
15.23<br />
Crude Oil<br />
Adjustments<br />
0.01<br />
Crude Oil<br />
Refinery<br />
and Blender<br />
Net Inputs<br />
15.24<br />
Crude Oil<br />
Stock<br />
Change<br />
0.03 NGPL<br />
Refinery<br />
and Blender<br />
Net Inputs<br />
0.47<br />
Other Liquids<br />
Refinery and<br />
Blender Net<br />
Inputsb<br />
1.20<br />
Million Dry Tons per Year<br />
Figure 4. Annual Biomass Resource Potential 76<br />
Refined Products<br />
Imports<br />
2.10<br />
Processing<br />
Gain<br />
1.00<br />
NGPL<br />
Direct Use<br />
1.27<br />
Refined Products<br />
Exports<br />
1.23<br />
Refinery Refinery<br />
and Blender and<br />
Net Inputs Blender<br />
16.91 Net<br />
Production<br />
17.91<br />
Liquefied<br />
Petroleum Gases<br />
Residual<br />
Fuel Oil<br />
Distillate<br />
Fuel Oil<br />
4.17<br />
2.04<br />
Jet Fuel 1.62<br />
0.68<br />
Other 2.83<br />
Refined Products<br />
Stock Change<br />
Finished Petroleum 0.03<br />
Products Adjustment<br />
and Other Liquids<br />
Product Supplied<br />
0.57<br />
Figure 5. Petroleum Flow 2006 77<br />
coal and renewable biomass synthetic fuel efforts.<br />
A defined course of action, at least with regard to importing<br />
oil for gasoline, has been identified and enacted by way of<br />
H.R. 6 through the new C<strong>AF</strong>E standards and the Renewable<br />
Fuels Standard for use of increasing amounts of ethanol. A<br />
focus on the transportation sector is needed (see Figure 5)<br />
since it uses nearly 75 percent of total daily petroleum flow.<br />
In particular, the personal transportation sector which is<br />
responsible for 50 percent of the imported oil in the form of<br />
motor gasoline.<br />
Support the existing developmental and technology efforts.<br />
The Biomass Program is a collaborative effort with industry<br />
to advance both biomass feedstock and conversion<br />
technologies. It will involve<br />
public-private partnerships to<br />
demonstrate the large-scale,<br />
integrated biomass technologies<br />
involved and will accelerate<br />
market deployment<br />
infrastructures to make<br />
the products commercially<br />
available. 78 The program is<br />
intended to build on existing<br />
technologies, improving and<br />
making them economical for<br />
large scale, long-term<br />
production efforts. It will also be<br />
taking similar technologies and<br />
integrating them in a new way<br />
called a biorefinery (see Figure<br />
6) that can convert any number<br />
of biomass feedstocks into fuels,<br />
power, and chemicals. This new<br />
concept can be compared to<br />
today’s petroleum refineries<br />
which produce multiple fuels<br />
Petroleum<br />
Consumption<br />
20.59<br />
Residential 0.83<br />
Commercial 0.37<br />
Industrial<br />
5.12<br />
Transportation<br />
13.99<br />
Electric<br />
Power<br />
0.29<br />
Air Force Journal of <strong>Logistics</strong>
and products from crude oil. 80 The difference here will be<br />
multiple input source materials rather than one, each going<br />
through their own independent conversion process,<br />
converging where the process and technology allow.<br />
At the time of this writing, it is difficult to determine the true<br />
impact H.R. 6 will have on biofuels and cellulosic ethanol<br />
production in particular. The funding for research and<br />
development (R&D) in the bill is minimal ($25M for biofuel<br />
grants and $2M for renewable energy technologies), but the<br />
requirement to use 21 billion gallons of cellulosic ethanol<br />
by 2022 puts most of the R&D onus on industry.<br />
Conservation can make a difference. New C<strong>AF</strong>E standards<br />
have been legislated in H.R. 6, along with new energy<br />
efficiency standards for lighting and for residential and<br />
commercial appliance equipment. Each of these actions will<br />
reduce overall energy consumption in the long-term. As was<br />
shown earlier in this article, conservation could be making a<br />
significant contribution to reducing American oil imports<br />
within just a few years. With oil prices continuing to rise,<br />
conservation should be able to provide relief in the relative<br />
near-term. The potential can be seen looking at the nominal<br />
price per barrel over time and the total import cost for the<br />
United States as of 2006 (see Figures 7 and 8). Immediate<br />
gasoline conservation is called for, but no immediate action<br />
is being taken. Achieving a fleet average of 35 miles per gallon<br />
by 2020 will be a significant accomplishment but does very<br />
little to provide near-term relief to the import oil issue or help<br />
the current economic issues driven by imported oil costs.<br />
Establish a strategic framework focused on successful<br />
results. The Biomass Program has three broad areas: core<br />
<strong>Vol</strong>ume XXXII, Number 4<br />
Figure 6. Technical Element Links to Biorefinery Pathway Framework 79<br />
research and development; industrial scale demonstration and<br />
validation; and cross-cutting market transformation<br />
activities. The program has taken the wide variety of biomass<br />
feedstocks and conversion technologies and placed them into<br />
seven plausible pathway options within the biorefinery<br />
construct. The approach taken is intended to streamline<br />
evaluation of opportunities, establish priorities for R&D, and<br />
measure commercialization progress. Although not shown as<br />
milestones in Figure 9, life cycle cost-benefit analysis and<br />
environmental impacts will also be addressed.<br />
The most interesting thing about the MYPP may be the<br />
infrastructure transformation activities. A considerable<br />
amount of change management thought has gone into this<br />
particular area to help move toward a successful outcome. It<br />
addresses everything from the environment to the consumer<br />
to international partnerships.<br />
With regards to renewable biofuels, a starting point, a strategic<br />
framework focused on successful results, has been defined.<br />
This is the crucial first step in American politics, defining a<br />
proposed policy. The next crucial step is funding the policy<br />
to a successful conclusion. However, that appears to be a<br />
potentially critical shortcoming of the current effort.<br />
Conclusion<br />
German scientists developed synthetic fuel processes before<br />
World War I and early oil shortage recognition by Bergius led to<br />
starting commercial development. Prior to World War II,<br />
Germany saw the Wehrmacht sustainment possibilities of<br />
synthetic fuel and the government incentivized a considerable<br />
number of commercial plants to provide internal sources of oil<br />
19
<strong>No</strong>minal Dollars per Barrel<br />
Billion <strong>No</strong>minal Dollars<br />
20<br />
80<br />
60<br />
40<br />
20<br />
0<br />
240<br />
200<br />
160<br />
120<br />
80<br />
40<br />
0<br />
1975 1980 1985 1990 1995 2000 2005<br />
Figure 7. <strong>No</strong>minal Crude Price 1973-2005 81<br />
$218 billion in 2006<br />
1975 1980 1985 1990 1995 2000 2005<br />
Figure 8. <strong>No</strong>minal Crude Cost 1973-2005 82<br />
products. These synthetic fuel plants provided sufficient products<br />
for Germany to fight far beyond what was expected, given their<br />
lack of internal oil resources.<br />
The United States’ own shortages in domestic oil sources<br />
indicate sufficient similarity of circumstances to warrant seriously<br />
considering the lessons to be learned from the German experience<br />
over 60 years ago. They are simple, but still viable in today’s<br />
world.<br />
Recognize and admit you have a problem<br />
Commit to a course of action<br />
Support the existing developmental and technology efforts<br />
Emphasize conservation<br />
Establish a strategic framework focused on successful results<br />
They have great applicability to determining if the United<br />
States is moving in the right direction with regard to its energy<br />
program. When a comparison is made to the actions taken to date<br />
it indicates that America may have admitted it had a problem<br />
over 30 years ago, but has been very slow to commit to a longterm<br />
course of action to address the problem. The extensive<br />
current activity around biofuels is foundational, but the nation’s<br />
resources have not been sufficiently committed. Congressional<br />
funding does not appear to be robust enough to encourage the<br />
capital investment needed to ensure long-term success. The<br />
current administration’s efforts and those of Congress are a good<br />
start, but a start only. America imports nearly 66 percent of its<br />
petroleum needs every day. Biofuels will replace about 30<br />
percent of current US petroleum consumption. 84 The remaining<br />
36 percent will have to be addressed as well—renewable sources<br />
may be preferred, but if those renewable sources are incapable of<br />
freeing the US from its imported oil dependency, other methods<br />
are clearly available and in most cases commercially viable with<br />
today’s volatile oil prices. Also remaining are residential and<br />
commercial power issues and whether this will be addressed by<br />
clean-coal technology or by nuclear power stations.<br />
Timing is also an issue. The extended time frame being used<br />
with the current efforts, especially conservation, may only cover<br />
future growth in national energy demands. This means current<br />
plans would only preclude additional large increases in crude<br />
oil import requirements—not necessarily drive import reductions<br />
in the near-term. Building a new infrastructure for biomass based<br />
fuels may take some time, but conservation efforts in the<br />
transportation sector would be of greater immediate benefit. New<br />
C<strong>AF</strong>E standards were overdue, but are not aggressive enough to<br />
be of any near-term assistance to alleviating oil import imbalance<br />
driven inflation on America’s economy or improving national<br />
security.<br />
Finally, improving current processes, exploring other existing<br />
technologies, and developing new ones should be continued and<br />
nurtured. Biomass fuels need cheaper enzymes to help break<br />
down the cellulose for processing. Nanotechnology might be<br />
used to develop artificial enzymatic biomass factory processes<br />
to manufacture ethanol or other petroleum products. Some<br />
commercial use could be found for all the carbon dioxide to be<br />
produced by clean-coal technology—possibly in a new build<br />
material such as current concrete or wall board or bricks. Other<br />
energy renewables such as wind, tidal, and solar show potential<br />
as the technology evolves.<br />
The bottom line is America has recognized the need and is<br />
beginning to transform its energy infrastructure. <strong>No</strong>w is the time<br />
to continue addressing the problem and finding true long-term<br />
solutions to assure national security and remove the volatility<br />
that importing vast amounts of oil has on the American economy.<br />
As Winston Churchill stated, “This is not the end. It is not even<br />
the beginning of the end. But it is, perhaps, the end of the<br />
beginning.” 85<br />
<strong>No</strong>tes<br />
1. James Molony Spaight, “The War of Oil,” Military Affairs, 1949, 138.<br />
2. George W. Bush, “2007 State of the Union Speech to the US Congress,”<br />
Washington, DC, 23 January 2007.<br />
3. US Department of State, The National Security Strategy of the United<br />
States, Washington, DC: White House Office of Communications,<br />
March 2006, 26-27.<br />
4. George W. Bush, 2007.<br />
5. Energy Information Administration, Annual Energy Outlook 2008,<br />
Washington, DC: US Department of Energy, December 2007, 3.<br />
6. Fred Charles Ikle, Every War Must End, New York, NY: Columbia<br />
University Press, 2005, 4-5.<br />
7. Energy Information Administration, Annual Energy Review 2006,<br />
Washington, DC: US Department of Energy, June 2007, 1-2.<br />
8. John Deutch and David G. Victor, National Security Consequences of<br />
US Oil Dependency, Independent Task Force Report <strong>No</strong> 58, New York,<br />
NY: Council on Foreign Relations, 2006, 19.<br />
9. Deutch and Victor, 16.<br />
10. US Government Accountability Office, Crude Oil - Uncertainty About<br />
Future Oil Supply Makes It Important to Develop a Strategy for<br />
Air Force Journal of <strong>Logistics</strong>
Core R&D<br />
Demonstration<br />
& Deployment<br />
Cross-cutting<br />
2005<br />
Feedstock Core R&D<br />
Conversion Core R&D<br />
Integrated Biorefineries<br />
Biofuels Infrastructure<br />
Market Transformation<br />
<strong>Vol</strong>ume XXXII, Number 4<br />
Sustainable feedstock production and logistics technologies and<br />
accessible feedstock supply developed and validated<br />
4 5<br />
Biochemical and thermochemical technologies for converting biomass<br />
into cost-competitive liquid fuels developed<br />
Cost-Competitive Cellulosic Ethanol<br />
Technology Development Timeline<br />
6 7<br />
8 9<br />
National strategy for E10 and regional strategy for E85 in place.<br />
10 11<br />
Effective communications, policies and partnerships established to<br />
accelerate market transformation<br />
1<br />
Demonstration and validation of integrated technologies that achieve<br />
commercially-acceptable performance and cost targets completed<br />
Cellulosic Ethanol Contribution to “20 in 10”<br />
12<br />
2010 2015 2020<br />
Addressing a Peak and Decline in Oil Production, GAO Report to<br />
Congressional Requestors, Washington, DC: Government<br />
Accountability Office, February 2007, 6.<br />
11. Anthony N. Stranges, “Friedrich Bergius and the Rise of the German<br />
Synthetic Fuel Industry,” Isis <strong>Vol</strong> 75, <strong>No</strong> 4, December 1984, 665.<br />
12. Paul Roberts, The End of Oil - on the Edge of a Perilous New World,<br />
New York, NY: Houghton Mifflin Company, 2005, 59-64.<br />
13. Energy Information Administration, International Energy Outlook<br />
2007, Washington, DC: US Department of Energy, May 2007, 20.<br />
14. US Department of Energy, “World Marketed Energy Fuel Use by Fuel<br />
Type 1980-2030,” [Online] Available: http://www.eia.doe.gov/oiaf/<br />
ieo/excel/figure_11data.xls.<br />
15. House Resolution (H.R.) 6,The Energy Independence and Security<br />
Act of 2007 [Summary], [Online] Available: energy.senate.gov/public/<br />
_files/RL342941.pdf , 19 December 2007, 2.<br />
16. John M. Broder, “Senate Approves Energy Bill without Tax Increase,”<br />
[Online] Available: http://www.nytimes.com/2007/12/13/washington/<br />
13cnd-energy.html?<br />
a. “Separately, Congress reached a tentative agreement on a major<br />
energy package that it plans to enact outside the energy bill, according<br />
to a Senate Democratic staff member. The agreement, to be included<br />
in a broad government spending bill, would authorize the Energy<br />
Department to guarantee loans for various energy projects, making<br />
financing far easier.<br />
b. The agreement would guarantee loans of up to $25B for new nuclear<br />
plants and $2B for a uranium enrichment plant, something those<br />
industries had been avidly seeking. It would also provide guarantees<br />
of up to $10B for renewable energy projects, $10B for plants to turn<br />
coal into liquid vehicle fuel and $2B to turn coal into natural gas.”<br />
17. Albert Speer, Inside the Third Reich, trans. Richard and Clara Winston,<br />
New York, NY: The Macmillan Company, 1970, 352.<br />
18. Anthony N. Stranges, “Germany’s Synthetic Fuel Industry 1927-<br />
1945,” Energeia, <strong>Vol</strong> 12, <strong>No</strong> 5, 2001, 1.<br />
19. Stranges, “Friedrich Bergius and the Rise of the German Synthetic<br />
Fuel Industry,” 660.<br />
20. Stranges, “Germany’s Synthetic Fuel Industry 1927-1945,” 1.<br />
2<br />
3<br />
Legend for Technology Development Timeline<br />
Overall<br />
1 Through R&D, make cellulosic ethanol cost-competitive, at a modeled cost for<br />
mature technology of $1.33/gallon by 2012<br />
2 Through R&D, make cellulosic ethanol cost-competitive, at a modeled cost for<br />
mature technology of ~$1.20/gallon by 2017<br />
3 Help create an environment conducive to maximizing the production of fuels<br />
by 2017 that includes cost-effective technology, sufficient infrastructure,<br />
appropriate policies, and supportive consumers<br />
Feedstock Core R&D Conversion Core R&D<br />
4. Reduce production processing costs 6. Reduce the processing<br />
(including harvesting, storage, cost of converting<br />
preprocessing and transportation to cellulosic feed stocks to<br />
$0.37/gallon in 2012. Validate a sufficient, ethanol to $0.82/gallon<br />
high quality feedstock supply of 130 million in 2012.<br />
dry tons/year (MDT/yr) in 2012. 7. Reduce the processing<br />
5. Reduce production processing costs cost of converting<br />
(including harvesting, storage, cellulosic feed stocks to<br />
preprocessing, and transportation to ethanol to $0.60/gallon<br />
$0.33/gallon in 2017. Validate a sufficient, in 2017.<br />
high-quality feedstock supply of 250 million<br />
dry tons/year (MDT/yr) in 2017.<br />
Integrated Biorefineries Biofuels Infrastructure<br />
8. Demonstrate integrated 10. In partnership with EPA and DOT,<br />
biorefineriesacross various complete standards development<br />
pathways (successful operation and testing of E15 and E20 by 2012.<br />
of three plants by 2012).<br />
9. Validate pioneer plant modeled<br />
cost of ethanol production and<br />
compare to the target.<br />
11. Develop capacity to transport and<br />
distribute 24 billion gallons of<br />
biofuel.<br />
Market Transformation<br />
12. Help to accelerate this multi-industry transformation through stake holder<br />
education, government-industry partnerships and coordination with policy,<br />
regulatory, permitting and standards organizations by 2012.<br />
Figure 9. Biomass Program Strategy for Technology Development 83<br />
21. Stranges, “Germany’s Synthetic Fuel Industry 1927-1945,” 1-2.<br />
22. Dr. Peter W. Becker, “Role of Synthetic Fuel in WW2 Germany -<br />
Implications for Today,” Air University Review, July-August 1981, 3.<br />
23. Wilhelm Deist, Germany and the Second World War, trans. Dean S.<br />
McMurry & Ewald Osers P.S. Falla, Oxford, England: Clarendon Press,<br />
1990, 196.<br />
24. Adolph Hitler, “Mein Kampf,” Project Gutenberg of Australia,<br />
[Online] Available: http://gutenberg.net.au.<br />
25. John Robert Bengtson, Nazi War Aims - the Plans for the Thousand<br />
Year Reich, Rock Island, IL: Augusta College Library, 1962, 20.<br />
26. Deist, Germany and the Second World War, 178.<br />
27. Ibid., 246.<br />
28. Daniel Yergin, The Prize, New York, NY: Free Press, 1991, 334.<br />
29. Deist, Germany and the Second World War, 183.<br />
30. Deist, Germany and the Second World War, 262-79.<br />
31. W. G. Jensen, “The Importance of Energy in the First and Second<br />
World Wars,” The Historical Journal, <strong>Vol</strong> 11, <strong>No</strong> 3, 1968, 552.<br />
<strong>32</strong>. Ibid.<br />
33. Deist, Germany and the Second World War, 198.<br />
34. Jensen, “The Importance of Energy in the First and Second World<br />
Wars,” 549.<br />
35. Stranges, “Germany’s Synthetic Fuel Industry 1927-1945,” 1.<br />
36. Yergin, The Prize, 333.<br />
37. Yergin, The Prize, 344.<br />
38. Nicholas Kaldor, “The German War Economy,” The Review of<br />
Economic Studies, <strong>Vol</strong> 13, <strong>No</strong> 1, 1945-1946, 33.<br />
39. Jensen, “The Importance of Energy in the First and Second World<br />
Wars,” 551.<br />
40. Kaldor, “The German War Economy,” 43.<br />
41. Speer, Inside the Third Reich, 346-47.<br />
42. Hanson Baldwin, “Oil Strategy in World War 2,” American Petroleum<br />
Institute, [Online] Available: www.oil150.com/essays/2007/08/oilstrategy-in-world-war-ii.<br />
43. United States Secretary of War, “United States Strategic Bombing<br />
Survey – Summary Report,” 1945, 9, [Online] Available: http://<br />
www.anesi.com/ussbs02.htm#tgwe.<br />
21
44. Alfred C. Mierzejewski, “When Did Albert Speer Give Up?,” The<br />
Historical Journal <strong>Vol</strong> 31, <strong>No</strong> 2, June 1988, 394.<br />
45. United States Secretary of War, “United States Strategic Bombing<br />
Survey – Summary Report,” 8-9.<br />
46. Spaight, “The War of Oil,” 141.<br />
47. Stranges, “Germany’s Synthetic Fuel Industry 1927-1945,” 2.<br />
48. Dr Joe Strange and Colonel Richard Iron, “Understanding Centers of<br />
Gravity and Critical Vulnerabilities, Parts 1 and 2,” Unpublished Paper,<br />
Air War College, Maxwell <strong>AF</strong>B, Alabama, <strong>No</strong> Date.<br />
49. Baldwin, “Oil Strategy in World War 2.”<br />
50. Stranges, “Friedrich Bergius and the Rise of the German Synthetic<br />
Fuel Industry,” 660.<br />
51. Deist, Germany and the Second World War, various pages.<br />
52. Brainy Quote, “George S. Patton Quotes,” [Online] Available: http://<br />
www.brainyquote.com/quotes/authors/g/george_s_patton.html.<br />
53. Jensen, “The Importance of Energy in the First and Second World<br />
Wars,” 549.<br />
54. Kaldor, “The German War Economy,” 47.<br />
55. Jensen, (Total amount indicated on Figure 2)<br />
56. Stranges, “Germany’s Synthetic Fuel Industry 1927-1945,” 2.<br />
57. Kaldor, “The German War Economy,” 44.<br />
58. Jensen, “The Importance of Energy in the First and Second World<br />
Wars,” 548.<br />
59. Deist, Germany and the Second World War, 278.<br />
60. Burton Klein, “Germany’s Preparation for War: A Re-Examination,”<br />
The American Economic Review <strong>Vol</strong> 38, <strong>No</strong> 1, March 1948, 76.<br />
61. Jensen, “The Importance of Energy in the First and Second World<br />
Wars,” 547.<br />
62. National Highway Traffic Safety Administration, “C<strong>AF</strong>E Overview -<br />
Frequently Asked Questions,” [Online] Available: http://<br />
www.nhtsa.dot.gov/cars/rules/cafe/overview.htm.<br />
63. Roberts, The End of Oil - on the Edge of a Perilous New World, 331.<br />
64. Administration, “Cafe Overview - Frequently Asked Questions.”<br />
65. Richard Cheney, National Energy Policy, ed. National Energy Policy<br />
Development Group, Washington, DC: US Government Printing Office,<br />
2001, xi.<br />
66. Taxpayers for Common Sense, “Cost Analysis of the Energy Policy<br />
Act of 2005, by Title,” [Online] Available: http://www.taxpayer.net/<br />
energy/2005EnergyBillCostAnalysis.htm.<br />
67. Union of Concerned Scientists, “The 2005 Energy<br />
Bill,”[Online] Available: http://www.ucsusa.org/clean_energy/<br />
clean_energy_policies/energy-bill-2005.html.<br />
68. George W. Bush, “2006 State of the Union Speech to the US Congress,”<br />
Washington, DC, 31 January 2006).<br />
69. National Economic Council (ed.), Advanced Energy Initiative,<br />
Washington, DC: White House, 20 February 2006, 2.<br />
70. Bush, 2007 State of the Union Speech to the US Congress.<br />
71. US Department of Energy, Biomass Multi-Year Program Plan, Office<br />
of the Biomass Program (ed), Washington, DC: US Government<br />
Printing Office, 2007, 1-15 to 1-16.<br />
22<br />
72. George W. Bush, “2008 Budget Fact Sheets,” [Online] Available: http:/<br />
/ s e a r c h . a r c h i v e s . g o v / q u e r y -<br />
bush.html?qt=2008+budget+&charset=iso-8859-<br />
1&qc=bush2&col=bush2, 22, 23.<br />
73. Energy, Biomass Multi-Year Program Plan, i.<br />
74. Energy, Biomass Multi-Year Program Plan, 1-2.<br />
75. Energy, Biomass Multi-Year Program Plan, iv.<br />
76. Congressional Research Service, Energy Independence and Security<br />
Act of 2007: A Summary of Major Provisions, Fred Sissine (ed),<br />
Washington, DC: Congressional Research Service, 21 December 2007,<br />
i.<br />
77. Brian Wingfield, “Senate Passes Watered-Down Energy Bill,” Forbes<br />
[Online] Available: http://www.forbes.com/2007/12/13/energysenate-bill-biz-wash-cx_bw_1213bizenergy.html,<br />
13 December 2007.<br />
78. E. Kyle Datta, Amory B. Lovins, Odd-Even Bustnes, Jonathan G.<br />
Koomey, and Nathan J. Glasgow, Winning the Oil Endgame:<br />
Innovation for Profits, Jobs, and Security, Snowmass, CO: Rocky<br />
Mountain Institute, 2004), xii.<br />
79. Cheney, National Energy Policy, Appendix 1.<br />
80. Bush, 2007 State of the Union Speech to the US Congress.<br />
81. US Department of Energy and US Dept of Agriculture, Biomass as<br />
Feedstock for a Bioenergy and Bioproducts Industry: The Technical<br />
Feasibility of a Billion-Ton Annual Supply, Washington, DC: US<br />
Government Printing Office, April 2005, ii.<br />
82. Administration, Annual Energy Review 2006, 123.<br />
83. Energy, Biomass Multi-Year Program Plan, 1-1.<br />
84. Energy, Biomass Multi-Year Program Plan, 3-3.<br />
85. Energy, Biomass Multi-Year Program Plan, 1-3.<br />
86. Administration, Annual Energy Review 2006, 166.<br />
87. Administration, Annual Energy Review 2006, 168.<br />
88. Energy, Biomass Multi-Year Program Plan, iii.<br />
89. Think Exist Web site, “Quotes of Albert Einstein,” [Online] Available:<br />
h t t p : / / t h i n k e x i s t . c o m / q u o t a t i o n /<br />
in_the_middle_of_difficulty_lies_opportunity/10122.html<br />
90. Agriculture, Biomass as Feedstock for a Bioenergy and Bioproducts<br />
Industry: The Technical Feasibility of a Billion-Ton Annual Supply, i.<br />
91. Winston Churchill, “Speech at Mansion House - Referring to the Battle<br />
of Egypt, <strong>No</strong>vember 10, 1942,” quoted in Eigen’s<br />
Political & Historical Quotations, [Online] Available: http://<br />
www.politicalquotes.org/Quotedisplay.aspx?DocID=59468.<br />
Michael E. Puckett is a career maintenance civilian with<br />
over 27 years in depot maintenance logistics within Air<br />
Force Materiel Command. He was previously assigned to<br />
Headquarters Air Force, coordinating transformation<br />
issues for the A4/7 as part of Air Force Smart Operations<br />
for the 21 st Century. At the time of the writing of this article,<br />
he was a student at the Air War College, Air University,<br />
Maxwell Air Force Base, Alabama.<br />
He who will not apply new remedies must expect new evils; for time is the greatest<br />
innovator.<br />
—Viscount Francis Bacon<br />
The final dictum of history must be that whatever excellence Lee possessed as a<br />
strategist or as a tactician, he was the worst Quartermaster General in history, and<br />
that, consequently, his strategy had no foundations, with the result that his tactics<br />
never once resulted in an overwhelming and decisive victory.<br />
—Major General J. C. Fuller, USA<br />
Air Force Journal of <strong>Logistics</strong>
Quotes Boxed Set:<br />
What You Need,<br />
When You Need It!<br />
<strong>Vol</strong>ume XXXII, Number 4<br />
Why a set of quotations for<br />
Air Force Logisticians? An<br />
obvious answer is there isn’t<br />
one. But that’s not the only<br />
reason, and it’s certainly not<br />
the most important reason.<br />
The primary reason for<br />
producing this set was to<br />
provide a teaching resource<br />
that can be used in<br />
classrooms, education,<br />
training, and mentoring<br />
programs for Air Force<br />
logisticians. It is a tool that<br />
can be used by instructors,<br />
teachers, managers, leaders,<br />
and students. It is also a tool<br />
that can be used in research<br />
settings and a resource that<br />
should stimulate comment<br />
and criticism within<br />
educational and mentoring<br />
settings. Copies of the set<br />
are provided free of charge to<br />
any Air Force logistician,<br />
educational institution,<br />
teacher, instructor,<br />
commander, or manager.<br />
<strong>AF</strong>LMA<br />
Generating Transformational<br />
Solutions Today; Focusing the<br />
<strong>Logistics</strong> Enterprise of the Future<br />
23
24<br />
Air Force Journal of <strong>Logistics</strong>
David Anderson, DBA<br />
Timothy W. Gillaspie, Major, US<strong>AF</strong><br />
<strong>Vol</strong>ume XXXII, Number 4<br />
Introduction<br />
<strong>Logistics</strong> is the lifeblood of all combat operations.<br />
Lt Gen Henaidy, Royal Saudi Air Force<br />
During the early phases of Operation Iraqi Freedom<br />
and Operation Enduring Freedom, the<br />
establishment of a multimodal distribution<br />
network was fraught with<br />
problems. The organizations<br />
required to establish the Joint<br />
theater distribution network<br />
did not exist or function as<br />
required in the case of the Joint<br />
Movement Center. Each<br />
Service established a portion<br />
of the network, but by itself did<br />
not establish the entire network. This division of labor<br />
caused seams in the Joint theater distribution network.<br />
These seams caused dramatic delays and variability in<br />
cargo and personnel delivery. V Corps had so many<br />
problems with transportation assets that the deputy<br />
commander personally approved the allocation of trucks<br />
daily. The origin of the delays was doctrine and<br />
organization centric: “Current logistics doctrine and<br />
systems do not support offensive operations across the<br />
distributed battle space.” 1 Some doctrinal changes<br />
occurred in the following years, such as the creation of the<br />
Joint deployment distribution operations center (JDDOC);<br />
however, current theater organizations, information<br />
systems, and doctrine do not meet the requirements for a<br />
seamless Joint theater distribution system.<br />
Our exhaustive research, which included a thorough<br />
review of existing distribution literature, multiple<br />
interviews, and analysis of air and ground movement data,<br />
highlight the magnitude of the problem. The reviewed<br />
literature identified a multitude of gaps in doctrine,<br />
organizations, and command and control between the Joint<br />
community and Services concerning management and<br />
execution of the distribution system, to include<br />
responsible parties and tasks. Interviews with individuals<br />
of varying ranks (captain through major general) who are<br />
engaged with theater distribution systems in multiple<br />
theaters also identified the seams created by organizations<br />
and doctrine. Their experience, coupled with analysis of<br />
movement data between locations with aerial ports in the<br />
Iraq theater of operations, further support the concept of a<br />
single command and control structure for the management<br />
of the distribution system.<br />
Furthermore, the JDDOC, supported by Joint movement<br />
control battalions (MCB), should become the centerpiece<br />
for the management of the distribution system. The<br />
Services should retain execution responsibilities for their<br />
areas of expertise, but should make every effort to remove<br />
the need for ad hoc organizations. The ad hoc<br />
organizations typically have inadequate staffing as well<br />
as inadequate planning and assessment processes. 2<br />
The creation of a JDDOC for every combatant<br />
commander addresses the issue of coordinating<br />
25
Strategic airlift, now and for the<br />
foreseeable future, provides critical<br />
capabilities vital to our national<br />
interests. It is, therefore, incumbent<br />
upon the Air Force, and specifically<br />
Air Mobility Command, to work toward<br />
minimizing the amount of time our<br />
C-5s and C-17s remain broken within<br />
the airlift system.<br />
A single command structure responsible for the<br />
movement control of the theater could better utilize<br />
available assets to meet mission requirements by<br />
selecting the mode that would be most effective<br />
for the mission. The data analysis indicated that<br />
a single Joint theater distribution, operating with<br />
true unity of effort in the management of the<br />
system, could meet the objectives of the Joint<br />
force commander—in this case, the reduction of<br />
the number of convoys conducted. For example,<br />
minimum requirements for the use of a C-130<br />
prevent organizations from submitting cargo for<br />
air transportation, but a single organization<br />
responsible for mode selection could make<br />
decisions based on availability of all assets above<br />
echelon to use a C-130 for the movement of less<br />
than the normal requirement for use of a C-130.<br />
The single organization could also reroute cargo<br />
to an Army sherpa designated for above echelon<br />
support to meet the requirement. These decisions<br />
made by a single organization would require<br />
changes to the processes for management of the<br />
system.<br />
Changes to the processes currently used for the<br />
management of the Joint theater distribution<br />
system need to occur. Analysis of the interviews<br />
concluded that a single or integrated information<br />
26<br />
intertheater and intratheater movement; however, this<br />
organization does not address all of the issues associated with<br />
the distribution delays identified in after action reports and<br />
RAND research. 3 Current research has shown that gaps still exist<br />
between air and land components of the Joint theater distribution<br />
system. These gaps are not only organizational, but also<br />
technological. The information systems that exist today do not<br />
meet the needs of the Joint theater distribution system. We<br />
propose a plausible way ahead in closing the gaps and seams<br />
that exist in the information network and physical network of<br />
the Joint theater distribution system between air and land<br />
components.<br />
Detailing the Problem<br />
The literature addressing Joint theater distribution is extensive.<br />
It includes works on the establishment and processes of a<br />
distribution system, Joint and Service doctrine, research articles,<br />
after action reports, briefings on the shortfalls of the current<br />
execution of the Joint distribution system, the command, and<br />
control of Joint theater logistics, and optimization of a specific<br />
portion of the theater distribution system. Major works from<br />
organizations and authors such as RAND, the Government<br />
Accountability Office (GAO), Colonel Fontenot, in On Point, V<br />
Corps as Multi-National Corps – Iraq, and the Joint Chiefs of<br />
Staff in their Joint Distribution Deployment Enterprise concept<br />
paper; all identify problems with the distribution system. Of the<br />
many problems identified, several deal with the air and ground<br />
interaction. In-theater experiences and observations identified<br />
the largest seams in the theater distribution systems. The seams<br />
highlighted in the interviews were the air and surface theater<br />
boundary, lack of common systems for managing requirements<br />
and capabilities, managing of modes separately, the point of<br />
interaction between aerial ports and the movement control team<br />
(MCT) and arrival/departure airfield control group (A/DACG),<br />
and finally, the managing of priorities for movement. While the<br />
creation of the JDDOC addressed some of these problems, several<br />
other problems require attention. In Mending a Seam: Joint<br />
Theater <strong>Logistics</strong>, several historical examples outline the<br />
continuing problems with Joint theater distribution and the<br />
capability to get large quantities of material to the theater of<br />
operations, but an inability to move that material forward. 4 In<br />
2003, the GAO issued a report describing Department of Defense<br />
(DoD) distribution in Operation Iraqi Freedom as inefficient and<br />
ineffective. 5 Of the multitude of problems identified in the report,<br />
United States Central Command (USCENTCOM), United States<br />
Transportation Command (USTRANSCOM), and Defense<br />
<strong>Logistics</strong> <strong>Agency</strong> could only provide fixes to a few, such as cargo<br />
arriving in-theater and requiring repackaging for forward<br />
movement. Pure pallets reduced repackaging by shipping<br />
complete pallets from the depot to the end user. 6 The GAO also<br />
identified the problems that DoD—and specifically<br />
USTRANSCOM—encountered with obtaining information<br />
systems that communicate with each other to provide intransit<br />
visibility (ITV) and asset visibility. 7<br />
Several authors address the systematic problem the DoD has<br />
continued to experience since the Korean War: the transition<br />
from intertheater lift to intratheater movement. 8 Inability to<br />
smoothly transition from intertheater to intratheater movement<br />
creates backlogs at ports and delays the arrival of badly needed<br />
Air Force Journal of <strong>Logistics</strong>
esources to frontline units. To improve some of these areas, the<br />
Joint community is working to update Joint distribution doctrine.<br />
The doctrine requires updating to capture the considerable changes<br />
to the Joint distribution system since early 2003. The draft update<br />
to Joint Publication 4-09, Global Distribution, incorporates<br />
changes such as the JDDOCs, located on the combatant<br />
commander’s staff to replace the function of the Joint Movement<br />
Center. The capstone logistics doctrine, Joint Publication 4-0,<br />
update will reflect several of the changes as well.<br />
Doctrine presents several ways for the geographic combatant<br />
commander (GCC) to support theater distribution. One way to<br />
support theater distribution would be for the GCC to direct the most<br />
capable Service to provide the required capabilities and assets. 9<br />
Under this arrangement, the GCC usually delegates operational<br />
control (OPCON) of other Service assets to the most capable<br />
Service. 10 Joint Publication 4-01.3, Joint Tactics, Techniques, and<br />
Procedures for Joint Theater Distribution, identifies two positive<br />
aspects of the most capable Service concept as “it satisfies<br />
requirements at the lowest level possible, and it frees the geographic<br />
combatant commander to focus on theater-wide critical issues.” 11<br />
Unfortunately, using the most-capable-Service concept does not<br />
support a seamless distribution system. The arrangement creates<br />
disconnects between air and surface movement because the most<br />
capable Services are different. The Air Force provides the most<br />
capability to command and control airlift and the Army provides<br />
the most capability to command and control ground lift. In very<br />
few circumstances would this division not be the case. To create<br />
an integrated distribution system, Joint Publication 4-01.3<br />
recommends assigning responsibility to the Joint Movement<br />
Center, recently replaced by the JDDOC. 12 The selection of the best<br />
method for supporting the Joint team is also difficult because the<br />
Services have different concepts of support.<br />
The Services have major differences in concepts of support and<br />
the command and control of the support forces, which include the<br />
Air Force’s concept of agile combat support, the Navy’s Sea Based<br />
<strong>Logistics</strong>, and the Army’s Modular Force <strong>Logistics</strong> Concept. These<br />
different concepts of support, infrastructure, and force structure that<br />
the Services have developed to support them ensure that any<br />
solution to distribution problems must address these organizational<br />
structures. For example, the design of brigade support battalions<br />
(BSB) and logistics readiness squadrons (LRS) supports only their<br />
assigned brigade or wing. The BSB or LRS requires significant<br />
increases in resources if a Joint force commander (JFC) plans to<br />
increase these units’ responsibility for supporting other forces.<br />
Additionally, the brigade and wing commanders have trained and<br />
planned with OPCON of the BSB or LRS, so command and control<br />
of these units at the brigade and wing levels must remain intact to<br />
ensure effective combat operations.<br />
According to Joint doctrine, the geographic combatant<br />
commander (GCC), Service component staffs, and Service<br />
component operational units are required to run the theater<br />
distribution system and must link together for the system to work. 13<br />
The Air Force was designated the lead Service for common user<br />
airlift and the Army was designated the lead Service for common<br />
user ground transportation, but no Service has responsibility for<br />
integration of the two modes. The designation of USTRANSCOM<br />
as the distribution process owner (DPO) and the creation of the<br />
JDDOC were a starting point; however, an organization with<br />
command and control authority is needed to bridge the gap. The<br />
JDDOC derives its authority from the JFC as a part of his Joint<br />
<strong>Vol</strong>ume XXXII, Number 4<br />
technology system for the management of the<br />
distribution system, as a single process for<br />
requesting movement and monitoring available<br />
capability, would dramatically improve an<br />
integrated organization’s capability to manage<br />
the distribution system. The ability to compare<br />
all available capabilities and all requirements<br />
immediately is key to making good mode<br />
decisions in the distribution system.<br />
Distribution system management should<br />
occur under a single manager, when possible,<br />
to reduce the impact of the natural seams<br />
caused by switching between modes.<br />
Article Acronyms<br />
A/DACG – Arrival/Departure Airfield Control Group<br />
AMD – Air Mobility Division<br />
APOD – Aerial Port of Debarkation<br />
BCS3 – Battle Command Sustainment Support System<br />
BSB – Brigade Support Battalion<br />
CJTF – Commander Joint Task Force<br />
CTC – Cargo Transfer Company<br />
DPO – Distribution Process Owner<br />
ESC – Expeditionary Support Command<br />
FWD – Forward<br />
GAO – Government Accountability Office<br />
GCC – Geographic Combatant Commander<br />
IT – Information Technology<br />
ITARS – Intratheater Airlift Request System<br />
ITV – Intransit Visibility<br />
JDDOC – Joint Deployment Distribution Operations<br />
Center<br />
JFC – Joint Force Commander<br />
JFSCC – Joint Force Support Component Commander<br />
JOPES – Joint Operational Planning and Execution<br />
System<br />
JTF – Joint Task Force<br />
JTF-PO – Joint Task Force-Port Opening<br />
MCB – Movement Control Battalion<br />
MCT – Movement Control Team<br />
TSC – Theater Sustainment Command<br />
USA – United States Army<br />
USCENTCOM – United States Central Command<br />
USJFCOM – United States Joint Forces Command<br />
USMC – United States Marine Corps<br />
USPACOM – United States Pacific Command<br />
USTRANSCOM United States Transportation Command<br />
27
<strong>Logistics</strong> Directorate but does not have command authority over<br />
any forces. The Joint community created Joint Task Force-Port<br />
Opening (JTF-PO) to solve the initial short-term problem of<br />
opening a Joint theater distribution network. However, JTF-PO<br />
does not support beyond 60 days for the sustainment of the Joint<br />
theater distribution network. 14<br />
The most recent draft Joint publication on global distribution<br />
calls for an end-to-end distribution system run as a Joint<br />
enterprise with sufficient authority to control the flow of materiel<br />
and personnel through the distribution pipeline. 15 Currently,<br />
only portions of the distribution pipeline run as Joint enterprises.<br />
These sections are the ones controlled by USTRANSCOM. In a<br />
theater of operations below the Joint task force (JTF) staff level,<br />
there are no Joint organizations to reduce the seams in the theater<br />
distribution system. So even though the GCC has the authority<br />
to control the flow of materiel and personnel through the<br />
distribution system, the lack of operational coordination between<br />
air and surface components and integration of Service tactical<br />
distribution units hampers the GCC’s ability to seamlessly<br />
control the flow.<br />
Many of the problems with Joint theater logistics stems from<br />
the ad hoc nature of the organizations identified to coordinate<br />
and control Joint theater logistics. 16 Army and Joint doctrine<br />
recognize that ad hoc organizations are required for logistics to<br />
operate in a theater of operations. These ad hoc organizations<br />
operate at the operational and tactical levels. In Afghanistan, an<br />
ad hoc Joint logistics command managed logistics for forces in<br />
country. 17 Throughout the USCENTCOM area of responsibility,<br />
A/DACGs operate as ad hoc organizations according to Field<br />
Manual Interim 4-93.2. 18 There are multiple ad hoc organizations<br />
in the USCENTCOM area of operations. Besides the A/DACG,<br />
forces in Afghanistan operated with a Joint logistics command<br />
and Joint movement control battalion. In Iraq, a Joint distribution<br />
center managed the distribution processes. These ad hoc<br />
organizations suggest the requirement for standing Joint units<br />
to meet the ongoing and future requirements. The Joint force<br />
support component commander (JFSCC) concept attempts to<br />
address this ad hoc nature of organizations at the operational<br />
level.<br />
US Joint Forces Command (USJFCOM) in their Joint<br />
Experiment Distribution system covers the Joint Force Support<br />
Component Command (JFSCC) and other organizational<br />
options. USJFCOM identified that a major push for strategic and<br />
operational commands occurred because of the Services’ failure<br />
to address seams in the distribution system, but an equal push to<br />
address the seams at the tactical level has not occurred. 19<br />
Additionally, the creation of the JFSCC does not resolve the<br />
central problem—lack of visibility of capabilities and<br />
requirements. Only changes to processes and information<br />
technology can correct these deficiencies completely.<br />
The processes that are central to distribution occur in the<br />
multiple organizations. In general terms, the organizations can<br />
be described as execution units and management units. The<br />
execution units handle personnel and cargo as they move<br />
through the Joint theater distribution system. Most of these units<br />
participate in terminal or port operations, or are the airlift<br />
squadrons or truck companies executing the movement. Joint<br />
Publication 4-01.5 outlines terminal processes as follows:<br />
28<br />
Terminal operations involve receiving, processing, and staging<br />
passengers. It also includes receiving, loading, transferring between<br />
modes, and discharging unit and nonunit equipment and cargo. The<br />
main activities executed at terminals are loading and unloading modes<br />
of transport, marshalling, manifesting, stow planning, and<br />
documenting movement through the terminal. 20<br />
The MCB and JDDOC are management units that integrate<br />
the actions of the execution units to smooth the flow of personnel<br />
and materiel in the theater distribution system. The processes that<br />
they execute are movement control and distribution management.<br />
In the air to surface interface of the distribution system,<br />
terminals are the key nodes. 21 These key nodes, when linked by<br />
transportation modes with the right personnel, material-handling<br />
equipment, and ITV systems, are the transportation structure in<br />
the distribution system. 22 Changes in the mode of transportation<br />
create the most visible seams. Every time a passenger or cargo<br />
passes between modes of transportation, there is a seam in the<br />
transportation system.<br />
The Service organizations create seams in the system at their<br />
intersection because of different chains of command. Besides the<br />
natural seams between Services, the relationship between<br />
organizations in the system creates seams. The interviews raised<br />
concerns about the separation between the modes of<br />
transportation and the division of responsibilities of the theater<br />
distribution system between Services. The command and control<br />
relationships that exist according to doctrine for the theater<br />
distribution system are different from the command and control<br />
relationships executed in the United States Pacific Command<br />
(USPACOM) and USCENTCOM.<br />
USPACOM and USCENTCOM do not have any theater ground<br />
capability integrated into the JDDOC. All the responsibilities<br />
for the ground movement are located in the Army component<br />
command. Without the capability to execute complete<br />
movement control through all modes of transportation, the<br />
JDDOC’s effectiveness is hampered with regard to management<br />
of the complete theater distribution system. For example, in<br />
USCENTCOM the Theater Sustainment Command (TSC) sets<br />
and executes the priorities for ground movement and the<br />
CENTCOM Deployment Distribution Operations Center sets and<br />
executes the priorities for air movement. While the JFC has<br />
overarching priorities, the day-to-day execution of these<br />
priorities is not linked through unity of command and effort due<br />
to the seam created by the division of organizational<br />
responsibilities for management of the theater distribution<br />
system. This division highlights the problem of using the most<br />
capable Service to manage only portions of the Joint theater<br />
distribution system.<br />
Service organizations create seams as cargo or passengers pass<br />
between organizations from different Services. At the operational<br />
level, validated requirements pass between the Services and the<br />
JFC, and then back to the Services for execution of the<br />
requirement. Seams have developed because of different<br />
processes and systems being used for managing requirements and<br />
capabilities for a mode. A large seam occurs during the transfer<br />
between JTF-PO and the Service organizations that must execute<br />
the long-term mission. The limited period for the JTF-PO to<br />
provide support at the deployed location creates a problem for<br />
the GCC for operations that last longer than the JTF-PO<br />
deployment period. The follow-on organizations do not fall<br />
under the same chain of command as the JTF-PO and are not<br />
Air Force Journal of <strong>Logistics</strong>
integrated into a single organization with a single command. For<br />
example the command and control for the Joint aerial port<br />
complex, which under JTF-PO has a single commander, reverts<br />
to a two-command system, as highlighted in Joint doctrine. The<br />
divided command and control for an aerial port of embarkation<br />
starts with the Air Force component having responsibility for the<br />
ready line and loading ramp area, the Air Force and United States<br />
Marine Corps (USMC) or United States Army (USA) components<br />
sharing responsibility for the call forward area, and the USMC<br />
or USA components operating the alert holding area and<br />
marshalling areas. 23 For an aerial port of debarkation (APOD),<br />
the Air Force operates the off-loading ramp area. The holding<br />
area responsibilities are split between Air Force forces and USMC<br />
or USA forces. The USMC and USA forces control the marshalling<br />
area. Doctrine acknowledges the difficulty of operating in this<br />
two-command system in a single process. 24 The USMC and USA<br />
further complicate the process by making one of the key<br />
organizations, the A/DACG, an ad hoc organization. Army<br />
doctrine, while highlighting the ad hoc nature of the A/DACG<br />
organization, does state that the organization should be<br />
composed of cargo transfer company personnel. 25<br />
To bridge the natural seams that exist in any distribution<br />
system, the Joint community and Services developed several<br />
organizations. The multitude of organizations created overlaps<br />
the command and control issues. For the Joint theater distribution<br />
to meet the objectives of the JFC, the organizations that manage<br />
and execute the system must provide the capability to coordinate<br />
and synchronize the multiple facets of the system with unity of<br />
effort. Most of the overlaps in capabilities exist so each Service<br />
does not have to depend on another Service to provide the<br />
common user logistics capability. The overlaps between the<br />
various organizations with the capability to provide common<br />
user support indicate areas where possible integration of units<br />
may exist. The integration could be in the form of training,<br />
organization, operating instructions, or doctrine. The TSC and<br />
JDDOC have overlap in roles and responsibilities as defined by<br />
their concepts. The major area of overlap is the capability to<br />
coordinate with USTRANSCOM representatives and integrate<br />
distribution across the modes of transportation. The overlap of<br />
responsibilities has created different documents for requesting<br />
transportation support.<br />
The current processes reflected in the transportation request<br />
process and command and control are not conducive to<br />
supporting the principles of theater distribution—specifically,<br />
centralized management and continuous, seamless, two-way flow<br />
of resources. There are multiple systems used to identify<br />
movement requirements with the Services using multiple<br />
processes to identify the movement requirements. The Air<br />
Movement Request, Transportation Movement Request, and<br />
Joint Movement Request are one set of processes for supporting<br />
the identification of requirements. In addition to using multiple<br />
systems to identify movement requirements, the Services and<br />
Joint community use multiple systems to identify the movement<br />
capabilities available. These multiple systems create a lack of<br />
integration in the management of movement requests as<br />
identified in our interviews. In general, the idea of combining<br />
the multiple forms into a single process received positive<br />
responses from the interviewees. To highlight the utility of the<br />
single requirements system, the interview responses reflected a<br />
desire for a single ticket process for the shipper. The single ticket<br />
<strong>Vol</strong>ume XXXII, Number 4<br />
process allows cargo or passengers to receive end-to-end<br />
scheduling of transportation without the need for additional<br />
transportation requests as modes of transportation change. The<br />
capability for intermodal management was a primary reason<br />
identified for combining the forms. Additionally, the<br />
interviewees agreed that the capability to receive a requirement<br />
and centrally manage the best mode for that movement was<br />
highly beneficial. However, most felt that without the single<br />
process owner merging the request forms, they would be<br />
ineffective because of the lack of command and control for the<br />
requirements.<br />
All ten of the general officers and colonels interviewed<br />
supported the management of requirements by one theater<br />
organization. They felt consolidation was a positive<br />
development for the theater distribution, which, given the proper<br />
information technology (IT) capability and a well-defined<br />
command and control structure, could be successful. The major<br />
concerns expressed were as follows.<br />
Maintaining the capability of the tactical commander to<br />
weigh efforts for lift assets above the echelon supporting his<br />
unit<br />
Lack of IT to make the organization successful<br />
The ability of Services to maintain assets for their internal<br />
support<br />
Data analysis confirmed that the creation of a single structure<br />
for the management of requirements, combined with a reduction<br />
in the multiple processes and information systems (which<br />
hamper the effective and efficient use of the distribution system)<br />
could greatly improve the performance of the Joint theater<br />
distribution system.<br />
The data analysis further supports that a single organization,<br />
given the correct responsibilities and tools, can improve the<br />
management of the theater distribution system to meet mission<br />
requirements. A comparison of movement data for city pairs<br />
during the first 20 days in August 2006 and August 2007 gave a<br />
basic picture of a change the MCB made with the handling of<br />
cargo for movement between locations in Iraq. A city pair was a<br />
match between a mode originating location and a mode<br />
destination. Changes made between 2006 and 2007 created a<br />
more integrated system to take advantage of space available on<br />
aircraft moving between locations in Iraq. One notable change<br />
included air marshalling yards controlled by MCTs for cargo that<br />
had a long lead time for its required delivery data, and could move<br />
via air or ground. 26 This change allowed the MCTs to pick the<br />
best way to move the cargo based on requirement, threat, and<br />
available assets. While not an entirely Joint approach, the MCTs<br />
could not have started this process without the support of the<br />
Air Force aerial ports. This change in the handling of cargo<br />
played a role in the reduction of air and ground missions in Iraq<br />
1 year later. The reduction occurred even with an increase in the<br />
number of combat troops by at least 21,000 in 2007 over 2006, 27<br />
and the number of locations with air missions increasing from<br />
20 locations in 2006 to 23 locations in 2007.<br />
The management of the different modes of transportation in<br />
the distribution system by different organizations, tied with the<br />
lack of a common IT system to gather and share requirements<br />
and capabilities, proved to be the largest seams in the distribution<br />
system. In addition to the divided management of requirements<br />
29
and capabilities, the interviews raised concerns about divided<br />
execution at the seams between Service organizations such as<br />
the aerial port and A/DACG. The interview responses showed<br />
concern with the integration of the distribution system between<br />
modes and organizations. They felt the entire system lacked<br />
personnel with the required training so prioritization within the<br />
system was a problem. The lack of training and poor visibility of<br />
the requirements and capabilities in the system also prevented<br />
the echeloning of capability to allow for a prioritization and<br />
tasking at lower levels. Additionally, the interviewee felt that<br />
the lack of training for personnel executing the distribution<br />
created a large negative impact on the system and the modes of<br />
the distribution system. The individuals were unable to execute<br />
the system effectively and efficiently because they did not have<br />
the knowledge required to do so.<br />
The following conclusions and recommendations were<br />
derived from literature review, interviews, and data analysis.<br />
They provide one path to improved performance of the<br />
distribution system. One item of interest from the responses<br />
received is the lack of a common understanding of what<br />
comprises the theater distribution system. This problem<br />
highlights the need for increased Joint training on the operation<br />
of the Joint theater distribution system starting at the lowest<br />
levels.<br />
30<br />
Conclusions<br />
The normal seams that one would expect to find were identified<br />
by the literature review and the interview analysis. These<br />
traditional seams included locations where cargo or personnel<br />
change modes of transportation, and at the organizations that<br />
operate these nodes in the distribution system. The interviews<br />
and literature also identified additional seams at areas where<br />
information systems do not exchange data. Finally, the exchange<br />
between intertheater and intratheater transportation management<br />
and execution created the most significant seam in the<br />
distribution system because of cargo and personnel change<br />
modes, information systems, and organizational management.<br />
Doctrine provided additional insights into the Joint theater<br />
distribution system.<br />
Doctrine provides a wide range of views on the organization<br />
and management of the Joint theater distribution system. Joint<br />
doctrine provides an overarching view of the strategic, GCC, and<br />
the JTF levels of command and management for the Joint theater<br />
distribution system. However, portions of the operational, and<br />
most of the tactical, levels of the theater distribution system are<br />
divided by Service doctrine. The division inhibits the capability<br />
of the system to operate seamlessly by creating gaps between<br />
tactical and operational level distribution perception and<br />
operation. This is especially troublesome when a Service makes<br />
assumptions about the capability of another Service to support<br />
a multimodal location such as an aerial port. Movement control<br />
doctrine in general does not address how the various forces work<br />
together to bridge the seams.<br />
After action reports, RAND, doctrine, and interviews provided<br />
detailed insight into the organizations of the current distribution<br />
system. These sources identified that the integration of the<br />
organizations in the theater distribution system must occur.<br />
Additionally, they provided multiple views on how the<br />
integration should occur at the operational level of logistics,<br />
ranging from a single JFSCC to executing doctrine as written for<br />
the JDDOC. At the tactical level, these same sources suggest<br />
integration of the organizations that operate multimodal hubs<br />
at the Joint aerial port complex and Joint Theater Distribution<br />
Center. Some authors suggested an increase in Joint training of<br />
the current organizations that operate in those environments and<br />
the merging of the Service organizations into Joint organizations<br />
to decrease the size of the seam that occurs between air and<br />
ground at these points in the distribution system. The Services<br />
have integrated their internal distribution systems, whether it is<br />
the TSC Distribution <strong>Management</strong> Center, the Air Force’s LRS<br />
or Global <strong>Logistics</strong> Support Center, or USMC’s Marine <strong>Logistics</strong><br />
Group. The strength of these units to respond and provide<br />
logistics support for both their own Services and a common user<br />
logistics environment show the strength of integrated logistics.<br />
Our analysis showed the Joint community beyond the DPO has<br />
failed to integrate Joint theater distribution under a single<br />
commander or organization. The distribution system<br />
management should occur under a single manager, when<br />
possible, to reduce the impact of the natural seams caused by<br />
switching between modes.<br />
A single command structure responsible for the movement<br />
control of the theater could better utilize available assets to meet<br />
mission requirements by selecting the mode that would be most<br />
effective for the mission. The data analysis indicated that a single<br />
Joint theater distribution, operating with true unity of effort in<br />
the management of the system, could meet the objectives of the<br />
JFC—in this case, the reduction of the number of convoys<br />
conducted. For example, minimum requirements for the use of a<br />
C-130 prevent organizations from submitting cargo for air<br />
transportation, but a single organization responsible for mode<br />
selection could make decisions based on availability of all assets<br />
above echelon to use a C-130 for the movement of less than the<br />
normal requirement for use of a C-130. The single organization<br />
could also reroute cargo to an Army sherpa designated for above<br />
echelon support to meet the requirement. These decisions made<br />
by a single organization would require changes to the processes<br />
for management of the system.<br />
Changes to the processes currently used for the management<br />
of the Joint theater distribution system need to occur. Analysis<br />
of the interviews concluded that a single or integrated IT system<br />
for the management of the distribution system, as a single process<br />
for requesting movement and monitoring available capability,<br />
would dramatically improve an integrated organization’s<br />
capability to manage the distribution system. The ability to<br />
compare all available capabilities and all requirements<br />
immediately is key to making good mode decisions in the<br />
distribution system. The work USTRANSCOM is conducting on<br />
information systems, if supported by the Services, could quickly<br />
fix the asset visibility problems.<br />
Recommendations<br />
A single organization responsible for consolidating requirements<br />
and committing the Services’ capabilities in accordance with<br />
Joint doctrine organizations (such as the Joint movement control<br />
center) would increase the flexibility of the GCC and JTF<br />
commanders to meet movement requirements with the best mode<br />
of transportation. The JDDOC provides the capability to execute<br />
this organization, if Army personnel dealing with ground<br />
Air Force Journal of <strong>Logistics</strong>
transportation requirements are assigned to the surface cell of<br />
the JDDOC. The requirement for a forward JDDOC element<br />
stationed with the JTF could meet the need for an organization<br />
familiar with local requirements to validate, prioritize, and<br />
forward requirements to the Service for execution. The forward<br />
element would coordinate all intratheater movement<br />
requirements, with the main JDDOC responsible for integration<br />
of intertheater movement within the theater distribution system.<br />
Consolidation of cargo yards for ground and air distribution<br />
would allow maximum flexibility for transfer between modes and<br />
a single authority controlling mode selection ensures the most<br />
effective and efficient use of available transportation assets based<br />
on the priority of the JFC. Instead of cargo being placed in the<br />
aerial port marshalling yard, or in the ground marshalling yard,<br />
the cargo should be placed in a general marshalling yard until<br />
the mode is decided based on availability of resources, priority,<br />
threat, and timing, and then moved to the correct mode for final<br />
preparation and Joint inspection. These yards should be<br />
collocated for enhanced communication between mode<br />
operators.<br />
<strong>Management</strong>, Organizational, and Process Changes<br />
The organizational structure and division of responsibilities<br />
recommended below are in agreement with RAND’s most recent<br />
publication dealing with the Joint multimodal distribution<br />
system. 28 The JDDOC provides the capability necessary to<br />
manage the theater distribution system, if properly staffed and<br />
resourced according to doctrine. The TSC must give up its<br />
capability to manage ground requirements to the JDDOC so that<br />
the management of all modes of transportation in the distribution<br />
system can be integrated across all Services and at all levels. To<br />
integrate across all levels, the JDDOC must utilize the JDDOC<br />
forward (FWD) capability to support JTFs for the GCC.<br />
The JDDOC should also change from a center to a command<br />
organization for the management of the requirements in a theater<br />
distribution system. To provide capability to the lowest levels,<br />
MCBs should be assigned to the JDDOC. MCBs provide the<br />
management capability required to manage the theater<br />
distribution system if they become Joint organizations. Our<br />
research has shown that in the current conflict, many MCBs have<br />
Air Force liaison officers embedded within the organizations.<br />
Instead of making this organization an ad hoc organization, the<br />
MCBs should re-flag as Joint organizations and transfer from<br />
Army ownership to direct reporting units to the JDDOC at<br />
USTRANSCOM. The units should remain at their current home<br />
stations for training purposes and for development of the<br />
necessary relationships with Expeditionary Support Command<br />
(ESC) and sustainment brigades. Additionally, the command<br />
relationship with units deployed in an MCB’s area of operations<br />
should be one of direct support, the same relationship that exists<br />
today. MCBs, when deployed, should receive operational<br />
command and control from the JDDOC FWD, providing theater<br />
management capability from top to the bottom. Each MCB should<br />
provide direct support to an ESC or sustainment brigade,<br />
depending on the size of the deployment. The MCT relationship<br />
should remain as it is today. This organizational structure<br />
provides an honest broker capability at all echelons of<br />
distribution. The MCBs can maintain their current structure with<br />
the addition of Joint personnel with specific Service capabilities<br />
for the management of the system. Figure 1 outlines the<br />
<strong>Vol</strong>ume XXXII, Number 4<br />
organizational relationship for the management and execution<br />
of the Joint theater distribution. There would be no change in<br />
the command relationships for Army organizations as identified<br />
in current doctrine and organizational relationships. This figure<br />
also represents the execution side of the theater distribution<br />
system with the TSC, ESC, and sustainment brigades. These<br />
organizations have the responsibility to execute the identified<br />
transportation requirements in coordination with the<br />
management portion of the theater distribution system.<br />
The Air Force command relationships identified in Figure 1<br />
show no change from current doctrine. The Air Force forces<br />
component has OPCON over all assigned Air Force forces and<br />
the Joint force air component commander (JFACC) has tactical<br />
control (TACON) over those forces provided. The air mobility<br />
division (AMD) as the JFACC’s airlift controlling authority has<br />
a TACON relationship with the air terminal operations center<br />
through the layers of command. The Air Force command<br />
relationships are for the air execution portion of the distribution<br />
system.<br />
The recommendations for changes in the Joint theater<br />
distribution system are to the management organizations and<br />
their command relationships with each other, and with the<br />
execution portion of the theater distribution system. The change<br />
of the MCB to a Joint organization assigned in an OPCON<br />
relationship with the JDDOC creates a single organization for<br />
the management of the theater distribution system at the<br />
operational and tactical levels of command. In addition to this<br />
change, the TSC and AMD should have direct support<br />
relationships with the JDDOC. The JDDOC, through the MCBs<br />
and MCTs, should have direct support relationships to the<br />
various levels of the execution portion of the distribution system.<br />
The direct support relationship of the TSC and AMD to the<br />
JDDOC allows the JDDOC to provide management of the<br />
execution of the movement requirements and priorities. The<br />
JDDOC, as a command organization, must reorganize its<br />
structure from a mode driven structure to an operational structure<br />
with a current and future operations cell. The manpower for the<br />
Joint manning document of the organization exists currently<br />
with the exception of the theater ground piece. These manpower<br />
billets currently reside in the TSC and ESC. The management<br />
portion of these billets (those that handle requirements,<br />
allocation, and commitment) should be moved to the JDDOC<br />
with the TSC and ESC retaining the billets to execute the ground<br />
transportation system. The JDDOC FWD provides the<br />
commander Joint task force (CJTF) a direct element into the Joint<br />
theater distribution system. The JDDOC FWD, while assigned<br />
to the JDDOC, provides direct support to the CJTF. The JDDOC<br />
FWD also has OPCON over MCBs assigned in its area of<br />
responsibility. The JDDOC retains its current alignment assigned<br />
to the GCC. Figure 1 outlines these command relationships.<br />
The removal of the theater designation of what can and cannot<br />
move via air would give the flexibility to the movement control<br />
organization to use all the modes of transportation available to<br />
meet the JFC priorities. The processes necessary for the<br />
management of the movement control system at all levels include<br />
properly identifying requirements and providing visibility on<br />
modal decisions to all organizational levels.<br />
An overarching description of the proposed request and<br />
execution systems provides insights into the streamlined nature<br />
31
<strong>32</strong><br />
...<br />
SPOD<br />
MCT<br />
LR 4<br />
+++<br />
ARFOR<br />
++<br />
TSC<br />
+<br />
ESC<br />
X<br />
SUST (TO)<br />
II<br />
MCB<br />
MSR<br />
X<br />
AVN<br />
TTOE<br />
...<br />
MCT<br />
+++<br />
JFLCC<br />
...<br />
Theater Distribution<br />
Center MCT<br />
ATOC<br />
... APOD<br />
MCT<br />
...<br />
MCT<br />
JDDOC or<br />
JDDOC FWD<br />
...<br />
AMD<br />
X<br />
(TD)<br />
SUST MCT<br />
...<br />
Distribution MCT<br />
Hub<br />
II<br />
MCB<br />
CSC CSC<br />
...<br />
MCT<br />
100 miles 200 miles<br />
required to operate a Joint theater distribution system. Starting<br />
at the beginning with requirements definition outside of division<br />
capabilities (lower right of Figure 2), the division staff<br />
coordinates its movement requirements with the Corps Staff in<br />
the event that the division MCT does not have the assets<br />
available to it for commitment. The MCT forwards the request<br />
to the area MCT, normally collocated with a sustainment<br />
brigade, for support. The MCT with a support relationship to the<br />
sustainment brigade has the ability to commit its transportation<br />
assets and provide support to other MCTs in its area of operation.<br />
Requests for transportation that are above the MCT’s capacity<br />
should be forwarded to the MCB for routing to other MCTs for<br />
support, or forwarded to the JDDOC FWD. At the division level,<br />
the aviation unit assigned to the division can identify assets for<br />
the division MCT to commit for movement requests. MCTs can<br />
also push cargo to Army aviation units for movement on<br />
previously scheduled airlift missions or regularly scheduled lift<br />
missions (channel missions) for space available movements. For<br />
successful use of channel missions, the MCTs require visibility<br />
over all cargo requiring movement at the aerial port so the Joint<br />
MCT can better prioritize all cargo for air movement—not just<br />
Army cargo.<br />
One area not represented in the figure is the continuous<br />
coordination between MCTs. Movement requirements are not<br />
all met with formal movement requests, as shown in Figure 2.<br />
JFACC<br />
Airlift Wing<br />
<strong>AF</strong>FOR<br />
ATOC<br />
...<br />
MCT<br />
APOD<br />
X<br />
SUST<br />
(Div)<br />
...<br />
MCT<br />
++<br />
Div Main CP<br />
G4 DTO<br />
Coordination<br />
Direct Support<br />
TACON<br />
OPCON<br />
X<br />
AVN<br />
...<br />
DIV MCT<br />
200 miles<br />
LR 3 LR 2 LR 1<br />
Figure 1. Recommended Organizational Relationships 29<br />
X<br />
CSB<br />
X<br />
FIRES<br />
X<br />
BFSB<br />
MSR<br />
BCT<br />
X<br />
BCT<br />
X<br />
BCT<br />
X<br />
BCT<br />
X<br />
BCT<br />
X<br />
BCT<br />
Some requirements are met by pushing smaller amounts of cargo<br />
to a port or terminal for movement on air channel missions or on<br />
a space available basis.<br />
Above the division level, the Army Forces Component may<br />
designate some aviation assets to support the distribution system.<br />
The JDDOC FWD should have responsibility for managing these<br />
resources in the same manner as Air Force lift assets. If an MCB<br />
cannot support a request from one of its MCTs, the request moves<br />
to the JDDOC FWD. The JDDOC FWD reviews and validates the<br />
request and forwards the request to the appropriate mode for<br />
execution through either the AMD or the ESC. If the JDDOC FWD<br />
does not have the assets available for commitment, the request<br />
is forwarded to the JDDOC. If the JDDOC determines that ground<br />
movement will best support the requirement, the commitment is<br />
sent to the TSC. If it determines that airlift best supports the<br />
requirement, the commitment is sent to the AMD or to<br />
USTRANSCOM for support.<br />
With the management of the request process conducted by a<br />
single command and control structure with Joint capabilities, the<br />
Services can concentrate on meeting the requirements given to<br />
them to execute. Additionally, the parochial concerns of the<br />
Services about the fairness of a system managed by one Service<br />
or another can be overcome. The changes also ensure that the<br />
tactical units are able to influence the Joint theater distribution<br />
system to the level they require to meet their requirements, as<br />
Air Force Journal of <strong>Logistics</strong>
…<br />
SPOD<br />
MCT<br />
LR 4<br />
++<br />
TSC<br />
II<br />
MCB<br />
TTOE<br />
X<br />
SUST (TO)<br />
MSR<br />
<strong>Vol</strong>ume XXXII, Number 4<br />
+<br />
ESC<br />
Theater Distribution<br />
Center<br />
APOD<br />
...<br />
MCT<br />
…<br />
MCT<br />
JDDOC<br />
JDDOC FWD<br />
...<br />
MCT<br />
...<br />
MCT<br />
ATOC<br />
X<br />
AVN<br />
X<br />
(TD)<br />
SUST<br />
Distribution<br />
Hub<br />
II<br />
MCB<br />
...<br />
MCT<br />
+++<br />
CORPS<br />
CSC CSC<br />
APOD<br />
...<br />
MCT<br />
100 miles 200 miles<br />
well as the GCC and JTF priorities. The current system’s failure<br />
to address the tactical commander’s concern for airlift due to GCC<br />
imposed priorities and limited tactical level system management<br />
capabilities creates friction between tactical and operational<br />
objectives. Placing management of the system under a single<br />
chain of command for unity of effort—with well-defined support<br />
relationships of that management system—addresses these<br />
concerns.<br />
Execution, Organization, and Process Change<br />
The execution organizations from the Services require little<br />
change, with the exception of the Joint aerial port complex. To<br />
improve the flow of cargo through the Joint aerial port complex,<br />
the A/DACG must cease to be an ad hoc organization. The Army<br />
must assign this responsibility to one of the cargo transfer<br />
company’s platoons or entire cargo transfer companies (CTC),<br />
as necessary. To improve execution of the system, these CTCs<br />
should be collocated and teamed with Air Force units for training<br />
purposes at locations such as McChord Air Force Base and Ft<br />
Lewis, Washington. In addition, the Joint movement control<br />
teams should be further integrated into the training of the Joint<br />
aerial port complex so a single set of instructions can be<br />
developed for the execution of aerial port activities and reduce<br />
the seam created by personnel in an ad hoc organization<br />
unfamiliar with the aerial port system.<br />
AMD<br />
...<br />
MCT<br />
Airlift Wing<br />
ATOC<br />
X<br />
SUST<br />
… MCT<br />
...<br />
MCT<br />
(Div)<br />
++<br />
Div Main CP<br />
G4 DTO<br />
Channel Air Movement<br />
Air Movement Commitment<br />
Ground Commitment<br />
Request for Movement<br />
Coordination of Movement<br />
Ground or Air Tasking<br />
X<br />
AVN<br />
...<br />
DIV MCT<br />
200 miles<br />
LR 3 LR 2 LR 1<br />
Figure 2. Recommended Joint Movement Request Process 30<br />
X<br />
CSB<br />
X<br />
FIRES<br />
X<br />
BFSB<br />
MSR<br />
BCT<br />
X<br />
BCT<br />
X<br />
BCT<br />
X<br />
BCT<br />
X<br />
BCT<br />
X<br />
BCT<br />
The Joint community should seek to link existing aerial port<br />
squadrons and logistics readiness squadrons with existing<br />
movement control battalions and cargo transfer companies for<br />
training and experience exchange, especially at locations with<br />
collocated Army and Air Force units. This enhanced training<br />
would greatly increase the capability of units to function as a<br />
team in-theater when they move to replace JTF-PO for sustainment<br />
operations at the APOD or intratheater terminals and increase the<br />
number of units capable of providing JTF-PO type functions. If<br />
Services are unwilling to integrate training and positioning of<br />
forces as ready tailored teams to meet the needs of the GCC, the<br />
Air Force should explore training the Air Force Traffic<br />
<strong>Management</strong> career field personnel to carry out the MCT port<br />
clearing duties. The training of traffic management airmen to<br />
execute these responsibilities would create a team capable of<br />
meeting the need to integrate theater ground and air within a<br />
single tactical organization at the aerial port.<br />
Information Technology Systems<br />
USTRANSCOM’s Theater Enterprise Deployment Distribution<br />
project identifies the gaps in IT systems. This USTRANSCOM<br />
project must be successful at providing one-stop shopping for<br />
the planner to see all requirements and all capabilities including<br />
ITV to allow for dynamic rerouting of theater capabilities and<br />
requirements. The effort should consolidate the Intratheater<br />
Airlift Request System (ITARS), Global Air Transportation<br />
33
Execution System (GATES), Cargo Movement Operations<br />
System (CMOS), Transportation Coordinator’s Automated<br />
Information for Movement System II, Battle Command<br />
Sustainment Support System (BCS3), and Transportation<br />
<strong>Logistics</strong> (TRANSLOG) Web data to provide complete<br />
requirements to the distribution planner and user. While not<br />
discussed in detail in this article (because it often involves<br />
intertheater movement), the data for movement requirements<br />
from the Joint Operational Planning and Execution System<br />
(JOPES) should be incorporated into the system, because the<br />
deployment and redeployment of forces places large requirements<br />
on theater distribution. The combined system should also pull<br />
the data from JOPES for deployment and redeployment<br />
requirements. Additionally, ITV systems for ground (MCT,<br />
BCS3) and air must be incorporated into the structure. In the short<br />
term, the combining of ITARS and TRANSLOG Web to create a<br />
single system for requesting lift would increase visibility of all<br />
requirements and aid in the management of the current<br />
organizational structures.<br />
The ad hoc nature of the processes and organizations in current<br />
doctrine and theater distribution—mainly along Service lines—<br />
creates a less than seamless theater distribution system. The result<br />
of failing to improve the theater distribution processes is the<br />
continued poor effectiveness and efficiency experienced during<br />
Operation Enduring Freedom and Operation Iraqi Freedom. The<br />
Services must overcome their parochialism toward Service<br />
capabilities and integrate these capabilities through information<br />
systems and integrated management of the system.<br />
34<br />
<strong>No</strong>tes<br />
1. Colonel Gregory Fontenot (Retired), Lieutenant Colonel E. J. Degen,<br />
Lieutenant Colonel David Tohn, On Point: The United States Army in<br />
Operation Iraqi Freedom, Fort Leavenworth, KS: Combat Studies<br />
Institute Press, 2004, 408-409.<br />
2. Robert S. Tripp, Kristin F. Lynch, Charles Robert Roll, John G. Drew,<br />
and Patrick Mills, A Framework for Enhancing Airlift Planning and<br />
Execution Capabilities Within the Joint Expeditionary Movement<br />
System, Santa Monica, CA: RAND Corporation, 2006, xx.<br />
3. Tripp et al, xvii.<br />
4. Lieutenant Gregory S. Otey, “Mending a Seam: Joint Theater <strong>Logistics</strong>,”<br />
Air Force Journal of <strong>Logistics</strong>, XXX, <strong>No</strong> 2, 12.<br />
5. U S Government Accounting Office (GAO), Defense <strong>Logistics</strong>:<br />
Preliminary Observations on the Effectiveness of <strong>Logistics</strong> Activities<br />
during Operation Iraqi Freedom, William M. Solis, GAO 04-305R,<br />
Defense <strong>Logistics</strong>, Washington, DC: Government Printing Office, 18<br />
December 2003, 3-4.<br />
6. U S Government Accounting Office (GAO), DoD Has Begun to<br />
Improve Supply Distribution Operations, but Further Actions Are<br />
Needed to Sustain These Efforts, William M. Solis, GAO 05-775,<br />
Supply Distribution Operations, Washington, DC: Government<br />
Printing Office, August 2005, i.<br />
7. US Government Accounting Office, 2005, 5.<br />
8. David J. Kolleda, Developing the Theater Level Aerial Port of<br />
Debarkation, Organization and Structure, Fort Leavenworth, KS:<br />
School of Advanced Military Studies, 23 April 1996, 30.<br />
9. Joint Publication 4.01.3., Joint Tactics, Techniques and Procedures<br />
for Movement Control, Washington, DC: The Joint Staff, 9 April 2002,<br />
I-6.<br />
10. Joint Publication 4.01.3., I-6 and I-7.<br />
11. Ibid.<br />
12. Joint Publication 4.01.3., III-1.<br />
13. Joint Publication 4.01.4., Joint Tactics, Techniques and Procedures<br />
for Joint Theater Distribution, Washington, DC: The Joint Staff, 22<br />
August 2000, IV-4–IV-5.<br />
14. US Transportation Command, Joint Task Force-Port Opening (Aerial<br />
Port of Debarkation) Concept of Operations, Version 1.65, Scott Air<br />
Force Base, Illinois: Strategy, Policy, Programs and <strong>Logistics</strong><br />
Directorate, DPO Program <strong>Management</strong> and Strategy Division,6 March<br />
2007, 3.<br />
15. Joint Publication 4.09., Doctrine for Global Distribution (Draft),<br />
Washington, DC: The Joint Staff, July 2007, III-15.<br />
16. Mark E. Drake, How to Improve Responsiveness for Theater Level Joint<br />
Command and Control Requirements, Carlisle Barracks, PA: US Army<br />
War College, 21 February 2006 and Mark Brady, Beans, Bullets and<br />
Black Oil … Are We Delighting the Joint Force Commander? Newport,<br />
RI: Naval War College, 16 May 2003, 16.<br />
17. David D. Dworak, The Future of Joint <strong>Logistics</strong>: A Proposal for<br />
Achieving True Joint <strong>Logistics</strong> within the American Military. Carlisle<br />
Barracks, PA: US Army War College, 15 March 2006, 7.<br />
18. Field Manual Interim 4-93.2, The Sustainment Brigade, Final Draft,<br />
Washington, DC: Department of the Army, 4-37.<br />
19. US Joint Forces Command, J9, Joint Experimental Deployment and<br />
Support, <strong>No</strong>rfolk, Virginia: Joint Concept Development and<br />
Experimentation Spotlight, October 2007, 1.<br />
20. Joint Publication 4.01.5., Joint Tactics, Techniques and Procedures<br />
for Transportation Terminal Operations, Washington, DC: The Joint<br />
Staff, 9 April 2003, I-3.<br />
21. Field Manual (FM) 4.0, Combat Service Support, Washington, DC:<br />
Department of the Army, 7 August 2003, 7-4.<br />
22. Ibid.<br />
23. Joint Publication 4.01.5., III-9.<br />
24. Joint Publication 4.01.5., III-12.<br />
25. Field Manual Interim 4-93.2, The Sustainment Brigade, Final Draft,<br />
Washington, DC: Department of the Army, 4-37.<br />
26. Gust W. Pagonis, Operational Distribution: Effectiveness versus<br />
Efficiency, Newport, RI: Naval War College, 6 <strong>No</strong>vember 2007, 13.<br />
27. House Armed Services Committee, Hearing of the House Armed<br />
Services Committee: The Way Forward in Iraq, Federal News Service,<br />
11 January 2007, [Online] Available: http://web.lexisnexis.com.lumen.cgsccarl.com/congcomp/document?_m=98716513758d6f26d5361cce2ce2b163&_docnum=2&wchp=dGLbVzWzSkSA&_md5=5a19483e9bd9121ebc13eeb2febcca71,<br />
accessed 6<br />
May 2008, 21.<br />
28. John Drew, et al, Applying the Strategies to Tasks Framework for<br />
Integrating Theater Airlift into the End-to-End Joint Multi-Modal<br />
Expeditionary Movement System, Santa Monica, CA: RAND, 2008.<br />
29. Force Development Directorate–Distribution, “Movement Control,”<br />
Power Point Briefing. US Army Combined Arms Support Command,<br />
1 February 2007, [Online] Available: https://forums.bcks.army.mil/<br />
secure/CommunityBrowser.aspx?id=<strong>32</strong>9640, accessed 28 February<br />
2008, 7.<br />
30. Ibid.<br />
David A. Anderson, DBA, is an associate professor in the<br />
Department of Joint, Interagency, and Multinational<br />
Operations, US Army Command and General Staff College,<br />
Fort Leavenworth, Kansas. He is a retired Marine Corps<br />
lieutenant colonel who served his entire career as a<br />
logistician in various tactical- through strategic-level staff<br />
and command positions.<br />
Major Timothy W. Gillaspie is currently the Commander,<br />
375 th <strong>Logistics</strong> Readiness Squadron, Scott Air Force Base,<br />
Illionis. At the time of writing this article, he was a student<br />
at the Army Command and General Staff College, Fort<br />
Leavenworth, Kansas.<br />
Visit the Journal online at: http://www.aflma.hq.af.mil/lgj/Afjlhome.html<br />
Air Force Journal of <strong>Logistics</strong>
<strong>Vol</strong>ume XXXII, Number 4<br />
Guidebooks:<br />
What You Need,<br />
When You Need It!<br />
Critical ideas and information need to<br />
be presented in a crisp and clear<br />
format. If you look around at some of<br />
the things being produced today, that’s<br />
not always the case. That’s why <strong>AF</strong>LMA<br />
was asked to produce this guidebook.<br />
The AEF Fuels <strong>Management</strong> Pocket<br />
Guide is in high-impact format and<br />
meets a defined Air Force need.<br />
This guide is designed to assist in<br />
understanding fuels issues as they<br />
relate to expeditionary operations. The<br />
information is intended to provide a<br />
broad overview of many issues and be<br />
useful to anyone who has an interest in<br />
the Air Force fuels business. Call or email<br />
for your copy today.<br />
(334) 416-2335<br />
editor-<strong>AF</strong>JL@maxwell.af.mil.<br />
Electronic copies are available at<br />
http://www.aflma.hq.af.mil/lgj/<br />
Afjlhome.html<br />
<strong>AF</strong>LMA<br />
Generating Transformational<br />
Solutions Today; Focusing the<br />
<strong>Logistics</strong> Enterprise of the Future<br />
35
36<br />
<strong>Logistics</strong> Stuff—Five Things to Consider<br />
The operations/logistics partnership is a target for our enemy—protect it. We must try<br />
always to think of an enemy’s looking for the decisive points in the partnership. What we want<br />
to make strong, they will try to weaken. Where we want agility, they will want to paralyse us.<br />
What we can do to our enemy, we can do to ourselves by lack of attention. So all concerned<br />
with operations and logistics must protect and care for the partnership and the things it needs<br />
for success. This includes stuff and information and people. Also, we must not forget the<br />
corollary is just as important: the operations/logistics partnership of the enemy is a target for us;<br />
we must attack it.<br />
Think about the physics. Stuff is heavy, and it fills space. Anything we want to do needs to<br />
take account of the weight that will have to be moved, over what distance, with what effort.<br />
Usually this all comes down to time, a delay between the idea and the act. If we think about the<br />
physics we can know the earliest time, we can finish any task and we can separate the possible<br />
from the impossible. It is crucial to determine the scope of the physical logistics task early in<br />
any planning process. Planners must know how long things take and why they take that long.<br />
Think about what needs to be done and when—and tell everybody. Once we have given<br />
instructions and the stuff is in the pipeline, it will fill that space until it emerges at the other end.<br />
The goal is to make sure that the stuff coming out of the pipe is exactly what is needed at that<br />
point in the operation. If it is not, then we have lost an opportunity—useless stuff is doubly<br />
useless, useless in itself and wasting space and effort and time. Moving useless stuff delays<br />
operations. Also, priority of order of arrival will change with conditions and with the nature<br />
of the force deploying. For example, the political need to show a presence quickly may lead a<br />
commander to take the risk of using the first air transport sorties to get aircraft turn-round crews<br />
and weapons into theatre before deploying all the force protection elements.<br />
Think about defining useful packages of stuff. Stuff is only useful when all the pieces to<br />
complete the jigsaw are assembled. Until the last piece arrives, there is nothing but something<br />
complicated with a hole in it. It is vital to know exactly what is needed to make a useful<br />
contribution to the operational goals and to manage effort to complete unfinished jigsaws, not<br />
simply to start more. Useful stuff often has a sell-by date. If it arrives too late, it has no value,<br />
and the effort expended has been wasted. The sell-by date must be clear to everyone who is<br />
helping build the jigsaw. And it is important to work on the right jigsaw first. In any operation,<br />
there is a need to relate stuff in the pipelines to joint operational goals, not to single-service or<br />
single-unit priorities. It is no good having all the tanks serviceable if the force cannot get enough<br />
aircraft armed and ready to provide air cover or ensuring that the bomber wing gets priority at<br />
the expense of its supporting aircraft.<br />
Think about what has already been started. The length of a pipeline is measured in time<br />
not distance. There will always be a lag in the system, and it is important to remember what has<br />
already been set up to happen later. Constantly changing instructions can waste a lot of energy<br />
just moving stuff around to no real purpose. Poorly conceived interventions driven by narrow<br />
understanding of local and transitory pain can generate instability and failure in the system.<br />
Group Captain David J. Foster, R<strong>AF</strong><br />
Air Force Journal of <strong>Logistics</strong>
Compelling reasons exist to radically<br />
change the current inspection process.<br />
The Air Force’s inventory of aircraft has<br />
become more geriatric than ever before, leading<br />
to increased downtime due to inspections and<br />
age-related maintenance factors. Consequently,<br />
operating costs for these mature aircraft fleets<br />
have soared 83 percent over the last decade.<br />
Because of the projected budget shortfalls,<br />
aircraft recapitalization programs will be severely<br />
constrained and take 20 years or longer to fully<br />
replace their predecessors. As a result, older<br />
aircraft will be forced to continue in service to<br />
cover the combat capability gaps until the<br />
replacement aircraft achieve full strength.<br />
Additionally, the cost of replacement weapons<br />
systems has become so great that Congress has<br />
enacted legislation to prevent the Air Force from<br />
retiring aircraft, forcing older aircraft to be flown<br />
and be maintained for longer periods to maximize<br />
their return on investment.<br />
Overlaid on these factors is the fact that the Air<br />
Force has been engaged in combat operations<br />
since 1991 and will likely continue to be for the<br />
foreseeable future. The combination of high<br />
operations tempo, an aging total fleet, and<br />
<strong>Vol</strong>ume XXXII, Number 4<br />
Transforming the Aircraft Inspection Process<br />
continual personnel reductions makes it<br />
imperative for the Air Force to apply Air Force<br />
Smart Operations for the 21 st Century (<strong>AF</strong>SO21)<br />
concepts to the aircraft inspection process. The<br />
threat of terrorism and asymmetric warfare has<br />
forced the Air Force to be continually ready to<br />
deploy and fight. The Army’s transformation and<br />
increasingly joint nature of military operations<br />
make it imperative for the Air Force to achieve and<br />
sustain the highest levels of aircraft availability<br />
possible. With the program budget decisiondriven<br />
manpower reductions, the Air Force cannot<br />
continue to carry out the current manpowerintensive<br />
inspection requirements and still sustain<br />
today’s levels of combat capability. The<br />
Maintenance Steering Group-3 approach offers<br />
the Air Force an opportunity to fully exploit<br />
<strong>AF</strong>SO21 efficiencies to produce combat-ready<br />
aircraft with increased availability, reduced cost,<br />
and improved unit control through an iterative and<br />
responsive inspection construct. Transforming<br />
the aircraft inspection process is one approach to<br />
produce the efficiencies required to better defend<br />
the United States and her allies in the global war<br />
against terrorism.<br />
37
38<br />
Introduction<br />
To everything there is a season, a time for every purpose<br />
under heaven; … a time to break down, and a time to<br />
build up; … a time to keep, and a time to throw away;<br />
… a time to keep silence, and a time to speak; … a time<br />
of war, and a time of peace. 1<br />
—Ecclesiastes 3:1-8<br />
The next 5 years promise to bring significant<br />
changes to the Air Force’s current operating<br />
environment. This change is prompted by several<br />
budget initiatives to provide funds for vital<br />
programs that include recapitalizing the growing<br />
inventory of aging aircraft. Some of these<br />
initiatives target manpower billets in specific<br />
Air Force Journal of <strong>Logistics</strong>
areas across the active, reserve, and National<br />
Guard forces with a projected goal of reducing<br />
full-time equivalent positions by approximately<br />
40,000. 2 One initiative, released as Programmed<br />
Budget Decision (PBD) 716, directs the offsets to<br />
be fully executed by the end of fiscal year (FY)<br />
2011 across most Air Force specialty codes<br />
<strong>Vol</strong>ume XXXII, Number 4<br />
Donald A. Van Patten, Colonel, US<strong>AF</strong><br />
(<strong>AF</strong>SCs) in order to minimize huge losses within<br />
a few areas. Within the past year, the period to<br />
complete the offsets has been accelerated to the<br />
end of FY09. PBD 716’s impact on aircraft<br />
maintenance is to reduce aircraft inspection<br />
manpower by 402 billets—a significant decrease<br />
in maintenance capability. 3<br />
39
The Air Force’s plan to reduce the inspection manpower<br />
focuses on regionalizing inspection centers for select aircraft<br />
types. Although the depot-level overhaul locations would remain<br />
unchanged, this plan would eliminate the base-level inspection<br />
docks by flying the aircraft to regional sites for their incremental<br />
hourly and periodic maintenance inspections. 4<br />
In addition to the manpower reductions, the Air Force has<br />
begun efforts to improve aircraft availability and decrease cost.<br />
Faced with decreasing budgets, Air Force leadership established<br />
goals to increase aircraft availability by 20 percent and reduce<br />
costs by 10 percent. 5 Known as the Aircraft Availability<br />
Improvement Program (AAIP), all levels of aircraft sustainment<br />
have been directed to develop efficiency initiatives to achieve<br />
the PBD goals. 6<br />
In order to achieve the projected PBD 716 manpower savings<br />
of $23.4M over the Future Year Defense Plan (FYDP), there<br />
appear to be three viable options. The first option would be to<br />
yield the manpower positions while retaining the phase and<br />
isochronal inspection docks at their current base-level locations. 7<br />
A second option would be to fully comply with the PBD and<br />
regionalize select inspection activities. The last option would<br />
be to develop a hybrid alternative—sending aircraft to the<br />
regional facilities for heavy inspections, but performing the light<br />
checks or minor inspections at the base.<br />
This article analyzes these three options against the goals to<br />
increase aircraft availability by 20 percent, while decreasing cost<br />
by 10 percent. Additionally, it examines a third impact of these<br />
options on a unit’s ability to control its success or destiny with<br />
respect to mission requirements. As part of the analysis, this study<br />
also investigates the theory of reliability-centered maintenance<br />
and analyzes its applicability to the inspection options.<br />
40<br />
Impetus for Change<br />
The Air Force cannot increase aircraft availability and decrease<br />
operating costs without revamping the current inspection<br />
process. The first of several reasons for change is that the average<br />
age of our aircraft today is almost a quarter of a century (23.5<br />
years) and has grown steadily over the past 3 decades. In 1967,<br />
Figure 1. Total Air Force Maintenance Man-Hours per Flying Hour, FY91–FY05<br />
the entire fleet’s average age was only 8.5 years. 8 This equates to<br />
a 176 percent increase in fleet age over the 40-year period.<br />
Although the Air Force has started receiving the F-22, the average<br />
age of the Air Force’s main fighter fleet is still over 20 years. This<br />
fact is not insignificant. Because the fleet has become geriatric,<br />
it is now susceptible to the normal problems that begin to surface<br />
with older airframes. For example, wiring has become a top driver<br />
for the F-15C/D. The insulation on the Kapton wiring used widely<br />
throughout the fighter aircraft has become brittle and cracked,<br />
resulting in an increasing number of electrical shorts and fires.<br />
The KC-135 has experienced peeling with its internal fuel tank<br />
coatings, leading to contaminated fuel systems and filters. 9 These<br />
age-related problems will continue to drive additional aircraft<br />
inspections, which in turn, will increase the amount of time the<br />
aircraft will not be available for flying.<br />
The second drive for change is increased downtime for the<br />
aircraft fleets due to the increased inspections and other<br />
maintenance-related aging factors. Over the past 15 years, the<br />
amount of aircraft downtime per flying hour has increased and is<br />
reflected in the Air Force’s maintenance man-hour per flying<br />
hour (MMH/FH) ratio metric. For the entire Air Force fleet, this<br />
ratio increased 61 percent between FY91 and FY05 (see Figure<br />
1). 10<br />
This is significant because the Air Force retired some of its<br />
oldest fleets of F-4 and F-111 aircraft during this same period<br />
without any major impact on the MMH/FH metric. For the aircraft<br />
maintenance community, this increase in workload, even with a<br />
newer total fleet, is monumental.<br />
Additionally, the size of Air Force budgets has continued to<br />
slow at a disconcerting pace over the past several years. Based<br />
on current projected budget programs, the FY11 budget will be<br />
only 16 percent larger than the FY06 budget—a significant<br />
spending departure compared to the previous 6-year period of<br />
FY01 to FY06, when the budget grew nearly 44 percent. 11 Due<br />
to decreasing budget dollars, the Air Force will be forced to<br />
stretch recapitalization plans for replacement aircraft and need<br />
to retain older aircraft longer than originally planned to provide<br />
the required combat capability.<br />
A fourth impetus for change is the increase in operating costs.<br />
Given the volatility of fuel<br />
prices, personnel pay and benefit<br />
expenditures, and other<br />
operating factors that comprise<br />
the Air Force total ownership<br />
costs (<strong>AF</strong>TOC), this important<br />
sustainment factor promises to<br />
rise faster than planned for in the<br />
budget requests through FY11. 12<br />
The cost to operate an average<br />
aircraft in FY96 was just over<br />
$3M. In FY05, the same cost<br />
reached nearly $5.5M, an 83<br />
percent increase. 13 This makes<br />
the stated AAIP goals even more<br />
challenging to achieve.<br />
The last reason for change is<br />
the track record of legislative<br />
involvement. During the last 4<br />
fiscal years (FY03-FY06),<br />
Congress prevented the Air<br />
Air Force Journal of <strong>Logistics</strong>
Force from retiring aircraft deemed too costly to operate from<br />
the B-52, C-5, C-130E/H, F-117, and KC-135 fleets. As of October<br />
2005, the number of aircraft congressionally restricted from<br />
retirement had grown to a total of 104, creating a burden on<br />
critical budget dollars. 14 This well intentioned legislation has<br />
forced the Air Force to divert shrinking funds from other vital<br />
programs to sustain these geriatric weapons systems.<br />
Analysis Criteria and Inspection Types<br />
The types of inspections discussed in this article are limited to<br />
the phase and isochronal inspections. The phase-type inspection<br />
is determined strictly by the number of operating or flying hours.<br />
If an inspection is due at 200 hour intervals, then the aircraft must<br />
be inspected at this point before it can be flown further. Aircraft<br />
that begin and end their sorties at the same location—such as<br />
fighter aircraft—normally operate on the hourly phase inspection<br />
concept. Isochronal inspections are based on a specified number<br />
of calendar days. Isochronal is a Greek word that means to occur<br />
in regular intervals of time. 15 The isochronal intervals are derived<br />
from an average number of flying hours that would be<br />
accumulated in the interval without degrading safety. The<br />
isochronal inspection concept is ideal for aircraft like tankers or<br />
airlifters that may fly multiple sorties away from home station.<br />
In conjunction with military representatives, the original<br />
equipment manufacturers (OEMs) determine the inspection type<br />
and intervals during the aircraft’s initial operational test and<br />
evaluation stage. These types and intervals normally serve the<br />
aircraft with minimal change up to retirement.<br />
To sufficiently analyze the data, two aircraft will be examined.<br />
Due to their significant numbers and the availability of research<br />
data, the phase-interval type F-15C/D fighter aircraft and the<br />
isochronal-interval type KC-135 tanker aircraft were selected for<br />
this study.<br />
The three proposed options will be evaluated against three<br />
criteria: aircraft availability, maintenance operating costs, and<br />
unit control. Because having aircraft available for combat and<br />
training is a vital prerequisite to enable a unit to accomplish its<br />
wartime mission, the Air Force constantly evaluates the aircraft<br />
availability of its fleets to identify causes of negative trends.<br />
Aircraft availability measures the ratio of time a unit possessed<br />
aircraft is mission capable (MC) or mission-ready against the total<br />
time of possession by all organizations. 16 The formula used to<br />
calculate this rate is as follows:<br />
Availability Rate = (MC Hours/Total Possessed Hours) x 100<br />
An aircraft is considered in possession when it is under its<br />
assigned unit’s control. For example, if the Air Force had a fleet<br />
of 100 aircraft, and in one day 20 aircraft were not MC and 10<br />
aircraft were possessed by depot maintenance, the number of<br />
aircraft mission-ready or MC for this 24-hour period would be<br />
70 percent. The calculation would be as shown below:<br />
(70 MC unit possessed aircraft x 24 hours/100 unit and depot<br />
possessed aircraft x 24 hours) x 100<br />
Of course, actual aircraft availability calculations are much<br />
more complex, as aircraft cycle through only a few of minutes or<br />
hours per day of not-mission-capable status before returning to<br />
MC status. As stated previously, the Air Force is striving to<br />
<strong>Vol</strong>ume XXXII, Number 4<br />
achieve a 20 percent improvement in availability across all its<br />
fleets of aircraft. A major way to impact availability rates would<br />
be to decrease the amount of time an aircraft is not mission<br />
capable and increase the amount of time an aircraft is unitpossessed<br />
and mission capable.<br />
In light of PBD 716’s emphasis on cost reduction, the second<br />
criterion analyzes the maintenance operating costs across the<br />
three options. As stated previously, the <strong>AF</strong>TOC data base captures<br />
the operating expenditures of unit-level consumption,<br />
intermediate maintenance, depot maintenance, contractor<br />
support, sustaining support, indirect support, and aircraft<br />
modifications from program element code (PEC) 3400 –<br />
Operations and Maintenance (O&M), and military and civilian<br />
pay from PEC 3500 – Pay and Allowances. The aircraft total<br />
operating cost is the total annual system costs of the two PECs<br />
divided by the total aircraft inventory (TAI). 17 The <strong>AF</strong>TOC costs<br />
most easily influenced at the unit, intermediate (regional), and<br />
depot levels are the maintenance and consumables expenditures.<br />
Minimizing these costs through a reanalysis of the OEMdeveloped<br />
phase and isochronal inspection construct would<br />
directly impact the inspection frequency and workforce size.<br />
The last criterion for judging the effectiveness of the three<br />
options is the degree of control a unit retains over its phase and<br />
isochronal inspection program. Unit control has always been a<br />
foundational building block for maintaining a healthy fleet of<br />
aircraft. A flying organization plans and executes its flying hour<br />
program with respect to its home station and deployment<br />
requirements, exercise and evaluation cycles, contingency<br />
rotations, and other local factors, including weather. The integral<br />
factor to achieving a successful flying hour program is being able<br />
to control the flow and rate at which aircraft are inspected. The<br />
inspection process is the banking mechanism for building a<br />
savings account of flying hour capability. It is commonplace for<br />
a unit to surge its inspection program periodically to respond to<br />
an externally-driven mission requirement that necessitates phase<br />
or isochronal inspection flexibility in order to accomplish the<br />
mission. The Chief of Staff of the Air Force (CS<strong>AF</strong>) recognized<br />
the importance of conjoined authority and responsibility when<br />
searching for a replacement to the objective wing structure that<br />
divided maintenance authority and responsibility between two<br />
groups. Under organizational structures where the maintenance<br />
group commander exercises both authority and responsibility<br />
for fleet health, aircraft performance has flourished. 18 Separating<br />
the phase and isochronal inspection capability from the direct<br />
control of the unit, as called for under PBD 716, partitions the<br />
necessary authority and responsibility to maintain fleet health<br />
in high tempo environments, especially combat and contingency<br />
operations. The most recent guidance in Air Force Instruction<br />
(<strong>AF</strong>I) 21-101 states that “Aircraft should not normally deploy<br />
with phase or isochronal inspections or engine time changes due<br />
immediately upon AOR (area of responsibility) arrival.” 19 A<br />
unit’s direct authority over its aircraft inspection program equates<br />
to being able to determine its own destiny or success, especially<br />
in combat and contingency operations. Pulling the phase or<br />
isochronal capability away from the unit has the strong potential<br />
to severely limit its flexibility to match flying requirements with<br />
fleet health maintenance.<br />
41
The MSG-3 Inspection Construct<br />
In the 1960s, an airline industry task force known as the<br />
Maintenance Steering Group (MSG) developed a new inspection<br />
program, known as MSG-1 (the first report published by the<br />
MSG), that produced substantial savings for the Boeing 747<br />
(B747) over the DC-8. 20 Table 1 reflects the savings of the MSG<br />
approaches over the traditional approach. 21 In 1970, the Air<br />
Transport Association (ATA) led the airline industry in<br />
developing a second report (MSG-2). 22 This revised program<br />
converted MSG-1 into an inspection logic applicable to aircraft<br />
other than the B747. 23<br />
Interestingly, the preponderance of Air Force aircraft<br />
developed during this period utilized the MSG-2 preventive<br />
inspection logic. Although these early MSG preventive<br />
inspection processes produced huge savings, they were bottomup<br />
approaches that focused on the failures of the individual items<br />
versus the effect of failures on the entire system. In addition, these<br />
early MSG approaches did not factor in operating performance<br />
data as the aircraft matured nor did they establish intervals for<br />
the preventive tasks. 24<br />
To overcome the MSG-1 and MSG-2 shortcomings, the<br />
reliability-centered maintenance (RCM) methodology was<br />
developed by United Airlines for the Department of Defense<br />
Type of Preventive<br />
Maintenance<br />
Traditional Approach MSG-1 & MSG-2 Approach<br />
Structural inspections for 20K<br />
flying hours<br />
4M man-hours for DC-8 66K man-hours for B747<br />
Overhaul 339 items for DC-8 7 items for DC-10<br />
Turbine engine overhaul Scheduled<br />
On-condition (cut DC-8 shop<br />
maintenance costs 50 percent)<br />
*Traditional approach to maintenance held that the more frequently equipment was inspected and<br />
overhauled, the better it was protected against failure, thus resulting in numerous tasks.<br />
42<br />
CHECK INTERVAL<br />
1 2 3 4<br />
Deterioration<br />
Table 1. MSG-1 and MSG-2 Savings<br />
Original System Design IR<br />
Component<br />
Replacement<br />
Limit of Acceptable Deterioration<br />
S<strong>AF</strong>ETY BOUNDARY<br />
Deteriorated System IR<br />
<strong>No</strong>rmally system component replacements will not restore system<br />
inherent reliability back to original design level<br />
Reliability enhancement visit (REV) restores deteriorated system to its<br />
original design level<br />
System upgrade increases inherent reliability above original design<br />
level<br />
Figure 2. Predetermined Levels of System<br />
(DoD) in 1978. The ATA incorporated this new preventive<br />
maintenance program into the revised MSG-3 decision logic<br />
published in 1980. 25 The heart of RCM is the failure mode, effects,<br />
and criticality analysis (FMECA) which targets components and<br />
structures from a top-down systems approach. 26 The effectiveness<br />
of RCM is achieved through an iterative application of the<br />
FMECA throughout the weapons life cycle. 27 Additionally, a<br />
predetermined level of system performance and acceptable<br />
degradation are established during the analysis, as shown in<br />
Figure 2. 28<br />
The importance of reaccomplishing the FMECA analysis at<br />
appropriate intervals cannot be overstated; the cost efficiencies<br />
are realized by analyzing performance data on a recurring or<br />
iterative basis. Although the terms MSG-3 and RCM are often<br />
used synonymously, RCM is the methodology to determine<br />
failures and preventive maintenance actions. MSG-3 is the<br />
governmental- and industry-sanctioned application of RCM by<br />
way of a strong, integrated network of Federal Aviation<br />
Administration (FAA), airline operators, and original equipment<br />
manufacturer members. The MSG-3 construct allows the operator<br />
to adapt and change the inspection program to its particular<br />
operating requirements once reviewed and approved by the<br />
FAA. 29 The preference to use the MSG-3 term in this article is<br />
intentional; MSG-3 connotes responsiveness and receptiveness<br />
to change. This is evident in the seven revisions made to MSG-<br />
3 from 1987 to 2005 to improve<br />
Upgrade<br />
REV<br />
safety and preventive<br />
maintenance activities. 30<br />
Unfortunately, when the<br />
Secretary of Defense initiated<br />
sweeping reforms to the defense<br />
acquisition process in 1994, he<br />
also rescinded DoD’s mandate to<br />
use RCM as well as the numerous<br />
Military Standards (MIL-STDs)<br />
that provided the methodology<br />
to accomplish the analysis. In its<br />
place, he mandated the services<br />
to rely on industry standards and<br />
best practices. 31 This action<br />
essentially orphaned legacy<br />
equipment, whose extended life<br />
cycles need the iterative<br />
engineering and operating<br />
analysis provided by RCM and<br />
the MIL-STDs. This statement is<br />
not intended to marginalize<br />
efforts by the weapon systems’<br />
engineers to improve the<br />
inspection continuum. However,<br />
constrained resources within Air<br />
Force Materiel Command<br />
(<strong>AF</strong>MC) have limited<br />
improvements to merely<br />
administrative-type changes to<br />
the OEM’s initial inspection<br />
framework. <strong>32</strong><br />
Consequently, the Air<br />
Force’s older legacy aircraft now<br />
operate on an infantile<br />
Air Force Journal of <strong>Logistics</strong>
preventive maintenance inspection concept primarily<br />
developed by the OEMs without having had the benefit of an<br />
MSG-3 end-to-end reevaluation of previous decades’ systems<br />
and structural performance history.<br />
Analysis of Three Options<br />
We must fundamentally change the culture of our Air Force<br />
so that all airmen understand their individual roles in<br />
improving their daily processes and eliminating things that<br />
don’t add value to the mission.<br />
—Secretary of the Air Force and Chief of Staff of the<br />
Air Force, 7 <strong>No</strong>vember 2005<br />
To provide a meaningful analysis of the three options, it is<br />
important to examine these alternatives against actual aircraft<br />
that are potential candidates for the PBD 716 initiatives. The<br />
notional candidate fleets considered for regionalized inspections<br />
are the A-10, F-15, F-16, F-22, B-1, B-52, C-130, and KC-135<br />
aircraft. 33 The analysis will be conducted using one aircraft from<br />
each inspection construct, the F-15C/D for phase inspections,<br />
and the KC-135 for the isochronal construct.<br />
The F-15 inspection construct combines a series of light and<br />
medium hourly post flight (HPO) inspections and a major<br />
periodic inspection (PE) in a series of 200 flying-hour intervals.<br />
For a complete phase inspection cycle, the F-15 undergoes five<br />
HPOs and one PE to produce a total of 1,200 flying hours. 34 A<br />
complete cycle from the first HPO-1 to the PE entails 3,500 steps,<br />
584 work cards, and 1,001 man-hours. 35 The average time the F-<br />
15 fleet was not mission capable (NMC) or not available for flying<br />
due to scheduled maintenance (phase inspections) per year<br />
during FY97 to FY06 was 2,169,296 hours out of 41,281,421<br />
unit possessed hours, or 5.25 percent. 36 This equates to an average<br />
NMC time for phase inspections of 450.1 hours per aircraft per<br />
year. Additionally, during the same 10-year period, the<br />
availability rate averaged 67.0 percent and the total operating<br />
costs from the <strong>AF</strong>TOC data base averaged $3.676M per aircraft. 37<br />
The KC-135 uses an isochronal or calendar-based inspection<br />
cycle that is accomplished in 360 calendar days. The HPOs occur<br />
at day 30, 120, 180, 240 and 300. 38 Additionally, critical<br />
corrosion inspections occur at day 180 and 300, along with a<br />
mid-PE inspection at 600 flying hours and a major PE during<br />
the 300-day inspection. 39 Although the work cards do not<br />
provide a standardized timeframe to complete the steps, the<br />
average number of HPO and PE work cards and steps per year<br />
total 197 and 1,638 respectively. The average time the KC-135<br />
fleet was NMC for scheduled isochronal maintenance during<br />
FY97 to FY06 was 2,878,133 hours out of 3,821,265 unit<br />
possessed hours, or 75.<strong>32</strong> percent. 40 Although this number seems<br />
unbelievable, and has been triple checked against the Multi-<br />
Echelon Resource and <strong>Logistics</strong> Information Network (MERLIN)<br />
database source, one possible reason for such a high scheduled<br />
maintenance rate may be due to the fact that the Air National<br />
Guard (ANG) possesses 196 airframes or nearly 40 percent of the<br />
total KC-135 fleet. 41 Since the ANG typically works only one<br />
shift per day, the doubled time to complete an inspection would<br />
contribute to the high scheduled maintenance rate when<br />
compared to the unit’s time of possession. The average NMC time<br />
<strong>Vol</strong>ume XXXII, Number 4<br />
for isochronal inspections totaled 543.0 hours per aircraft per year<br />
during FY97–FY06 and produced an availability rate of 59.9<br />
percent. 42 Additionally, the total operating costs from the <strong>AF</strong>TOC<br />
database averaged $4.184M per aircraft. 43<br />
Option 1 - Stay the Course<br />
The first option is to continue accomplishing phase and<br />
isochronal inspections under the current organizational construct<br />
but with a reduction of 402 personnel, as called for in PBD 716.<br />
However, instead of the aircraft having its inspection performed<br />
at a regional facility, this option calls for completing the<br />
inspections at the possessing base. Evenly distributing the 402<br />
manning losses across the Air Force’s 73 active duty inspection<br />
docks in operation after the projected Base Realignment and<br />
Closure-2005 adjustments equates to a loss of 5.5, or 6 whole<br />
personnel per dock. As a result, the average F-15 phase dock<br />
would drop from 30 personnel to 24 and the average KC-135<br />
isochronal dock from 35 to 29. This loss of manpower equates to<br />
an annual loss per inspection dock of 12,096 man-hours (6<br />
personnel x 8 hours per day x 252 O&M work days per year).<br />
While it is difficult to measure the exact decrease in aircraft<br />
availability that would result under this option, a loss of 6<br />
inspection personnel per F-15 dock would most likely extend<br />
the inspection of each aircraft by 1.5 days for HPO-1s, 2 days for<br />
HPO-2s, and 2.5 days for PEs. In a 1-year period, a single F-15<br />
unit with 27 assigned aircraft would fall behind the current<br />
inspection production rate by 66 days, totaling 1,584 hours of<br />
aircraft nonavailability. 44 For the KC-135, the results would be<br />
similar. An annual inspection cycle with 35 personnel requires<br />
40 days. Reducing the inspection dock down to 29 personnel<br />
would increase the time to complete the annual cycle to 48 days,<br />
causing a 12-aircraft unit to fall 96 days behind per year and lose<br />
2,304 hours of aircraft availability. As is evident, this option<br />
would negatively impact aircraft availability due to the unit<br />
requiring more days to complete phase or isochronal inspections<br />
with less manpower. Consequently, the increase in aircraft<br />
nonavailability would drive a proportional decrease in possible<br />
sorties as well.<br />
Operating costs would obviously decrease with this option<br />
due to the PBD-driven reduction in manpower. As the PBD 716<br />
document states, this reduction would provide an annual savings<br />
of $58,209 per person, or $23.4M for all 402 technicians. 45 At<br />
the unit level, the loss of 6 technicians would equate to a cost<br />
reduction of $349,254, thereby positively impacting the cost<br />
criterion. However, all other costs would remain the same.<br />
Unit control for this option, the greatest strength of the current<br />
inspection approach, remains unchanged. Although the unit will<br />
experience a lower aircraft availability rate, it will possess its<br />
assigned aircraft the same amount of days as compared to<br />
operations before PBD 716. Therefore, this option is judged as<br />
having a positive impact on this criterion.<br />
Option 2 - Fully Employ PBD 716 Initiatives:<br />
Regionalize Inspections<br />
Fully implementing PBD 716’s initiatives, as notionally<br />
determined by the Air Staff, would require units within eight<br />
aircraft types—A-10, F-15, F-16, F-22, B-1, B-52, C-130, and KC-<br />
135—to accomplish all of their phase or isochronal inspections<br />
43
at regional inspection facilities while reducing the work force<br />
by 402 personnel. The concept calls for 10 regional stateside<br />
inspection facilities for the Combat Air Forces and four such<br />
facilities for the Mobility Air Forces, as shown in Figures 3 and<br />
4.<br />
PAC<strong>AF</strong><br />
A-10: 10: Osan AB (26) (+0)<br />
F-15C: 15C: Kadena AB (68) (+0)<br />
F-15C: 15C: Elmendorf <strong>AF</strong>B (23) (+0)<br />
F-16: 16: Kunsan AB (44) (+Osan)<br />
F-16: 16: Misawa AB (29)<br />
F-22A: 22A: Elmendorf <strong>AF</strong>B (22) (+0)<br />
MDS (# Phase/ISO per yr)<br />
Base<br />
(+Add (+ Add’l Base Acft)<br />
= +1 AEF Pkg<br />
US<strong>AF</strong>E<br />
A-10: 10: Spangdahlem AB (20) (+0)<br />
F-16: 16: Spangdahlem AB (33) (+Aviano)<br />
F-15C/E: 15C/E: Lakenheath (124) (+0)<br />
F/A-22 F/A 22 (43)<br />
F-16 16 (144)<br />
Luke <strong>AF</strong>B, AZ<br />
(+Hill, +Nellis)<br />
F-15C/E 15C/E (1<strong>32</strong>)<br />
Nellis <strong>AF</strong>B, NV<br />
(+Mt Home)<br />
B-1 1 (44)<br />
Dyess <strong>AF</strong>B, TX<br />
(+ Ellsworth)<br />
B-52 52 (74)<br />
Barksdale <strong>AF</strong>B, LA<br />
(+Minot)<br />
Langley <strong>AF</strong>B, VA<br />
(+Tyndall)<br />
F-15E 15E (134)<br />
SJ <strong>AF</strong>B, NC<br />
F-16 16 (57)<br />
Shaw <strong>AF</strong>B, SC<br />
A-10 10 (87)<br />
D-M M <strong>AF</strong>B, AZ<br />
(+Nellis)<br />
F-15C 15C (83)<br />
Tyndall <strong>AF</strong>B, FL<br />
(+Langley)<br />
A-10 10 (52)<br />
Moody <strong>AF</strong>B, GA<br />
MDS (# ISO per yr)<br />
US<strong>AF</strong>E<br />
Base<br />
(+Add (+ Add’l Base Acft)<br />
KC-135: KC 135: R<strong>AF</strong> Mildenhall (15)<br />
C-130: 130: Ramstein AB (20)<br />
KC-135 KC 135 (54)<br />
Fairchild <strong>AF</strong>B<br />
(+Altus)<br />
KC-135 KC 135 (64)<br />
McConnell <strong>AF</strong>B<br />
C-5 5 (20)<br />
Dover <strong>AF</strong>B<br />
(+Travis)<br />
(+MacDill)<br />
PAC<strong>AF</strong><br />
KC-135: KC 135: Kadena AB (15)<br />
C-130: 130: Yokota AB (20)<br />
C-130 130 (144)<br />
Little Rock <strong>AF</strong>B<br />
(+Pope, Dyess) Dyess<br />
C-130: 130: Elmendorf (20)<br />
46<br />
the entire aircraft fleet causes lost time when inspection personnel<br />
are rotated among other bases and must learn the new unit’s<br />
sequencing. Secondly, the locally-developed procedures are not<br />
updated promptly, if at all, to incorporate changes due to systems<br />
or structural improvements which represents lost efficiencies.<br />
For overseas-assigned fleets, bases with similar fleets in the Transitioning to a few regional inspection facilities affords the<br />
same geographical areas would combine their inspections at a opportunity to conduct an Air Force Smart Operations 21<br />
single regional inspection site.<br />
(<strong>AF</strong>SO21) study to mitigate these inefficiencies. <strong>AF</strong>SO21 is the<br />
Aircraft availability stands to achieve significant increases Air Force’s model to harness industry process efficiencies to<br />
under this option. One of the improvements in this plan is to<br />
standardize the work cards that direct the inspection activities.<br />
Currently, almost all aircraft technical order work cards are<br />
organized according to the <strong>AF</strong>SC-tasked inspection and aircraft<br />
zone, but not according to the most efficient flow of the<br />
inspection. This has led owning organizations to develop their<br />
own inspection flow sequencing based on their own<br />
requirements and preferences. This lack of standardization across<br />
improve operational support and eliminate nonvalue-added<br />
work using efficiency tools such as Lean, Six-Sigma, and Theory<br />
of Constraints. 47 These improvements would sequence the<br />
inspection activities for maximum efficiency and standardize the<br />
inspections across the entire fleet. Additionally, a robust training<br />
program would be developed to ensure maintenance inspectors<br />
fully understood their role in the flow sequencing and the<br />
rationale behind it. Early estimates proposed that each aircraft<br />
fleet’s inspection flow time could be reduced by nearly 50 percent<br />
by incorporating these<br />
efficiencies. 48 Such reductions<br />
would enable the F-15 fleet to<br />
decrease scheduled maintenance<br />
downtime from a 10-year<br />
inspection average of 19 days to<br />
12 days per year. 49 This could<br />
potentially add 7 additional days<br />
of availability per aircraft per<br />
year and up to 14 sorties<br />
annually. A similar<br />
improvement in isochronal<br />
inspections with the KC-135<br />
fleet would decrease scheduled<br />
inspection downtime from a 10year<br />
average of 23 days to 14<br />
days per year, leading to 9<br />
additional days of availability<br />
and potentially 18 sorties per<br />
year. 50 For contingency<br />
operations, four additional<br />
deployable docks, two at each<br />
stateside regional site, would<br />
provide the capability to perform<br />
inspections at deployed sites.<br />
Aircraft availability under this<br />
second option would improve<br />
significantly. The rationale for<br />
such a prediction is based on the<br />
process efficiencies of<br />
restructuring the inspection flow<br />
for each aircraft.<br />
Costs for this option would be<br />
similar to those of the first<br />
option—reduced primarily due<br />
to the loss of 402 personnel,<br />
providing a savings of $23.4M.<br />
However, these savings would be<br />
offset by onetime costs, as shown<br />
in Table 2. 51 Figure 3. Option 2 Regional Inspection Concept—Combat Air Forces<br />
Expenses to<br />
relocate the remaining 1,020 of<br />
Figure 4. Option 2 Regional Inspection Concept—Mobility Air Forces<br />
1,555 inspection personnel to<br />
44<br />
A<br />
A<br />
A<br />
A<br />
A<br />
A<br />
A<br />
Air Force Journal of <strong>Logistics</strong>
their respective regional<br />
inspection centers, as well as<br />
fuel and travel costs incurred in<br />
ferrying the aircraft to and from<br />
the regional inspection<br />
facilities, would offset the<br />
savings. Achieving maximum<br />
benefits through an <strong>AF</strong>SO21<br />
review would require assistance<br />
by experienced consultants. A<br />
projected $300K cost to<br />
implement the new concept at<br />
each of the 27 stateside and<br />
overseas regional sites would<br />
total approximately $8M; a cost<br />
well worth decreasing<br />
inspection flows by half. 52 An<br />
additional cost of $130K to<br />
relocate special equipment,<br />
hardware, and other assets per<br />
fleet would add $1.04M. 53<br />
Despite these costs, a total<br />
projected annual savings of<br />
nearly $12M would accrue,<br />
excluding personnel relocation<br />
and aircraft ferry costs.<br />
Unit control under this<br />
option would be the factor most<br />
significantly decreased. Current<br />
inspection operations allow the<br />
unit to determine their phase or<br />
isochronal production rate to<br />
meet internal and external<br />
flying requirements. This<br />
flexibility provides a critical buffer to balance mission<br />
requirements with maintenance capacity. Internally, a unit will<br />
increase or decrease the number of inspections based on the flying<br />
hour program, sometimes phasing multiple aircraft<br />
simultaneously to yield short periods without any aircraft<br />
undergoing inspection. This approach has been a critical unit<br />
tool to support periods needed to upgrade pilots to four-ship<br />
aircraft flight lead prior to deployments or exercises.<br />
Additionally, units often preload their inspections to fly sortie<br />
surges. For example, an F-15C fighter squadron recently set a<br />
world record for the number of sorties during a 3-day surge—a<br />
feat not likely under a regional inspection concept. 54 In addition,<br />
external real-world mission requirements, such as short-notice<br />
contingency operations and deployments, would also be difficult<br />
to execute without being able to change inspection priorities or<br />
production rates. Prior to an air and space expeditionary force<br />
(AEF) rotation overseas, fighter units will typically increase or<br />
even surge their inspection production rate to amass enough<br />
inspections hours so that the unit doesn’t need to accomplish<br />
any inspections immediately upon arriving in-theater. This surge<br />
enables the unit to have sufficient spare aircraft available with<br />
adequate remaining inspection hours.<br />
Weather would also potentially impact the flow of aircraft<br />
inspections through a regional facility. Flying units normally<br />
attempt to maximize aircraft availability during the good months<br />
of summer flying—counterproductive to establishing a smooth<br />
<strong>Vol</strong>ume XXXII, Number 4<br />
Inspection Dock Calculations<br />
Before After*<br />
A-10, F-15, F-16, F-22 50 29<br />
B-1, B-52 7 4<br />
KC-135 6 4<br />
C-130 10 7<br />
Total 73 44<br />
* Based on 50 percent inspection flow reduction; does not take credit for BRAC<br />
Inspection Personnel Calculations<br />
Post-BRAC/Pre-Regional Personnel: 2,033 After<br />
A-10, F-15, F-16, F-<br />
(30/dock x 29 docks) _<br />
1,050<br />
22<br />
(30/dock x 6 AEF<br />
docks)<br />
B-1, B-52 30/dock x 4 docks 120<br />
KC-135 140<br />
C-130 245<br />
Total 1,555<br />
Cost Calculations (in $M)<br />
1 st FY = <strong>AF</strong>SO21 training/contractor and reorganization per MDS site = $0.30M<br />
2 nd FY = Regionalization/relocate assets per MDS = $0.13M<br />
Aircraft Sites FY07 FY08 FY09 FY10 FY11 Total<br />
F-16 5 $1.50 $0.13 $1.63<br />
C-130 4 $1.20 $0.13 $1.33<br />
A-10 4 $1.20 $0.13 $1.33<br />
KC-135 4 $1.20 $0.13 $1.33<br />
C-5 ** 4 $0.30 $0.13 $0.43<br />
F-15C/E 6 $1.80 $0.13 $1.93<br />
B-52 1 $0.30 $0.13 $0.43<br />
B-1 1 $0.30 $0.13 $0.43<br />
F-22 2 $0.60 $0.13 $0.73<br />
Total $2.70 $2.66 $2.66 $1.29 $0.26 $9.57<br />
Table 2. Option 2 <strong>No</strong>tional Implementation Costs<br />
fleet flow and maximizing capacity under the regional inspection<br />
dock concept. Consequently, during months of poor flying<br />
weather, the regional facilities would not have enough capacity<br />
to inspect the required number of aircraft. The regional inspection<br />
construct would require a highly responsive scheduling function<br />
in order to provide the same degree of flexibility. Finally, with<br />
inspection docks located miles away rather than just off the flight<br />
line, opportunities to cannibalize critical parts to generate sorties<br />
would be lost.<br />
This option would improve the flow days through an efficiency<br />
study, standardized inspection technical orders, efficiently<br />
sequenced actions, and a highly skilled and trained work force.<br />
These positives would be offset by the other factors that would<br />
restrict flexibility at the unit level. The unit’s ability to prepare<br />
for AEF commitments, sortie surges, and weather-driven issues,<br />
as well as respond to no-notice contingency operations, periods<br />
of low aircraft availability, time compliance technical orders<br />
(TCTO), other preventive maintenance, and pilot-training<br />
requirements would be more limited and only serve to defeat<br />
mission accomplishment. In a perfect world, this alternative<br />
would be an optimal solution; however, equipment, weather, and<br />
human requirements demand more flexibility not inherent in this<br />
option.<br />
45
Option 3 - Hybrid Solution<br />
Whereas the first and second options are merely administrative<br />
changes (improvements within an existing construct), the third<br />
option changes the model by employing RCM and MSG-3<br />
concepts to their maximum extent. First, the entire inspection<br />
continuum requires a top-to-bottom reevaluation using the<br />
analysis developed under MSG-3. Drawing on the operational<br />
systems performance data already being collected, engineers<br />
could reevaluate the FMECA for each type of aircraft and realign<br />
the inspections into intervals based on the new failure<br />
projections, establishing preventive tasks as required based on<br />
the analysis. The MSG-3 construct facilitates shifting the most<br />
time-consuming, major structural inspections to the heavy PE<br />
inspections later in the phase or isochronal cycle, which allows<br />
the light-to-medium HPO inspections to concentrate on systems<br />
reliability. 55 These minor inspections can be packaged into 6hour<br />
segments and completed during nonflying periods of the<br />
day or week at the aircraft’s assigned base. Therefore, aircraft<br />
would only need to be flown to the regional inspection facility<br />
for PEs requiring more rigorous repairs or refurbishment not<br />
possible at the home station.<br />
By employing MSG-3 on their Boeing 737 (B737) fleet of<br />
447 aircraft, Southwest Airlines has been able to sustain over<br />
3,050 flights daily with 435 of their aircraft. This equates to 97.3<br />
percent of their fleet dedicated to the daily flying schedule.<br />
Southwest Airlines accomplishes all of their light and medium<br />
inspections overnight at airports and their heavy inspections at<br />
one of three regional locations. Using the MSG-3 model,<br />
Southwest Airlines anticipates each B737’s 30-year life span will<br />
only require 82 days of downtime for scheduled inspections,<br />
resulting in a 99.97 percent aircraft availability rate throughout<br />
the aircraft’s life span. 56 Annually, this downtime averages 2.73<br />
days, or 0.7 percent, per aircraft.<br />
Analyzing this hybrid option against the aircraft availability<br />
criterion would produce the greatest benefits by far. While no<br />
US military examples of a total conversion to an MSG-3 approach<br />
exist, <strong>AF</strong>MC has begun an MSG-3 conversion study for the C-5<br />
fleet. The realignment of newly developed inspection tasks<br />
lengthened the 105-day, 420-day, and 840-day isochronal<br />
inspections to 120, 480, and 1460 days, respectively. 57 The net<br />
effect is to increase C-5 fleet aircraft availability by 5 aircraft per<br />
year, a 4.5 percent increase in aircraft availability. 58<br />
Applying the MSG-3 construct to the F-15 inspection<br />
continuum would allow the preponderance of structural<br />
inspections to be accomplished during PE checks. Consequently,<br />
HPOs could be limited to systems inspections and packaged into<br />
smaller segments that could be accomplished across several days<br />
during nonflying periods. For example, currently an F-15<br />
averages 450 hours per year undergoing scheduled phase<br />
inspections. 59 The complete F-15 phase cycle takes<br />
approximately 5 years to complete, averaging 94 days of<br />
scheduled downtime per aircraft during that period. Because PEs<br />
require 10 days out of this entire cycle, the ability to be able to<br />
accomplish all HPOs on the ramp would add 84 days of aircraft<br />
availability over 5 years, or nearly 17 days per year for each F-<br />
15. The total extra days of availability across the fleet of 482<br />
aircraft would be the equivalent of gaining 17 additional F-15s<br />
per year and equates to a 4.6 percent increase in aircraft<br />
availability. 60 For FY06, the availability rate of 68.7 would have<br />
increased to 73.3 percent, surpassing the Air Force goal of 68.5<br />
46<br />
percent. 61 While it is unrealistic to assume that the aircraft would<br />
remain mission capable during the HPOs, estimating a 25 percent<br />
nonmission capable time during the inspections would still yield<br />
an additional 17 aircraft per year and a 3.5 percent increase in<br />
availability.<br />
The KC-135 fleet would likewise benefit from an MSG-3<br />
analysis and inspection approach. Over a 10-year period, each<br />
KC-135 was unavailable for an average of 23 days a year due to<br />
scheduled isochronal inspections. 62 The KC-135 is required to<br />
complete an entire isochronal cycle of six inspections within 12<br />
months. 63 Assuming that five of the six light and medium HPOs<br />
consume 13 days and the sixth heavy PE accounts for 10 days,<br />
the MSG-3 reevaluation would repackage inspection tasks into<br />
6-hour segments. This would allow the light and medium HPOs<br />
to be conducted at the base, while the heavy PEs would occur at<br />
a regional inspection facility. Consequently, each KC-135 could<br />
be available 13 additional days per year, increasing the fleet<br />
availability rate by 3.5 percent. The total extra days of availability<br />
across the fleet of 530 aircraft would be the equivalent of gaining<br />
nearly 19 additional KC-135s per year, equating to an increase<br />
in availability from 61.4 to 64.9 percent for FY06, surpassing<br />
the Air Force goal of 61.4 percent. 64 Assuming a similar 25<br />
percent nonmission capability during the minor inspections<br />
would still yield 14 additional aircraft and a 2.9 percent<br />
availability rate increase.<br />
Of course, this hybrid option is not without significant costs.<br />
Conducting the MSG-3 analysis requires a substantial<br />
investment in time, resources, and personnel. However, one<br />
aviation maintenance expert predicts “conversion to an MSG-3<br />
based maintenance schedule will provide significant and tangible<br />
returns [with] as much as a 30 percent reduction in scheduled<br />
maintenance costs.” 65 For the C-5 fleet, <strong>AF</strong>MC has invested<br />
approximately $7M to date to standardize historical performance<br />
data and conduct a complete FMECA evaluation of all the<br />
aircraft’s systems. 66 This effort began in 2002 with a staff that<br />
included engineers, analysts, systems technicians, maintenance<br />
overhaul representatives, OEM representatives, flight crews, and<br />
quality assurance personnel. 67 Their strategic intent was to reduce<br />
costs and increase aircraft availability by increasing inspection<br />
intervals without compromising safety. 68 These goals have<br />
yielded a cost avoidance of <strong>32</strong> percent for the C-5As and 5 percent<br />
for the C-5B fleet through the interval changes. 69 Although the<br />
finalized cost data has not been fully tabulated, the cost<br />
avoidances are in the multimillion dollar range due to the<br />
inspection interval changes. 70<br />
Applying a similar percentage based on the C-5’s financial<br />
gains against the two test case aircraft would most likely yield<br />
similar investment costs and cost avoidances due to the MSG-3<br />
efforts. If a modest 10 percent cost avoidance factor were applied<br />
to the F-15 unit-level consumable costs, the annual savings could<br />
amount to $9.46M per year (10 percent of the average costs<br />
during FY97-FY06). 71 However, an estimated cost to conduct the<br />
MSG-3 study for the F-15 fleet could total as much as $10M.<br />
Amortizing the $10M cost of the MSG-3 study across the entire<br />
fleet of 482 aircraft would amount to a onetime investment of<br />
$20,750 per aircraft. The net savings across the FYDP of 5 years<br />
would include the $10M MSG-3 study cost and the $47.3M cost<br />
avoidance in unit-level consumables, yielding a net FYDP<br />
savings of $37.3M.<br />
Air Force Journal of <strong>Logistics</strong>
If the same modest 10 percent cost avoidance factor were<br />
applied to the KC-135 unit-level consumable costs, the annual<br />
savings could reach $8.28M (10 percent of the average costs<br />
during FY97–FY06). 72 As with the F-15, accounting for the $10M<br />
investment to conduct the MSG-3 study across the fleet of 530<br />
KC-135s would produce a cost per aircraft of $18,870. The net<br />
savings across the FYDP would include the $10M MSG-3 study<br />
cost and the $41.4M cost avoidance in unit-level consumables,<br />
yielding a net FYDP savings of $31.4M.<br />
Moreover, this hybrid option would accrue the $23.4M<br />
savings projected from the reduction of 402 personnel due to<br />
the PBD 716 manpower cuts. However, rather than moving all<br />
remaining 1,555 inspection personnel to regional facilities, only<br />
a percentage would be required at the central inspection sites,<br />
due to the MSG-3’s lengthened intervals for heavy inspections.<br />
Therefore, a greater percentage of inspection personnel could<br />
remain within their unit to assist with the onsite light and medium<br />
inspections. Furthermore, the inspection personnel would be<br />
assigned to the sortie generating squadron so that they could form<br />
the inspection cadre to accomplish the light and medium checks,<br />
train other flight line personnel in these duties, and contribute<br />
to sortie generation activities during slack inspection periods.<br />
Because of the realignment of inspection tasks and lengthened<br />
intervals, fewer aircraft would flow through the regional<br />
inspection facilities. Assuming that the heavy PE inspections<br />
would account for one-sixth of all current base-level inspections,<br />
as is the case with the F-15 and KC-135, then just one-sixth of<br />
unit inspection personnel would need to be assigned to the<br />
regional facility. Even if 20 percent of the 1,555 inspection<br />
personnel were required to perform the heavy PEs, only 311<br />
personnel would need to be relocated to the regional sites—a<br />
substantial cost savings compared to Option 2’s requirement to<br />
move all 1,555.<br />
Finally, unlike under Options 1 and 2, the hybrid alternative<br />
maximizes unit control of assigned aircraft. This option enables<br />
the unit to conduct its light and medium inspections at the base<br />
using the MSG-3 approach. Being able to break inspections into<br />
small, 6-hour blocks enables a unit to more readily control the<br />
inspection flow to better meet unforecasted requirements,<br />
taskings, and AEF deployment demands. Furthermore, the unit<br />
still retains the inspection personnel who can deploy with them<br />
to the AEF location to ensure that inspections are accomplished<br />
during the deployment. These benefits are simply not available<br />
under the regionalized concept of Option 2.<br />
Summary and Implementation<br />
Considerations<br />
This chapter has examined three options for allowing the Air<br />
Force to perform phase and isochronal inspections with 402 fewer<br />
personnel. Option 1 retains the current inspection concept of<br />
performing the inspections at the base but with 402 fewer<br />
personnel. Unfortunately, with less manpower to complete<br />
inspection tasks under the current construct, inspection time<br />
would increase, causing aircraft availability to decrease. Option<br />
2 sends all aircraft to a regional inspection facility. As compared<br />
to Option 1, this option would improve aircraft availability but<br />
would require implementation expenditures and significantly<br />
degrade a unit’s flexibility to accomplish mission requirements<br />
and thereby control the health of its fleet.<br />
<strong>Vol</strong>ume XXXII, Number 4<br />
Option 3 provides a hybrid solution that significantly<br />
improves both aircraft availability and unit control. This option<br />
requires approximately $10M per aircraft fleet, or $80M across<br />
the Air Force’s eight aircraft types, to conduct the failure analysis<br />
and to determine the inspection task packaging for the MSG-3<br />
approach. The initial investment is minimal when compared to<br />
the gains. When analyzed against the F-15 and KC-135 fleets,<br />
the MSG-3 approach offers the equivalent of gaining 31<br />
additional aircraft per year from both fleets. This option packages<br />
the minor inspections into 6-hour segments that can be<br />
accomplished overnight or between sorties by personnel assigned<br />
to the sortie generating unit who can continue the inspection<br />
rhythm at home station or deployed to a combat environment.<br />
Consequently, the unit to which the aircraft are assigned retains<br />
both responsibility and authority for the health of their fleet. Pride<br />
of ownership, as General Wilbur Creech demonstrated with the<br />
dedicated crew chief program during his tenure as commander<br />
of Tactical Air Command, is not inconsequential for maintaining<br />
and improving aircraft readiness levels. Additionally, Option 3’s<br />
plan to fly the aircraft to a regional inspection facility for the<br />
heavy, structure-focused inspections leverages the regional<br />
experience and industrial-type test and repair equipment not<br />
found at the base level.<br />
Most importantly, by fully supporting the most significant<br />
Army restructuring in the last 50 years, Option 3 offers significant<br />
benefits for Joint operations. In keeping with their emphasis on<br />
expeditionary, brigade-sized organizations, the Army is<br />
eliminating 36 heavy field artillery units, 10 air defense units,<br />
and 19 armor units to build military police, civil affairs,<br />
psychological, and biological detection units. 73 As a result, the<br />
Army will fully rely on the Air Force and the other Services to<br />
provide their artillery fire support through improved precision<br />
attack munitions. Option 3’s opportunities for increased aircraft<br />
availability and unit control establish the foundation for the Air<br />
Force to better shoulder this Joint fire support responsibility and<br />
increase its relevance in the Joint arena. Even though the savings<br />
for Option 2 are greater in the short term, Option 3 provides<br />
hundreds more airframes across the entire fleet every year; a long<br />
term increase in aircraft availability that more than justifies the<br />
initial additional investment. In today’s environment of Joint<br />
interdependency and constrained aircraft recapitalization, the<br />
low-risk, high-yield dividends demand serious consideration of<br />
Option 3. Table 3 summarizes the key aircraft availability, cost,<br />
and unit control data for the F-15 and KC-135 test cases.<br />
To implement a vigorous MSG-3 reevaluation across the eight<br />
or more weapon systems candidates, several actions need to be<br />
taken. At the Air Staff level, policy and sufficient funding must<br />
be established for conducting the MSG-3 review and analyses.<br />
The process needs to be formalized, with standardized guidance<br />
for mandatory participants [Headquarters United States Air Force,<br />
major commands (MAJCOM), system program offices (SPO), and<br />
others] regarding responsibilities, time lines, and funding<br />
requirements. A decision and approval process for initiating and<br />
conducting subsequent iterative MSG-3 reevaluations needs to<br />
be established. The lead MAJCOMs for the candidate aircraft<br />
need to partner with the SPOs to standardize the inspections flow<br />
for the most efficient sequence, devise user-friendly, industrystandard<br />
type work cards to improve technician efficiency, and<br />
fund <strong>AF</strong>SO21 consultants to outline the most efficient way ahead.<br />
Additionally, the commands must develop acceptable levels of<br />
47
Aircraft Availability<br />
(AA)<br />
system degradation and formalize them in a revised minimum<br />
essential systems list (MESL) to balance mission requirements<br />
against sustainment costs. Along with these changes, the new<br />
inspection process must be gradually phased in, allowing pilot<br />
units to test and refine the new system before employing it across<br />
the fleet. Finally, units need to set up training programs for their<br />
inspection personnel and employ <strong>AF</strong>SO21 consultants to assist<br />
in transitioning to the new MSG-3 inspection construct. These<br />
recommendations would create the type of responsive and<br />
predictive inspection environment that would produce improved<br />
aircraft availability and reliability with decreased operating costs.<br />
48<br />
Conclusion<br />
As the author of the Bible verse in Ecclesiastes observed, there<br />
is a time for everything, including change. The budgetary<br />
decreases across the next several FYDPs mandate that the Air<br />
Force reexamine all of its current processes. Driven by the<br />
manpower cuts dictated in PBD 716 and 720, the time for<br />
changing aircraft inspections is now. Increasing aircraft<br />
availability while decreasing operating costs without sacrificing<br />
combat capability requires more than mere administrative<br />
changes to the Air Force’s current phase and isochronal inspection<br />
processes.<br />
Compelling reasons exist to radically change the current<br />
inspection process. The Air Force’s inventory of aircraft has<br />
become more geriatric than ever before, leading to increased<br />
downtime due to inspections and age-related maintenance<br />
factors. Consequently, operating costs for these mature aircraft<br />
fleets have soared 83 percent over the last decade. 74<br />
Because of the projected budget shortfalls, aircraft<br />
recapitalization programs will be severely constrained and will<br />
COMPARISON OF THE THREE OPTIONS<br />
Option 1<br />
Stay the Course<br />
Option 2<br />
Regionalize Inspections<br />
Option 3<br />
Hybrid MSG-3<br />
Solution<br />
F-15 KC-135 F-15 KC-135 F-15 KC-135<br />
Decreases<br />
1,177 days*<br />
(Equiv of<br />
4 less<br />
F-15s/yr;<br />
-0.7%<br />
AA)<br />
Decreases<br />
4,240 days*<br />
(Equiv of<br />
12 less<br />
KC-135s/yr;<br />
-2.2%<br />
AA)<br />
Operating Cost <strong>No</strong> additional savings<br />
above $23.4M FYDP<br />
Manpower Savings for all<br />
Air Force Fleets<br />
Unit Control Retain in Status Quo<br />
Increases<br />
3,374<br />
days*<br />
(Equiv of<br />
9 more<br />
F-15s/yr;<br />
+1.9%<br />
AA)<br />
Increases<br />
4,770<br />
days*<br />
(Equiv of<br />
13 more<br />
KC-135s/yr;<br />
+2.7%<br />
AA)<br />
Increases<br />
6,146<br />
days**<br />
(Equiv of<br />
17 more<br />
F-15s/yr;<br />
+3.5% AA)<br />
Increases<br />
5,167<br />
days**<br />
(Equiv of<br />
14 more<br />
KC-135s/yr<br />
+2.9%<br />
AA)<br />
Additional Investment of: Additional Savings of:<br />
$1.93M in<br />
FYDP<br />
$1.33 M in<br />
FYDP<br />
$37.3M***<br />
In FYDP;<br />
$9.46M/FY<br />
Thereafter<br />
$31.4M***<br />
In FYDP;<br />
$8.28M/FY<br />
Thereafter<br />
Significantly Decreased in Retained in MSG-3<br />
Approach<br />
Regionalization Approach Approach h<br />
* Increases/decreases are calculated across the entire fleet of 482 F-15 and 530 KC-135 aircraft.<br />
** Accounts for assumed 25% nonmission capable status during light and medium inspections.<br />
*** FYDP savings deducts the one-time $10M investment for the MSG-3 study; annual savings; thereafter<br />
would be based on 5-year savings of $47.3M (F-15) and $41.4M (KC-135).<br />
Table 3. Comparison of the Three Inspection Options<br />
take 20 years or longer to fully replace their predecessors. As a<br />
result, older aircraft will be forced to continue in service to cover<br />
the combat capability gaps until the replacement aircraft achieve<br />
full strength. Additionally, the cost of replacement weapons<br />
systems has become so great that Congress has enacted<br />
legislation to prevent the Air Force from retiring aircraft, forcing<br />
older aircraft to be flown and be maintained for longer periods<br />
to maximize their return on investment.<br />
Overlaid on these factors is the fact that the Air Force has been<br />
engaged in combat operations since 1991 and will likely<br />
continue to be for the foreseeable future. The combination of high<br />
operations tempo, an aging total fleet, and continual personnel<br />
reductions makes it imperative for the Air Force to apply <strong>AF</strong>SO21<br />
concepts to the aircraft inspection process. The threat of terrorism<br />
and asymmetric warfare has forced the Air Force to be continually<br />
ready to deploy and fight. The Army’s transformation and<br />
increasingly joint nature of military operations make it<br />
imperative for the Air Force to achieve and sustain the highest<br />
levels of aircraft availability possible. With the PBD-driven<br />
manpower reductions, the Air Force cannot continue to carry out<br />
the current manpower-intensive inspection requirements and still<br />
sustain today’s levels of combat capability. The MSG-3 approach<br />
offers the Air Force an opportunity to fully exploit <strong>AF</strong>SO21<br />
efficiencies to produce combat-ready aircraft with increased<br />
availability, reduced cost, and improved unit control through<br />
an iterative and responsive inspection construct. Transforming<br />
the aircraft inspection process is one approach to produce the<br />
efficiencies required to better defend the United States and her<br />
allies in the global war against terrorism.<br />
Air Force Journal of <strong>Logistics</strong>
<strong>Vol</strong>ume XXXII, Number 4<br />
<strong>No</strong>tes<br />
1. Ecclesiastes 3:1-8, The Holy Bible, New King James Version.<br />
2. Department of Defense, Program Budget Decision (PBD) 720: Air<br />
Force Transformation Flight Plan, Washington, DC: Office of the<br />
Under Secretary of Defense [Comptroller], 28 December 2005, 11.<br />
3. Department of Defense, Program Budget Decision (PBD) 716:<br />
Directed Offsets - Air Force, Washington, DC: Office of the Under<br />
Secretary of Defense [Comptroller], 20 December 2005, 9.<br />
4. Aircraft initially proposed by Headquarters US<strong>AF</strong>/A4MY in Fall 2005<br />
as potential candidates for regionalized inspections were the active<br />
duty A-10, F-15, F-16, F-22, B-1, B-52, C-130, and KC-135 fleets.<br />
5. Lt Gen Donald Wetekam, DCS/Installations & <strong>Logistics</strong>, HQ US<strong>AF</strong>/<br />
A4, and Lt Gen Richard Reynolds, Vice Commander, HQ <strong>AF</strong>MC to<br />
directors of logistics at HQs AMC, <strong>AF</strong>MC, ACC, and <strong>AF</strong>SOC, letter, 8<br />
April 2005. This letter directed the 20 percent aircraft availability by<br />
FY11. Later, HQ US<strong>AF</strong>/A4M and HQ <strong>AF</strong>MC/A4 included the 10<br />
percent cost reduction effort in the August 2006 AAIP.<br />
6. Col John Stankowski, Chief, Weapons System Division, HQ US<strong>AF</strong>/<br />
A4MY, Briefing, subject: eLog21 - AAIP, 1 December 2006, slides<br />
3-25. The AAIP was formed in April 2005 to improve depot overhaul<br />
efficiency and parts processes for 20 aircraft fleets.<br />
7. Department of Defense, Program Budget Decision 716: Directed<br />
Offsets - Air Force, 2.<br />
8. Lt Gen Steve Wood, Director of Requirements, Headquarters US<strong>AF</strong>/<br />
A8, Subject: Blue Horizons, Briefing, 3 August 2006, Slide 22.<br />
9. Headquarters US<strong>AF</strong>/A4MY, subject: What are the Effects of Aging?,<br />
2 February 2006, slide 1.<br />
10. Air Force Portal, Applications: Multi-Echelon Resource and <strong>Logistics</strong><br />
Information Network (MERLIN), Mission Performance, MMH per<br />
FH for total Air Force inventory, FY91-FY05, [Online] Available:<br />
https://www.my.af.mil/merlinprod/MissionPerformance/<br />
mission_WSA_unit.asp, accessed 18 February 2007.<br />
11. Lt Gen Wood, Blue Horizons, slide 23.<br />
12. Department of Defense, Operating and Support Cost-Estimating Guide,<br />
Washington, DC: Office of the Secretary of Defense [Cost Analysis<br />
Improvement Group (CAIG)], May 1992, 4-1 to 4-8. The CAIG is an<br />
OSD body that analyzes merged data from the <strong>AF</strong>TOC, Reliability<br />
and Maintainability Information System (REMIS), Multi-Echelon<br />
Resource and <strong>Logistics</strong> Information Network (MERLIN), and<br />
Personnel Data System (PDS) systems. There are seven main CAIGelement<br />
categories of cost data contained in the <strong>AF</strong>TOC: mission<br />
personnel pay and allowances, unit-level consumption, intermediate<br />
maintenance, depot maintenance, contractor support, sustaining<br />
support, and indirect support.<br />
13. Lt Gen Wood, Blue Horizons, slide 21.<br />
14. Maj Gen Frank Faykes, Deputy Assistant Secretary for Budget<br />
(Financial <strong>Management</strong> and Comptroller), Headquarters S<strong>AF</strong>/FMB,<br />
subject: FY07 US<strong>AF</strong> Posture & Acquisition Hearing (HAC-D) briefing,<br />
8 March 2006, slide 10.<br />
15. Webster’s Third New International Dictionary of the English Language,<br />
Unabridged, s.v. “isochronal.”<br />
16. Air Force Instruction (<strong>AF</strong>I) 21-101, Aircraft and Equipment<br />
Maintenance <strong>Management</strong>, 29 June 2006, 24-25.<br />
17. Col Steve Schumacher, Chief, Weapons System Division,<br />
Headquarters US<strong>AF</strong>/A4MY, subject: “Cost To Sustain & Operate Select<br />
Aging Aircraft,” briefing, 15 <strong>No</strong>vember 2005, slide 5.<br />
18. Gen John Jumper, Chief of Staff (CS<strong>AF</strong>), Headquarters US<strong>AF</strong>, “Wing<br />
Organization Evolution, 1947-2002,” briefing, 21 February 2003,<br />
slide 37.<br />
19. <strong>AF</strong>I 21-101, Aircraft and Equipment Maintenance <strong>Management</strong>, 29<br />
June 2006, 381.<br />
20. Dave Nakata, “Why Transition to a MSG-3 Based Maintenance<br />
Schedule?,” EmpowerMX White Paper, [Online] Available: http://<br />
www.empowermx.com/whitepapers/MSG3.pdf, accessed 12<br />
December 2006.<br />
21. F. Stanley <strong>No</strong>wlan and Howard F. Heap, Reliability-Centered<br />
Maintenance, San Jose, CA:Dolby Access Press, 1978, 5-6.<br />
22. Airline Transport Association (ATA) of America MSG-3, Operator/<br />
Manufacturer Scheduled Maintenance Development, Revision<br />
2003,1,5.<br />
The ATA is the principle trade organization of major US airlines,<br />
OEMs, and other airline-related businesses.<br />
23. Dave Nakata, “Why Transition to a MSG-3 Based Maintenance<br />
Schedule?” 1-2.<br />
24. <strong>No</strong>wlan and Heap, Reliability-Centered Maintenance, vii.<br />
25. ATA of America MSG-3, Operator/Manufacturer Scheduled<br />
Maintenance Development, 4.<br />
26. DoD MIL-STD 1629A, Procedures for Performing a Failure Mode,<br />
Effects and Criticality Analysis, 24 <strong>No</strong>vember 1980, iii.<br />
27. Ibid.<br />
28. Scott Vandersall, Chief Engineer (C-5), 730th Aircraft Sustainment<br />
Group (<strong>AF</strong>MC), “Maintenance Steering Group 3 (MSG-3),” briefing,<br />
17 January 2006, slide 6.<br />
29. ATA of America MSG-3, Operator/Manufacturer Scheduled<br />
Maintenance Development, 12.<br />
30. ATA of America MSG-3, Operator/Manufacturer Scheduled<br />
Maintenance Development, 7-8.<br />
31. Dr Edward Rogers and Col Robert P. Birmingham, USA, “A Ten-<br />
Year Review of the Vision for Transforming the Defense Acquisition<br />
System,” Defense Acquisition Review Journal, January-April 2004,<br />
38-40, [Online] Available: http://www.dau.mil/pubs/arq/2004arq/<br />
Rogers.pdf.<br />
<strong>32</strong>. Discussion with Col Steve Schumacher, Chief, Weapons System<br />
Division, Headquarters US<strong>AF</strong>/A4MY, Pentagon, DC, 7 April 2006.<br />
33. Colonel Schumacher, “Enterprise View of Aircraft Inspections,”<br />
briefing, slides 36-37.<br />
34. The complete cycle for an F-15 phase inspection requires an HPO-1,<br />
HPO-2, HPO-1, HPO-2, HPO-1, and PE to produce 1,200 phase hours.<br />
The HPO-1 contains 494 steps in 77 separate work cards, totaling 120<br />
man-hours. The HPO-2 includes the HPO-1 inspection items and<br />
comprises 673 steps in 114 work cards and nearly 201 man-hours to<br />
complete. The PE includes both HPOs, has 705 steps in 125 work<br />
cards, and requires 239.4 man-hours to complete.<br />
35. Technical Order (TO) 1F-15A-6WC-5, Workcards: Periodic<br />
Inspection, US<strong>AF</strong> Series F-15A/B/C/D Aircraft, Change 20, 15 August<br />
1999, i to 3-11.<br />
36. Scott Finley, Chief Analyst, Headquarters US<strong>AF</strong>/A4MY; data retrieved<br />
from Air Force Portal, Applications: Reliability and Maintainability<br />
Information System (REMIS - US<strong>AF</strong>), Scheduled Maintenance<br />
Downtime for F-15 and KC-135 Aircraft, FY1997-FY2006, [Online]<br />
Available: https://www.my.af.mil/merlinprod/MissionPerformance/<br />
mission_WSA_unit.asp, accessed 31 January 2007.<br />
37. Air Force Portal, Applications: Multi-Echelon Resource and <strong>Logistics</strong><br />
Information Network (MERLIN), Mission Performance, Weapon<br />
Systems Availability for KC-135, FY97-FY06, [Online] Available:<br />
https://www.my.af.mil/merlinprod/MissionPerformance/<br />
mission_WSA_unit.asp, accessed 31 January 2007. Larry Klapper,<br />
Financial Analyst, Air Force Cost Analysis <strong>Agency</strong> (<strong>AF</strong>CAA), data<br />
retrieved from <strong>AF</strong>TOC database, CAIG elements for F-15 and KC-<br />
135 fleets, 6 February 2007.<br />
38. TO 1C-135A-6WC-1, All 135 Aircraft: Preflight/Postflight/Hourly<br />
Post-Flight Inspection Workcards, Change 10, 1 August 2005, I-14.<br />
39. TO 1C-135A-6WC-2, All -135 Aircraft: Periodic Inspection<br />
Workcards, Change 5, 1 August 2005, I-01.<br />
40. Scott Finley, REMIS - US<strong>AF</strong>, Scheduled Maintenance Downtime for<br />
F-15 and KC-135 Aircraft.<br />
41. “Major Commands,” Air Force Magazine, Journal of the Air Force<br />
Association: 2006 US<strong>AF</strong> Almanac 89, <strong>No</strong> 5, [Online] Available: http:/<br />
/www.afa.org/magazine/may2006/0506majcoms.pdf, May 2006,<br />
114-116.<br />
42. Scott Finley, REMIS - US<strong>AF</strong>, Scheduled Maintenance Downtime for<br />
F-15 and KC-135 Aircraft, and Air Force Portal, Applications:<br />
MERLIN, Mission Performance, Weapons Systems Availability for<br />
KC-135, FY97-FY06, 31, accessed January 2007.<br />
43. Larry Klapper, <strong>AF</strong>TOC database, CAIG elements for F-15 and KC-<br />
135 fleets, 6 February 2007.<br />
44. The extra days were derived from the total time an inspection currently<br />
requires—the HPO-1 takes 6 days to complete with 30 technicians<br />
working 8 hours for 1,440 total man-hours; the HPO-2, 8 days at 1,920<br />
total man-hours; and the PE, 10 days at 2,400 total man-hours. This<br />
was compared to the number of days required with 6 less technicians<br />
per inspection.<br />
45. DOD, PBD 716: Directed Offsets - Air Force, 2.<br />
46. Colonel Schumacher, “Enterprise View of Aircraft Inspections,”<br />
briefing, slides 36-37.<br />
47. Brig Gen S. Gilbert, Director of Air Force Smart Ops, Headquarters<br />
US<strong>AF</strong>/A3-SO, “<strong>AF</strong>SO21: Air Force Smart Ops for the 21st Century,”<br />
3 January 2007, slide 5.<br />
49
48. Colonel Schumacher, “Enterprise View of Aircraft Inspections,”<br />
briefing, slide 34.<br />
49. Scott Finley, REMIS - US<strong>AF</strong>, Scheduled Maintenance Downtime for<br />
F-15 and KC-135 Aircraft. The 12 days of scheduled maintenance<br />
downtime includes 2 days required to deliver the aircraft to and from<br />
the regional site.<br />
50. Ibid.<br />
The 14 days of scheduled maintenance downtime includes 2 days<br />
required to deliver the aircraft to and from the regional site.<br />
51. Colonel Schumacher, “Enterprise View of Aircraft Inspections,”<br />
briefing, slide 36.<br />
52. Ibid.<br />
53. Ibid.<br />
54. Author’s personal experience while assigned as the squadron<br />
maintenance officer, 60th Fighter Squadron (FS), 33rd Fighter Wing<br />
(ACC), Eglin <strong>AF</strong>B, FL. The 60 FS made Air Force history in 2000 by<br />
flying 130 sorties in a single day and 362 over 3 days; eclipsing the<br />
world record by 18 sorties for 1-day and 37 sorties for 3-day flying<br />
windows.<br />
55. Scott Vandersall, “MSG-3,” briefing, slide 4.<br />
56. Author’s discussion with Gregg Brown, Manager, Regulatory<br />
Compliance, Southwest Airlines), 23 February 2006.<br />
57. Scott Vandersall, “MSG-3,” briefing, slide 12.<br />
58. Scott Vandersall, “MSG-3,” briefing, slide 57.<br />
59. Scott Finley, REMIS - US<strong>AF</strong>, Scheduled Maintenance Downtime for<br />
F-15 and KC-135 Aircraft.<br />
60. Additional F-15s per year calculated by multiplying fleet of 482 by<br />
17 extra days and dividing by 365 days per year to yield 22.<br />
61. Air Force Portal, Applications: MERLIN, Mission Performance,<br />
Weapon Systems Availability for F-15A-D, FY97-FY06, 29 January<br />
2007, and MERLIN, Readiness Review, 12 December 06, slide 3,<br />
[Online] Available: https://www.my.af.mil/merlinprod/<br />
MissionPerformance/mission_WSA_unit.asp, both accessed 29<br />
January 2007.<br />
62. Scott Finley, REMIS - US<strong>AF</strong>, Scheduled Maintenance Downtime for<br />
F-15 and KC-135 Aircraft.<br />
63. TO 1C-135A-6WC-1, All 135 Aircraft: Preflight/Postflight/Hourly<br />
Post-Flight Inspection Workcards, I-14.<br />
64. Air Force Portal, Applications: MERLIN, Mission Performance,<br />
Weapon Systems Availability for F-15A-D, FY97-FY06, 29 January<br />
2007, and MERLIN, Readiness Review, 12 December 06, slide 3.<br />
50<br />
For Want of a Spanner<br />
65. Dave Nakata, “Why Transition to a MSG-3 Based Maintenance<br />
Schedule?,” 3.<br />
66. Author’s interview with Scott Vandersall, 22 February 2006.<br />
67. Scott Vandersall, MSG-3, slide 21.<br />
68. Scott Vandersall, MSG-3, 22.<br />
69. Scott Vandersall, MSG-3, 57.<br />
70. Ibid.<br />
71. Larry Klapper, <strong>AF</strong>TOC database, CAIG elements for F-15 and KC-<br />
135 fleets, 6 February 2007.<br />
72. Ibid.<br />
73. Col Gene Kamena, “US Army Service Employment,” briefing Air War<br />
College, Maxwell <strong>AF</strong>B, Alabama, 21 <strong>No</strong>vember 2006, slide 29.<br />
74. Lt Gen Wood, Blue Horizons, slide 21.<br />
Colonel Donald A. Van Patten is a career aircraft<br />
maintenance officer. At the time of writing of this article he<br />
was a student at the Air War College, Maxwell <strong>AF</strong>B,<br />
Alabama. His maintenance assignments have taken him to<br />
bases in Air Education and Training Command, Air Combat<br />
Command, and United States Air Forces in Europe,<br />
sustaining F-16A/B/C/D, F-15C/D, EF/F-111E and A-10<br />
aircraft, and other joint and NATO aircraft while assigned<br />
to Operations PROVIDE COMFORT and NORTHERN<br />
WATCH. He commanded the 33 d <strong>Logistics</strong> Support<br />
Squadron and 33 d Maintenance Squadron at Eglin <strong>AF</strong>B,<br />
FL, followed by a tour in the Pentagon as Chief of Base<br />
Maintenance Policy and Chief of Tanker Aircraft<br />
Sustainment in the Chief of Staff Deputate for Installations<br />
and <strong>Logistics</strong>, Headquarters, United States Air Force.<br />
Colonel Van Patten holds a bachelor of arts degree from<br />
Iowa State University, a master of science degree from<br />
Golden Gate University, a master of arts degree from the<br />
Air Command and Staff College, Air University, and a master<br />
of arts degree from Air War College, Air University. He is<br />
currently the Deputy Commander, 57 th Maintenance Group,<br />
Nellis <strong>AF</strong>B, Nevada<br />
A<br />
curious minor logistical mystery of Royal Air Force History in World War II was the shortage of<br />
hand tools. This lasted well into 1943, four years after the war began and nine years after rearmament<br />
started in 1934.<br />
Before wartime expansion, fitters and riggers did their initial course at <strong>No</strong>. 1 Technical Training School at<br />
Habton. They specialized either as engine fitters or as airframe riggers. Upon completion of the course, they were<br />
sent to squadrons where in seven years their education was completed.<br />
At the squadron they reported to A, B, or C Flight where they were issued a toolkit. If they were transferred from<br />
one flight to another, they had to turn in their toolbox and have the contents accounted for before proceeding<br />
across the street to draw another set from their new flight. In biplane days, a fitter or a rigger assigned to a two<br />
seater not only acted as the gunner, but in colonial theaters lashed his toolbox to the wing next to the fuselage in<br />
case of a forced landing.<br />
What makes the case of the missing hand tools so intriguing is that the historical documentation concerning<br />
the ordering of such necessary items has disappeared (meaning it has either been destroyed or it has been filed<br />
with the papers of a successor organization of unlikely title).<br />
The first clue to the problem came from the Operational Record Book (ORB) of a repair and salvage unit (RSU)<br />
in the Middle East in 1940 which opened by noting that of the RSU’s 62 personnel, only 25 had tools. So they<br />
were happy to pass on salvaged aircraft to whoever claimed them.<br />
What this meant was that in a theater then desperate for serviceable aircraft, many were standing idle because<br />
the necessary repairs could not be made for want of a spanner, let alone the necessary spares.<br />
But the matter is important because in 1943 in Burma (South-East Asia Command or SEAC), the Beaufighters<br />
of <strong>No</strong>. 26 Squadron only sortied once every 18 days due to lack of tools and spares.<br />
The fact that the R<strong>AF</strong> had insisted on standardized nuts, bolts and other fittings meant that special tools were<br />
not needed. Unserviceability was due to the unavailability of regular tools.<br />
Robin Higham, PhD<br />
Air Force Journal of <strong>Logistics</strong>
Guidebooks:<br />
What You Need,<br />
When You Need It!<br />
<strong>Vol</strong>ume XXXII, Number 4<br />
Contingency contracting<br />
support has evolved from<br />
purchases under the<br />
simplified acquisition<br />
threshold to major defense<br />
procurement and interagency<br />
support of commodities,<br />
services, and construction for<br />
military operations and other<br />
emergency relief. Today, this<br />
support includes<br />
unprecedented reliance on<br />
support contractors in both<br />
traditional and new roles.<br />
Keeping up with these<br />
dramatic changes, while<br />
fighting the Global War on<br />
Terror, is an ongoing<br />
challenge.<br />
This pocket-sized handbook<br />
and its accompanying DVD<br />
provide the essential<br />
information, tools, and training<br />
for contracting officers to<br />
meet the challenges they will<br />
face, regardless of the mission<br />
or environment.<br />
<strong>AF</strong>LMA<br />
Generating Transformational<br />
Solutions Today; Shaping<br />
the <strong>Logistics</strong> Enterprise of<br />
the Future<br />
51
52<br />
http://www.aflma.hq.af.mil/lgj/Afjlhome.html<br />
Fighting that annual<br />
requirement to<br />
publish?<br />
Air Force Journal of <strong>Logistics</strong> . 501 Ward Street . Maxwell<br />
<strong>AF</strong>B, Gunter Annex, Alabama 36114-<strong>32</strong>36 . (334) 416-2335<br />
Air Force Journal of <strong>Logistics</strong>
Enterprise Architecture: Origins, Tools, and Insights<br />
Transforming Army Supply Chains: an Analytical Architecture for <strong>Management</strong> Innovation<br />
Leaning the DoD Supply Chain: the DoD Activity Address Code<br />
Contemporary Issues in this edition<br />
presents three articles: “Enterprise<br />
Architecture: Origins, Tools, and<br />
Insights,” “Transforming Army Supply Chains: an<br />
Analytical Architecture for <strong>Management</strong><br />
Innovation” and “Leaning the DoD Supply Chain:<br />
the DoD Activity Address Code.”<br />
In “Enterprise Architecture: Origins, Tools, and<br />
Insights” Captain Alice Marie Long, US<strong>AF</strong>,<br />
discusses enterprise architecture (EA), how it<br />
works, and most importantly, why it is needed.<br />
She also presents guidelines for implementation<br />
of EA, along with a synopsis of possible pitfalls<br />
in EA development.<br />
Colonel Greg H. Parlier, PhD, USA, Retired, in<br />
“Transforming Army Supply Chains: an Analytical<br />
Architecture for <strong>Management</strong> Innovation”<br />
describes a practical approach for understanding<br />
the Army’s extremely complex logistics system by<br />
introducing a systems framework which is guiding<br />
an ongoing project addressing major challenges<br />
confronting logistics transformation. The project<br />
focus is on inventory management policy<br />
prescriptions illuminated through the prism of an<br />
enterprise-wide supply chain analysis.<br />
<strong>Vol</strong>ume XXXII, Number 4<br />
In the concluding article, Jay Barber, Global<br />
<strong>Logistics</strong> Support Center, US<strong>AF</strong>; Michael<br />
Werneke, Global <strong>Logistics</strong> Support Center,<br />
US<strong>AF</strong>; and Kevin P. Duffy, PhD, Wright State<br />
University, examine the efforts to introduce Lean<br />
to the Department of Defense (DoD) supply chain.<br />
A survey conducted by Manrodt, Vitasek and<br />
Thompson discovered that although Lean<br />
principles and concepts are being applied to the<br />
supply chain across numerous organizations,<br />
these principles are slow to be adopted in<br />
nonmanufacturing organizational settings.<br />
Importantly, the DoD is seen as an enormous<br />
organization, and an organization which is<br />
steeped in the traditional: the DoD encompasses<br />
ways of doing things which apply to supplier<br />
selection, organizational processes, and rigid<br />
hierarchical chains of command. Thus, the<br />
implementation of Lean principles into the DoD<br />
supply chain provides an extraordinary<br />
opportunity to examine a Lean implementation<br />
from two different perspectives. The first is that of<br />
applying Lean to a nonmanufacturing<br />
organization. The second perspective is to view<br />
attempts to implement Lean in a rigid<br />
organizational setting.<br />
53
54<br />
>>>><br />
Introduction<br />
The Air Force is continually taking measures to<br />
institutionalize enterprise architecture (EA).<br />
However, many in the Air Force have a limited<br />
concept of what an EA is, how it works, and most<br />
importantly, why it is needed. The purpose of this article is<br />
to discuss these key questions, to present some guidelines<br />
for implementation of EA, and make the reader aware of<br />
some of the possible pitfalls of EA development.<br />
To begin a discussion of enterprise architecture, it is<br />
important to first obtain an understanding of architecture<br />
in general. Architecture is the structure of components, their<br />
relationships, and the principles and guidelines governing<br />
their design and evolution over time. 1 Architecture is<br />
known to be essential when considering the design of a new<br />
building or a community; however, architecture is equally<br />
necessary when considering the design and creation of<br />
complex systems within organizations. Whether a new<br />
community is being planned or a business is expanding,<br />
several of the same issues must be considered: integrated<br />
services, interoperable systems, and efficient operations.<br />
The end objective of architecture is the alignment of<br />
components under common standards that facilitate<br />
change management and ensure integrated and effective<br />
operation.<br />
The concept of architecture is comparable at the<br />
enterprise level. The Federal Chief Information Officers<br />
Alice Marie Long, Captain, US<strong>AF</strong><br />
(CIO) Council regards an enterprise as an organization<br />
supporting a defined business scope and mission and<br />
comprised of interdependent resources (people,<br />
organizations, and technology) who must coordinate their<br />
functions and share information in support of a common<br />
mission (or set of related missions). 2 Enterprises exist within<br />
commercial businesses and industry, private institutions, as<br />
well as in areas of governance. Governmental enterprises<br />
are unique because their purpose is not the generation of<br />
revenue. These organizations are concerned primarily with<br />
the maintenance of basic security and public order.<br />
Nevertheless, the federal government is a single enterprise<br />
with shared strategic objectives, a common authority<br />
structure, integrated management processes, and consistent<br />
policies. As is the case in other enterprises, the goal is to<br />
optimize resource allocations across the organization to<br />
achieve common goals, whether at the local or national<br />
level. 3<br />
Legislation<br />
Aside from simply being a good tool for business,<br />
architecture within the government has been mandated by<br />
legislation. In 1996, the Clinger-Cohen Act (CCA) was<br />
established to improve the way the federal government<br />
acquires and manages information technology (IT). The<br />
idea was that acquisition, planning, and management of<br />
technology should be treated as a capital investment, exactly<br />
as a profitable business would be operated. The CCA directs<br />
Air Force Journal of <strong>Logistics</strong>
<strong>Vol</strong>ume <strong>Vol</strong>ume XXXII, XXXII, Number Number 44<br />
55
all federal agencies to establish a comprehensive approach to<br />
manage the acquisition, use, and disposal of IT. Though<br />
architecture is not prescribed by name in the CCA, it does promote<br />
a coordinated, interoperable, secure, and shared governmental<br />
infrastructure. 4 A legislative measure that formally mandates the<br />
development of architecture for government programs is<br />
described in Circular A-130, <strong>Management</strong> of Federal<br />
Information Resources. This publication prescribes the<br />
development and maintenance of an enterprise architecture to<br />
promote the appropriate application of federal information<br />
resources. 5 This mandate is intended to establish capital planning<br />
and investment control processes that link mission needs,<br />
information, and IT in an effective and efficient way. The circular<br />
also establishes architecture as grading criteria for acquisition<br />
56<br />
Article Acronyms<br />
ACE – Automated Commercial Environment<br />
ADM – Architecture Development Method<br />
<strong>AF</strong> E<strong>AF</strong> – Air Force Enterprise Architecture Framework<br />
<strong>AF</strong>EA – Air Force Enterprise Architecture<br />
<strong>AF</strong>I – Air Force Instruction<br />
<strong>AF</strong>LMA – Air Force <strong>Logistics</strong> <strong>Management</strong> <strong>Agency</strong><br />
AV – All Views<br />
BRM – Business Reference Model<br />
C4ISR – Command, Control, Communications,<br />
Computers, Intelligence, Surveillance, and<br />
Reconnaissance<br />
CBP – Customs and Border Protection<br />
CCA – Clinger-Cohen Act<br />
CEA – Chief Enterprise Architect<br />
CJCSI – Chairman Joint Chiefs of Staff Instruction<br />
DoD – Department of Defense<br />
DoD<strong>AF</strong> – Department of Defense Architecture<br />
Framework<br />
DRM – Data Reference Model<br />
EA – Enterprise Architecture<br />
E<strong>AF</strong> – Expeditionary Aerospace Forces<br />
eLog-21 – Expeditionary <strong>Logistics</strong> for the 21 st Century<br />
FDA – Food and Drug Administration<br />
FEA – Federal Enterprise Architecture<br />
GAO – General Accountability Office<br />
HHS – Health and Human Services (Department of)<br />
IT – Information Technology<br />
JCIDS – Joint Capabilities Integration and Development<br />
System<br />
LogEA – <strong>Logistics</strong> Enterprise Architecture<br />
MAJCOM – Major Command<br />
OV – Operational View<br />
PRM – Performance Reference Model<br />
SRM – Service Component Reference Model<br />
SV – Systems/Services View<br />
T<strong>AF</strong>IM – Technical Architecture Framework for<br />
Information <strong>Management</strong><br />
TAG – Technology and Architecture Group<br />
TE<strong>AF</strong> – Treasury Enterprise Architecture Framework<br />
TOG<strong>AF</strong> – The Open Group Architecture Framework<br />
TRM – Technical Reference Model<br />
TV – Technical View<br />
of new systems. In that, architecture is used for the certification<br />
of any federal business system modernization effort that exceeds<br />
$1M. 6<br />
One of the most significant Department of Defense (DoD) level<br />
instructions is Chairman of the Joint Chiefs of Staff Instruction<br />
3170.01, Joint Capabilities Integration and Development System<br />
(JCIDS). JCIDS is intended to identify shortfalls and<br />
redundancies in national defense and to develop solutions<br />
(materiel and nonmateriel) through a joint collaboration using<br />
integrated architectures among the Services. The focus is to<br />
resolve military capability gaps with solutions that are born Joint<br />
with architecting consideration given to uses across the spectrum,<br />
not a single Service or mission area. The future state of JCIDS<br />
implementation is fully integrated defense networks that<br />
eliminate waste and optimize system usage. 7 There are several<br />
other DoD directives governing the use of architecture, but at<br />
the Air Force level, enterprise architecture is prescribed in Air<br />
Force Policy Directive 33-4, Enterprise Architecting. The<br />
directive assigns architecture development and management, a<br />
governance process, as well as the establishment of a repository<br />
for architecture products. The Air Force enterprise architecture<br />
is to be used as a decision support tool, and guide all IT and<br />
National Security System investments. 8<br />
Architecture Frameworks<br />
To facilitate the completion of required architecture, a framework<br />
is necessary. A framework addresses architecture components,<br />
such as methodology, product descriptions, reference models,<br />
categorization, and classification. An overview of the most<br />
common architecture frameworks follows.<br />
The Zachman Framework<br />
One of the first and best known standards for classifying the<br />
descriptive models that comprise enterprise architecture is the<br />
Zachman Framework. This methodology was based on the belief<br />
that a common architectural schema could be used to represent<br />
any complex entity. It is depicted as a grid (see Figure 1) that<br />
consists of six functional focuses (columns), and then considers<br />
those focuses from the perspectives of the stakeholders (rows).<br />
The Zachman Framework does not prescribe a particular<br />
architecting methodology, and is used to categorize primitive<br />
enterprise architecture information. However, the tool can be<br />
used to organize data on the enterprise, to define which artifacts<br />
to produce and to describe processes. 9 Zachman applied to the<br />
Air Force logistics enterprise would include an organization chart<br />
to define the high level who portion of the framework. At a lower<br />
level would be a description of the physical data resident in the<br />
logistics enterprise. This framework would be helpful in defining<br />
and describing processes associated with the logistics enterprise<br />
and provide a good way to determine which artifacts are<br />
necessary to model the system.<br />
The Open Group Architecture Framework<br />
Another framework that provides a detailed comprehensive<br />
approach to design, planning, and implementation of<br />
architecture is The Open Group Architecture Framework<br />
(TOG<strong>AF</strong>). TOG<strong>AF</strong> is designed to support four common subsets<br />
of an overall enterprise architecture: business architecture, data<br />
architecture, application architecture, and technology<br />
Air Force Journal of <strong>Logistics</strong>
Scope<br />
Business<br />
System<br />
Technology<br />
Component<br />
Operations<br />
Inventory<br />
Identification:<br />
Inventory<br />
Types<br />
architecture. This method originated from the Technical<br />
Architecture Framework for Information <strong>Management</strong> developed<br />
by DoD. TOG<strong>AF</strong> is an architectural process that can be used to<br />
complement Zachman’s taxonomical approach. Like Zachman,<br />
however, TOG<strong>AF</strong> does not prescribe architecture products, but<br />
instead promotes an architecture development method (ADM)<br />
that gives guidelines for architecting. The stages of the<br />
development cycle outlined in the ADM provide guidance to<br />
the architect. These phases are further decomposed into steps.<br />
The ADM cycle is an iterative process, requiring frequent<br />
validation of results against the original expectations. 10<br />
The Federal Enterprise Architecture<br />
A third architecture framework is tailored to a more specific<br />
enterprise; the federal government. The federal enterprise<br />
architecture (FEA) is a business approach aimed at developing a<br />
more customer focused government that simplifies processes and<br />
unifies efforts across agencies. The FEA has evolved from its<br />
original form, with significant changes occurring in 2007 and<br />
2008. Currently, three core principles guide the strategic<br />
direction of the FEA: the federal enterprise must be business<br />
driven, proactive, and collaborative across the federal<br />
government; and the architecture must improve the effectiveness<br />
and efficiency of government information resources (see Figure 2). 11<br />
<strong>Vol</strong>ume XXXII, Number 4<br />
What How Where Who When Why<br />
Inventory<br />
Definition:<br />
Bus. Entity<br />
Bus. Relation<br />
Inventory<br />
Representation<br />
Sys. Entity<br />
Sys. Relation<br />
Inventory<br />
Specification:<br />
Tech. Entity<br />
Tech. Relation<br />
Inventory<br />
Configuration:<br />
Comp. Entity<br />
Comp. Relation<br />
Inventory<br />
Instantiation:<br />
Ops. Entity<br />
Ops. Relation<br />
Process<br />
Identification:<br />
Process Types<br />
Process<br />
Definition:<br />
Bus. Transform<br />
Bus. Input<br />
Process<br />
Representation<br />
Sys. Transform<br />
Sys. Input<br />
Process<br />
Specification:<br />
Tech. Transform<br />
Tech. Input<br />
Process<br />
Configuration:<br />
Comp. Transform<br />
Comp. Input<br />
Process<br />
Instantiation:<br />
Ops. Transform<br />
Ops. Input<br />
Network<br />
Identification:<br />
Network Types<br />
Network<br />
Definition:<br />
Bus. Location<br />
Bus, Connect<br />
Network<br />
Representation<br />
Sys. Location<br />
Sys. Connect<br />
Network<br />
Specification:<br />
Tech. Location<br />
Tech. Connect<br />
Network<br />
Configuration:<br />
Comp. Location<br />
Comp. Connect<br />
Network<br />
Instantiation:<br />
Ops. Location<br />
Ops. Connect<br />
Organization<br />
Identification:<br />
Organization<br />
Types<br />
Organization<br />
Definition:<br />
Bus. Role<br />
Bus. Work<br />
Organization<br />
Representation<br />
Sys. Role<br />
Sys. Work<br />
Organization<br />
Specification:<br />
Tech. Role<br />
Tech. Work<br />
Organization<br />
Configuration:<br />
Comp. Role<br />
Comp. Work<br />
Organization<br />
Instantiation:<br />
Ops. Role<br />
Ops. Work<br />
Timing<br />
Identification:<br />
Timing Types<br />
Timing<br />
Definition:<br />
Bus. Cycle<br />
Bus. Moment<br />
Timing<br />
Representation<br />
Sys. Cycle<br />
Sys. Moment<br />
Timing<br />
Specification:<br />
Tech. Cycle<br />
Tech. Movement<br />
Timing<br />
Configuration:<br />
Comp. Cycle<br />
Comp. Moment<br />
Timing<br />
Instantiation:<br />
Ops. Cycle<br />
Ops. Movement<br />
Motivation<br />
Identification:<br />
Motivation<br />
Types<br />
Motivation<br />
Definition:<br />
Bus. End<br />
Bus. Means<br />
Motivation<br />
Representation<br />
Sys. End<br />
Sys. Means<br />
Motivation<br />
Specification:<br />
Tech. End<br />
Tech. Means<br />
Motivation<br />
Configuration:<br />
Comp. End<br />
Comp. Means<br />
Motivation<br />
Instantiation:<br />
Ops. End<br />
Ops. Means<br />
Inventory Process Network Organization Timing Motivation<br />
Figure 1. Zachman Enterprise Architecture Framework<br />
Strategies<br />
Executive<br />
Leaders<br />
Architects<br />
Engineers<br />
Technicians<br />
Workers<br />
The FEA is comprised of an interrelated set of five reference<br />
models, all focused on developing a common language for the<br />
enterprise. The first model is the Performance Reference Model<br />
(PRM). The PRM is a performance measurement focused on the<br />
business of government at a strategic level and assesses the<br />
impact of IT investments at this level. It is designed to show the<br />
link between inputs and outputs, as well as to identify the<br />
practices of effective and efficient organizations within the<br />
enterprise. This type of analysis facilitates decisionmaking<br />
regarding resource allocation.<br />
The next model is the Business Reference Model (BRM). This<br />
model facilitates a functional view of the enterprise rather than<br />
an organizational one. Standard business capabilities are<br />
identified without regard to what agency is completing them,<br />
and a business functions view is defined. The importance of this<br />
model lies in proper implementation. The BRM must be<br />
incorporated into the architectures and management processes<br />
of governmental agencies in order to help accomplish strategic<br />
goals of the enterprise. 11<br />
The Service Component Reference Model (SRM) is a business<br />
driven, functional framework used to classify individual service<br />
components according to how they support both the performance<br />
and business objectives. The SRM helps to recommend service<br />
capabilities that will maximize reuse of business and technical<br />
capabilities. The Technical Reference Model is a component-<br />
57
58<br />
Business and Performance-Driven Approach<br />
Federal Enterprise Architecture (FEA)<br />
Performance Reference Model (PRM)<br />
• Inputs, Outputs, and Outcomes<br />
Uniquely Tailored Performance Indicators<br />
Business Reference Model (BRM)<br />
Lines of Business<br />
Agencies, Customers, Partners<br />
Service Component Reference Model (SRM)<br />
Service Domains, Service Types<br />
Business and Service Components<br />
Data and Information Reference Model (DRM)<br />
Subject Areas, Classifications, Data Elements<br />
Data Properties, Data Representations<br />
Technical Reference Model (TRM)<br />
Service Component Interfaces, Interoperability<br />
Technologies, Recommendations<br />
Figure 2. FEA Reference Models<br />
driven model that categorizes standards and technologies. Again,<br />
the focus is to identify and reuse the best solutions.<br />
Finally, the Data Reference Model (DRM) is a more flexible,<br />
standards-based model that facilitates information sharing among<br />
government agencies. The DRM objective is the standardization<br />
of data management processes across federal, state, and local<br />
organizations as necessary to enable the repeatability of the best<br />
processes across agencies by establishing a common language.<br />
In support of this objective, DRM contains three standardization<br />
areas: data description, data context, and data sharing. 11<br />
Another issue critical to FEA is the measurement of success.<br />
Federal agencies are rated in three main capability areas:<br />
completion, use, and results. The completion capability area<br />
measures the completion maturity of an EA’s artifacts with<br />
respect to performance, business data, services, and technology.<br />
The enterprise’s architectures should be well-defined and show<br />
traceability among the layers of architecture and artifacts. The<br />
use capability area deals with the actual implementation and use<br />
of the architecture as it measures the policies and procedures<br />
necessary for an organization to develop and manage its EA. The<br />
results capability area measures the effectiveness and value of<br />
the EA by assigning performance measurements to the EA<br />
processes and using these measures to complete analysis of the<br />
architecture. The results of this analysis are used to update<br />
practices and guidance for the EA. Following measurement in<br />
each of these three areas, agencies are assigned a success rating<br />
based on a green, yellow, and red coding system. 12<br />
DoD Architecture Federation<br />
Figure 3 depicts the architecture federation of the federal<br />
government as it pertains to the Air Force specifically. It is<br />
relevant to note the horizontal portions of Figure 3. Each Air<br />
Force component is broken down into three subenterprises: agile<br />
combat support, warfighting, and infrastructure. The Air Force<br />
decomposition is further depicted in Figure 4, showing several<br />
mission and major command (MAJCOM) architectures. The Air<br />
Force <strong>Logistics</strong> Enterprise (LogEA) is a subenterprise of the agile<br />
combat support mission, and evaluation of the LogEA<br />
architecture products is one of the newly chartered mission areas<br />
Interoperability/Information Sharing<br />
(Business-Content Driven)<br />
of the Air Force <strong>Logistics</strong><br />
<strong>Management</strong> <strong>Agency</strong> (<strong>AF</strong>LMA).<br />
The <strong>AF</strong>LMA is charged by A4I<br />
(Directorate of Transformation)<br />
with guaranteeing compliance of<br />
architecture to prescribed<br />
standards, and eventual<br />
management of the LogEA.<br />
Air Force Enterprise<br />
Architecture and the<br />
DoD Architecture<br />
Framework<br />
The vertical columns of the<br />
Federal Architecture Federation<br />
depict the guidance setting<br />
architecture requirements for the<br />
DoD and the individual military<br />
services. As seen here, the Air<br />
Force has its own enterprise architecture framework (<strong>AF</strong> E<strong>AF</strong>).<br />
The <strong>AF</strong> E<strong>AF</strong> uses the same reference models as the DoD’s FEA,<br />
but provides context focused on Air Force strategy and missions.<br />
The correlation between the FEA and the <strong>AF</strong>EA is illustrated in<br />
Figure 4.<br />
<strong>AF</strong>PD 33-04 establishes the <strong>AF</strong>EA as the method for managing<br />
change and understanding complexity in the Air Force<br />
environment. The <strong>AF</strong>EA is ultimately intended to act as a tool<br />
to aid in decisionmaking through supporting key<br />
decisionmaking processes (capabilities based planning and<br />
analysis; planning, programming, budgeting, and execution;<br />
acquisitions; and portfolio management), and guiding all IT and<br />
National Security Systems investments. Additionally, the <strong>AF</strong>EA<br />
assigns responsibility for the development, evolution, and<br />
management of the EA, and institutes a governance process. Air<br />
Force MAJCOMs directed to establish enterprise architectures<br />
must institute policies, procedures, and guidelines for<br />
architecture activities, appoint an architect, and develop and<br />
maintain architecture products. Throughout this process these<br />
products must be approved and certified as prescribed in Air<br />
Force Instruction 33-401, Implementing Air Force Architectures.<br />
It was determined by the Defense Science Board that one of<br />
the key means for ensuring military systems are interoperable<br />
and effective is to establish comprehensive architecture<br />
guidance for the entire DoD. 13 The Department of Defense<br />
architecture framework (DoD<strong>AF</strong>) was developed to give direction<br />
as to how architecture products should be developed.<br />
The DoD<strong>AF</strong> is an evolution of the Air Force command,<br />
control, communications, computers, intelligence, surveillance,<br />
and reconnaissance (C4ISR) architecture framework which<br />
originally addressed the interoperability of C4ISR specific<br />
capabilities. It consists of three volumes. <strong>Vol</strong>ume I offers a<br />
general overview of the DoD architecture concept and provides<br />
guidance for the development and management of DoD<br />
architectures. <strong>Vol</strong>ume II delves more deeply into the concept,<br />
outlining the specific details for the individual framework<br />
products. Finally, <strong>Vol</strong>ume III shifts in focus to the data for<br />
architecture and its uses. The overarching DoD<strong>AF</strong> structure is<br />
organized into four unique views: all (AV), operational (OV),<br />
systems/services (SV), and technical standards (TV). The<br />
Air Force Journal of <strong>Logistics</strong>
architecture products associated with each of these views serve<br />
specific purposes.<br />
The OV captures the operational nodes of an architecture, their<br />
tasks and activities, and interactions and information exchanges<br />
required to accomplish DoD operational concepts. The SVs<br />
outline the physical systems, required system functionality, and<br />
their data exchanges for supporting the operational views. As<br />
the architecture matures, the TVs are needed to communicate<br />
standards, protocols, technologies, and interfaces to ensure the<br />
system will satisfy its operational requirements. Though not<br />
depicted in the graphic below, the AV represents aspects of the<br />
architecture related to all three views. While the AV products<br />
don’t present a distinct view of the architecture, they provide<br />
information relevant to the architecture as a whole (see Figure<br />
5). 13<br />
The architectural products outlined in the DoD<strong>AF</strong> flow<br />
naturally from the reference models contained in the FEA, and<br />
subsequently the <strong>AF</strong>EA. The relationship between the <strong>AF</strong>EA and<br />
DoD<strong>AF</strong> is seen in the developing Air Force LogEA. One of the<br />
DoD<strong>AF</strong> architectural models representing the Performance<br />
Reference Model is the AV-1. In LogEA, this product acts as a<br />
concept of operations, providing strategic level information<br />
including assumptions, constraints, and limitations of the<br />
logistics enterprise. Representations of the Business Reference<br />
Model are the OV-5 activity models. The OV-5 describes the<br />
operations that are generally conducted in the course of<br />
FEA Guidance<br />
Global Information<br />
Grid (GIG)<br />
Descriptive<br />
Prescriptive<br />
<strong>Vol</strong>ume XXXII, Number 4<br />
Intel<br />
…<br />
Warfighting<br />
TRANSCOM<br />
FEA Mission - Content<br />
Marine Corps<br />
Business<br />
Navy Infrastructure<br />
DOD EA Mission - Content<br />
Army<br />
Guide<br />
Content reuse<br />
…<br />
Air Force<br />
<strong>AF</strong> EA Mission - Content<br />
Warfighting<br />
AMC<br />
ACC<br />
Agile Combat Support<br />
Acquisition<br />
Sub-Enterprise Mission - Content<br />
Personnel<br />
<strong>Logistics</strong><br />
Finance<br />
DOD EA Guidance<br />
<strong>AF</strong> Reference Models (Infostructure<br />
Technology Reference Model—<br />
<strong>AF</strong> I-TRM)<br />
Descriptive<br />
<strong>AF</strong> EA Guidance<br />
Prescriptive<br />
ConstellationNet<br />
Descriptive<br />
<strong>AF</strong> Sub-EA Guidance<br />
Prescriptive<br />
<strong>AF</strong> CONOPs (for example Global Strike)<br />
D<br />
Descriptive<br />
MAJCOM Guidance<br />
Descripti<br />
tt ve vv<br />
Prescriptive<br />
EIE<br />
Domain & MAJCOM Missions - Content<br />
Air and Space Operations Center (AOC)<br />
Figure 3. Federal Architecture Federation<br />
executing the logistics mission. The DoD Supply Chain Material<br />
<strong>Management</strong> Regulation 4140.1 outlines the primary activities<br />
resident in the logistics enterprise high-level OV-5; Plan, Source,<br />
Make, Deliver, and Return. All lower level activities in the<br />
logistics supply chain result from decompositions of these key<br />
activities. The Air Force Systems/Service Component Reference<br />
Model is represented in the DoD<strong>AF</strong> SVs. For LogEA, the<br />
Systems/Services views are resident in the Expeditionary<br />
Combat Support System—the system that supports the logistics<br />
supply chain.<br />
Observations and Case Studies<br />
The frameworks presented here employ different approaches to<br />
architecture. While each method has its own focus, some<br />
frameworks could be used in complementary ways, and the<br />
combination of methodologies can result in synergistic effects.<br />
For example, TOG<strong>AF</strong> describes how to architect. Products<br />
outlined in the DoD<strong>AF</strong> could be employed to document the<br />
architecture decisions made in TOG<strong>AF</strong> methodology. The<br />
Zachman Framework can be used to check for completeness in<br />
architectural elements and to determine whether or not processes<br />
are sufficiently examined. This type of combination often<br />
provides a better result than attempting to fit everything into a<br />
single framework. The important issue is to find the method (or<br />
methods) that works well within the organization’s goals and<br />
*Graphic from: <strong>AF</strong>I 33-401<br />
Mission Areas<br />
Programs<br />
59
60<br />
Business<br />
Reference<br />
Model<br />
(BRM)<br />
Federal Enterprise Architecture Reference Models<br />
Performance<br />
Reference<br />
Model<br />
(PRM)<br />
<strong>AF</strong> Performance<br />
Reference Model<br />
<strong>AF</strong> Mission Vision / Strategy<br />
Synthesis<br />
Enterprise Transition<br />
Strategy<br />
Enterprise Architecture<br />
Roadmap<br />
Performance measures /<br />
Balanced scorecard<br />
What What What Needs Needs Needs to to to Be Be Be Done Done Done<br />
Who Who Who Does Does Does It It It<br />
Information Information Information Exchanges Exchanges Exchanges<br />
Required Required Required to to to Get Get Get It It It Done Done Done<br />
Systems Systems Systems and and and Services Services Services<br />
that that that Support Support Support the the the<br />
Activities Activities Activities and and and<br />
Information Information Information Exchanges Exchanges Exchanges<br />
Systems and Services<br />
View<br />
Relates Systems, Services, and<br />
Characteristics to Op Needs<br />
Data/<br />
Information<br />
Reference<br />
Model<br />
(DRM)<br />
Service<br />
Component<br />
Reference<br />
Model<br />
(SRM)<br />
Air Force Architecture<br />
Reference Models<br />
Performance<br />
Business<br />
Data (Information)<br />
System/Service Component<br />
Technical<br />
<strong>AF</strong> Business<br />
Reference Model<br />
<strong>AF</strong> Operational Activities<br />
<strong>AF</strong> Operational <strong>No</strong>des<br />
Technical<br />
Reference<br />
Model<br />
(TRM)<br />
Enterprise Perspective Descriptions<br />
<strong>AF</strong> System/Service<br />
Component<br />
Reference Model<br />
<strong>AF</strong> System <strong>No</strong>des<br />
<strong>AF</strong> Systems<br />
System Functions/Services<br />
Documented using Reference<br />
Models & Federal EA constructs<br />
Provides context & coherence<br />
for <strong>AF</strong> architectures<br />
Enables high-level description &<br />
categorization of reusable <strong>AF</strong><br />
architecture components<br />
Facilitates integration with<br />
external architectures and drivers<br />
<strong>AF</strong> Data<br />
(Information)<br />
Reference Model<br />
Information Exchanges<br />
XML Name spaces<br />
Core Architecture Data<br />
Model (CADM)<br />
Figure 4. Air Force Enterprise Architecture Framework<br />
Operational<br />
View<br />
Identifies What Needs to be<br />
Accomplished and Who Does It<br />
Specifies System Capabilities<br />
Required to Satisfy Information<br />
Exchanges<br />
Technical Standards Criteria<br />
Governing Interoperable<br />
Implementation/Procurement of<br />
the Selected Capabilities<br />
Figure 5. DoD<strong>AF</strong> Views and Linkages<br />
Operational Operational Operational Requirements<br />
Requirements<br />
Requirements<br />
and and and Capabilities<br />
Capabilities<br />
Capabilities<br />
Basic Basic Basic Technology<br />
Technology<br />
Technology<br />
Supportability<br />
Supportability<br />
Supportability<br />
New New New Technical Technical Technical<br />
Capabilities<br />
Capabilities<br />
Capabilities<br />
<strong>AF</strong> Technical<br />
Reference Model<br />
Technology Areas<br />
Technical Standards<br />
Standard Platform<br />
Profiles<br />
<strong>AF</strong> Standard Products<br />
Architecture Patterns<br />
Technical Standards<br />
View<br />
Prescribes Standards and<br />
Conventions<br />
Air Force Journal of <strong>Logistics</strong>
constraints, always keeping in mind that the focus of using these<br />
tools is to unite the resources of the enterprise, and not to<br />
overcomplicate the effort.<br />
Though an overarching view of EA has been presented, the<br />
concepts and various methodologies can still seem a bit<br />
nebulous. A few case studies where enterprise architectures have<br />
been implemented will now be examined. The hope is to clarify<br />
and give relevance to the discussion, and to highlight the realized<br />
advantages as well as some of the difficulties associated with<br />
architecture implementation. The following examples illustrate<br />
uses of EA within government agencies.<br />
Case 1<br />
The Food and Drug Administration (FDA) is the operating<br />
division of the Department of Health and Human Services (HHS),<br />
and is charged with ensuring foods, drugs, and cosmetics are safe<br />
and properly labeled; drugs and medical devices are safe and<br />
effective; blood is safe and in adequate supply, and equipment<br />
that uses radiant energy is safe. 14 In response to the President’s<br />
2002 <strong>Management</strong> Agenda, the HHS established its own<br />
initiative to consolidate, streamline, and standardize<br />
administrative programs. The FDA faced a few key challenges<br />
associated with the mandate: necessary alignment of information<br />
technology with business strategy, limited funding and resources,<br />
lack of standardized processes, and a culture resistant to change. 15<br />
The FDA began by adding a chief enterprise architect (CEA)<br />
position to its strategic IT management staff to oversee this<br />
undertaking. The CEA established an EA working group made<br />
up of representatives from each of the eight FDA center offices.<br />
Technical training was required to ensure personnel could<br />
adequately build and use EA frameworks, so representatives from<br />
the center offices received Federal Enterprise Architecture<br />
certification. The FEA reference models were chosen for<br />
architecture development in order to facilitate cross-agency<br />
analysis and the identification of duplicative investments, gaps,<br />
and opportunities for collaboration within and across the agency.<br />
The resulting products created a standardized architecture<br />
framework which served as a foundation to develop both<br />
baseline and future target EAs. Common governance structures<br />
were defined, ensuring each of the departments supported the<br />
FDA’s goals and objectives. Additionally, an office of shared IT<br />
services was developed to provide better alignment between<br />
business and IT. This helped the agency to reuse and consolidate<br />
applications where possible. This office also enabled the FDA<br />
to track IT investments across the entire enterprise.<br />
Though a significant investment was made to develop and<br />
maintain an enterprise architecture, benefits were soon realized.<br />
The budget for the maintenance of the EA is $350K to $500K<br />
annually, but the FDA projected a $10M savings over the first 5<br />
years. This savings comes primarily from eliminating redundant<br />
IT costs. The infrastructure now helps to drive consolidation<br />
activities across the enterprise. With the transparency of the<br />
system, communication and efficiency were improved, leading<br />
to improved decisionmaking as well. 14<br />
The FDA provides a good example of enterprise architecture<br />
implementation. Today, the EA working group acts as a review<br />
board, selecting IT investments based on the FDA mission and<br />
objectives. As a continuing component of the IT strategy, the<br />
FDA’s EA framework is reducing costs, and improving mission<br />
performance.<br />
<strong>Vol</strong>ume XXXII, Number 4<br />
Case 2<br />
The next case study involves US Customs and Border Protection<br />
(CBP). CBP is a component of the Department of Homeland<br />
Security and is primarily responsible for keeping terrorists and<br />
their weapons out of the US. The scope of this mission is threefold:<br />
covering border control, trade, and travel within the US. Presently,<br />
CBP employs 41,000 personnel who enforce hundreds of US<br />
regulations, including immigration and drug laws. 16<br />
<strong>No</strong>t all implementations of enterprise architecture are as clearcut<br />
or initially successful as the FDA example. CBP encountered<br />
significant problems in earlier stages of its architecture<br />
development. Beginning in 1997, the US Customs Service<br />
planned to invest over $1B in a modernization effort to create<br />
an automated commercial environment (ACE) focused on certain<br />
core missions. In 1999, the Government Accountability Office<br />
(GAO) found that CBP was not managing this effort in a cost<br />
effective way. The GAO found serious weaknesses in<br />
architectural definition, investment management, and software<br />
development and acquisition. It was recommended that Congress<br />
withhold funding until these deficiencies were resolved.<br />
CBP began preparing a new strategy starting with the<br />
development of the US Customs Modernization Program<br />
management organization. The organization is charged with<br />
establishing an EA systems concept for the ACE. The goals of<br />
the concept were to govern the modernization processes, align<br />
investments with strategic goals, and turn the CBP into a more<br />
performance based organization. A task force consisting of a<br />
planning group and a technology and architecture group (TAG)<br />
were created. The TAG was responsible for developing the<br />
enterprise architecture. The EA was a collaborative effort and<br />
involved stakeholders from each CBP business unit. A cost<br />
analysis, along with a metrics program to measure the benefits<br />
of implementing the EA was considered from the onset. The GAO<br />
worked in conjunction with CBP, validating their efforts<br />
throughout the process.<br />
CBP’s architecture ensures that IT investments are properly<br />
aligned with the architecture. Similar to the FDA, focus was<br />
placed on increasing IT standardization, minimizing<br />
duplication, providing better justification for IT spending,<br />
increased efficiency, and better responsiveness to customer<br />
needs. CBP produced the architecture using the four FEA<br />
reference models, and System Architect was used for modeling<br />
purposes. Further, the EA framework has evolved and, like the<br />
Air Force’s <strong>AF</strong>EA, an enterprise-specific Treasury Enterprise<br />
Architecture Framework (TE<strong>AF</strong>) now defines all artifacts<br />
contained in the CBP EA.<br />
CBP met with many of the same obstacles to architecture<br />
implementation as did the FDA. Initially, a major culture change<br />
was required within IT. Systems developers were not optimistic<br />
about compliance with new processes, standards, and controls.<br />
Development of an EA was also a major time commitment, taking<br />
18 months to realize the initial functioning EA. There was also<br />
an upfront cost of $5M associated with the effort, and a<br />
continuing cost of $2M annually to update and maintain the EA.<br />
Though CBP had a rocky start in developing EA, eventually<br />
the management weaknesses identified by the GAO were<br />
resolved and funding was restored. In addition to this, benefits<br />
are now realized. Evaluation processes have confirmed that over<br />
a $30M return on investment has been made, with over $5M of<br />
these savings resulting from the elimination of duplicative<br />
61
systems. The IT infrastructure is much less complex now, and<br />
stovepiping of data, technology, and systems has been<br />
eliminated. Finally, change management is also facilitated, with<br />
the development of a to be architecture blueprint ushering in<br />
several new systems acquisitions.<br />
62<br />
Air Force <strong>Logistics</strong> Enterprise<br />
Architecture and the <strong>AF</strong>LMA<br />
The <strong>AF</strong>LMA was recently given responsibility for the evaluation<br />
of LogEA. LogEA is intended to guide the transformation of the<br />
Air Force supply chain, and to stand as the single authoritative<br />
source of process and system models for this logistics chain. The<br />
current system must evolve into a rapid response, dynamically<br />
reconfigurable, integrated network, supporting the expeditionary<br />
aerospace forces (E<strong>AF</strong>) concept at home and in deployed<br />
locations. 17 Ultimately, the intent of LogEA is to deliver mission<br />
capability while maintaining affordability.<br />
Several transformation initiatives have been implemented as<br />
part of the EA execution plan. This campaign, known as<br />
Expeditionary <strong>Logistics</strong> for the 21 st Century (eLog-21), is<br />
intended to capture both the future vision and the transformation<br />
path for the Air Force logistics enterprise. LogEA is the<br />
operational and systems architecture that will communicate and<br />
guide the vision of the eLog-21 campaign. 16 The impact of these<br />
eLog-21 initiatives is measured against the high-level goals to<br />
improve operational capability while minimizing costs.<br />
The elog-21 transformation initiatives are divided into 11 cost<br />
categories.<br />
Depot maintenance<br />
Depot level reparable<br />
Aviation fuels<br />
Consumables<br />
Sustaining engineering<br />
Contract service<br />
Military personnel<br />
Civilian personnel<br />
Software maintenance<br />
Other operations and maintenance<br />
Critical space operations<br />
Each of the eLog-21 initiatives is classified as IT or non-IT,<br />
and architecture requirements are determined according to this<br />
classification. Artifacts are submitted to <strong>AF</strong>LMA for a review to<br />
verify LogEA compliance, according to the published LogEA<br />
Compliance Plan. The result of this process is an integrated set<br />
of enterprise-wide priorities which will reduce costs by<br />
improving the planning and execution of procurement and<br />
production activities. 16<br />
Challenges<br />
It is clear that the lack of a system architecture can contribute to<br />
increased costs and subsystem problems, but even in successful<br />
architecture developments, common difficulties seem to arise.<br />
As the <strong>AF</strong>LMA manages LogEA, it is valuable to highlight some<br />
of these challenges.<br />
Strategy<br />
The cornerstone of a successful architecture begins with a<br />
strategic vision. This point is reflected in the <strong>AF</strong>EA Performance<br />
Reference Model. This model prescribes a roadmap for the entire<br />
architecture development as well as performance measures to<br />
calculate the success of the effort. This involves well-defined<br />
direction from the key sponsors and stakeholders that is directly<br />
traceable to the Air Force mission area under consideration. As<br />
illustrated in the case studies, the vision and scope for both efforts<br />
were clear, and architecting teams had focus and, most<br />
importantly, a shared concept of the effort. The CBP case study<br />
specifically illustrates the implementation of performance<br />
measures and metrics to calculate the benefit of implementing<br />
architecture. Cost/benefit analysis is a vital point in the decision<br />
to develop architecture. An organization must be willing to invest<br />
in the underlying organizational and cultural structures to<br />
support the EA, and be absolutely certain that these investments<br />
will pay dividends in the future.<br />
Culture and Senior Commitment<br />
Senior stakeholder commitment is also essential to initiating<br />
architecture development. Though policy direction ensures<br />
commitment from Air Force leadership regarding architecture<br />
development, other associated issues arise. It is crucial that<br />
organizations are creating artifacts with the strategic vision in<br />
mind and not simply to fulfill requirements and meet deadlines.<br />
The purpose of architecture can be summed up in one idea:<br />
optimizing limited resources. If focus shifts from this idea to<br />
simple fulfillment of requirements, the benefits of architecture<br />
will never manifest. To help guarantee effectiveness, the mandate<br />
to develop enterprise architecture should also provide for<br />
resources toward additional personnel, education, and training<br />
for those developing and evaluating architecture, and reasonable<br />
deadlines. Ideally, enterprise architecture development should<br />
focus first on understanding the existing process (as-is), and then<br />
the desired future state (to be). This practice lends support to the<br />
change management capability of EA. Products should be<br />
incremental and iterative, not a static set of artifacts to be archived<br />
and then forgotten.<br />
Cost<br />
With these ideas in mind, another issue comes to light; that is,<br />
architecture costs money. As shown in the case studies, both the<br />
FDA and CBP established a start-up budget as well as an annual<br />
maintenance budget for development and continuing<br />
management of the EAs. Many eLog-21 initiatives employed<br />
contractor support for architecture development. Attention<br />
should also be given to sustainment of the architecture products<br />
either internally, or with persistent contractor support. Ideally,<br />
contractor support can effectively be used to initiate enterprise<br />
architecture development when conducted in conjunction with<br />
permanent party personnel who can exercise continuing<br />
maintenance of the EA. Many architecture projects are<br />
overstaffed at the onset if critical architectural work needs to be<br />
expedited, which may indicate that an organization is not<br />
investing sufficient time in the architecture analysis and<br />
development. 18 DoD<strong>AF</strong> version 1.5 warns that the architectural<br />
views are not important; the key issue is the integrity of the data<br />
used to produce the views.<br />
Air Force Journal of <strong>Logistics</strong>
Communication<br />
The nature of enterprise architecture is to capitalize on horizontal<br />
integration; standardizing processes and eliminating<br />
redundancies; which leads to another possible pitfall:<br />
communication. Some organizations charged with development<br />
of LogEA artifacts display a lack of communication across<br />
organizations, and cross flow of information among<br />
geographically separated organizations is an ever present issue.<br />
Without adequate communication between eLog-21 initiatives,<br />
systems that need to be integrated and interoperable may not<br />
achieve the overall goal. Some of the initiatives are so expansive<br />
that several large architecture teams are employed in disparate<br />
locations for artifact development. Significant differences in<br />
process understanding and even architecture styles are evident<br />
in many artifacts submitted for approval. If processes cannot be<br />
standardized within a single organization, it is easy to see how<br />
communicating vital information between agencies would be<br />
difficult. This problem of standardization is apparent throughout<br />
all levels of LogEA.<br />
Standardization<br />
Though all architecture products are measured by their adherence<br />
to the DoD<strong>AF</strong> by way of the LogEA Compliance Plan, there is<br />
no prescribed methodology or software package for architecture<br />
modeling. Though different product suites were used to develop<br />
enterprise architecture in each of the case studies, there was<br />
standardization of software and training for each project. Software<br />
integration and interoperability is a key element of enterprise<br />
architecture, so it would seem appropriate to ensure the same<br />
interoperability for all architecture developments. This is<br />
problematic as artifacts are approved and certified. Original<br />
products cannot be maintained in a central repository due to the<br />
lack of standardization among software, and it is a point of<br />
discussion how maintenance and archiving of the LogEA will<br />
be accomplished.<br />
<strong>Vol</strong>ume XXXII, Number 4<br />
Conclusion<br />
It has been said that the architecture of an enterprise exists,<br />
whether it is explicitly developed or not. By virtue of process,<br />
system, and technical make up, architecture is inherent in all<br />
organizations, even if it is not formally defined. The discipline<br />
of enterprise architecting allows the capitalization of the<br />
potential effectiveness and efficiency of an organization, while<br />
minimizing cost. A well established EA also guides acquisition<br />
of new technologies and facilitates change management and<br />
transformation. The institution of enterprise architecture has<br />
emerged as common practice within commercial industry, and<br />
is mandated now for all federal enterprises. Though enterprise<br />
architecture is not a topic requiring expertise for every member<br />
of an organization, it is valuable to have a fundamental<br />
understanding of what it is and why it is being used. This article<br />
was intended to provide the reader with a fundamental<br />
understanding of the background, practices, and possible<br />
complications associated with enterprise architecture. Though<br />
it is a relatively new mandate within the Air Force, EA will offer<br />
substantial benefits if properly implemented throughout the<br />
enterprise.<br />
<strong>No</strong>tes<br />
1. EEE-SA, IEEE Standard Glossary of Software Engineering<br />
Terminology, New York, NY: IEEE, 2004.<br />
2. Federal Chief Information Officer Council, “A Practical Guide to<br />
Federal Enterprise Architecture,” [Online] Available: www.enterprisearchitecture.info/Images/Documents/<br />
Federal%20Enterprise%20Architecture%20Guide%20v1a.pdf, 2001.<br />
3. Federal Chief Information Officers Council, “Architecture Principles<br />
for the US Government,” [Online] Available: www.cio.gov/documents/<br />
Architecture_Principles_US_Govt_8-2007.pdf , 2007.<br />
4. US President, Presidential Documents, “Federal Information<br />
Technology – Clinger-Cohen Act,” Federal Register, 61, no. 140, 19<br />
July 1996, 37657-376621.<br />
5. Office of <strong>Management</strong> and Budget, Circular A-130, <strong>Management</strong> of<br />
Federal Resources, Washington, DC: Office of <strong>Management</strong> and<br />
Budget, 1996.<br />
6. US Congress, “FY 05 National Defense Authorization Act,” [Online]<br />
Available: http://www.ndia.org/Content/NavigationMenu/Advocacy/<br />
Action_Items/FY05_NDAA.htm, 13 October 2004, accessed 3<br />
September 2008.<br />
7. Chairman of the Joint Chiefs of Staff Instruction (CJCSI) 3170.01F,<br />
Joint Capabilities Integration and Development System, 1 May 2007.<br />
8. Air Force Policy Directive (<strong>AF</strong>PD) 33-4, Air Force Enterprise<br />
Architecting, 27 June 2006.<br />
9. R. Sessions, MSDN Architecture Center Library, [Online] Available:<br />
http://msdn.microsoft.com/en-us/library/bb4662<strong>32</strong>.aspx, accessed 4<br />
September 2008.<br />
10. “The Open Group Introduction to the ADM,” [Online] Available: http:/<br />
/www.opengroup.org/architecture/togaf8-doc/arch/, accessed 9<br />
September 2008.<br />
11. US President, “FEA Consolidated Reference Model Document,”<br />
Version 2.3., [Online] Available: www.whitehouse.gov/omb/<br />
asset.aspx?AssetId=470, October 2007<br />
12. Executive Office of the President of the United States, “Federal<br />
Enterprise Architecture Program EA Assessment Framework 2.1.,”<br />
[Online] Available: http://www.whitehouse.gov/omb/e-gov/fea/, 2006.<br />
13. Department of Defense, DoD Architecture Framework Version 1.5.,<br />
[Online] Available: jitc.fhu.disa.mil/jitc_dri/pdfs/dodaf_v1v2.pdf, 23<br />
April 2007.<br />
14. US Food and Drug Administration, US Food and Drug Administration<br />
Homepage, [Online] Available: http://www.fda.gov/, accessed 28<br />
October 2008.<br />
15. Federal Enterprise Architecture Program <strong>Management</strong> Office,<br />
“Enterprise Architecture in Action,” [Online] Available:<br />
www.egov.gov, accessed 29 October 2008.<br />
16. US Department of Homeland Security, US Customs and Border<br />
Protection Homepage, [Online] Available: www.cbp.gov, accessed 31<br />
October 2008.<br />
17. Deputy Chief of Staff for Installations and <strong>Logistics</strong> Directorate of<br />
Transformation, “US Air Force <strong>Logistics</strong> Enterprise Architecture<br />
Concept of Operations,” Washington DC: <strong>AF</strong>/A4I, 2007.<br />
Captain Alice Marie Long is the Systems Engineer for the<br />
Air Force <strong>Logistics</strong> <strong>Management</strong> <strong>Agency</strong>, Maxwell <strong>AF</strong>B,<br />
Gunter Annex, Alabama. She is a graduate of the Air Force<br />
Institute of Technology and holds a master of science degree<br />
in systems engineering.<br />
Because of my wartime experience, I am insistent on the point that logistics knowhow<br />
must be maintained, that logistics is second to nothing in importance in warfare,<br />
that logistics training must be widespread and thorough.…<br />
—Vice Adm Robert B. Carney, USN<br />
63
64<br />
>>>><br />
An army fights with its weapons but lives off its logistics…<br />
Greg H. Parlier, PhD, Colonel, USA, Retired<br />
—Military maxim<br />
So now let us embark on our enquiry into what is true … we sometimes<br />
notice that our senses deceive us, and it is wise never to put too much<br />
trust in what has let us down…<br />
—Rene Descartes<br />
<strong>No</strong>thing is more powerful than an idea whose time has come.<br />
Introduction<br />
—Victor Hugo<br />
The US Army’s logistics enterprise is truly enormous in scale and<br />
scope. However, it is not merely the size and complexity of the<br />
supply chain that causes difficulty, but rather the structure and<br />
policies within the system that are the root cause of persistent problems.<br />
Army logistics has especially suffered from several disorders which are<br />
both systemic and chronic. This ongoing research project has illuminated<br />
these problems using inventory management theory, supply chain<br />
principles, and logistics systems analysis as key sources of diagnostic<br />
power. To summarize generally, 5 years ago when the project described in<br />
this article was launched, these causal disorders and their respective effects<br />
were found to include the following:<br />
Lack of an empirically measured readiness production function which<br />
induces both uncertainty and variability at the point of consumption<br />
in the supply chain resulting in inappropriate planning, improper<br />
budgeting, and inadequate management<br />
to achieve readiness objectives<br />
Limited understanding of mission-based,<br />
operational demands and associated<br />
spares consumption patterns which<br />
contribute to poor operational and tactical<br />
support planning and cost-ineffective<br />
retail stock policy<br />
Failure to optimize retail stock policy to<br />
achieve cost-efficient readiness<br />
(customer) objectives, which results in<br />
inefficient procurement and reduced<br />
readiness<br />
Failure to proactively synchronize and<br />
manage reverse logistics which<br />
contributes significantly to increased<br />
requirement objectives (RO), excess<br />
inventory, and increased delay times<br />
(order fulfillment) with reduced readiness<br />
Inadequately organized depot repair<br />
operations that may be creating a growing<br />
gap in essential repair capacity while<br />
simultaneously precluding the enormous<br />
potential benefits of a synchronized,<br />
closed-loop supply chain for reparable<br />
components<br />
Limited visibility into and management<br />
control over disjointed and disconnected<br />
manufacturing (original equipment<br />
Air Force Journal of <strong>Logistics</strong>
<strong>Vol</strong>ume XXXII, Number 4<br />
65
66<br />
Acquisition Wholesale Retail Unit<br />
Reverse<br />
<strong>Logistics</strong><br />
Figure 1. Multi-Stage <strong>Logistics</strong> Model<br />
manufacturer) and key supplier procurement programs which<br />
are vulnerable to boom and bust cycles with extremely long<br />
lead times, high price volatility for aerospace steels and alloys,<br />
and increasing business risk to crucial, unique vendors in the<br />
industrial base resulting in diminishing manufacturing<br />
sources of materiel supplies, and growing obsolescence<br />
challenges for aging aircraft and vehicle fleets<br />
Independently operating, uncoordinated and unsynchronized<br />
stages within the supply chain creating pernicious bullwhip<br />
effects including high RO, inadequate stock levels, long lead<br />
times, and declining readiness<br />
Fragmented data processes and inappropriate supply chain<br />
measures focusing on interface metrics which mask the effects<br />
of efficient and effective alternatives, and further preclude an<br />
ability to determine readiness return on net assets or to relate<br />
resource investment levels to readiness outcomes<br />
Lack of central supply chain management and supporting<br />
analytical capacity results in multiagency, consensus-driven,<br />
bureaucratic responses hindered by lack of an Army supply<br />
Article Acronyms<br />
Ao – Operational Availability<br />
ASL – Authorized Stockage List (used once in graphic)<br />
CILS – Center for Innovation in <strong>Logistics</strong> Systems<br />
DDSN – Defense Driven Supply Network<br />
DLR – Depot Level Reparable<br />
DoD – Department of Defense<br />
DRRS – Defense Readiness Reporting System<br />
DSLP – Dynamic Strategic <strong>Logistics</strong> Planning<br />
DSP – Dynamic Strategic Planning<br />
GARCH – Generalized Autoregressive Conditional<br />
Heteroskedstic<br />
HQDA – Headquarters, Department of the Army<br />
IT – Information Technology<br />
OEM – Original Equipment Manufacturer<br />
OSD – Office of the Secretary of Defense<br />
PLL – Prescribed Load List<br />
RBS – Readiness Based Sparing<br />
RFID – Radio Frequency Identification<br />
RO – Requirement Objective<br />
SARSS – Standard Army Retail Supply System<br />
SSA – Supply Support Activity (used once in graphic)<br />
SSF – Single Stock Fund<br />
TAV – Total Asset Visibility<br />
Demand<br />
chain management science<br />
and an enabling analytical<br />
architecture to guide logistics<br />
transformation<br />
Lack of an engine for<br />
innovation to accelerate then<br />
sustain continual improvement<br />
for a learning organization<br />
We found the existing<br />
logistics structure was indeed<br />
vulnerable to the supply chain<br />
bullwhip. While endless<br />
remedies have been adopted<br />
over the years to address<br />
visibly apparent symptoms, the fundamental underlying<br />
disease has not been adequately diagnosed or treated, much less<br />
cured. <strong>No</strong>w, better understanding these underlying causes of<br />
failure, a new approach to logistics management is required for<br />
the US Army.<br />
The analytical challenge is to conquer unpredictability: to<br />
better understand their sources, then attack the root causes of<br />
variability and uncertainty within each stage and their collective<br />
contributions to volatility across the system of stages—the<br />
bullwhip effect. By improving demand forecasting and reducing<br />
supply-side variability and inefficiencies within each of the<br />
stages, logistics system performance is moving toward an<br />
efficient frontier in the cost-availability trade space.<br />
The first step in suppressing the bullwhip effect is to isolate,<br />
detect, and quantify inefficiencies within each stage and their<br />
respective contributions to system-wide aggregate inventory RO.<br />
The next step is to use this knowledge to drive inventory policy.<br />
Since Army inventories are managed to these computed ROs,<br />
reducing the value of the RO is critical to eliminating<br />
unnecessary inventory. As recommended prescriptions for<br />
improved performance are implemented in each of the stages,<br />
their respective contributions to reducing RO (while sustaining<br />
or actually improving readiness performance) can be measured,<br />
compared and assessed within a rational cost-performance<br />
framework (see Figure 2).<br />
In general, these various contributions to the aggregate,<br />
system-wide RO (induced by the bullwhip effect) can be isolated,<br />
quantified, then systematically reduced by understanding and<br />
attacking root causes. They include the following:<br />
Reducing demand uncertainty by adopting empiricallyderived,<br />
mission-based demand forecasting<br />
Reducing supply-side lead times and their associated<br />
variability<br />
Improving order fulfillment while reducing back orders and<br />
requisition wait times by implementing readiness-based<br />
sparing (RBS) stock policies, inventory pooling, and<br />
ultimately, tactical-level demand driven supply networks<br />
An especially compelling and urgent need—and also one with<br />
lucrative potential benefits—is the reverse pipeline. As<br />
retrograde operations become more responsive and contribute<br />
to a synchronized closed-loop supply chain, it becomes possible<br />
to reduce RO and safety stock for specific depot-level reparable<br />
components (DLRs) while simultaneously reducing back orders<br />
and increasing readiness (Ao – operational availability). As<br />
these efforts are systematically pursued, the logistics system<br />
Air Force Journal of <strong>Logistics</strong>
ecomes more efficient. RO<br />
(safety stock) is reduced while<br />
performance (back orders and<br />
Ao) is increased, thereby<br />
moving toward the efficient<br />
frontier in the cost-performance<br />
trade space (see Figure 3).<br />
Efficiency,<br />
Resilience, and<br />
Effectiveness<br />
Simply recognizing that these<br />
bullwhip conditions exist does<br />
not guarantee that needed<br />
changes will actually be made.<br />
Moreover, these debilitating<br />
and persistent effects can be<br />
avoided only if long term<br />
organizational behavior and<br />
management processes are<br />
addressed.<br />
In addition to reducing<br />
demand uncertainty, and<br />
identifying the causes and<br />
reducing the effects of supply<br />
and demand variability within<br />
each of the logistics stages,<br />
the stages must also be<br />
integrated—linked together in<br />
meaningful ways—for credible<br />
cause and effect relationships to<br />
be identified among new<br />
initiatives. Department of the<br />
Army resource allocation<br />
investment levels can then be<br />
credibly related to readinessoriented<br />
operational outcomes<br />
(see Figure 4).<br />
Achieving Efficiency<br />
A recurring management<br />
challenge in complex supply<br />
chains is determining where<br />
and in what quantities to hold<br />
safety stock in a network to<br />
protect against variability, and<br />
to ensure that target customer<br />
service levels are met. In an<br />
effort to improve supply chain<br />
efficiency, an appreciation for<br />
the interdependencies of the<br />
various stages is required in<br />
order to fully understand<br />
how inventory management<br />
decisions in one particular<br />
stage or location impact other<br />
stages throughout the supply<br />
chain.<br />
For military and aerospace<br />
logistics systems, optimizing<br />
<strong>Vol</strong>ume XXXII, Number 4<br />
AMC Requirements Objective ($ in Billions)<br />
12<br />
10<br />
8<br />
6<br />
4<br />
2<br />
0<br />
Acquisition Wholesale Retail Unit Demand<br />
A o<br />
1.1<br />
1.0<br />
3.4<br />
2.1<br />
0.5<br />
0.8<br />
0.3<br />
1.4<br />
Single-<br />
Echelon<br />
Supplier<br />
Lead<br />
Time<br />
Retail<br />
Inventory Drivers<br />
Demand<br />
Customer<br />
Numeric Stockage Objective<br />
Repair Cycle<br />
Stock Due Out<br />
Procurement Cycle<br />
Production Lead Time<br />
Administrative Lead Time<br />
Safety Level<br />
Below Depot SSF RO<br />
War Reserve<br />
Multi-<br />
Echelon<br />
Supplier<br />
Lead<br />
Time<br />
Wholesale<br />
Inventory Drivers<br />
Lead<br />
Time<br />
Retail<br />
Inventory Drivers<br />
Demand<br />
Customer<br />
Reverse<br />
<strong>Logistics</strong><br />
Safety Stock<br />
Because inventories are<br />
managed to the computed<br />
RO, reducing the value of the<br />
RO calculated by AMC’s AMC s<br />
models is a critical first step<br />
to reducing inventories.<br />
Gain in<br />
Efficiency<br />
$<br />
Supplier<br />
Lead<br />
Time<br />
Wholesale<br />
Inventory Drivers<br />
Lead<br />
Time<br />
Retail<br />
Inventory Drivers<br />
Customer<br />
Demand<br />
$160,000<br />
$160,000<br />
$140,000<br />
$140,000<br />
$120,000<br />
$120,000<br />
$100,000<br />
$100,000<br />
$80,000<br />
$80,000<br />
$60,000<br />
$60,000<br />
$40,000<br />
$40,000<br />
$20,000<br />
$20,000<br />
Wholesale<br />
Replenishment<br />
Optimization<br />
Retail<br />
Replenishment<br />
Optimization<br />
Baseline Cost<br />
Optimized Cost<br />
$0<br />
$0<br />
50% 60% 70% 80% 90% 100%<br />
Service Level<br />
Figure 2. Improving System Efficiency—Across the System of Stages and within Each Stage<br />
Efficient Frontier<br />
Figure 3. Achieving Efficiency in the Cost-Availability Trade Space<br />
Supplier<br />
Lead<br />
Time<br />
Wholesale<br />
Inventory Drivers<br />
Inventory Drivers Sequential Approach Multi-Echelon Approach<br />
Figure 4. Multi-Echelon Integration<br />
Lead<br />
Time<br />
Retail<br />
Inventory Drivers<br />
Customer<br />
Demand<br />
Network<br />
Replenishment<br />
Optimization<br />
67
these decisions requires a decision support system that captures<br />
multiechelon, multi-item, multi-indenture interactions, and also<br />
the dynamics of the reverse flows for reparable components. Such<br />
a decision support system must also be linked to the various<br />
supply information transactions, depot repair and overhaul, and<br />
long term planning systems that affect the overall responsiveness,<br />
support adequacy, and capacity of the fleet supply chain<br />
enterprise—the readiness of the entire, globally-dispersed<br />
logistics support system.<br />
Consequently, an integrated, multiechelon network offers<br />
several opportunities for supply chain efficiency:<br />
68<br />
Multiple, independent forecasts in each of the stages are<br />
avoided.<br />
Variability in both demand and lead time (supply) can be<br />
accounted for.<br />
The bullwhip effect can be observed, monitored, and<br />
managed.<br />
Its various root causes can be identified and their effects<br />
measured, corrected, and tracked.<br />
Common visibility across the supply chain stages reduces<br />
uncertainty, improving demand forecasting and inventory<br />
requirements planning.<br />
Order cycles can be synchronized (this has special<br />
significance for DLRs in the retrograde and depot repair<br />
stages).<br />
Differentiated service levels (for example, Ao targets for<br />
different units) can be accommodated.<br />
Action can be taken to reduce unnecessary inventory and<br />
operational costs, while simultaneously improving readinessoriented<br />
performance.<br />
Although the computations to incorporate key variables, their<br />
relationships, and associated costs are certainly not trivial, they<br />
can nonetheless be performed using advanced analytic methods,<br />
including RBS optimization methods. Improved results are then<br />
possible and the organization will have far greater confidence<br />
that it is operating closer to the efficient frontier within the costperformance<br />
trade space.<br />
For military aircraft it has also been demonstrated that DLRs<br />
most directly relate to aircraft performance and, in general,<br />
minimizing the sum of DLR back orders is equivalent to<br />
maximizing aircraft availability. Significant effort has also been<br />
placed on determining optimal stock levels and locations for<br />
reparable components in a multiechelon system. While the<br />
subsequent extension of this theory has been widespread, the<br />
focus of practical implementation within the Department of<br />
Defense (DoD) has been on fixed-wing aircraft in the Navy and<br />
the Air Force, rather than rotary wing aircraft in the Army. Another<br />
structural constraint which previously precluded an integrated<br />
multiechelon approach for Army supply systems was the<br />
existence of separate stock funds used by the Army financial<br />
management system for retail and wholesale operations. In recent<br />
years, however, these separate funds have been combined into<br />
one revolving fund, the Single Stock Fund (SSF). In theory, this<br />
SSF should both facilitate and encourage adoption of an<br />
integrated multiechelon approach. For example, the wholesale<br />
stage now has both visibility into the retail stage and more<br />
control over stock policy in the wholesale and retail stages,<br />
which it previously did not have for Class IX (repair parts). It<br />
now becomes possible for Army Materiel Command to<br />
incorporate multiechelon optimization for wholesale stock levels,<br />
in addition to retail RBS solutions, to be directly related to<br />
readiness (Ao).<br />
It is not possible to truly optimize performance output from<br />
large scale, complex systems if they have not first been<br />
integrated. The key integrating enabler for improved efficiency<br />
in all Army weapon system supply chains (and the more complex<br />
the system, the more crucial the enabler) is multiechelon readiness<br />
based sparing. Indeed, this is a precondition for Army logistics<br />
transformation.<br />
Designing for Resilience<br />
The intent is certainly not to blindly adopt the latest management<br />
fad inundating the corporate world, but rather to consider<br />
adapting proven concepts to the unique needs and challenges<br />
the Army faces. The opposite result could occur with just-in-time<br />
methods. Lean manufacturing concepts have certainly helped<br />
firms to become more competitive through the application of justin-time<br />
principles which exchange industrial age mass for<br />
information age velocity. In addition, many of the original Lean<br />
manufacturing concepts, especially the focus on reducing<br />
stagnant work-in-progress inventory, have been successfully<br />
adapted for supply chain management across the entire enterprise.<br />
However, the idea of integration, when achieved by reducing<br />
slack or waste in the system, does not necessarily enable greater<br />
flexibility.<br />
Furthermore, just-in-time concepts, although a powerful<br />
inventory reduction method, need stable, predictable supply<br />
chains for maximum efficiency. Even when enabled by<br />
information technology (IT), Lean supply chains can be fragile,<br />
vulnerable to disruption, and unable to meet surge requirements<br />
needed to accommodate an immediate increase in demand. In<br />
fact, recent official documents describe exactly such a condition<br />
for Army logistics in recent years. Under greater duress and the<br />
compounding stress of ongoing operations, the military logistics<br />
system has indeed resulted in a Lean supply chain without the<br />
benefit of either an improved distribution system or an enhanced<br />
information system.<br />
A more appropriate analogy for Army logistics is a flexible,<br />
robust logistics network; not a serial chain or hierarchical<br />
arborescence (see Figure 5), but rather a network web—as in spider<br />
web—which is then enabled by a strong analytical foundation<br />
with supporting IT to achieve an integrated, flexible, efficient,<br />
and effective logistics capability.<br />
The research and subsequent understanding of emergence in<br />
self-organizing systems has been rapidly advancing in recent<br />
decades, extending originally from cybernetics to incorporate<br />
growing knowledge in cognitive science, evolutionary biology,<br />
dynamic systems, stochastic processes, computational theory,<br />
and culminating now in complex adaptive systems. For military<br />
operations, this network-centric future force will be linked and<br />
synchronized in time and purpose, allowing dispersed forces to<br />
communicate and maneuver independently, while sharing a<br />
common operating picture. Conceptually, the traditional<br />
mandate for overwhelming physical mass, in the form of a linear<br />
array of land combat forces converging at the decisive place and<br />
time, is replaced by attaining comparable effects derived from<br />
dispersed and disparate forces operating throughout a nonlinear<br />
battlespace.<br />
Air Force Journal of <strong>Logistics</strong>
Our ability to logistically<br />
support these concepts,<br />
especially the notion of an agile<br />
supply network at the theater<br />
and tactical levels for Army and<br />
Joint logistics distribution, may<br />
be much closer at hand now than<br />
previously recognized. At the<br />
tactical level for example, the<br />
demand driven supply network<br />
(DDSN), which includes<br />
mission-based forecasting on<br />
the demand side and RBS,<br />
lateral supply and risk-pooling<br />
(especially for depot level<br />
reparables) on the supply side,<br />
provides the foundational basis<br />
for a more agile and resilient<br />
network web (see Figure 6).<br />
Through theoretical<br />
development corroborated by<br />
recent field tests, this DDSN<br />
concept has also been shown<br />
to attain both improved<br />
effectiveness (Ao) and, as total<br />
asset visibility (TAV) and<br />
intransit visibility (ITV) ITbased<br />
technologies are<br />
incorporated, increasingly<br />
better efficiency. Such a tactical<br />
level DDSN is not only effective<br />
and efficient, but also both<br />
resilient and adaptive, enabling<br />
a rapid transition away from<br />
the traditional hierarchical<br />
arborescence structure, which<br />
required mountains of iron<br />
necessary to buffer uncertainty,<br />
inefficiencies, and rigidity<br />
toward an adaptive network<br />
design consistent with sense<br />
and respond logistics.<br />
By applying design<br />
principles for supply chain<br />
resilience, a supply chain<br />
operating a large-scale (global),<br />
demand-driven (pull) system<br />
under stable and predictable<br />
demand can quickly adapt to<br />
support localized, temporary<br />
requirements that may involve<br />
considerable uncertainty, but<br />
which must be pushed to the<br />
<strong>Vol</strong>ume XXXII, Number 4<br />
Wholesale System<br />
Retail System<br />
ASL<br />
SSA<br />
SSA<br />
ASL DDOC<br />
ASL SSA<br />
SSA<br />
- RBS reduces cost<br />
- Inventory pooling reduces<br />
both cost and risk<br />
- Lateral supply decreases<br />
requisition<br />
- Delay time & increases Ao<br />
customer (combat units) to achieve maximum effectiveness<br />
(mission Ao in this case). Resilient design concepts include the<br />
identification of push-pull boundaries separating base from surge<br />
demand using decoupling points for the placement and use of<br />
strategic capacity and inventory.<br />
These concepts suggest, first, creating prepositioned, missiontailored<br />
support packages designed using RBS in conjunction<br />
SSA<br />
ASL<br />
PLL<br />
NICP<br />
SSA<br />
DDOC DDOC SSA<br />
SSA SSA SSA RBS<br />
Cost/Item<br />
List<br />
A<br />
NICP<br />
Vertical serial chains create vulnerable supply channels<br />
Increased buffer stock is required to reduce risk<br />
Results in increased inventory investment costs<br />
Figure 5. Current Structure: Arborescence<br />
RBS<br />
Stock<br />
List<br />
Figure 6. Demand Driven Supply Network (DDSN)<br />
$<br />
Hi Cost-<br />
Low Demand<br />
DLRs<br />
- Low Cost<br />
Consumables<br />
- Hi Demand<br />
Parts<br />
with mission-based forecasting. These tailored mission support<br />
packages can then accommodate replacement part needs at<br />
deployed locations where existing (host nation) sustainment is<br />
not immediately or readily available. This is an example of<br />
defining a decoupling point in the existing supply chain and<br />
creating additional slack inventory to accommodate a short-term<br />
69
70<br />
A o<br />
A o<br />
4<br />
3<br />
$<br />
2<br />
Gain in<br />
Efficiency<br />
$<br />
1<br />
Efficient Frontier<br />
Efficient Frontier<br />
Figure 7. Achieving Efficiency in the Cost-Availability Trade Space<br />
surge that the existing logistics supply network infrastructure<br />
cannot immediately support.<br />
Second, to accommodate sustained (rather than temporary)<br />
higher demand for extended operations (such as Operation Iraqi<br />
Freedom), resilient supply chain design principles suggest<br />
creating additional capacity, or relocating existing capacity,<br />
closer to the demand source. This strategic supply chain concept<br />
shifts decoupling points and push-pull boundaries by<br />
dynamically changing the supply chain configuration. Hence,<br />
the logistics network responds quickly to initially accommodate<br />
a short-term need with built-in slack inventory, and then adapts,<br />
if and when necessary, by actually changing its configuration to<br />
sustain increased longer-term requirements by relocating<br />
production (repair) capacity closer to the source of demand.<br />
In summary, efforts for attaining resilience must focus on<br />
strategically designing and structuring supply chains to respond<br />
to the changing dynamics of globally positioned and engaged<br />
forces, conducting different operational missions under a wide<br />
range of environmental conditions. Ultimately, this necessitates<br />
supply chain management innovation.<br />
Cost Benefit Alternatives:<br />
1. Improved effectiveness<br />
with increased costs<br />
2. Improved effectiveness at<br />
same costs<br />
3. Improved effectiveness at<br />
reduced costs<br />
4. Same effectiveness at<br />
significantly reduced costs<br />
… however, magnitude of each<br />
depends upon where you are on<br />
the current efficient frontier!<br />
… and the expansion trace of the<br />
improved frontier<br />
Figure 8. Increasing Effectiveness in the Cost-Availability Tradespace<br />
Improving Effectiveness<br />
Economists commonly make a<br />
distinction between efficiency<br />
and productivity. Efficiency<br />
refers to the output achieved<br />
from inputs using a<br />
given technology, while<br />
productivity also incorporates<br />
the results of changes in<br />
technology. By efficient we<br />
refer to those methods<br />
(whether policies, techniques,<br />
procedures, or technologies)<br />
which reduce uncertainty or<br />
variability both within any<br />
particular stage, as well as<br />
across the system of stages<br />
that comprise the multistage<br />
logistics enterprise. Using<br />
these methods would have the<br />
effect of moving toward the<br />
efficient frontier in the costavailability<br />
trade space<br />
(see Figure 7). Achieving an<br />
efficient solution results in<br />
operating on the existing<br />
efficient frontier and implies<br />
the best possible use of<br />
existing resources within the<br />
constraints of the current<br />
system design and business<br />
practices using existing<br />
technology.<br />
In contrast, a more effective<br />
(productive) method is one<br />
which actually shifts the<br />
existing efficient frontier,<br />
representing an improved<br />
operating curve. This reflects<br />
the fact that current business practices have actually changed:<br />
new or different technologies are being exploited. Cost benefit<br />
analyses can be performed on various initiatives which yield<br />
improved, but different results (see Figure 8).<br />
Finally, the ultimate goal is to sustain continual improvement<br />
and progress over time through innovation in all of its various<br />
forms—the notion of pushing the envelope (see Figure 9). This<br />
is the essence of productivity gain and differentiates, in<br />
competitive markets, those commercial firms that successfully<br />
compete, survive, and flourish over extended periods from those<br />
that do not.<br />
For a governmental activity, an engine for innovation is<br />
needed to compensate for the lack of competitive marketplace<br />
pressures, typically driven by consumer demand and customer<br />
loyalty. The most obvious engine for a military organization is<br />
imminent or evident failure on the battlefield. Failure in battle,<br />
especially if sufficient to cause the loss of a major war, clearly<br />
constitutes an unmet military challenge which is one of several<br />
key historical prerequisites for a revolution in military affairs.<br />
In the absence of imminent or evident failure resulting in<br />
battlefield losses which threaten the nation’s interests and values,<br />
Air Force Journal of <strong>Logistics</strong>
an alternative engine for innovation is an extensive<br />
experimentation capacity providing an ability to see the impact<br />
of alternative concepts, policies and procedures, doctrine, tactics<br />
and organizational design—a virtual or synthetic environment<br />
that can realistically illuminate a better way, possibly preempting<br />
future failure. This experimentation capacity must also have the<br />
institutional means to incorporate positive results into new or<br />
existing policies, doctrine, and resource programs—in short, an<br />
organizational capacity that both encourages and accommodates<br />
change.<br />
<strong>Vol</strong>ume XXXII, Number 4<br />
Design and Evaluation<br />
A viable strategy is now needed to transition from the existing<br />
state of affairs to a desired outcome defined by the characteristics<br />
presented. Inherent in developing such a strategy or plan are<br />
efforts to (1) optimize the allocation of limited resources and (2)<br />
understand and anticipate in advance the consequences, likely<br />
outcomes, and risks associated with an unlimited array of tasks<br />
that must be selected, sequenced, and synchronized for<br />
implementation.<br />
These two analytical approaches—optimization modeling<br />
and predictive modeling—must be used together in a<br />
complementary manner to illuminate a viable plan for<br />
implementation. They provide an analytically-based strategy to<br />
link means (resources) with ways (concepts and plans) to achieve<br />
desired ends (objectives): an<br />
analytical architecture to<br />
guide logistics transformation.<br />
The modeling and<br />
simulation methodology<br />
outlined in the next sections<br />
will provide this much-needed<br />
analytical capacity and could<br />
constitute a dynamic strategic<br />
planning capability for<br />
logistics transformation. The<br />
purpose of this engine for<br />
innovation, regardless of the<br />
form it ultimately takes, is to<br />
provide large-scale systems<br />
simulation analysis and<br />
experimentation capacity and<br />
expertise needed to serve as A0 a credible test bed. This<br />
capability will generate<br />
the compelling analytical<br />
arguments needed to induce,<br />
organize, sequence, and<br />
synchronize the many changes<br />
needed to gain momentum,<br />
then accelerate transformation<br />
for Army logistics, including<br />
those identified and described<br />
previously. The purpose,<br />
function, and relationships<br />
of key components of<br />
this enabling analytical<br />
architecture are described in<br />
the following paragraphs.<br />
Multistage Supply Chain Optimization<br />
Evolutionary progress for an Army logistics transformation<br />
trajectory can be easily imagined along a spectrum transitioning<br />
from legacy-reactive to future-anticipatory concepts.<br />
Reactive, cumbersome, World War II-era mass-based, order<br />
and ship concept where days of supply is the primary metric<br />
Modern supply chain management incorporating velocitybased,<br />
sense and respond concept where flow time is the metric<br />
Adaptive and dynamic, inference-based, autonomic logistics<br />
network concept to anticipate and lead, where the metrics are<br />
speed and quality of effects.<br />
However, a clearly defined implementation scheme for<br />
transformation is certainly not self-evident. Analytical<br />
methodologies are needed to properly sequence the vast array<br />
of new initiatives, modern technologies, process changes, and<br />
innovative management policies in cost-effective ways. Which<br />
ones are dependent upon others as enablers for their success?<br />
How many can be done in parallel? For those that can be, will it<br />
be possible to identify and quantify the different effects of their<br />
respective contributions? Will the synergistic consequences of<br />
interactions among complementary initiatives be measurable?<br />
Which ones may be precluded by combinations of other, more<br />
cost effective options? And how can we be assured that these<br />
$<br />
Figure 9. Pushing the Performance Envelope in the Cost-Availability Tradespace<br />
t n<br />
t 4<br />
t3 t2 t1 71
various initiatives are not inadvertently discarded because their<br />
potentially positive effects on readiness are lost in the existing<br />
noise of such a complex, massive supply chain? In short, how<br />
can cause and effect be disentangled as transformation proceeds?<br />
The earlier use of a multistage conceptual model to analyze<br />
the Army’s logistic structure naturally lends itself to the use of<br />
dynamic programming or a comparable problem solving<br />
technique. In this multistage, graphical example, the challenge<br />
is to determine the optimal allocation of a defined budget across<br />
a range of initiatives associated with these several logistics stages.<br />
Consideration must be given to various constraints that may be<br />
imposed within each of the stages as well. The overall goal is to<br />
maximize output from the system of stages - readiness (that is<br />
Ao).<br />
From a practical perspective, this approach also reinforces the<br />
crucial importance of developing a clearly defined, empirically<br />
measured readiness production function, and adopting RBS<br />
stock policies as enabling prerequisites to realize further costeffective<br />
improvements to the system. For example, if the link<br />
between the unit stage (where readiness is produced for specific<br />
capabilities) and the retail stage (where management policy has<br />
not been optimized to desired readiness objectives (Ao) by<br />
adopting RBS), then the potential positive effects of a wide range<br />
of other improvements throughout the supply chain will not be<br />
clearly visible and fully realized. Additionally, potential<br />
investments should not be chosen on an individual basis, but<br />
rather on how they interact with each other. Otherwise, their real<br />
effects will simply be lost in the downstream noise of a very<br />
volatile, disconnected, and inefficient supply chain.<br />
Dynamic Strategic Planning<br />
Second, use of a multiperiod model must be incorporated into<br />
logistics transformation to accommodate both the extensive and<br />
extended nature of this enormous undertaking. As events occur<br />
and a transformation trajectory evolves, a mechanism is needed<br />
to routinely update the optimal solution which, inevitably, will<br />
change over time due to (1) the inability to perfectly forecast<br />
future conditions, (2) consequences of past decisions which do<br />
not always reveal the results expected, and (3) the opportunities<br />
provided by adaptation and innovation as they materialize and<br />
offer improved solutions requiring new decisions.<br />
This dynamic strategic planning (DSP) approach is, in essence,<br />
a multiperiod decision analysis challenge which also encourages<br />
and assists in identifying, clarifying, and quantifying risk to the<br />
transformation effort. Risk assessment, a precursor to risk<br />
management, is needed to reduce and mitigate the inevitably<br />
disruptive consequences of any major transformative effort with<br />
all the uncertainties surrounding significant change.<br />
Most planning methods generate a precise, optimized design<br />
based upon a set of very specific conditions, assumptions, and<br />
forecasts. In contrast, DSP instead presumes forecasts to be<br />
inherently inaccurate (“the forecast is always wrong”) and<br />
therefore builds in flexibility as part of the design process. This<br />
engineering systems approach incorporates and extends earlier<br />
best practices including systems optimization and decision<br />
analysis. DSP allows for the optimal solution—more precisely,<br />
optimal policy—which cannot be preordained at the beginning<br />
of the undertaking, to reveal itself over time while incorporating<br />
risk management: a set of if-then-else decision options that<br />
evolve as various conditions unfold which cannot be predicted<br />
with certainty. This planning method yields more robust and<br />
72<br />
resilient system designs which can accommodate a wider range<br />
of scenarios and future outcomes than those more narrowly<br />
optimized to a set of specific conditions. Though perhaps easier<br />
to engineer and manage, traditional optimal designs can quickly<br />
degenerate toward instability when such conditions no longer<br />
exist.<br />
These observations suggest that large-scale, transformational<br />
endeavors are much more than conventional construction<br />
engineering efforts. They represent a major human enterprise<br />
where effective managerial decisionmaking requires a thorough<br />
understanding of the evolution and dynamics of the change<br />
undertaken. New software tools now make it possible for managers<br />
to actively participate in the development of these system<br />
dynamics models, so-called management flight simulators, which<br />
have become the basis for learning laboratories in many<br />
organizations.<br />
Army logistics transformation will benefit enormously from<br />
such an application. Since supply chain behavior often exhibits<br />
persistent and costly instability, a stock management structure<br />
can be used to model and explain these effects. Since this<br />
structure involves multiple chains of materiel stocks, information<br />
and financial flows, with resulting time delays; and because<br />
decision rules often create important feedback loops among the<br />
interacting operations of the supply chain, system dynamics is<br />
well suited for modeling and policy design (see Figure 10).<br />
Much of the management literature in business process<br />
reengineering emphasizes finding, then relaxing, major<br />
bottlenecks in the existing manufacturing or operations process.<br />
Focusing improvement effort on the current bottleneck<br />
immediately boosts throughput, while effort on nonbottleneck<br />
activities is wasted. However, relaxing one constraint simply<br />
enables another to develop as time progresses. Obviously,<br />
waiting for each successive bottleneck to occur would prolong<br />
and retard rather than accelerate continuous improvement. The<br />
value of system dynamics modeling is accelerating this<br />
understanding by exploring the implementation of different<br />
sequences in a synthetic (simulated) environment. By using the<br />
model to anticipate and accelerate this shifting sequence of<br />
bottlenecks, a prioritization scheme for these many initiatives<br />
can be developed. For the Army, a system dynamics model of<br />
the supply chain has the potential to guide and help accelerate<br />
logistics transformation by optimally sequencing and<br />
synchronizing the vast array of initiatives that have been<br />
suggested for implementation.<br />
Decision analysis, the second major analytical component in<br />
the evolution of DSP, enables structuring the combination of<br />
system dynamics-enabled design choices so they can be made<br />
in stages as a system evolves over time. Cost-effective options<br />
can be evaluated to determine the best pattern for system<br />
development depending on how uncertainties, both within the<br />
system and external to it, are resolved over time. Thus, DSP defines<br />
an optimal strategy or policy rather than a fixed plan.<br />
The most recent DSP improvements have focused on<br />
incorporating means to evaluate and build flexibility into<br />
designs. These include real options and robust design methods<br />
which enable calculation of the value of flexibility which was<br />
not previously considered. Consequently, flexibility as an<br />
attribute of engineering systems design was systematically<br />
neglected. Real options, applied to real physical systems, is an<br />
adaptation of options analysis which was developed for and has<br />
Air Force Journal of <strong>Logistics</strong>
een applied extensively in<br />
financial markets. Recent and<br />
ongoing applications of this<br />
newest aspect of DSP indicate<br />
the approach leads to<br />
substantial improvements in<br />
design. Also, embedding<br />
flexibility into diverse systems<br />
already optimized for<br />
performance under traditional<br />
deterministic concepts is<br />
leading to substantial savings<br />
in many cases.<br />
Operational and<br />
Organizational Risk<br />
Evaluation<br />
In conjunction with DSP, a<br />
wide variety of analytical<br />
methods should be used to<br />
understand, evaluate, and<br />
reduce risk during logistics<br />
transformation. Risk can<br />
take on different connotations<br />
depending upon the<br />
application. Accordingly, we<br />
address the following two<br />
concepts:<br />
Operational risk faced by the logistics system responding to<br />
various shocks, supply chain disruptions, and mission<br />
requirements that may not have been anticipated.<br />
Organizational risk to the Army logistics community,<br />
including the combination of investment, or programmatic,<br />
risk associated with new project undertakings, and the larger<br />
impacts induced by transformation uncertainties associated<br />
with organizational change at a difficult and challenging time.<br />
Operational risk, in this decision analysis context, consists<br />
of assessing both the likelihood of a particular adverse<br />
outcome and the consequences of that outcome.<br />
Practical management frameworks have recently been<br />
developed to systematically identify supply chain<br />
vulnerabilities, assess risk, and then formulate strategies to<br />
reduce those vulnerabilities and mitigate risk. Various sources<br />
and potential causes of disruption are then bundled into<br />
associated risk categories. Analytical tool kits can be applied to<br />
examine specific effects and larger consequences for these risk<br />
categories, then supply chain modeling and simulation is used<br />
to analyze, evaluate, and compare alternative operational<br />
strategies and their respective costs.<br />
Those strategies which reduce disruptive risk and enhance<br />
supply chain resilience, while simultaneously improving both<br />
efficiency and effectiveness, are ideal candidates for accelerated<br />
implementation. Two practical risk mitigation strategies which<br />
impact all three supply chain system performance objectives<br />
(efficiency, resilience, and effectiveness ) are (1) a demand-driven<br />
supply network (DDSN) which reduces buffer inventory,<br />
improves readiness, and provides tactical agility, and (2) theaterlevel<br />
decoupling points to enhance operational agility and<br />
flexibility by providing, respectively, slack inventory for short,<br />
specific mission surge needs (such as humanitarian operations)<br />
<strong>Vol</strong>ume XXXII, Number 4<br />
Inventory<br />
Vendors<br />
Orders to<br />
Vendors<br />
Payments to<br />
Vendors and<br />
Depots<br />
ReCap &<br />
ReSet<br />
Demand<br />
Inventory<br />
Wholesale<br />
Orders to<br />
Wholesale<br />
INFORMATION FLOWS<br />
ReCap &<br />
ReSet<br />
Funding<br />
AWCF<br />
Obligation<br />
Authority<br />
MATERIAL FLOWS<br />
Inventory<br />
Retail<br />
Figure 10. Supply Chain Flows<br />
Orders to<br />
Retail<br />
OMA<br />
Funding<br />
Available<br />
Inventory<br />
Unit<br />
FUNDING FLOWS<br />
Demand<br />
OMA<br />
Funding<br />
and, when necessary, slack capacity for long-term increases in<br />
demand to sustain in-theater operations.<br />
To address organizational (rather than operational) risk for<br />
Army logistics transformation, a variety of virtual, constructive,<br />
and live simulation methods (especially analytical<br />
demonstrations, field testing, and experimentation) can identify<br />
early on which technologies or new methods warrant further<br />
consideration. This process enables differentiating those<br />
appropriate or sufficiently mature for implementation from other<br />
methods that are not. In this context, organizational risk consists<br />
of the combined effects of both uncertainty of outcomes (simply<br />
not knowing the impacts of various alleged improvements on<br />
the logistics system) and also the uncertainty of future costs<br />
incurred as a consequence of either adopting (or failing to adopt)<br />
particular courses of action.<br />
An example of this accelerating crawl-walk-run approach is<br />
the sequence of experimentation and testing adopted by this<br />
project to first demonstrate, through rigorous analytical<br />
experimentation using the UH60 aircraft in the 101 st Airborne<br />
Division, the potential value of adopting RBS as aviation retail<br />
stock policy. These insightful, positive results then provided<br />
impetus for more widespread field testing with several aircraft<br />
types in an operational training environment at Fort Rucker.<br />
Confidence and credibility in a new, different method have<br />
been gained through experience while significantly reducing the<br />
uncertainty initially surrounding the new initiative. And returnon-investment<br />
results clearly reveal reduced investment costs<br />
while still meeting or exceeding aircraft training availability<br />
goals.<br />
<strong>Logistics</strong> System Readiness and<br />
Program Development<br />
The final enabling analytical component includes the<br />
development, refinement, and use of econometric and transfer<br />
73
function models. This capability is needed so that the Office of<br />
the Secretary of Defense and Headquarters Department of the<br />
Army level budget planners and resource programmers can relate<br />
budget and program investment levels with associated<br />
performance effects, including future capability needs and desired<br />
readiness outcomes. New impetus for this long-recognized need<br />
is now provided by DoD Directive 7730.65, which requires<br />
developing and implementing a new Defense Readiness<br />
Reporting System (DRRS). The Services, as force providers,<br />
generate and maintain military capabilities which are then<br />
provided to the regional combatant commanders to accomplish<br />
specified missions. Each Title 10 function consists of significant<br />
institutional resources, organizations, and programs which<br />
collectively define systems. Hence, a measure of each system’s<br />
ability to achieve its respective goal can be defined as its<br />
readiness (for example, logistics system readiness).<br />
Application of this systems approach using supply chain<br />
management concepts will help to identify constraints and weak<br />
links that are inhibiting desired readiness output (Ao), thus<br />
reducing the overall strength of the logistics chain. Marginal<br />
investment resources should then be spent on strengthening these<br />
weak links. OSD and the Services are pursuing many logistics<br />
initiatives, but as the supply chain structure is improved and<br />
refined, the logical next step is to understand and report the<br />
ability and capacity of the chain to generate output<br />
commensurate with its purpose.<br />
New supply chain management concepts are incorporating<br />
geospatial sensors and automatic identification technologies to<br />
enable TAV and the transition toward adaptive supply chains.<br />
In particular, radio frequency identification (RFID) is expected<br />
to significantly reduce transaction error rates while also<br />
providing near real-time, high volume data. Although these new<br />
technologies hold great potential, it is unlikely that legacy<br />
software and enterprise resource planning (ERP) systems will be<br />
able to provide improved decision support and fully extract all<br />
of the potentially useful information contained in these high<br />
volume data streams.<br />
Recent forecasting advances have yielded more accurate and<br />
precise results. These models, described as generalized<br />
autoregressive conditional heteroskedastic (GARCH), are able<br />
to significantly reduce the error term by better quantifying<br />
interaction and lag effects among the explanatory variables and<br />
time series within the model. As the volume of data increases,<br />
the ability of GARCH techniques to better disentangle and<br />
explain cause and effect relationships, while reducing forecasting<br />
error (unexplained model variance) improves. One project<br />
initiative involves examining the application of GARCH to<br />
RFID-generated supply demand data for units engaged in<br />
ongoing military operations in Iraq. Early results are promising,<br />
indicating that GARCH is yielding order of magnitude<br />
improvements for predictive performance compared to standard<br />
methods.<br />
In the near term, however, driven by the new DRRS mandate<br />
and enabled by supply chain concepts, econometric modeling<br />
and dynamic forecasting to understand, measure, and monitor<br />
Army logistics as a readiness-producing system, a conceptual<br />
framework has emerged for a <strong>Logistics</strong> Readiness and Early<br />
Warning System. The purpose is not only to assess and monitor<br />
supply chain capacity to efficiently and effectively support<br />
74<br />
current requirements, but also to anticipate its ability to<br />
responsively meet a range of future capabilities-based<br />
requirements as well. The objective is to overcome fundinginduced<br />
instability manifested in periodic boom and bust cycles.<br />
As Figure 11 portrays, three elements would interact in a<br />
feedback-alert-warning cycle. Automated monitoring<br />
continuously tracks and forecasts both tactical readiness (Ao)<br />
and supply chain parameters, then signals an alert if there is a<br />
decline in projected readiness or adverse trend in metrics.<br />
<strong>Management</strong> Assessment then validates an alert, quickly<br />
evaluates the potential problem, and assesses the impact of<br />
current and planned resource allocation as well as other technical<br />
initiatives which might mitigate or improve the logistics<br />
projection. After Headquarters Department of the Army (HQDA)level<br />
policy analysis and review, policy response acts to prevent<br />
a shortfall while minimizing recognition and resource response<br />
lags. This responsive link to program development is absolutely<br />
crucial to an adaptive demand network. Historically, however,<br />
this response has significantly lagged or been missing altogether<br />
causing boom and bust cycles in resource programming, thus<br />
precluding viable resource-to-readiness frameworks for<br />
management decisions.<br />
Further developed and refined over time, these forecasting<br />
models can increasingly be used for future capability forecasting,<br />
program requirements determination, and readiness prediction.<br />
These models should constitute part of a <strong>Logistics</strong> Readiness and<br />
Early Warning System contributing toward the DoD mandate for<br />
a larger DRRS by linking Army PPBES (Planning, Programming,<br />
Budgeting, and Execution System) to operational planning<br />
systems (readiness). The goal is to relate planning guidance,<br />
funding decisions, and execution performance in meaningful<br />
ways, all of which are informed by this supply chain health<br />
monitoring and management concept.<br />
Accelerating Transformation<br />
Several agencies and organizations with logistics modeling and<br />
supply chain simulation capabilities should now be integrated<br />
into a more formal research consortium to better coordinate their<br />
efforts and reinforce their respective strengths. This synergistic<br />
effort will facilitate properly sequenced field tests, experiments,<br />
and evaluation with supporting modeling, simulation, and<br />
analysis. Furthermore, these organizations should form the<br />
nucleus of an engine for innovation for logistics transformation—<br />
a Center for Innovation in <strong>Logistics</strong> Systems (CILS).<br />
The CILS organizational construct consists of three<br />
components which essentially comprise the core competencies<br />
(mission essential tasks) for the center (see Figure 12). The three<br />
components are as follows:<br />
A research and development model and supporting framework<br />
to function as a generator, magnet, conduit, clearinghouse,<br />
and database for good ideas.<br />
A modeling, simulation, and analysis component which<br />
contains a rigorous analytical capacity to evaluate and assess<br />
the improved performance, contributions, and associated costs<br />
that promising good ideas might have on large-scale logistics<br />
systems.<br />
An organizational implementation component which then<br />
enables the transition of promising concepts into existing<br />
organizations, agencies, and companies by providing training,<br />
Air Force Journal of <strong>Logistics</strong>
education, technical<br />
support, and risk reduction or<br />
mitigation methods to<br />
reduce implementation risk.<br />
These three components<br />
serve to accomplish the<br />
following:<br />
Encourage and capture a<br />
wide variety of inventions<br />
Incubate those great ideas<br />
and concepts within virtual<br />
organizations to test,<br />
evaluate, refine, and assess<br />
their potential costs, system<br />
effects, and contributions in<br />
a nonintrusive manner<br />
Transition those most<br />
promising ideas and<br />
concepts into actual<br />
commercial or governmental<br />
practice<br />
Hence the term innovation is<br />
deliberately in the center’s title<br />
to express the notion of an<br />
engine for innovation to support<br />
major transformation endeavors<br />
in the government and private<br />
sectors driven by an<br />
increasingly recognized<br />
necessity for change.<br />
These four modeling<br />
approaches—multistage<br />
optimization, dynamic strategic<br />
planning, risk management,<br />
and program development—<br />
should be used in unified<br />
and complementary ways to<br />
constitute a dynamic strategic<br />
logistics planning (DSLP)<br />
capability. DSLP can take, as input, both the empirical evidence<br />
of ongoing operational evidence (real world results) and also the<br />
potential contribution of new opportunities derived from an<br />
engine for innovation (synthetic results), and then guide (as<br />
output) logistics transformation toward strategic goals and<br />
objectives: an efficient, increasingly effective, yet resilient<br />
global military supply network. DSLP constitutes the analytical<br />
architecture needed to sustain continual improvement for<br />
logistics transformation (see Figure 13).<br />
Collectively, CILS and DSLP have the potential to accelerate<br />
the process of management innovation by building a capacity<br />
for low-risk experimentation using a credible, synthetic<br />
environment. This cycle sustains continuous improvement<br />
through a deliberative process of incremental innovation<br />
achieved through experimentation, prototyping, and field<br />
testing.<br />
<strong>Vol</strong>ume XXXII, Number 4<br />
Automated Monitoring<br />
- Readiness trends and forecasts<br />
- Supply chain metrics<br />
- <strong>Logistics</strong> system readiness parameters<br />
Academia<br />
Corporate<br />
Research<br />
Feedback<br />
Policy Response<br />
<strong>Management</strong><br />
Alert Assessment<br />
Warning<br />
(1)<br />
Clearing House for<br />
Good Ideas<br />
Organizational Design<br />
Supply/Value Chain<br />
Workforce Development<br />
Technology Implications<br />
Innovation & Productivity<br />
Gain<br />
- Corroborate and validate alerts<br />
- Assess near and long-term implications<br />
- Integrate empirical evidence with human judgment<br />
Figure 11. <strong>Logistics</strong> Readiness and Early Warning<br />
FFRDC<br />
<strong>No</strong>n-Profits<br />
Government<br />
Organizations<br />
DAU<br />
ALMC<br />
(2)<br />
Modeling, Simulation<br />
& Analysis of<br />
LS Systems<br />
Academic<br />
Departments<br />
System Dynamics Modeling<br />
Large Scale (LS) System<br />
Design, Analysis, and<br />
Evaluation<br />
Systems Simulation,<br />
Modeling and Analysis<br />
- HQDA reviews<br />
- Analyze and implement cost-effective options<br />
- Minimize recognition and response bags<br />
- PPBES implications (resources-to-readiness)<br />
Professional<br />
Societies<br />
Private<br />
Companies<br />
Figure 12. Center for Innovation in <strong>Logistics</strong> Systems<br />
Final Thoughts<br />
(3)<br />
Transforming<br />
Organizations &<br />
Managing Change<br />
Public<br />
Private<br />
Education & Training<br />
Technical Support<br />
Risk Reduction & Mitigation<br />
Consulting<br />
Research, Studies, and<br />
Analysis<br />
Tactical units in the US Army are renowned for pioneering and<br />
refining the after action review concept as a continuous learning<br />
method to surface, diagnose, and correct deficiencies in order to<br />
improve performance and sustain operational excellence. Yet<br />
comparable diagnostic effort has not been prevalent at strategic<br />
levels within the institutional Army bureaucracy. Since<br />
analytically rigorous diagnosis, understanding, and response on<br />
management issues are not routinely performed to uncover<br />
ground truth and learn from mistakes, reactive firefighting has<br />
been the standard response to visible symptoms. Army logistics<br />
management has become sclerotic.<br />
As with any complex, large-scale systems challenge, key<br />
implementing concepts will be essential to ensure a successful<br />
Army logistics transformation endeavor. These organizational,<br />
analytical, information systems, technology, and management<br />
concepts should all be guided by a clear understanding of the<br />
75
76<br />
Innovation to Sustain Continual Improvement<br />
A 0<br />
$<br />
t n<br />
t 4<br />
t 3<br />
t2 t1 Objective Hierarchy:<br />
Relating Outcomes (Results) to Goals & Objectives (Desired Ends)<br />
Goal:<br />
Objectives:<br />
Performance<br />
Measures:<br />
(MOEs,<br />
‘Metrics’)<br />
Readiness<br />
Outcome:<br />
Improve <strong>Logistics</strong> Chain Efficiency and Effectiveness to<br />
Enable a Strategically Responsive, Transforming Army<br />
Reduce Lead Time<br />
Demand & System<br />
Variability<br />
ultimate purpose for which the<br />
enterprise exists—an<br />
organizational vision for the<br />
future and a supporting<br />
strategy to realize the vision<br />
(see Figure 14).<br />
This strategy must focus the<br />
effects of transformative<br />
change upon capabilitiesbased,<br />
readiness-oriented<br />
outcomes. The development<br />
of strategic planning and<br />
management frameworks are<br />
also essential to enable<br />
learning within organizations.<br />
Transformation will indeed<br />
require disturbing existing<br />
cultural paradigms, causing an<br />
inevitably disruptive period of<br />
significant change. Despite<br />
the inexorable advance of<br />
technology, it will be<br />
improved management and<br />
decision support systems that<br />
ultimately enable innovation potential to be realized. Finally,<br />
this endeavor should embrace that of a learning organization.<br />
This will be a crucial enabler for sustaining continuous<br />
improvement.<br />
A o<br />
Improve Strategic<br />
Mobility; Reduce<br />
Force Closure<br />
Timelines<br />
Reduce<br />
Sustainment<br />
‘Footprint’<br />
A O AO A O AO<br />
A o<br />
$<br />
Reduce Costs<br />
While Maintaining<br />
Readiness<br />
Achieving Effectiveness in the<br />
Cost -Availability Tradespace<br />
4<br />
3<br />
$<br />
2<br />
1<br />
Efficient Frontier<br />
Cost Benefits Alternatives:<br />
1. Improved effectiveness<br />
with increased costs<br />
2. Improved effectiveness at<br />
same costs<br />
3. Improved effectiveness at<br />
reduced costs<br />
4. Same effectiveness at<br />
significantly reduced costs<br />
… however, magnitude of each<br />
depends upon where you are on<br />
the current efficient frontier!<br />
… and the expansion trace of the<br />
improved frontier<br />
(for example, pushing the<br />
envelope)<br />
Figure 13. Sustaining Innovation While Linking Execution to Strategy<br />
Vision<br />
Strategic Concept<br />
Strategic Goals<br />
<strong>Management</strong> Objectives<br />
Strategies & Programs/Initiatives<br />
Annual Objectives<br />
Mission Achievement<br />
Achieving Efficiency in the Cost -<br />
Availability Tradespace<br />
A o<br />
Gain in<br />
Efficiency<br />
$<br />
Efficient Frontier<br />
Ends<br />
Ways<br />
Means<br />
Results<br />
Figure 14. <strong>Logistics</strong> Transformation Framework—Linking Strategy to Measurable Results<br />
We hope this endeavor will serve as a catalyst for an<br />
intellectual and professional resurgence in military logistics<br />
systems analysis. We are certainly encouraged by our empirical<br />
Air Force Journal of <strong>Logistics</strong>
esearch results which continue to reinforce and corroborate many<br />
of the intuitive concepts and ideas presented in this article.<br />
Consequently, we have engaged the larger military operations<br />
research and professional logistics communities and continue<br />
to encourage the participation of all those interested to<br />
collectively pursue this enormous challenge.<br />
<strong>Vol</strong>ume XXXII, Number 4<br />
Military <strong>Logistics</strong> and the Warfighter<br />
Greg H. Parlier, PhD, was the senior operations research/<br />
systems analyst on active duty when he retired as an Army<br />
colonel. The project described in this article was initially<br />
undertaken in 2002 when he was assigned as Director for<br />
Transformation at the US Army Aviation and Missile<br />
Command, Redstone Arsenal, Alabama.<br />
I<br />
think we can all agree there is a relationship between the function of military logistics and the<br />
warfighter. What is that relationship, and is it correctly defined? In the early 1960s, there was<br />
a stated relationship between logistics and the weapons systems: military logistics “support”<br />
the weapons system. At that time, the subject of military logistics was fairly new and, with little<br />
ongoing research, very slow in providing greater understanding about it. Therefore, during<br />
that period, this definition of relationship seemed appropriate. It was not until the late 1970s that<br />
several advocates of military logistics came to the realization that logistics support of the<br />
weapon system was actually creating and sustaining warfighting capability. This warfighting<br />
capability was provided to the combat forces in the form of continuing availability of<br />
operational weapon systems (the tools of war). This new awareness set up another definition<br />
of the relationship: military logistics creates and sustains warfighting capability. While many<br />
heard the words, few realized their implications.<br />
The level of warfighting capability that logistics provides the combat forces determines the extent<br />
to which war can be waged. This, in turn, limits and shapes how the war will be waged. Warfighting<br />
capability is embedded in the design of all weapon systems. Advancing technology increases speed,<br />
range, maneuverability, ceiling, and firepower, all of which provide more lethal and accurately<br />
guided munitions, stealth, and other offensive and defensive warfighting capabilities. They will be<br />
embedded into the design of future weapon systems. It is the weapon systems that contain the<br />
warfighting capability of military forces. The strength of military forces is no longer measured by<br />
the number of men under arms. Today, military forces are measured by the number—and<br />
warfighting capabilities—of their weapon systems. The Department of Defense has yet to<br />
adequately define and manage the total logistics environment (those activities and resources required<br />
to create and sustain warfighting capability). While it is said that armies travel on their stomachs,<br />
what is usually left unsaid is they perform on the basis of their logistics competency.<br />
Today, as most of you are aware, we have another, more recently defined relationship: military<br />
logistics supports the warfighter. We know military logistics creates and sustains warfighting<br />
capability. We can assume the warfighter fights wars. It would, therefore, appear reasonable to<br />
suggest that in order for one to be a warfighter (a pilot in this case) he or she must have the capability<br />
to wage war. While weapon systems are designed and created to wage war, people are not.<br />
Therefore, in order to become warfighters, pilots must be provided with some level or amount of<br />
warfighting capability. I would submit that by providing the pilot with an operational weapon system,<br />
which allows him or her to utilize its warfighting capability, military logistics creates the<br />
warfighter. It does not support the warfighter; it creates the warfighter. This transformation<br />
occurs when a checked-out pilot starts the engine. At that point, the pilot is in control of the<br />
weapon system and its warfighting capability. The pilot is now the warfighter. Without the<br />
warfighting capability, which the weapons system provides, a pilot is a pilot.<br />
Military logistics creates and sustains warfighting capability; by doing so, military logistics creates<br />
and sustains the warfighter.<br />
Colonel Fred Gluck, US<strong>AF</strong>, Retired<br />
77
78<br />
>>>><br />
Jay Barber, Global <strong>Logistics</strong> Support Center, US<strong>AF</strong><br />
Michael Werneke, Global <strong>Logistics</strong> Support Center, US<strong>AF</strong><br />
Kevin P. Duffy, PhD, Wright State University<br />
Introduction<br />
Information is the key to enabling supply chain design and performance.<br />
Accurate shipping and billing addresses are vital to the transportation<br />
segment within the supply chain; these addresses assure that products<br />
get to the right place, at the right time, and at the right cost. This is true for<br />
all supply chains, but even more so for the Department of Defense (DoD)<br />
distribution system. <strong>No</strong>t only does the DoD have fixed locations around<br />
the world to where supplies are shipped, but the DoD also ships to combat<br />
operations that continually change their locations.<br />
Every DoD organization, including those in combat zones, has an<br />
address to receive mail and materiel. To manage this information, the DoD<br />
relies on a 6-digit code called a Department of Defense activity address<br />
code (DODAAC, pronounced “doe-dack”) which represents an<br />
organization’s physical address. Currently, the Air Force assigns and<br />
maintains over 9,000 DODAACs. This article documents the reengineering<br />
of an antiquated DODAAC maintenance process by applying Lean<br />
techniques. 1 Modern Web technology and the utilization of Lean concepts<br />
has enabled the development of a system that not only improves efficiency<br />
and reduces man-hours of processing time, but also provides tools for<br />
tracking information that have been impractical in the past. We discuss<br />
the history of DODAACs, their importance to DoD and Air Force activities,<br />
how the DODAAC system used to work, and what changes were required.<br />
We then discuss the redesign, development, testing and implementation<br />
of the new system. We conclude with a discussion of how the Air Force<br />
supply chain will benefit from using the new DODAAC Web <strong>Management</strong><br />
System.<br />
The warfighter must have visibility of all<br />
logistics processes to effectively engage in<br />
combat in the dangerous, resource<br />
constrained, and remote locations where<br />
they are deployed. Creating systems that are<br />
able to provide the instantaneous<br />
information required is essential for effective<br />
operation in war zones.<br />
Lean Initiatives in the<br />
Supply Chain<br />
The introduction of manufacturing systems<br />
had a profound impact upon workers,<br />
organizations, and life. These systems were<br />
set up to speed parts and raw materials<br />
through the manufacturing process. In turn,<br />
less expensive production methods resulted<br />
in the production of less expensive goods for<br />
consumers. As an added bonus,<br />
organizations realized huge profits.<br />
However, many of these manufacturing<br />
systems were laid out without giving<br />
thought to the process as a whole, or how the<br />
parts or pieces of the process interacted in<br />
order to produce a finished good. In an effort<br />
Air Force Journal of <strong>Logistics</strong>
<strong>Vol</strong>ume XXXII, Number 4<br />
79
to keep the manufacturing process moving, firms often would<br />
accumulate large amounts of parts and other inventory. The<br />
notion behind holding vast amounts of inventory was that of fully<br />
utilizing manufacturing tools and the firm’s labor pool. Fully<br />
utilizing tools and labor would result in producing as much of a<br />
product as the firm was capable of producing. Unfortunately, this<br />
perspective did not consider the costs associated with inventory<br />
or its related carrying costs. The availability of excess labor and<br />
excess inventory, while enabling production to carry on within<br />
a manufacturing facility, translated into a cost to the firm which<br />
did not add value to the finished product (did not add value to<br />
the end customer).<br />
In contrast, Lean initiatives, as applied to the manufacturing<br />
process, are intended to improve business by focusing on the<br />
elimination of waste. When Lean principles were adopted within<br />
manufacturing, more attention was given to factors such as how<br />
a chain of processes worked together, or how a process could be<br />
broken down into a rearranged series of tasks or steps.<br />
Lean principles were originally adopted by organizations in<br />
an effort to remove waste and revitalize manufacturing processes,<br />
with hopes of achieving productivity gains seen in Japanese<br />
companies. Grant states that “Lean manufacturing was developed<br />
in Japan to eliminate waste in manufacturing processes.” 2 An<br />
implementation of Lean principles strives to eliminate waste;<br />
both physical waste (excess inventory holdings) as well as process<br />
waste (removing excessive processing time and unnecessary<br />
processing steps from the firm’s value chain). Underlying the<br />
application of Lean is the discovery that while processes may<br />
differ from manufacturing to service companies, and from one<br />
type of process to another, processes seem to suffer from the<br />
inclusion of unnecessary or wasteful steps. Taking an approach<br />
of standardizing process design aids in uncovering and<br />
eliminating many of these redundant or wasteful steps. 3<br />
Manrodt, Vitasek, and Thompson 4 note that their research has<br />
pointed them toward six attributes which are vital to building a<br />
Lean supply chain. These attributes are as follows:<br />
80<br />
Article Acronyms<br />
<strong>AF</strong>B – Air Force Base<br />
<strong>AF</strong>MC – Air Force Materiel Command<br />
DAASC – Defense Automatic Addressing System<br />
Center<br />
DoD – Department of Defense<br />
DODAAC – Department of Defense Activity Address<br />
Code<br />
DODAAD – Department of Defense Activity Address<br />
Directory<br />
HQ - Headquarters<br />
ICP – Inventory Control Point<br />
LOT – Office Symbol for Distribution Office<br />
LSO – <strong>Logistics</strong> Support Office<br />
MAJCOM – Major Command<br />
MILSTRIP – Military Standard Requisition and Issue<br />
Procedures<br />
SME – Subject Matter Expert<br />
SP – Service Point<br />
TAC – Type Address Code<br />
Improved demand management<br />
Waste and cost reduction<br />
Process standardization<br />
Industry standards adoption<br />
Cultural change agent<br />
Cross enterprise collaboration<br />
Improved demand management is an organizational focus on<br />
moving toward a pull supply system, rather than a push system.<br />
Briefly, a pull system revolves around customer demands<br />
(initiated when a customer places an order) rather than a<br />
manufacturer pushing goods into the system. Waste and cost<br />
reduction work hand-in-hand within a Lean system, rather than<br />
competing with one another. This is to say that cost reduction is<br />
not more important, as a system goal, than is reducing—or<br />
eliminating—waste. Waste can take the form of time, excess<br />
inventory, or can be found within organizational processes. Often,<br />
the authors note, when waste is reduced or eliminated, this<br />
reduction may be accompanied by cost reduction. Importantly,<br />
though, the authors note that the focus should remain one of<br />
reducing waste. They caution that focusing too sharply on cost<br />
reduction may “lead a firm down a suboptimal path, as not all<br />
waste can be easily tied to costs.” 5<br />
Process standardization requires the firm to promote the<br />
standardizing of processes across the firm, with the intention of<br />
directing the process flow toward the chain’s most efficient<br />
points. Further, they note that organizations wishing to<br />
differentiate themselves on the basis of proprietary workmanship<br />
may actually impede the smooth and efficient flow of work and<br />
processes, especially when materials and products cross country<br />
and organizational borders.<br />
The notion of Lean being involved in cultural change stems<br />
from the age-old problem of resistance to change. The authors<br />
note 6 that one obstacle to implementing Lean principles is that<br />
these actions must be undertaken by people—people who often<br />
question why the tried-and-true methods of accomplishing tasks<br />
is no longer viewed as optimal. In these cases, actively promoting<br />
Lean through change management may be valuable for the firm.<br />
Kumar 7 states that organizations may wish to involve users and<br />
other employees in the project, as this will foster a sense of<br />
ownership. Finally, and importantly with respect to the supply<br />
chain, is to emphasize the notion of working with partners in<br />
bringing value to the customer, rather than suboptimally<br />
embracing a view which extends no further than the<br />
organization’s boundaries.<br />
While the practice of Lean manufacturing has been around<br />
for a while, the notion of applying Lean principles to the supply<br />
chain is a newer concept. Grant notes 8 that “most businesses have<br />
yet to apply Lean thinking to service and transaction processes.”<br />
This article examines the efforts to introduce Lean to the<br />
Department of Defense (DoD) supply chain. A survey conducted<br />
by Manrodt, Vitasek and Thompson 9 discovered that although<br />
Lean principles and concepts are being applied to the supply<br />
chain across numerous organizations, these principles are slow<br />
to be adopted in nonmanufacturing organizational settings.<br />
Additionally, the researchers note that the application of Lean<br />
can result in behavior or procedural changes within<br />
organizations. These necessary changes often present a barrier<br />
to the adoption and application of Lean. (The authors cite the<br />
Air Force Journal of <strong>Logistics</strong>
common anecdote of “we’ve always done it this way” as an<br />
example of resistance to change.) Importantly, the DoD is seen<br />
as an enormous organization, and an organization which is<br />
steeped in the traditional: the DoD encompasses ways of doing<br />
things which apply to supplier selection, organizational<br />
processes, and rigid hierarchical chains of command.<br />
Thus, the implementation of Lean principles into the DoD<br />
supply chain grants an extraordinary opportunity to examine a<br />
Lean implementation from two different perspectives. The first<br />
is that of applying Lean to a nonmanufacturing organization.<br />
The second perspective is to view attempts to implement Lean<br />
in a rigid organizational setting. Our hope is to gather lessons<br />
learned from the implementation which, in turn, may assist other<br />
nonmanufacturing organizations, as well as other hierarchically<br />
structured organizations in their considerations of whether or not<br />
Lean initiatives are worth pursuing within their own<br />
organization.<br />
The DODAAC within the DoD<br />
For nearly 50 years, the DoD has relied on a standardized<br />
logistics system to manage the requisition and supply processes<br />
necessary to support worldwide armed forces operations. This<br />
program, known as Military Standard Requisition and Issue<br />
Procedures (MILSTRIP, DoD 4000.25-1-M) was designed in an<br />
era of mainframe computers and punch cards. Since data entry<br />
was restricted to 80 characters of data per card, the program relied<br />
heavily on coding of information. These codes are delineated in<br />
written manuals, regulations, or instructions. Although the DoD<br />
is working on modernizing this system, MILSTRIP is still in use<br />
today and still relies on coded information. 10<br />
One code is the DODAAC. The DODAAC is a six-digit code<br />
that represents shipping, mailing, and billing addresses for DoD<br />
locations throughout the world.<br />
The Defense Automatic Addressing System Center (DAASC),<br />
located at Wright-Patterson Air Force Base (<strong>AF</strong>B) houses the data<br />
base that maintains the addresses for the DoD. This database is<br />
called the Department of Defense Activity Address Directory<br />
(DODAAD). Governed by DoD Manual 4000.25-6-M, this<br />
publication delineates responsibilities for each branch of the<br />
military and various other government agencies that supply<br />
material to the DoD and require DODAACs. Each of these<br />
organizations has an office called a service point to maintain their<br />
codes and addresses and input the information into the<br />
DODAAD.<br />
The Air Force service point is located within the 401<br />
SCMS/Distribution Flight at Wright-Patterson <strong>AF</strong>B. This service<br />
point maintains over 9,000 military and contractor DODAACs<br />
located throughout the Air Force. The office works with customers<br />
worldwide to establish new Air Force addresses. Prior to the<br />
reengineering effort, new addresses were accomplished through<br />
a series of complex and outdated methods including an Air Force<br />
Materiel Command (<strong>AF</strong>MC) legacy data system (D035T,<br />
developed in the 1980s), a Web site developed in 1995, and a<br />
network of military and civilian employees who approve new<br />
codes and address changes for their Air Force major command<br />
(MAJCOM). For example, Headquarters <strong>AF</strong>MC has four persons<br />
assigned the task of maintaining the DODAACs for all of the<br />
command—an organization with over 78,000 people.<br />
<strong>Vol</strong>ume XXXII, Number 4<br />
Background<br />
DODAAC Essential to the Air Force Supply Chain<br />
Whenever an Air Force organization needs stock listed material<br />
(material that has been designated with a national stock number)<br />
to support their mission (for example an aircraft part) their supply<br />
system (Standard Base Supply System) generates a DoD<br />
requisition which is routed to the appropriate inventory control<br />
point (ICP). An item manager of the part determines from where<br />
to source the request and generates a material release order to<br />
have the item released from stock, or ordered from a vendor, and<br />
shipped to the customer. A DODAAC identifying the<br />
organization submitting the requisition is necessary before the<br />
requisition can be processed by the ICP. Once the material is<br />
released for shipment, the DODAAC is used to indicate where<br />
the material is to be shipped and is included in the transportation<br />
control number used to track the shipment through the<br />
transportation pipeline. Without a DODAAC included in the<br />
11, 12<br />
requisition, none of this could take place.<br />
DODAAC Requirements<br />
Although the DODAAC is a simple 6-digit code and the data<br />
behind the code is relatively straight forward (addresses), the<br />
information associated with a DODAAC’s application within<br />
each Service and agency can be complex. The rules directing<br />
how addresses are developed and displayed in the data base are<br />
standard throughout the DoD. For example, each DODAAC will<br />
have a corresponding clear text address that will consist of a type<br />
address code (TAC) 1, 2 or 3. A TAC 1 address represents where<br />
a unit wants mail and mail-like material (US mail and possibly<br />
small parcel delivery) delivered. A TAC 2 address is where a unit<br />
wants freight delivered (normally larger than 150 pounds), and<br />
a TAC 3 is an invoicing address. Many times only a TAC 1<br />
address is required as the unit may want both freight and mail<br />
delivered to the same location. Mail to overseas locations will<br />
usually go to an APO (military post office) and freight will go to<br />
a separate location with a street address requiring both a TAC 1<br />
and TAC 2 address. International addresses have a variety of<br />
differences, so DAASC has developed a standard address format<br />
so all Services make their addresses look the same.<br />
To keep each agency and military Service’s DODAACs unique<br />
and separate from each other, the DoD has designated the first<br />
letter of the DODAAC to represent each Service and agency. The<br />
Air Force is restricted to codes that begin with E, F, and J.<br />
Although there are only three sets of codes available to the Air<br />
Force, there are thousands of combinations of numbers that can<br />
be created. All the other military Services and DoD agencies that<br />
require a DODAAC have been assigned their own unique codes.<br />
An “A,” for example is for Army. The Air Force cannot assign<br />
any DODAAC that begins with an A. As long as the DODAACs<br />
begin with E, F, and J, the Air Force has been free to develop its<br />
own policy concerning format and use of the codes.<br />
Air Force DODAAC Requirements<br />
Over the years the Air Force DODAAC policy was developed to<br />
use the codes for purchasing and shipping various types of<br />
commodity (engines—FExxxx, munitions—FKxxxx, fuel—<br />
FPxxxx), types of product (computers—Fuxxxx, clothing—<br />
FSxxxx), types of service (base library—FLxxxx, dining halls—<br />
FTxxxx), and types of process (base supply—FBxxxx, ship to<br />
81
only—Fyxxxx). In addition, F series DODAACs apply to<br />
military, E series DODAACs apply to Air Force contractors and<br />
J series DODAACs are used to supply a range of maps and flight<br />
publications to flying activities throughout the Air Force. To<br />
manage DODAACs for all these different purposes takes a large<br />
network of persons to provide the knowledge of how and why<br />
an Air Force DODAAC will be assigned (Air Force Manual 23-<br />
13, 14<br />
110, October 2005; Air Force Instruction 24-230, August 1996).<br />
82<br />
Air Force DODAAC Process Evolution<br />
The DODAAC assignment process starts with an Air Force<br />
military unit or Air Force contractor identifying the need to have<br />
a new DODAAC assigned or to change or update an existing<br />
DODAAC. This could mean they relocated an office, formed a<br />
new organization, or in the case of contractors, have a new<br />
contract with a new manufacturing facility; all of which might<br />
require a new DODAAC to identify their new address. This has<br />
been especially critical in recent years since the country has been<br />
involved in Afghanistan and Iraq and has established many new<br />
addresses.<br />
Past Practices<br />
To get a DODAAC assigned, the initiator submitted a request (in<br />
the form of an e-mail, fax, or phone call) to the DODAAC monitor<br />
assigned to their parent MAJCOM for approval. When the<br />
MAJCOM DODAAC monitor determined they agreed with the<br />
request, they forwarded it to an Air Force control office (a subject<br />
matter expert [SME] for the type of equipment or material that<br />
would be purchased with the pending DODAAC) for their<br />
approval. Once the SME was satisfied with the request, it was<br />
forwarded to the Air Force service point. Once the service point<br />
agreed with the request, a code was assigned and forwarded to<br />
the DODAAD. Once established, the code was then available to<br />
be used for requisitioning and shipping material. This process<br />
could take as little as 2 to 3 days, but many times took much<br />
longer depending on the speed of the command monitors and<br />
the control offices. Sometimes it would take as much as 8 to 10<br />
days (or longer) depending on availability of personnel within<br />
the approval process (vacations, sick days, business trips, and<br />
military deployments could delay request processing).<br />
Sometimes requests were lost altogether. In this case it was up to<br />
the originator to track down and locate his/her request. Although<br />
this process had issues, it was much better than processing<br />
computer punch-cards to the mainframe that the service point<br />
relied upon for many years. That process took as long as 30 days<br />
to complete.<br />
Before reengineering, most steps in the DODAAC request and<br />
approval process were manual. After the requests from customers<br />
were processed and validated, personnel in supply chain<br />
management squadron would enter the data (two employees—<br />
full time) from the request into an Air Force legacy computer<br />
system (D035T) which sent the information to DAASC in a daily<br />
batch process which was then updated to the DODAAD. Once<br />
each day DAASC would then broadcast a data feed back to D035T<br />
to update the DODAAD information for use by the Air Force.<br />
D035T then became the Air Force’s primary source for providing<br />
DODAAC data to other Air Force data systems.<br />
A New Process Sought<br />
As this process matured in the mid-1990s, a new DODAAC search<br />
process was desired. DAASC had a DODAAC program to display<br />
the addresses associated with a DODAAC, but one could not use<br />
any other information to create a search. For example, if one knew<br />
the zip code where the DODAAC was located, but didn’t know<br />
the DODAAC, there was no way to find the DODAAC. A solution<br />
to this problem was to build a Web site that could take the<br />
information provided from DAASC each day to D035T,<br />
manipulate it, and create a search engine available to everyone<br />
in the Air Force. This was the beginning of the current process.<br />
Several years after implementing the DODAAC Web site with<br />
its improved search capabilities, a cut in manpower (eliminating<br />
one of the full-time positions used to make all the additions and<br />
changes) LSO/LOT allowed the MAJCOM monitors the ability<br />
to use the Web site to make changes to addresses for DODAACS<br />
within their command. This was not well received since it pushed<br />
workload onto requesting offices. Additionally, there were many<br />
mistakes made in the data entry, and the service point office had<br />
no visibility as to what changes were being made. Calls from the<br />
field asking why shipments were not getting to them would<br />
generally uncover a mistake in their shipping addresses (because<br />
a MAJCOM monitor put in an incorrect address). The problem<br />
was corrected, but it took a lot of time to find the problems.<br />
Further, this created a bad situation for the customer, potentially<br />
causing the loss of valuable equipment intransit. To combat this<br />
problem, the service point office developed a feedback loop to<br />
provide visibility of any changes the MAJCOMs were making.<br />
Although it was after the change was made, it allowed for<br />
resubmission of another change if an entry was incorrect.<br />
Small improvements were continually made to this part of the<br />
process but were still tied to D035T for DODAAC additions and<br />
deletions and the Web site for making changes. Figure 1<br />
demonstrates how the system was working at the beginning of<br />
the project. All requests were supposed to be going to the<br />
MAJCOM monitor with new and delete transactions going to<br />
the Air Force Service point for entry into the DODAAD through<br />
D035T. In reality all of the add and delete requests, and many of<br />
the changes to existing DODAAC transactions were being sent<br />
to the Air Force service point. They had to be forwarded to the<br />
appropriate MAJCOM monitor for them to work. When the<br />
process was reviewed for this reengineering project investigators<br />
quickly found the existing process to be cumbersome, slow,<br />
somewhat disorganized, and labor intensive.<br />
Air Force DODAAC Process Review<br />
The DODAAC process review was initiated by several events;<br />
namely, the War on Terror and the increasing number of<br />
humanitarian relief operations. This elevated operation tempo<br />
identified a problem with being able to quickly add, change, and<br />
delete Air Force DODAACs as locations were established, closed,<br />
and relocated to support field troop movements. In working this<br />
process review, Lean principles were used as a guide. 15 Realizing<br />
the difficulties we had with the existing process we determined<br />
this would be a good project to reengineer.<br />
Problem<br />
When personnel working on the project began to brainstorm the<br />
limitations of the existing process flow, they identified many<br />
problems that affected the customer and the infrastructure in<br />
place to develop and maintain Air Force DODAACs. The<br />
following were the primary process problems identified:<br />
The customer did not have a consistent method to submit<br />
requests.<br />
Air Force Journal of <strong>Logistics</strong>
The system in place was not customer oriented (user friendly).<br />
There was no customer feedback or tracking system.<br />
The system was labor intensive and somewhat unorganized.<br />
Air Force DODAAC data had to be updated manually.<br />
DODAAC paper files were cumbersome.<br />
D035T system changes were impractical.<br />
Goals<br />
Once the main problems with the DODAAC process were<br />
identified, the following goals were established as a guide<br />
through the reengineering process:<br />
Improved customer service<br />
Ability for customer to figure out how to get a DODAAC<br />
assigned without added input from anyone—totally selfhelp<br />
Faster and easier process for the customer<br />
Process would be the only way to get a DODAAC—onestop<br />
shopping<br />
Customers would have visibility of the progress of their<br />
DODAAC requests<br />
Improved process control<br />
Minimize workload for the MAJCOM monitors and the<br />
Air Force service point<br />
Eliminate duplication in data entry<br />
Delegate workload<br />
Create a system that was less susceptible to gaps in the<br />
process (evaluators and approval authorities missing from<br />
the system)<br />
Ensure more consistent information was passed through<br />
the system<br />
Administrative<br />
Create metrics that would measure the process, locate<br />
bottlenecks, and help provide the basis for continual<br />
improvement<br />
Eliminate paper files<br />
Ensure traceability and accountability for all transactions<br />
Improve training for those involved in the process<br />
Limiting Factors<br />
As with any new project there<br />
are constraints in trying to<br />
move from conception to<br />
implementation. <strong>No</strong> additional<br />
funding, personnel, or new<br />
equipment procurement could<br />
be devoted to this reengineering<br />
project (the project was started<br />
after the fiscal year and no<br />
funding requirements for this<br />
project had been included in the<br />
organization’s budget request).<br />
Without funding, creative<br />
solutions and time management<br />
techniques had to be used to<br />
move this project from<br />
conception into reality.<br />
Solution<br />
DODAAC service point<br />
technical specialists were<br />
<strong>Vol</strong>ume XXXII, Number 4<br />
CHG<br />
ADD<br />
DEL<br />
<strong>AF</strong><br />
MAJCOM<br />
Monitor<br />
<strong>AF</strong><br />
Service<br />
Point<br />
CHG<br />
DEL<br />
ADD<br />
consulted, as well as a computer programmer to develop a flow<br />
chart of the process. Current Web technology, coupled with the<br />
programmer’s knowledge of Web-based database management<br />
would permit the building of a process that would let the<br />
customer create the original record, and then send that record<br />
through an approval process without duplicating the data. The<br />
Web site should be simple to understand and display everything<br />
the customer would need to request a new DODAAC or change<br />
an existing one. Figure 2 demonstrates the basic process flow.<br />
The customer would access the Web site and select an operation.<br />
Once a form was displayed, the customer would complete the<br />
form and submit it. The computer would route the request to the<br />
MAJCOM monitor. Request approval required the monitor to<br />
press a button which sent it to the next person in the approval<br />
process, the control office. If the MAJCOM monitor disagreed<br />
with some part of the request, a rejected request could be returned<br />
to the customer for rework. This process would be repeated until<br />
the request made it to the Air Force DODAAC service point.<br />
There a new DODAAC request would have a DODAAC assigned<br />
and would be sent to DAASC for loading into the DODAAD. The<br />
process design was straightforward and was simple in concept.<br />
Building it was a lot harder.<br />
A team of experts, including three internal DODAAC technical<br />
specialists, a computer programmer, and management was<br />
assembled; the team worked this project in addition to their<br />
normal workload. The team would meet for short brainstorming<br />
sessions (1 to 2 hours) two to three times per week. At first the<br />
meetings were used to develop the structure of the Web site. As<br />
the project progressed, the meetings were used to review<br />
previous work, demonstrate the work, and discuss what would<br />
be done after the meeting. In this manner all team members were<br />
kept on track. These meetings were also used to sort out technical<br />
problems, find alternatives, and redirect the programmer’s<br />
activities. As the project progressed it went through the following<br />
steps:<br />
Mapped the new Web site and data management system<br />
Developed the Web site framework<br />
Developed the Web site structure—what the customer sees<br />
<strong>AF</strong><br />
DODAAC<br />
Website<br />
DODAAD<br />
DO35T<br />
DODAAC<br />
Available to<br />
Customer<br />
DAASC<br />
DAASC<br />
Figure 1. DODAAC Process Before Reengineering. <strong>No</strong>tes: the customer would submit his or her<br />
requests by phone, fax, or e-mail to either the Air Force service point or the MAJCOM monitor. The<br />
service point and the MAJCOM monitor would collaborate on the information and determine which<br />
office would submit the request. Most DODAAC changes were submitted by the MAJCOM monitor<br />
through the Web site and all the new and deleted DODAACs had to be submitted through D035T.<br />
83
84<br />
Request Form<br />
Customer<br />
DODAAC<br />
Website<br />
DAASC<br />
Submit ACCEPT<br />
ACCEPT<br />
REJECT<br />
MAJCOM<br />
Developed the supporting data tables and drop-down help<br />
data<br />
Developed the flow process<br />
Internal operability testing and review<br />
Data connection to other systems<br />
Acceptance and approval for using<br />
Prototype demonstration<br />
The service point office hosted a DODAAC workshop at<br />
Wright-Patterson <strong>AF</strong>B when the new system was developed<br />
enough to demonstrate and validate the process. All MAJCOM<br />
monitors, control offices, and other SMEs were invited to attend.<br />
The agenda included introducing the system’s capabilities,<br />
showing attendees how they would use the system, and most<br />
importantly, get feedback from the audience to allow for any last<br />
minute changes to the system before implementation.<br />
The meeting provided valuable discussion and<br />
recommendations, specifically identifying ways to improve the<br />
system and make it more user friendly. This feedback was<br />
especially useful as it validated the system design and allowed<br />
for buy-in from the workforce. Some of the important items<br />
changed as a result of feedback from the meeting include the<br />
following:<br />
Add help note for deployed units under MAJCOM drop-down<br />
box on request form<br />
Develop Reroute system for requests that get submitted to the<br />
wrong MAJCOM monitor<br />
Add Headquarters Air Force on MAJCOM drop-down box<br />
Add link to MAJCOM monitor list in e-mail receipt back to<br />
requestor<br />
Add <strong>No</strong> Special Characters message to request form to alert<br />
requestor not to use (*, /, -) in address lines<br />
Add confirmation number to submission page for new requests<br />
On MAJCOM monitor, control office, and service point<br />
request view pages, add a link to requestor contact<br />
ACT Control<br />
REJECT REJECT<br />
Figure 2. The DODAAC Web <strong>Management</strong> System<br />
information in case they have<br />
questions about request<br />
Change canned responses<br />
to checkboxes on request view<br />
forms<br />
Add selection for City/State<br />
change to Line 3, Line 4, <strong>No</strong><br />
Change on TAC 1 on DODAAC<br />
change form (like TAC 2 has<br />
now)<br />
Make rationale required<br />
field on change/delete form<br />
Put in Are You Sure page on<br />
closed/delete account form<br />
Make WPOD and APOD a<br />
drop-down box of selections to<br />
ensure they choose correct one;<br />
add help button.<br />
Set up dynamic validation<br />
report page and develop export<br />
to Excel feature<br />
Build requestor change/edit<br />
page for rejects from MAJCOM back to requestor<br />
Setup 24-hour tracking system<br />
Develop metrics of tracking information<br />
<strong>AF</strong> SP<br />
Some very significant changes were developed during this<br />
validation trial run. Other important topics covered during the<br />
meeting were to brainstorm how to structure the annual validation<br />
process and how to do the live testing of the system. Following<br />
the meeting, two final steps included that of performing<br />
adjustments to the process, and the crucial step of live field<br />
testing and validation.<br />
Testing the new system would be challenging because a<br />
complete test could not be run without turning off the existing<br />
system (the DODAAC Web <strong>Management</strong> System was hosted on<br />
an Air Force server that resided inside the Wright-Patterson <strong>AF</strong>B<br />
network firewall). Further, access was through one portal—there<br />
was no way to run the test while the old system was still<br />
functioning. MAJCOM monitors were informed of the shutdown<br />
to ensure they had all required work up to date, since only<br />
emergency DODAAC changes would be processed during the 10day<br />
system shutdown. Manual updates in D035T were performed<br />
on an as-required basis.<br />
The test was scripted by completing a DODAAC input for each<br />
MAJCOM monitor in our system. At a designated time each<br />
MAJCOM processed the information they were given. The flow<br />
of information was measured. After the first test, only 60 percent<br />
(approximate) of the information had been received. The system<br />
appeared to be working properly, but some of the MAJCOM<br />
monitors did not process their information correctly.<br />
A second test was run to assure the system was working as<br />
intended and that the problem was not with the program. The<br />
second test was a great success. All of the information in the<br />
second test flowed properly and the Air Force DODAAC Web<br />
<strong>Management</strong> System was made available for Air Force use.<br />
Implementation Results<br />
The system is a major improvement. As soon as the DODAAC<br />
Web <strong>Management</strong> System was implemented one could tell it<br />
Air Force Journal of <strong>Logistics</strong>
would serve the Air Force as it was intended. Other than some<br />
minor glitches that were fixed quickly (usually within hours),<br />
the system has performed well. 16 The system has allowed<br />
DODAAC processing time to be reduced from an average of 4 to<br />
5 days to its current average of 2 to 3 days. 17 The system has<br />
reduced administrative workload (waste) at least 75 percent<br />
system-wide (metrics are being developed to measure this<br />
accurately), provides accurate electronic records, and provides<br />
a single, precise method to manage DODAACs for the Air Force.<br />
Supply Chain Improvements<br />
The system was designed, developed, and implemented to follow<br />
the principals outlined by James Womack and Daniel Jones, in<br />
their book Lean Thinking. 18 More specifically, the goals included<br />
the need for the following:<br />
Create value from the customer’s perspective<br />
Determine and improve the value stream<br />
Create flow through the system<br />
Create pull processes<br />
Strive for perfection<br />
This Lean thinking allowed the process to be rebuilt from the<br />
customer’s point of view. The existing system had not been set<br />
up to guide the customer; this was a main focus in designing the<br />
new system. Next, considering the process as one part of the value<br />
stream, the new system was built with the ability to replace the<br />
aging legacy system as the DODAAC data warehouse for the Air<br />
Force. This approach built in flexibility to store, manipulate, and<br />
use the DODAAC data in a manner beneficial to the entire Air<br />
Force.<br />
To improve flow, the process to create or maintain a DODAAC<br />
is now streamlined. Instead of multiple ways to get the job done,<br />
the improved system has only one way to process a DODAAC.<br />
This eliminated many wasteful process steps, reduced redundant<br />
effort, and organized the data to come close to providing the<br />
customer same-day service.<br />
The new DODAAC development and maintenance process is<br />
a true pull system. The customer is no longer responsible for<br />
figuring out what their request should consist of, what medium<br />
to use to communicate that request, and where to process their<br />
request. Instead, the system pulls the customer’s request through<br />
once the customer places their order. The system triggers work<br />
at each approval point by an e-mail to tell the evaluator they<br />
have a request to review and the system measures each step of<br />
the process. Once the customer submits a request they can follow<br />
the approval process simply by visiting the Web site and using<br />
the Tracker system. From the Air Force supply chain perspective<br />
this helps the customer get their DODAAC assigned and updated<br />
faster than ever. It allows the customer to order material faster<br />
and reduce the stress in establishing a new address when speed<br />
may be critical.<br />
<strong>Vol</strong>ume XXXII, Number 4<br />
Conclusions<br />
The last Lean principle—perfection—is an ongoing process. This<br />
new system is not finished and may never be, since the Air Force<br />
is constantly changing. The old system was built around a legacy<br />
computer system which prohibited even small changes. The new<br />
system is very flexible to changes. Table 1 compares all<br />
DODAAC processes before and after Lean thinking was initiated<br />
and applied.<br />
Discussion and Lessons Learned<br />
From the start of the DODAAC system process improvement the<br />
team was focused on adding value for the warfighter. <strong>No</strong>thing is<br />
more frustrating than being deployed in a remote and hostile<br />
location and not being able to accomplish a mission because of<br />
an inability to procure needed supplies. Under the old system it<br />
could take 3 or more days to get an Air Force DODAAC validated<br />
and loaded into the DODAAD. During this time the warfighter<br />
was waiting, unable to order the supplies required to accomplish<br />
or sustain the mission. The new system process will establish a<br />
new address in the DODAAD within 1 or 2 days. By working from<br />
the customer’s perspective through the entire value stream, the<br />
team was able to provide better visibility of the process, establish<br />
metrics to control the process, improve overall data quality, and<br />
reduce total processing time using the same resources. Improving<br />
logistics support by 24 to 48 hours will continue to ensure our<br />
warfighter has a battlefield advantage.<br />
There were a variety of lessons to be learned from the successful<br />
implementation of Lean principles. First and foremost of these<br />
is that the system is a success. This success is largely due to the<br />
formal aspects of the system itself. Committing the entire process<br />
to the system forced entry of data into the system—data did not<br />
get lost or otherwise go astray. The system aspects of the<br />
DODAAC system permitted rapid data entry, error detection, and<br />
error correction. Ultimately, the speed of the system facilitates<br />
the goals of the organization, individual units, and of those<br />
waiting for supplies.<br />
Further, the system enabled streamlining of the entire process.<br />
In turn, this streamlining added tremendous visibility to the<br />
project, as potential users (DODAAC requestors) were following<br />
development and implementation efforts. Frequent meetings were<br />
held with users, both to provide progress reports and to seek their<br />
input into the system. These meetings had an unexpected benefit<br />
of strengthening user buy-in to the system.<br />
One unexpected bonus only appeared following<br />
implementation of the system. In response to an Air Force Audit<br />
<strong>Agency</strong> finding, the system was modified to include a contractor<br />
validation page (and supporting process) to improve the ability<br />
to monitor DODAACs created for contractors. Before the<br />
modifications, it was not possible to monitor when to delete<br />
contractor DODAACs. Unless deletion had been requested by<br />
the contracting offices, there was no way to recognize an unneeded<br />
DODAAC and to act accordingly. In turn, this gap in information<br />
would permit contractors to order material from the defense<br />
supply system after a contract had expired. The modified process<br />
enables the contracting office to cross reference contracts to<br />
DODAACs and DODAACs to contractors. When fully<br />
implemented, this feature will allow for determination of when<br />
to delete a contractor DODAAC. In this fashion, the information<br />
is serving to ensure the integrity of the underlying process.<br />
The Lean initiative described in this article not only ensures<br />
process integrity, but also provides a significant image boost to<br />
a process which before had been haphazard. The DODAAC assists<br />
in collecting all required information, collecting all required<br />
approvals, and by identifying bottlenecks in the process, assures<br />
that the process completes in a minimal timeframe. The goals<br />
and objectives of the organization, as well as those of its<br />
customers, are better met through the implementation of Lean<br />
principles underlying the DODAAC system.<br />
85
86<br />
Table 1. DODAAC Process After Lean Thinking Applied<br />
DODAAC Web <strong>Management</strong><br />
System Updates<br />
In the time since the DODAAC system began, many<br />
improvements have been made to the system. One of the most<br />
significant was the alignment of Air Force data with that in the<br />
DODAAD maintained by DAASC. This major development<br />
allowed for the elimination of the daily batch process. Instead,<br />
DODAAC input is pushed to DAASC in real time. Instead of<br />
taking 1 to 2 days, a DODAAC change or addition can be input<br />
in minutes, allowing a unit to order material much quicker.<br />
A second major improvement provides a way for the Air Force<br />
contracting community to validate and maintain Air Force<br />
DODAACs assigned to their contractors. Previously, contracting<br />
offices had no way to determine if their contractors had a need to<br />
keep assigned DODAACs. <strong>No</strong>w contracting offices can use this<br />
system to validate the contactors continued need for a DODAAC<br />
and delete DODAACs when the contract expires.<br />
<strong>No</strong>tes<br />
1. James P. Womack and Daniel T. Jones, Lean Thinking, New York,<br />
NY: Free Press, 2003.<br />
2. Vince Grant, “Lean Six Sigma –<br />
The GUTs of Improvement?”<br />
<strong>Management</strong> Services, <strong>Vol</strong> 52, <strong>No</strong> 1,<br />
2008, 22-23.<br />
3. Ibid.<br />
4. Karl B. Manrodt, Kate Vitasek,<br />
and Rich Thompson, “The Lean<br />
Journey,” <strong>Logistics</strong> <strong>Management</strong>, <strong>Vol</strong><br />
47, <strong>No</strong> 4, 2008, 35-38.<br />
5. Ibid.<br />
6. Manrodt, et al, 2008.<br />
7. Dinesh Kumar, “Beyond the<br />
Low-Hanging Fruit: Designing an<br />
Enduring Lean Supply Chain in the<br />
Consumer Packaged Goods Industry,”<br />
Industrial Engineer, <strong>Vol</strong> 36, <strong>No</strong> 5,<br />
2004, 44-48.<br />
8. Grant, 2008.<br />
9. Manrodt, et al, 2008.<br />
10. DoD 4000.25-10-M, Defense<br />
Automatic Addressing System,<br />
Washington, DC: Government<br />
Printing Office, October 2003.<br />
11. DoD Directive 4140.1, Supply<br />
Chain Material <strong>Management</strong> Policy,<br />
Washington, DC: Government<br />
Printing Office, April 2004.<br />
12. DoD 4140.1-R, DoD Supply<br />
Chain Material <strong>Management</strong><br />
Regulation, Washington, DC:<br />
Government Printing Office, May<br />
2003.<br />
13. Air Force Manual 23-110,<br />
United States Air Force Supply<br />
Manual, Washington, DC:<br />
Government Printing Office, October<br />
2005.<br />
14. Air Force Instruction 24-230,<br />
Maintaining the DoD Activity Address<br />
Directory (DODAAD), Washington,<br />
DC: Government Printing Office,<br />
August 1996.<br />
15. Womack and Jones.<br />
16. Once in the first month of<br />
operation we had to take the system down for one day to fix a minor<br />
issue.<br />
17. We are working on replacing the daily batch process with real time<br />
delivery to DAASC, which should give the system same-day service.<br />
18. Womack and Jones.<br />
Jay Barber is currently a Transportation Specialist for the<br />
401 Supply Chain <strong>Management</strong> Squadron at Wright-<br />
Patterson <strong>AF</strong>B, Ohio. At the time of the writing of this<br />
article, he was a student at the Raj Soin College of Business<br />
at Wright State University, Ohio.<br />
Michael Werneke is currently Chief, 401 Supply Chain<br />
<strong>Management</strong> Squadron at Wright-Patterson <strong>AF</strong>B, Ohio. At<br />
the time of the writing of this article, he was a student at the<br />
Raj Soin School of Business at Wright State University,<br />
Ohio.<br />
Kevin P. Duffy, PhD, is an Assistant Professor in the<br />
Information Systems Operations <strong>Management</strong> Department,<br />
Raj Soin College of Business, Wright State University. He<br />
completed his doctoral studies in <strong>Management</strong> Information<br />
Systems at Florida State University.<br />
Air Force Journal of <strong>Logistics</strong>
Guidebooks:<br />
What You Need,<br />
When You Need It!<br />
<strong>Vol</strong>ume XXXII, Number 4<br />
Aircraft maintenance metrics<br />
are important. Don’t let<br />
anyone tell you differently!<br />
They are critical tools to be<br />
used by maintenance<br />
managers to gauge an<br />
organization’s effectiveness<br />
and efficiency. In fact, they are<br />
roadmaps that let you<br />
determine where you’ve been,<br />
where you’re going, and how<br />
(or if) you’re going to get<br />
there. Use of metrics allows<br />
you to flick off your<br />
organizational autopilot and<br />
actually guide your unit. But<br />
they must be used correctly to<br />
be effective.<br />
This handbook is an<br />
encyclopedia of metrics and<br />
includes an overview to<br />
metrics, a brief description of<br />
things to consider when<br />
analyzing fleet statistics, an<br />
explanation of data that can<br />
be used to perform analysis, a<br />
detailed description of each<br />
metric, a formula to calculate<br />
the metric, and an explanation<br />
of the metric’s importance and<br />
relationship to other metrics.<br />
The handbook also identifies<br />
which metrics are leading<br />
indicators (predictive) and<br />
which are lagging indicators<br />
(historical). It is also a guide<br />
for data investigation.<br />
<strong>AF</strong>LMA<br />
Generating Transformational<br />
Solutions Today; Shaping<br />
the <strong>Logistics</strong> Enterprise of<br />
the Future<br />
87
88<br />
Study Results:<br />
What You Need,<br />
When You Need It!<br />
The C-5 TNMCM Study II proved to be a stern<br />
test of <strong>AF</strong>LMA’s abilities and perseverance.<br />
Considering the numerous potential factors<br />
that impact TNMCM rates as well as the<br />
C-5’s historical challenges in the areas of<br />
availability and achieving established<br />
performance standards, the study team was<br />
determined to apply new thinking to an old<br />
problem. The research addressed areas of<br />
concern including maintaining a historically<br />
challenged aircraft, fleet restructuring,<br />
shrinking resources, and the need for accurate<br />
and useful metrics to drive desired enterprise<br />
results. The team applied fresh perspectives,<br />
ideas and transformational thinking. As a<br />
result, the study team developed a new<br />
detailed methodology to attack similar<br />
research problems, formulated a new<br />
personnel capacity equation that goes<br />
beyond the traditional authorized versus<br />
assigned method, and analyzed the overall<br />
process of setting maintenance metric<br />
standards. <strong>AF</strong>LMA also formed a strategic<br />
partnership with the Office of Aerospace<br />
Studies at Kirtland <strong>AF</strong>B in order to<br />
accomplish an analysis of the return on<br />
investment of previous C-5 modifications and<br />
improvement initiatives. A series of articles<br />
was produced that describes various portions<br />
of the research and accompanying results.<br />
Those articles are consolidated in this book.<br />
<strong>AF</strong>LMA<br />
Generating Transformational<br />
Solutions Today; Focusing the<br />
<strong>Logistics</strong> Enterprise of the Future<br />
Air Force Journal of <strong>Logistics</strong>
<strong>Vol</strong>ume XXXII, Number 4<br />
89
Editors<br />
James C. Rainey<br />
Editor-in-Chief, Air Force Journal<br />
of <strong>Logistics</strong><br />
90<br />
Cindy Young<br />
Editor, Air Force Journal of<br />
<strong>Logistics</strong><br />
Roger D. Golden, DPA<br />
Director, <strong>AF</strong>LMA<br />
This report may be reproduced in whole<br />
or in part by Department of Defense<br />
organizations. Other organizations<br />
wishing to make copies should contact<br />
the Air Force <strong>Logistics</strong> <strong>Management</strong><br />
<strong>Agency</strong>.<br />
501 Ward Street<br />
Maxwell <strong>AF</strong>B, Gunter Annex, Alabama<br />
36114-<strong>32</strong>36<br />
Commercial (334) 416-4511<br />
DSN 596-4511<br />
departments<br />
Journal<br />
Annual Edition<br />
92 Air Force Journal of <strong>Logistics</strong>—More Than 20<br />
Years of Capturing <strong>Logistics</strong><br />
96 Journal Special Editions<br />
97 Author and Writer Support<br />
98 Submitting a Manuscript<br />
170 Books and Monographs: Newest Products with<br />
Style and Impact<br />
188 Journal Quick Reference<br />
Air Force Journal of <strong>Logistics</strong>
Annual Edition, <strong>Vol</strong>ume XXXIII, Number 1<br />
Most Significant Articles 2008<br />
100 Sense and Respond Combat Support: Command and Control-Based Approach<br />
112 Contingency Contracting: Analyzing Support to Air Force Missions in Iraqi Freedom<br />
122 Beyond Authorized Versus Assigned: Aircraft Maintenance Personnel Capacity<br />
134 Aligning Maintenance Metrics: Improving C-5 TNMCM<br />
146 C-5 TNMCM Study II: Realistic Metrics to Drive Operational Decisions<br />
156 Earned Value <strong>Management</strong>: Uses and Misuses<br />
162 Using <strong>AF</strong>SO21: The Problem Is Big, Time Is Short, and Visibility Is Enormous<br />
features<br />
Journal<br />
Annual Edition<br />
91
The Air Force Journal of <strong>Logistics</strong> is the<br />
professional logistics publication of the<br />
Air Force. We provide an open forum for<br />
presenting research, innovative thinking, and<br />
ideas and issues of concern to the Air Force and<br />
civilian logistics communities.<br />
The Journal is distributed worldwide. It reaches<br />
all segments of the Air Force and nearly all levels<br />
of the Department of Defense and the US<br />
Government. The Journal is read by foreign<br />
military forces in 26 countries, people in<br />
industry, and students at universities with<br />
undergraduate and graduate programs in logistics.<br />
92<br />
address<br />
more more than than 2<br />
2<br />
We have a strong research focus, as our name<br />
implies, but that’s not our only focus. <strong>Logistics</strong><br />
thought and history are two of the major subject<br />
areas you’ll find in the Journal. And by no means<br />
are these areas restricted to just military issues<br />
nor are our authors all from the military.<br />
The <strong>AF</strong>JL staff also produces and publishes a<br />
variety of high-impact publications—books,<br />
monographs, reading lists, and reports. That’s<br />
part of our mission—address logistics issues,<br />
ideas, research, and information for aerospace<br />
forces.<br />
Air Force Journal of <strong>Logistics</strong><br />
501 Ward Street, Maxwell <strong>AF</strong>B, Gunter Annex AL 36114-<strong>32</strong>36<br />
Air Force Journal of <strong>Logistics</strong>
0 0 years years of of capturing capturing logistics<br />
logistics<br />
The Journal is considered the premier Air Force<br />
logistics research publication, both within and outside<br />
the Air Force.<br />
Annual Edition, <strong>Vol</strong>ume XXXIII, Number 1<br />
93
The Air Force Journal of <strong>Logistics</strong> began as The<br />
Pipeline, with the first edition appearing in January<br />
1977. Three editions of The Pipeline were published<br />
before it was renamed the Air Force Journal of <strong>Logistics</strong><br />
in 1980. It has been published continually since then!<br />
What What You’ll You’ll Find Find in in the the Journal— Journal—Relevant Journal— Relevant Themes<br />
Themes<br />
94<br />
A conscious effort to develop and institutionalize professional<br />
ethos among logisticians<br />
How and where logistics fits in war preparation and waging war<br />
Professional, educational, and career development<br />
Historical studies<br />
Technological innovation<br />
Statistical and quantitative logistics analysis<br />
Global logistics analysis<br />
Expeditionary airpower studies<br />
Transformation<br />
On the Internet<br />
In addition to the printed magazine, we also<br />
have an online version of the Journal,<br />
which can be downloaded or read via any<br />
standard Web-based browser. At any time, the<br />
last four editions of the Journal can be seen at our<br />
Web site.<br />
Cumulative Index<br />
We’ve published and distributed a cumulative<br />
index for both The Pipeline and the Journal,<br />
available in hard copy and electronic versions.<br />
An update to the index will be published in 2009.<br />
more more than than 2<br />
2<br />
Ordering Information<br />
US Government organizations, employees of the<br />
US Government, or colleges and universities<br />
with undergraduate or graduate programs in<br />
logistics should contact the <strong>AF</strong>JL editorial staff<br />
for ordering information: DSN 596-2335/2357 or<br />
commercial (334) 416-2335/2357. <strong>AF</strong>JL<br />
subscriptions are available through the<br />
Superintendent of Documents, US Government<br />
Printing Office, Washington DC 20402. The <strong>AF</strong>JL<br />
editorial staff maintains a limited supply of back<br />
issues.<br />
phone Air Force Journal of <strong>Logistics</strong><br />
DSN 596-2335/2357 Commercial (334) 416-2335/2357<br />
Air Force Journal of <strong>Logistics</strong>
0 0 years years of of capturing capturing logistics<br />
logistics<br />
Annual Edition, <strong>Vol</strong>ume XXXIII, Number 1<br />
95
96<br />
journal journal special special editions<br />
editions<br />
As we look to the future, senior leaders across the Air Force have repeatedly stated that they cannot<br />
emphasize enough how important it will be to make Air Force Smart Operations (<strong>AF</strong>SO) for the 21 st<br />
Century thinking an integral part of every airman’s daily routine. While the specific nature of the<br />
challenges we will face remains uncertain and dynamic, one of the inherent strengths of <strong>AF</strong>SO21 is<br />
its flexibility to effectively address any unique set of circumstances. In this regard, it is easy to see that<br />
<strong>AF</strong>SO21 exists for the sole purpose of helping Airmen continue to strengthen mission capability.<br />
<strong>AF</strong>SO21 is all about doing jobs faster, better, more safely, and smarter. It is important to understand<br />
that <strong>AF</strong>SO21 doesn’t make decisions to cut or constrain resources. Quite the contrary, <strong>AF</strong>SO21 helps<br />
Airmen deal effectively in an environment where those limitations already exist. The Air Force Journal<br />
of <strong>Logistics</strong>, <strong>Vol</strong>ume XXXII, Number 2 carries this message to the Air Force logistics community.<br />
The Expeditionary Combat Support System (ECSS) is, without question, the most significant change<br />
in Air Force support and support concepts since the inception of the Air Force in 1947. It will affect<br />
virtually every Air Force logistics process—changing most of them. <strong>Vol</strong>ume XXXII, Number 2 looks at<br />
three major aspects of ECSS—combat support transformation, implementing transformation, and the<br />
way ahead. Six major articles written by subject matter experts or individuals managing specific<br />
transformation efforts—”Expeditionary <strong>Logistics</strong> for the 21 st Century,” “Change <strong>Management</strong>,” “ECSS<br />
Program <strong>Management</strong> Office,” “<strong>Logistics</strong> Transformation Office,” “<strong>Logistics</strong> Enterprise Architecture,”<br />
and “Enterprise Resource Planning”—are contained in this edition.<br />
Air Force Journal of <strong>Logistics</strong>
What What You’ll You’ll Find Find in in Author Author and and Writer Writer Publications<br />
Publications<br />
Submission information<br />
Style guidelines<br />
Standard English grammar and usage rules<br />
Useful and user-friendly reference sections<br />
author author and and writer writer suppo support suppo rt<br />
Annual Edition, <strong>Vol</strong>ume XXXIII, Number 1<br />
97
98<br />
Finished Finished Finished Finished Finished research<br />
research<br />
research<br />
research<br />
research<br />
Wrote Wrote Wrote article article article<br />
publish publish<br />
publisher er er<br />
Need Need Need Need Need publish<br />
Air Air Force Force Journal Journal of of <strong>Logistics</strong> <strong>Logistics</strong>
You’ve finished the research. You’ve<br />
written the article or essay. Looking for<br />
the right publisher? Think about the Air<br />
Force Journal of <strong>Logistics</strong> (<strong>AF</strong>JL).<br />
Every article published in the Air Force Journal of<br />
<strong>Logistics</strong> is also considered for inclusion in one<br />
of our monographs or books.<br />
Manuscripts from any source—civilian or<br />
military—are always welcome. Articles and<br />
essays should be from 1,500 to 5,500 words. We<br />
also welcome manuscripts for books,<br />
monographs, and similar publications.<br />
All manuscripts should be sent via e-mail to<br />
the following address:<br />
editor-<strong>AF</strong>JL@maxwell.af.mil<br />
Manuscripts also can be submitted in hard copy<br />
if e-mail is not available. They should be sent to<br />
the following address.<br />
address<br />
Annual Edition, <strong>Vol</strong>ume XXXIII, Number 1<br />
Manuscripts from any source—civilian<br />
or military—are always welcome.<br />
Air Force Journal of <strong>Logistics</strong><br />
501 Ward Street<br />
Maxwell <strong>AF</strong>B, Gunter Annex AL<br />
36114-<strong>32</strong>36<br />
If you submit a manuscript in hard copy, a 3.5inch<br />
disk, zip disk, or compact disk containing<br />
an electronic version of the manuscript must<br />
accompany the hard copy.<br />
All manuscripts must be in Microsoft Word or<br />
WordPerfect format, and all supporting tables,<br />
figures, graphs, or graphics must be provided in<br />
separate files (preferably created in Microsoft<br />
Office products). They should not be embedded<br />
in the manuscript.<br />
All submissions will be edited in accordance with<br />
the Air Force Journal of <strong>Logistics</strong> Manual for Style,<br />
First Edition and the Gregg Reference Manual,<br />
Ninth Edition.<br />
Air Force Journal of <strong>Logistics</strong><br />
501 Ward Street, Maxwell <strong>AF</strong>B, Gunter Annex AL 36114-<strong>32</strong>36<br />
99
100<br />
Mahyar A. Amouzegar, PhD, RAND<br />
Robert S. Tripp, PhD, RAND<br />
Ronald G. McGarvey, PhD, RAND<br />
Michael J. Neumann, RAND<br />
Rick Bereit, RAND<br />
David George, RAND<br />
Joan Cornuet, Colonel, US<strong>AF</strong>, AMC<br />
Air Force Journal of <strong>Logistics</strong>
Annual Edition, <strong>Vol</strong>ume XXXIII, Number 1<br />
<strong>No</strong>thing is too wonderful to be true.<br />
Introduction<br />
—Kay Redfield Jamison<br />
Modern warfare has evolved from conflicts dominated by<br />
massed manpower, the so-called first generation of modern<br />
(post-Westphalian) war, to a warfare that has integrated<br />
political, social, economical, and technological issues. A recent<br />
National Defense University study maps this evolution from first<br />
generation warfare, culminating in the Napoleonic Wars, to secondgeneration<br />
wars dominated by firepower. Third generation war was<br />
the new maneuver tactics developed by the Germans in World War<br />
II. Unconventional enemy, in terms of insurgencies and counterinsurgencies,<br />
dominates the fourth generation. 1 In fourth generation<br />
warfare, the nation-states no longer hold a monopoly on weapon<br />
systems and may be involved in long conflicts with stateless enemies.<br />
Although insurgency is not new (dating back over two millennium) 2<br />
the political features of insurgency have become a predominate<br />
character of modern insurgents. Advances in information technology<br />
also have had a revolutionary impact in these types of warfare.<br />
A constant throughout the history of warfare has been the central<br />
role of logistics in the successful prosecution of any conflict. However,<br />
the 20 th century logistical system lagged behind rapidly changing<br />
technology and tremendous efforts were put into the scientific study<br />
of logistics. Most of the early supply systems operated on a push<br />
concept rather than in response to actual needs and changes. It was<br />
thought that having an abundance of resources in-theater ensured that<br />
combat support (CS) elements would be able to provide everything<br />
needed to achieve the desired operational effects. In practice, the<br />
presence of mountains of supplies did not always ensure warfighters’<br />
demands were met. In fact, the backlog of war materiel congested the<br />
CS system because of inefficiencies in the transportation system and<br />
the prioritization processes. It was evident that a more comprehensive<br />
capability was needed for matching CS assets to warfighter needs. In<br />
the past, prediction and responsiveness have been viewed as<br />
competing concepts. However, in this article, we argue that both are<br />
necessary and can be integrated within a command and control system<br />
to create military sense and respond capabilities.<br />
Military logistics planning grew even more difficult with the<br />
collapse of the Soviet Union and the dissolution of the associated<br />
threat to United States interests in Europe. The shift in global power<br />
exposed the inefficiencies of legacy CS systems that had been hidden<br />
under a static and focused, albeit immense, threat. The geopolitical<br />
divide that once defined US military policy was replaced by a<br />
temporary rise of regional hegemons, which in turn slowly evolved<br />
(and continues to evolve) into a geopolitical environment that is<br />
defined not only by regional powers, but also by nontraditional<br />
security threats. The uncertainty associated with planning for military<br />
operations was thus extended to include uncertainty about the<br />
locations and purpose of operations.<br />
101
Unless significant improvements are<br />
made to last-mile transportation<br />
in-theater, S&RL will have only a<br />
limited effect on operations. A robust,<br />
assured transportation network is the<br />
foundation on which expeditionary<br />
operations, as well as S&RL<br />
implementation, rests. The complete<br />
integration of transportation into the<br />
CSC2 architecture is essential.<br />
Most of the early supply systems operated on a<br />
push concept rather than in response to actual<br />
needs and changes. It was thought that having an<br />
abundance of resources in-theater ensured that<br />
combat support (CS) elements would be able to<br />
provide everything needed to achieve the desired<br />
operational effects. In practice, the presence of<br />
mountains of supplies did not always ensure<br />
warfighters’ demands were met. In fact, the<br />
backlog of war materiel congested the CS system<br />
because of inefficiencies in the transportation<br />
system and the prioritization processes. It was<br />
evident that a more comprehensive capability<br />
was needed for matching CS assets to warfighter<br />
needs. In the past, prediction and responsiveness<br />
have been viewed as competing concepts. In<br />
“Sense and Respond Combat Support:<br />
Command and Control-Based Approach,” the<br />
authors argue that both are necessary and can be<br />
integrated within a command and control system<br />
to create military sense and respond capabilities.<br />
In the course of the article they outline how this<br />
may be accomplished.<br />
The authors conclude by noting that significant<br />
challenges remain before the Air Force can<br />
realize a sense and respond combat support<br />
(S&RCS) capability. To develop effective tools<br />
that accurately link logistics levels and rates to<br />
102<br />
The Air Force, in response to the changing military<br />
environment, designed and developed a transformational<br />
construct called the Air and Space Expeditionary Force (AEF). 3<br />
The implementation of the AEF changed the Air Force’s mindset<br />
from a threat-based, forward-deployed force designed to fight the<br />
Cold War to a primarily continental United States-positioned,<br />
rotational, and effects-based force able to rapidly respond to a<br />
variety of threats while accommodating a high operations tempo<br />
in the face of the uncertainties inherent in today’s contingency<br />
environment. The AEF prompted a fundamental rethinking and<br />
restructuring of logistics. This modern perspective of CS does<br />
not merely consider maintenance, supply, and transportation but<br />
is expanded to include civil engineering, services (billeting and<br />
messing), force protection, basing, and command, control,<br />
communications, and computers.<br />
The shift to a more expeditionary force compelled a<br />
movement within the Air Force toward a capability called agile<br />
combat support (ACS). One of the Air Force’s six distinctive<br />
capabilities, ACS includes actions taken to create, effectively<br />
deploy, and sustain US military power anywhere—at our<br />
initiative, speed, and tempo. ACS capabilities include provision<br />
for and protection of air and space personnel, assets, and<br />
capabilities throughout the full range of military operations. 4<br />
ACS ensures that responsive expeditionary support for rightsized<br />
forces used in Joint operations is achievable within resource<br />
constraints. ACS began to emerge as a concept in a series of Air<br />
Force and RAND publications, 5 which detailed both micro- and<br />
macro-level analyses. One of the key conclusions of these studies<br />
has been the need for a robust and responsive combat support<br />
command and control (CSC2) architecture.<br />
Combat Support Command and Control:<br />
Key to Agile Combat Support and<br />
Essential for Sense and Respond<br />
Combat Support<br />
Command and control (C2), although often associated with<br />
operations, is also a fundamental requirement for effective CS.<br />
As warfighting forces become more flexible in operational<br />
tasking, the support system must adapt to become equally<br />
flexible. The C2 of modern CS assets must be woven thoroughly<br />
with operational events—from planning through deployment,<br />
employment, retasking, and reconstitution. Additionally, CS<br />
goals and objectives must be increasingly linked directly to<br />
operational goals and objectives. The traditional distinction<br />
between operations and CS loses relevance in such an<br />
environment. CS activities need to be linked to operational<br />
tasking with metrics that have relevance to both warfighter and<br />
logistician.<br />
In essence, CSC2 sets a framework for the transformation of<br />
traditional logistics support into an ACS capability. CSC2 should<br />
provide the capabilities to<br />
Develop plans that take operational scenarios and<br />
requirements, and couple them with the CS process<br />
performance and resource levels allocated to plan execution<br />
to project operational capabilities. This translation of CS<br />
performance into operational capabilities requires modeling<br />
technology and predicting CS performance.<br />
Air Force Journal of <strong>Logistics</strong>
Establish control parameters for the CS process performance and<br />
resource levels that are needed to achieve the required<br />
operational capabilities.<br />
Determine a feasible plan that incorporates CS and operational<br />
realities.<br />
Execute the plan and track performance against calculated<br />
control parameters.<br />
Signal all appropriate echelons and process owners when<br />
performance parameters are out of control.<br />
Facilitate the development of operational or CS get-well plans<br />
to get the processes back in control or develop new ones, given<br />
the realities of current performances.<br />
CSC2 is not simply an information system. Rather, it sits on top<br />
of functional logistics systems and uses information from them to<br />
translate CS process performance and resource levels into<br />
operational performance metrics. It also uses information from<br />
logistics information systems to track the parameters necessary to<br />
control performance. It includes the battlespace management<br />
process of planning, directing, coordinating, and controlling forces<br />
and operations. Command and control involves the integration of<br />
the systems, procedures, organizational structures, personnel,<br />
equipment, facilities, information, and communications that enable<br />
a commander to exercise C2 across the range of military<br />
operations. 6 Previous studies built on this definition of C2 to define<br />
CS execution, planning, and control to include the functions of<br />
planning, directing, coordinating, and controlling CS resources to<br />
meet operational objectives. 7<br />
The objective of this transformed CSC2 architecture is to<br />
integrate operational and CS planning in a closed-loop<br />
environment, providing feedback on performance and resources.<br />
The new CSC2 components significantly improve planning and<br />
control processes, including<br />
Planning and forecasting (prediction)<br />
Joint analysis and planning of CS and operations<br />
Determining feasibility, establishing control parameters<br />
Controlling<br />
Monitoring planned versus actual execution—a feedback<br />
loop process allowing for tracking, correction, and<br />
replanning when parameters are out of control<br />
Responsiveness<br />
Quick pipelines and the ability to respond quickly to change<br />
One of the key elements of planning and execution is the<br />
concept of an effective feedback loop that specifies how well the<br />
system is expected to perform during planning, and contrasts these<br />
expectations with observations of the system performance realized<br />
during execution. If actual performance deviates significantly from<br />
planned performance, the CSC2 system warns the appropriate CS<br />
processes that their performance may jeopardize operational<br />
objectives. The system must be able to differentiate small<br />
discrepancies that do not warrant C2 notification from substantial<br />
ones that might compromise future operations. This requires the<br />
identification of tolerance limits for all parameters, which is heavily<br />
dependent on improved prediction capabilities. This feedback loop<br />
process identifies when the CS plan and infrastructure need to be<br />
reconfigured to meet dynamic operational requirements and<br />
notifies the logistics and installations support planners to take<br />
action, during both planning and execution.<br />
Annual Edition, <strong>Vol</strong>ume XXXIII, Number 1<br />
operational effects, the modern Expeditionary<br />
Combat Support System must be developed<br />
and tested in conjunction with operations and<br />
intelligence systems.<br />
Technologies associated with S&RL are still<br />
in an early stage of development and may not<br />
be fielded for a number of years. Ultimately, the<br />
Expeditionary Combat Support System should<br />
relate how combat support performance and<br />
resource levels affect operations, but current<br />
theoretical understanding limits these<br />
relationships. The Air Force does not appear to<br />
be lagging behind industry in the<br />
implementation of S&RL capabilities but should<br />
continue to make judicious investments in this<br />
field.<br />
The Air Force has recently established the<br />
Global <strong>Logistics</strong> Support Center as the single<br />
agent responsible for end-to-end supply chain<br />
management. The creation of this entity holds<br />
promise for the achievement of S&RCS<br />
capabilities. The Global <strong>Logistics</strong> Support<br />
Center should be in a position to advocate for<br />
future improvements while exploring ways to<br />
provide the capability utilizing current systems.<br />
Article Acronyms<br />
ABM – Agent-Based Models<br />
ACS – Agile Combat Support<br />
AEF – Air and Space Expeditionary Force<br />
C2 – Command and Control<br />
CoAX – Coalition Agent Experiment<br />
CS – Combat Support<br />
CSC2 – Combat Support Command and Control<br />
DARPA – Defense Advanced Research Projects<br />
<strong>Agency</strong><br />
DoD – Department of Defense<br />
ECSS – Expeditionary Combat Support System<br />
IT – Information Technology<br />
OFT – Office of Force Transformation<br />
RFID – Radio Frequency Identification<br />
S&R – Sense and Respond<br />
S&RCS – Sense and Respond Combat Support<br />
S&RL – Sense and Respond <strong>Logistics</strong><br />
103
A robust CSC2 construct will enable a sense and respond<br />
capability that integrates operational and CS planning in a<br />
closed-loop environment, providing feedback on performance<br />
and resources. Figure 1 illustrates this concept in a process<br />
template that can be applied through all phases of an operation<br />
from readiness, planning, deployment, employment, and<br />
sustainment to redeployment and reconstitution.<br />
This comprehensive transformation of CSC2 doctrine and<br />
capabilities blends the benefits of continuously updated<br />
analytical prediction with the ongoing monitoring of CS systems,<br />
which, given a robust transportation capability, enables the rapid<br />
response necessary to produce a sense and respond combat<br />
support (S&RCS) model appropriate for military operations in<br />
the 21 st century.<br />
Traditionally, ongoing planning and tasking often occur in isolation from<br />
those who would subsequently be required to support the levels and<br />
rates of tasking. Coordination, if any, occurs after initial planning cycles<br />
are completed. Modern, responsive systems demand information-<br />
sharing among all partners in the military enterprise. Moreover, tools<br />
and technology play a vital role in this enterprise.<br />
104<br />
Defining Sense and Respond<br />
Combat Support<br />
The emphasis on the ability to respond quickly and appropriately<br />
through the command and control function to the broader areas<br />
constituting CS is how this article differentiates S&RCS from<br />
the traditional definition of sense and respond logistics (S&RL).<br />
Implementing S&RL concepts and technologies through the<br />
CSC2 architecture is the way to achieve an S&RCS capability.<br />
In an often volatile commercial market, the manufacturer and<br />
distributor constantly monitor changes in buying patterns and<br />
adapt quickly to maintain market share. By employing S&RL,<br />
commercial enterprise has been able to reduce investments in<br />
warehouses and stock. Industry now increasingly produces what<br />
is desired and required rather than what a planner thinks should<br />
be built based on internal production goals. Commercial S&RL,<br />
in theory, reduces stock and overhead costs and responds rapidly<br />
to change. 8 The key to these improvements is a robust system of<br />
information-gathering and analysis or, in military terms, a highly<br />
efficient C2 system.<br />
Commercial practices and commercial definitions of S&RL<br />
fall short of what is needed to create S&RCS in the Air Force<br />
environment. Although there are similarities between some of<br />
the issues and constraints of the military and those of a large<br />
corporation, the risk of human casualty, the consequences to the<br />
international political order, and vastly different military<br />
objectives set the Department of Defense (DoD) apart from any<br />
corporation of comparable size. The scope of activities included<br />
in military CS is also much broader than that of commercial<br />
logistics; any reorganizational concept must consider the nuances<br />
of military operations. It is interesting to note that firms have<br />
designed lean supply chains to be resilient to business<br />
disruptions, 9 but it has been shown that resiliency for firms may<br />
not translate to resiliency for the entire supply chain and the<br />
government provision of pliability and redundancy may be<br />
necessary in an era of lean supply chain management. 10 In the<br />
military case, the Air Force is the sole user and provider and thus<br />
the business notions of resiliency may not be entirely applicable.<br />
Traditionally, ongoing planning and tasking often occur in<br />
isolation from those who would subsequently be required to<br />
support the levels and rates of tasking. Coordination, if any,<br />
occurs after initial planning cycles are completed. Modern,<br />
responsive systems demand information-sharing among all<br />
partners in the military enterprise. Moreover, tools and<br />
technology play a vital role in this enterprise.<br />
A Brief Survey of Sense and Respond<br />
Tools and Technology<br />
The DoD Office of Force Transformation (OFT) developed the<br />
military sense and respond logistics concept, borrowing heavily<br />
from research in the commercial sector (which was in turn<br />
indebted to earlier military efforts, such as the observe, orient,<br />
decide, and act loop) 11 to describe an adaptive method for<br />
maintaining operational availability of units by managing their<br />
end-to-end support network. OFT addresses S&RL from a Joint<br />
force perspective and as an important component of DoD’s<br />
focused logistics strategy.<br />
OFT considered architectural development planning that<br />
includes the development of an information technology S&RL<br />
prototype. One of these architectural concepts is the Integrated<br />
Enterprise Domain Architecture, which has the objectives of<br />
integrating, accommodating, and employing concepts and<br />
components of logistics, operations, and intelligence<br />
architectures and of their command, control, communications,<br />
computers, intelligence, surveillance, and reconnaissance<br />
concepts. 12 Presently, Integrated Enterprise Domain Architecture<br />
is in a predevelopment stage, but plans are to eventually link it<br />
to other architectures or programs, including Joint Staff J4, Joint<br />
Forces Command, US Marine Corps, United States<br />
Transportation Command, and possibly certain organizations in<br />
the Navy and the Army. Among the in-work project linkages is<br />
the RAND-Air Force CSC2 Operational Architecture as the Air<br />
Air Force Journal of <strong>Logistics</strong>
Force vehicle for coordinating with concepts in S&RL.<br />
Overall, the OFT program for S&RL is in a very early stage,<br />
but it has the potential to influence and effect near- to mid-term<br />
changes in some current programs using S&RL technologies.<br />
OFT suggests that elements of the concept can be employed in<br />
an evolutionary development in the very near term and could<br />
result in immediate operational gains. 13 OFT has also identified<br />
a number of technologies that are essential in an S&RL system,<br />
two of which were highlighted as especially important<br />
components: radio frequency identification and intelligent<br />
(adaptive) software agents.<br />
However, before we discuss these components it is noteworthy<br />
to present some of the technical requirements that are essential<br />
in supporting sense and respond CS. Although there is great<br />
diversity amongst various approaches to sense and respond<br />
logistics implementation and its applications, a general theme<br />
is best stated by the IBM Sense and Respond Enterprise Team. 14<br />
These criteria are in line with RAND’s CSC2 concepts which the<br />
Air Force is in the process of implementing. 15 In general,<br />
technologies and innovation to support sense and respond (S&R)<br />
must have the following:<br />
The ability to detect, organize, and analyze pertinent<br />
information and sense critical business (force) conditions<br />
The filters for enterprise data to enable stable responses to<br />
disturbances in the business or military environment<br />
The intelligent response agents that analyze global value<br />
chain relationships and information and derive the optimal<br />
strategy for the best supply chain performance<br />
Predictive modeling at multiple levels: strategic, tactical, and<br />
operational<br />
Agent coordination mechanisms at multiple levels: strategic,<br />
tactical, and operational<br />
Integrated Planning System<br />
(Demand Generation Process)<br />
CS<br />
Resources<br />
and<br />
Processes<br />
Guidance<br />
Operational<br />
Objectives<br />
Plan<br />
(Ops/CS)<br />
Ops/CS<br />
Plan<br />
Annual Edition, <strong>Vol</strong>ume XXXIII, Number 1<br />
Develop<br />
MOEs<br />
CS Performance<br />
Parameters<br />
Assess<br />
(Capability/<br />
MOEs)<br />
Ops/CS Plan Shortfalls<br />
Ops/CS<br />
Plan<br />
Execution Control System<br />
(Resource Supply, Assessment,<br />
and Control Process)<br />
Execute<br />
(Ops/CS)<br />
Continue<br />
Ops/CS Plan Shortfalls<br />
Adjust When Actual MOE Is Beyond<br />
Planned CS Control Parameters<br />
Figure 1. Feedback Loop Process<br />
The ability to learn by comparing previously predicted trends<br />
with recorded data and information to improve future<br />
responses<br />
A software infrastructure to integrate heterogeneous and<br />
collaborative agents implementing critical business policies<br />
and making operational decisions<br />
This concept can be contrasted with the OFT perspective. OFT,<br />
within its All Views Architecture, lists specific systems<br />
architecture components for S&RL, including the following<br />
capabilities: 16<br />
Passive and active tagging, instruments, and sensors that<br />
provide location status, diagnoses, prognoses, and other<br />
information relative to operations space entities, especially<br />
for conditions and behavior that affect force capabilities<br />
management, logistics, and sustainment.<br />
Intelligent software agents that represent operations space<br />
entities, conditions, and behaviors, provide a focus for control<br />
of action or behavior, or act as monitors.<br />
S&RL knowledge bases oriented toward force capabilities<br />
management, logistics, and sustainment.<br />
S&RL reference data, again focused on force capabilities,<br />
assets, and resources related to force capabilities management,<br />
logistics, and sustainment.<br />
S&RL rule sets, which govern the operations and organization<br />
of S&RL functions, activities, and transactions.<br />
S&RL cognitive decision support tools uniquely supporting<br />
force capabilities management, logistics, and sustainment.<br />
Unique S&RL processes, applications, portals, and interfaces<br />
not provided either by Distributed Adaptive Operations<br />
Command and Control or the Network-Centric Operations and<br />
Warfare infrastructure.<br />
Monitor/Control<br />
(Actual vs Planned<br />
Performance)<br />
105
These are representative of the technologies and innovations<br />
that have been identified with military and commercial S&RL<br />
initiatives. In the next section, we discuss two important<br />
technologies needed to enable an ultimate S&RCS capability:<br />
radio frequency identification (RFID) and intelligent (adaptive)<br />
software agents. 17<br />
Radio Frequency Identification. RFID is an automatic<br />
identification technology that provides location and status<br />
information for items in the CS system. RFID technologies are<br />
fairly mature and have been fielded in both commercial and<br />
military arenas. Technically, RFID offers a way to identify unique<br />
items using radio waves. Typically, a reader communicates with<br />
a tag, which holds digital information in a microchip. However,<br />
some chipless forms of RFID tags use material to reflect back a<br />
portion of the radio waves beamed at them. This technology is<br />
of equal interest to military and commercial enterprises.<br />
There are several examples of real-time information-gathering<br />
and distribution. For example, in Iraq, some Marine units had<br />
active tags not just on pallets but also on vehicles. RFID readers<br />
were set up at a distribution center in Kuwait, at the Iraq-Kuwait<br />
border, and at checkpoints along the main arteries in Iraq. When<br />
trucks passed the readers, the location of the goods they were<br />
carrying was updated in the DoD’s intransit visibility network<br />
database. This enabled commanders on the ground to see the<br />
precise location of the replenishments needed to sustain<br />
operations. RFID implementation is limited, but the DoD goal is<br />
to minimize human involvement when collecting data on<br />
shipments and their movements.<br />
The Application of Agent Technology. The application of<br />
agent technology in S&RL research has become pervasive both<br />
in military and nonmilitary programs. Agent-based modeling<br />
(ABM) allows a more robust simulation of CS operations. 18<br />
Agent-based models are already in wide use within the DoD for<br />
force-on-force simulations but have only recently been adapted<br />
for military logistics use. The logistics domain is distributed and<br />
involves decentralized (autonomous) organizations. These<br />
organizations are also<br />
106<br />
Intentional entities, with goals, functions, roles, and beliefs,<br />
using processes and expertise to achieve their goals<br />
Reactive, and thus responsive to changes that occur in their<br />
environment<br />
Social, so they interact with other organizations to achieve<br />
their goals, where the social interaction is typically complex,<br />
such as negotiation, rather than just action requests<br />
The similarity in characteristics between agents and<br />
organizations makes agents an appropriate choice for modeling<br />
organizations. This also explains agent functionality in carrying<br />
out organizational or human processes in S&RL applications.<br />
Moreover, robust distributed C2 strategies can also be tested<br />
using ABMs. 19 Although some simple supply chain simulations<br />
have been done for logistics, almost none have modeled actual<br />
organizations with the requisite detail and calibration necessary<br />
to compare alternative policies and gain insight.<br />
Although individual automated software agents are already<br />
employed commercially for particular tasks, intelligent multiagent<br />
systems are still in early development. 20 Consequently,<br />
ABMs have only had a limited effect on practical<br />
decisionmaking. Only in recent years have academic researchers<br />
explored the use of intelligent agents for supply chain<br />
management. 21 Although ABMs are properly understood as<br />
multi-agent systems, not all agents or multi-agent systems are<br />
employed for modeling and simulation purposes. Several<br />
researchers, including some under DoD contracts, have<br />
developed applications of ABMs for supply chain management. 22<br />
Agents have been used in telecommunications, e-commerce,<br />
transportation, electric power networks, and manufacturing<br />
processes. Within telecommunications, software agents bear the<br />
responsibility for error-checking (such as dropped packets),<br />
routing and retransmission, and load-balancing over the network.<br />
Web-search robots are agents that traverse Web sites collecting<br />
information and cataloging their results. When a customer<br />
searches for an item on a Web site, say Amazon.com, at the<br />
bottom of the page there is a list of similar products that other<br />
customers interested in the item also viewed. Similar agents<br />
assemble customized news reports and filter spam from e-mail.<br />
Data-mining agents seek trends and patterns in an abundance of<br />
information from varying sources and are of particular interest<br />
for all-source intelligence analysis. 23<br />
A World of Initiatives<br />
The following discussion represents recent and current<br />
initiatives, both public and private, to develop sense and respond<br />
capabilities.<br />
The Defense Advanced Research Projects <strong>Agency</strong> (DARPA)<br />
has been working on an end-to-end logistics system under the<br />
Advanced <strong>Logistics</strong> Project. 24 Under this project, DARPA<br />
developed an advanced agent architecture with applications<br />
to logistics. As follow-on to Advanced <strong>Logistics</strong> Project,<br />
DARPA initiated a program called Ultra-Log that attempted<br />
to introduce robust, secure, and scalable logistics agents into<br />
the architecture. Ultimately, ultra-Log is seeking valid<br />
applications to DoD problems (such as Defense <strong>Logistics</strong><br />
Institute applications) while adopting commercial opensource<br />
models.<br />
DARPA led another experiment called Coalition Agent<br />
eXperiment (CoAX), which was an example of the utility of<br />
agent technology for military logistics planning. A multiagent<br />
logistics tool, implemented within CoAX, was<br />
developed using agent technology to have agents represent<br />
organizations within the logistics domain and model their<br />
logistics functions, processes, expertise, and interactions with<br />
other organizations. The project generated important lessons<br />
for S&RL, identifying two types of issues that need to be<br />
overcome for agents to be effectively used for military logistics<br />
planning—technological and social (human acceptability).<br />
RAND believes the issues are the same for use in executing<br />
logistics functions. Under technology, the identified issues<br />
include logistics business process modeling, protocols,<br />
ontologies, automated information-gathering, and security.<br />
We found some of these being addressed in DARPA’s work.<br />
Under social acceptability, the following were important:<br />
trusting agents to do business for you, accountability and the<br />
law, humans and agents working together, efficiency metrics,<br />
ease of use, adjustable autonomy, adjustable visibility, and<br />
social acceptability versus optimality.<br />
The Air Force Research Laboratory, <strong>Logistics</strong> Readiness<br />
Branch (<strong>AF</strong>RL/HEAL) has focused its attention on human<br />
factor issues in S&RL, with a concentration on cognitive<br />
Air Force Journal of <strong>Logistics</strong>
decision support. 25 <strong>AF</strong>RL proposes to focus on the human<br />
aspects of distributed operations by researching and<br />
developing enhanced or novel methodologies and measures<br />
to evaluate the effect of collaboration technologies on human<br />
performance from an individual, team, and organizational<br />
perspective. This group suggests that human performance<br />
metrics should be created along with other performance<br />
metrics for S&RL functions and activities in the military<br />
enterprise, although such considerations are currently not<br />
being called for in the requirements.<br />
In addition to the multiple DoD-led initiatives, a number of<br />
commercial sector and university initiatives have developed<br />
some of the technologies needed to enable an S&RCS capability<br />
and presents a number of industrial applications of fielded S&R<br />
systems. These included an IBM Sense and Respond Blue<br />
program, which was a major influence on the military OFT<br />
enterprise definition and emphasized the employment of careful<br />
planning as well as intelligence, flexibility, and responsiveness<br />
in execution in order to achieve high levels of distributed<br />
efficiency. 26 In addition, General Electric Transportation Systems<br />
developed and fielded an autonomic logistics capability for its<br />
locomotive engine business. This capability is enabled through<br />
an onboard computing and communications unit that hosts<br />
Although individual automated software agents are already employed<br />
commercially for particular tasks, intelligent multi-agent systems are<br />
still in early development. Consequently, ABMs have historically only<br />
had a limited effect on practical decisionmaking. Only in recent years<br />
have academic researchers explored the use of intelligent agents for<br />
supply chain management.<br />
software applications, continuously monitors locomotive<br />
parameters, and provides communications to General Electric’s<br />
Monitoring and Diagnostics Service Center. 27<br />
Based on this technology review of both military and<br />
commercial activities and initiatives (and a more thorough review<br />
detailed in the RAND monograph 28 ), we concluded that although<br />
current technology has enabled a limited set of sense and respond<br />
capabilities, a full implementation of S&RL concepts remains<br />
dependent on substantial future technological development. The<br />
largest challenge ahead for implementing a broader S&RCS<br />
capability is the development of an understanding of the<br />
interactions between CS system performance and combat<br />
operational metrics. Without the proper metrics for measuring<br />
the agent (and other) technologies used in S&RCS<br />
implementation, it is difficult to project where or when CSC2<br />
effectiveness best stands to gain from this technology insertion.<br />
This is an important subject to address through information<br />
technology prototyping for CSC2 because it should drive<br />
information technology investments among S&RL technologies.<br />
Annual Edition, <strong>Vol</strong>ume XXXIII, Number 1<br />
Air Force Combat Support Command and<br />
Control Implementation Effort<br />
The Air Force has taken initial steps to implement the CS<br />
command and control operational architecture. Its efforts are<br />
designed to help enable AEF operational goals. Implementation<br />
actions to date include changes in C2 doctrine, organizations,<br />
processes, and training. Although progress has been steady, the<br />
area of information systems and technology requires increasing<br />
application of modern capabilities. The emerging modernized<br />
logistics information systems emphasize mostly business process<br />
improvements, with little focus on CS challenges and<br />
requirements. Additionally, CS systems are not being coordinated<br />
and tested in an integrated way with operations and intelligence<br />
systems. The architecture and requirements for peacetime and<br />
wartime logistics and CS information systems will need to be<br />
more closely coordinated.<br />
The Air Force has begun evaluating the effectiveness of CSC2<br />
concepts in exercises. Improving CSC2 organizations, processes,<br />
and information systems hardware, software, and architecture<br />
will require several years of active involvement by US Air Force<br />
Headquarters as well as Air Force initiatives to restructure a<br />
system that was previously organized around fixed-base, fight-<br />
in-place air assets. However, there are active efforts to structure<br />
CSC2 activity and policy in a way that should effectively support<br />
forces throughout the 21st century. Below is a summary of the<br />
status of Air Force implementation actions.<br />
C2 Doctrine. The Air Force initiated a review of its doctrine<br />
and policy and began revisions to reflect the robust AEF CSC2<br />
operational architecture. Such actual and planned changes to Air<br />
Force doctrine and policy are on the right track. As doctrine is<br />
changed, procedures, policies, organizations, and systems can<br />
then be changed to align with the changing concepts of warfare.<br />
Perhaps the most significant opportunity for improvement is the<br />
integration of CS and operational planning. Currently, there are<br />
no standard processes for operational planners to communicate<br />
operational parameters to CS planners. This deficiency greatly<br />
hinders timely, accurate CS planning. Creating a framework,<br />
reinforced in doctrine, to delineate specifically what information<br />
operations planners provide, in what format, and to whom could<br />
address this shortfall. Solidifying this linkage between<br />
operations and logistics in crisis action planning would enable<br />
a step forward in the coordination, time liness, and accuracy of<br />
CS planning.<br />
107
Organizations and Processes. The Air Force has made<br />
progress in establishing standing CS organizations with clear C2<br />
responsibilities and developing processes and procedures for<br />
centralized management of CS support resources and capabilities.<br />
Training. The Air Force has made much progress in<br />
improving CSC2 training, including the formation of an<br />
education working group, to address the development and<br />
enhancement of formal education programs. The group will also<br />
address the implementation of significant new C2 instruction at<br />
the Air Force Advanced Maintenance and Munitions Officers<br />
School at Nellis Air Force Base, Nevada, 29 and the development<br />
of the Support Group Commanders Course and the new CS<br />
Executive Warrior Program, which will provide training for<br />
support group commanders, who are potential expeditionary<br />
support group commanders and A4s.<br />
Information Systems. This area needs the most change. These<br />
changes should include the following:<br />
Significant challenges remain before the Air Force can realize an S&RCS<br />
capability. To develop effective tools that accurately link logistics levels<br />
and rates to operational effects, the modern Expeditionary Combat<br />
Support System must be developed and tested in conjunction with<br />
operations and intelligence systems. Only through integrated testing<br />
can the CSC2 architecture be properly developed and implemented.<br />
108<br />
Relate operational plans to CS requirements<br />
Convert CS resource levels to operational capabilities<br />
Conduct capability assessments and aggregate on a theater<br />
or global scale<br />
Conduct tradeoff analyses of operational, support, and<br />
strategy options<br />
Focus integration efforts on global implementation of a few<br />
selected tools<br />
Standardize tools and systems for consistent integration<br />
Most of the logistics information systems’ modernization<br />
efforts are linked to improving information technology solutions,<br />
which support day-to-day business processes. Modernization of<br />
the peacetime systems will certainly yield some improved CSC2<br />
information ability. However, the requirements for a more robust<br />
S&RCS capability need to be considered within the wartime<br />
CSC2 architecture. CS system modernization will need to assess<br />
both peacetime and deployment requirements and produce tools<br />
and capabilities that will satisfy business processes as well as<br />
CSC2 needs.<br />
Enterprise-Wide Systems and Combat Support Command<br />
and Control. CSC2 analytical and presentation tools will need<br />
to augment typical data processing with increasingly modern<br />
sense and respond capabilities. Batch processing and analysis, a<br />
proven rate and methodology for most of the Air Force’s 60 years<br />
of experience, will not effectively support agile combat<br />
operations and effects-based metrics. To respond to continuously<br />
changing desired effects, enemy actions, rates of consumption,<br />
and other controlling inputs, the 21st century logistics<br />
warfighter will need to accumulate, correlate, and display<br />
information rapidly and in graphic formats that will be equally<br />
understandable for operators and logisticians. Data will need to<br />
be refreshed much more rapidly than the former monthly and<br />
quarterly cycles. Daily decisions will require daily (if not hourly<br />
or possibly continuous) data refresh cycles.<br />
A closed-loop planning and control system is essential to a<br />
robust military S&RCS architecture. Currently, information<br />
about Air Force resource and process metrics is organized by<br />
commodity or end item and located on disparate information<br />
systems. Creating a single system accessible to a wide audience<br />
would enhance leadership visibility over these resources. Such<br />
a system needs to have enough automation to translate lowerlevel<br />
process and data into aggregated metrics, which can be<br />
related in most cases to operational requirements.<br />
The greatest change required in modernized logistics systems<br />
is to reorient existing logistics systems toward combat-oriented<br />
ones. The peacetime-only materiel management systems need<br />
to be structured to participate in the enterprise-wide sharing of<br />
data and culling of information.<br />
Stand-alone, single-function systems need to be replaced with<br />
systems that serve several functions for CS leaders at all echelons.<br />
Finally, modern CSC2 systems need to provide information<br />
useful in both peacetime and wartime decisionmaking.<br />
Future Work and Challenges<br />
The Air Force has made some progress toward implementing<br />
doctrine and policy changes, and plans are in place to continue<br />
to close the information technology and analytical tools gaps.<br />
An expanded Air Force to-be CSC2 execution planning and<br />
control architecture system would enable the Air Force to meet<br />
its AEF operational goals. New capabilities include the<br />
following:<br />
Enable the CS community to quickly estimate support<br />
requirements for force package options and assess the<br />
feasibility of operational and support plans<br />
Facilitate quick determination of beddown needs and<br />
capabilities<br />
Air Force Journal of <strong>Logistics</strong>
Ensure rapid time-phased force and deployment data<br />
development<br />
Support development and configuration of theater<br />
distribution networks to meet Air Force employment time lines<br />
and resupply needs<br />
Facilitate the development of resupply plans and monitor<br />
performance<br />
Determine the effects of allocating scarce resources to various<br />
combatant commanders<br />
Indicate when CS performance begins to deviate from desired<br />
states and facilitate development and implementation of getwell<br />
plans<br />
CS and operations activities must be continuously monitored<br />
for changes in performance and regulated to keep within planned<br />
objectives. Significant advances must be made in the way<br />
planning, directing, coordinating, and controlling functions are<br />
performed to move the Air Force toward a robust S&RCS<br />
capability. These essential elements of an effective C2 system<br />
must be altered to allow them to accomplish the important aspects<br />
of sensing and responding to changes in operating parameters<br />
when the violation of tolerance becomes evident. These sense<br />
and respond activities will need to take place in a nearly realtime<br />
environment.<br />
The objective of rapid sensing and response is to alert<br />
decisionmakers to initial deviations in the plan, rather than<br />
reacting after-the-fact, to situations affecting mission capability.<br />
Emphases of metrics in the future need to be on outcomes, rather<br />
than on outputs. The RAND report details necessary adaptations<br />
that include (at the minimum) the following improvements in<br />
CSC2 architecture and activities.<br />
Planning. With the AEF’s short time lines and pipelines, it is<br />
critical to be able to add CS information to initial planning,<br />
giving planners flexibility and confidence. CS execution<br />
planning functions include monitoring theater and global CS<br />
resource levels and process performance, estimating resource<br />
needs for a dynamic and changing campaign, and assessing<br />
plan feasibility. Because capabilities and requirements are<br />
constantly changing, these activities must be performed<br />
continuously so that accurate data are available for courses<br />
of action and ongoing ad hoc operational planning.<br />
Directing. CS-directing activities include configuring and<br />
tailoring the CS network, and establishing process<br />
performance parameters and resource thresholds. 30 Planning<br />
output drives infrastructure configuration direction—there<br />
must be an ongoing awareness of CS infrastructure and<br />
transportation capabilities to feed into operational planning<br />
and execution. Once combat operations commence, the<br />
logistics and installations support infrastructure must be<br />
regulated to ensure continued support for dynamic<br />
operations. The system must monitor actual CS performance<br />
against the plan. The performance parameters and resource<br />
buffers established during execution planning will provide<br />
advance warning of potential system failure.<br />
Coordinating. Coordination ensures a common operating<br />
picture for CS personnel. It includes beddown site status,<br />
weapon system availability, sortie production capabilities,<br />
and other similar functions. Coordination activities should<br />
be geared to providing information to higher headquarters to<br />
Annual Edition, <strong>Vol</strong>ume XXXIII, Number 1<br />
create an advance awareness of issues should one be needed<br />
at a later date. Great effort must be made to effectively filter<br />
the information flows up the command chain, to avoid<br />
overwhelming commanders with information of little utility,<br />
but to provide sufficient information to improve battlespace<br />
awareness.<br />
Controlling. During the execution of peacetime and<br />
contingency operations, CS control tracks CS activities,<br />
resource inventories, and process performance worldwide,<br />
assessing root causes when performance deteriorates, deviates<br />
from what is expected, or otherwise falls out of control. Control<br />
modifies the CS infrastructure to return CS performance to the<br />
desired state. CS control should evaluate the feasibility of<br />
proposed modifications before they are implemented and then<br />
direct the appropriate organizations to implement the<br />
changes.<br />
Toward a Responsive System<br />
The Air Force has already begun to take steps to implement some<br />
of these concepts and technologies with varying degrees of<br />
success. Air Force implementation actions include making<br />
doctrine changes to recognize the importance of CSC2, as part<br />
of S&RCS capabilities, and identifying training and information<br />
system improvements.<br />
However, significant challenges remain before the Air Force<br />
can realize an S&RCS capability. To develop effective tools that<br />
accurately link logistics levels and rates to operational effects,<br />
the modern Expeditionary Combat Support System (ECSS) must<br />
be developed and tested in conjunction with operations and<br />
intelligence systems. Only through integrated testing can the<br />
CSC2 architecture be properly developed and implemented.<br />
Technologies associated with S&RL are still in an early stage<br />
of development and may not be fielded for a number of years.<br />
Ultimately, ECSS should relate how CS performance and<br />
resource levels affect operations, but current theoretical<br />
understanding limits these relationships. The Air Force does not<br />
appear to be lagging behind industry in the implementation of<br />
S&RL capabilities but should continue to make judicious<br />
investments in this field.<br />
The Air Force has recently established the Global <strong>Logistics</strong><br />
Support Center (GLSC) as the single agent responsible for endto-end<br />
supply chain management. The creation of this entity<br />
holds promise for the achievement of S&RCS capabilities. The<br />
GLSC should be in a position to advocate for future improvements<br />
while exploring ways to provide the capability utilizing current<br />
systems.<br />
Finally, the observations of the Joint <strong>Logistics</strong> Transformation<br />
Forum are worth repeating: Unless significant improvements are<br />
made to last-mile transportation in-theater, S&RL will have only<br />
a limited effect on operations. A robust, assured transportation<br />
network is the foundation on which expeditionary operations,<br />
as well as S&RL implementation, rests. The complete integration<br />
of transportation into the CSC2 architecture is essential.<br />
End <strong>No</strong>tes<br />
1. Thomas X. Hammes, “Insurgency: Modern Warfare Evolves in a<br />
Fourth Generation,” Strategic Forum, <strong>No</strong> 214 January, 2005.<br />
2. Darius the Great, King of Persia (558-486 BC), and Alexander the<br />
Great (356-<strong>32</strong>3 BC) both had to deal with insurgents in their respective<br />
empires.<br />
109
3. Early in its development, the term Expeditionary Aerospace Force<br />
(E<strong>AF</strong>) was used to describe the concept of employing Air Force forces<br />
rapidly anywhere in the world, in predefined force packages, called<br />
Aerospace Expeditionary Forces. The terms have since evolved and<br />
the Air Force now uses the term Air and Space Expeditionary Force to<br />
describe both the concept and force packages.<br />
4. Air Force Doctrine Document 2-4, Combat Support, March 23, 2005.<br />
5. Robert S. Tripp, Lionel A. Galway, Paul S. Killingsworth, Eric Peltz,<br />
Timothy L. Ramey, and John G. Drew, Supporting Expeditionary<br />
Aerospace Forces: An Integrated Strategic Agile Combat Support<br />
Planning Framework, Santa Monica, CA: RAND Corporation,<br />
MR-1056-<strong>AF</strong>, 1999.<br />
Robert S. Tripp, Lionel A. Galway, Timothy L. Ramey, Mahyar A.<br />
Amouzegar, and Eric Peltz, Supporting Expeditionary Aerospace<br />
Forces: A Concept for Evolving to the Agile Combat Support/Mobility<br />
System of the Future, Santa Monica, CA: RAND Corporation,<br />
MR-1179-<strong>AF</strong>, 2000.<br />
Lionel A. Galway, Robert S. Tripp, Timothy L. Ramey, and John G.<br />
Drew, Supporting Expeditionary Aerospace Forces: New Agile Combat<br />
Support Postures, Santa Monica, CA: RAND Corporation,<br />
MR-1075-<strong>AF</strong>, 2000.<br />
Eric Peltz, Hyman L. Shulman, Robert S. Tripp, Timothy L. Ramey,<br />
Randy King, and John G. Drew, Supporting Expeditionary Aerospace<br />
Forces: An Analysis of F-15 Avionics Options, Santa Monica, CA:<br />
RAND Corporation, MR-1174-<strong>AF</strong>, 2000.<br />
Mahyar A. Amouzegar, Lionel A. Galway, and Amanda Geller,<br />
Supporting Expeditionary Aerospace Forces: Alternatives for Jet<br />
Engine Intermediate Maintenance, Santa Monica, CA: RAND<br />
Corporation, MR-1431-<strong>AF</strong>, 2002.<br />
Mahyar A. Amouzegar, Lionel A. Galway, and Robert S. Tripp,<br />
“Integrated <strong>Logistics</strong> Planning for Expeditionary Aerospace Force,”<br />
Journal of Operational Research, <strong>Vol</strong> 55, 2004.<br />
Mahyar A. Amouzegar, Robert S. Tripp, Ronald G. McGarvey, Edward<br />
Wei-Min Chan, and Charles Robert Roll, Jr., Supporting Air and Space<br />
Expeditionary Forces: Analysis of Combat Support Basing Options,<br />
Santa Monica, CA: RAND Corporation, MG-261-<strong>AF</strong>, 2004.<br />
Mahyar A. Amouzegar, Ronald G. McGarvey, Robert S. Tripp, Louis<br />
Luangkesorn, Thomas Lang, C. Robert Roll, Jr., Evaluation Of Options<br />
For Overseas Combat Support Basing, Santa Monica, CA: RAND<br />
Corporation, MG-421-<strong>AF</strong>, 2006.<br />
James C. Rainey, Mahyar A. Amouzegar, Beth F. Scott, Robert S.<br />
Tripp, Ann M. C. Gayer, eds., Combat Support: Shaping Air Force<br />
<strong>Logistics</strong> for the 21st Century, Montgomery, AL: Air Force <strong>Logistics</strong><br />
<strong>Management</strong> <strong>Agency</strong> Publisher, August 2003.<br />
6. Air Force Doctrine Document 1, Air Force Basic Doctrine, September,<br />
1997.<br />
7. James Leftwich, Robert S. Tripp, Amanda Geller, Patrick H. Mills,<br />
Tom LaTourrette, Charles Robert Roll, Cauley Von Hoffman, and<br />
David Johansen, Supporting Expeditionary Aerospace Forces: An<br />
Operational Architecture for Combat Support Execution Planning and<br />
Control, Santa Monica, CA: RAND Corporation, MR-1536-<strong>AF</strong>, 2002.<br />
8. The military readers need to equate the word customer, in civilian<br />
literature, to operational effects.<br />
9. Yosef Sheffi, The Resilient Enterprise: Overcoming Vulnerability for<br />
Competitive Advantage, Cambridge, MA: MIT Press, 2005.<br />
10. See for example: Henry H. Willis and David Santana Ortiz, Evaluating<br />
the Security of the Global Containerized Supply Chain, Santa Monica,<br />
CA: RAND Corporation, TR-214-RC, 2004.<br />
11. David S. Alberts, John J. Garstka, Richard E. Hayes, and David A.<br />
Signori, “Understanding Information Age Warfare,” Department of<br />
Defense Command and Control Research Program Publication Series,<br />
Washington DC, 2001.<br />
12. US Department of Defense, Sense and Respond <strong>Logistics</strong>: Co-evolution<br />
of and Adaptive Enterprise Capability, Concept Document (long<br />
version), Washington, DC, 2004, a.<br />
13. Ibid. In conversations with Office of Force Transformation (OFT) staff,<br />
the timeframe for identifying and developing specific technologies<br />
for full implementation of all elements of operational S&RL is 2010<br />
to 2015.<br />
14. Grace Lin, Steve Buckley, Heng Cao, Nathan Caswell, Markus Ettl,<br />
Shubir Kapoor, Lisa Koenig, Kaan Katircioglu, Anil Nigam, Bala<br />
110<br />
Ramachandran, and Ko-Yang Wang, “The Sense-and-Respond<br />
Enterprise: IBM Researchers Develop Integrated SAR System of Global<br />
Value Chain Optimization,” OR/MS Today, April 2002.<br />
15. Leftwich.<br />
16. US Department of Defense.<br />
17. This certainly is not an inclusive list because this is an active research<br />
area with numerous initiatives around the globe. Although we will<br />
examine a few of these in some detail, projecting the availability of<br />
these technologies is beyond the scope of our research.<br />
18. For a more detailed discussion of agent based modeling see:<br />
Andrew Illachinski, Artificial War: Multiagent-Based Simulation of<br />
Combat, Singapore: World Scientific Publishing, 2004.<br />
19. E. Bonabeau, C. W. Hunt, and P. Gaudiano, “Agent-Based Modeling<br />
for Testing and Designing <strong>No</strong>vel Decentralized Command and Control<br />
System Paradigms,” presentation at the 8th International Command<br />
and Control Research and Technology Symposium, National Defense<br />
University, Washington, DC, June 17-19, 2003.<br />
20. A multiagent system is a collection of agents cooperating or competing<br />
with each other to fulfill common and individual goals. See P.L.<br />
Davidsson, L. Henesey, L. Ramstedt, J. Törnquist, and F. Wernstedt,<br />
“Agent-Based Approaches to Transport <strong>Logistics</strong>,” Proceedings of the<br />
3rd International Joint Conference on Autonomous Agents and Multi-<br />
Agent Systems, Workshop on Agents in Traffic and Transportation,<br />
New York, 2004.<br />
21. R. Lempert, “A New Decision Sciences for Complex Systems,”<br />
Proceedings of the National Academy of Sciences, <strong>Vol</strong>. 99, S3, 2002.<br />
22. See for example: H.V.D. Parunak, Agents in Overalls: Experiences<br />
and Issues in the Development and Deployment of Industrial Agent-<br />
Based Systems, Ann Arbor, MI: ERIM Center for Electronic<br />
Commerce, 1999.<br />
23. John S. Hollywood, Diane Snyder, Kenneth McKay, and John E. Boon,<br />
Out of the Ordinary: Finding Hidden Threats by Analyzing Unusual<br />
Behavior, Santa Monica, CA: RAND Corporation, MG-126-RC, 2004.<br />
24. Bonabeau et al., 2003.<br />
25. Information on DARPA’s research is based on personal<br />
communications with Dr. Mark Greaves, the current Ultra-Log<br />
program manager; see also DARPA’s Web site: www.darpa.gov.<br />
26. Author’s communication with Mr. Edward Boyle, Chief, <strong>AF</strong>RL/HEAL.<br />
27. Lin et al., 2002.<br />
28. See www.getransportation.com/general/locomotives/services/rm_d/<br />
lococomm.asp.<br />
29. Tripp, et al.<br />
30. Major General Kevin Sullivan, “Concept to Reality,” in James C.<br />
Rainey et al., eds., Combat Support: Shaping Air Force <strong>Logistics</strong> for<br />
the 21st Century, Montgomery, AL: Air Force <strong>Logistics</strong> <strong>Management</strong><br />
<strong>Agency</strong>, August 2003.<br />
31. Heuristically determined thresholds can be established while more<br />
sophisticated expert rules or algorithms are being developed. For<br />
instance, Brigadier General Hennessey AMC/LG) uses zero-balance<br />
stock positions coupled with forces supporting an engaged combatant<br />
commander as a rule to determine when lateral actions should be taken<br />
to resupply a unit at war. Using this rule, he authorizes the AMC/<br />
Regional Supply Squadron (RSS) to reallocate stocks from units with<br />
stock to those with zero balances. The idea is to prevent mission<br />
degradation by focusing attention on the items that will cause the next<br />
mission degradation.<br />
Mahyar A. Amouzegar is a senior analyst at RAND and the<br />
Associate Dean at California State University, Long Beach.<br />
Robert S. Tripp is a senior analyst at RAND.<br />
Ronald G. McGarvey is an operations researcher at RAND.<br />
Michael J. Neumann is a communications analyst at RAND.<br />
Richard Bereit is an adjunct senior analyst at RAND.<br />
David George is an adjunct senior analyst at RAND.<br />
Colonel Joan H. Cornuet, US<strong>AF</strong>, is the commander,<br />
Mobility Air Forces Logistical Support Center, Air Mobility<br />
Command.<br />
Air Force Journal of <strong>Logistics</strong>
Annual Edition, <strong>Vol</strong>ume XXXIII, Number 1<br />
Thinking About <strong>Logistics</strong><br />
Understanding the elements of military power requires more than a passing knowledge of logistics and how<br />
it influences strategy and tactics. An understanding of logistics comes principally from the study of history<br />
and lessons learned. Unfortunately, despite its importance, little emphasis is placed on the study of history among logisticians.<br />
To compound matters, the literature of warfare is replete with triumphs and tragedy, strategy and tactics, and brilliance or blunders;<br />
however, far less has been written concerning logistics and the tasks involved in supplying war or military operations. 1<br />
<strong>Logistics</strong> is the key element in warfare, more so in the 21 st century than ever before. Success on the modern battlefield is dictated by<br />
how well the commander manages available logistical support. Victories by the United States in three major wars (and several minor<br />
wars or conflicts) since the turn of the century are more directly linked to the ability to mobilize and bring to bear economic and<br />
industrial power than any level of strategic or tactical design. The Gulf War and operations to liberate Iraq further illustrates this point.<br />
As the machinery of the Allied Coalition began to turn, armchair warriors addicted to action, and even some of the hastily recruited military experts,<br />
revealed a certain morbid impatience for the “real war” to begin. But long before the Allied offensive could start, professional logisticians had to<br />
gather and transport men and materiel and provide for the sustained flow of supplies and equipment that throughout history has made possible the<br />
conduct of war. Commanders and their staffs inventoried their stocks, essayed the kind and quantities of equipment and supplies required for<br />
operations in the severe desert climate, and coordinated their movement plans with national and international logistics networks. The first victory<br />
in the Persian Gulf War was getting the forces there and making certain they had what they required to fight [Emphasis added]. Then and only then,<br />
would commanders initiate offensive operations. 2<br />
Unfortunately, the historical tendency of political and military leadership to neglect logistics activities in peacetime and expand<br />
and improve them hastily once conflict has broken out may not be so possible in the future as it has in the past. A declining industrial<br />
base, flat or declining defense budgets, force drawdowns, and base closures have all contributed to eliminating or restricting the<br />
infrastructure that made rapid expansion possible. Regardless, modern warfare demands huge quantities of fuel, ammunition, food,<br />
clothing, and equipment. All these commodities must be produced, purchased, transported, and distributed to military forces. And of<br />
course, the means to do this must be sustained. Arguably, logistics of the 21 st century will remain, in the words of one irreverent World<br />
War II supply officer, “The stuff that if you don’t have enough of, the war will not be won as soon as.” 43<br />
<strong>No</strong>tes<br />
1. John A. Lynn, ed, Feeding Mars: <strong>Logistics</strong> in Western Warfare from the Middle Ages to the Present, San Francisco: Westview Press, 1993, vii.<br />
2. Charles R. Shrader, U.S. Military <strong>Logistics</strong>, 1607-1991, A Research Guide, New York: Greenwood Press, 1992, 3.<br />
3. Julian Thompson, The Lifeblood of War: <strong>Logistics</strong> in Armed Conflict, Oxford: Brassy’s, 1991, 3<br />
Shaping <strong>Logistics</strong>—Just-in-Time <strong>Logistics</strong><br />
The Editors, Air Force Journal of <strong>Logistics</strong><br />
Geostrategic, economic, and technological changes will make support of air operations, both at home and<br />
overseas, increasingly dependent on the flexibility and responsiveness of the military logistic organization.<br />
This requires the creation of a highly integrated and agile support chain with global reach. The most promising strategy to<br />
achieve these aims is based on a joint management approach, teaming the public and private sectors, under long-term partnering<br />
arrangements. While it is probable that organic military maintenance capabilities will be retained, particularly to address life-extension<br />
and fleet-upgrade requirements, the alliance partners will largely determine the size and shape of the military logistic organization as<br />
part of their wider responsibilities for shaping the overall support chain. Success will be measured by a reduction in inventories, faster<br />
turn-round times, more rapid modification embodiment, swifter deployment of new technologies, a smaller expeditionary footprint,<br />
lower support costs, and greater operational output.<br />
This strategy requires more, however, than the application of just-in-time principles. It embraces commercial express transportation;<br />
innovative contracting arrangements including spares-inclusive packages; the application of commercial information technology<br />
solutions to support materiel planning and inventory management; collective decisionmaking involving all stake-holders; an overriding<br />
emphasis on operational output; and most important, a high level of trust between all the parties. These changes may well result in<br />
smaller organic military repair facilities and the greater use of contractors at all maintenance levels, including overseas. Most important,<br />
it will require the military aviation maintenance organization to move away from an internal focus on efficiency and utilization to a<br />
holistic approach that puts customer needs, in the form of operational output, first and foremost.<br />
As with any new strategy, there are risks. The fundamental building block in determining a successful partnership with industry is<br />
trust. As one commentator has observed, “Trust is the currency that makes the supply chain work. If it’s not there, the supply chain falls<br />
apart.” 1 As support chains are more closely integrated and maintenance strategies are better aligned, the more vulnerable is the logistic<br />
organization to the impact of inappropriate behavior. In the past, the risk might have been minimized and resilience enhanced by<br />
providing duplicate or alternative in-house capabilities backed up by large inventories. This is neither affordable nor compatible with<br />
today’s operational needs. In the future, therefore, the main safeguard will be the creation of an environment in which government and<br />
industry, both primes and subcontractors, can function coherently, effectively, and harmoniously.<br />
1. Aviation Week & Space Technology, 13 Sep 99, 75-82.<br />
<strong>No</strong>tes<br />
Group Captain Peter J. Dye, R<strong>AF</strong><br />
111
112<br />
Laura H. Baldwin, PhD, RAND<br />
John Ausink, PhD, RAND<br />
Nancy F. Campbell, PhD, RAND<br />
John G. Drew, RAND<br />
C. Robert Roll, PhD, Jr, RAND<br />
Air Force Journal of <strong>Logistics</strong>
Annual Edition, <strong>Vol</strong>ume XXXIII, Number 1<br />
Introduction 1<br />
Contractors have been an important part of US war efforts<br />
since they were hired to take care of cavalry horses for<br />
the Continental Army during the Revolutionary War.<br />
While the history of contracted support to US military operations<br />
is a long one, the role of that support has expanded<br />
rapidly and extensively, particularly since the end of the Cold<br />
War. 2,3,4 Today the US Air Force, as well as the other US military<br />
services, buys an enormous amount and variety of goods and<br />
services to support its contingency operations. These purchases<br />
are necessary for a wide range of activities, including feeding,<br />
housing, and protecting military personnel; repairing aircraft<br />
weapon systems; and transporting personnel and supplies. The<br />
outcomes of these purchases directly affect the Air Force’s ability<br />
to succeed in a contingency environment.<br />
Purchasing goods and services to support contingency<br />
operations can provide several types of benefits to the Air Force.<br />
As with most types of outsourcing, contract support frees up<br />
airmen to perform core military activities. Providers that<br />
specialize in the outsourced goods or services often can offer<br />
improved performance and cost outcomes, if managed<br />
effectively. Buying in-theater reduces requirements for scarce<br />
transportation resources, potentially shortening deployment time<br />
lines, and also garners host-nation support for US military<br />
presence. Additionally, having the capability to purchase as<br />
needed, rather than being forced to predict requirements in<br />
advance, helps commanders meet emerging demands and the<br />
often-changing requirements associated with the realities of war.<br />
Since September 11, 2001, the Air Force has been involved<br />
in two significant contingency operations in the United States<br />
Central Command (USCENTCOM) area of responsibility (AOR):<br />
Operation Enduring Freedom (OEF) in Afghanistan, and<br />
Operation Iraqi Freedom (OIF) in Iraq. To take advantage of the<br />
depth of contingency contracting experience built during recent<br />
operations, the Deputy Assistant Secretary of the Air Force for<br />
Contracting asked RAND Project Air Force to gather and analyze<br />
data on goods and services purchased to support Air Force<br />
missions in OIF to determine the size and extent of contractor<br />
support for OIF and how plans for and the organization and<br />
execution of contingency contracting activities might be<br />
improved to better support the warfighter in future operations.<br />
The motivation for this study was that insights from<br />
comprehensive data on recent multiyear contingency contracting<br />
experiences would help inform decisions about a number of<br />
important policy issues.<br />
First, such data could be used to improve the Air Force’s ability<br />
to plan for combat operations at contingency operating locations,<br />
particularly by linking purchases to supplemental information<br />
about the phases of operations (such as deployment, the building<br />
of a base, the sustainment of operations at a base, or the closing<br />
of a base) and mission activities supported by those purchases.<br />
113
While price information can be<br />
a powerful tool for contingency<br />
contracting officers (CCO),<br />
additional information about the<br />
relative performance of suppliers<br />
and other factors related to<br />
meeting requirements, such as the<br />
urgency, transportation needs, or<br />
security threats, would be helpful in<br />
interpreting such comparisons.<br />
In “Contingency Contracting: Analyzing Support<br />
to Air Force Missions in Iraqi Freedom” the<br />
authors describe the construction of a database<br />
of CCO purchases supporting Air Force activities<br />
in Operation Iraqi Freedom during fiscal years<br />
2003 and 2004. The results of their analysis<br />
demonstrate how this database can be a powerful<br />
analytic tool to inform and support policy<br />
decisions and initiatives for CCO staffing and<br />
training, combat support planning, and sharing<br />
lessons within the theater.<br />
They recommend the Air Force (and the<br />
Department of Defense more broadly) establish<br />
a standardized methodology for collecting<br />
contingency contracting data on an ongoing basis<br />
to facilitate planning and policy decisions for<br />
future contingencies.<br />
To facilitate the types of analyses required, the<br />
Air Force needs to systematically gather<br />
contingency contracting data on an ongoing<br />
basis. To be most useful, the CCO data system<br />
must make it possible to quickly access detailed<br />
114<br />
For example, the Air Force could make more informed tradeoffs<br />
between purchasing required assets as needed during<br />
operations in-theater or purchasing them in advance and then<br />
using airlift or other transportation assets to move materials from<br />
the United States or regional storage locations to operating<br />
locations.<br />
Second, purchasing data could be used to improve training<br />
for future contingency contracting officers (CCOs). Insights<br />
about how purchasing evolves with operational phases could be<br />
used to design more realistic training courses. Further,<br />
information about typical goods and services purchased, types<br />
of contracts used, and supply bases at specific locations could<br />
be used to better prepare CCOs before deployment.<br />
Third, information about contracting workloads at different<br />
types of bases and other purchasing organizations during<br />
different phases of operations could be used to better align CCO<br />
organizations and personnel assignments (both CCO numbers<br />
and skill levels) with warfighter requirements.<br />
Finally, descriptive data on individual transactions are<br />
important inputs in efforts to improve purchasing practices across<br />
the theater. For example, CCOs could achieve more effective<br />
price negotiations based on improved visibility of prices of<br />
similar goods or services, as well as identification of potential<br />
opportunities to improve the Air Force’s leverage with key<br />
suppliers through contract consolidation across commodity<br />
groups or sites.<br />
Defining Contingency Contracting for<br />
Operation Iraqi Freedom<br />
The Air Force Federal Acquisition Regulation Supplement<br />
(<strong>AF</strong>FARS) provides the following relevant definitions:<br />
A contingency is “an emergency, involving military forces,<br />
caused by natural disasters, terrorists, subversives, or required<br />
military operations.”<br />
CCOs are people with “delegated contracting authority to<br />
enter into, administer, and terminate contracts on behalf of<br />
the Government in support of contingency…operations.” 5<br />
In this article, we use a broad definition of contingency<br />
contracting for OIF that includes war preparations in early fiscal<br />
year (FY) 2003, the major combat operations in mid-FY 2003,<br />
and postwar activities beginning in the latter part of FY 2003.<br />
Although United States Central Command Air Forces<br />
(USCENT<strong>AF</strong>) was the primary major command involved in Air<br />
Force operations, many other commands and organizations made<br />
purchases in support of this effort. For example, purchases were<br />
made to support US Air Forces at European bases, Air Force<br />
Special Operations Command forces, and Air Mobility Command<br />
operations.<br />
Building the Database<br />
To develop a baseline of Air Force contingency contracting for<br />
OIF and obtain insights relevant to the policy issues introduced<br />
above, we sought to develop a comprehensive database of Air<br />
Force OIF contingency purchases, which were made by a large<br />
number of organizations around the world. Our analyses are based<br />
on CCO purchases at 24 purchasing organizations located within<br />
the USCENTCOM AOR that supported OIF during FY 2003 and<br />
Air Force Journal of <strong>Logistics</strong>
FY 2004. These data include more than 24,000 transactions<br />
obligating more than $300M.<br />
We chose these data for several reasons. The current lack of<br />
visibility into the details of the forward transactions and the<br />
decentralized nature of the CCO purchases suggest that there could<br />
be opportunities to improve planning for and execution of these<br />
activities, for example, through preplanning for certain types of<br />
goods or services, more effective price negotiation, or contract<br />
consolidation with key suppliers to the AOR. In addition, the<br />
numbers of dollars and individual transactions for USCENT<strong>AF</strong> are<br />
much greater than equivalent data received from other commands<br />
and organizations that supported OIF.<br />
In order to create a comprehensive Air Force contingency<br />
contracting database for OIF, the RAND team used transaction logs<br />
maintained by the office of the USCENT<strong>AF</strong> comptroller,<br />
headquartered at Shaw Air Force Base, South Carolina. These data<br />
on CCO purchases were tracked in Microsoft® Excel®<br />
spreadsheets, which included similar, but not identical, data fields<br />
and spreadsheet formats for contract and government purchase card<br />
(GPC) files across purchasing organizations in fiscal years 2003<br />
and 2004. 6 As a result, it was necessary for RAND to develop a<br />
detailed process to merge these files into an aggregated master<br />
database that would enable our analyses. 7<br />
The Air Force spreadsheets contained data fields such as a text<br />
description of the goods and services purchased, the date the<br />
purchase was requested, the price paid, and the supplier. In addition,<br />
the RAND team created three new variables for our analyses. First,<br />
we created a variable for the purchasing organization (the base or<br />
other organization) with which the comptroller associated the<br />
transaction. Second, we used the text description for each<br />
transaction to categorize the purchase according to one or more<br />
types of goods or services. And third, we used several pieces of<br />
data from the spreadsheets to create a variable for the type of<br />
transaction to identify whether the purchase was made using a GPC<br />
or a contract vehicle. Contracts are further broken down into<br />
blanket purchase agreements 8 (BPAs) and other contracts.<br />
Baseline of Contingency Contracting for<br />
Operation Iraqi Freedom<br />
This section provides an overview of the results of our baseline<br />
analysis of purchases supporting Air Force OIF activities during<br />
FY 2003 and FY 2004 at Air Force operating locations in the<br />
USCENTCOM AOR. RAND’s database allowed the team to analyze<br />
the USCENT<strong>AF</strong> CCO purchases in several important ways. After<br />
an overview of expenditures, we describe:<br />
Who (which organizations) made purchases<br />
What types of goods and services were purchased<br />
When the purchases were made (time periods)<br />
How the purchases were made (contracting tools used)<br />
From whom (suppliers) the purchases were made<br />
Who<br />
Figure 1 provides information on the time frames for purchasing<br />
activity for each of the OIF purchasing organizations during FY<br />
2003 and FY 2004. (Purchasing activity corresponds to operations<br />
for each of these organizations.) Only five organizations had<br />
contracting activity throughout both years. Some were active for<br />
only a few months.<br />
Annual Edition, <strong>Vol</strong>ume XXXIII, Number 1<br />
descriptions of individual transactions, as well<br />
as aggregate those transactions according to<br />
categories of purchases, types of contract<br />
vehicles used, locations of purchases, suppliers<br />
dealt with, and so forth.<br />
The authors also recommend establishing a<br />
standardized automated system for transactionspecific<br />
data that could be either virtually<br />
connected to a master database or regularly<br />
downloaded into such a database as a means<br />
of recording and cataloging purchases. Such a<br />
system should also include an easy method both<br />
for categorizing purchases across a wide range<br />
of commodities and services and for identifying<br />
suppliers in a standardized way. Contingency<br />
contracting representatives and logistics<br />
planners should work in concert to develop the<br />
database, ensuring that one standardized<br />
system will satisfy the requirements of both<br />
organizations.<br />
Article Acronyms<br />
<strong>AF</strong>FARS – Air Force Federal Acquisition Regulation<br />
Supplement<br />
AOR – Area of Responsibility<br />
BPA – Blanket Purchase Agreement<br />
CAOC – Combined Air Operations Center<br />
CCO – Contingency Contracting Officer<br />
USCENT<strong>AF</strong> – United States Central Command Air<br />
Forces<br />
USCENTCOM – United States Central Command<br />
DFAS – Defense Finance and Accounting Service<br />
FY – Fiscal Year<br />
GPC – Government Purchase Card<br />
OEF – Operation Enduring Freedom<br />
OIF – Operation Iraqi Freedom<br />
PSAB – Prince Sultan Air Base<br />
RED HORSE – Rapid Engineer Deployable Heavy<br />
Operational Repair Squadron Engineers<br />
115
An analysis of spending by location indicates that the most<br />
spending by far occurred at Al Udeid. Two things may explain<br />
this: First, expenditures there include not only those for air base<br />
operations, but also for the Combined Air Operations Center<br />
(CAOC), which relocated from Prince Sultan Air Base (labeled<br />
Category<br />
116<br />
Al Dhafra<br />
Al Jaber<br />
Al Udeid<br />
Ali Al Salem<br />
Camp Snoopy<br />
Masirah<br />
PSAB<br />
Seeb<br />
Shaikh Isa<br />
Thumrait<br />
CAOC<br />
Red Horse<br />
Oct 02 Jan 03 Apr 03 Jul 03 Oct 03 Jan 04 Apr 04 Jul 04<br />
Al Minhad<br />
Amman<br />
Ar Ar<br />
Azraq<br />
King Faisal<br />
Cairo West<br />
Tabuk<br />
JCC Jordan<br />
Baghdad<br />
Kirkuk<br />
Tallil<br />
Balad<br />
Figure 1. Time Lines for Purchasing Activity, by Purchasing Organization<br />
Construction Supplies<br />
Vehicles<br />
Construction Services<br />
Other Heavy Equipment<br />
Force Protection<br />
Food Service<br />
Miscellaneous Equipment<br />
Buildings<br />
Miscellaneous Commodities<br />
Heavy Construction Equipment<br />
Repair/Maintenance Service<br />
Other Repair Parts<br />
Tools<br />
Office Supplies & Equipment<br />
Furniture<br />
Communication Equipment<br />
Water<br />
Morale, Welfare & Recreation<br />
Transportation of Cargo<br />
Computer Equipment<br />
Single Category<br />
Multiple Categories<br />
Oct 04<br />
$0 $10 $20 $30 $40 $50<br />
Millions of Dollars<br />
Figure 2. Obligations for the Top 20 Categories, FY03 and FY04<br />
<strong>No</strong>te: the single category portion of the horizontal bars shows obligations that clearly belonged in only one<br />
category; the multiple categories portion shows obligations for transactions that could also be assigned to<br />
other categories.<br />
PSAB) to Al Udeid during this period. Second, Al Udeid served<br />
as the forward headquarters of the Air Force in Southwest Asia<br />
during both OIF and OEF. Unfortunately, Al Udeid’s and the<br />
CAOC’s contract expenditures were captured only in a separate<br />
financial management system which lacks the necessary<br />
resolution to allow detailed<br />
analysis. 9<br />
What<br />
Deployed CCOs purchased a<br />
variety of products to support OIF<br />
operations during FY 2003<br />
and FY 2004. We created 45<br />
categories of goods and services<br />
and used a computer program to<br />
assign transactions to these<br />
categories based on key words<br />
found in the text descriptions of<br />
the purchases. After categorizing<br />
the transactions as well as<br />
possible, we calculated both the<br />
total obligations per category as<br />
well as the number of transactions<br />
per category. The categories with<br />
the highest total obligations<br />
included construction supplies,<br />
vehicles, construction services,<br />
and other heavy equipment<br />
(see Figure 2). 10 Construction<br />
supplies, miscellaneous<br />
commodities, and office supplies<br />
and equipment represent the<br />
largest number of transactions.<br />
When<br />
Our database also allows analysis<br />
of purchases over time. Figure 3<br />
shows that CCO purchases and<br />
transactions at these purchasing<br />
organizations were higher in FY<br />
2003 than in FY 2004. This could<br />
be associated with the decline in<br />
the number of active bases or any<br />
number of other factors.<br />
We can disaggregate these data<br />
to examine how the level of<br />
expenditures varied over time at<br />
individual bases. Such data can be<br />
used to make comparisons across<br />
locations according to<br />
characteristics such as base<br />
population, types of operational<br />
missions (for example, special<br />
operations, F-16s), existing base<br />
infrastructure, or permanency of<br />
the operating location.<br />
While our database alone<br />
cannot address underlying causes<br />
for the observed differences in<br />
spending patterns across locations<br />
Air Force Journal of <strong>Logistics</strong>
over time, an analyst with<br />
additional information about<br />
characteristics of locations such<br />
as base population, numbers and<br />
types of aircraft, types of missions,<br />
types and maturity of base<br />
infrastructure, geographic<br />
dispersion of facilities, and<br />
Service branch responsible for<br />
base operating support, could<br />
perform more sophisticated<br />
evaluations to determine the<br />
correlation between these factors<br />
and spending patterns over time. 11<br />
The results of such analyses could<br />
be used to make programming<br />
decisions about new bases, plan<br />
transportation requirements,<br />
match CCO resources with user<br />
requirements, and so forth.<br />
How<br />
CCOs have a variety of<br />
instruments with which to make<br />
purchase payments. Our data<br />
allow us to identify two particular<br />
types of instruments for further<br />
analysis: GPCs (essentially<br />
government-issued credit cards)<br />
and BPAs. Here, we compare<br />
purchases made using GPCs to<br />
purchases made through contract<br />
instruments that are recorded in<br />
USCENT<strong>AF</strong> comptroller files. As<br />
shown in Figure 4, GPC purchases<br />
represented more than one-third<br />
of the transactions made in fiscal<br />
years 2003 and 2004 , but they<br />
represented less than one-tenth of<br />
the dollars spent.<br />
Since GPCs are designed for<br />
purchases of small items, such as<br />
office supplies—many of which<br />
can be made over the Internet—<br />
this is an understandable finding.<br />
The dollar amount for the average<br />
Obligated Dollars (millions)<br />
$35<br />
$30<br />
$25<br />
$20<br />
$15<br />
$10<br />
Annual Edition, <strong>Vol</strong>ume XXXIII, Number 1<br />
$5<br />
$0<br />
Oct Oct 02 02<br />
Dec Dec 02 02<br />
Feb Feb 03 03<br />
Apr Apr 03 03<br />
Jun Jun 03 03<br />
Aug Aug 03 03<br />
Oct Oct 03 03<br />
Dec Dec 03 03<br />
Feb Feb 04 04<br />
Apr Apr 04 04<br />
Jun Jun 04 04<br />
Aug Aug 04 04<br />
Month<br />
Number of Transactions<br />
Contract<br />
15,385<br />
contract transaction was about 6 times larger than the amount<br />
for the average GPC transaction.<br />
Although GPCs are intended for the purchase of small items,<br />
it is interesting to note that construction supplies are the largest<br />
category for both GPC and contract transactions. Other contract<br />
transactions were concentrated in construction services and larger<br />
goods, including vehicles and heavy equipment, while GPC<br />
purchases included smaller equipment, tools, and office supplies.<br />
From Whom<br />
Having examined who made what purchases, and when and how<br />
the purchases were made, we now turn to the question of from<br />
whom goods and services were purchased. We examined the top<br />
10 suppliers (in terms of dollars obligated) in fiscal years 2003<br />
Obligated Dollars<br />
Transactions<br />
Figure 3. Obligations and Transactions by Month, FY03 and FY04.<br />
GPC<br />
8,877<br />
Contract<br />
$284.1 M<br />
2,000<br />
1,800<br />
1,600<br />
1,400<br />
1,200<br />
1,000<br />
800<br />
600<br />
400<br />
200<br />
0<br />
GPC<br />
$25.7M<br />
Obligated Dollars<br />
Figure 4. GPC versus Contract Purchases in FY03 and FY04.<br />
and 2004 by all obligations, for contract obligations alone, and<br />
for GPC obligations alone. 12<br />
Based on firm names, the top firms by contract expenditures<br />
appear to be regional firms primarily, whereas GPCs were often<br />
used to make purchases from US firms, presumably over the<br />
Internet. To get a better sense of what percentage of Air Force<br />
CCO purchases were with regional firms, we examined the top<br />
100 firms used in fiscal years 2003 and 2004, which represented<br />
78 percent of the obligations during this period. Of these, 55 were<br />
regional firms. Breaking this out by type of transaction, 59 of<br />
the top 100 firms for contract transactions were regional, while<br />
the number was much smaller for GPC purchases, where only 11<br />
out of 100 were regional.<br />
Number of Transactions<br />
117
Category<br />
118<br />
Construction services<br />
Construction supplies<br />
Force protection<br />
Unknown<br />
Other repair parts<br />
Other<br />
Vehicles<br />
Other heavy equipment<br />
Construction services<br />
Repair/maintenance services<br />
Sewage and portable latrine services<br />
Other<br />
Food service<br />
Construction supplies<br />
Buildings<br />
Other heavy equipment<br />
Hotel services<br />
Other<br />
Other heavy equipment<br />
Construction heavy equipment<br />
Miscellaneous equipment<br />
Water<br />
Laundry services<br />
Other<br />
Vehicles<br />
Construction supplies<br />
Transporting cargo<br />
Repair/maintenance services<br />
Miscellaneous equipment<br />
Other<br />
Millions of Dollars<br />
Firm A<br />
Firm B<br />
Firm C<br />
Firm D<br />
Firm E<br />
Figure 5. Top Five Purchase Categories for the Top Five Suppliers<br />
<strong>No</strong>te: one of the top categories of purchases from firm A consisted of items that our computer program found<br />
difficult to categorize and so placed in the unknown category.<br />
The top-ranked suppliers provided goods and services from a<br />
variety of categories. For each of the top five suppliers in fiscal<br />
years 2003 and 2004 (noted as Firms A through E), Figure 5<br />
displays the top five categories of purchases made through the<br />
supplier (with all other purchases counted in the bar labeled<br />
Other).<br />
Top suppliers worked across multiple locations as well. In<br />
particular, Firm E supplied goods and services not only in Iraq,<br />
but also in Qatar and Oman.<br />
Such detailed information on suppliers’ activities across the<br />
theater can assist CCOs in planning future acquisitions. While<br />
no contracts in our database encompassed more than one<br />
purchasing organization, there may be opportunities for the Air<br />
Force or the Department of Defense to increase leverage with<br />
providers by combining contracts across organizations and<br />
encouraging competition among providers. RAND’s data<br />
analyses of suppliers point to more detailed analyses that could<br />
inform such strategic purchasing decisions.<br />
Implications for Policy Issues<br />
In this section, we use insights from the data and from interviews<br />
we conducted in the course of our research to address issues<br />
related to CCO staffing, CCO training, combat support planning,<br />
and the sharing of lessons within the theater.<br />
CCO Staffing<br />
Lacking hard data for detailed workload analyses, the Air Force<br />
traditionally has used general rules based on perceptions of past<br />
experience to determine how<br />
many contracting officers to<br />
allocate to deployed locations.<br />
This approach can lead to the need<br />
for adjustments after the fact to<br />
reflect real demands on CCOs’<br />
time.<br />
One potentially important use<br />
of our database could be the<br />
systematic assessment of CCO<br />
workloads — measured in dollars<br />
obligated or transactions<br />
executed — across purchasing<br />
organizations. While neither<br />
measure is perfect (some smalldollar<br />
transactions may require<br />
more time and attention than do<br />
some big-dollar transactions),<br />
both measures are potentially<br />
important indicators of CCO time<br />
requirements. Having received<br />
supplemental data from<br />
USCENT<strong>AF</strong> on CCO staffing<br />
for selected purchasing<br />
organizations for FY 2004, we<br />
compared the workload of<br />
contracting officers in terms of<br />
the average number of<br />
transactions per CCO and the<br />
average number of dollars<br />
obligated per CCO.<br />
Our analyses indicate that<br />
there were large differences in<br />
CCO activities across locations during fiscal year 2004. However,<br />
a better understanding of the nature of activities at individual<br />
locations is necessary to draw conclusions. With additional<br />
information on the nature of the work within these<br />
organizations—such as mission activities supported, types of<br />
goods and services purchased, and the number of transactions<br />
completed—statistical analyses such as regressions could be used<br />
to understand the factors associated with these differences.<br />
CCO Training<br />
Anecdotes from our interviews indicate that a number of factors<br />
make contracting in-theater challenging, including differences<br />
in the nature of contingency contracting duties as opposed to<br />
duties of a contracting officer at a nondeployed location,<br />
variation in the contracting environments among countries<br />
within the AOR, the short duration of most deployments for<br />
contracting personnel, 13 and differences in contracting culture<br />
among the military branches operating in a Joint environment.<br />
At first glance, there appears to be abundant guidance<br />
available to CCOs to help mitigate any adverse effects associated<br />
with these challenges, including <strong>AF</strong>FARS Appendix CC for Air<br />
Force contingency contracting support; 14 Air Force Instruction<br />
10-401, Air Force Operations Planning and Execution; 15 the<br />
2003 Air Force <strong>Logistics</strong> <strong>Management</strong> <strong>Agency</strong> contingency<br />
contracting handbook; 16 as well as formal training through the<br />
Defense Acquisition University 17 and predeployment orientation<br />
programs (limited to office chiefs) provided by USCENT<strong>AF</strong><br />
contracting.<br />
Air Force Journal of <strong>Logistics</strong>
However, one officer we interviewed likened learning CCO<br />
procedures from formal training to learning to play golf by<br />
reading the rulebook. In contrast, several people mentioned the<br />
importance of providing deploying CCOs with opportunities to<br />
engage in training simulations (such as Silver Flag exercises 18 )<br />
which present them with scenarios they can expect to encounter<br />
when they go into the AOR.<br />
A database of CCO purchases such as the one RAND<br />
developed (as described above), could supplement classroom<br />
and predeployment training by providing insights into ongoing<br />
activities in the theater. Information could be tailored to locations<br />
where trainees would be deploying. It also could assist in creating<br />
more realistic environments for exercises. In addition, a CCO who<br />
is getting ready to deploy could use the database to prepare by<br />
becoming familiar with the detailed contracting environment at<br />
his or her future location, including the types of purchases made,<br />
the predominant types of contracts used for these purchases, and<br />
the local supply base. Similar data on contracting for other<br />
military branches and coalition partners could be used to better<br />
prepare CCOs who will be operating in a Joint requirements<br />
environment.<br />
Combat Support Planning<br />
Combat support planners are responsible for making sure all of<br />
the resources the Air Force needs to go to war are in place in time<br />
to support contingency operations and associated personnel.<br />
After determining all the necessary resources, planners must make<br />
choices about where to obtain them and how to get them to the<br />
theater to shorten the deployment-to-employment time line,<br />
make the best use of scarce airlift and other transportation<br />
resources, and reduce the military footprint in-theater.<br />
Since one option that planners consider is the availability of<br />
resources in-theater, a motivation for the development of the OIF<br />
CCO database was that such data could be used to improve<br />
combat support planners’ ability to make effective, efficient<br />
trade-offs between purchasing items in-theater and purchasing<br />
them elsewhere and then using scarce transportation resources<br />
to bring them to the theater. In addition, these data can be used<br />
to describe the local supply base for different types of purchases.<br />
The purchase of bottled water in Iraq provides a simple case<br />
study of how a detailed database of CCO purchases can be used<br />
to help assess the trade-offs among options. The US military<br />
required a great deal of bottled water for personnel stationed in<br />
locations supporting OIF during fiscal years 2003 and 2004. Our<br />
database indicates that CCOs in 15 purchasing organizations intheater<br />
purchased bottled water through 38 contracts with more<br />
than 30 suppliers. Alternatively, planners could have elected to<br />
set up contract vehicles for large quantities of water in advance<br />
(or purchase and store the water) and then ship the water to<br />
appropriate locations in-theater as needed. Presumably, such<br />
advance planning would result in a lower cost per liter than CCOs<br />
were able to negotiate in real time during contingency operations.<br />
However, shipments of water into the theater would either delay<br />
the transport of troops and other<br />
supplies or would require the<br />
purchase of additional<br />
transportation. 19<br />
A combat support planner<br />
could use RAND’s database to<br />
determine the best way to meet<br />
Annual Edition, <strong>Vol</strong>ume XXXIII, Number 1<br />
water requirements in-theater during operations. The database<br />
would assist the planner by enabling the assessment of costs<br />
associated with purchasing water in-theater, an analysis of the<br />
amount of airlift required for an alternate approach, and the<br />
identification of any potential effects on the mission.<br />
In addition, data on Joint contracting in-theater, similar to<br />
those analyzed in this article, could be used by the combatant<br />
commands to construct more realistic and detailed contract<br />
support plans. These plans are intended to outline personnel<br />
requirements, organizational structures, and so forth, which will<br />
be used for Joint contingency contracting to support operations<br />
executed by the combatant commands (for example, at what<br />
point contracting should transition from a decentralized, servicespecific<br />
structure to Joint organizations).<br />
Sharing Lessons<br />
The nature of particular requirements and the local environment<br />
may limit the CCOs’ ability to reduce costs. However, awareness<br />
of details of purchases made by other CCOs in the theater should<br />
assist in negotiating better prices where this is possible. For<br />
example, Table 1 shows the maximum, minimum, and average<br />
prices paid per liter of water in fiscal years 2003 and 2004<br />
transactions in our database.<br />
The purchase for Baghdad in Table 1 was for 64 pallets of<br />
bottled water, which under our assumptions, equates to 110,592<br />
half-liter bottles, or 55,296 liters. If the Baghdad CCO had been<br />
able to obtain this water for the price paid at Al Jaber, he or she<br />
would have saved more than $53K. Of course, the majority of<br />
the cost for the Baghdad purchase may be attributable to the<br />
challenges of delivering into that location.<br />
While price information can be a powerful tool for CCOs,<br />
additional information about the relative performance of<br />
suppliers and other factors related to meeting requirements, such<br />
as the urgency, transportation needs, or security threats, would<br />
be helpful in interpreting such comparisons.<br />
Recommendations<br />
In this article, we have described the construction of a database<br />
of CCO purchases supporting Air Force activities in OIF during<br />
fiscal years 2003 and 2004. We have demonstrated how this<br />
database can be a powerful analytic tool to inform and support<br />
policy decisions and initiatives for CCO staffing and training,<br />
combat support planning, and sharing lessons within the theater.<br />
Based on our experience creating the database and analyzing<br />
the CCO data for OIF, we recommend the Air Force (and the<br />
Department of Defense more broadly) establish a standardized<br />
methodology for collecting contingency contracting data on an<br />
ongoing basis to facilitate planning and policy decisions for<br />
future contingencies.<br />
To facilitate the types of analyses illustrated here in a timely<br />
way, the Air Force needs to systematically gather contingency<br />
contracting data on an ongoing basis. To be most useful, the CCO<br />
Category Maximum Minimum Average<br />
Price per liter ($) 1.08 0.12 0.38<br />
Date March 2004 June 2003<br />
Location Baghdad Al Jaber<br />
Table 1. Range of Prices CCOs Paid per Liter of Drinking Water, FY03 and FY04<br />
119
data system must make it possible to quickly access detailed<br />
descriptions of individual transactions, as well as aggregate those<br />
transactions according to categories of purchases, types of<br />
contract vehicles used, locations of purchases, suppliers dealt<br />
with, and so forth.<br />
Table 2 contains our recommendations on the types of data<br />
that would be most useful to collect. These recommendations<br />
encompass data about the transactions themselves, as well as<br />
supplemental information about the activities supported by<br />
individual purchasing organizations and the relevant supply<br />
bases, that would enhance the types of analyses illustrated in this<br />
article and provide a basis for interpreting their results.<br />
We understand the complex and austere conditions in which<br />
CCOs often operate. Additionally, we do not propose to<br />
overburden these hard-working individuals with new reporting<br />
requirements. We do suggest a standardized automated system<br />
for transaction-specific data that could be either virtually<br />
connected to a master database or regularly downloaded into<br />
such a database as a means of recording and cataloging<br />
purchases. 20 Such a system should also include an easy method<br />
both for categorizing purchases across a wide range of<br />
commodities and services and for identifying suppliers in a<br />
TYPE OF DATA EXPLANATION<br />
Individual Transactions Data to be Entered by Purchasing CCO<br />
Purchasing organization Organization that purchases the goods or services<br />
CCO Individual responsible for the transaction<br />
Recipient Organization or location that benefited from the purchase, if different from the<br />
purchasing organization (such as base that benefited from a RED HORSE repair<br />
project)<br />
Text description Description of full range of goods and services purchased through the transaction<br />
Units Number of goods purchased or period of time for which service is to be provided; break<br />
out according to types of goods or services covered within the transaction<br />
Purchase category General class(es) of goods or services purchased; break out according to types of<br />
goods or services covered within the transaction<br />
Price Price paid for the goods and services; when multiple goods and services are purchased<br />
within a single transaction, prices should be broken out by type<br />
Supplier Firm that provides the goods and services<br />
Location of supplier Identifies whether supplier is a local firm, regional firm, or other<br />
Transaction ID Unique identifier for the transaction, such as contract number<br />
Payment mechanism GPC or contract<br />
Type of contract For contracts, type of contract, such as BPA, Form SF44<br />
Date of request Date on which purchasing organization received the formal request for goods and<br />
services<br />
Date of payment Date on which supplier was paid<br />
Date of delivery Date on which goods were delivered or services began<br />
Comments Any explanatory comments CCO deems useful<br />
Activities Supported by<br />
Supplemental Data Needed to Explain Purchasing Trends<br />
Purchasing Organizations<br />
(will vary over time)<br />
Population Number of personnel supported by the purchasing organization<br />
Mission activity Description of mission activity supported by the purchasing organization’s transactions<br />
(number and types of aircraft, special operations)<br />
Responsibility for base operating<br />
Service branch responsible for providing base operating support for the location<br />
support<br />
Infrastructure Number of buildings, acres supported by the purchasing organization<br />
Condition of infrastructure Condition of infrastructure supported by the purchasing organization, particularly for new<br />
locations<br />
Outlook Plans for the purchasing organization (temporary operating location)<br />
Supply base Supplemental data to facilitate improved purchasing over time<br />
Supplier ratings Performance ratings of suppliers (perhaps only key suppliers) based on, for example,<br />
the quality of goods and services, reliability, and ease of working relationship<br />
120<br />
Table 2. Recommended Data to Be Collected on an Ongoing Basis<br />
standardized way. For example, drop-down menus with category<br />
options and supplier name options from which to choose would<br />
make it easier for CCOs to identify these in a consistent manner.<br />
Contingency contracting representatives and logistics planners<br />
should work in concert to develop the database, ensuring that<br />
one standardized system will satisfy the requirements of both<br />
organizations.<br />
The Air Force is in the process of reviewing current contracting<br />
organizations, including those overseas, to determine what future<br />
organizations should look like. In addition, the Air Force is<br />
actively engaged in discussions about how to improve the<br />
effectiveness and efficiency of contracting in a Joint contingency<br />
environment, in which forces from different military branches<br />
are collocated and are operating together. The analytic<br />
capabilities recommended in this article as well as the<br />
corresponding RAND monograph 21 can provide key inputs to<br />
these important organizational and operational decisions.<br />
End <strong>No</strong>tes<br />
1. This article is based on the RAND monograph Contingency Contracting<br />
Purchases for Operation Iraqi Freedom (Unrestricted Version), MG-<br />
559/1-<strong>AF</strong>, 2008. We thank our RAND colleague Mike Neumann for<br />
his help creating this short article.<br />
Air Force Journal of <strong>Logistics</strong>
2. George A. Cahlink, “Send in the Contractors,” Air Force Magazine,<br />
<strong>Vol</strong> 86, <strong>No</strong> 1, [Online] Available: http://www.afa.org/magazine/<br />
jan2003/0103contract.asp, January 2003.<br />
3. Frank Camm and Victoria A. Greenfield, How Should the Army Use<br />
Contractors on the Battlefield? Assessing Comparative Risk in Sourcing<br />
Decisions, Santa Monica, CA: RAND Corporation, MG-296-A, 2005,<br />
[Online] Available: http://www.rand.org/pubs/monographs/MG296,<br />
as of 7 February 2008.<br />
4. Congressional Budget Office, <strong>Logistics</strong> Support for Deployed Military<br />
Forces, Washington, DC, [Online] Available: http://www.cbo.gov/<br />
ftpdocs/67xx/doc6794/10-20-Military<strong>Logistics</strong>Support.pdf, October<br />
2005, as of 7 February 2008.<br />
5. Air Force Federal Acquisition Regulation Supplement, Appendix CC,<br />
paragraph CC-102, 14 March 2007.<br />
6. In most cases, these databases represent all available data on CCO<br />
purchases at the identified locations. However, seven of these<br />
purchasing organizations recorded some or all of their contract<br />
transactions during this period in a centralized electronic database called<br />
the BQ system, rather than in the financial management spreadsheets.<br />
(The BQ system is the US Air Force’s standard base-level general<br />
accounting and finance system. Its structure and use are described in<br />
DFAS [2000].) Although we were given information about the dollar<br />
amount of purchases recorded in BQ, the BQ data do not provide<br />
detailed descriptions of these purchases. In addition, we do not know<br />
the number of transactions associated with the dollars in the BQ system.<br />
Because data for these locations are incomplete, encompassing only<br />
GPC expenditures in some cases, we are unable to include them in<br />
some of the analyses in this article.<br />
7. As part of the process, we reviewed and corrected several variables,<br />
including dates associated with each purchase and information related<br />
to contractors.<br />
8. BPA contracts are used to satisfy anticipated recurring requirements<br />
for goods or services. They are designed to reduce transaction costs<br />
and speed up the procurement process “by establishing charge<br />
accounts with qualified sources of supply” (Air Force Audit <strong>Agency</strong>,<br />
2004). The contracts specify the range of goods and services covered<br />
by the agreement, price lists, total dollar limits, and time limits.<br />
Contracting officers (or other authorized and trained personnel) can<br />
then place calls against those agreements to meet specific user<br />
requirements that fall within the bounds of the agreements.<br />
9. See Footnote 6. In many of the detailed analyses presented in this<br />
article, we exclude seven organizations for which we have only partial<br />
contracting information; those excluded are Al Dhafra, Al Jaber, Al<br />
Udeid, Ali Al Salem, CAOC, Prince Sultan Air Base, and Seeb.<br />
10. In many cases, the description of a purchase clearly fits into only one<br />
category. Other transactions included purchases of more than one<br />
disparate item or items that were ambiguously described and might,<br />
because of the use of key words in the program, fit into more than one<br />
category. For example, the text description might include a laptop<br />
computer (computer equipment) and a printer (office supplies and<br />
equipment), or the purchase may be described as a desk for chapel<br />
which could be interpreted by the computer program as furniture (the<br />
desk) or MWR (the chapel). The single category portion of the<br />
horizontal bars in Figure 2 shows obligations that clearly belonged in<br />
only one category; the multiple categories portion shows obligations<br />
for transactions that could also be assigned to other categories.<br />
11. Such information would need to be dynamic due to the fluid nature<br />
of wartime operations.<br />
12. We cannot list firm names here due to operational security<br />
considerations.<br />
13. Typical deployments increased from 3 months to 4 months during<br />
our data timeframe, fiscal years 2003 and 2004.<br />
14. Air Force Federal Acquisition Regulation Supplement, Appendix CC,<br />
paragraph CC-102.<br />
15. <strong>AF</strong>I 10-401, Air Force Operations Planning and Execution, 25 April<br />
2005.<br />
16. James Roloff, Contingency Contracting: A Handbook for the Air<br />
Force CCO, Maxwell <strong>AF</strong>B, AL: Air Force <strong>Logistics</strong><br />
<strong>Management</strong> <strong>Agency</strong>, February 2003. [Online] Available:<br />
h t t p : / / w w w . a f l m a . h q . a f . m i l / l g j /<br />
contingency%20Contracting%20Mar03_corrections.pdf. In 2007 The<br />
<strong>AF</strong>LMA released new handbook entiled Contingency Contracting: A<br />
Joint Handbook.<br />
Annual Edition, <strong>Vol</strong>ume XXXIII, Number 1<br />
17. Defense Acquisition University, 2006 Defense Acquisition University<br />
Catalog, Ft Belvoir, VA: DAU Press, October 2005.<br />
The course CON 234 (Contingency Contracting) is designed to help<br />
develop “skills for contracting support provided to Joint Forces across<br />
the full spectrum of military operations” (DAU, 2005, 36). The Defense<br />
Acquisition University was updating its contingency contracting<br />
curriculum at the time of our research.<br />
18. GlobalSecurity.org, Silver Flag, [Online] Available: http://<br />
www.globalsecurity.org/military/ops/silver-flag.htm., last updated<br />
August 21, 2005. The Silver Flag exercises provide civil engineers,<br />
services, and other support personnel training on building and<br />
maintaining bare bases in deployed locations.<br />
19. One or more contracts with regional providers that could easily<br />
distribute water to multiple locations would reduce the need for airlift.<br />
20. Since the beginning of our study, USCENT<strong>AF</strong> Contracting and the<br />
USCENT<strong>AF</strong> Comptroller have introduced tools to address some of<br />
the data difficulties encountered in our analyses.<br />
21. Laura H.Baldwin, John A. Ausink, Nancy F. Campbell, John G. Drew,<br />
and Charles Robert Roll, Jr, Contingency Contracting Purchases for<br />
Operation Iraqi Freedom (Unrestricted Version), Santa Monica, CA:<br />
RAND Corporation, MG-559/1-<strong>AF</strong>, 2008.<br />
Laura H. Baldwin, PhD, is a senior economist at The RAND<br />
Corporation. She joined RAND in 1994 after completing a<br />
PhD in economics from Duke University. In 2007, she was<br />
named Director, Resource <strong>Management</strong> within Project Air<br />
Force. Prior to that, she was the associate director.<br />
John Ausink, PhD, is a senior policy researcher who has<br />
been at the RAND Corporation since 1999. He earned a BS<br />
in mathematics and physics from the United States Air Force<br />
Academy, an MS in mathematics from Oxford University, and<br />
a PhD in public policy from Harvard University. In the Air<br />
Force he was an instructor pilot in the T-37, T-41, and T-3A<br />
aircraft and an associate professor of mathematics at the<br />
Air Force Academy.<br />
Nancy F. Campbell is a senior programmer in the RAND<br />
Research Programming Department, providing<br />
programming support to the research staff. She has been at<br />
RAND since 1978. Her education includes a BA in<br />
psychology from the University of California, Los Angeles,<br />
CA. Ms Campbell has experience managing health data and<br />
has created numerous analytical files.<br />
John G. Drew is a senior project associate who has been at<br />
the RAND Corporation since 2002. Mr Drew has over 33<br />
years experience in logistics systems operations,<br />
development, management, and evaluation. At RAND, he<br />
directs and conducts research to evaluate new logistics<br />
concepts, procedures, and systems needed to support the<br />
projection of aerospace power. Mr Drew has spent the last<br />
10 years working projects evaluating how support policy,<br />
practice, and technology options impact the effectiveness<br />
and efficiency of air and space expeditionary forces. He<br />
retired from the Air Force as a chief master sergeant after<br />
27 years of service.<br />
C. Robert Roll, Jr, PhD, was the Director, Resource<br />
<strong>Management</strong> for Project Air Force until 2006. He died in<br />
April 2007. A friend and mentor, he is truly missed.<br />
121
122<br />
Introduction<br />
Most would agree that aircraft maintenance has been and<br />
continues to be a challenging, complex task involving<br />
a delicate balance of resources to include personnel,<br />
equipment, and facilities. This balancing act occurs in a very<br />
hectic environment. The Air Force flies 430 sorties per day in<br />
support of Operation Iraqi Freedom and Enduring Freedom.<br />
A mobility aircraft takes off somewhere in world<br />
approximately every 90 seconds. 1 As the demand for aircraft<br />
continues to grow, the number of airmen who support these<br />
aircraft is declining. “Since 2001 the active duty Air Force has<br />
reduced its end-strength by almost 6 percent but our deployments<br />
have increased by at least 30 percent, primarily in support of the<br />
Global War on Terror.” 2 T his reduction in personnel is part of the<br />
Air Force’s process of drawing down the total force by<br />
approximately 40,000 people, with many of these cuts in aircraft<br />
maintenance career fields. Also adding to the growing<br />
maintenance workload is an aircraft fleet which now averages<br />
almost 24 years old, with the average age still increasing. 3<br />
When it comes to aircraft maintenance, the Air Force depends<br />
on metrics to know whether or not we are measuring up to<br />
standards. Several metrics exist which attempt to measure the<br />
success or failure of our maintainers’ efforts. One of the most<br />
recognized metrics is the total not mission capable maintenance<br />
(TNMCM) rate. Air Force Instruction 21-101 describes TNMCM<br />
as “perhaps the most common and useful metric for determining<br />
if maintenance is being performed quickly and accurately.” 4<br />
Although a lagging type indicator, it is one of several key metrics<br />
followed closely at multiple levels of the Air Force. Over the last<br />
several years, the TNMCM rate for many aircraft gradually<br />
increased. This fact was highlighted during a 2006 quarterly<br />
Chief of Staff of the Air Force Health of the Fleet review. Followon<br />
discussions ultimately resulted in the Air Force Materiel<br />
Command Director of <strong>Logistics</strong> (<strong>AF</strong>MC/A4) requesting the Air<br />
Force <strong>Logistics</strong> <strong>Management</strong> <strong>Agency</strong> (<strong>AF</strong>LMA) to conduct an<br />
analysis of TNMCM performance with the C-5 Galaxy aircraft<br />
as the focus. <strong>AF</strong>LMA conducted two studies in support of this<br />
request.<br />
Background<br />
The C-5 TNMCM Study II (<strong>AF</strong>LMA project number<br />
LM200625500) included five objectives. One of those<br />
objectives was to determine root causes of increasing TNMCM<br />
rates for the C-5 fleet. An extensive, repeatable methodology was<br />
developed and utilized to scope an original list of 184 factors<br />
down to two potential root causes to analyze in-depth for that<br />
particular study. These two factors were aligning maintenance<br />
capacity with demand, and the logistics departure reliability<br />
versus TNMCM paradigm. To address the root cause factor of<br />
aligning maintenance capacity with demand, a method of<br />
determining available maintenance capacity was needed. To<br />
meet this objective, a new factor designated as net effective<br />
personnel (NEP) was developed. NEP articulates available<br />
maintenance capacity in a more detailed manner that goes<br />
Air Force Journal of <strong>Logistics</strong>
Annual Edition, <strong>Vol</strong>ume XXXIII, Number 1<br />
Jeremy A. Howe, Whirlpool Corporation<br />
Benjamin A. Thoele, FitWit Foundation<br />
Scotty A. Pendley, Captain, US<strong>AF</strong>, <strong>AF</strong>LMA<br />
Anthony F. Antoline, Major, US<strong>AF</strong>, <strong>AF</strong>LMA<br />
Roger D. Golden, DPA, <strong>AF</strong>LMA<br />
123
Ultimately, the NEP methodology<br />
has the potential to be used alone<br />
or in conjunction with the <strong>Logistics</strong><br />
Composite Model to better<br />
portray maintenance personnel<br />
requirements and capabilities<br />
based on experience and skill<br />
levels.<br />
“Beyond Authorized Versus Assigned: Aircraft<br />
Maintenance Personnel Capacity” quantifies the<br />
phrase “we need more people” beyond the<br />
traditional metric of authorized versus assigned<br />
personnel. The article is based on work done for<br />
a recent Air Force <strong>Logistics</strong> <strong>Management</strong> <strong>Agency</strong><br />
project—C-5 TNMCM Study II. During this project,<br />
an extensive, repeatable methodology was<br />
developed and utilized to scope an original list of<br />
184 factors down to two potential root causes.<br />
These two factors were aligning maintenance<br />
capacity with demand, and the logistics departure<br />
reliability versus TNMCM paradigm. To address<br />
the root cause factor of aligning maintenance<br />
capacity with demand, a method of determining<br />
available maintenance capacity was needed. To<br />
meet this need, a new factor designated as net<br />
effective personnel (NEP) was developed. NEP<br />
articulates available maintenance capacity in a<br />
more detailed manner that goes beyond the<br />
traditional authorized versus assigned viewpoint.<br />
The article describes how the NEP calculations<br />
were developed during the C-5 TNMCM Study II.<br />
The NEP calculations were ultimately used in<br />
conjunction with historical demand to propose<br />
base-level maintenance capacity realignments<br />
resulting in projected improvements in the C-5<br />
TNMCM rate.<br />
The ratio between authorized and assigned<br />
personnel is typically used to quantify personnel<br />
availability. While this ratio is an indicator of<br />
maintenance capacity, it provides only a limited<br />
124<br />
beyond the traditional authorized versus assigned personnel<br />
viewpoint. The remainder of this article describes the need for<br />
NEP and how the NEP calculations were developed during the<br />
C-5 TNMCM Study II. The NEP calculations were ultimately<br />
used in conjunction with historical demand to propose base-level<br />
maintenance capacity realignments resulting in projected<br />
improvements in the C-5 TNMCM rate.<br />
Personnel as a Constraint<br />
The analytical methodology applied to the C-5 maintenance<br />
system determined that personnel availability was an important<br />
factor to consider. This idea is not new; indeed, the force-shaping<br />
measures underway in the Air Force have brought the reality of<br />
constrained personnel resources to the forefront of every airman’s<br />
mind. Without exception, maintenance group leadership (MXG)<br />
at each base visited during the C-5 TNMCM Study II considered<br />
personnel to be one of the leading constraints in reducing not<br />
mission capable maintenance hours. The study team heard the<br />
phrase “we need more people” from nearly every shop visited:<br />
“The biggest problem for the maintainers here is a shortage<br />
of people.” 5<br />
“With more people we could get a higher MC [mission<br />
capable]. We’re currently just scrambling to meet the flying<br />
schedule.” 6<br />
“Hard-broke tails and tails in ISO [isochronal inspection]<br />
get less priority than the flyers. We run out of people—we<br />
physically run out.” 7<br />
The Air Force defines total maintenance requirements<br />
(authorizations) on the basis of the <strong>Logistics</strong> Composite Model<br />
(LCOM) and current manpower standards. LCOM is a stochastic,<br />
discrete-event simulation which relies on probabilities and<br />
random number generators to model scenarios in a maintenance<br />
unit and estimate optimal manpower levels through an iterative<br />
process. The LCOM was created in the late 1960s through a joint<br />
effort of RAND and the Air Force <strong>Logistics</strong> Command. Though<br />
intended to examine the interaction of multiple logistics resource<br />
factors, LCOM’s most important use became establishing<br />
maintenance manpower requirements. LCOM’s utility lies in<br />
defining appropriate production levels, but it does not<br />
differentiate experience. 8 Once these requirements are defined,<br />
the manpower community divides these requirements among the<br />
various skill levels as part of the programming process. Overall,<br />
the manpower office is charged with determining the number of<br />
slots, or spaces, for each skill level needed to meet the units’ tasks.<br />
The personnel side then finds the right faces, or people, to fill<br />
the spaces.<br />
One measure historically used to quantify personnel<br />
availability is the ratio between authorized and assigned<br />
personnel. While this ratio is an indicator of maintenance<br />
capacity, it provides only a limited amount of information.<br />
Authorized versus assigned ratios do not take into account the<br />
abilities and skill levels of the maintenance personnel, nor does<br />
it factor in the availability of the personnel on a day-to-day<br />
basis. These issues were addressed in the C-5 TNMCM Study II<br />
by quantifying “we need more people” beyond the traditional<br />
metric of authorized versus assigned personnel. This capacity<br />
Air Force Journal of <strong>Logistics</strong>
quantification was done as part of the larger effort of aligning<br />
capacity with demand. The process of capacity planning generally<br />
follows three steps:<br />
Determine available capacity over a given time period<br />
Determine the required capacity to support the workload<br />
(demand) over the same time period<br />
Align the capacity with the demand9 The following describes how the study team pursued step 1,<br />
determining available capacity over a given time period, using data<br />
from the 436 MXG at Dover Air Force Base (<strong>AF</strong>B) and<br />
characterizing the results in terms of what the study team denoted<br />
as NEP.<br />
Determining Available Capacity<br />
When personnel availability and capacity are discussed at the<br />
organizational level, typically the phrase authorized versus<br />
assigned personnel is used. However, are all people assigned to<br />
maintenance organizations—namely, an aircraft maintenance<br />
squadron (AMXS) or a maintenance squadron (MXS)—viable<br />
resources in the repair process? Most maintainers will answer no.<br />
While it is true that all assigned personnel serve a defined and<br />
important purpose, not everyone in these organizations is a totally<br />
viable resource to be applied against maintenance demand. This<br />
impacts maintenance repair time and aircraft availability.<br />
TNMCM time begins and ends when a production<br />
superintendent advises the maintenance operations center to<br />
change the status of an aircraft. The length of that time interval is<br />
determined by several things. One factor is the speed of technicians<br />
executing the repair, which includes diagnosis, corrective action,<br />
and testing (illustrated in Figure 1) the repair node of Hecht’s<br />
restore-to-service process model.<br />
As illustrated by the Hecht process model, there are other<br />
important components required to return an aircraft to service, but<br />
the pool of manpower resources required to support the repair node<br />
is critically linked to TNMCM time. Within a mobility aircraft<br />
maintenance organization, this pool represents hands-on 2AXXX<br />
technicians whose primary duty is performing aircraft maintenance.<br />
Specifically, the study team defined the technician resource pool<br />
as follows:<br />
Technicians: the collective pool of airmen having a 2AXXX <strong>AF</strong>SC,<br />
that are 3-level or 5-level maintainers, or nonmanager 7-level<br />
maintainers whose primary duty is the hands-on maintenance of aircraft<br />
and aircraft components.<br />
The distinction of nonmanager 7-levels generally reflects 7levels<br />
in the grades of E-5 and E-6. In active duty units, 7-levels in<br />
the grade of E-7 do not typically perform hands-on aircraft<br />
maintenance, but are instead directors of resources and processes—<br />
they are managers. 11 This is in stark contrast to Air National Guard<br />
units, where 2AXXX personnel in the senior noncommissioned<br />
officer ranks routinely perform wrench-turning, hands-on<br />
maintenance. 12 For the research detailed in the C-5 TNMCM Study<br />
II, personnel analysis centered on data from the 436 MXG at Dover<br />
<strong>AF</strong>B and utilized the study team’s definition of technicians.<br />
Net Effective Personnel<br />
Authorized versus assigned personnel figures usually quantify the<br />
entire unit. With the definition of technicians in mind, it is<br />
Annual Edition, <strong>Vol</strong>ume XXXIII, Number 1<br />
amount of information. These ratios do not take<br />
into account the abilities and skill levels of the<br />
maintenance personnel, nor does it factor in the<br />
availability of the personnel on a day-to-day<br />
basis. The NEP methodology described in the<br />
article is a repeatable process which produces<br />
data that provides leadership with a better<br />
representation of the personnel resources and<br />
actual capacity available to an Air Force aircraft<br />
maintenance organization on a day-to-day<br />
basis. The NEP methodology will be tested<br />
further and validated using personnel data from<br />
other units to verify similar results and potential<br />
gains. Ultimately, the NEP methodology has the<br />
potential to be used alone or in conjunction with<br />
the <strong>Logistics</strong> Composite Model to better portray<br />
maintenance personnel requirements and<br />
capabilities based on experience and skill<br />
levels.<br />
This is the first in a three-part series of articles<br />
that examine C-5 TNMCM rates.<br />
Article Acronyms<br />
<strong>AF</strong>B – Air Force Base<br />
<strong>AF</strong>LMA – Air Force <strong>Logistics</strong> <strong>Management</strong><br />
<strong>Agency</strong><br />
<strong>AF</strong>SC – Air Force Specialty Code<br />
AMXS – Aircraft Maintenance Squadron<br />
ANGB – Air National Guard Base<br />
APG – Aerospace and Powerplant General<br />
CBT – Computer-Based Training<br />
CMS – Component Maintenance Squadron<br />
EMS – Equipment Maintenance Squadron<br />
ETCA – Education and Training Course<br />
Announcement<br />
LCOM – <strong>Logistics</strong> Composite Model<br />
MXG – Maintenance Group<br />
MXS – Maintenance Squadron<br />
NEP – Net Effective Personnel<br />
TDY – Temporary Duty<br />
TNMCM – Total <strong>No</strong>t Mission Capable<br />
Maintenance<br />
125
Technician Category Productivity Factor<br />
<strong>No</strong>n-manager 7-levels 100%<br />
<strong>No</strong>n-manager 7-level trainers 85%<br />
5-levels 100%<br />
5-level trainers 85%<br />
3-levels 40%<br />
important to consider three additional factors that introduce<br />
variability into the personnel resource pool. These factors are:<br />
126<br />
Table 1. Productivity Factors 15<br />
Skill-level productivity<br />
Ancillary and computer-based training (CBT)<br />
Availability<br />
The study team examined the influence of these three factors,<br />
as well as their impact on the viable resource pool for the 436<br />
MXG. This collective impact yielded a new resource pool<br />
representing a depiction of effective capacity rather than just the<br />
authorized versus assigned ratio. Again, this new resource pool<br />
is denoted as Net Effective Personnel, or NEP.<br />
Factor 1: Skill-Level Productivity<br />
In order to accurately examine the quantitative adequacy of a<br />
resource, as well as how a resource has historically been used to<br />
meet demand, there must be parity among individual resource<br />
units. Consider the previous definition of technicians. If one were<br />
to select two people at random, would they be equally capable<br />
resources? <strong>No</strong>t necessarily, if one was a 3-level trainee and the<br />
other was a 5 or 7-level resource. In order to collectively examine<br />
people in terms of comparable resources, and to account for the<br />
skill-level variability in typical aircraft maintenance<br />
organizations, productivity factors were applied to the resource<br />
pool.<br />
As part of this research effort, the study team utilized its<br />
strategic partnership with RAND Project Air Force. Through<br />
personal interviews with RAND personnel and review of recently<br />
Figure 1. Time to Restore Service Process Model 10<br />
published RAND research, the study team learned that RAND<br />
had explored the productivity of trainees and trainers in aircraft<br />
maintenance units. Trainees were defined as 3-levels, who are<br />
not as productive as 5- and 7-levels. Additionally, some 5- and<br />
7-levels were not as productive as others because they spend time<br />
training and instructing 3-level personnel. 13 In terms of specific<br />
productivity based on RAND research, 3-levels were estimated<br />
to be 40 percent productive, 5-level trainers and nonmanager 7level<br />
trainers were estimated to be 85 percent productive, and 5levels<br />
and nonmanager 7-levels were 100 percent productive if<br />
they were unencumbered with training responsibilities. 14 For the<br />
purpose of this analysis, the number of trainers was considered<br />
to be equal to the number of 3-levels assigned—a one-to-one<br />
ratio. The productivity factors for the viable resource pool are<br />
summarized in Table 1.<br />
These productivity factors also are similar to results from<br />
additional RAND research at Travis <strong>AF</strong>B published in 2002. 16<br />
Considering the productivity factors from Table 1, the net effect<br />
of these productivity factors alone was a reduction of the 436<br />
AMXS viable resource pool by an average of 5.68 percent. 17<br />
Factor 2: Ancillary Training and Computer-Based<br />
Training<br />
In recent times the impact of ancillary training and CBT has been<br />
such an important issue for Air Force senior leaders, that it was<br />
the sole topic of the airman’s Roll Call of 9 February 2007. 18 This<br />
document indicated that some active duty airmen spend<br />
disproportionate amounts of time on ancillary training, which<br />
detracts from their ability to perform official duties. Moreover,<br />
the document suggested that some ancillary training may no<br />
longer be relevant. 19 In the context of the viable pool of aircraft<br />
maintenance technicians, this would mean that, some of the time,<br />
personnel resources may be on duty but unavailable to perform<br />
hands-on maintenance due to an ancillary training requirement.<br />
A consensus majority of personnel interviewed during the<br />
study team’s site visits echoed these concerns, describing an<br />
insidious growth of new training requirements in recent years. 20<br />
Air Force Journal of <strong>Logistics</strong>
An additional concern voiced by interviewees pertained to<br />
computer resources. Interviewees described a situation where<br />
office workers have ready access to a personal computer (PC),<br />
but dozens of maintenance technicians often share only a handful<br />
of communal PCs. Consequently, their ability to complete<br />
computer-based ancillary training is constrained. One unit<br />
training manager explained that in the past, a group training<br />
briefing would be conducted for an entire work center, fulfilling<br />
each individual’s training requirement simultaneously. 21 Today,<br />
an online course issues the required certificate of completion for<br />
only one individual, thereby necessitating that each airman<br />
conduct the training individually. The net result is more time<br />
away from primary duties (for example, repairing aircraft). In order<br />
to assess the influence of ancillary training and CBT on the<br />
technician resource pool, the study team quantified the average<br />
daily impact.<br />
A list of various ancillary and computer-based training items<br />
that are applicable to the relevant pool of aircraft maintenance<br />
personnel was collected from three data sources:<br />
The US<strong>AF</strong> Education and Training Course Announcement<br />
(ETCA) Web site22 The unit training monitor at the <strong>AF</strong>LMA<br />
The unit training monitor for the 105 MXG at Stewart Air<br />
National Guard Base (ANGB)<br />
The training was categorized by data source, course number<br />
(if applicable), and course name. Training was also categorized<br />
as follows.<br />
Mandatory for all personnel, such as law of armed conflict<br />
training<br />
<strong>Vol</strong>untary or job-specific, such as hazardous material<br />
management training<br />
Also, requirements were identified by the recurrence frequency<br />
(one-time, annual, or semiannual). Some requirements are aligned<br />
with the 15-month aerospace expeditionary force cycle; this<br />
would equate to a yearly recurrence frequency of 0.8 (12/15).<br />
Finally, training was categorized by the duration in hours for each<br />
requirement as identified by the data sources.<br />
Most training courses only take up a portion of the duty day.<br />
The average duration for courses considered was 2.8 hours, with<br />
many listed at one hour or less. In situations like these, a manager<br />
would still view the individual as available for the duty day. 23<br />
Therefore, the study team examined the impact of CBT and<br />
ancillary training as a separate factor and not as a part of the<br />
availability factor (factor 3). Final calculations resulted in the<br />
following totals:<br />
Hours of mandatory one-time training (denoted M o ), 101.5<br />
hours<br />
Annual Edition, <strong>Vol</strong>ume XXXIII, Number 1<br />
Hours of mandatory annually-recurring training (M ), 67.2<br />
a<br />
hours<br />
<strong>Vol</strong>untary or job-specific one-time training (VJS ), 85.8 hours<br />
o<br />
<strong>Vol</strong>untary or job-specific annually-recurring training (VJS ), a<br />
10.3 hours<br />
In order to quantify the daily impact of these training items,<br />
the study team made the following assumptions:<br />
An 8-hour workday<br />
220 workdays in a calendar year. (5 days per week x 52 weeks<br />
per year) = 260; 260 – (30 days annual leave) – (10 federal<br />
holidays24 ) = 220 workdays<br />
3-levels required all of the mandatory, one-time training<br />
5-levels and 7-levels required only the annually-recurring<br />
portion of the mandatory training<br />
As an average, all 3-levels required 10 percent of the voluntary<br />
or job-specific, one-time training<br />
As an average, all 5-levels and 7-levels required 10 percent<br />
of the voluntary or job-specific, one-time, annually-recurring<br />
training<br />
As an average, all training durations would be increased 20<br />
percent to account for travel, setup, and preparation25 When employing the above assumptions, the figures in Table<br />
2 were calculated to be best estimates of the time impact of<br />
ancillary training and CBT.<br />
The best estimates for CBT and ancillary training<br />
requirements account for 7.51 percent and 5.24 percent of the<br />
workday for 3-, 5-, and 7-levels, respectively. The complementary<br />
effectiveness rates for this factor are expressed as 0.9249 (1 –<br />
0.0751) for 3-levels and 0.9476 (1 – 0.0524) for 5 and 7-levels.<br />
These rates are listed as the ancillary and CBT factors for 3-, 7-,<br />
and 5-levels respectively in Table 6.<br />
Table 3 illustrates how these rates change when the<br />
percentages of voluntary and job-specific training (V/JST) or the<br />
percentage of travel and setup buffer are varied. The matrices in<br />
Table 3 illustrate the results of sensitivity analysis of various CBT<br />
and ancillary training factors that would result for combinations<br />
of voluntary or job-specific training, or travel and setup buffer<br />
ranging from zero to 25 percent. The range of all calculated<br />
factors is approximately 3 percent for both technician categories.<br />
<strong>No</strong>te that the CBT and ancillary training factors chosen utilizing<br />
the study team’s assumptions are boxed and shaded. For both 3-,<br />
5-, and 7-levels, the calculated training factors fall very near the<br />
mean developed in the sensitivity analysis. Some values shown<br />
in Table 3 are the result of rounding. For the 436 MXG at Dover<br />
<strong>AF</strong>B, the net effect of these CBT and ancillary training factors<br />
alone was a reduction of the viable resource pool by an average<br />
of 1.58 percent. 26<br />
Technician Hours per Year<br />
Hours per<br />
Workday<br />
Percentage of 8-Hour<br />
Workday<br />
Minutes per<br />
Workday<br />
3-level 1<strong>32</strong>.10 0.60 7.51% 36.03<br />
Formula 1.2(M +(0.1VJS )) o o (Hrs/yr)/220 (Hrs/workday/8)*100 (Hrs/workday)*60<br />
5- / 7-level 92.17 0.42 5.24% 25.1<br />
Formula 1.2(M +(0.1(VJS +VJS )) a o a (Hrs/yr)/220 (Hrs/workday/8)*100 (Hrs/workday)*60<br />
Table 2. Best Estimate of CBT and Ancillary Training Time Requirements<br />
127
3-Levels<br />
% Travel/Setup Multiplier<br />
% V/JST 1 1.05 1.1 1.15 1.2 1.25<br />
0.00 0.942 0.939 0.937 0.934 0.931 0.928<br />
0.05 0.940 0.937 0.934 0.931 0.928 0.925<br />
0.10 0.937 0.934 0.931 0.928 0.925 0.922<br />
0.15 0.935 0.9<strong>32</strong> 0.929 0.925 0.922 0.919<br />
0.20 0.933 0.929 0.926 0.922 0.919 0.916<br />
0.25 0.930 0.927 0.923 0.920 0.916 0.913<br />
5- and 7-Levels<br />
% Travel/Setup Multiplier<br />
% V/JST 1 1.05 1.1 1.15 1.2 1.25<br />
0.00 0.962 0.960 0.958 0.956 0.954 0.952<br />
0.05 0.959 0.957 0.955 0.953 0.951 0.949<br />
0.10 0.956 0.954 0.952 0.950 0.948 0.945<br />
0.15 0.954 0.951 0.949 0.947 0.944 0.942<br />
0.20 0.951 0.948 0.946 0.944 0.941 0.939<br />
0.25 0.948 0.946 0.943 0.940 0.938 0.935<br />
Descriptive Statistics<br />
Mean Min Max Range<br />
3-Level 0.928 0.913 0.942 0.030<br />
5- and 7-Level 0.949 0.935 0.962 0.027<br />
Reason Unavailable<br />
Factor 3: Availability<br />
Manpower resources must be present to be viable, and on any<br />
given day, aircraft maintenance organizations lose manpower<br />
resources due to nonavailability. Examples include temporary<br />
duty (TDY) assignments, sick days, and other details. To<br />
illustrate, Figure 2 depicts the actual availability of 436 AMXS<br />
airframe and powerplant general (APG) technicians on day shift<br />
for Thursday, April 12, 2007. For this work center, on this<br />
particular day and shift, roughly 65 percent of assigned<br />
technicians were not available for the various reasons listed.<br />
Much like aircraft maintenance, some events that take people<br />
away from the available pool are scheduled and known well in<br />
128<br />
Table 3. CBT and Ancillary Training Factor Sensitivity Analysis<br />
3-Level 5-Level 7-Level Total % of Total<br />
Assigned <strong>32</strong> 28 22 82 100%<br />
Temporary Duty 6 4 10 12%<br />
Qualification and Training Program 9 9 11%<br />
Detail 2 3 2 7 9%<br />
Leave 2 3 2 7 9%<br />
Scheduled Off Day 2 1 2 5 6%<br />
Medical Profile 2 1 3 4%<br />
Part-day Appointment 1 1 1 3 4%<br />
Full-day Appointment 2 2 2%<br />
Compensatory Off Day 1 1 1%<br />
Flying Crew Chief Mission 1 1 1%<br />
Out Processing 1 1 1%<br />
Permanent Change of Assignment 1 1 1%<br />
Field Training Detachment Course 1 1 1%<br />
First Term Airmen’s Center 1 1 1%<br />
Bay Orderly 1 1 1%<br />
Available 14 8 7 29 35%<br />
Figure 2. 436 AMXS APG Day Shift Personnel Availability Snapshot 27<br />
advance, while others are unexpected, such as illnesses and family<br />
emergencies.<br />
Although scheduled and unscheduled events both have an<br />
impact, scheduled events are anticipated and can be planned for.<br />
Adjustments can be made and resources can be shifted.<br />
Consequently, resource managers want to monitor and manage<br />
scheduled personnel nonavailability to the greatest extent<br />
possible. In order to assess the impact of this factor on the resource<br />
pool, the study team monitored the personnel availability of the<br />
436 AMXS at Dover <strong>AF</strong>B from 1 March through 30 April 2007<br />
via 9 weekly snapshots. 436 AMXS supervision tracks manpower<br />
via a spreadsheet tool that identifies the availability status of<br />
Air Force Journal of <strong>Logistics</strong>
each assigned 3-level, 5-level, and nonmanager 7-level in their<br />
hands-on maintenance resource pool. For AMXS, this represents<br />
technicians from six different shops, identified with the<br />
corresponding Air Force specialty codes (<strong>AF</strong>SC) as follows:<br />
Airframe and Powerplant General (APG) – 2A5X1C, 2A5X1J<br />
Communication and Navigation (C/N) – 2A5X3A<br />
Electro/Environmental Systems (ELEN) – 2A6X6<br />
Guidance and Control (G/C) 28 – 2A5X3B<br />
Hydraulics (HYD) – 2A6X5<br />
Engines (JETS) – 2A6X1C, 2A6X1A<br />
The AMXS snapshot spreadsheet is updated (but overwritten)<br />
continually as status changes occur. 29 By monitoring changes<br />
in these snapshots, the study team was able to examine not only<br />
the impact of personnel nonavailability in aggregate, but also<br />
the degree to which the discovery and documentation of events<br />
altered the size of the capacity pool. Using the Dover AMXS<br />
snapshots, the study team calculated the number of available<br />
technicians in the aircraft maintenance resource pool.<br />
The study team monitored the actual availability figures for<br />
the 436 AMXS over the 9-week period of March and April 2007,<br />
for a total of n = 61 daily observations. Across all shifts, the total<br />
number of personnel assigned to the AMXS personnel resource<br />
pool was 411 for the month of March, and 412 for the month of<br />
April. Actual availability figures, however, were much lower.<br />
Table 4 summarizes the descriptive statistics of this analysis.<br />
The upper row of Table 4 statistics reflects the actual number<br />
of technicians available, while the bottom row reflects that<br />
number as a percentage relative to the total number of technicians<br />
assigned. For example, in the month of March, the maximum<br />
number of available technicians observed was 202, or 49 percent<br />
(202 of 411) of the total assigned. The mean availability for March<br />
was 36 percent. These figures take into consideration that some<br />
of the nonavailable personnel may be performing duties<br />
Annual Edition, <strong>Vol</strong>ume XXXIII, Number 1<br />
elsewhere for the Air Force such as flying crew chief missions or<br />
other TDY assignments. Therefore, they would not be viable<br />
assets for the aircraft maintenance resource pool at Dover <strong>AF</strong>B.<br />
The net effect of this nonavailability factor was a reduction of<br />
the AMXS home station viable resource pool by an average of<br />
65.39 percent. This is reflected as the 35 percent mean<br />
highlighted for March-April 2007.<br />
As discussed previously with Factors 1 and 2, the productivity<br />
of available technicians is reduced due to skill-level training<br />
needs, as well as ancillary and CBT training requirements. The<br />
study team applied productivity factors from Table 1 and CBT<br />
and ancillary training factors from Table 2 to the observed<br />
number of available technicians in AMXS. These calculations<br />
quantified the final pool of viable personnel resources, which is<br />
denoted as NEP. Because of daily variations in the number of 3-,<br />
5-, and 7-skill level technicians available, the factors were<br />
applied to each daily observation. In performing these<br />
calculations, the study team developed a representation of the<br />
effective personnel resource pool. Specifically, the NEP figures<br />
account for the realities of availability and productivity, and<br />
allow the resource pool to be viewed objectively, unconstrained<br />
by concerns such as skill-level differences. The value of such a<br />
resource picture is that it provides a suitable mechanism for<br />
comparing maintenance capacity (NEP resource pool) with<br />
maintenance demand. The summary descriptive statistics for the<br />
436 AMXS NEP are indicated in Table 5. Averaging across the<br />
observed timeframe, the 436 AMXS had approximately 113 net<br />
effective technicians in its viable resource pool on any given<br />
day. This figure is approximately 27 percent of the total assigned<br />
quantity of technicians, again using the previously discussed<br />
definition for technicians.<br />
Therefore, to arrive at the results shown in Table 5, the study<br />
team considered the factors from Table 1 and 2, as well as the<br />
ancillary and CBT factors complimentary effectiveness rates<br />
calculated.<br />
411 Assigned<br />
Min<br />
March 07<br />
Max Mean Range Min<br />
April 07<br />
Max Mean Range Min<br />
March-April 07<br />
Max Mean Range<br />
Available 100 202 147 102 104 163 137 59 100 202 142 102<br />
% of Assigned 24% 49% 36% 25% 25% 40% 33% 14% 24% 49% 35% 25%<br />
Table 4. 436 AMXS Availability Descriptive Statistics<br />
411 Assigned<br />
Min<br />
March 07<br />
Max Mean Range Min<br />
April 07<br />
Max Mean Range Min<br />
March-April 07<br />
Max Mean Range<br />
Available 79 167 120 88 77 124 105 47 77 167 113 90<br />
% of Assigned 19% 41% 29% 21% 19% 30% 26% 11% 19% 41% 27% 22%<br />
Table 5. 436 AMXS NEP Descriptive Statistics<br />
Factor Description Value<br />
T 75 Ancillary/CBT Factor for 7- and 5-levels 0.948<br />
A 75NT The number of available nonmanager 7-levels and 5-levels who are not trainers Varies day-to-day<br />
P t Trainer Productivity 0.85<br />
A 75T The number of available nonmanager 7-levels and 5-levels who are trainers Varies day-to-day<br />
T 3 Ancillary/CBT Factor for 3-levels 0.925<br />
P e Trainee Productivity 0.4<br />
A 3 The number of available 3-levels Varies day-to-day<br />
Table 6. NEP Factors<br />
129
Each factor and rate detailed to this point was assigned a new<br />
designation for ease of use in the proposed NEP equation. The<br />
newly designated factors, factor descriptions, and the associated<br />
values are listed in Table 6.<br />
The T factors relate to training, the A factors relate to available<br />
personnel, and the P factors relate to productivity. These factors<br />
were applied to the number of available technicians as recorded<br />
in the AMXS availability snapshots using the newly proposed<br />
NEP calculation, shown as Equation 1. Equation 1 is the<br />
cumulative NEP equation which accounts for all three factors<br />
which create variability in the resource pool and yields a<br />
numerical quantity of net effective personnel. To determine the<br />
NEP percentage, one need simply divide the right side of the<br />
equation by the number of assigned technicians (7-level<br />
nonmanagers, 5-levels, and 3-levels).<br />
Figure 3 provides an Excel spreadsheet snapshot of an example<br />
NEP calculation for a generic maintenance unit. The<br />
maintenance unit’s NEP is calculated using Equation 1 by<br />
entering the personnel totals in each of the five categories in the<br />
left column. These values are then multiplied by the factors in<br />
the right column to determine NEP. In this example, the unit has<br />
104 technicians available but the NEP is only 77. In other words,<br />
the practical available maintenance capacity is only 77<br />
technicians, not 104 as it initially appears.<br />
130<br />
# of available 3-levels<br />
# of available 5-levels<br />
who are trainers<br />
# of available 5-levels<br />
who are not trainers<br />
# of available nonmanager<br />
7-levels who<br />
are trainers<br />
# of available nonmanager<br />
7-levels who<br />
are not trainers<br />
NEP<br />
30<br />
30<br />
<strong>32</strong><br />
0<br />
12<br />
Equation 1. Net Effective Personnel<br />
CBT Factor (3-levels)<br />
CBT Factor (5/7-levels)<br />
Productivity Factor<br />
(trainees)<br />
Productivity Factor<br />
(trainers)<br />
77.0<br />
Figure 3. Example NEP Calculation<br />
To summarize, the study team’s arrival at NEP followed an<br />
iterative sequence of three factor reductions:<br />
Skill-level productivity differences, to include those for<br />
trainees and trainers<br />
Ancillary training and CBT<br />
The nonavailability of personnel<br />
Figure 4 graphically illustrates these iterations based on the<br />
relative size of the impact of the three factors on reductions to<br />
the overall resource pool. As shown in Figure 4, nonavailability<br />
had the biggest impact, productivity factors were next, and<br />
finally the effect of CBT and ancillary training had the smallest<br />
impact.<br />
In addition to AMXS, an Air Force Maintenance Group<br />
usually includes a separate equipment maintenance squadron<br />
(EMS) and component maintenance squadron (CMS). However,<br />
if total authorizations are under 700, EMS and CMS will be<br />
combined into a maintenance squadron such as the MXS at Dover<br />
<strong>AF</strong>B. Various flights within a typical MXS maintain aerospace<br />
ground equipment, munitions, off-equipment aircraft and support<br />
equipment components; perform on-equipment maintenance of<br />
aircraft and fabrication of parts; and provide repair and calibration<br />
of test, measurement, and diagnostic equipment. 30 Technicians<br />
assigned to MXS usually perform maintenance not explicitly<br />
0.925<br />
0.948<br />
0.400<br />
0.850<br />
linked to the launch and<br />
recovery of aircraft (as is the<br />
focus of AMXS). However, some<br />
MXS personnel directly support<br />
flight line activities.<br />
A more complete<br />
representation of the net<br />
effective personnel pool for<br />
aircraft maintenance resources in<br />
an MXG would include not only<br />
personnel in AMXS, but also<br />
those in MXS. The number of<br />
nonmanager 7-levels, 5-levels,<br />
and 3-levels assigned to the 436<br />
MXS was determined from Air<br />
Force Personnel Center data to be<br />
318. 31 Using the study team’s<br />
definition of technician, this<br />
results in 729 technicians in the<br />
436 MXG (411 in AMXS plus<br />
318 in MXS). However, because<br />
the study team could not obtain<br />
exact daily availability figures<br />
for MXS similar to those of<br />
AMXS, the study team<br />
applied each of the calculated<br />
daily NEP percentages for<br />
AMXS against the number of<br />
Air Force Journal of <strong>Logistics</strong>
Annual Edition, <strong>Vol</strong>ume XXXIII, Number 1<br />
Assigned I1 I2 100%<br />
Iteration 1 (I 1 ) : Availability<br />
35%<br />
A 75NT + A 75T + A 3<br />
Iteration 2 (I 2 ) : Availability and Productivity<br />
A 75NT + P t A 75T + P e A 3<br />
Iteration 3 (I 3 ) : Availability, Productivity, CBT and Ancillary Training<br />
T 75(A 75NT + P tA 75T) + T 3(P eA 3)<br />
assigned technicians to MXS. This calculation yielded daily<br />
estimates of the number of NEP for MXS. Since AMXS and MXS<br />
are both aircraft maintenance units with many of the same <strong>AF</strong>SCs<br />
and similar demands on their personnel, any differences from<br />
actual numbers as a result of this method were considered<br />
negligible for this analysis.<br />
The study team then added the AMXS NEP figures to the MXS<br />
NEP figures, resulting in a collective NEP figure for the flight<br />
line maintainers at Dover <strong>AF</strong>B. These collective NEP figures<br />
are shown in Table 7. The upper portion of the table shows the<br />
NEP figures grouped by columns (day of the week) with each<br />
row representing 1 of the 9 weeks over the entire period that data<br />
was tracked. The bottom section of Table 7 also displays the<br />
descriptive statistics for NEP across both AMXS and MXS<br />
combined. The highest average NEP value was 222 on<br />
Thursdays, representing approximately 30 percent of the baseline<br />
total of 729 people.<br />
Conclusion<br />
The ratio between authorized and assigned personnel is typically<br />
used to quantify personnel availability. While this ratio is an<br />
indicator of maintenance capacity, it provides only a limited<br />
amount of information. These ratios do not take into account the<br />
abilities and skill levels of the maintenance personnel, nor does<br />
it factor in the availability of the personnel on a day-to-day basis.<br />
Figure 4. The Iterations of NEP<br />
29%<br />
I 3<br />
27%<br />
The Net Effective Personnel methodology described in this<br />
article is a repeatable process which produces NEP figures that<br />
provide leadership with a better representation of the personnel<br />
resources and actual capacity available to an Air Force aircraft<br />
maintenance organization on a day-to-day basis. The NEP<br />
methodology will be tested further and validated using personnel<br />
data from other units to verify similar results and potential gains.<br />
Ultimately, the NEP methodology has the potential to be used<br />
alone or in conjunction with LCOM to better portray<br />
maintenance personnel requirements and capabilities based on<br />
experience and skill levels.<br />
As previously mentioned, the NEP methodology described<br />
in this article was developed as part of the larger C-5 TNMCM<br />
Study II. The entire study can be found at the Defense Technical<br />
Information Center Private Scientific and Technical Information<br />
Network Web site at https://dtic-stinet.dtic.mil/.<br />
End <strong>No</strong>tes<br />
1. General T. Michael Moseley, CS<strong>AF</strong>’s Vector: Air Mobility’s Strategic<br />
Impact, 23 May 2007, [Online] Available: http://www.af.mil/library/<br />
viewpoints/csaf.asp?id=<strong>32</strong>4.<br />
2. Honorable Michael W. Wynne and General T. Michael Moseley,<br />
“Strategic Initiatives,” presentation to the House Armed Services<br />
Committee, 24 October 2007.<br />
3. Michael W. Wynne, “Savings Less Than Expected in Drawdown,”<br />
briefing to the Center for Strategic and Budgetary Assessments, Air<br />
131
Force Times, [Online] Available: www.airforcetimes.com/news/2007/<br />
09/airforce wynnedrawdown 070924, accessed 9 September 2007.<br />
4. <strong>AF</strong>I 21-101, Aircraft and Equipment Maintenance <strong>Management</strong>, HQ<br />
US<strong>AF</strong>/A4MM, 29 June 2006, 28.<br />
5. Study team notes from 439 MXG daily production meeting, Westover<br />
ARB, 12 December 2006.<br />
6. Study team notes from meeting with 436 MXG/CD, Dover <strong>AF</strong>B, 8<br />
January 2007.<br />
7. Study team notes from meeting with 105 MXG/CC, Stewart ANGB,<br />
18 January 2007.<br />
8. Carl J. Dahlman, Robert Kernchner, and Davis E. Thaler, Setting<br />
Requirements for Maintenance Manpower in the US Air Force, Santa<br />
Monica, California: RAND Corporation, 2002, 136.<br />
9. J.R.T. Arnold and S. Chapman, Introduction to Materials <strong>Management</strong>,<br />
5th ed., Pearson Education, 2003, 244.<br />
10. Herbert Hecht, Systems Reliability and Failure Prevention, <strong>No</strong>rwood,<br />
MA: Artech House Inc., 2004.<br />
11. John G. Drew, Kristin F. Lynch, Jim Masters, Robert S. Tripp, and<br />
Charles Robert Roll, Jr., Maintenance Options for Meeting Alternative<br />
Active Associate Unit Flying Requirements, Santa Monica, California:<br />
RAND Corporation, MG-611-<strong>AF</strong>, 2008.<br />
12. Ibid.<br />
13. Ibid.<br />
14. Ibid.<br />
15. Ibid.<br />
16. Dahlman, et. al., 1<strong>32</strong>.<br />
17. This figure represents data from the 436 AMXS for March-April 2007.<br />
18. “Ancillary Training,” Airman’s Roll Call, [Online] Available: http://<br />
www.af.mil/shared/media/document/<strong>AF</strong>D-070209-083.pdf, accessed<br />
9 February 2007.<br />
19. Ibid.<br />
20. Study team notes from meeting with 436 MOS Supervision, 9 January<br />
2007.<br />
21. 436 AMXS/MXAA, Dover <strong>AF</strong>B, March – April 2007.<br />
22. “Education and Training Course Announcement,” ETCA Web site,<br />
[Online] Available: https://etca.randolph.af.mil/, accessed 21 March<br />
2007.<br />
1<strong>32</strong><br />
NEP<br />
Day of the Week NEP Distributions<br />
Sun Mon Tue Wed Thu Fri Sat<br />
186 219 228 211 259 219 187<br />
148 209 226 219 213 182 140<br />
153 212 211 242 219 195 155<br />
188 242 289 297 245 205 169<br />
165 210 220 216 294 235 198<br />
137 186 187 195 205 175 148<br />
173 206 192 188 194 176 168<br />
167 213 201 195 183 186 174<br />
176 203 185 194 180<br />
n 9 9 8 8 9 9 9<br />
Min 137 186 187 188 183 175 140<br />
Max 188 242 289 297 294 235 198<br />
Mean 166 211 219 221 222 196 169<br />
% of Assigned 23% 29% 30% 30% 30% 27% 23%<br />
Range 51 56 102 109 110 59 58<br />
Variance 300 221 1031 1241 1385 404 349<br />
Standard Dev 17 15 <strong>32</strong> 35 37 20 19<br />
Table 7. Day of the Week NEP Distributions for 436 MXG (AMXS and MXS) <strong>32</strong><br />
Who bravely dares must sometimes risk a fall.<br />
23. Ibid.<br />
24. US Office of Personnel <strong>Management</strong>, “Federal Holidays,” [Online]<br />
Available: http://www.opm.gov/fedhol/, 11 April 2007.<br />
25. It should be noted that the study team performed sensitivity analysis<br />
on the last three assumptions. See Table 3.<br />
26. 436 AMXS/MXAA.<br />
27. Data for 12 April 2007, 436 AMXS/MXAA, Dover <strong>AF</strong>B.<br />
28. G/C is alternatively known as Automatic Flight Controls & Instruments.<br />
29. 436 AMXS/MXAA.<br />
30. Ibid.<br />
31. Air Force Personnel Center, data pull, 27 March 2007.<br />
<strong>32</strong>. Values in Table 7 are rounded to nearest whole number.<br />
Jeremy A. Howe is currently employed with the Whirlpool<br />
Corporation, Corporate Headquarters, as the Manager,<br />
<strong>No</strong>rth American Region Supply Chain Metrics Team. He<br />
previously worked as a Captain in the Air Force <strong>Logistics</strong><br />
<strong>Management</strong> <strong>Agency</strong> as Chief, Munitions Analysis.<br />
Benjamin A. Thoele is currently the Executive Director of<br />
the FitWit Foundation in Atlanta, Georgia. He previously<br />
worked as a Captain in the Air Force <strong>Logistics</strong> <strong>Management</strong><br />
<strong>Agency</strong> as an operations researcher and Chief, <strong>Logistics</strong><br />
Analysis.<br />
Major Scotty A. Pendley is currently the Chief,<br />
Maintenance Studies Branch, <strong>Logistics</strong> Innovation Studies<br />
Division, Air Force <strong>Logistics</strong> <strong>Management</strong> <strong>Agency</strong>.<br />
Major Anthony F. Antoline is currently the Chief, <strong>Logistics</strong><br />
<strong>Logistics</strong> Transformation Division, Air Force <strong>Logistics</strong><br />
<strong>Management</strong> <strong>Agency</strong>.<br />
Roger D. Golden is the Director, Air Force <strong>Logistics</strong><br />
<strong>Management</strong> <strong>Agency</strong>.<br />
—Tobias George Smollett<br />
Air Force Journal of <strong>Logistics</strong>
Annual Edition, <strong>Vol</strong>ume XXXIII, Number 1<br />
Historical Perspective<br />
The battle is fought and decided by the quartermasters before the shooting begins.<br />
—Field Marshal Erwin Rommel<br />
<strong>No</strong> matter their nationality or specific service, military logisticians throughout history have understood the absolute<br />
truth represented in the above quote. Whether they were charged with supplying food for soldiers, fodder for horses or<br />
the sinews of modern war—petroleum, oil, and lubricants (POL), they have understood that victory is impossible without<br />
them—even if, sometimes, it seemed their vital contributions were forgotten or ignored. <strong>No</strong>ne of the great military captains of<br />
history were ignorant of logistics. From Frederick the Great to Napoleon to Patton, they all understood the link between their<br />
operations and logistics. The great captains also have all understood that history had much to teach them about the nature of the<br />
military profession. Yet, military logisticians do not often spend time studying the history of military logistics.<br />
There are at least three general lessons from history that might prove of some use in understanding how best to prepare for the<br />
future. The first of these is the best case operationally is often the worst case logistically. The second is promises to eliminate<br />
friction and uncertainty have never come to fruition. And the third is technological change must be accompanied by organizational<br />
and intellectual change to take full advantage of new capabilities. While these lessons are not exclusive to logistics, when<br />
applied to the understanding and practice of military logistics, they provide a framework for understanding the past and planning<br />
for the future.<br />
Colonel Karen S. Wilhelm, US<strong>AF</strong> (Ret)<br />
Concentration and <strong>Logistics</strong><br />
To win in battle we must concentrate combat power in time and space. Strategy and tactics are concerned with the questions<br />
of what time and what place; these are the ends, not the means. The means of victory is concentration and that process is<br />
our focus here. There are only four key factors to think about if we seek success in concentration. This is not a simple task.<br />
Although few in number, their impact, dynamics and interdependencies are hard to grasp. This is a problem as much of perspective<br />
as of substance. It concerns the way we think, as much as what we are looking at. The factors are not functions, objects or even<br />
processes. They are best regarded as conditions representing the nature of what we are dealing with in seeking concentration.<br />
They are as follows. <strong>Logistics</strong> is not independent. It exists only as one half of a partnership needed to achieve concentration.<br />
Why is understanding this so important? <strong>Logistics</strong> governs the tempo and power of operations. For us, and for our enemy. We<br />
have to think about the partnership of operations and logistics because it is a target. A target for us, and for our enemy. Like any<br />
target, we need to fully understand its importance, vulnerabilities and critical elements to make sure we know what to defend and<br />
what to attack. All military commanders, at all levels of command, rely on the success of this partnership. How well they understand<br />
it will make a big difference concerning how well it works for them and how well they work for it.<br />
Wing Commander David J. Foster, R<strong>AF</strong><br />
Lessons from the First Deployment of Expeditionary Airpower<br />
The lens of history speaks to many of the issues that are significant in today’s expeditionary airpower environment.<br />
Particularly relevant are the lessons learned during first deployment of expeditionary airpower by the Royal Flying Corps<br />
during WWI. These include:<br />
The use of airpower is an expensive proposition.<br />
Maintaining aircraft away from home station demands considerable resources.<br />
Attrition from active operations is often very high.<br />
Effective support demands the ready availability of spares.<br />
Transport and protecting the transportation system is critical.<br />
Preserving mobility (the ability to redeploy quickly) is a constant battle.<br />
The supply system must be adequate in scope with a margin in capacity to meet unplanned events.<br />
The essential lubricant is skilled manpower.<br />
Group Captain Peter J. Dye, R<strong>AF</strong><br />
133
134<br />
Introduction<br />
Metrics are often used as roadmaps to help us know where we<br />
have been, where we are going, and how or if we are going to get<br />
there. 1 Metrics should generally be used to gauge organizational<br />
effectiveness and efficiency and to identify trends, not as a pass<br />
or fail indicator. Individually, they are snapshots in time. 2 Metrics<br />
are a statement of what is important to your organization and<br />
embody a way of thinking about your business; when metrics<br />
change, so does people’s point of view. But what exactly is a<br />
metric and what constitutes a good versus bad metric?<br />
Air Force Instruction (<strong>AF</strong>I) 21-101, Aircraft Equipment and<br />
Maintenance <strong>Management</strong>, describes metrics, specifically<br />
maintenance management metrics, as a crucial form of<br />
information used by maintenance leaders to improve the<br />
performance of maintenance organizations, equipment, and<br />
people when compared with established goals and standards. 3<br />
<strong>AF</strong>I 21-101 also lists four attributes for metrics including:<br />
Accurate and useful for decisionmaking<br />
Consistent and clearly linked to goals and standards<br />
Clearly understood and communicated<br />
Based on a measurable, well-defined process4 Dr Michael Hammer, a recognized leader in the field of process<br />
reengineering, also notes four principles of measurement.<br />
Measure what matters, rather than what is convenient or<br />
traditional<br />
Measure what matters most, rather than everything<br />
Measure what can be controlled, rather than what cannot be<br />
controlled<br />
Measure what has impact on desired business goals, rather<br />
than ends in themselves5 Hammer also points out several flaws with traditional metrics<br />
such as too many, fragmented, disorganized, internally focused,<br />
irrelevant to the customer, not used systematically, and not<br />
aligned with goals. 6 It is this last flaw (metrics not aligned with<br />
goals) which became a focus of examination during an Air Force<br />
<strong>Logistics</strong> <strong>Management</strong> <strong>Agency</strong> (<strong>AF</strong>LMA) study of rising Air<br />
Force total not mission capable maintenance (TNMCM) rates and<br />
potential root cause factors affecting these rates.<br />
Background<br />
This article is the second of a three-part series based on <strong>AF</strong>LMA<br />
project number LM200625500, the C-5 TNMCM Study II. At the<br />
request of the Air Force Materiel Command Director of <strong>Logistics</strong><br />
(<strong>AF</strong>MC/A4), <strong>AF</strong>LMA conducted an analysis in 2006-2007 of<br />
TNMCM performance with the C-5 Galaxy aircraft as the focus.<br />
The C-5 TNMCM Study II included five objectives. One of those<br />
objectives was to determine root causes of increasing TNMCM<br />
rates for the C-5 fleet. To achieve that particular objective, an<br />
extensive, repeatable methodology was developed and utilized<br />
Air Force Journal of <strong>Logistics</strong>
Annual Edition, <strong>Vol</strong>ume XXXIII, Number 1<br />
Scotty A. Pendley, Major, US<strong>AF</strong>, <strong>AF</strong>LMA<br />
Benjamin A. Thoele, FitWit Foundation<br />
Timothy W. Albrecht, US<strong>AF</strong>, <strong>AF</strong>CENT<br />
Jeremy A. Howe, Whirlpool Corporation<br />
Anthony F. Antoline, Major, US<strong>AF</strong>, <strong>AF</strong>LMA<br />
Roger D. Golden, DPA, <strong>AF</strong>LMA<br />
135
Realignment of metrics must start<br />
at the highest levels of the Mobility<br />
Air Force (M<strong>AF</strong>). The M<strong>AF</strong> should<br />
choose its value measure and<br />
create a set of metrics aligned with<br />
that measure.<br />
At the request of the Air Force Materiel Command Director<br />
of <strong>Logistics</strong>, <strong>AF</strong>LMA conducted an analysis in 2006-2007<br />
of total not mission capable maintenance (TNMCM)<br />
performance with the C-5 Galaxy aircraft as the focus. The<br />
C-5 TNMCM Study II included five objectives. One of those<br />
objectives was to determine root causes of increasing<br />
TNMCM rates for the C-5 fleet. To achieve that particular<br />
objective, an extensive, repeatable methodology was<br />
developed and utilized to scope an original list of 184 TNMCM<br />
factors down to two root causes for in-depth analysis. Those<br />
two factors were aligning maintenance capacity with demand<br />
and the logistics departure reliability versus the TNMCM<br />
paradigm. This article details the analysis of the second of<br />
these two factors.<br />
This second factor was also described as a disconnect<br />
or misalignment between the C-5 maintenance group<br />
leadership’s primary metric, home station logistics departure<br />
reliability (HSLDR), and one of the major command and Air<br />
Force senior leadership’s primary metrics, aircraft<br />
availability. The remainder of this article describes how realworld<br />
and simulated data supported the early hypothesis that<br />
HSLDR and TNMCM were not aligned metrics. Finally, a brief<br />
discussion explains why the study team believed a<br />
disconnect existed between the base-level and commandlevel<br />
metrics.<br />
The research demonstrated that HSLDR is aligned with<br />
neither aircraft availability nor TNMCM, as there is only a<br />
weak correlation between them. Maintainers at the wing level<br />
work to support operational effectiveness; however, higher<br />
levels of Air Force supervision appear more focused on<br />
improving strategic readiness. This disconnect in priorities<br />
was determined to be a root cause of the C-5 TNMCM rate<br />
being below Air Force standards.<br />
If the Air Force’s primary goal is to improve the C-5 fleet<br />
TNMCM rate, then priorities of the maintainers in the field<br />
must change. As the maintenance group (MXG) leadership<br />
focuses on HSLDR performance, not TNMCM, the MXP<br />
136<br />
to scope an original list of 184 TNMCM factors down to two<br />
root causes for in-depth analysis. Those two factors were aligning<br />
maintenance capacity with demand and the logistics departure<br />
reliability (LDR) versus TNMCM paradigm. This article details<br />
the analysis of the second of these two factors.<br />
This second factor was also described as a disconnect or<br />
misalignment between the C-5 maintenance group (MXG)<br />
leadership’s primary metric, home station logistics departure<br />
reliability (HSLDR), and one of the major command (MAJCOM)<br />
and Air Force senior leadership’s primary metrics, aircraft<br />
availability (AA). The remainder of this article describes how<br />
real-world and simulated data supported the early hypothesis that<br />
HSLDR and TNMCM were not aligned metrics. Finally, a brief<br />
discussion explains why the study team believed a disconnect<br />
existed between the base-level and command-level metrics.<br />
Primary Metrics of C-5<br />
Maintenance Leadership<br />
The C-5 TNMCM Study II originated because the project sponsor<br />
placed significant importance on TNMCM rates. Based on site<br />
visits and feedback from all but one C-5 MXG commander (MXG/<br />
CC) or other MXG senior leaders, the study team determined that<br />
the primary metric of the MXG/CC was HSLDR. AA, which is<br />
directly related to the TNMCM rate, was a primary metric of<br />
higher level leadership. Major General McMahon, then AMC<br />
director of logistics (AMC/A4), spoke to the study team in<br />
December 2006 concerning aircraft availability as the future<br />
cornerstone maintenance metric [as opposed to mission capable<br />
(MC) rates]. 7 Similarly, personnel from the AMC/A4M office<br />
stated that aircraft availability is the number one concern for<br />
AMC Headquarters as opposed to MC rates. 8<br />
During site visits to Dover Air Force Base (<strong>AF</strong>B), Stewart Air<br />
National Guard Base, and Westover Air Reserve Base, the study<br />
team received feedback from base-level maintenance leadership<br />
concerning maintenance metrics. Some of the comments<br />
included:<br />
“We don’t manage by MC-Rate…we don’t chase the<br />
numbers. We care about departure reliability, and [the Air<br />
Force] should be looking at en route reliability.” 9<br />
“We don’t look at the TNMCM rate…numbers aren’t the<br />
issue. We focus on the mission and the flying schedule.” 10<br />
“What’s important? Anything that makes us fly. The metric<br />
for the base is departure reliability…Ops isn’t happy with a<br />
73 percent LDR.” 11<br />
“MC rate is way down on the list of things we pay attention<br />
to…We’re currently scrambling to meet the flying schedule.<br />
Our priorities go to the scheduled aircraft.” 12<br />
“Our primary metric is LDR.” 13<br />
Based on feedback from <strong>AF</strong>MC/A4 and AMC/A4 leadership,<br />
MXG/CCs at three C-5 bases, and telephone discussions with<br />
MXG leadership at other C-5 bases, the study team concluded<br />
that the primary metric of the MAJCOM A4 leadership was AA,<br />
which includes TNMCM, and that the primary metric of the<br />
MXG/CCs was HSLDR.<br />
Air Force Journal of <strong>Logistics</strong>
HSLDR, TNMCM, and AA Defined<br />
<strong>AF</strong>I 21-101 defines the HSLDR, TNMCM, and AA metrics and<br />
their uses. Additional insight on the use of these metrics can be<br />
found in the Metrics Handbook for Maintenance Leaders.<br />
Home-Station <strong>Logistics</strong> Departure Reliability (HSLDR) Rate.<br />
This is a leading metric used primarily by the Mobility Air Forces<br />
(M<strong>AF</strong>) for airlift aircraft. This delineates down to only first-leg<br />
departures of unit-owned aircraft departing home station. 14<br />
HSLDR Rate (%) = ((# of HS Departures – # of HS<br />
<strong>Logistics</strong> Delays)/# of HS Departures) x 100<br />
Total <strong>No</strong>t Mission Capable Maintenance (TNMCM) Rate.<br />
TNMCM rate is the average percentage of possessed aircraft<br />
(calculated monthly or annually) that are unable to meet primary<br />
assigned missions for maintenance reasons…. Any aircraft that is<br />
unable to meet any of its wartime missions is considered not<br />
mission capable (NMC). The TNMCM is the amount of time aircraft<br />
are in NMCM [not mission capable maintenance] plus not mission<br />
capable both (NMCB) status. 15<br />
NMCB is mentioned in <strong>AF</strong>I 21-101 as the percentage of unitpossessed<br />
hours that aircraft are not mission capable due to both<br />
maintenance and supply. 16<br />
TNMCM (%) = ((NMCM Hrs + NMCB Hrs)/Unit<br />
Possessed Hrs) x 100<br />
Aircraft Availability (AA) Rate. Aircraft availability is the<br />
percentage of a fleet that is in neither depot possessed status nor<br />
unit possessed NMC status. 17<br />
AA (%) = (MC Hours/Total Possessed Hrs) x 100<br />
<strong>No</strong>te that TNMCM rate and AA rate are both part of the family<br />
of metrics that relate to aircraft status hours. Also important to<br />
remember is that unit possessed aircraft must be in one of four<br />
statuses:<br />
MC (to include partially mission capable for maintenance or<br />
supply)<br />
NMCM<br />
<strong>No</strong>t mission capable supply (NMCS)<br />
NCMB<br />
Therefore, the percentage of MC hours must decrease as the<br />
percentage of NMCM, NMCS, and NMCB hours increase.<br />
Metrics at Different Levels<br />
of the Organization<br />
One might expect two different levels of an organization to have<br />
two different primary metrics. For the Air Force, the focus at the<br />
base maintenance level is expected to be on the tasks at hand to<br />
execute the mission on a daily basis. However, a strategic focus at<br />
the command A4 level is to be expected, looking across the<br />
availability of the entire fleet. Consider Dr Michael Hammer’s<br />
presentation of this phenomenon in Table 1.<br />
Annual Edition, <strong>Vol</strong>ume XXXIII, Number 1<br />
simulation indicated that improving the TNMCM rate would<br />
require an increase in resources. Therefore, in order to<br />
improve the TNMCM rate without increased resources, the<br />
maintainers in the field must make TNMCM a priority. While<br />
it is impossible to model the current system perfectly, the<br />
results suggest that current maintenance policies do not<br />
ensure TNMCM improvement, but do improve HSLDR,<br />
which is the stated priority of the MXG leadership.<br />
Therefore, the study team recommended that MAJCOM<br />
leadership and MXG leadership decide on a set of metrics<br />
that are better aligned toward the same goal.<br />
This is the second in a three-part series of articles that<br />
examine C-5 TNMCM rates.<br />
Article Acronyms<br />
AA – Aircraft Availability<br />
<strong>AF</strong>B – Air Force Base<br />
<strong>AF</strong>I – Air Force Instruction<br />
<strong>AF</strong>LMA – Air Force <strong>Logistics</strong> <strong>Management</strong> <strong>Agency</strong><br />
<strong>AF</strong>MC – Air Force Materiel Command<br />
AMC – Air Mobility Command<br />
D&C – Delays and Cancellations<br />
Est TNMCM – Estimated TNMCM<br />
FIFO – First In First Out<br />
FY – Fiscal Year<br />
HS – Home Station<br />
HSLDR – Home Station <strong>Logistics</strong> Departure Reliability<br />
LDR – <strong>Logistics</strong> Departure Reliability<br />
LIFO – Last In First Out<br />
M<strong>AF</strong> – Mobility Air Force<br />
MAJCOM – Major Command<br />
MC – Mission Capable<br />
MCO – Maintenance Carryovers<br />
MCR – Mission Capable Rate<br />
MDR – Maintenance Dispatch Reliability<br />
MOS – Maintenance Operations Squadron<br />
MX – Maintenance<br />
MXG – Maintenance Group<br />
MXP – Maintenance Priority<br />
NMC – <strong>No</strong>t Mission Capable<br />
NMCB – <strong>No</strong>t Mission Capable Both<br />
NMCM – <strong>No</strong>t Mission Capable Maintenance<br />
NMCS – <strong>No</strong>t Mission Capable Supply<br />
REMIS – Reliability and Maintainability Information<br />
System<br />
TDR – Technical Dispatch Reliability<br />
TNMCM – Total <strong>No</strong>t Mission Capable Maintenance<br />
UAOOS – Unscheduled Aircraft Out of Service<br />
137
The first column in Table 1 lists the various categories across<br />
the spectrum of oversight for an organization, ranging from<br />
enterprise goals to local activities. The headings in the top row<br />
list the range of positions in the hierarchy of jobs within the<br />
organization. In general, senior leaders are primarily accountable<br />
for setting the vision and strategy across the entire business<br />
enterprise. Process owners are responsible for developing and<br />
executing operations and processes to support higher strategy,<br />
while professionals actually perform specific work tasks through<br />
various activities. Consider this same chart in terms of C-5 aircraft<br />
maintenance, shown in Table 2. The base-level focus on on-time<br />
departure reliability falls within the operating objective level,<br />
providing ready airplanes for the flying schedule. On the surface,<br />
this supports the strategic performance objectives of cargo and<br />
passenger delivery. These processes are, after all, at the core of<br />
the airlift mission. On-time departure reliability, as a<br />
measurement, only considers those airplanes scheduled to fly<br />
(departing). 19 TNMCM, on the other hand, is concerned with the<br />
categorization of aircraft status, and pertains to all possessed<br />
airplanes, regardless of whether or not there is an operational<br />
demand. 20 The takeaway here is that the study team’s<br />
observations of the C-5 aircraft maintenance enterprise supported<br />
Dr Hammer’s view presented in Table 1. The study team found<br />
that different levels of the C-5 maintenance hierarchy do in fact<br />
focus on different primary metrics.<br />
Aligning Metrics<br />
Although it may be common for different organizational levels<br />
to focus on different metrics, this split focus can be problematic<br />
for the enterprise when the pursuit of goals at the local level is<br />
not aligned to goals at the strategic level. That is, pursuit of better<br />
performance in one metric could result in suboptimal<br />
performance of higher level metrics. When this occurs, the metrics<br />
are not aligned. The study team utilized the following definition<br />
for aligned metrics:<br />
Leadership Process Owner Professionals<br />
Enterprise Goals High* Low<br />
Medium<br />
Strategic Performance High* High Medium<br />
Operating Objectives Medium High* Medium<br />
Process Performance Medium High* High<br />
Activity Performance<br />
* = primary accountability<br />
Low High*<br />
Enterprise Goals – increase aircraft availability,<br />
reduce costs<br />
Strategic Performance – deliver cargo and<br />
passengers accurately and on-time<br />
Operating Objectives – provide ready airplanes for<br />
the flying schedule<br />
Process Performance – isochronal inspections,<br />
unscheduled repair process<br />
Activity Performance – inspect and repair<br />
airplanes<br />
* = primary accountability<br />
138<br />
Definition 1 - Aligned Metrics. A set of metrics is said to be<br />
aligned if, with all other variables held constant, improvement<br />
in the lower level metric implies improvement of the higher<br />
level metrics.<br />
Table 1. Accountability and Attention 18<br />
AMC/A4 MXG/CC Technicians<br />
High* Medium Low<br />
High* High Medium<br />
Medium High* Medium<br />
Medium High* High<br />
Low High High*<br />
Table 2. Accountability and Attention for C-5 Aircraft Maintenance<br />
For example, consider the priorities of a trucking company.<br />
The company is concerned with a higher level metric, known as<br />
a value measure, of increasing profit. The value measurement is<br />
in dollars. Shop managers at a truck maintenance facility use a<br />
lower level metric, known as a process measure, of reducing repair<br />
cycle time. By reducing the repair cycle time, the labor cost per<br />
truck is reduced, and each truck is returned to revenue-generating<br />
status sooner. All other variables held constant, reduced labor<br />
costs and greater numbers of operational trucks increase profit<br />
for the company. In this way, improving cycle time implies<br />
improvement in profit. 21 By Definition 1, these metrics are<br />
aligned.<br />
<strong>No</strong>w consider the Air Force maintenance metrics of HSLDR<br />
rate and TNMCM rate. The base focus on departure reliability<br />
may have a direct effect on prioritizing unscheduled maintenance<br />
actions to best meet the flying schedule. This optimization can<br />
cause an airplane that is hard broke to be prioritized below another<br />
airplane in order to get the less broke airplane repaired more<br />
quickly and readied for the next flight. This decision, while<br />
supporting the objective of on-time departure reliability, may<br />
actually have a negative effect on the TNMCM rate. If, however,<br />
HSLDR and TNMCM were aligned, an improvement to HSLDR<br />
would imply an improvement to TNMCM. To investigate the<br />
alignment of the HSLDR, TNMCM, and AA metrics, the study<br />
team analyzed data from August 2004 through December 2006<br />
for the 436 MXG at Dover Air Force Base (<strong>AF</strong>B). The 436<br />
Maintenance Operations Squadron (MOS) analysis section<br />
provided the data for the HSLDR and TNMCM rates; the source<br />
for the AA rates was the Multi-Echelon Resource and <strong>Logistics</strong><br />
Information Network.<br />
Mathematically, metric alignment implies that two metrics are<br />
fairly strongly related. To test the correlation mathematically,<br />
the study team employed the correlation coefficient denoted by<br />
the symbol (rho). The correlation coefficient is a number<br />
between -1 and 1 which measures the degree to which two<br />
variables are linearly related and is scaled such that > 0<br />
indicates a positive correlation between the variables. A value<br />
of = +1 implies a perfect correlation with all ordered pairs<br />
(points) falling on a straight line with a positive slope. A value<br />
of = -1 implies a perfect<br />
negative correlation with all<br />
points on a straight line with a<br />
negative slope. 22 For the<br />
purposes of this study, the study<br />
team partitioned the correlation<br />
coefficient values in the<br />
following manner:<br />
|| 0.20 implies a very<br />
weak correlation<br />
0.20 < || 0.50 implies a<br />
weak correlation<br />
0.50 < || 0.80 implies a<br />
moderate correlation<br />
0.80 < || 1.0 implies a<br />
strong correlation<br />
Figure 1 illustrates the<br />
relationship between the<br />
TNMCM rate and HSLDR rate.<br />
Air Force Journal of <strong>Logistics</strong>
TNMCM (%)<br />
60<br />
50<br />
40<br />
30<br />
20<br />
10<br />
= -0.15056<br />
y = -0.1377x + 45.93<br />
0<br />
40 50 60 70 HSLDR (%)<br />
80 90<br />
Figure 1. HSLDR and TNMCM Rates Scatter Plot for 436 MXG<br />
August 2004 to December 2006<br />
If the metrics were aligned, the graph should show evidence of a<br />
strong negative correlation. That is, as HSLDR increased,<br />
TNMCM would decrease and vice versa. In this case, the scatter<br />
plot reveals no definite relationship, appearing more like a<br />
shotgun spread. For comparison purposes, the least squares<br />
regression line for the data is drawn and the line equation is<br />
presented. A regression equation allows for the expression of a<br />
relationship between two or more variables algebraically. From<br />
Figure 1, the correlation coefficient between HSLDR and<br />
TNMCM is very weak, with = -0.15056. Therefore,<br />
improvement of the HSLDR rate does not imply improvement<br />
of the TNMCM rate. By the study’s definition, HSLDR and<br />
TNMCM were not aligned metrics.<br />
Figure 2 illustrates the relationship between the HSLDR rate<br />
and AA rate, the primary metric at the MAJCOM A4 level. Again,<br />
the plot resembles a shotgun spread, and there is a very weak<br />
correlation coefficient with = 0.072165. HSLDR and AA do<br />
not appear aligned according to the study’s definition.<br />
Figure 3 illustrates the relationship between the TNMCM and<br />
AA rates. Here, the scatter plot reveals a negative correlation.<br />
Likewise, the correlation coefficient indicates a moderate<br />
negative correlation with = -0.77927. This evidence supports<br />
the idea that TNMCM and AA are aligned according to the study<br />
definition. As the TNMCM rate improves (decrease), the AA rate<br />
also tends to improve (increase). This result is not surprising since<br />
TNMCM and AA are a part of the same family of status-hour<br />
metrics.<br />
In summary, Figures 1, 2, and 3 suggest that TNMCM and AA<br />
are aligned, and HSLDR is not aligned with either TNMCM or<br />
AA. As stated earlier, the MXG/CC’s focus on HSLDR as their<br />
primary metric, not TNMCM and AA. Therefore, the MXG/CCs<br />
and their personnel make decisions about resources and day-today<br />
operations which impact HSLDR first. Since HSLDR is not<br />
aligned with TNMCM and AA, there is no guarantee that<br />
TNMCM or AA will improve as a result of the current operations.<br />
Annual Edition, <strong>Vol</strong>ume XXXIII, Number 1<br />
AA (%)<br />
AA (%)<br />
60<br />
50<br />
40<br />
30<br />
20<br />
10<br />
= 0.072165<br />
y = 0.062x + 40.058<br />
0<br />
40 50 60 70<br />
HSLDR (%)<br />
80 90 90<br />
Figure 2. HSLDR and AA Rates Scatter Plot for 436 MXG August<br />
2004 to December 2006<br />
60<br />
55<br />
50<br />
45<br />
40<br />
35<br />
30<br />
25<br />
= -0.77927<br />
y = -0.7314x + 70.761<br />
20<br />
0 10 20 30<br />
TNMCM (%)<br />
40 50 60<br />
Figure 3. TNMCM and AA Rates Scatter Plot for 436 th MXG<br />
August 2004 to December 2006<br />
The MXG efforts, therefore, are not directly aimed at improving<br />
TNMCM rates when they are focusing on improving HSLDR<br />
rates.<br />
Experimentation Using C-5 Maintenance<br />
Priority (MXP) Simulation<br />
In order to test the impact to TNMCM rates of base-level HSLDRcentric<br />
maintenance decisionmaking, the <strong>AF</strong>LMA study team<br />
created a discrete event simulation using Arena simulation<br />
software. The simulation facilitated an analysis of how different<br />
maintenance operations could affect the HSLDR and TNMCM<br />
139
ates in a controlled environment. This analysis would be<br />
impractical to do in the real world. The following sections<br />
summarize the development and results of the C-5 maintenance<br />
priority (MXP) simulation.<br />
140<br />
MXP Problem Formulation and Objectives<br />
The MXP model was designed to study the employment of<br />
different queuing prioritization policies and their effect on key<br />
maintenance performance metrics in the support of C-5 aircraft.<br />
These policies determine the order in which aircraft awaiting<br />
maintenance are processed. Field interviews conducted by the<br />
study team revealed that in order to improve HSLDR, the<br />
maintenance commanders gave priority to those aircraft that<br />
“have the best chance of being returned to a [fully mission<br />
capable] status in minimum time.” 23 These recovery maintenance<br />
practices were utilized at both Travis <strong>AF</strong>B and Dover <strong>AF</strong>B for<br />
C-5 maintenance. 24 The MXP model labels this as the least<br />
maintenance (Mx) policy and determines the priority of queued<br />
aircraft based on the remaining man-hours of repair. Thus, the<br />
aircraft with the fewest man-hours of repair remaining relative to<br />
other queued aircraft receives top priority when maintenance<br />
resources become available. Alternatively, the most Mx policy<br />
gives priority to the aircraft with the most man-hours of repair<br />
remaining. The two remaining policies are first-in-first-out (FIFO)<br />
and last-in-first-out (LIFO). These queuing policies order aircraft<br />
according to their arrival. With FIFO, a newly arrived aircraft goes<br />
to the back of the queue. In a LIFO policy environment, a newly<br />
arrived aircraft goes to the front of the queue.<br />
MXP Data Collection<br />
Data for the MXP came from multiple sources. Aircraft arrival<br />
data was provided by the 436 MOS at Dover <strong>AF</strong>B for the period<br />
from January 2006 through March 2007. Manpower data was<br />
provided by the 436 th Aircraft Maintenance Squadron for March<br />
and April 2007. Data for the possessed aircraft inventory, HSLDR<br />
rates, and TNMCM rates were provided by the 436 MOS for the<br />
fourth quarter fiscal year (FY) 2006. Data for the maintenance<br />
processes were taken from the Reliability and Maintainability<br />
Information System (REMIS) for fourth quarter FY 2006. The<br />
study team determined that these data sets were the most suitable<br />
given the availability of data.<br />
MXP Assumptions<br />
Two important assumptions were made in the formulation of the<br />
MXP simulation:<br />
TNMCS time was assumed to have no impact on the<br />
maintenance operations or the TNMCM rate. The impact of<br />
supply operations was assumed to be accounted for in the<br />
repair time data. The MXP does not model any TNMCS time.<br />
Unit possessed time for all aircraft was assumed to be constant<br />
and equal for the four maintenance policies modeled in the<br />
MXP simulation.<br />
MXP Model Conceptualization<br />
The MXP simulation modeled C-5 maintenance operations at<br />
Dover <strong>AF</strong>B. The simulation modeled 18 aircraft (the average<br />
number of possessed aircraft for Dover <strong>AF</strong>B in the fourth quarter<br />
FY 2006) that arrive at the base according to a daily arrival<br />
schedule with a fixed number of breaks. To achieve the desired<br />
arrival stream attributes within the Arena simulation framework,<br />
the MXP model employed three separate processes.<br />
The first process created 18 C-5 aircraft entities at time zero.<br />
The entities then entered an arrival queue at a gate which opens<br />
according to the aircraft arrival schedule. Once opened, the gate<br />
allowed a single aircraft to proceed to the maintenance process<br />
before closing until the next arrival signal was received. The same<br />
18 aircraft entities flowed from arrival process to the maintenance<br />
process before being recycled back to the arrival process. In this<br />
way, the model never had more than 18 aircraft in the system at<br />
one time.<br />
The second process tracked the day of the week. A clock entity<br />
was created at time zero and thereafter stepped through the days<br />
of the week at 24-hour intervals. The simulation employed two<br />
schedules that depend on the day of the week cycle. The first<br />
was related to the maintenance process and defined how many<br />
manpower resources were available to perform maintenance on<br />
a given day. The second schedule governed the aircraft arrival<br />
pattern.<br />
The final process related to aircraft arrivals determined when<br />
the gate should be opened allowing an aircraft to arrive and<br />
proceed to the maintenance process. These triggers were created<br />
according to a schedule derived from 15 months of aircraft arrival<br />
data at Dover <strong>AF</strong>B. The data defined day-specific discrete<br />
probability distributions of the number of aircraft arrivals. These<br />
distributions are given in Table 3.<br />
The manpower resources and repair times required to complete<br />
the repairs were drawn from distributions based on the real-world<br />
data. The aircraft wait in the maintenance queue until resources<br />
are available for repair. Repairs are then completed in three<br />
phases.<br />
The values in each row of Table 3 represent the probability of<br />
the particular number of arrivals (represented as 0 through 8 in<br />
the column headings) on that day of the week. Each row sums to<br />
one. These daily arrival distributions are the building blocks for<br />
a random aircraft arrival stream based on historic observations<br />
at Dover <strong>AF</strong>B. When all repairs are complete, the manpower<br />
resources are released to perform other repairs and the aircraft<br />
departs the base.<br />
REMIS data was used to derive a discrete distribution of the<br />
number of personnel on a work crew associated with a repair<br />
action. Each repair action is assigned a randomly sized crew.<br />
Table 4 shows the crew size probability distribution used in the<br />
simulation. For example, there is a 0.519 probability that a repair<br />
action requires two maintenance personnel. When all repairs are<br />
complete, the manpower resources are released to perform other<br />
repairs and the aircraft departs the base. The data did not indicate<br />
any instances of crew sizes of seven or eight people during the<br />
timeframe of the data.<br />
Figure 4 illustrates the overall view of the basic maintenance<br />
processes modeled in the MXP.<br />
C-5 arrivals are triggered according to an arrival schedule.<br />
After arrival, aircraft require (seize) maintenance resources,<br />
maintenance actions are performed, and then manpower<br />
resources are released. This cycle is accomplished three times<br />
before returning the aircraft to the arrival queue.<br />
In order to model the parallel and serial nature of aircraft<br />
maintenance actions, the study team adopted the repair bin<br />
methodology used by Balaban et al., in their mission capable<br />
Air Force Journal of <strong>Logistics</strong>
ate (MCR) simulation model, which they demonstrated using<br />
the C-5 fleet. 25 In reality, certain repair actions are accomplished<br />
simultaneously with other repair actions. However, by regulation,<br />
some actions cannot be performed simultaneously with certain<br />
other maintenance actions. Balaban et al., modeled this parallel<br />
and serial operation by grouping repair actions for a given aircraft<br />
into three bins or buckets. Repairs within a given bin are<br />
performed simultaneously, but the bins are repaired serially.<br />
Thus, all repairs in bin one are completed before beginning bin<br />
two repairs. The repair time for each bin is the longest of the repair<br />
times contained in the bin. 26 The MXP model also used three bins.<br />
The first bin contained 65 percent of the total number of repair<br />
actions, the second bin contained 25 percent, and the third bin<br />
contained 10 percent. This is very similar to the probabilities<br />
used in the MCR model—60, 30, and 10 percent, respectively. 27<br />
MXP Model Validation<br />
As previously stated, the least Mx priority system most closely<br />
matched the recovery maintenance practices in place at both<br />
Dover <strong>AF</strong>B and Travis <strong>AF</strong>B. Therefore, the study team deemed<br />
the least Mx model the best representation of the current, realworld<br />
process and considered this model the as-is model. The<br />
study team used the HSLDR rate in order to validate the MXP<br />
simulation with the real-world maintenance processes. After<br />
calibrating the MXP, the least Mx model achieved an HSLDR<br />
rate of 0.821 with a 95 percent confidence interval that included<br />
the real-world HSLDR rate of 0.833 for the timeframe of the data.<br />
It is important to note that the<br />
model’s intended use was not as<br />
a predictive model (given C-5<br />
break rates, how many<br />
maintenance resources<br />
are required to satisfy a given<br />
AA rate?), but only to make a<br />
relative comparison between the<br />
four given prioritization<br />
policies. The model was not<br />
designed to determine HSLDR/<br />
TNMCM/Mx backlog or<br />
to determine maintenance<br />
manning levels.<br />
Arrival Queue<br />
Arrival Trigger<br />
Gate<br />
yes<br />
Annual Edition, <strong>Vol</strong>ume XXXIII, Number 1<br />
Arrivals (AC) 0 1 2 3 4 5 6 7 8<br />
Sunday 0.231 0.461 0.2 0.093 0.015 - - - -<br />
Monday 0.092 0.139 0.292 0.215 0.108 0.092 0.047 - 0.015<br />
Tuesday 0.015 0.047 0.2 0.261 0.185 0.154 0.107 0.031 -<br />
Wednesday 0.015 0.077 0.093 0.307 0.308 0.138 0.062 - -<br />
Thursday - 0.062 0.107 0.216 0.338 0.185 0.092 - -<br />
Friday 0.077 0.077 0.138 0.293 0.184 0.185 0.031 0.015 -<br />
Saturday 0.169 0.416 0.246 0.061 0.062 0.046 - - -<br />
no<br />
Table 3. Probability of Number of Aircraft Arrivals by Day of the Week<br />
Crew Size (CS) 1 2 3 4 5 6 9<br />
P(CS) 0.<strong>32</strong>3 0.519 0.123 0.022 0.003 0.001 0.009<br />
Are all 3 repair<br />
buckets<br />
complete?<br />
MX Queue<br />
Table 4. Crew Size Probability<br />
Seize MX<br />
Resources<br />
MX Action<br />
MX Manpower<br />
Resource Pool<br />
Figure 4. Maintenance Process as Modeled in the C-5 MXP Simulation<br />
MXP Results and Conclusions<br />
Table 5 summarizes the MXP simulation results for the four<br />
policies examined with respect to three metrics: HSLDR,<br />
estimated TNMCM (Est TNMCM), and Sum of Mx in the queue<br />
(Mx backlog). Mx backlog covers the middle ground between<br />
the other two metrics—the prioritization policy determines<br />
which aircraft the maintenance group returns to mission capable<br />
status soonest while the remaining aircraft accrue TNMCM time.<br />
Mx backlog is a measure of the ability of the maintenance system<br />
to generate all possessed aircraft if called upon to do so. An ideal<br />
policy is one that would produce a high LDR rate, a low TNMCM<br />
rate, and a low Mx backlog. Table 5 summarizes the results for<br />
each policy with regard to these three metrics.<br />
Least Mx. The least Mx model was the baseline for<br />
comparison to the other Mx prioritization policies. It most<br />
closely resembled the as-is process of recovery maintenance.<br />
The HSLDR achieved in the model was representative of the<br />
real-world HSLDR rate and was used to validate the model.<br />
Likewise, the Est TNMCM rate achieved matched the realworld<br />
value for the timeframe of the data. Mx backlog for the<br />
least Mx model was the largest for the four policies considered.<br />
The Mx backlog measured the ability to improve the steadystate<br />
TNMCM rate. The higher the backlog, the harder it was<br />
for the Mx system to improve from their steady state TNMCM.<br />
Higher backlog means longer aircraft generation time.<br />
Most Mx. The most Mx prioritization policy had the same<br />
LDR (statistically speaking, within a 95 percent confidence<br />
Release MX<br />
Resources<br />
141
Policy HSLDR Est TNMCM Mx Backlog<br />
Least Mx 0.821 0.<strong>32</strong>2 45K<br />
Most Mx 0.816 0.305 23K<br />
FIFO 0.764 0.307 20K<br />
LIFO 0.735 0.393 30K<br />
142<br />
Table 5. Summary of MXP Results for Study Metrics<br />
interval) as the least Mx policy. Both the Est TNMCM and<br />
Mx backlog improved over the least Mx policy. This is<br />
intuitive because the most Mx policy actively applies<br />
resources to the biggest maintenance jobs first. However, the<br />
variability from day to day increased significantly with this<br />
policy. This means that the predictability and stability for<br />
scheduling purposes suffered greatly.<br />
FIFO. The FIFO policy had a reduced LDR when compared to<br />
the least Mx policy. However, the Est TNMCM improved, and<br />
was statistically the same as the Est TNMCM for the most Mx<br />
policy (within 95 percent confidence intervals). The Mx<br />
backlog was lower than the least Mx policy as well.<br />
LIFO. The LIFO policy appeared to be the least attractive with<br />
regard to the key metrics. As compared to the least Mx policy,<br />
it had a reduced LDR and increased Est TNMCM. It also had<br />
a reduced Mx backlog when compared to the least Mx policy<br />
but was the second worst of all the policies examined.<br />
These results reveal several things about the prioritization<br />
policies and their impact to the LDR and TNMCM rates. First,<br />
LDR and TNMCM react differently depending on maintenance<br />
policy. The current policy in place (least Mx) achieves a high<br />
LDR but has a mediocre estimated TNMCM when compared to<br />
the other policies, and the worst Mx backlog, which indicates<br />
that it is very difficult to improve the TNMCM rate. It is possible<br />
to improve the TNMCM rate by changing the prioritization<br />
policy. However, the improved TNMCM would come at the cost<br />
of predictability and stability in day-to-day operations (as with<br />
most Mx policy) and LDR, as is the case with the FIFO policy.<br />
The results of the simulation added support to the original<br />
hypothesis that HSLDR and TNMCM are not aligned metrics,<br />
but did not completely confirm it. While the current system can<br />
not be modeled perfectly, the simulation results did suggest that<br />
current maintenance policies do not ensure TNMCM<br />
improvement, but do improve LDR. It is safe to conclude that<br />
TNMCM and LDR are not necessarily aligned, complementary<br />
metrics.<br />
Several personnel interviewed during the study team’s site<br />
visits suggested that awareness exists of the just-described<br />
disconnect between enterprise goals (aircraft availability) and<br />
operating objectives. “There is a huge disconnect between<br />
AMC’s focus on the availability of tails (airplanes) and our focus<br />
on on-time departure reliability.” 28<br />
Consequently, while process owners are diligently focused<br />
on supporting the strategic performance objectives of delivering<br />
cargo and passengers, they are unable to simultaneously align<br />
their performance with the enterprise goal of increased aircraft<br />
availability. 29<br />
Maintenance Metrics at Delta Airlines<br />
As a means of comparing business practices, the study team<br />
elected to compare Air Force maintenance metrics with those of<br />
a leading commercial organization, Delta Airlines. The team<br />
interviewed representatives from Delta Airlines’ reliability<br />
program office. The study team<br />
was told the focus of Delta’s<br />
reliability program is driven by<br />
what is termed as Delays and<br />
Cancellations (D&C). 30 These<br />
are unscheduled events that<br />
have an operational impact and<br />
require a mechanical dispatch. For each delay or cancellation,<br />
there is a direct, net consequence to Delta’s revenue, so there is<br />
a high priority placed on diagnosing the cause.<br />
Delta personnel identified nine main aircraft maintenance<br />
metrics used by Delta. These metrics are summarized in Table<br />
6. 31 <strong>No</strong>te that technical dispatch reliability (TDR) includes all<br />
maintenance related to primary delays and cancellations, whereas<br />
mechanical dispatch reliability (MDR) includes only those<br />
primary events for which the reliability program is responsible.<br />
Repairs due to damage, cannot duplicate actions, maintenance<br />
carryovers, and maintenance errors (such as over-servicing) are<br />
not included in MDR. Dispatches are the term used for all of<br />
Delta’s revenue flights. <strong>32</strong> Although there is not an explicit<br />
hierarchy, the first two metrics, TDR and MDR, are directly linked<br />
to the daily revenue-producing flights on Delta’s schedule. These<br />
metrics track the volume of, and reasons behind, delays and<br />
cancellations for a revenue flight.<br />
Maintenance carryovers are Delta Airlines’ equivalent to<br />
delayed discrepancies in the Air Force. Maintenance carryovers<br />
are repairs that may be delayed (or carried over) to a more<br />
opportune time. Unscheduled aircraft out of service (UAOOS)<br />
measures the number of aircraft out of service due to an<br />
unscheduled event (such as a broken component). Delta measures<br />
UAOOS by counting the number of aircraft in this category three<br />
times per day (0900 hours, 1200 hours, and 1800 hours), and<br />
averaging that count over specified intervals. 33 Prioritization of<br />
repair is often given to aircraft that can be returned to service<br />
quickly, but the level of impact to fleet operations may be the<br />
driving factor. 34 As an example, a broken B-777 has a much bigger<br />
impact than a broken MD-88; the MD-88 fleet has many spares,<br />
while the B-777 does not. 35 The UAOOS metric is analogous to<br />
the Air Force TNMCM rate, though it is only focused on the<br />
unscheduled aircraft and is counted in whole aircraft rather than<br />
hours. Delta’s primary metrics (those driven by delays and<br />
cancellations) are not measured to an objective standard (met or<br />
not met), instead, they alert when they exceed a control limit for<br />
2 consecutive months. 36 Additionally, Delta personnel<br />
interviewed suggested that the metrics are driving desired<br />
behavior; this is supported by measured performance, as TDR<br />
averaged 97 percent fleet-wide at the time of the original study’s<br />
publication. 37<br />
Delta has a very clear enterprise-level value measure—profit.<br />
This clear value measure lends itself well to metric definition at<br />
the operational level, which is why Delta focuses on the D&Cs.<br />
The D&Cs have a direct net effect on the revenue producing<br />
flights, which in turn has a direct impact on profit.<br />
Value Metrics in the Mobility Air Forces<br />
The M<strong>AF</strong> on the other hand, seems to have two competing<br />
enterprise-level value metrics.<br />
Strategic Readiness. AA and TNMCM rates measure the<br />
ability of the fleet to be fully mobilized at any given time<br />
Air Force Journal of <strong>Logistics</strong>
Operational Effectiveness. HSLDR rates measure the ability<br />
of the fleet to meet the daily mission requirements.<br />
Conventional wisdom argues that increased strategic<br />
readiness facilitates operational effectiveness—increased AA and<br />
decreased TNMCM should lead to increased HSLDR. However,<br />
as previously shown, there is a weak correlation between HSLDR<br />
and both AA and TNMCM. Again, these metrics are not aligned.<br />
Conclusions<br />
This article discussed the focus on different metrics to include<br />
HSLDR, TNMCM, and AA at varying levels of the Air Force<br />
maintenance enterprise. It also demonstrated that HSLDR is<br />
aligned with neither AA nor TNMCM, as there is only a weak<br />
correlation between them. Maintainers at the wing level work to<br />
support operational effectiveness; however, higher levels of Air<br />
Force supervision appear more focused on improving strategic<br />
readiness. This disconnect in priorities was determined to be a<br />
root cause of the C-5 TNMCM rate being below Air Force<br />
standards. This article does not advocate one metric over another.<br />
That choice is left for Air Force leadership to make. This article<br />
illustrates that, in this case, the primary metrics at varying levels<br />
of aircraft maintenance are not aligned and not complementary<br />
to one another.<br />
If the Air Force’s primary goal<br />
is to improve the C-5 fleet<br />
TNMCM rate, then priorities of<br />
the maintainers in the field must<br />
change. As the MXG leadership<br />
focuses on HSLDR performance,<br />
not TNMCM, the MXP<br />
simulation indicated that<br />
improving the TNMCM rate<br />
would require an increase in<br />
resources. Therefore, in order to<br />
improve the TNMCM rate<br />
without increased resources, the<br />
maintainers in the field must<br />
make TNMCM a priority. While<br />
C<br />
it is impossible to model the<br />
current system perfectly, the<br />
results suggest that current<br />
maintenance policies do not<br />
ensure TNMCM improvement,<br />
but do improve HSLDR, which C<br />
is the stated priority of the MXG<br />
leadership. Therefore, the study C<br />
team recommended that<br />
MAJCOM A4 leadership and<br />
MXG leadership decide on a set<br />
of metrics that are better aligned<br />
toward the same goal.<br />
This realignment of metrics<br />
must start at the highest levels of<br />
the M<strong>AF</strong>. The M<strong>AF</strong> should<br />
choose its value measure and<br />
create a set of metrics aligned<br />
with that measure. For example,<br />
if the M<strong>AF</strong> directs that<br />
Annual Edition, <strong>Vol</strong>ume XXXIII, Number 1<br />
operational effectiveness is its primary value, then metrics such<br />
as Tons of Cargo Moved or Million Ton Miles Moved over a<br />
given time period could be used as the value metric. Then it must<br />
be determined whether or not metrics at lower levels are aligned<br />
with the value metric. Once that is determined, all levels of<br />
maintenance leadership will have the same overarching<br />
priorities. Dr Hammer describes the entire view as pulling it<br />
together and lists three things to consider:<br />
Deciding what to measure is a science<br />
Deciding how to measure is an art<br />
Using measures is a process<br />
100<br />
Delays + Cancellations<br />
100<br />
Revenue Departures<br />
100<br />
Recommendations<br />
If improving C-5 TNMCM rates is the goal, all levels of<br />
maintenance leadership must make improving TNMCM rates<br />
a priority.<br />
AMC should determine its priorities between operational<br />
effectiveness and strategic readiness, and determine metrics<br />
aligned with these priorities.<br />
Conduct a study to determine whether or not increased AA is<br />
correlated with increased operational effectiveness in million<br />
ton miles or another pertinent metric. The answer to this<br />
Technical Issues<br />
Revenue Departures<br />
100<br />
Where technical issues include dispatches for mechanical,<br />
process, policy, and paperwork issues associated with delays<br />
and cancellations.<br />
Number of Unscheduled Aircraft Out of Service<br />
Total Inflight Shutdowns x 1,000<br />
Total Engine Hours<br />
Number of Maintenance Carryovers<br />
Number of Restricted Items<br />
Total Unscheduled Removals x 1,000<br />
Total Hours<br />
Pilot Reports x 1,000<br />
Total Flying Hours<br />
Number of Diversions, Air Turn Backs and<br />
Rejected Takeoffs for Mechanical Reasons<br />
Table 6. Delta Airlines Maintenance Metrics<br />
143
144<br />
question will help determine the applicability of AA towards<br />
measuring operational effectiveness.<br />
AMC/A4 develop simpler, more concrete maintenance<br />
metrics that are easily countable and give an indication that<br />
operational effectiveness and or strategic readiness is going<br />
to be affected.<br />
As previously mentioned, the metrics analysis, modeling, and<br />
simulation described in this article was developed as part of the<br />
larger C-5 TNMCM Study II. This is the second in a series of<br />
articles related to that study. The entire study can be found at<br />
the Defense Technical Information Center (DTIC) Private<br />
Scientific and Technical Information Network (STINE T) Web<br />
site at https://dtic-stinet.dtic.mil/.<br />
<strong>No</strong>tes<br />
1. <strong>AF</strong>LMA, Metrics Handbook for Maintenance Leaders, December<br />
2001, 3.<br />
2. <strong>AF</strong>LMA, 6.<br />
3. <strong>AF</strong>I 21-101, Aircraft and Equipment Maintenance <strong>Management</strong>,<br />
29 June 2006, 23.<br />
4. Ibid.<br />
5. Michael Hammer, Harnessing the Power of Process, personal<br />
presentation, 22 September 2006.<br />
6. Ibid.<br />
7. Study team notes from meeting with AMC/A4 and AMC/A9, Scott<br />
<strong>AF</strong>B, 1 December 2006.<br />
8. Study team notes from in-progress review VTC with <strong>AF</strong>MC/A4, AMC/<br />
A4M, <strong>AF</strong>/A4MY, and OAS/XRA, VTC, 31 January 2007.<br />
9. Study team notes from MXG Daily Production Meeting, 12 December<br />
2006.<br />
10. Study team notes from meeting with MXG leadership, 18 January<br />
2007.<br />
11. Study team notes from meetings with MXG leadership, 17-19 January<br />
2007.<br />
12. Study team notes from meeting with MXG leadership, 8 January 2007.<br />
13. Study team notes from meeting with MXG leadership, 11 January<br />
2007.<br />
14. <strong>AF</strong>I 21-101, 27-28.<br />
15. Ibid.<br />
16. <strong>AF</strong>I 21-101, 433.<br />
17. <strong>AF</strong>I 21-101, 24-25.<br />
18. Hammer.<br />
19. <strong>AF</strong>I 21-101, 26.<br />
20. <strong>AF</strong>I 21-101, 28.<br />
21. Jason Howe, Using FleetFocus M5 for Practical Fleet <strong>Management</strong>,<br />
PowerPoint presentation, 2007, 14.<br />
22. Dennis D. Wackerly, et al, Mathematical Statistics with Applications<br />
6 th ed, Pacific Grove, CA: Duxbury/Thomas Learning, Inc, 2002, 250-251.<br />
23. 60 th MXG/CCC, “Recovery Maintenance Brief,” Power Point<br />
presentation, Travis <strong>AF</strong>B, 20 July 2006, 20; and “Recovery<br />
Maintenance Bullet Background Paper,” Word document, Travis <strong>AF</strong>B,<br />
20 July 2006, 1.<br />
24. Gregory Porter, ACSSS/GFWAC, “Recovery Centered Maintenance<br />
(RCM) Talking Paper,” Robins <strong>AF</strong>B, 4 May 2007, 1.<br />
25. Harold S. Balaban, et al, “A Simulation Approach to Estimating Aircraft<br />
Mission Capable Rates for the United States Air Force,” Proceedings<br />
of the 2000 Winter Simulation Conference, 2000, 1035-1042.<br />
26. Balaban, et al, 1037.<br />
27. Balaban, et al, 1040.<br />
28. Study team notes from meeting with MXG leadership, 18 January<br />
2007.<br />
29. Ibid.<br />
30. Jim Hylton and Jeff Finken, Delta Airlines Reliability Program Office,<br />
telephone interview, 12 March 2007.<br />
31. Ibid.<br />
<strong>32</strong>. Ibid.<br />
33. Hylton and Finken.<br />
34. Ibid.<br />
35 Ibid.<br />
36. Ibid.<br />
37. Delta Technical Operations, http://www.delta.com/<br />
business_programs_services/technical_operations/<br />
about_delta_techops/experience_awards/index.jsp, 8 May 2007.<br />
Major Scotty A. Pendley is currently the Chief,<br />
Maintenance Studies Branch, <strong>Logistics</strong> Innovation Studies<br />
Division, Air Force <strong>Logistics</strong> <strong>Management</strong> <strong>Agency</strong>.<br />
Benjamin A. Thoele is currently the Executive Director of<br />
the FitWit Foundation in Atlanta, Georgia. He previously<br />
worked as a Captain in the Air Force <strong>Logistics</strong> <strong>Management</strong><br />
<strong>Agency</strong> as an operations researcher and Chief, <strong>Logistics</strong><br />
Analysis.<br />
Major Timothy W. Albrecht is currently Chief, Operational<br />
Assessments, <strong>AF</strong>CENT/A3XL, Long Range Plans. He<br />
previously worked in the Air Force <strong>Logistics</strong> <strong>Management</strong><br />
<strong>Agency</strong> as Chief Analyst.<br />
Jeremy A. Howe is currently employed with the Whirlpool<br />
Corporation, Corporate Headquarters, as the Manager,<br />
<strong>No</strong>rth American Region Supply Chain Metrics Team. He<br />
previously worked as a Captain in the Air Force <strong>Logistics</strong><br />
<strong>Management</strong> <strong>Agency</strong> as Chief, Munitions Analysis.<br />
Major Anthony F. Antoline is currently the Chief, <strong>Logistics</strong><br />
<strong>Logistics</strong> Transformation Division, Air Force <strong>Logistics</strong><br />
<strong>Management</strong> <strong>Agency</strong>.<br />
Roger D. Golden is the Director, Air Force <strong>Logistics</strong><br />
<strong>Management</strong> <strong>Agency</strong>.<br />
<strong>Logistics</strong>…embraces not merely the traditional functions of supply and<br />
transportation in the field, but also war finance, ship construction, munitions<br />
manufacture, and other aspects of war economy.<br />
—Lieutenant Colonel George C. Thorpe, USMC<br />
<strong>Logistics</strong> comprises the means and arrangements which work out the plans of<br />
strategy and tactics. Strategy decides where to act, logistics brings the troops to that<br />
point.<br />
—General Antoine Henri Jomini<br />
Air Force Journal of <strong>Logistics</strong>
Annual Edition, <strong>Vol</strong>ume XXXIII, Number 1<br />
<strong>Logistics</strong> and Warfare<br />
General Mathew B. Ridgway, of World War II fame, once observed, “What throws you in combat is rarely the fact that<br />
your tactical scheme was wrong … but that you failed to think through the hard cold facts of logistics.” <strong>Logistics</strong> is the<br />
key element in warfare, more so in the 21 st century than ever before. Success on the modern battlefield is dictated by<br />
how well the commander manages available logistical support. Victories by the United States in major wars (and several minor<br />
wars or conflicts) in the 20 th century are linked more directly to the ability to mobilize and bring to bear economic and industrial<br />
power than any level of strategic or tactical design. The Gulf War and operations to liberate Iraq further illustrate this point.<br />
Long before the Allied offensive could start, professional logisticians had to gather and transport men and materiel and provide<br />
for the sustained flow of supplies and equipment that throughout history has made possible the conduct of war. Commanders<br />
and their staffs inventoried their stocks, essayed the kind and quantities of equipment and supplies required for operations in<br />
the severe desert climate, and coordinated their movement plans with national and international logistics networks. “The first<br />
victory in the Persian Gulf War was getting the forces there and making certain they had what they required to fight [Emphasis<br />
added]. Then and only then, would commanders initiate offensive operations.” 1 The same may be said of lightning quick victory<br />
in Iraq, although without the massive stockpile of inventory seen during the Gulf War.<br />
In 1904, Secretary of War Elihu Root warned, “Our trouble will never be in raising soldiers. Our trouble will always be the<br />
limit of possibility in transporting, clothing, arming, feeding, and caring for our soldiers.…” 2 Unfortunately, the historical<br />
tendency of both the political and military leadership to neglect logistics activities in peacetime and expand and improve them<br />
hastily once conflict has broken out may not be so possible in the future as it has in the past. A declining industrial base, flat<br />
or declining defense budgets, force drawdowns, and base closures have all contributed to eliminating or restricting the<br />
infrastructure that made rapid expansion possible. Regardless, modern warfare demands huge quantities of fuel, ammunition,<br />
food, clothing, and equipment. All these commodities must be produced, purchased, transported, and distributed to military<br />
forces. And of course, the means to do this must be sustained.<br />
<strong>No</strong>tes<br />
1. Charles R. Shrader, U.S. Military <strong>Logistics</strong>, 1607-1991, A Research Guide, New York: Greenwood Press, 1992, 3.<br />
2. Shrader, 9.<br />
The Editors, Air Force Journal of <strong>Logistics</strong><br />
The Themes of US Military <strong>Logistics</strong><br />
From a historical perspective, ten major themes stand out in modern US military logistics.<br />
The tendency to neglect logistics in peacetime and expand hastily to respond to military situations or conflict.<br />
The increasing importance of logistics in terms of strategy and tactics. Since the turn of the century, logistical considerations<br />
increasingly have dominated both the formulation and execution of strategy and tactics.<br />
The growth in both complexity and scale of logistics in the 20th century. Rapid advances in technology and the speed and<br />
lethality associated with modern warfare have increased both the complexity and scale of logistics support.<br />
The need for cooperative logistics to support allied or coalition warfare. Virtually every war involving US forces since World<br />
War I has involved providing or, in some cases, receiving logistics support from allies or coalition partners. In peacetime,<br />
there has been an increasing reliance on host-nation support and burden sharing.<br />
Increasing specialization in logistics. The demands of modern warfare have increased the level of specialization among<br />
support forces.<br />
The growing tooth-to-tail ratio and logistics footprint issues associated with modern warfare. Modern, complex,<br />
mechanized, and technologically sophisticated military forces, capable of operating in every conceivable worldwide<br />
environment, require that a significant portion, if not the majority of it, be dedicated to providing logistics support to a<br />
relatively small operational component. At odds with this is the need to reduce the logistics footprint in order to achieve the<br />
rapid project of military power.<br />
The increasing number of civilians needed to provide adequate logistics support to military forces. Two subthemes dominate<br />
this area: first, unlike the first half of the 20th century, less reliance on the use of uniformed military logistics personnel and,<br />
second, the increasing importance of civilians in senior management positions.<br />
The centralization of logistics planning functions and a parallel effort to increase efficiency by organizing along functional<br />
rather than commodity lines.<br />
The application of civilian business processes and just-in-time delivery principles, coupled with the elimination of large<br />
stocks of spares.<br />
Competitive sourcing and privatization initiatives that replace traditional military logistics support with support from the<br />
private business sector.<br />
The Editors, Air Force Journal of <strong>Logistics</strong><br />
145
146<br />
Scotty A. Pendley, Major, US<strong>AF</strong>, <strong>AF</strong>LMA<br />
Benjamin A. Thoele, FitWit Foundation<br />
Jeremy A. Howe, Whirlpool Corporation<br />
Anthony F. Antoline, Major, US<strong>AF</strong>, <strong>AF</strong>LMA<br />
Roger D. Golden, DPA, <strong>AF</strong>LMA<br />
Air Force Journal of <strong>Logistics</strong>
Annual Edition, <strong>Vol</strong>ume XXXIII, Number 1<br />
Introduction<br />
This article details the process for calculating and establishing<br />
Air Force aircraft total not mission capable maintenance<br />
(TNMCM) standards. It is impossible to discuss the TNMCM<br />
rates and standards without including discussions of<br />
the mission capable (MC) and the total not mission<br />
capable supply (TNMCS) rates and standards. These three<br />
rates are dependent upon one another. Because the rates are<br />
percentages of total unit-possessed time, one rate cannot<br />
increase or decrease without impacting the other two. The Air<br />
Force standards applied to these metrics are interrelated as<br />
well. As discussed in this article, the TNMCM and TNMCS<br />
standards depend on the MC standard. Thus, the formulation<br />
of the MC standard is the foundation for the TNMCS and<br />
TNMCM standards.<br />
The 2003 CORONA directed that Air Force-wide standards<br />
for MC, TNMCM, and TNMCS be established. While directed<br />
toward TNMCM, the research detailed in this article also<br />
revealed that the MC standard is the foundation for<br />
calculating the other two metric standards. As the process<br />
exists currently, the Air Force MC standards are based on<br />
requirements which are determined in one of three ways:<br />
The flying hour or flying schedule requirement<br />
Contract logistics support (CLS) contract<br />
Another requirement based on major command<br />
(MAJCOM) input determined by the designed operational<br />
capability (DOC) statement, readiness study, or any<br />
operational requirement the MAJCOM may use<br />
In the case of the Air Force’s C-5 Galaxy, Air Mobility<br />
Command (AMC) provides the active duty fleet MC standard<br />
to the Air Staff based on the Mobility Requirements Study<br />
(MRS). However, the standard is not actually calculated in<br />
the MRS, it is an assumption used in the MRS.<br />
This is not the case for the separate Air Force Reserve<br />
Command (<strong>AF</strong>RC) and Air National Guard (ANG) fleet C-5<br />
MC standards. Those two values are calculated at the Air Staff<br />
level. The <strong>AF</strong>RC MC standard is calculated from utilization<br />
rate, attrition, turn pattern, annual fly days, spares, aircraft held<br />
down for scheduled maintenance, and primary aerospace<br />
vehicles authorized. The ANG MC standard equation uses<br />
variables portraying daily operations and maintenance<br />
(O&M) flying hours, aircraft taskings per flying day over and<br />
147
There are numerous implications<br />
for the complex, seemingly<br />
disjointed standards methodology<br />
that are problematic for the Air<br />
Force at the strategic, operational,<br />
and tactical levels.<br />
At the request of the Air Force Materiel Command Director<br />
of <strong>Logistics</strong>, <strong>AF</strong>LMA conducted an analysis in 2006-2007<br />
of total not mission capable maintenance (TNMCM)<br />
performance with the C-5 Galaxy aircraft as the focus. The<br />
C-5 TNMCM Study II included five objectives. One of those<br />
objectives was to analyze the process for calculating and<br />
establishing TNMCM standards. This article details the<br />
analysis conducted in support of that particular study<br />
objective.<br />
It is important to recognize that any discussion of TNMCM<br />
rates and standards must also include discussions of the<br />
mission capable (MC) and the total not mission capable<br />
supply (TNMCS) rates and standards. These three rates are<br />
dependent upon one another. Because the rates are<br />
percentages of total unit-possessed time, one rate cannot<br />
increase or decrease without impacting the other two. The<br />
Air Force standards applied to these metrics are interrelated<br />
as well. As the authors point out, the TNMCM and TNMCS<br />
standards depend on the MC standard. Thus, the formulation<br />
of the MC standard is the foundation for the TNMCS and<br />
TNMCM standards.<br />
The research demonstrates that the process for<br />
calculating and establishing Air Force-level TNMCM<br />
standards is not well known across the Air Force and not<br />
equally applied across the total force. Also, the process<br />
currently in use does not produce realistic, capability-based<br />
metrics to drive supportable operational decisions.<br />
The authors conclude by recommending that a repeatable<br />
methodology be developed to compute the TNMCM standard<br />
so that it:<br />
148<br />
Reflects day-to-day minimum operational requirements<br />
Adjusts to fully mobilized force capabilities and surge<br />
mobility requirements<br />
Accounts for historic capabilities and fleet resources<br />
above O&M flying, average number of aircraft required for<br />
standard flying operations each day, required daily spares, and<br />
the forecasted number of unit possessed aircraft over the year.<br />
Background<br />
This article is the third in a three-part series based on Air Force<br />
<strong>Logistics</strong> <strong>Management</strong> <strong>Agency</strong> (<strong>AF</strong>LMA) project number<br />
LM200625500, the C-5 TNMCM Study II. At the request of the<br />
Air Force Materiel Command Director of <strong>Logistics</strong> (<strong>AF</strong>MC/A4),<br />
an <strong>AF</strong>LMA study team conducted an analysis in 2006-2007 of<br />
TNMCM performance with the C-5 aircraft as the focus. The C-5<br />
TNMCM Study II included five objectives. One of those objectives<br />
was to analyze the process for calculating and establishing aircraft<br />
TNMCM standards. This article details the analysis conducted<br />
in support of that particular study objective.<br />
Maintenance Metric Definitions<br />
Air Force Instruction (<strong>AF</strong>I) 21-101, Aircraft Equipment and<br />
Maintenance <strong>Management</strong>, defines the MC, TNMCS, and<br />
TNMCM metrics and their uses. For additional insight on the use<br />
of these metrics see Metrics Handbook for Maintenance Leaders.<br />
Mission Capable (MC) Rate<br />
Though a lagging indicator, the MC rate is perhaps the best known<br />
yardstick for measuring a unit’s performance. It is the percentage<br />
of possessed hours for aircraft that are fully mission capable (FMC)<br />
or partially mission capable (PMC) for specific measurement<br />
periods (such as monthly or annually). 1<br />
Total <strong>No</strong>t Mission Capable Maintenance (TNMCM) Rate<br />
Though a lagging indicator, the TNMCM rate is perhaps the most<br />
common and useful metric for determining if maintenance is being<br />
performed quickly and accurately. It is the average percentage of<br />
possessed aircraft (calculated monthly or annually) that are unable<br />
to meet primary assigned missions for maintenance reasons<br />
(excluding aircraft in B-Type possession identifier code status).<br />
Any aircraft that is unable to meet any of its wartime missions is<br />
considered not mission capable. The TNMCM is the amount of<br />
time aircraft are in NMCM plus not mission capable both (NMCB)<br />
status. 2<br />
Total <strong>No</strong>t Mission Capable Supply (TNMCS) Rate<br />
Though this lagging metric may seem a logistics readiness<br />
squadron responsibility because it is principally driven by<br />
availability of spare parts, it is often directly indicative of<br />
maintenance practices. For instance, maintenance can keep the<br />
rate lower by consolidating feasible cannibalization actions to<br />
as few aircraft as practical. This monthly (annual) metric is the<br />
average percentage of possessed aircraft that are unable to meet<br />
primary missions for supply reasons. The TNMCS rate is the time<br />
aircraft are in not mission capable supply (NMCS) plus not<br />
mission capable both maintenance and supply (NMCB) status.<br />
TNMCS is based on the number of airframes out for mission<br />
capable (MICAP) parts that prevent the airframes from performing<br />
their mission (NMCS is not the number of parts that are MICAP). 3<br />
Air Force Journal of <strong>Logistics</strong>
Fiscal Year (FY) 2007 C-5 Fleet Standards<br />
and Standards Calculations<br />
As previously mentioned, during a 2003 CORONA, the Air Force<br />
Chief of Staff (CS<strong>AF</strong>) directed the establishment of Air Force-wide<br />
standards for the MC, TNMCS, and TNMCM metrics. Headquarters<br />
(HQ) Air Force Instalations and <strong>Logistics</strong> (now <strong>AF</strong>/A4) was named<br />
the office of primary responsibility (OPR). Their charter was to<br />
develop Air Force standards rooted in operational requirements and<br />
resources dedicated to each weapon system or mission design series<br />
(MDS). They subsequently developed calculation methodologies<br />
for calculating MC, TNMCS, and TNMCM standards. However, as<br />
of the time of the original study research, the study team found no<br />
official publication documenting the methodology for calculating<br />
these maintenance metric standards. Consequently, OPRs at the HQ<br />
Air Force and MAJCOM levels provided the study team with the<br />
definitions for the calculation methodologies that produced the C-<br />
5 fleet maintenance standards used in FY 2007. Table 1 summarizes<br />
the 2007 C-5 standard percentage rates for the MC, TNMCS and<br />
TNMCM metrics. An explanation of each method for deriving the<br />
standards follows.<br />
MC Standard<br />
The MC standard provides the foundation for calculating the other<br />
maintenance metric standards. According to HQ Air Force,<br />
Directorate of Maintenance, Weapons Systems Division,<br />
Sustainment Branch (<strong>AF</strong>/A4MY) personnel, the MC standards are<br />
based on requirements. The MC standard represents the percentage<br />
of MC aircraft required at the beginning of each flying day. That<br />
requirement is determined by one of the following three ways: 5<br />
The flying hour or flying schedule requirement, calculated using<br />
Equation 1, 2, or 3.<br />
Contract logistics support (CLS) contract.<br />
Some other requirement based on MAJCOM input. That input<br />
can be a DOC statement, readiness study, or any operational<br />
requirement the MAJCOM may use.<br />
The Air Reserve Component (ARC), a composite of both ANG<br />
and <strong>AF</strong>RC, MC standard is based on the number of aircraft<br />
committed to the flying schedule. However, the ANG flying<br />
commitment is based on O&M flying hours, transportation working<br />
capital fund (TWCF) hours, and the number of operations alert<br />
committed aircraft per flying day. Also included is the daily spares<br />
requirement. This commitment in aircraft is divided by the<br />
forecasted possessed aircraft to determine the MC requirement. 6<br />
Each year, <strong>AF</strong>/A4MY personnel request input from AMC for the<br />
MC standard. AMC determines the MC rate necessary to meet their<br />
airlift requirement and then gives their desired MC rate to Air Staff.<br />
Air Staff then uses this rate as the MC standard. This process is<br />
currently used to determine the active duty MC standards for the<br />
C-17, C-5, C130, KC-10, and KC-135 airframes. 7 These MC<br />
standards are based solely on AMC’s input. <strong>AF</strong>/A4MY personnel<br />
do not calculate the MC standard for any of the above listed active<br />
duty fleets.<br />
Annual Edition, <strong>Vol</strong>ume XXXIII, Number 1<br />
Article Acronyms<br />
AA – Aircraft Availability<br />
AAT – Aircraft Availability Target<br />
AC – Aircraft<br />
ACC – Air Combat Command<br />
AE – Aeromedical Evacuation<br />
<strong>AF</strong>B – Air Force Base<br />
<strong>AF</strong>I – Air Force Instruction<br />
<strong>AF</strong>LMA – Air Force <strong>Logistics</strong> <strong>Management</strong> <strong>Agency</strong><br />
<strong>AF</strong>MC – Air Force Materiel Command<br />
<strong>AF</strong>RC – Air Force Reserve Command<br />
<strong>AF</strong>SO21 – Air Force Smart Operations for the 21 st<br />
Century<br />
AMC – Air Mobility Command<br />
ANG – Air National Guard<br />
BE – Business Effort<br />
CLS – Contract <strong>Logistics</strong> Support<br />
CONOPS – Concept of Operations<br />
CS<strong>AF</strong> – Chief of Staff, United States Air Force<br />
DOC – Designed Operational Capability<br />
DoD – Department of Defense<br />
FMC – Fully Mission Capable<br />
FY – Fiscal Year<br />
GAO – Government Accountability Office<br />
HQ – Headquarters<br />
LMI – <strong>Logistics</strong> <strong>Management</strong> Institute<br />
LRS – <strong>Logistics</strong> Readiness Squadron<br />
MAJCOM – Major Command<br />
MC – Mission Capable<br />
MCS – Mobility Capabilities Study<br />
MDS – Mission Design Series<br />
MERLIN – Multi-Echelon Resource and <strong>Logistics</strong><br />
Information Network<br />
MICAP – Mission Capable<br />
MRS – Mobility Requirements Study<br />
NMCB – <strong>No</strong>t Mission Capable Both<br />
NMCM – <strong>No</strong>t Mission Capable Maintenance<br />
NMCS – <strong>No</strong>t Mission Capable Supply<br />
O&M – Operations and Maintenance<br />
OPR – Office of Primary Responsibility<br />
PAA – Possessed Aircraft Authorized<br />
PMC – Partially Mission Capable<br />
REMIS – Reliability and Maintainability Information<br />
System<br />
RERP – Reliability Enhancement and Re-Engining<br />
Program<br />
TNMCM – Total <strong>No</strong>t Mission Capable Maintenance<br />
TNMCS – Total <strong>No</strong>t Mission Capable Supply<br />
TWCF – Transportation Working Capital Fund<br />
UTE - Utilization<br />
149
150<br />
MC<br />
TNMCS<br />
TNMCM<br />
Active Duty ARC <strong>AF</strong>RC ANG<br />
Standard 75 50 50 47<br />
Method MAJCOM Input Equation 3 Equation 1 Equation 2<br />
Standard 8 8<br />
Method Equation 4 Equation 4<br />
Standard 24 50<br />
Method Equation 6 Equation 6<br />
Table 1. FY 2007 C-5 Maintenance Standards and Calculation Methodologies 4<br />
The three MC standard requirement algorithms are detailed<br />
in Equations 1, 2, and 3. Equation 1 is typically used with active<br />
duty aircraft fleets.<br />
Equation 1. MC Standard 8<br />
Where:<br />
MC std is MC Standard.<br />
UTE is the sortie utilization rate, which is the number of sorties<br />
required to fly each month by authorized aircraft. 12 x UTE yields<br />
the annual sorties required to meet the flying hour program (FHP).<br />
Attrition is the annual attrition rate of sorties lost due to<br />
operations, maintenance, and other considerations such as<br />
weather. Dividing by (1-Attrition) yields the sorties required to<br />
be scheduled to account for attrition.<br />
Turn pattern, or turn rate, is the total number of sorties<br />
scheduled divided by the number of first go sorties. For example:<br />
a unit schedules 100 sorties during the week and 60 of them occur<br />
on the first go of the day. The turn rate would be 100/60 = 1.67.<br />
Dividing by turn pattern yields the number of front-line flyers.<br />
Dividing by the number of fly days yields the number of frontline<br />
flyers per day.<br />
Fly Days = 2<strong>32</strong>. This figure assumes 244 working days minus<br />
12 goal days.<br />
Spares, or front line spares, is the number of scheduled spare<br />
aircraft for the first go.<br />
MC SchdMX is the average number of aircraft per squadron held<br />
down on each flying day for scheduled maintenance including<br />
delayed discrepancies, health of the fleet management, washes,<br />
and so forth.<br />
Spares + MC SchdMX is expressed as a percentage of squadron<br />
possessed aircraft authorized (PAA).<br />
PAA is the number of aircraft authorized for a unit to perform<br />
its operational missions. 9<br />
Equation 2 is the algorithm used by the ANG.<br />
Equation 2. MC Standard for ANG 10<br />
Where:<br />
AC O&M is the average number of committed aircraft based on<br />
the O&M requirements per flying day.<br />
AC TWCF/BE/AE is the number of aircraft required for taskings per<br />
flying day that the ANG supports above its O&M flying (such<br />
as TWCF, aeromedical<br />
evacuation (AE), business<br />
effort [BE]).<br />
AC Ops is the average number<br />
of aircraft required for standard<br />
flying operations per flying<br />
day.<br />
Spares is the same as in<br />
Equation 1, but is reported as<br />
the number of aircraft per<br />
flying day.<br />
AC Forecast is the number of aircraft that are expected to be unit<br />
possessed over the year based on depot maintenance schedules<br />
and other considerations.<br />
shown in the numerator of Equation 2 denotes the smallest<br />
integer greater than or equal to x. This function rounds any<br />
decimal value up to the next whole number. The ceiling function<br />
is used in order to speak in terms of whole aircraft.<br />
Equation 3 is utilized to calculate the MC standard for the<br />
composite ARC portion of an aircraft fleet.<br />
Equation 3. MC Standard for ARC Fleet 11<br />
The MC standard for the <strong>AF</strong>RC (MC <strong>AF</strong>RC ) fleet is calculated<br />
using the standard MC equation given in Equation 1. For<br />
simplicity, the result of this formula is rounded to the nearest<br />
tenth.<br />
TNMCS Standard<br />
Active duty and ARC fleets use the same methodology for<br />
TNMCS once the MC standard is established. This calculation<br />
is shown in Equation 4. <strong>No</strong>te that separate TNMCS standards for<br />
<strong>AF</strong>RC and ANG are not calculated.<br />
Equation 4. TNMCS Standard 12<br />
The aircraft availability target (AAT), ties the TNMCS<br />
standard to the funding and requirements for spare parts that are<br />
calculated in the Requirements <strong>Management</strong> System. 13 It assumes<br />
the supply pipeline and spare safety levels are fully funded. The<br />
AAT for the C-5 has been at 92 since the beginning of the<br />
maintenance standard development. This yields a TNMCS<br />
standard of 8 which is applied to both ARC components.<br />
Equation 5 defines the aircraft availability target calculation.<br />
Equation 5. AAT Calculation 14<br />
Required MC is determined the same way that the Air Force<br />
active duty MC standard is determined. 15<br />
NMCM 3 year historical is the 3-year historical average of the NMCM<br />
rate for the particular MDS under consideration.<br />
It is important to note that the maintenance metrics standards<br />
established for FY07 (Table 1) used the FY05 calculated AATs.<br />
Air Force Journal of <strong>Logistics</strong>
This is because the C-5 parts on the shelf in FY07 were based<br />
on the FY05 AATs. 16 As just mentioned, the FY05 AAT for the<br />
C-5 fleet was 0.92. The <strong>Logistics</strong> <strong>Management</strong> Institute (LMI)<br />
updated the AAT-setting methodology in 2006 to include<br />
computations for Required MC and NMCM rates for both dayto-day<br />
operations and predeployment. 17<br />
Equation 6. TNMCM Standard 18<br />
TNMCM Standard (Equation 6):<br />
PAA<br />
Command<br />
Input<br />
PAA<br />
(FY07<br />
Actual)<br />
Annual Edition, <strong>Vol</strong>ume XXXIII, Number 1<br />
UTE Attrition<br />
Turn<br />
Pattern<br />
weights in determining the composite ARC MC standard, <strong>AF</strong>/<br />
A4MY used the PAAs for FY07, which included the additions<br />
for the gaining units. These values are 40 for <strong>AF</strong>RC and 29 for<br />
ANG.<br />
<strong>AF</strong>RC MC Standard (Equation 1):<br />
Fly<br />
Days<br />
Spares<br />
<strong>AF</strong>RC <strong>32</strong> 40 8.5 0.23 1.3 2<strong>32</strong> 2 0<br />
PAA<br />
Command<br />
Input<br />
TNMCM Standard<br />
Active duty and ARC fleets use the same methodology for<br />
TNMCM once the respective MC standard is established. This<br />
calculation is shown in Equation 6. <strong>No</strong>te that separate TNMCM<br />
standards for <strong>AF</strong>RC and ANG are not calculated.<br />
NMCB 3 yr historical is the average NMCB rate over the previous 3<br />
years. The data used for the FY07 calculation came from the<br />
Reliability and Maintainability Information System (REMIS);<br />
the average NMCB for FY04, FY05, and FY06 equaled 0.07. 19<br />
Standards Calculation Examples<br />
This section applies the above formulas to the real-world data<br />
that produced the metric standards in Table 1.<br />
FY07 Active Duty C-5 Fleet<br />
MC Standard (MAJCOM Input):<br />
AMC stated that the MC standard is 0.75 (75 percent) based<br />
on an operational requirement used in the Mobility Requirements<br />
Study (MRS) 2005 (MRS-05).<br />
TNMCS Standard (Equation 4):<br />
FY07 ARC C-5 Fleet<br />
The data required to calculate the ARC standards for FY07 is<br />
given in Table 2. <strong>AF</strong>RC and ANG provided the data in response<br />
to the FY07 Air Force Standards Data Call.<br />
The PAA numbers the commands provided were <strong>32</strong> for the<br />
<strong>AF</strong>RC and 16 for the ANG. These values reflected the PAA before<br />
the PAA was adjusted to accommodate units recently gaining<br />
C-5s. To compute the <strong>AF</strong>RC MC standard, <strong>AF</strong>/A4MY used the<br />
PAA based on <strong>AF</strong>RC input, which was <strong>32</strong>. However, for the Of<br />
PAA<br />
(FY07<br />
Actual)<br />
O&M<br />
AC/day<br />
TWCF,BE, Spares/<br />
AE AC/day day<br />
Possessed<br />
Ops<br />
AC<br />
AC/day<br />
Forecast<br />
ANG 16 27 3.84 1.19 1.3 0.45 15<br />
Table 2. Data for <strong>AF</strong>RC and ANG MC Standard Calculations 20<br />
ANG MC Standard (Equation 2):<br />
ARC MC Standard (Equation 3):<br />
TNMCS Standard (Equation 4):<br />
TNMCM Standard (Equation 6):<br />
note is the fact that the 3-year average NMCB was actually 0.166<br />
(based on Multi-Echelon Resource and <strong>Logistics</strong> Information<br />
Network [MERLIN] data). <strong>AF</strong>/A4MY capped the NMCB at 0.08<br />
because the historical NMCB cannot theoretically exceed the<br />
TNMCS. Recall that TNMCS is the sum of NMCS and NMCB;<br />
therefore, NMCB should be less than or equal to TNMCS. 21 The<br />
TNMCS standard is established as a resourced goal and the Air<br />
Force is trying to achieve a balance in the maintenance<br />
standards. 22<br />
AMC Determination of the C-5 MC<br />
Operational Requirement<br />
According to <strong>AF</strong>/A4MY and AMC/A4MXA, AMC provides Air<br />
Staff with the value for the MC standard for the active duty fleet.<br />
This standard has been 75 percent since 2003, the year that Air<br />
Force-wide standards were implemented. 23 AMC/A4MXA stated<br />
MC for<br />
Sched<br />
Mx<br />
that the value of 75 percent was<br />
based on the MRS. 24 According<br />
to the AMC/A9 office, every<br />
major mobility study including<br />
the MRS (1992), the MRS<br />
Bottom-Up Review Update<br />
(1995), MRS-05 (2000), and the<br />
Mobility Capabilities Study<br />
(2005), has used 75 percent as the<br />
C-5 MC rate standard to<br />
151
determine the capability of the C-5 fleet to support the mobility<br />
forces. 25<br />
Examination of the MRS-05 revealed the MRS-05 did not<br />
calculate an MC standard; the MRS-05 assumed an MC rate of<br />
76 percent for a fleet in which all C-5s have had the Reliability<br />
Enhancement and Re-Engining Program (RERP) modifications.<br />
The MRS-05 explains that the use of 76 percent MC rate is<br />
because of expected RERP improvements. The study also<br />
assumes a 65 percent MC rate for aircraft that have not received<br />
the RERP improvements. 26 The director of the AMC office of<br />
Analysis, Assessments, and Lessons Learned (AMC/A9)<br />
concurred that the C-5 MC standard is not based on any formal<br />
calculation or analysis, and stated that the original estimate (circa<br />
1990) of a 75 percent MC rate was deemed “a prudent objective”<br />
for planning purposes. 27 AMC/A9 stated that the 75 percent MC<br />
rate assumes a fully mobilized total force to support C-5<br />
maintenance operations. 28<br />
In summary, the FY07 MC, TNMCS, and TNMCM standards<br />
for the C-5 active duty fleet are based on the assumption that the<br />
C-5 fleet can achieve a 75 percent MC rate with the entire fleet<br />
receiving RERP upgrades or a fully mobilized total force to<br />
support maintenance operations.<br />
152<br />
Implications of the Methodology<br />
There are numerous implications of this complex, seemingly<br />
disjointed standards methodology that are problematic for Air<br />
Force members at the strategic, operational, and tactical levels.<br />
First, Equation 1, in its present state, is more appropriate for<br />
fighter aircraft than mobility aircraft. 29 For example, the Turn<br />
Pattern and MC SchdMX variables are reflective of fighter aircraft<br />
flying schedules. Mobility aircraft are less often turned on the<br />
same flying day, and mobility aircraft units, having a relatively<br />
small number of PAA, often have less opportunity to hold aircraft<br />
down for fleet health purposes. Consequently, this is a<br />
contributing factor to <strong>AF</strong>/A4MY’s rationale of using AMC’s<br />
input to determine active duty standards. The study team<br />
concluded that if Equation 1 is not appropriate for heavy aircraft,<br />
then it should not be used as a foundation for the MC standard.<br />
The variables used to measure performance need to accurately<br />
reflect the relevant process.<br />
An additional issue is a lack of consistency across the total<br />
force components. The active duty component uses AMC input<br />
to determine the MC standard, but the ARC uses calculation<br />
methodology. Moreover, in addition to the planning objective<br />
used to determine the active duty maintenance standards and the<br />
calculations used to determine the ARC standards, the total force<br />
components, including the ANG, have maintenance metric goals.<br />
These goals are separate from the Air Force standards and are<br />
calculated differently. Within the ANG, units report their<br />
performance with regard to the ANG goals, and not necessarily<br />
the ARC metric standards. While the functional mission<br />
differences between fighter and mobility aircraft may justify<br />
distinct calculation methodologies, inconsistencies within a<br />
given airframe (for example, the C-5) are less easily supported.<br />
Consistency, in fact, is identified by <strong>AF</strong>I 21-101 as one of four<br />
important characteristics of a metric. These four characteristics<br />
are:<br />
Accurate and useful for decisionmaking<br />
Consistent and clearly linked to goals or standards<br />
Clearly understood and communicated<br />
Based on a measurable, well-defined process30 The fourth characteristic mentioned above highlights another<br />
concern given the current methodology for calculating the C-5<br />
standards. Fundamentally, the process is not rigidly followed as<br />
part of formal policy; rather, the practice of establishing standards<br />
involves numerous deviations, discussed at length earlier in this<br />
article (active duty MC input, AAT from FY05, ANG goals).<br />
Simply stated, there was no complete, published, defined process.<br />
In April 2003, the United States Government Accountability<br />
Office (GAO) discussed these same issues in a report addressing<br />
aircraft availability goals across the Department of Defense<br />
(DoD). 31 The GAO found that all branches of military Service<br />
fail to clearly define the standards computation process for<br />
aircraft maintenance metrics.<br />
The following selected comments were taken from the GAO<br />
report’s executive summary:<br />
Despite their importance, DoD does not have a clear and defined<br />
process for setting aircraft availability goals. The goal-setting process<br />
is largely undefined and undocumented, and there is widespread<br />
uncertainty among the military Services over how the goals were<br />
established, who is responsible for setting them, and the continuing<br />
adequacy of MC and FMC goals as measures of aircraft availability.<br />
DoD guidance does not define the availability goals that the Services<br />
must establish or require any objective methodology for setting them.<br />
<strong>No</strong>r does it require the Services to identify one office as the<br />
coordinating agent for goal setting or to document the basis for the<br />
goals chosen. <strong>32</strong><br />
Speaking in terms of consequence, the GAO suggested that<br />
the “lack of documentation in setting the goals ultimately<br />
obscures basic perceptions of readiness and operational<br />
effectiveness.” 33 Additionally, the report documented several<br />
findings specifically relevant to establishing standards for the<br />
Air Force. These findings included:<br />
Air Force officials told [the GAO] that they generally try to<br />
keep the goals high because it is difficult to stop the goals<br />
from dropping further once they begin to be lowered. 34<br />
Air Combat Command could find no historical record of the<br />
process used to establish most of the goals. 35<br />
AMC compared the goals with the actual rates for the previous<br />
2 years. Depending upon actual performance, the goal could<br />
then be changed, sometimes on the basis of subjective<br />
judgments. 36<br />
It is vitally important to examine the effectiveness and<br />
validity of metrics and their associated standards. Many hours<br />
are spent preparing for and participating in meetings discussing<br />
the performance of organizations, all of which is wasted if the<br />
metrics or standards are ineffective at measuring organizational<br />
performance and driving the desired behavior. Budgets and other<br />
requirements are driven in part from metrics. If the metrics being<br />
utilized are not valid, the effectiveness of the organization to<br />
meet warfighter needs is also difficult to accurately measure.<br />
Air Force maintenance metrics are presented with an<br />
associated numerical standard or goal 37 and managers are required<br />
to account for failure to meet those standards. These failures are<br />
reported at unit, command, and Air Force levels, but what if the<br />
established standard is inaccurate, unrealistic, or unattainable?<br />
Consider Table 3, which identifies historical MC performances<br />
Air Force Journal of <strong>Logistics</strong>
for the C-5 at various points in time compared with the<br />
assumption used in establishing the C-5 MC standard.<br />
During Operations Desert Shield and Desert Storm in FY91,<br />
the MC rate was less than 71 percent. During Operation Iraqi<br />
Freedom in FY03, the MC rate was less than 64 percent. This is<br />
particularly intriguing because numerous personnel interviewed<br />
during the original research suggested MC rates have been or<br />
should be usually better during conflicts. 39 Indeed, the highest<br />
quarterly MC rate the C-5 total fleet achieved, 81.8 percent, was<br />
observed during first quarter of FY91 (during Operation Desert<br />
Shield). Considering the data points in Table 3 are rates achieved<br />
during wartime scenarios, the feasibility of using 75 percent as<br />
the day to day, peacetime C-5 MC standard appears questionable<br />
at best.<br />
Still, consistent failures to meet a standard can often be<br />
perceived as a shortfall in the performance of the units supporting<br />
the C-5, rather than an unrealistic expectation not being met.<br />
Again, a tremendous amount of time and effort is put forth<br />
explaining why standards are not met. Historical C-5 MC rate<br />
performance would suggest that the standard and its associated<br />
metric are not driving improvement in performance, which is the<br />
fundamental purpose of a performance measure. A metric and its<br />
associated standard should drive performance, not simply<br />
document it, and the measure should be useful for<br />
decisionmaking. Additionally, the Air Force Smart Operations<br />
for the 21 st Century Concept of Operations (CONOPS) identifies<br />
good process metrics as having the following attributes: 40<br />
Accurate – reliably expresses the phenomenon being measured<br />
Objective – not subject to dispute<br />
Comprehensible – readily communicated and understood<br />
Easy – inexpensive and convenient to compute<br />
Timely – data sources are available<br />
Robust – resistant to being gamed and hard to manipulate41 As previously stated, the current standards methodology<br />
involves differences across the total force. Additionally, the study<br />
team interviewed many subject matter experts while conducting<br />
site visits for this research. Some of them indicated the consistent<br />
inability to achieve an MC standard of 75 percent led to an<br />
attitude of frustration, indifference and apathy towards the<br />
standards. 42 <strong>AF</strong>I 21-101 states that “metrics shall be used at all<br />
levels of command to drive improved performance.” 43 In the case<br />
of the C-5, the existing maintenance standards methodology<br />
associated with the MC and TNMCM metrics appear to cause<br />
those metrics to fall short of this goal.<br />
Alternative Strategies to<br />
Performance Measurement<br />
As described in the second article in this series, the <strong>AF</strong>LMA<br />
study team interviewed<br />
representatives from the Delta<br />
Airlines reliability programs<br />
office as a means of comparing<br />
business practices. Delta<br />
personnel identified nine main<br />
aircraft maintenance metrics. Of<br />
note was the fact that Delta’s<br />
Annual Edition, <strong>Vol</strong>ume XXXIII, Number 1<br />
primary metrics (those driven by delays and cancellations) were<br />
not measured to an objective standard (met or not met); instead,<br />
they alert when they exceed a control limit for 2 consecutive<br />
months. 44<br />
Using control limits, found in control charts, is a commonly<br />
used technique for determining if a process is in a state of<br />
statistical control. First developed by Shewhart, many influential<br />
quality leaders have advocated the proper use of control charts,<br />
most notably W. Edwards Deming. Generally speaking, recent<br />
data is examined to determine the control limits that apply to<br />
future data with the intent being to ascertain whether the process<br />
is in a state of control. 45 Charts alone cannot induce process<br />
control; stabilization or improvement is the challenge of people<br />
in the process. 46 Viable control limits can only be developed for<br />
processes in a state of statistical control, and they are best applied<br />
to process variables rather than product variables. 47 For example,<br />
consider the manufacturing process of a metal component. The<br />
product variables might be thickness or diameter, whereas<br />
process variables could be temperature or pressure at the point<br />
of forging. The benefit of monitoring process variables better<br />
allows someone to assign cause to variation. Using the previous<br />
example, variance in component diameter indicates a problem<br />
but requires further investigation to determine the cause.<br />
However, excessive pressure measurements identify the cause<br />
behind improper component diameter. Essentially, process<br />
variable measurements identify causes that could affect product<br />
variables. 48<br />
Today, many maintenance units are using versions of control<br />
charts to monitor performance in terms of the various metrics<br />
listed in <strong>AF</strong>I 21-101. 49 For example, Figure 1 illustrates TNMCM<br />
performance (large solid black line), with upper and lower control<br />
limits (represented by the solid red lines), at Dover Air Force Base<br />
(<strong>AF</strong>B) during calendar year 2006. Although the effort to use<br />
control charts is a step in the right direction, there can be two<br />
major problems associated with the use of charts akin to those of<br />
Figure 1.<br />
First, Air Force metric measurements such as TNMCM are not<br />
process variables; consequently, they do not lend themselves to<br />
the immediate, precise root-cause analysis that usually follows<br />
from control charts. This is evidenced by the copious explanatory<br />
notes pages accompanying products like the CS<strong>AF</strong> quarterly<br />
review slideshow. 51 In fact, the C-5 TNMCM II study team’s<br />
analytical effort identified 184 factors that bear influence on the<br />
C-5 TNMCM rate. An additional confounding element is that<br />
status of aircraft and the categorization of hours (such as<br />
possessed) bear direct influence on the outcome of rates such as<br />
TNMCM, and this process is not consistent. Study team<br />
discussions with maintenance personnel revealed that aircraft<br />
status is not an exact science, and status documentation can be<br />
vulnerable to manipulation for the sake of improving numbers.<br />
For example, this can happen by delaying aircraft status changes<br />
MC Rate Time Period<br />
AMC C-5 MC Standard 75% ~1990 – Present 38<br />
Operation Desert Shield/Desert<br />
Storm<br />
70.6% Fiscal Year 1991<br />
Operation Iraqi Freedom 63.4% Fiscal Year 2003<br />
Highest Quarterly MC Rate<br />
Achieved<br />
81.8% Fiscal Year 1991, Quarter 1<br />
Table 3. C-5 Fleet Historically Achieved MC Rates 38<br />
153
y not changing the status to NMCM or NMCS as soon as an<br />
aircraft breaks and maintenance is underway or work stoppage<br />
occurs due to needed parts.<br />
The categorization of hours is something that is in stark<br />
contrast with the host of metrics used by Delta Airlines, which<br />
upon examination appeared more tangible, more easily measured,<br />
and less easily manipulated. Again, a thorough discussion of<br />
Delta’s maintenance metrics was included in the second Air Force<br />
Journal of <strong>Logistics</strong> article in this series.<br />
Next, upon examination of the control chart in Figure 1, one<br />
sees that the centerline mean (small dashed line between the solid<br />
red lines) is set at 30.2 for the months in FY07, with the upper<br />
and lower control limits set at <strong>32</strong>.5 and 27.5, respectively. 52 The<br />
study team sought to uncover the specific methodology used to<br />
arrive at the centerline mean, as well as the upper and lower<br />
control limits. Personnel at Dover stated that the control limits<br />
are downward directed from headquarters AMC. The managing<br />
office at AMC stated that the control limits were derived from 2<br />
years of historical data for all of AMC, with a range of one<br />
standard deviation above and below the mean. 53 There are two<br />
issues with this approach. First, the figure is not arrived at through<br />
subgroup sampling of at least 20 subgroups, as advocated by<br />
statistical analysis literature. 54 Secondly, this centerline mean is<br />
known as the AMC goal for the TNMCM rate. Interestingly, it is<br />
higher (that is, less ambitious) than the active duty TNMCM<br />
standard, which was 24 for the FY07 timeframe. The fact that<br />
AMC units are using a different figure than the established active<br />
duty standard for management purposes is further evidence that<br />
fleet standards appear to have limited influence on performance<br />
at base levels.<br />
However, as noted in the 2005 AMC Metrics Handbook,<br />
because AMC command goals are rooted in wartime operational<br />
requirements, there are some standards that are difficult or<br />
impossible to achieve during peacetime operations.<br />
154<br />
Figure 1. Example of TNMCM Control Chart, Dover <strong>AF</strong>B 2006 50<br />
Using the command average is one way around this shortcoming.<br />
Comparing (your base) to command averages helps to gauge true<br />
performance and is invaluable for identifying if a problem is local<br />
or fleet wide. AMC weapons system managers (WSMs)<br />
use command averages<br />
for understanding overall<br />
performance of their fleets. When<br />
discussing performance problems<br />
with AMC WSMs, base<br />
personnel should have a good<br />
understanding of where their base<br />
performance numbers are<br />
in relation to the command<br />
average. 55<br />
It should be noted that the<br />
study team was not advocating<br />
the use of the active duty<br />
standard as the centerline mean<br />
for this control chart. In fact,<br />
extreme caution must be taken<br />
when using a standard value as<br />
opposed to the sampling<br />
mean as the centerline for<br />
performance. Although the<br />
intent might be to control the<br />
process mean at a particular<br />
value, one runs the risk that the current process is incapable of<br />
meeting that standard. For example, if the lower and upper control<br />
limits are calculated from the standard, and the current process<br />
mean exceeds the standard, subgroup averages might often<br />
exceed the upper limit, even though the process is in control.<br />
This lessens the ability to determine assignable causes of<br />
variation, because the only observation is that the process isn’t<br />
conforming to the desired value. 56 This may, in fact, be what was<br />
actually occurring with the MC metrics for the C-5 fleet.<br />
What Should the TNMCM Standard Be?<br />
If the existing standard’s equations were used with current C-5<br />
aircraft data (rather than using the 75 percent MC input from<br />
AMC for the active duty fleet) to calculate the active duty fleet<br />
MC, TNMCS, and TNMCM standards, the resulting standards 57<br />
would be:<br />
MC Standard = 56.8<br />
TNMCS Standard = 20.6<br />
TNMCM Standard = 29.3<br />
These figures are presented for informational purposes only<br />
in order to illustrate the stark contrast with the active duty<br />
standards in place at the time of the original report’s publication<br />
(MC = 75, TNMCS = 8, and TNMCM = 24). The study team was<br />
not advocating the use of the standards presented above. Instead,<br />
the examination presented here and in the study report led to the<br />
recommendation that AMC and Air Staff develop a repeatable<br />
methodology to compute a standard focused on three things.<br />
These three things are listed in the recommendations section of<br />
this article. Such a methodology would better align to the original<br />
charter from the 2003 CORONA, which was to develop Air Force<br />
standards rooted in operational requirements and resources<br />
dedicated to the weapon system or MDS.<br />
Conclusions<br />
The process for calculating and establishing Air Force-level<br />
TNMCM standards is not well known across the Air Force and<br />
Air Force Journal of <strong>Logistics</strong>
not equally applied across the total force. Also, the process<br />
currently in use does not produce realistic, capability-based<br />
metrics to drive supportable operational decisions.<br />
Recommendations<br />
Develop a repeatable methodology to compute the standard that:<br />
Reflects day-to-day minimum operational requirements<br />
Adjusts to fully mobilized force capabilities and surge<br />
mobility requirements<br />
Accounts for historic capabilities and fleet resources<br />
As previously mentioned, the analysis of maintenance metric<br />
standards described in this article was developed as part of the<br />
larger C-5 TNMCM Study II. This is the third and final article in<br />
a series related to that particular research. The entire study report<br />
can be found at the Defense Technical Information Center private<br />
Scientific and Technical Information Network Web site at https:/<br />
/dtic-stinet.dtic.mil/.<br />
<strong>No</strong>tes<br />
1. <strong>AF</strong>I 21-101, Aircraft and Equipment Maintenance <strong>Management</strong>, HQ<br />
US<strong>AF</strong>/A4MM, 29 June 2006, 27-28.<br />
2. <strong>AF</strong>I 21-101, 28.<br />
3. Ibid.<br />
4. <strong>AF</strong>/A4MY, Metrics Chart with Air Staff Input, 6 February, Excel<br />
spreadsheet, 6 February 2007.<br />
5. Ibid.<br />
6. <strong>AF</strong>/A4MY, “C5 <strong>AF</strong>RC_ANG MC STD Explanation,” e-mail,<br />
11 May 2007.<br />
7. <strong>AF</strong>/A4MY, 6 February 2007.<br />
8. <strong>AF</strong>/A4MY, C-5 Maintenance Standards Methodology, PowerPoint<br />
presentation, 27 October 2006, 7-9.<br />
9. <strong>AF</strong>I 21-101, 28.<br />
10. <strong>AF</strong>/A4MY, 11 May 2007.<br />
11. Ibid.<br />
12. <strong>AF</strong>/A4MY, 27 October 2006, 3.<br />
13. Ibid.<br />
14. <strong>Logistics</strong> <strong>Management</strong> Institute, Aircraft Availability Targets, Report<br />
Number <strong>AF</strong>510T1, May 2006, 2-1.<br />
15. <strong>Logistics</strong> <strong>Management</strong> Institute, 2-2.<br />
16. <strong>AF</strong>/A4MY, 27 October 2006, 3.<br />
17. <strong>Logistics</strong> <strong>Management</strong> Institute, 3-1.<br />
18. <strong>AF</strong>/A4MY, 27 October 2006, 3.<br />
19. Figures validated with MERLIN data; actual mean is 0.68 which is<br />
rounded to 0.7.<br />
20. <strong>AF</strong>/A4MY, 11 May 2007.<br />
21. <strong>AF</strong>/A4MY, 27 October 2006, 3.<br />
22. <strong>AF</strong>/A4MY, 11 May 2007.<br />
23. <strong>AF</strong>/A4MY, 27 October 2006, 2.<br />
24. AMC/A4XM, FY 2007 Air Force Standards Data Call, Attachment 1,<br />
Excel spreadsheet, 7 February 2007.<br />
25. Dave Merrill, AMC/A9, e-mail, 7 May 2007.<br />
26. Joint Chiefs of Staff, Mobility Requirements Study-05 Executive<br />
Summary, Washington, DC: The Joint Staff, 23 January 1992, 5.<br />
27. Dave Merrill, AMC/A9, telephone conference call, 8 May 2007.<br />
28. Ibid.<br />
29. Skip Tyler, <strong>AF</strong>/A4MY, telephone interview, 12 January 2007; AMC<br />
Metrics Handbook, 11.<br />
30. <strong>AF</strong>I 21-101, 433.<br />
31. General Accountability Office, DOD Needs a Clear and Defined<br />
Process for Setting Aircraft Availability Goals in the New Security<br />
Environment, Report Number GAO-03-300, April 2003.<br />
Annual Edition, <strong>Vol</strong>ume XXXIII, Number 1<br />
<strong>32</strong>. GAO, executive summary.<br />
33. Ibid.<br />
34. GAO, 15.<br />
35. GAO, 28.<br />
36. Ibid.<br />
37. The Air National Guard uses the term goal as opposed to standard.<br />
This information was obtained from a NGB/A4 Health of the Fleet,<br />
PowerPoint presentation, January 2007.<br />
38. REMIS Data.<br />
39. Personnel interviews, study team site visits, January 2007.<br />
40. <strong>AF</strong>SO21 Concept of Operations, Version 1.0, 15 <strong>No</strong>vember 2006, 19.<br />
Taken from Dr Michael Hammer, Hammer and Company, Harnessing<br />
the Power of Process, 2006.<br />
41. Ibid.<br />
42. Study team site visits, personnel interviews, January 2007.<br />
43. <strong>AF</strong>I 21-101, 23.<br />
44. Ibid.<br />
45. Thomas P. Ryan, Statistical Methods for Quality Improvement, Wiley<br />
& Sons, 2000, 77-134.<br />
46. Ibid.<br />
47. Ibid.<br />
48. Ibid.<br />
49. Study team site visits and personal interviews, Dover <strong>AF</strong>B and Westover<br />
ARB, January 2007.<br />
50. Dover Air Force Base, Display Case MXG Metrics, PowerPoint<br />
presentation, 26 January 2007, slide 2.<br />
51. CS<strong>AF</strong> Quarterly Review Slideshow, second quarter FY 2006, 31<br />
March 2006.<br />
52. Personal interview, AMC/A4XM, 10 May 2007.<br />
53. Ibid.<br />
54. Ryan, 82-86.<br />
55. AMC/A44A, Metrics Handbook for Mobility Air Forces, 3d ed.,<br />
April 2005, 7.<br />
56. Ryan, 98.<br />
57. Data Sources: UTE, Spares, Required Mx MC, PAI: FY07 Air Force<br />
Standards Data Call Spreadsheet, <strong>AF</strong>/A4MY. Attrition, Turn rate:<br />
Personnel interviews, Dover <strong>AF</strong>B. NMCM 2 year historical, NMCB 3<br />
year historical: MERLIN data pull for AMC, FY04 – FY06,<br />
15 May 2007.<br />
Major Scotty A. Pendley is currently the Chief, Maintenance<br />
Studies Branch, <strong>Logistics</strong> Innovation Studies Division, Air<br />
Force <strong>Logistics</strong> <strong>Management</strong> <strong>Agency</strong>.<br />
Benjamin A. Thoele is currently the Executive Director of<br />
the FitWit Foundation in Atlanta, Georgia. He previously<br />
worked as a Captain in the Air Force <strong>Logistics</strong> <strong>Management</strong><br />
<strong>Agency</strong> as an operations researcher and Chief, <strong>Logistics</strong><br />
Analysis.<br />
Jeremy A. Howe is currently employed with the Whirlpool<br />
Corporation, Corporate Headquarters as the Manager,<br />
<strong>No</strong>rth American Region Supply Chain Metrics Team. He<br />
previously worked as a Captain in the Air Force <strong>Logistics</strong><br />
<strong>Management</strong> <strong>Agency</strong> as Chief, Munitions Analysis.<br />
Major Anthony F. Antoline is currently the Chief, <strong>Logistics</strong><br />
<strong>Logistics</strong> Transformation Division, Air Force <strong>Logistics</strong><br />
<strong>Management</strong> <strong>Agency</strong>.<br />
Roger D. Golden is the Director, Air Force <strong>Logistics</strong><br />
<strong>Management</strong> <strong>Agency</strong>.<br />
Visit the Journal online at: http://www.aflma.hq.af.mil/lgj/Afjlhome.html<br />
155
156<br />
Air Force Journal of <strong>Logistics</strong>
Originally developed as a financial management tool, earned value<br />
management (EVM) has become a project management tool for cost,<br />
schedule, and scope management. However, this broader approach<br />
to EVM generates potential for misuse when the schedule metrics of<br />
EVM are used to the exclusion of true schedule management tools.<br />
In addition, estimate at completion calculations with EVM metrics<br />
should be employed judiciously lest misleading projections arise<br />
given the circumstances of any particular project.<br />
Introduction<br />
Earned Value <strong>Management</strong> was originally developed by<br />
the United States Air Force as a financial management tool.<br />
Over the years, the earned value technique has matured<br />
into a significant project management tool with particular<br />
application to the acquisition of weapon systems.<br />
The relevance of EVM to the logistics community is threefold.<br />
First, today’s logisticians are intimately involved in the weapon<br />
systems acquisition process. Because EVM is such an integral<br />
part of the imposed acquisition management architecture,<br />
logisticians need to understand the tool. Otherwise, they become<br />
tangential to the management and performance reviews of an<br />
acquisition program. Second, EVM is increasingly being<br />
addressed in the literature of performance based logistics (PBL)<br />
and acquisition logistics. 1 Third, EVM as a leading-edge<br />
management tool has not seen the application to logisticsspecific<br />
projects that it merits. 2<br />
Many logisticians have low familiarity with this important<br />
management tool. This article examines the conceptual<br />
underpinnings of the EVM methodology and its applicability<br />
to measuring a project’s performance, with particular emphasis<br />
on its uses and misuses.<br />
Background of EVM<br />
The earned value concept was developed to correct serious<br />
distortions in assessing a project’s cost performance generated<br />
by comparing actual costs with a time-phased budget. Consider<br />
Figure 1, which plots both a time-phased budget (the spend plan)<br />
and cumulative actual expenditures to date. <strong>No</strong>te that at<br />
Annual Edition, <strong>Vol</strong>ume XXXIII, Number 1<br />
Stephen Hays Russell, PhD, Weber State University<br />
Time <strong>No</strong>w , actual expenditures are below budget. Cost<br />
performance appears favorable.<br />
The problem, of course, is this approach fails to consider what<br />
work has been done. The cumulative budget at Time <strong>No</strong>w may<br />
contemplate the completion of more tasks than have actually<br />
been accomplished. If this is the case, the favorable cost variance<br />
could be illusionary.<br />
A more accurate assessment—one that ties budget to tasks<br />
actually completed—is possible with the time-phased program<br />
plan illustrated in Table 1. Here four tasks have been scheduled<br />
to date for a total Time <strong>No</strong>w budget of $152K. Actual expenditures<br />
to date are $128K. However, only Tasks A, B, and C have been<br />
accomplished. Hence, comparing the $128K actually spent to<br />
the $152K spend plan does not make sense. Why? Because this<br />
Article Acronyms<br />
ACWP – Actual Cost of Work Performed<br />
BAC – Budget at Completion<br />
BCWP – Budgeted Cost of Work Performed<br />
BCWS – Budgeted Cost of Work Scheduled<br />
CAP – Control Account Plan<br />
CPI – Cost Performance Index<br />
CV – Cost Variance<br />
DoD – Department of Defense<br />
EAC – Estimate at Completion<br />
EVM – Earned Value <strong>Management</strong><br />
PBL – Performance Based <strong>Logistics</strong><br />
SPI – Schedule Performance Index<br />
SV – Schedule Variance<br />
157
program is behind schedule. Task D has not been accomplished<br />
as of Time <strong>No</strong>w . The earned value to date—earned in the sense<br />
that the tasks have been performed—is $120K. Clearly, we should<br />
compare expenditures to date to the earned value. With this<br />
comparison, we correctly determine that this project is $8K over<br />
budget ($128K spent less $120K budgeted for the tasks actually<br />
completed), whereas the spend plan approach suggested by<br />
Figure 1 would erroneously conclude this program is under<br />
budget by $24K ($152K - $128K). This earned value concept is<br />
at the heart of EVM.<br />
The following discussion illustrates that EVM brings together<br />
the scope, budget, and cost dimensions of a project and generates<br />
metrics for planning, measurement, and control.<br />
158<br />
Cumulative<br />
Spend<br />
EVM Techniques<br />
Earned Value <strong>Management</strong> requires four pieces of information:<br />
A baseline plan that defines the project in total<br />
The tasks planned to be accomplished at Time <strong>No</strong>w<br />
The budgeted value of the tasks accomplished by Time <strong>No</strong>w<br />
Actual costs at Time <strong>No</strong>w<br />
The baseline plan is the entire project defined by objectives,<br />
tasks, and budget. The aggregated budget for all tasks is called<br />
the budget at completion (BAC) and represents the approved<br />
funds or the budget constraint for the entire project.<br />
The sum of all tasks in the baseline plan you planned to have<br />
accomplished at Time <strong>No</strong>w in budgeted dollars is called the<br />
budgeted cost of work scheduled (BCWS) in EVM terminology.<br />
BCWS is the planned value. In Table 1 this value is $152K.<br />
Task Budget Status Actual<br />
A $40K Done $42K<br />
B $60K Done $60K<br />
C $20K Done $26K<br />
D $<strong>32</strong>K Pending<br />
Total at<br />
Time<strong>No</strong>w $152K<br />
$128K<br />
Table 1. Tasks Scheduled Through Time now<br />
Actual<br />
Time <strong>No</strong>w<br />
Figure 1. The Spend Plan Approach<br />
The budgeted value of the tasks actually completed at<br />
Time <strong>No</strong>w is the earned value to date and is called the budgeted<br />
cost of work performed (BCWP). In Table 1 this value is $120K.<br />
How much you have actually spent to date is called actual<br />
cost of work performed (ACWP). In Table 1 this value is $128K.<br />
As suggested earlier, the key piece of information in EVM and<br />
the basis for the EVM technique is the earned value, which is<br />
BCWP. In all EVM analysis, BCWP is a benchmark number for<br />
variance and performance measures.<br />
Budget<br />
The Metrics of Performance Measurement<br />
The difference between BCWP and ACWP (that is, the difference<br />
between the budgeted cost through Time <strong>No</strong>w and the actual cost<br />
at Time <strong>No</strong>w for the work performed) is the cost variance (CV). In<br />
the Table 1 example, CV is -$8K ($120K - $128K).<br />
The difference between BCWP and BCWS (that is, the<br />
difference between the work you have performed and the work<br />
you have scheduled through Time <strong>No</strong>w on a budgeted basis) is<br />
schedule variance (SV). In Table 1, SV is $-<strong>32</strong>K ($120K - $152K).<br />
These performance measurements are expressed formally as:<br />
1. CV = BCWP - ACWP<br />
2. SV = BCWP - BCWS<br />
<strong>No</strong>te that in both CV and SV calculations the benchmark for<br />
measurement is the earned value—that is, the BCWP. For these<br />
variance measures, positive values portray the project as doing<br />
better than planned. Specifically, if for work performed, actual<br />
cost is less than budgeted cost, CV is positive—meaning actuals<br />
are less than budget, a favorable condition. For SV, if on a<br />
budgeted basis work performed is greater than work scheduled,<br />
a positive value means the project is ahead of schedule. Similarly,<br />
negative values portray unfavorable conditions.<br />
Consider Figure 2. BCWP or earned value (the work actually<br />
performed on a budgeted basis) is ahead of BCWS (the work<br />
scheduled on a budgeted basis) at Time <strong>No</strong>w . This project is ahead<br />
of schedule. However, for the work performed, actual cost at Time <strong>No</strong>w<br />
(ACWP) exceeds the budgeted cost (BCWP). This project is<br />
experiencing a cost overrun. Indeed, in this example, actual cost<br />
will soon reach the BAC<br />
constraint—the cumulative<br />
BCWS for the whole project.<br />
Actual cumulative<br />
expenditures to date are<br />
below the cumulative budget<br />
to date.<br />
Time Periods<br />
Clearly, action is required by<br />
the program manager.<br />
Performance can also be<br />
expressed in terms of ratios. The<br />
ratio of BCWP to ACWP is the<br />
cost performance index (CPI):<br />
3. CPI = BCWP/ACWP<br />
The ratio of BCWP to BCWS<br />
is the schedule performance<br />
index (SPI).<br />
4. SPI = BCWP/BCWS<br />
For these ratio measures,<br />
values greater than 1.0 mean<br />
performance is favorable (better<br />
than the plan).<br />
Air Force Journal of <strong>Logistics</strong>
Implementing EVM<br />
EVM can be successfully<br />
employed in varying degrees of<br />
formality and in projects of all<br />
sizes. Examples of potential<br />
logistics applications of EVM<br />
include a complex logistics<br />
research project, development<br />
and implementation of<br />
new software, design and<br />
construction of a new<br />
maintenance facility, or any<br />
other complex project whose<br />
plan consists of discrete, timephased<br />
tasks.<br />
Implementation requires the<br />
establishment of detailed<br />
processes to collect baseline<br />
data and to reliably measure<br />
performance and cost. For<br />
Department of Defense (DoD)compliant<br />
systems (that is, for<br />
EVM systems of private sector<br />
firms to qualify for defense<br />
contracts), the implementation<br />
must satisfy <strong>32</strong> official structural<br />
and measurement criteria jointly<br />
developed by the federal<br />
government and industry. 3<br />
The first step in<br />
implementation is identifying<br />
the total scope of work that<br />
defines the project and creating<br />
a master schedule and a budget<br />
for project accomplishment.<br />
This step defines the scope<br />
baseline in tasks, time, and<br />
dollars. The scope baseline is the<br />
time-phased BCWS, the<br />
project’s planned value. The<br />
project’s total budget (the BAC)<br />
is the BCWS for the whole<br />
project.<br />
Next, the baseline is broken<br />
down into miniature project<br />
plans called control account<br />
plans (CAPs) (see Figure 3). Each<br />
CAP will have a programmed<br />
start and completion date, an<br />
assigned hour and dollar<br />
budget, and assigned<br />
resources including a manager<br />
accountable for accomplishment.<br />
CAPs are, in turn, disaggregated into discrete work packages.<br />
It is at the work package level where earned value is measured<br />
and reported at the CAP and ultimately the project level.<br />
The work package level is the genesis for a bottom-up<br />
approach to program performance in terms of BCWS, BCWP, and<br />
ACWP. Once the project has begun, performance measurement<br />
Annual Edition, <strong>Vol</strong>ume XXXIII, Number 1<br />
Figure 2. Illustration of EVM Metrics<br />
Project Baseline Defined in Objectives, Tasks, and Budget<br />
Figure 3. Data and Measurement Structure for Implementing EVM<br />
and variance analysis is launched at the work package level and<br />
rolled up into the CAP and total program level.<br />
Uses and Misuses of EVM<br />
To illustrate the uses and potential misuses of EVM, consider<br />
the metrics portrayed in Figure 4. At Time , ACWP exceeds<br />
<strong>No</strong>w<br />
BCWP. The distance CV represents cost overrun to date.<br />
159
Figure 4 also shows BCWP below BCWS. On a dollarized<br />
basis, this program is behind schedule by the amount of SV.<br />
The time dimension of the behind-schedule condition<br />
(labeled Time Variance in Figure 4) is illustrated by the<br />
horizontal distance between BCWS and BCWP. At Time <strong>No</strong>w , the<br />
dollar value of work performed (BCWP) should have been<br />
achieved at the time period indicated by that same value on the<br />
BCWS line.<br />
These performance measures serve the following purposes:<br />
160<br />
They can serve as an early warning to the program manager<br />
that this program is in trouble. In the Figure 4 example, both<br />
variance measures are negative, meaning this program is both<br />
behind schedule and over on cost.<br />
Managers can drill down to CAPs and work packages in the<br />
EVM database to identify areas and root causes of schedule<br />
slippage and cost overruns.<br />
Constructive actions can be taken as EVM metrics indicate<br />
deviations from plan. Actions may include correcting<br />
inefficiencies that caused the deviations, the recognition that<br />
initial budgets were inadequate for the scope of work<br />
programmed, or the application of additional resources to<br />
bring the project back on schedule. Conversely, unfavorable<br />
schedule and cost performance at Time <strong>No</strong>w may force the<br />
program manager to take tasks out of the project (bring the<br />
scope of the total project down) in order to complete the<br />
program within a firm BAC.<br />
Program status at completion can be projected. The CPI can<br />
be employed to develop a revised estimate on cost to complete<br />
the program. <strong>No</strong>te from equation 3 the CPI is the ratio of BCWP<br />
to ACWP. Assume this value is .90. This means that for every<br />
dollar spent, only 90 percent of the programmed work for that<br />
dollar is actually getting accomplished. If we assume the CPI<br />
to date is indicative of future performance (that is, that the<br />
CPI will remain reasonably stable for the duration of the<br />
project), then we can use the following equation for an<br />
estimate at completion (EAC) calculation:<br />
$<br />
SV<br />
CV<br />
Time Variance<br />
Time <strong>No</strong>w<br />
BCWS<br />
ACWP<br />
BCWP<br />
Figure 4. Performance Assessment with EVM Metrics<br />
5. EAC = BAC/CPI<br />
In logic, this equation reduces to the simple proposition that<br />
if actual costs are running 11.1 percent ahead of budget for work<br />
to date (1.0 divided by .90), a reasonable EAC will likely be 11.1<br />
percent greater than the BAC.<br />
With regard to schedule performance, the SPI given in<br />
equation 4 divides BCWP by BCWS. Assume this value is .85.<br />
For every dollar of budget (BCWS) only 85 cents worth of work<br />
gets completed (BCWP). The inverse of the SPI (BCWS/BCWP)<br />
in this example (1.176) would indicate this project is running<br />
17.6 percent behind schedule or that the project is forecasted to<br />
take 17.6 percent longer than the original schedule.<br />
These illustrations represent the common employment of<br />
EVM to assess the cost and schedule performance of a project.<br />
However, rote employment of these metrics is risky and can<br />
represent a misuse of EVM—misuse in the sense that these<br />
metrics must not be employed in a vacuum or to the exclusion of<br />
other performance indicators.<br />
First, consider cost performance metrics. The EAC of equation<br />
5 assumes the remaining work will have the same relative cost<br />
variance as work already done.<br />
Time Periods<br />
4 Analysis of root causes or of<br />
specific CAPS may show that past performance is not a good<br />
predictor of future performance—that a particular problem will<br />
not occur again. 5<br />
Furthermore, if the project is behind schedule, project duration<br />
increases and so will costs. Efforts to get the project back on<br />
schedule usually mean the employment of more resources<br />
(overtime, for example). In short, to project costs without<br />
incorporating the cost implications of a schedule variance is a<br />
misuse of EVM metrics as well. 6<br />
The most significant misuse of EVM, however, is in the area<br />
of schedule assessment. Using SV as the only measure of schedule<br />
performance can lead to erroneous conclusions. For example,<br />
some tasks may be performed out of sequence. High-dollar<br />
activities may be done ahead of schedule while lesser value<br />
critical activities are hopelessly behind schedule. Yet, EVM will<br />
show a favorable SV at the<br />
project level. A project in<br />
aggregate may be ahead of<br />
schedule, yet one critical<br />
component may not be<br />
available. In this situation,<br />
heads-up managers know<br />
delivery schedules will slip, yet<br />
EVM will show this program<br />
ahead of schedule. 7<br />
A quirk of EVM is the fact that<br />
every project (even a project<br />
behind schedule) shows an SV<br />
metric of zero at project<br />
completion. This happens<br />
because as the project<br />
approaches 100 percent<br />
completion, the work performed<br />
(BCWP) converges on the work<br />
scheduled (BCWS)—no more<br />
variance. Obviously, at some<br />
point prior, the SV as a<br />
performance metric has lost its<br />
management value.<br />
Air Force Journal of <strong>Logistics</strong>
Clearly, program managers need a schedule management<br />
system that is sequence- and milestone-based. EVM may be an<br />
aggregate indicator of work performed compared to work<br />
scheduled, but to engage EVM as a reliable schedule indicator<br />
is a misuse of the tool. 8<br />
Conclusion<br />
Over the years, a number of significant management innovations<br />
and tools with broad application have emerged from the DoD.<br />
These include incentive contracting, Performance Evaluation<br />
and Review Technique (PERT), configuration management,<br />
integrated logistics support, life-cycle costing, and many others.<br />
One major tool developed by DoD that continues to face limited<br />
familiarity within the logistics community is EVM.<br />
A basic understanding of EVM is important to the logistician,<br />
not only because of its intrinsic value to the management of any<br />
complex project, but because it is now widely employed in the<br />
procurement-program management community of which<br />
logistics is a part.<br />
EVM is able to provide a true picture of a project’s cost<br />
performance by accounting for differences between work<br />
accomplished and work scheduled. A number of metrics are<br />
employed for variance calculations, performance indices, and<br />
projections at completion.<br />
Originally developed as a financial management tool, EVM<br />
has become a project management tool for cost, schedule, and<br />
scope management. However, this broader approach to EVM<br />
generates potential for misuse when the schedule metrics of EVM<br />
are used to the exclusion of true schedule management tools. In<br />
addition, EAC calculations with EVM metrics should be<br />
employed judiciously lest misleading projections arise given the<br />
circumstances of any particular project.<br />
This article equips the logistician with an understanding of<br />
the terminology and technique of EVM, and provides an<br />
appreciation for its uses and potential misuses.<br />
<strong>No</strong>tes<br />
1. EVM is now an integral part of DoD’s guidelines on PBL. See<br />
Performance Based <strong>Logistics</strong>: A Program Manager’s Product Support<br />
Guide, Defense Acquisition University, March 2005, [Online]<br />
Available: http://www.dau.mil/pubs/misc/PBL_Guide.pdf, accessed<br />
28 April 2008.<br />
If I had to sum up in a word what makes a good manager, I’d say decisiveness.<br />
You can use the fanciest computers to gather the numbers, but in the end you have<br />
to set a timetable and act.<br />
—Lido Anthony (Lee) Iacocca<br />
If opportunity doesn’t knock, build a door.<br />
Annual Edition, <strong>Vol</strong>ume XXXIII, Number 1<br />
2. The best opportunities for [EVM] may well lie in the management of<br />
thousands of smaller projects that are being directed by people who<br />
may well be unaware of earned value. Quentin W. Fleming and Joel<br />
M. Koppelman, “Earned Value Project <strong>Management</strong>: A Powerful Tool<br />
for Software Projects,” Crosstalk: The Journal of Defense Software<br />
Engineering, July 1998, 23, [Online] Available: http://<br />
www.stsc.hill.af.mil/crosstalk/1998/07/value.asp, accessed<br />
11 <strong>No</strong>vember 2007.<br />
3. The <strong>32</strong> standards have evolved into an American National Standards<br />
Institute (ANSI) standard on Earned Value <strong>Management</strong> System<br />
Guidelines, ANSI/EIA-748-A-1998 (R2002). Copies can be ordered<br />
from Global Engineering Documents (800-854-7179). DoD policy<br />
and guidance on EVM are online and available at www.acq.osd.mil/pm.<br />
4. For a complete assessment of this issue, see David Christensen and<br />
Kirk Payne, “Cost Performance Index Stability—Fact or Fiction?”<br />
Journal of Parametrics, 10 April 1992, 27-40, and David S.<br />
Christensen, “Using Performance Indices to Evaluate the Estimate at<br />
Completion,” Journal of Cost Analysis and <strong>Management</strong>, Spring 1994,<br />
17-24.<br />
5. Different shops, different work forces, different subcontractors, and<br />
different cost problems within a project don’t necessarily invite a<br />
mirrored projection of past performance into the future. And cost<br />
variances in production don’t necessarily mean similar variances in<br />
assembly.<br />
6. Jan Evensmo and Jan Terje Karlsen, “Reviewing the Assumptions<br />
Behind Performance Indexes,” Transactions of AACE International<br />
CSC 14, 2004, 1-7.<br />
7. See Jim W. Short, Using Schedule Variance as the Only Measure of<br />
Schedule Performance, Cost Engineering, <strong>Vol</strong> 35, <strong>No</strong> 10, October<br />
1993, 35. Also see Walter H. Lipke, “Schedule is Different,” The<br />
Measurable News, Summer 2003, 31-34.<br />
8. Seasoned practitioners of EVM are increasingly realizing that EVM is<br />
considerably more useful as a tool for measuring and managing cost<br />
performance than it is for schedule performance. Indeed, the earned<br />
value concept was developed to get appropriate data for cost assessment.<br />
The dollarized schedule assessment is a byproduct fraught with<br />
difficulties. In this sense, EVM better serves project managers as a<br />
financial management tool rather than a cost-schedule-scope project<br />
management tool.<br />
Lieutenant Colonel Stephen Hays Russell, PhD, US<strong>AF</strong> (Ret)<br />
is Professor of Supply Chain <strong>Management</strong>, John B. Goddard<br />
School of Business and Economics, Weber State University,<br />
Ogden, Utah. His active duty assignments included logistics<br />
and acquisition management positions from base level to<br />
the Office of the Secretary of Defense. His areas of expertise<br />
include logistics, supply chain management, and systems<br />
acquisition strategies.<br />
—Milton Berle<br />
<strong>No</strong> form of transportation ever really dies out. Every new form is an addition to,<br />
and not a substitution for, an old form of transportation.<br />
—Air Marshal Viscount Hugh M. Trenchard, R<strong>AF</strong><br />
161
162<br />
The Problem Is Big, Time Is Short,and Visibility Is Enormous<br />
The foundation of the Comprehensive Assessment of Nuclear Sustainment<br />
(CANS) analysis was the aggressive use of Air Force Smart Operations for the<br />
21 st Century (<strong>AF</strong>SO21) tools to attack root causes. Though the effort was time<br />
constrained and many of the processes were modified to streamline the<br />
application, this did not detract from the effort, and actually enhanced the<br />
team’s ability to use those portions of <strong>AF</strong>SO21 that made sense. Overall, the<br />
CANS effort highlights the power, flexibility, applicability, and simplicity of the<br />
<strong>AF</strong>SO21 toolkit and is a resounding success story.<br />
Introduction<br />
When initially assigned to the Air<br />
Force CANS project, I wondered<br />
what role analysis would play in<br />
the effort. Typically, analysts are brought into<br />
projects after all the data has been collected<br />
and it is time to analyze. Most often, this is<br />
much too late for the analytic effort to have<br />
the optimum impact on the problem and its<br />
solutions. However, in this case, the CANS<br />
chairman brought me on board at the very<br />
beginning. This was a chance to shape the<br />
effort and to ensure that a methodical and<br />
repeatable analytic process was both followed<br />
and documented.<br />
Major Jennifer G. Walston, PhD, US<strong>AF</strong><br />
Given this phenomenal opportunity and<br />
the fact that I am an operations research<br />
analyst by trade, not an <strong>AF</strong>SO21 expert, why<br />
did I choose to use the tools of <strong>AF</strong>SO21? The<br />
simple answer is that it just made sense. When<br />
researching applicable industry methods for<br />
root cause analysis and risk analysis, the<br />
methods that I found most used by industry<br />
were available in the <strong>AF</strong>SO21 Playbook.<br />
Additionally, because the <strong>AF</strong>SO21 process<br />
is tailorable, we were able to use an industry<br />
accepted process and tools while still meeting<br />
a very short schedule. The remainder of this<br />
article reviews the methodology used in the<br />
CANS project.<br />
Air Force Journal of <strong>Logistics</strong>
Annual Edition, <strong>Vol</strong>ume XXXIII, Number 1<br />
163
164<br />
CANS Methodology<br />
The focus of the CANS methodology was to not only<br />
investigate nuclear sustainment and develop solutions,<br />
but also to ensure a clear linkage would exist amongst<br />
the prioritized findings, root causes, and actionable<br />
solutions for implementation.<br />
A team of subject matter experts (SME) was selected,<br />
divided into seven subteams, and subsequently<br />
consolidated into five working teams as follows:<br />
Organizational structure and lines of authority and<br />
responsibility<br />
<strong>Logistics</strong> and supply chain management<br />
Maintenance and storage<br />
Training and standardization<br />
Previous report review and research<br />
In order to ensure that the CANS study produced<br />
solutions that addressed the root causes of the problem<br />
instead of only treating the symptoms, the team<br />
followed a methodical, industry and Air Force accepted,<br />
appropriately modified, 5-step problem solving<br />
approach called Define, Measure, Analyze, Improve,<br />
and Control (DMAIC) 11 which worked as a framework,<br />
encapsulating the overall solution methodology (see<br />
Figure 1). (Please note that at the time of this study, the<br />
Air Force had not yet fully adopted the Toyota 8-step<br />
problem solving model as the preferred model for<br />
<strong>AF</strong>SO21. For more information, see the <strong>AF</strong>SO21 Web<br />
site.)<br />
Define<br />
The first step of the DMAIC model is to define the<br />
problem and develop an improvement project plan.<br />
In this stage, the CANS team built subteam-level<br />
charters, defined the scope, and established milestones<br />
and roles. Additionally, based on the defined scope, the<br />
team developed a comprehensive questionnaire for the<br />
team to use during all site visits.<br />
The overall problem was defined and scoped. From<br />
the definition, using affinity diagramming, cause and<br />
effect diagramming, and brainstorming, 3, 4, 5, 10, 11, 12 the<br />
Figure 1. The DMAIC 5-Step Problem Solving Approach 5<br />
team determined and stratified key mission elements, or<br />
focus areas, contributing to the overall problem. These<br />
key mission elements are noted as follows:<br />
Training. Activities addressing the level of<br />
competence to execute the required job. They include<br />
formal training, education, on-the-job training,<br />
certifications, and experience.<br />
Policy. Activities that define how the Air Force does<br />
business. They should be clear, concise, standard,<br />
and relevant.<br />
Culture. Intangibles such as trust, support,<br />
accountability, internal and external environment,<br />
spirit, politics, pride, personal commitment,<br />
perceptions, and tribe mentality.<br />
Resources. People, equipment, systems, facilities,<br />
funding, and time.<br />
Oversight and Control. Activities that provide<br />
feedback on Air Force processes. They include<br />
performance measurements and metrics, inspections,<br />
closed loop feedback processes, and corrective<br />
actions.<br />
Also during this step, the research subteam collected<br />
and reviewed over 2,000 documents related to the Air<br />
Force nuclear enterprise. From this group of documents,<br />
the research team identified 67 key documents and<br />
scrutinized previous findings as they related to the key<br />
mission areas. It is important to note that the other<br />
subteam members were not given access to the previous<br />
documents so that the data collection in the site visits<br />
would not be biased.<br />
Measure<br />
The second step of the DMAIC model is to measure<br />
the existing process and identify the process capability<br />
requirement.<br />
The teams collected data through a variety of methods<br />
during the measurement step. These methods include<br />
the following:<br />
Site visits consisting of 23 members of the team<br />
visiting 31 sites with nuclear capability or related<br />
functions<br />
Air Force Journal of <strong>Logistics</strong>
Personal interviews during site visits, and followup<br />
interviews as needed with SMEs<br />
Research included staff studies, reports, policy,<br />
audits, and other sources<br />
A rapid improvement event addressing the<br />
engineering technical support process<br />
Analyze<br />
The process is analyzed to determine its capability. Data<br />
is analyzed to identify opportunities for improvement<br />
and to develop plans for improving the process. The<br />
steps in this phase include root cause analysis, solution<br />
development, risk analysis and mitigation, and<br />
determining the path forward.<br />
Root Cause Analysis<br />
Root cause analysis was conducted using proven<br />
methods, accepted by both industry and the Air Force.<br />
Specific methods used included flow diagramming<br />
(value stream or process), affinity diagramming,<br />
brainstorming, cause and effect diagramming, and the<br />
Five Whys. 3, 4, 5, 10,11,12 Brief descriptions of these<br />
methods follow.<br />
Flow Diagramming (Value Stream or Process<br />
Mapping). Value stream mapping (VSM) is a tool to<br />
visualize an entire process, such as the flow of<br />
material and information as a product or service<br />
makes its way through the value stream. It is a good<br />
method for displaying relationships between material<br />
and information, making waste and its sources visible,<br />
setting a common language and basis for discussion,<br />
and getting the big picture. Value stream mapping<br />
differs from process mapping in that it is broader in<br />
scope, tends to be at a higher level, and is typically<br />
used to identify where future focus should occur. The<br />
process map shows a process in more detail than a<br />
VSM. Such information is useful in analyzing all<br />
aspects of a specific process. VSM was used by the<br />
engineering team to map out the technical order 00-<br />
25-107 maintenance assistance engineering process.<br />
Process mapping was used by the engineering team<br />
to map out the information flow of the time change<br />
technical order process. The CANS team did not<br />
perform a full VSM on the entire Air Force nuclear<br />
sustainment enterprise due to time constraints.<br />
However, the team did use the tool to visualize the<br />
highest-level processes of the entire enterprise in order<br />
to scope the problem and to view the entire enterprise<br />
as one overall process. This was helpful as it<br />
highlighted the seams to organizations outside of the<br />
Annual Edition, <strong>Vol</strong>ume XXXIII, Number 1<br />
Air Force and was especially useful in integrating<br />
process solutions to non-Air Force processes.<br />
Affinity Diagramming. Affinity diagramming,<br />
sometimes called the JK Method for its creator Jiro<br />
Kawakito, is useful for organizing and presenting<br />
large amounts of data (ideas, issues, solutions,<br />
problems) into logical categories based on user<br />
perceived relationships and conceptual frameworks.<br />
When paired with brainstorming, affinity diagrams<br />
can help organize data and ideas, group like items,<br />
sort a large number of brainstorming ideas quickly,<br />
build consensus, avoid long discussions, stop people<br />
from dominating discussions, stimulate independent<br />
thoughts, and enable a greater variety of ideas. The<br />
CANS team used affinity diagramming when<br />
determining the five key mission areas.<br />
Brainstorming. Brainstorming is a problem solving<br />
technique in which team members attempt a<br />
deductive methodology for identifying possible<br />
causes of any problem via free-form, fast-paced idea<br />
generation. Brainstorming was popularized by Alex<br />
Osborn (advertising executive) in the 1930s, and can<br />
be an effective means to develop many ideas in a<br />
short amount of time. Brainstorming was used<br />
throughout the CANS study.<br />
Cause-Effect Diagramming (Fishbone<br />
Diagramming). Cause-effect diagramming, also<br />
called fishbone or Ishikawa diagramming, was<br />
created by Kaoru Ishikawa in the 1960s as part of<br />
the quality movement at Kawasaki Shipyards. It is a<br />
visual tool used to logically organize possible causes<br />
for a specific problem or effect by graphically<br />
displaying them in increasing detail. Additionally, it<br />
helps to identify root causes and ensures common<br />
understanding of the causes. In this method, a<br />
problem statement is written in a box on the right side<br />
of the diagram and then possible causes are<br />
determined (usually via brainstorming) as categories<br />
branching off the problem statement. Benefits include<br />
conciseness, adding structure to brainstorming, easily<br />
trained and understood, works well in team<br />
environment, and the ability to determine and analyze<br />
countermeasures. This method was used in<br />
determining the five key mission areas and during<br />
root cause analysis.<br />
The Five Whys. For root cause analysis, the team<br />
used the Five Whys, a well accepted method, first<br />
developed by Sakichi Toyoda of Toyota, described<br />
by Taiichi Ohno as “… the basis of Toyota’s<br />
scientific approach,” and is now widely used across<br />
industry and within <strong>AF</strong>SO21. The Five Whys<br />
165
166<br />
typically refers to the practice of asking, five times,<br />
why the failure has occurred in order to get to the root<br />
cause or causes of the problem. There can be more<br />
than one cause to a problem as well. In an<br />
organizational context, generally root cause analysis<br />
is carried out by a team of persons related to the<br />
problem. <strong>No</strong> special technique is required.<br />
Using these tools, the hundreds of tactical findings<br />
discovered during data collection were analyzed to<br />
determine common trends or higher-level issues, which<br />
the team chose to call strategic level findings. These<br />
findings were then analyzed to determine the root<br />
causes. Finally, solutions were developed and then<br />
further scrutinized via a murder board process to ensure<br />
they truly solved the root causes instead of merely<br />
symptoms of the real problem.<br />
Risk Analysis<br />
Risk analysis 2,14 and mitigation was performed on each<br />
solution using a modified version of the Develop and<br />
Sustain Warfighting Systems (D&SWS) Core Process<br />
Working Group 13 Active Risk <strong>Management</strong> (ARM)<br />
Process model. Because of the high visibility and<br />
importance associated with the correction of the<br />
enterprise, the risks of not implementing the solutions<br />
were assumed to be known and sufficiently high such<br />
that all solutions would be implemented. Thus, the risk<br />
analysis in this study focused on the risks associated with<br />
implementing the solutions.<br />
These risks were identified and analyzed as follows.<br />
The teams identified potential risks to solutions via<br />
brainstorming with SMEs by indentifying and explicitly<br />
defining potential unintended consequences which<br />
might occur when the solutions are implemented. These<br />
consequences were then scored by the SMEs, via a<br />
Delphi voting method, using life cycle risk management<br />
likelihood and severity ratings as defined in the<br />
D&SWS ARM Process model and shown in Tables 1<br />
and 2. (<strong>No</strong>te that the CANS team focused on<br />
performance impact as the most critical characteristic.<br />
Each proposed solution was reviewed on the basis of<br />
consequence, vice cost or time to implement.)<br />
<strong>No</strong>tional risk analysis output is shown in Figure 2,<br />
where the green squares identify a safe area where there<br />
1 <strong>No</strong>t Likely 1% - 20%<br />
2 Low Likelihood 21% - 40%<br />
3 Likely 41% - 60%<br />
4 Highly Likely 61% - 80%<br />
5 Near Certainty 81% - 99%<br />
Table 1. Consequence Likelihood Ratings 13<br />
is little likelihood of a risk occurring and low impact to<br />
the system if it does. Similarly, the yellow and red<br />
squares identify medium and high risk areas,<br />
respectively. The line is calculated by measuring the full<br />
range of the yellow area (medium impact) and<br />
determining the 98 percentile point. The team<br />
determined that the +98 percentile data points (within<br />
the medium area), could have very easily been scored<br />
within the red area (high impact) relative to the error<br />
margins within the scoring process and should be treated<br />
as high risk. Thus, solutions with risks above and to the<br />
right of this line required additional review by the teams<br />
to determine risk mitigation strategies.<br />
Prioritization via Multi-Objective<br />
Optimization<br />
To determine a prioritized order, the strategic level<br />
findings were scored on their impact, if solved, on the<br />
five key mission areas. The result was then modeled as<br />
a multi-objective optimization problem in which five<br />
key mission areas represent the competing objectives<br />
and the prioritized order of the strategic findings<br />
represents the decision variable. In this type of problem,<br />
there often exists no single criterion for choosing the best<br />
solution. In fact, even the notion of best can be unclear<br />
when multiple objectives are present; and in many cases,<br />
it can be shown that improvement to one objective<br />
actually degrades the performance of another. 1<br />
The multi-objective optimization problem,<br />
subject to<br />
min F(x)<br />
x {0,1) n : g i (x) < 0, i = 1,2,..., M}<br />
where F:{0,1}” R J , is that of finding a solution<br />
x n that optimizes the set of objectives<br />
F = (F 1 , F 2 , ..., F J ) in the sense that no other point<br />
y yields a better function value in all the objectives. 15<br />
(<strong>No</strong>te the precise mathematical definition of x n can be<br />
found in Ehrgott 8 ) The point x is said to be nondominated,<br />
efficient, or optimal in the Pareto sense. 9<br />
The (typically infinite) set of all such points is referred<br />
to as the Pareto optimal set or simply the Pareto set.<br />
The image of the Pareto set is referred to as the Pareto<br />
Frontier or Pareto Front. If the Pareto set (or<br />
corresponding Pareto front) results from a solution<br />
algorithm and is not exact, it is referred to as the<br />
approximate (or experimental) Pareto set or<br />
approximate (or experimental) Pareto front, respectively.<br />
Air Force Journal of <strong>Logistics</strong>
Once defined, a multiobjective<br />
optimization<br />
problem can be solved via<br />
many methods. The<br />
particular method selected<br />
can depend on many factors<br />
including, but not limited<br />
to, the complexity of<br />
t h e problem, the time<br />
allowed for problem<br />
solution, the availability<br />
and quality of<br />
information, and<br />
the preferences of<br />
the decisionmaker. In this<br />
case, an a priori scalar<br />
method called weightedsum-of-the-objectivefunctions<br />
(WSOTOF)<br />
was selected. As the name<br />
implies, this method<br />
combines the various<br />
objectives via a convex<br />
combination (a weighted<br />
sum). Though it is among<br />
the simplest of the multiobjective<br />
methods, it is<br />
guaranteed to produce an<br />
efficient solution (see<br />
Lemma 3.3.11 in<br />
Walston 19 ). It should be<br />
noted that this method is not<br />
guaranteed to find all<br />
possible solutions,<br />
particularly if the<br />
corresponding Pareto front<br />
is non-convex; 6,7,16,17<br />
however, in this particular<br />
case, the benefits of<br />
simplicity and speed far<br />
outweigh potential risks<br />
associated with examining<br />
only a portion of the Pareto<br />
front.<br />
To combine the<br />
objectives, the WSOTOF<br />
method requires a<br />
predetermined set of<br />
weights. In many cases, this<br />
can be problematic 18 as it is<br />
Severity<br />
dependent on subjective judgment of the decisionmaker<br />
which may not be available or fixed across the duration<br />
of the study. Thus, this step is of particular importance.<br />
Additionally, in this particular problem, the<br />
Annual Edition, <strong>Vol</strong>ume XXXIII, Number 1<br />
5<br />
4<br />
3<br />
2<br />
1<br />
0<br />
1<br />
2<br />
3<br />
4<br />
5<br />
DoD Guide Proposed Air Force Definition<br />
Minimal or no consequence to technical<br />
performance<br />
Minor reduction in technical<br />
performance or supportability, can be<br />
tolerated with little or no impact on<br />
program<br />
Moderate reduction in technical<br />
performance or supportability with<br />
limited impact on program objectives.<br />
Significant degradation in technical<br />
performance or major shortfall in<br />
supportability; may jeopardize program<br />
success.<br />
Severe degradation in technical<br />
performance; cannot meet KPP or key<br />
technical/supportability threshold; will<br />
jeopardize program success<br />
Table 2. Risks<br />
Minimal consequence to technical<br />
performance but no overall impact to<br />
the program success. A successful<br />
outcome is not dependent on this issue;<br />
the technical performance goals will still<br />
be met.<br />
Minor reduction in technical<br />
performance or supportability, can be<br />
tolerated with little impact on program<br />
success. Technical performance will be<br />
below the goal, but within acceptable<br />
limits.<br />
Moderate shortfall in technical<br />
performance or supportability with<br />
limited impact on program success.<br />
Technical performance will be below the<br />
goal, but approaching unacceptable<br />
limits.<br />
Significant degradation in technical<br />
performance or major shortfall in<br />
supportability with a moderate impact<br />
on program success. Technical<br />
performance is unacceptably below the<br />
goal.<br />
Severe degradation in<br />
technical/supportability threshold<br />
performance; will jeopardize program<br />
success.<br />
0 1 2 3 4 5<br />
Likelihood<br />
Figure 2. <strong>No</strong>tional Risk Analysis Output<br />
determination of weights is even more complex as there<br />
are multiple decisionmakers to be considered.<br />
To ensure that multiple decisionmaker preferences<br />
are included and considered in the solution, the<br />
167
following method was used. First, a group of senior Air<br />
Force leaders was identified as stakeholders for the<br />
nuclear sustainment enterprise and defined as the<br />
decisionmakers for the multi-objective problem. After<br />
each stakeholder provided a set of weights, the problem<br />
was solved as follows:<br />
N Minimum Maximum Mean<br />
Standard<br />
Deviation<br />
Variance<br />
Training 31 5 40 22.16 7.267 52.806<br />
Policy 31 10 50 21.77 8.995 80.914<br />
Culture 31 5 35 16.06 8.668 75.129<br />
Resources 31 5 40 22.52 8.282 68.591<br />
Oversight/Control 31 5 30 17.48 5.591 31.258<br />
Valid N (listwise) 31<br />
168<br />
A simple average of the weights provided by the<br />
stakeholders was used as the weights for the problem.<br />
However, there was considerable variance in the<br />
weighting schemes provided by the stakeholders (see<br />
Figure 3 and Table 3) indicating that further<br />
investigation was necessary. The distribution of the<br />
weights was tested for normality using normal p-p<br />
plots and the Kolmogorov-Smirnov (K-S) goodness<br />
test for normality. The plots and the K-S test indicate<br />
failing to reject the null hypothesis that the weights<br />
are normally distributed. Though in this case,<br />
parametric statistics would then be applicable, the use<br />
Figure 3. Histogram of Weights Assigned to Culture<br />
Table 3. Descriptive Statistics<br />
of a simple mean may not be adequate because of the<br />
high degree of variance.<br />
The weights were further analyzed as follows. A<br />
sensitivity analysis was conducted to determine the<br />
impact of the weighting scheme on the overall<br />
prioritized solution. It was found that the top priority<br />
issues in the prioritization solution were relatively<br />
impervious to the weighting scheme. A prioritized list<br />
of findings was determined for each decisionmaker’s<br />
preference of weights and was then examined against<br />
the others. In this case, it was also found that the top<br />
priority issues did not vary much over the various<br />
weighting schemes. The average of the ranks<br />
assigned from each weighting scheme was<br />
determined for each finding, and was used to assign<br />
its final rank.<br />
Once the objectives have been combined, any<br />
applicable optimization<br />
method can be used to<br />
determine the prioritized list<br />
of findings. In this case,<br />
because no constraining<br />
information was identified,<br />
and impact to the overall<br />
problem statement was the<br />
sole criteria for selection, a<br />
simple greedy heuristic<br />
method was used. Simply<br />
stated, once the weights are<br />
determined, the value of<br />
solving each particular<br />
finding becomes clear, and<br />
the prioritized list follows<br />
directly.<br />
Cost Analysis<br />
The CANS cost team<br />
estimated costs for solutions<br />
Air Force Journal of <strong>Logistics</strong>
that required funding. Cost analyst support upfront was<br />
critical to providing leadership with vital financial<br />
information. As solutions were identified, the cost team<br />
worked to define tasks, time lines, and associated costs.<br />
Identifying and linking costs with solutions allows<br />
leadership to make timely, informed decisions with<br />
known costs. In this case, costs of the CANS solutions<br />
totalled $25.6M for fiscal year 2008—the process<br />
worked and our leadership provided the funding to fix<br />
the problems because the methodology was solid.<br />
Improve. During the Improve step, the plan that was<br />
developed in the Analyze phase is implemented. The<br />
results of the change are evaluated and conclusions are<br />
drawn as to its effectiveness. This can lead to<br />
documenting changes and updating new instructions<br />
and procedures.<br />
The CANS chairman was given authority to<br />
immediately implement some solutions. There were six<br />
just-do-it solutions. The remaining results of this team’s<br />
efforts were presented to senior leaders in a number of<br />
briefings at the major commands and Air Staff.<br />
Control. Control plans were developed to ensure the<br />
process is institutionalized and continues to be measured<br />
and evaluated. This can include implementing process<br />
audit plans, data collection plans, and plans of action<br />
for out-of-control conditions, if they occur.<br />
This study team worked concurrently with S<strong>AF</strong>/IG<br />
(Secretary of the Air Force, Inspector General’s office)<br />
and <strong>AF</strong>/A9 (Studies and Analyses, Assessments, and<br />
Lessons Learned Directorate) to develop inspection and<br />
assessment criteria and plans to assess the status of the<br />
Air Force nuclear sustainment enterprise and measure<br />
the progress of addressing the CANS findings.<br />
Conclusion<br />
The foundation of the CANS analysis was the<br />
aggressive use of <strong>AF</strong>SO21 tools to attack root causes.<br />
Though the effort was time constrained and many of<br />
the processes were modified to streamline the<br />
application, this did not detract from the effort, and<br />
actually enhanced the team’s ability to use those portions<br />
of <strong>AF</strong>SO21 that made sense. Overall, the CANS effort<br />
highlights the power, flexibility, applicability, and<br />
simplicity of the <strong>AF</strong>SO21 toolkit and is a resounding<br />
success story.<br />
Annual Edition, <strong>Vol</strong>ume XXXIII, Number 1<br />
<strong>No</strong>tes<br />
1. A. Abraham and J. Lakhmi, J. Evolutionary Multiobjective<br />
Optimization, London: Springer-Verlag, 2005.<br />
2. <strong>AF</strong>MC PAM 63-101, Risk <strong>Management</strong>, 9 July 1997.<br />
3. <strong>AF</strong>SO21 Level 1 Training, Lesson 4, Value Stream Mapping, accessed<br />
https://wwwd.my.af.mil/afknprod/ASPs/deskbook/<br />
index2.asp?Filter=OO-21&Type=DP&Cat=21, 27 June 2008.<br />
4. <strong>AF</strong>SO21 Level 1 Training, Lesson 7, Problem Solving Tools, [Online]<br />
Available: https://wwwd.my.af.mil/afknprod/ASPs/deskbook/<br />
index2.asp?Filter=OO-21&Type=DP&Cat=21, 27 June 2008.<br />
5. <strong>AF</strong>/SAO, Air Force Smart Operations for the 21st Century Playbook,<br />
Version 2.0, <strong>Vol</strong>ume H, H-2, [Online] Available: https://<br />
wwwd.my.af.mil/afknprod/ASPs/docman/<br />
DOCMain.asp?Tab=0&FolderID=OO-TR-<strong>AF</strong>-43-13&Filter=OO-TR-<br />
<strong>AF</strong>-43, October 2007.<br />
6. Y. Collette, and P. Siarry, Multiobjective Optimization Principles and<br />
Case Studies, Berlin, Germany: Springer-Verlag, 2004.<br />
7. I. Das and J. D. Dennis, Jr, “A Closer Look at Drawbacks of Minimizing<br />
Weighted Sums of Objectives for Pareto Set Generation in Multicriteria<br />
Optimization Probems, Structural Optimization, 1997, 14, 63—69.<br />
8. M. Ehrgott, Multicriteria Optimization, second edition, Berlin,<br />
Germany: Springer, 2005.<br />
9. Y. Fu and U. Diwekar, “An Efficient Sampling Approach to<br />
Multiobjective Optimization,” Annals of Operations Research, 1<strong>32</strong>,<br />
109—134, 2004.<br />
10. M. L. George, D. Rowlands, M. Price, and J. Maxey, Lean Six Sigma<br />
Pocket Toolbook, a Quick Reference Guide to Nearly 100 Tools for<br />
Improving Process Quality, Speed, and Complexity, New York, NY:<br />
McGraw-Hill, 2005.<br />
11. T. Goldsby and R. Martichenko, Lean Six Sigma <strong>Logistics</strong>, Strategic<br />
Development to Operational Success, Fort Lauderdale, Florida: J. Ross<br />
Publishing, Inc., 2005.<br />
12. SixSigma Magazine, term definition library. accessed http://<br />
www.isixsigma.com/dictionary/glosary.asp, 27 June 2008.<br />
13. J. Jackson and M. Hailstone, “D&SWS Life Cycle Risk <strong>Management</strong><br />
(LCRM) Update,” briefing, D&SWS Core Process Working Group,<br />
27 Jun 2008.<br />
14. J. Kindinger and J. Darby, “Risk Factor Analysis—A New Qualitative<br />
Risk <strong>Management</strong> Tool,” Proceedings of the Project <strong>Management</strong><br />
Institute Annual Seminars & Symposium, Houston, Texas, 7-16<br />
September 2000.<br />
15. L. H. Lee, E. P. Chew, and S. Teng, “Optimal computing budget<br />
allocation for multi-objective simulation models,” in J.S.S.R.G. Ingalls,<br />
M. D. Rossetti and B. A. Peters, editors, Proceedings of the 2004 Winter<br />
Simulation Conference, [Online] Available: http://www.informssim.org/wsc04papers/071.pdf.<br />
16. M. Makowski, “Methodology and a Modular Tool for Multiple Criteria<br />
Analysis of lp Models,” working papers, Laxenburg, Austria:<br />
International Institute for Applied Systems Analysis, 94-102.<br />
17. S. Sait and H. Youssef, Iterative Computer Algorithms with<br />
Applications in Engineering: Solving Combinatorial Optimization<br />
Problems, Las Alamitos, California: IEEE Computer Society, 1999.<br />
18. P. Vincke, Multicriteria Decision-Aid, England:John Wiley & Sons,<br />
1992.<br />
19. J. Walston, Search Techniques for Multi-Objective Optimization of Mixed<br />
Variable Systems Having Stochastic Responses, PhD thesis, Air Force<br />
Institute of Technology, September 2007.<br />
Major Jennifer G. Walston, PhD, is currently the<br />
Chief Scientist, Air Force <strong>Logistics</strong> <strong>Management</strong><br />
<strong>Agency</strong>, Maxwell <strong>AF</strong>B, Gunter Annex, Alabama.<br />
At the time of writing this article, she was<br />
temporarily assigned to the Comprehensive<br />
Assessment of Nuclear Sustainment project at Hill<br />
Air Force Base, Utah.<br />
Visit the Journal online at: http://www.aflma.hq.af.mil/lgj/Afjlhome.html<br />
169
contingency contracting<br />
Contingency contracting support has evolved from purchases under the<br />
simplified acquisition threshold to major defense procurement and<br />
interagency support of commodities, services, and construction for military<br />
operations and other emergency relief. Today, this support includes<br />
unprecedented reliance on support contractors in both traditional and new<br />
roles. Keeping up with these dramatic changes, while fighting the Global<br />
War on Terror, is an ongoing challenge. This pocket-sized handbook and<br />
its accompanying DVD provide the essential information, tools, and<br />
training for contracting officers to meet the challenges they will face,<br />
regardless of the mission or environment.<br />
170<br />
relevant, relevant, informative, informative, and and insightful<br />
insightful<br />
Newest Products<br />
with Style<br />
and Impact<br />
maintenance metrics<br />
This handbook is an encyclopedia of metrics and includes an<br />
overview to metrics, a brief description of things to consider<br />
when analyzing fleet statistics, an explanation of data that can<br />
be used to perform analysis, a detailed description of each<br />
metric, a formula to calculate the metric, and an explanation<br />
of the metric’s importance and relationship to other metrics.<br />
The handbook also identifies which metrics are leading<br />
indicators (predictive) and which are lagging indicators<br />
(historical). It is also a guide for data investigation.<br />
Air Force Journal of <strong>Logistics</strong>
logistics dimensions 2008<br />
<strong>Logistics</strong> Dimensions 2008 is a collection of 19 essays,<br />
articles, and vignettes that lets the reader look broadly at a<br />
variety of logistics concepts, ideas, and subjects. Included<br />
in the volume is the work of many authors with diverse<br />
interests and approaches. The content was selected for two<br />
basic reasons—to represent the diversity of the ideas and<br />
to stimulate thinking. That's what we hope you do as you<br />
read the material—think about the dimensions of logistics.<br />
Annual Edition, <strong>Vol</strong>ume XXXIII, Number 1<br />
C-5 TNMCM study II<br />
The C-5 TNMCM Study II proved to be a stern test of<br />
<strong>AF</strong>LMA’s abilities and perseverance. The research addressed<br />
areas of concern including maintaining a historically challenged<br />
aircraft, fleet restructuring, shrinking resources, and the need<br />
for accurate and useful metrics to drive desired enterprise<br />
results. The study team applied fresh perspectives, ideas and<br />
transformational thinking. They developed a new detailed<br />
methodology to attack similar research problems, formulated<br />
a new personnel capacity equation that goes beyond the<br />
traditional authorized versus assigned method, and analyzed<br />
the overall process of setting maintenance metric standards.<br />
A series of articles was produced that describes various portions<br />
of the research and accompanying results. Those articles are<br />
consolidated in this book.<br />
Have you noticed there seems to be a void when it comes to books or<br />
monographs that address current Air Force logistics thought, lessons from<br />
history, doctrine, and concerns? We did, and we’re filling that void. Our staff<br />
produces and publishes selections of essays or articles—in monograph format—on a<br />
quarterly basis. Each has a theme that’s particularly relevant to today’s Air Force logistics.<br />
Informative, insightful, and in many cases, entertaining, they provide the Air Force<br />
logistics community the kind of information long taken for granted in other parts of the<br />
Air Force.<br />
171
172<br />
relevant, relevant, informative, informative, and and insightful<br />
insightful<br />
Products<br />
with Style<br />
and Impact<br />
2006 logistics dimensions<br />
<strong>Logistics</strong> Dimensions 2006 is a collection of 25<br />
essays, articles, and vignettes that lets the<br />
reader look broadly at a variety of logistics<br />
concepts, ideas, and subjects. Included in the<br />
volume is the work of many authors with<br />
diverse interests and approaches. The content<br />
was selected for two basic reasons—to<br />
represent the diversity of the ideas and to<br />
stimulate thinking. That's what we hope you<br />
do as you read the material—think about the<br />
dimensions of logistics. Think about the lessons<br />
history offers. Think about why some things<br />
work and others do not. Think about problems.<br />
Think about organizations. Think about the<br />
nature of logistics. Think about fundamental<br />
or necessary logistics relationships.<br />
Air Force Journal of <strong>Logistics</strong>
quotes for the Air Force logistician, volume 1<br />
Quotes for the Air Force Logistician, <strong>Vol</strong>ume 1 is a teaching<br />
resource that can be used in classroom, education, training,<br />
and mentoring programs for Air Force logisticians. It is a<br />
tool that can be used by instructors, teachers, managers,<br />
leaders, and students. It is also a tool that can be used in<br />
research settings and a resource that should stimulate<br />
comment and criticism within educational and mentoring<br />
settings. Copies of the book are provided free of charge to<br />
any Air Force logistician, educational institution, teacher,<br />
instructor, commander, or manager. Quotes for the Air Force<br />
Logistician, <strong>Vol</strong>ume 1 is packaged with Quotes for the Air<br />
Force Logistician, <strong>Vol</strong>ume 2 as a boxed set.<br />
Annual Edition, <strong>Vol</strong>ume XXXIII, Number 1<br />
quotes for the Air Force logistician, volume 2<br />
Quotes for the Air Force Logistician, <strong>Vol</strong>ume 2 is a teaching<br />
resource that can be used in classroom, education, training,<br />
and mentoring programs for Air Force logisticians. It is a tool<br />
that can be used by instructors, teachers, managers, leaders,<br />
and students. It is also a tool that can be used in research<br />
settings and a resource that should stimulate comment and<br />
criticism within educational and mentoring settings. Copies<br />
of the book are provided free of charge to any Air Force<br />
logistician, educational institution, teacher, instructor,<br />
commander, or manager. Quotes for the Air Force Logistician,<br />
<strong>Vol</strong>ume 2 is packaged with Quotes for the Air Force Logistician,<br />
<strong>Vol</strong>ume 1 as a boxed set.<br />
Each of our books and monographs is also available in electronic format, even<br />
when available in hard copy. All are in the portable document format (PDF)<br />
and can be viewed online or downloaded. File sizes, in some cases are very<br />
large, however.<br />
173
174<br />
Each of our newest works is produced in a high-impact format that<br />
makes you want to pick it up and read it. If you’re used to seeing or thinking of<br />
works dealing with logistics as colorless and dry, you’ll be more than surprised<br />
with these products. They continue the tradition of high-quality publications produced<br />
by the Air Force <strong>Logistics</strong> <strong>Management</strong> <strong>Agency</strong> and staff of the Air Force Journal of<br />
<strong>Logistics</strong>.<br />
old lessons new thoughts 2006<br />
Old Lessons New Thoughts 2006 is a<br />
collection of 28 essays, articles, and vignettes<br />
that lets the reader look broadly at a variety<br />
of logistics and technological areas through<br />
the lens of history. Included in the volume is<br />
the work of many authors with diverse<br />
interests and approaches. The content was<br />
selected for two basic reasons—to represent<br />
the diversity of ideas and to stimulate<br />
thinking.<br />
Air Force Journal of <strong>Logistics</strong>
aef fuels management pocket guide<br />
The AEF Fuels <strong>Management</strong> Pocket Guide is designed to<br />
assist in understanding fuels issues as they relate to<br />
expeditionary airpower operations. The information is<br />
intended to provide a broad overview of many issues and<br />
be useful to anyone who has an interest in the Air Force<br />
fuels business.<br />
Annual Edition, <strong>Vol</strong>ume XXXIII, Number 1<br />
thinking about logistics<br />
Thinking About <strong>Logistics</strong> is a collection of papers<br />
written by students taking the Advanced <strong>Logistics</strong><br />
Readiness Officer Course at the Air Mobility Warfare<br />
Center, Fort Dix, New Jersey. The focus of the work<br />
is on issues facing Air Force logistics in the 21 st<br />
century, particularly supporting expeditionary<br />
airpower.<br />
Products<br />
with Style<br />
and Impact<br />
when when critical critical thinking thinking really really matters<br />
matters<br />
175
176<br />
relevant, relevant, informative, informative, and and insightful<br />
insightful<br />
Products<br />
with Style<br />
and Impact<br />
old lessons, new thoughts<br />
Old Lessons, New Thoughts is a collection of<br />
seven essays or articles that lets the reader<br />
examine logistics and technological lessons<br />
from history that are particularly applicable in<br />
today’s transformation environment. The<br />
majority of the articles and essays are the result<br />
of work done at the Air Command and Staff<br />
College during 2002 and 2003. Specific subject<br />
areas include oil logistics in the Pacific during<br />
World War II, German wonder weapons and<br />
logistics failings, advanced technology and<br />
modern warfare, leading the “nexters”<br />
generation, and Allied failings during the battle<br />
of the Kaserine Pass.<br />
Air Force Journal of <strong>Logistics</strong>
2004 logistics dimensions, volume 1<br />
<strong>Logistics</strong> Dimensions 2004 is a two-volume collection of<br />
essays and articles that looks at a broad range of logistics<br />
challenges facing the Air Force in the 21 st Century. Four<br />
major themes dominate the work presented—agile<br />
combat support (ACS), global support and mobility,<br />
supporting and maintaining aircraft, and contractor<br />
support and its implementation and implications. All the<br />
major articles and essays are the result of work done at<br />
the Air War College during 2003 and 2004. Specific<br />
subject areas included in <strong>Vol</strong>ume 1 include ACS, barebase<br />
support in the ACS framework, global combat<br />
support systems, reducing the logistics footprint within<br />
the ACS framework, transformation, defense industrial<br />
base, global and theater mobility, and transportation<br />
technology implementation.<br />
Annual Edition, <strong>Vol</strong>ume XXXIII, Number 1<br />
2004 logistics dimensions, volume 2<br />
<strong>Logistics</strong> Dimensions 2004 is a two-volume collection of essays<br />
and articles that looks at a broad range of logistics challenges<br />
facing the Air Force in the 21 st Century. Four major themes<br />
dominate the work presented—agile combat support, global<br />
support and mobility, supporting and maintaining aircraft, and<br />
contractor support and its implementation and implications.<br />
All the major articles and essays are the result of work done<br />
at the Air War College during 2003 and 2004. Specific subject<br />
areas included in <strong>Vol</strong>ume 2 include supporting aging aircraft,<br />
integrating active Air Force and Reserve units, recapitalizing<br />
tanker aircraft, aircraft modification versus new aircraft<br />
procurement, contractor support and contractors on the<br />
battlefield, and financial management as a force multiplier.<br />
Presently, there’s no charge for any of these products. There are limited quantities<br />
of some, however. Ordering any of these items is never a problem. Simply<br />
contact the staff of the Air Force Journal of <strong>Logistics</strong> at (334) 416-2335.<br />
177
178<br />
The research and thought that underpin our publications are of the highest quality.<br />
Many of the articles or essays presented were developed as part of our work<br />
with the Air War College, Air Command and Staff College, Air Mobility Warfare<br />
Center, RAND, and the <strong>Logistics</strong> <strong>Management</strong> Institute.<br />
combat support<br />
This publication communicates the essentials<br />
of the combat-support analyses completed by<br />
the Air Force <strong>Logistics</strong> <strong>Management</strong> <strong>Agency</strong><br />
and RAND. The research was conducted to<br />
help the Air Force configure the agile combat<br />
support system in order to meet expeditionary<br />
airpower goals. These articles also illustrate<br />
how analysis can, when properly accomplished,<br />
influence Air Force policymaking. Additionally,<br />
the book can be used as a teaching document,<br />
illustrating the complexity of Air Force logistics<br />
systems and processes, as well as an archive of<br />
analytic methodology applied to military policy<br />
analysis. As a whole, the book can serve as a<br />
history of logistics during this 6-year period of<br />
extensive change, detailing where the Air Force<br />
has come from and why. Further, an<br />
examination of the entire collection can serve<br />
as an example of how to manage complex<br />
change and how to study large complex issues.<br />
Limited quantities.<br />
Air Force Journal of <strong>Logistics</strong>
logistics and warfighting<br />
This small book is a collection of essays, articles, and<br />
studies that lets the reader look broadly at many of the<br />
issues associated with agile combat support. The content<br />
was selected to both represent the diversity of the<br />
challenges faced and stimulate discussion about these<br />
challenges. Also included is a short history of transporting<br />
munitions. Limited quantities.<br />
Annual Edition, <strong>Vol</strong>ume XXXIII, Number 1<br />
2003 logistics dimensions<br />
<strong>Logistics</strong> Dimensions 2003 is a collection of seven essays,<br />
articles, and studies that lets the reader look broadly at<br />
many of the issues associated with the expeditionary air<br />
force of the 21 st century. While small, <strong>Logistics</strong><br />
Dimensions 2003 addresses several of the major issues<br />
or challenges facing Air Force logistics. The content was<br />
selected to represent the diversity of the challenges faced<br />
and stimulate discussion about these challenges. Limited<br />
quantities.<br />
Products<br />
with Style<br />
and Impact<br />
when when critical critical thinking thinking really really matters<br />
matters<br />
179
180<br />
education, education, training, training, and and mentoring<br />
mentoring<br />
Products in<br />
Electronic<br />
Format Only<br />
contractors on the battlefield<br />
Contractors on the Battlefield is a collection of seven articles and essays that lets<br />
the reader look broadly at many of the initiatives involved with and the issues<br />
surrounding the increasing role of contractor support for the US military. It is<br />
by no means all encompassing. The very nature of the subject prevents this.<br />
These works were selected primarily to stimulate interest, thought, and action.<br />
In today’s military environment, this thought-provoking monograph is a must<br />
read.<br />
Air Force Journal of <strong>Logistics</strong>
logistics on the move<br />
<strong>Logistics</strong> on the Move is a collection of essays and articles that<br />
looks broadly at five areas of significant interest to<br />
logisticians—logistics thought, competitive sourcing and<br />
privatization, lessons from history, international logistics, and<br />
technology.<br />
Annual Edition, <strong>Vol</strong>ume XXXIII, Number 1<br />
expeditionary logistics 2000<br />
The force being molded today differs drastically from its<br />
predecessors. Rather than being reactive, airpower must now be<br />
proactive to meet the needs of a rapidly changing world. Today’s<br />
definition of expeditionary airpower means a rapid response force<br />
that is light, lean, and tailored to mission needs. What are the<br />
challenges, opportunities, and initiatives that need examination?<br />
And perhaps more important, how do existing logistics concepts<br />
and principles need to change to support expeditionary<br />
airpower. Expeditionary <strong>Logistics</strong> 2000: Issues and Strategy for<br />
the New Millennium examines a number of these questions<br />
through a collection of selected readings.<br />
Many of our books and monographs are now out of print. However, they are<br />
available in electronic format to support continuing Air Force professional<br />
military education requirements. They can be viewed or downloaded at the<br />
<strong>AF</strong>JL WWW site (http://www.aflma.hq.af.mil/lgj/Afjlhome.html) All are in the<br />
portable document format. Files range in size from 1.5 meg to 10 meg.<br />
181
today’s logistics<br />
Today’s <strong>Logistics</strong> is a collection of essays, articles,<br />
and studies that are very much about change,<br />
innovation, and finding ways to improve processes<br />
and products. The majority of the writings deal with<br />
improving specific facets of Air Force logistics:<br />
supply, transportation, maintenance, contracting,<br />
and prepositioning. However, other works have<br />
been included that focus on logistics thought, theory,<br />
crime, and history. Much of the material is based<br />
on work performed by the staff at the Air Force<br />
<strong>Logistics</strong> <strong>Management</strong> <strong>Agency</strong>.<br />
182<br />
Two of our most popular handbooks or guidebooks—Maintenance Metrics U.S.<br />
Air Force and Contingency Contracting: A Handbook for the Air Force CCO—are<br />
also available in electronic format. As with our other books or monographs, they<br />
may be downloaded from the <strong>AF</strong>JL WWW site (http://www.aflma.hq.af.mil/lgj/<br />
Afjlhome.html) in portable document format and can be viewed online or downloaded.<br />
shaping tomorrow’s logistics<br />
Shaping Tomorrow's <strong>Logistics</strong> is a collection of 12<br />
essays, articles, and studies that lets the reader<br />
examine a variety of research and thought that<br />
speaks to shaping and changing tomorrow's Air<br />
Force logistics. Included in the volume is the work<br />
of many authors with diverse interests and<br />
approaches. Much of the research discussed herein<br />
was conducted at the Air Force <strong>Logistics</strong><br />
<strong>Management</strong> <strong>Agency</strong>.<br />
Air Force Journal of <strong>Logistics</strong>
global thinking, global logistics<br />
Global Thinking, Global <strong>Logistics</strong> is a collection of<br />
articles and essays by many authors with diverse<br />
interests and approaches. However, it contains four<br />
distinct areas of interest or issues that face the<br />
military as we enter the 21 st century: competitive<br />
sourcing and privatization, logistics support,<br />
logistics history and doctrine, and current challenges.<br />
The content was selected for two reasons: to represent<br />
the diversity of global logistics issues facing the<br />
military of the next century and stimulate thinking<br />
about these issues.<br />
education, education, training, training, and and mentoring<br />
mentoring<br />
Annual Edition, <strong>Vol</strong>ume XXXIII, Number 1<br />
Products in<br />
Electronic<br />
Format Only<br />
183
184<br />
education, education, training, training, and and mentoring<br />
mentoring<br />
Products in<br />
Electronic<br />
Format Only<br />
usaf supply<br />
US<strong>AF</strong> Supply: Pride, Dedication,<br />
Professionalism highlights the past and future<br />
of Air Force supply. As a community, Air Force<br />
supply has much to be proud of. They were<br />
there when the Berlin Wall came down. They<br />
were there when the Cold War ended. And they<br />
are there today. As a community, they also have<br />
a lot to look forward to. New initiatives, new<br />
programs, and new challenges exist that will<br />
carry the supply-fuels family well into this<br />
century.<br />
Air Force Journal of <strong>Logistics</strong>
Annual Edition, <strong>Vol</strong>ume XXXIII, Number 1<br />
the logistics of war<br />
The <strong>Logistics</strong> of War is a collection of three<br />
works that examines both broadly and<br />
specifically the history of US military<br />
logistics: The <strong>Logistics</strong> of Waging War—<br />
American <strong>Logistics</strong>, 1774-1985—<br />
Emphasizing the Development of<br />
Airpower; The <strong>Logistics</strong> of Waging War—US<br />
Military <strong>Logistics</strong> 1982-1993—The End of<br />
Brute Force <strong>Logistics</strong>; and the History of US<br />
Military <strong>Logistics</strong>: 1935-1985, A Brief<br />
Review. The <strong>Logistics</strong> of Waging War—<br />
American <strong>Logistics</strong>, 1774-1985—<br />
Emphasizing the Development of Airpower<br />
was originally published by the Air Force<br />
<strong>Logistics</strong> <strong>Management</strong> <strong>Agency</strong> as part of<br />
Project Warrior. While retaining its original<br />
character, this work has been extensively<br />
edited and reorganized, and two new<br />
sections were added: "The <strong>Logistics</strong><br />
Constant Throughout the Ages" and<br />
"General <strong>Logistics</strong> Paradigm: A Study of the<br />
<strong>Logistics</strong> of Alexander, Napoleon, and<br />
Sherman." Readers of the old work will find<br />
this new version easy to navigate and a bit<br />
more user friendly. The <strong>Logistics</strong> of Waging<br />
War—US Military <strong>Logistics</strong> 1982-1993—<br />
The End of Brute Force <strong>Logistics</strong>, also<br />
originally published by the Air Force<br />
<strong>Logistics</strong> <strong>Management</strong> <strong>Agency</strong>, has<br />
likewise been extensively edited and<br />
updated. The final work is Jerome G.<br />
Peppers’ seminal work on the history of US<br />
military logistics. Call and order your copy<br />
today.<br />
We produce and publish a variety of high-impact publications—books,<br />
monographs, reading lists, and reports. That’s part of our mission—address<br />
logistics issues, ideas, research, and information for aerospace forces.<br />
185
contingency contracting<br />
This pocket-sized handbook and its accompanying DVD<br />
provide the essential information, tools, and training for<br />
contracting officers to meet the challenges they will face,<br />
regardless of the mission or environment.<br />
186<br />
what what you you need, need, when when you you need need it<br />
it<br />
Guidebooks and<br />
Special References<br />
vehicle maintenance safety handbook<br />
The Vehicle Maintenance Safety Handbook was produced in<br />
partnership with Air Staff and MAJCOM vehicle<br />
maintenance subject-matter experts for use in the Air Force<br />
2T3 vehicle maintenance community. It’s designed to improve<br />
safety awareness in the Air Force vehicle maintenance<br />
community. It provides practical information and draws on<br />
lessons learned from actual safety incidents. Limited<br />
quantities.<br />
Air Force Journal of <strong>Logistics</strong>
aef fuels management pocket guide<br />
The AEF Fuels <strong>Management</strong> Pocket Guide is designed to<br />
assist in understanding fuels issues as they relate to<br />
expeditionary airpower operations. The information is<br />
intended to provide a broad overview of many issues and<br />
be useful to anyone who has an interest in the Air Force<br />
fuels business.<br />
Annual Edition, <strong>Vol</strong>ume XXXIII, Number 1<br />
maintenance metrics<br />
This handbook is an encyclopedia of metrics and includes an<br />
overview to metrics, a brief description of things to consider<br />
when analyzing fleet statistics, an explanation of data that can<br />
be used to perform analysis, a detailed description of each<br />
metric, a formula to calculate the metric, and an explanation<br />
of the metric’s importance and relationship to other metrics.<br />
The handbook also identifies which metrics are leading<br />
indicators (predictive) and which are lagging indicators<br />
(historical). It is also a guide for data investigation.<br />
Our guidebooks and special reference material are in high-impact format and<br />
meet defined Air Force needs. They’re also publications that communicate<br />
and will be used where they’re needed and when they’re needed. They may<br />
be ordered by contacting the Office of the Air Force Journal of <strong>Logistics</strong> or the applicable<br />
<strong>AF</strong>LMA division. There are limited quantities of some of these items.<br />
187