Download now - Tapir Specialist Group
Download now - Tapir Specialist Group
Download now - Tapir Specialist Group

Create successful ePaper yourself
Turn your PDF publications into a flip-book with our unique Google optimized e-Paper software.
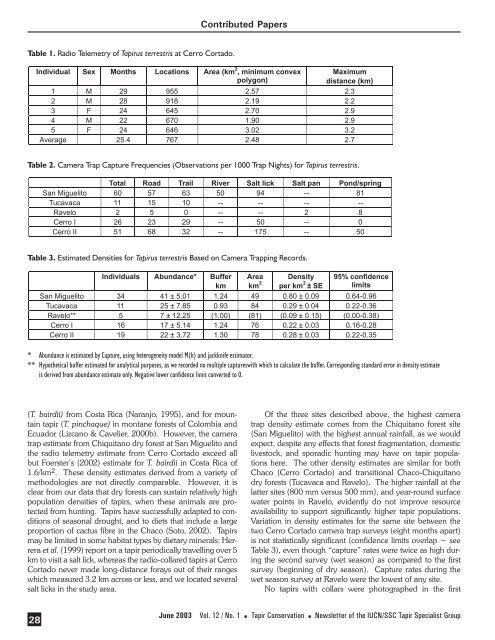
Table 1. Radio Telemetry of <strong>Tapir</strong>us terrestris at Cerro Cortado.<br />
(T. bairdii) from Costa Rica (Naranjo, 1995), and for mountain<br />
tapir (T. pinchaque) in montane forests of Colombia and<br />
Ecuador (Lizcano & Cavelier, 2000b). However, the camera<br />
trap estimate from Chiquitano dry forest at San Miguelito and<br />
the radio telemetry estimate from Cerro Cortado exceed all<br />
but Foerster’s (2002) estimate for T. bairdii in Costa Rica of<br />
1.6/km 2 . These density estimates derived from a variety of<br />
methodologies are not directly comparable. However, it is<br />
clear from our data that dry forests can sustain relatively high<br />
population densities of tapirs, when these animals are protected<br />
from hunting. <strong>Tapir</strong>s have successfully adapted to conditions<br />
of seasonal drought, and to diets that include a large<br />
proportion of cactus fibre in the Chaco (Soto, 2002). <strong>Tapir</strong>s<br />
may be limited in some habitat types by dietary minerals: Herrera<br />
et al. (1999) report on a tapir periodically travelling over 5<br />
km to visit a salt lick, whereas the radio-collared tapirs at Cerro<br />
Cortado never made long-distance forays out of their ranges<br />
which measured 3.2 km across or less, and we located several<br />
salt licks in the study area.<br />
28<br />
Contributed Papers<br />
Table 2. Camera Trap Capture Frequencies (Observations per 1000 Trap Nights) for <strong>Tapir</strong>us terrestris.<br />
Table 3. Estimated Densities for <strong>Tapir</strong>us terrestris Based on Camera Trapping Records.<br />
* Abundance is estimated by Capture, using heterogeneity model M(h) and jackknife estimator.<br />
** Hypothetical buffer estimated for analytical purposes, as we recorded no multiple captureswith which to calculate the buffer. Corresponding standard error in density estimate<br />
is derived from abundance estimate only. Negative lower confidence limit converted to 0.<br />
Of the three sites described above, the highest camera<br />
trap density estimate comes from the Chiquitano forest site<br />
(San Miguelito) with the highest annual rainfall, as we would<br />
expect, despite any effects that forest fragmentation, domestic<br />
livestock, and sporadic hunting may have on tapir populations<br />
here. The other density estimates are similar for both<br />
Chaco (Cerro Cortado) and transitional Chaco-Chiquitano<br />
dry forests (Tucavaca and Ravelo). The higher rainfall at the<br />
latter sites (800 mm versus 500 mm), and year-round surface<br />
water points in Ravelo, evidently do not improve resource<br />
availability to support significantly higher tapir populations.<br />
Variation in density estimates for the same site between the<br />
two Cerro Cortado camera trap surveys (eight months apart)<br />
is not statistically significant (confidence limits overlap − see<br />
Table 3), even though “capture” rates were twice as high during<br />
the second survey (wet season) as compared to the first<br />
survey (beginning of dry season). Capture rates during the<br />
wet season survey at Ravelo were the lowest of any site.<br />
No tapirs with collars were photographed in the first<br />
June 2003 Vol. 12 / No. 1 n <strong>Tapir</strong> Conservation n Newsletter of the IUCN/SSC <strong>Tapir</strong> <strong>Specialist</strong> <strong>Group</strong>