
Create successful ePaper yourself
Turn your PDF publications into a flip-book with our unique Google optimized e-Paper software.
Model Features<br />
Broadband (DC-6GHz)<br />
Non-linear (Angelov model)<br />
Measurement validations:<br />
- DCIV<br />
- Multi bias S-parameter<br />
- Noise parameters<br />
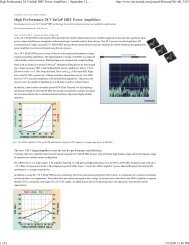
- Single tone Power sweep (0.9 and 1.9GHz)<br />
- Two tone Power sweep (0.9 and 1.9GHz)<br />
- Load pull (0.9 and 1.9GHz)<br />
Model Description<br />
Technical Notes<br />
• The non-linear model is extracted from DCIV and<br />
multi-bias S-parameter measurements<br />
• The non-linear model is also used to simulate<br />
noise parameters.<br />
• The model has been validated with measurements<br />
over the frequency range DC to 6 GHz in a<br />
single channel and a common source configuration.<br />
• The model biad points tested include Vds=2V,<br />
Ids=40mA and Vds=4V, Ids=50mA.<br />
• Via-grounding effects are included.<br />
• The substrate used to extract the model: 20mil<br />
FR4<br />
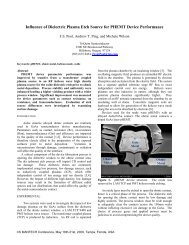
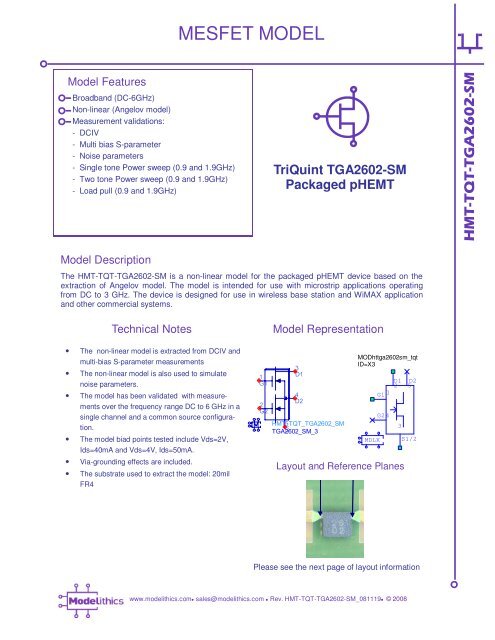
<strong>MESFET</strong> <strong>MODEL</strong><br />
TriQuint TGA2602-SM<br />
Packaged pHEMT<br />
The HMT-TQT-TGA2602-SM is a non-linear model for the packaged pHEMT device based on the<br />
extraction of Angelov model. The model is intended for use with microstrip applications operating<br />
from DC to 3 GHz. The device is designed for use in wireless base station and WiMAX application<br />
and other commercial systems.<br />
1<br />
G1<br />
2<br />
G2<br />
Model Representation<br />
Layout and Reference Planes<br />
Please see the next page of layout information<br />
www.modelithics.com sales@modelithics.com Rev. HMT-TQT-TGA2602-SM_081119 © 2008<br />
3<br />
D1<br />
4<br />
D2<br />
HMT_TQT_TGA2602_SM<br />
5<br />
TGA2602_SM_3<br />
S<br />
MODhttga2602sm_tqt<br />
ID=X3<br />
MDLX<br />
D1 D2<br />
2 5<br />
G11<br />
G24<br />
3<br />
S1/2<br />
HMT-TQT-TGA2602-SM
HMT-TQT-TGA2602-SM<br />
Ids (A)<br />
0.14<br />
0.12<br />
0.10<br />
0.08<br />
0.06<br />
0.04<br />
Test Layout<br />
Note: units are mils (mm)<br />
DCIV Characteristics (25C)<br />
0.02<br />
0.00<br />
VGS=-0.300<br />
VGS=-0.400<br />
0.0 0.5 1.0 1.5 2.0 2.5 3.0 3.5 4.0<br />
Vds (V)<br />
Legend: Solid Red lines-Model, dashed lines with Blue markers-Measured data<br />
Simulated at T=25C with VGS varying from –0.4 to 0V in steps of 0.1V<br />
and VDS=0~4V<br />
VGS=0.000<br />
VGS=-0.100<br />
VGS=-0.200
HMT-TQT-TGA2602-SM<br />
Stability Factor<br />
S11<br />
S21<br />
1.0<br />
0.8<br />
0.6<br />
0.4<br />
0.2<br />
0.0<br />
freq (100.0MHz to 6.000GHz)<br />
-20 -15 -10 -5 0 5 10 15 20<br />
freq (100.0MHz to 6.000GHz)<br />
0 1 2 3 4 5 6<br />
freq, GHz<br />
Bias Dependence at 25C<br />
Legend: Solid Red lines-Model, dashed lines with Blue markers-Measured data<br />
S12<br />
Max. Gain (dB)<br />
S22<br />
40<br />
35<br />
30<br />
25<br />
20<br />
15<br />
-0.08<br />
-0.06<br />
-0.04<br />
Bias condition: Vds=2V for Ids=40mA.<br />
Frequency range is 0.1 to 6 GHz.<br />
-0.02<br />
0.00<br />
0.02<br />
0.04<br />
freq (100.0MHz to 6.000GHz)<br />
freq (100.0MHz to 6.000GHz)<br />
0.06<br />
0.08<br />
0 1 2 3 4 5 6<br />
freq, GHz
HMT-TQT-TGA2602-SM<br />
Stability Factor<br />
S11<br />
S21<br />
1.0<br />
0.8<br />
0.6<br />
0.4<br />
0.2<br />
0.0<br />
freq (100.0MHz to 6.000GHz)<br />
-25 -20 -15 -10 -5 0 5 10 15 20 25<br />
freq (100.0MHz to 6.000GHz)<br />
0 1 2 3 4 5 6<br />
freq, GHz<br />
Bias Dependence at 25C<br />
S12<br />
Max. Gain (dB)<br />
S22<br />
40<br />
35<br />
30<br />
25<br />
20<br />
15<br />
-0.08<br />
-0.06<br />
-0.04<br />
Bias condition: Vds=4V for Ids=50mA.<br />
Frequency range is 0.1 to 6 GHz.<br />
-0.02<br />
0.00<br />
0.02<br />
0.04<br />
freq (100.0MHz to 6.000GHz)<br />
freq (100.0MHz to 6.000GHz)<br />
0.06<br />
0.08<br />
0 1 2 3 4 5 6<br />
freq, GHz<br />
Legend: Solid Red lines-Model, dashed lines with Blue markers-Measured data
HMT-TQT-TGA2602-SM<br />
NFmin (dB)<br />
Noise Resistance<br />
1.2<br />
1.0<br />
0.8<br />
0.6<br />
0.4<br />
0.2<br />
0.0<br />
2 3 4 5 6 7<br />
6<br />
5<br />
4<br />
3<br />
2<br />
1<br />
freq, GHz<br />
2 3 4 5 6 7<br />
freq, GHz<br />
Noise parameter (25C)<br />
Associated Gain (dB)<br />
freq (2.000GHz to 7.000GHz)<br />
Legend: Solid Red lines-Model, dashed lines with Blue markers-Measured data<br />
Model and measured noise parameter at<br />
the bias condition: Vgs=-0.18V and Vds=4V (Ids= 50mA).<br />
Frequency range is 2 to 7 GHz.<br />
Gamma_opt<br />
20<br />
18<br />
16<br />
14<br />
12<br />
10<br />
2 3 4 5 6 7<br />
freq, GHz
HMT-TQT-TGA2602-SM<br />
PAEmarker<br />
indep(PAEmarker)= 3<br />
PAE_contours_p=0.184 / 50.898<br />
lev el=54.244292, number=1<br />
impedance = Z0 * (1.205 + j0.357)<br />
Poutmarker<br />
indep(Poutmarker)= 2<br />
Pdel_contours_p=0.147 / 91.392<br />
lev el=20.667392, number=1<br />
impedance = Z0 * (0.951 + j0.285)<br />
Load Pull Validations (f=900MHz)<br />
Pdel_contours_p<br />
PAE_contours_p<br />
Delivered power (blue) and PAE (red) contours for model (top) and measurement (bottom)<br />
Load impedance at<br />
max. PAE<br />
Sy stem<br />
Ref erence<br />
Impedance<br />
PAE (thick) and Deliv ered<br />
Power (thin) Contours<br />
Poutmarker PAEmarker<br />
indep(PAE_contours_p) (0.000 to 22.000)<br />
indep(Pdel_contours_p) (0.000 to 34.000)<br />
Max. PAE Value<br />
(%)<br />
Measured 58.2+j12.05 43.02<br />
Model 60.2+j21.3 54.34<br />
50.000<br />
Set Deliv ered Power<br />
contour step size (dB)<br />
and PAE contour step<br />
size (%), and number of<br />
contour lines<br />
Eqn Pdel_step=0.25<br />
Eqn PAE_step=1<br />
Eqn NumPAE_lines=5<br />
Eqn NumPdel_lines=5<br />
Maximum<br />
Power-Added<br />
Ef f iciency , %<br />
54.34<br />
Load impedance<br />
at Max Pout<br />
31.95+j13.7<br />
50+j11.65<br />
Maximum<br />
Power<br />
Deliv ered,<br />
dBm<br />
Max Pout Value<br />
(dbm)<br />
Comparison of load pull between the measurement data (bottom) and the model performance<br />
(top). The bias conditions: Vgs=-0.18V and Vds=4V, the input power=-2dBm, the frequency<br />
900MHz, and source impedances at 49.2+j0.6 Ohm.<br />
20.68<br />
20.81<br />
20.68
HMT-TQT-TGA2602-SM<br />
PAEmarker<br />
indep(PAEmarker)= 3<br />
PAE_contours_p=0.267 / 112.037<br />
lev el=46.568284, number=1<br />
impedance = Z0 * (0.731 + j0.389)<br />
Poutmarker<br />
indep(Poutmarker)= 1<br />
Pdel_contours_p=0.282 / 147.914<br />
lev el=20.031721, number=1<br />
impedance = Z0 * (0.591 + j0.193)<br />
Load Pull Validations (f=1900MHz)<br />
Pdel_contours_p<br />
PAE_contours_p<br />
Delivered power (blue) and PAE (red) contours for model (top) and measurement (bottom)<br />
Load impedance at<br />
max. PAE<br />
Sy stem<br />
Ref erence<br />
Impedance<br />
PAE (thick) and Deliv ered<br />
Power (thin) Contours<br />
Poutmarker<br />
PAEmarker<br />
indep(PAE_contours_p) (0.000 to 26.000)<br />
indep(Pdel_contours_p) (0.000 to 30.000)<br />
Max. PAE Value<br />
(%)<br />
Measured 45.5.2+j8.4 38.2<br />
Model 36.5+j19.4 46.67<br />
50.000<br />
Load impedance<br />
at Max Pout<br />
25.7+j6.2<br />
29.5+j9.6<br />
Set Deliv ered Power<br />
contour step size (dB)<br />
and PAE contour step<br />
size (%), and number of<br />
contour lines<br />
Eqn Pdel_step=0.25<br />
Eqn PAE_step=1<br />
Eqn NumPAE_lines=5<br />
Eqn NumPdel_lines=5<br />
Maximum<br />
Power-Added<br />
Ef f iciency , %<br />
46.67<br />
Maximum<br />
Power<br />
Deliv ered,<br />
dBm<br />
Max Pout Value<br />
(dbm)<br />
Comparison of load pull between the measurement data (bottom) and the model performance<br />
(top). The bias conditions: Vgs=-0.18V and Vds=4V, the input power=0dBm, the frequency<br />
1900MHz, and source impedances at 52.79-j0.9 Ohm.<br />
20.04<br />
20.53<br />
20.04
HMT-TQT-TGA2602-SM<br />
Gain (dB)<br />
Gain (dB)<br />
35<br />
30<br />
25<br />
20<br />
15<br />
10<br />
5<br />
Single tone power sweep (f=900MHz)<br />
0<br />
8<br />
-22 -20 -18 -16 -14 -12 -10 -8 -6<br />
Legend: Solid lines-Model, markers-Measured data<br />
-Gain Compression, -Output power<br />
Simulated and measured with source impedance at 39.82+j59.79 ohms and load<br />
impedance at 36.71+j22.88 ohms. An input frequency of 900 MHz.<br />
The bias condition: Vgs=-0.18V and Vds=4V (Ids~50mA)<br />
35<br />
30<br />
25<br />
20<br />
15<br />
10<br />
5<br />
Input power (dBm)<br />
0<br />
-30 -25 -20 -15 -10 -5 0 5<br />
Input power (dBm)<br />
Legend: Solid lines-Model, markers-Measured data<br />
-Gain Compression, -Output power<br />
Simulated and measured with an input impedance at 50 ohms and the output<br />
impedance at 50 ohms. An input frequency of 900 MHz.<br />
The bias condition: Vgs=-0.18V and Vds=4V (Ids~50mA)<br />
22<br />
20<br />
18<br />
16<br />
14<br />
12<br />
10<br />
25<br />
20<br />
15<br />
10<br />
5<br />
0<br />
-5<br />
Output power (dBm)<br />
Output power (dBm)
HMT-TQT-TGA2602-SM<br />
Gain (dB)<br />
Gain (dB)<br />
35<br />
30<br />
25<br />
20<br />
15<br />
10<br />
5<br />
35<br />
30<br />
25<br />
20<br />
15<br />
10<br />
Single tone power sweep (f=1900MHz)<br />
0<br />
-20 -18 -16 -14 -12 -10 -8 -6 -4 -2 0 2<br />
Input power (dBm)<br />
Legend: Solid lines-Model, markers-Measured data<br />
-Gain Compression, -Output power<br />
Simulated and measured with source impedance at 15.5+j19.9 ohms and<br />
load impedance at 22.4+j6.54 ohms. An input frequency of 1900 MHz.<br />
The bias condition: Vgs=-0.18V and Vds=4V (Ids~50mA)<br />
5<br />
0<br />
-20 -18 -16 -14 -12 -10 -8 -6 -4 -2 0<br />
Input power (dBm)<br />
Legend: Solid lines-Model, markers-Measured data<br />
-Gain Compression, -Output power<br />
Simulated and measured with an input impedance at 50 ohms and the output<br />
impedance at 50 ohms. An input frequency of 1900 MHz.<br />
The bias condition: Vgs=-0.18V and Vds=4V (Ids~50mA)<br />
25<br />
20<br />
15<br />
10<br />
5<br />
20<br />
15<br />
10<br />
5<br />
0<br />
Output power (dBm)<br />
Output power (dBm)
HMT-TQT-TGA2602-SM<br />
Third order inter-modulation (IP3 and IM3) (f=900MHz)<br />
Pout & IM3 (dBm)<br />
IP3 (dB)<br />
40<br />
20<br />
0<br />
-20<br />
-40<br />
-60<br />
-80<br />
35<br />
30<br />
25<br />
20<br />
15<br />
10<br />
-22 -20 -18 -16 -14 -12 -10 -8 -6 -4 -2 0<br />
Pin (dBm)<br />
-22 -20 -18 -16 -14 -12 -10 -8 -6 -4 -2 0<br />
Pin (dBm)<br />
Legend: Solid lines-Model, markers-Measured data<br />
–IM3, -Output power, X - IP3<br />
Simulated and measured with source impedance at 131+j88.47 ohms and load<br />
impedance at 36.71+j22.88 ohms. An input frequency of 900 MHz.<br />
The bias condition: Vgs=-0.18V and Vds=4V (Ids~50mA)
HMT-TQT-TGA2602-SM<br />
Third order inter-modulation (IP3 and IM3) (f=1900MHz)<br />
Pout & IM3 (dBm)<br />
IP3 (dB)<br />
40<br />
20<br />
-20<br />
-40<br />
-60<br />
-80<br />
-20 -18 -16 -14 -12 -10 -8 -6 -4 -2 0 2<br />
35<br />
30<br />
25<br />
20<br />
15<br />
10<br />
0<br />
Pin (dBm)<br />
-20 -18 -16 -14 -12 -10 -8 -6 -4 -2 0 2<br />
Pin (dBm)<br />
Legend: Solid lines-Model, markers-Measured data<br />
–IM3, -Output power, X - IP3<br />
Simulated and measured with source impedance at 88.53+j26.87 ohms and<br />
load impedance at 22.4+j6.54 ohms. An input frequency of 1900 MHz.<br />
The bias condition: Vgs=-0.18V and Vds=4V (Ids~50mA)<br />
Notice: Modelithics models represent as-measured characteristics of sample devices using specific testing and fixture configurations. The accuracy of models may<br />
vary as a result of differing device characteristics, test fixtures, or test conditions. No liability shall be assumed by Modelithics for use of its models, or for any infringement<br />
of rights of third parties that may result from their use. Modelithics reserves the right to revise its models and its product line without prior notice.