HMT-TQT-TGF2961-SD - TriQuint
HMT-TQT-TGF2961-SD - TriQuint
HMT-TQT-TGF2961-SD - TriQuint

Create successful ePaper yourself
Turn your PDF publications into a flip-book with our unique Google optimized e-Paper software.
Model Features<br />
Broadband (DC-6GHz)<br />
Non-linear (Angelov model)<br />
Measurement validations:<br />
- Pulse IV<br />
- Multi bias S-parameters<br />
- Single tone Power sweep for<br />
(0.8, 1, 2 and 2.5GHz)<br />
- Two tone Power sweep for<br />
(0.8, 1, 2 and 2.5GHz)<br />
- Load pull (0.8, 1, 2 and 2.5GHz)<br />
Model Description<br />
Technical Notes<br />
• The non-linear model is extracted from Pulsed IV<br />
and multi-bias S-parameter measurements<br />
• The non-linear model is used to simulate power,<br />
PAE and intermodulation behavior.<br />
• The model has been validated with measurements<br />
over the frequency range DC to 6 GHz in a<br />
common source configuration.<br />
• Typical bias condition is Vds=8V, Ids=200mA<br />
• Via-grounding effects are included as part of the<br />
model (see layout diagram on next page).<br />
• The substrate used to extract the model: 20mil<br />
FR4<br />
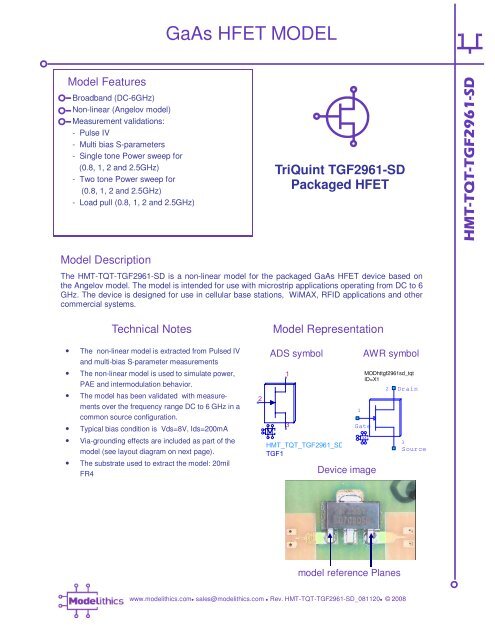
GaAs HFET MODEL<br />
<strong>TriQuint</strong> <strong>TGF2961</strong>-<strong>SD</strong><br />
Packaged HFET<br />
The <strong>HMT</strong>-<strong>TQT</strong>-<strong>TGF2961</strong>-<strong>SD</strong> is a non-linear model for the packaged GaAs HFET device based on<br />
the Angelov model. The model is intended for use with microstrip applications operating from DC to 6<br />
GHz. The device is designed for use in cellular base stations, WiMAX, RFID applications and other<br />
commercial systems.<br />
2<br />
Model Representation<br />
ADS symbol AWR symbol<br />
1<br />
3<br />
<strong>HMT</strong>_<strong>TQT</strong>_<strong>TGF2961</strong>_<strong>SD</strong><br />
TGF1<br />
Device image<br />
model reference Planes<br />
1<br />
Gate<br />
MODhttgf2961sd_tqt<br />
ID=X1<br />
www.modelithics.com sales@modelithics.com Rev. <strong>HMT</strong>-<strong>TQT</strong>-<strong>TGF2961</strong>-<strong>SD</strong>_081120 © 2008<br />
M<br />
2<br />
Drain<br />
3<br />
Source<br />
<strong>HMT</strong>-<strong>TQT</strong>-<strong>TGF2961</strong>-<strong>SD</strong>
<strong>HMT</strong>-<strong>TQT</strong>-<strong>TGF2961</strong>-<strong>SD</strong><br />
Drain Current (A)<br />
0.9<br />
0.8<br />
0.7<br />
0.6<br />
0.5<br />
0.4<br />
0.3<br />
0.2<br />
0.1<br />
0.0<br />
-0.1<br />
Test Layout<br />
Note: units are mils (mm)<br />
Pulsed IV Characteristics (25C)<br />
0 1 2 3 4 5 6 7 8 9 10 11 12<br />
Drain-Source Voltage (V)<br />
Legend: Solid Red lines-Model, dashed lines with Blue □ markers-Measured data<br />
Simulated at T=25C with VGS varying from –2.5 to 0.75V in steps of 0.25V<br />
and VDS=0 to 12 V in steps of 0.5V<br />
VGS=0.750<br />
VGS=0.500<br />
VGS=0.250<br />
VGS=0.000<br />
VGS=-0.250<br />
VGS=-0.500<br />
VGS=-0.750<br />
VGS=-1.000<br />
VGS=-1.250<br />
VGS=-1.500<br />
VGS=-1.750<br />
VGS=-2.000<br />
VGS=-2.500<br />
VGS=-2.250
<strong>HMT</strong>-<strong>TQT</strong>-<strong>TGF2961</strong>-<strong>SD</strong><br />
S12<br />
S11<br />
freq (100.0MHz to 6.000GHz)<br />
S-parameters<br />
-0.10 -0.05 0.00 0.05<br />
0.10<br />
freq (100.0MHz to 6.000GHz)<br />
S21<br />
S22<br />
-20 -15 -10 -5 0 5 10 15 20<br />
freq (100.0MHz to 6.000GHz)<br />
freq (100.0MHz to 6.000GHz)<br />
Legend: Solid Red lines-Model, dashed lines with Blue markers-Measured data<br />
Bias condition: Vds=6V, Vgs = -1.2, Ids=170mA.<br />
Frequency range is 0.1 to 6 GHz.
<strong>HMT</strong>-<strong>TQT</strong>-<strong>TGF2961</strong>-<strong>SD</strong><br />
S12<br />
S11<br />
freq (100.0MHz to 6.000GHz)<br />
-0.10 -0.05 0.00 0.05<br />
0.10<br />
freq (100.0MHz to 6.000GHz)<br />
S-parameters<br />
S21<br />
S22<br />
-20 -15 -10 -5 0 5 10 15 20<br />
freq (100.0MHz to 6.000GHz)<br />
freq (100.0MHz to 6.000GHz)<br />
Legend: Solid Red lines-Model, dashed lines with Blue markers-Measured data<br />
Bias condition: Vds=8V, Vgs = -1.2, Ids=200mA.<br />
Frequency range is 0.1 to 6 GHz.
<strong>HMT</strong>-<strong>TQT</strong>-<strong>TGF2961</strong>-<strong>SD</strong><br />
S12<br />
S11<br />
freq (100.0MHz to 6.000GHz)<br />
S-parameters<br />
-0.10 -0.05 0.00 0.05<br />
0.10<br />
freq (100.0MHz to 6.000GHz)<br />
-15 -10 -5 0 5 10 15<br />
Legend: Solid Red lines-Model, dashed lines with Blue markers-Measured data<br />
Bias condition: Vds=8V, Vgs = -0.8V, Ids=300mA.<br />
Frequency range is 0.1 to 6 GHz.<br />
S21<br />
S22<br />
freq (100.0MHz to 6.000GHz)<br />
freq (100.0MHz to 6.000GHz)
<strong>HMT</strong>-<strong>TQT</strong>-<strong>TGF2961</strong>-<strong>SD</strong><br />
PAEmarker<br />
indep(PAEmarker)= 3<br />
PAE_contours_p=0.210 / 108.521<br />
lev el=56.636302, number=1<br />
impedance = Z0 * (0.812 + j0.338)<br />
Poutmarker<br />
indep(Poutmarker)= 1<br />
Pdel_contours_p=0.226 / 158.409<br />
lev el=29.122055, number=1<br />
impedance = Z0 * (0.644 + j0.113)<br />
Load Pull Validations (f=800MHz)<br />
Pdel_contours_p<br />
PAE_contours_p<br />
Delivered power (blue) and PAE (red) contours for model (top) and measurement (bottom)<br />
Max. PAE<br />
Value (%)<br />
Sy stem<br />
Ref erence<br />
Impedance<br />
PAE (thick) and Deliv ered<br />
Power (thin) Contours<br />
Poutmarker<br />
PAEmarker<br />
indep(PAE_contours_p) (0.000 to 24.000)<br />
indep(Pdel_contours_p) (0.000 to 27.000)<br />
Load impedance<br />
at max<br />
PAE (ohm)<br />
50.000<br />
Max Pout<br />
Value (dbm)<br />
Set Deliv ered Power<br />
contour step size (dB)<br />
and PAE contour step<br />
size (%), and number of<br />
contour lines<br />
Eqn Pdel_step=0.25<br />
Eqn PAE_step=2<br />
Eqn NumPAE_lines=5<br />
Eqn NumPdel_lines=5<br />
Maximum<br />
Power-Added<br />
Ef f iciency , %<br />
Load impedance<br />
at max<br />
Pout (ohm)<br />
Measured 43.95 27.3 +j4.96 29.37 24.7 +j1.98<br />
Model 56.65 40.5 + j16.8 29.13 32 + j5.8<br />
Maximum<br />
Power<br />
Deliv ered,<br />
dBm<br />
Comparison of load pull between the measurement data (bottom) and the model performance<br />
(top). The bias conditions: Vgs=-1.2V and Vds=8V, Input power=11dBm, Frequency = 800MHz.<br />
Source impedance is set at 50.4 - j1.96<br />
56.65<br />
29.13
<strong>HMT</strong>-<strong>TQT</strong>-<strong>TGF2961</strong>-<strong>SD</strong><br />
PAEmarker<br />
indep(PAEmarker)= 3<br />
PAE_contours_p=0.227 / 108.561<br />
lev el=58.281634, number=1<br />
impedance = Z0 * (0.792 + j0.360)<br />
Poutmarker<br />
indep(Poutmarker)= 1<br />
Pdel_contours_p=0.352 / 163.472<br />
lev el=29.398758, number=1<br />
impedance = Z0 * (0.488 + j0.111)<br />
Load Pull Validations (f=1000MHz)<br />
Pdel_contours_p<br />
PAE_contours_p<br />
Delivered power (blue) and PAE (red) contours for model (top) and measurement (bottom)<br />
Max. PAE<br />
Value (%)<br />
Sy stem<br />
Ref erence<br />
Impedance<br />
PAE (thick) and Deliv ered<br />
Power (thin) Contours<br />
Poutmarker<br />
PAEmarker<br />
indep(PAE_contours_p) (0.000 to 20.000)<br />
indep(Pdel_contours_p) (0.000 to 33.000)<br />
Load impedance<br />
at max<br />
PAE (ohm)<br />
50.000<br />
Max Pout<br />
Value (dbm)<br />
Set Deliv ered Power<br />
contour step size (dB)<br />
and PAE contour step<br />
size (%), and number of<br />
contour lines<br />
Eqn Pdel_step=0.25<br />
Eqn PAE_step=2<br />
Eqn NumPAE_lines=5<br />
Eqn NumPdel_lines=5<br />
Maximum<br />
Power-Added<br />
Ef f iciency , %<br />
Load impedance<br />
at max<br />
Pout (ohm)<br />
Measured 49.45 26 + j7.8 29.85 22.5 + j0.7<br />
Model 58.29 39.4 + j18 29.41 24.5 + j5.7<br />
Maximum<br />
Power<br />
Deliv ered,<br />
dBm<br />
Comparison of load pull between the measurement data (bottom) and the model performance<br />
(top). The bias conditions: Vgs=-1.2V and Vds=8V, Input power=13dBm, Frequency = 1000MHz.<br />
Source impedance is set at 50.5 + j1.82<br />
58.29<br />
29.41
<strong>HMT</strong>-<strong>TQT</strong>-<strong>TGF2961</strong>-<strong>SD</strong><br />
PAEmarker<br />
indep(PAEmarker)= 3<br />
PAE_contours_p=0.435 / 150.220<br />
lev el=61.443310, number=1<br />
impedance = Z0 * (0.417 + j0.222)<br />
Poutmarker<br />
indep(Poutmarker)= 1<br />
Pdel_contours_p=0.392 / -177.566<br />
lev el=29.508732, number=1<br />
impedance = Z0 * (0.436 - j0.017)<br />
Load Pull Validations (f=2000MHz)<br />
Pdel_contours_p<br />
PAE_contours_p<br />
Delivered power (blue) and PAE (red) contours for model (top) and measurement (bottom)<br />
Max. PAE<br />
Value (%)<br />
Sy stem<br />
Ref erence<br />
Impedance<br />
PAE (thick) and Deliv ered<br />
Power (thin) Contours<br />
PAEmarker<br />
Poutmarker<br />
indep(PAE_contours_p) (0.000 to 23.000)<br />
indep(Pdel_contours_p) (0.000 to 25.000)<br />
Load impedance<br />
at max<br />
PAE (ohm)<br />
50.000<br />
Max Pout<br />
Value (dbm)<br />
Set Deliv ered Power<br />
contour step size (dB)<br />
and PAE contour step<br />
size (%), and number of<br />
contour lines<br />
Eqn Pdel_step=0.25<br />
Eqn PAE_step=2<br />
Eqn NumPAE_lines=5<br />
Eqn NumPdel_lines=5<br />
Maximum<br />
Power-Added<br />
Ef f iciency , %<br />
Load impedance<br />
at max<br />
Pout (ohm)<br />
Measured 54.67 18.6 + j4.15 29.99 18.66 - j4.5<br />
Model 61.45 20.6 + j11.2 29.52 21.94- j0.7<br />
Maximum<br />
Power<br />
Deliv ered,<br />
dBm<br />
Comparison of load pull between the measurement data (bottom) and the model performance<br />
(top). The bias conditions: Vgs=-0.9V and Vds=8V, Input power=13dBm, Frequency = 2000MHz.<br />
Source impedance is set at 5.6 - j4.3<br />
61.45<br />
29.52
<strong>HMT</strong>-<strong>TQT</strong>-<strong>TGF2961</strong>-<strong>SD</strong><br />
PAEmarker<br />
indep(PAEmarker)= 3<br />
PAE_contours_p=0.517 / 168.034<br />
lev el=55.721354, number=1<br />
impedance = Z0 * (0.321 + j0.094)<br />
Poutmarker<br />
indep(Poutmarker)= 6<br />
Pdel_contours_p=0.517 / -168.196<br />
lev el=29.048944, number=1<br />
impedance = Z0 * (0.321 - j0.093)<br />
Load Pull Validations (f=2500MHz)<br />
Pdel_contours_p<br />
PAE_contours_p<br />
Delivered power (blue) and PAE (red) contours for model (top) and measurement (bottom)<br />
Max. PAE<br />
Value (%)<br />
PAEmarker<br />
Poutmarker<br />
Sy stem<br />
Ref erence<br />
Impedance<br />
PAE (thick) and Deliv ered<br />
Power (thin) Contours<br />
indep(PAE_contours_p) (0.000 to 21.000)<br />
indep(Pdel_contours_p) (0.000 to 23.000)<br />
Load impedance<br />
at max<br />
PAE (ohm)<br />
50.000<br />
Max Pout<br />
Value (dbm)<br />
Set Deliv ered Power<br />
contour step size (dB)<br />
and PAE contour step<br />
size (%), and number of<br />
contour lines<br />
Eqn Pdel_step=0.25<br />
Eqn PAE_step=2<br />
Eqn NumPAE_lines=5<br />
Eqn NumPdel_lines=5<br />
Maximum<br />
Power-Added<br />
Ef f iciency , %<br />
Load impedance<br />
at max<br />
Pout (ohm)<br />
Measured 47.71 14.98 - j2.78 29.49 16.38 - j9.2<br />
Model 55.82 15.94 + j4.7 29 15.94 - j4.73<br />
Maximum<br />
Power<br />
Deliv ered,<br />
dBm<br />
Comparison of load pull between the measurement data (bottom) and the model performance<br />
(top). The bias conditions: Vgs=-1.2V and Vds=8V, Input power=14dBm, Frequency = 2500MHz.<br />
Source impedance is set at 6.15 - j10.93<br />
55.82<br />
29.06
<strong>HMT</strong>-<strong>TQT</strong>-<strong>TGF2961</strong>-<strong>SD</strong><br />
Gain (dB), Pout (dBm)<br />
Gain (dB), Pout (dBm)<br />
35<br />
30<br />
25<br />
20<br />
15<br />
Single tone power sweeps<br />
10<br />
0<br />
-10 -5 0 5 10 15 20<br />
Simulated (solid line) and measured (symbols)<br />
source impedance = 48.6+j1.29 ohms and load impedance = 23.68+j3 ohms.<br />
Frequency = 800 MHz, Vds = 8V, Ids = 200mA, Vgs = -1.2V<br />
35<br />
30<br />
25<br />
20<br />
15<br />
10<br />
Fund. Input Power, dBm<br />
5<br />
0<br />
-10 -5 0 5 10 15 20<br />
Fund. Input Power, dBm<br />
Simulated (solid line) and measured (symbols)<br />
source impedance = 50.58+j1.82 ohms and load impedance = 20.9+j1.37 ohms.<br />
Frequency = 1000 MHz, Vds = 8V, Ids = 200mA, Vgs = -1.2V<br />
Legend: Solid lines-Model, symbols-Measured data<br />
-Gain Compression, -Output power, ▼ PAE<br />
100<br />
80<br />
60<br />
40<br />
20<br />
100<br />
80<br />
60<br />
40<br />
20<br />
PAE (%)<br />
PAE (%)
<strong>HMT</strong>-<strong>TQT</strong>-<strong>TGF2961</strong>-<strong>SD</strong><br />
Gain (dB), Pout (dBm)<br />
Gain (dB), Pout (dBm)<br />
30<br />
25<br />
20<br />
15<br />
10<br />
Single tone power sweeps<br />
5<br />
0<br />
-15 -10 -5 0 5 10 15<br />
30<br />
25<br />
20<br />
15<br />
10<br />
Fund. Input Power, dBm<br />
Simulated (solid line) and measured (symbols)<br />
source impedance = 5.36-j4.2 ohms and load impedance = 24.55+j2 ohms.<br />
Frequency = 2000 MHz, Vds = 8V, Ids = 200mA, Vgs = -1.2V<br />
5<br />
0<br />
-10 -5 0 5 10 15<br />
Fund. Input Power, dBm<br />
Simulated (solid line) and measured (symbols)<br />
source impedance = 6.2-j10.8 ohms and load impedance = 24.66-j3.29 ohms.<br />
Frequency = 2500 MHz, Vds = 8V, Ids = 200mA, Vgs = -1.2V<br />
Legend: Solid lines-Model, symbols-Measured data<br />
-Gain Compression, -Output power, ▼ PAE<br />
100<br />
80<br />
60<br />
40<br />
20<br />
100<br />
80<br />
60<br />
40<br />
20<br />
PAE (%)<br />
PAE (%)
<strong>HMT</strong>-<strong>TQT</strong>-<strong>TGF2961</strong>-<strong>SD</strong><br />
Power (dBm)<br />
Power (dBm)<br />
40<br />
25<br />
Two tone power sweeps<br />
Simulated (solid line) and measured (symbols)<br />
source impedance = 9.33+j26.65 ohms and load impedance = 34.15+j16 ohms.<br />
Frequency = 800 MHz, Vds = 8V, Ids = 200mA, Vgs = -1.2V<br />
40<br />
25<br />
5<br />
-15<br />
-35<br />
-55<br />
5<br />
-15<br />
-35<br />
-55<br />
-6 -4 -2 0 2 4 6<br />
Pin (dBm)<br />
-8 -6 -4 -2 0 2 4 6 8<br />
Pin (dBm)<br />
Simulated (solid line) and measured (symbols)<br />
source impedance = 6.1+j18.8 ohms and load impedance = 31.2+j12.6 ohms.<br />
Frequency = 1000 MHz, Vds = 8V, Ids = 200mA, Vgs = -1.2V<br />
Legend: Solid lines-Model, symbols-Measured data<br />
-fundamental, ▼ IM3. IM5
<strong>HMT</strong>-<strong>TQT</strong>-<strong>TGF2961</strong>-<strong>SD</strong><br />
Power (dBm)<br />
Power (dBm)<br />
40<br />
25<br />
5<br />
-15<br />
-35<br />
Two tone power sweeps<br />
-55<br />
-10 -5 0 5 10 15 20<br />
Pin (dBm)<br />
Simulated (solid line) and measured (symbols)<br />
source impedance = 5.36-j4.22 ohms and load impedance = 24.5+j2.0 ohms.<br />
Frequency = 2000 MHz, Vds = 8V, Ids = 200mA, Vgs = -1.2V<br />
40<br />
25<br />
5<br />
-15<br />
-35<br />
-55<br />
-10 -5 0 5 10 15 20<br />
Pin (dBm)<br />
Simulated (solid line) and measured (symbols)<br />
source impedance = 6.2-j10.8 ohms and load impedance = 24.66-j3.29 ohms.<br />
Frequency = 2500 MHz, Vds = 8V, Ids = 200mA, Vgs = -1.2V<br />
Legend: Solid lines-Model, symbols-Measured data<br />
-fundamental, ▼ IM3. IM5<br />
Notice: Modelithics models represent as-measured characteristics of sample devices using specific testing and fixture configurations. The accuracy of models may<br />
vary as a result of differing device characteristics, test fixtures, or test conditions. No liability shall be assumed by Modelithics for use of its models, or for any infringement<br />
of rights of third parties that may result from their use. Modelithics reserves the right to revise its models and its product line without prior notice.