Antioxidant properties, total phenols and pollen analysis of propolis ...
Antioxidant properties, total phenols and pollen analysis of propolis ...
Antioxidant properties, total phenols and pollen analysis of propolis ...

Create successful ePaper yourself
Turn your PDF publications into a flip-book with our unique Google optimized e-Paper software.
2.2. Reagents<br />
Absolute alcohol <strong>and</strong> 2,2-diphenyl-1-picryl-hydrazyl (DPPH) were obtained<br />
from Sigma-Aldrich (Germany). Methanol HPLC grade was obtained from Pronolab<br />
(Lisboa, Portugal). All other chemicals were obtained from Sigma Chemical Co. (St.<br />
Louis, USA). Water was treated in a Milli-Q water purification system (TGI Pure<br />
Water Systems, USA).<br />
2.3. Sample preparation<br />
Samples were prepared by mixing <strong>propolis</strong> with methanol (1:1, v/v) <strong>and</strong> were<br />
left over-night in agitation. After this step, the obtained solution was filtered (Whatman<br />
n 4 filter paper). Two other methanolic extractions were performed using the<br />
same procedures. The combined methanolic extracts were placed at low temperatures<br />
<strong>and</strong>, after 12 h, filtered to remove wax. The methanol was evaporated with a<br />
rotary evaporator. The extracts were evaporated by reduced pressure (Rotavapor<br />
Buchi RE 111 with a Buchi 461 water-bath, 2002), re-dissolved in the corresponding<br />
solvent at a concentration <strong>of</strong> 50 mg/mL <strong>and</strong> analysed for their content in <strong>total</strong><br />
<strong>phenols</strong>.<br />
2.4. Pollen <strong>analysis</strong><br />
The <strong>pollen</strong> <strong>analysis</strong> was executed by the methodology described by Barth et al.<br />
(1999). The <strong>pollen</strong> attainment was initiated by mixing <strong>of</strong> 0.5 g <strong>of</strong> <strong>propolis</strong> with<br />
15 mL <strong>of</strong> absolute alcohol at least 24 h. The mixture obtained after centrifugation<br />
was boiled on KOH 10% for 2 min in water-bath. The sediment was washed in distilled<br />
water, filtered, <strong>and</strong> kept in acid ascetic glacial during a night. Then acetolise <strong>of</strong><br />
<strong>pollen</strong> sediments was carried out in a mixture 9:1 <strong>of</strong> ascetic acid <strong>and</strong> sulphuric acid<br />
anhydride, in water-bath until reaching the temperature <strong>of</strong> 80 °C for about 3 min.<br />
After careful sediment washing with water <strong>and</strong> glycerinate-water, the sediment<br />
was mounted in gelatine-glycerinate, with or without courante (fuchsine basic).<br />
2.5. Determination <strong>of</strong> <strong>total</strong> phenol content<br />
Total <strong>phenols</strong> content in the methanolic extract <strong>of</strong> the different <strong>propolis</strong> were<br />
estimated by a colorimetric assay based on procedures described by Kumazawa<br />
et al. (2002) <strong>and</strong> Singleton et al. (1999) with some modifications. The reaction <strong>of</strong><br />
0.5 mL methanolic extract solution mixed with 0.5 mL <strong>of</strong> the Folin-Ciocalteau re-<br />
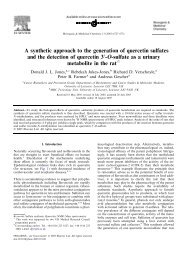
Fig. 1. Location <strong>of</strong> <strong>propolis</strong> samples origin (Bornes <strong>and</strong> Fundão) on the Portugal<br />
map.<br />
L. Moreira et al. / Food <strong>and</strong> Chemical Toxicology 46 (2008) 3482–3485 3483<br />
agent <strong>and</strong> 0.5 mL <strong>of</strong> 10% Na2CO 3 was kept in the dark at room temperature for<br />
1 h, after which the absorbance was read at 700 nm (Unicam UV-Visible Spectrometry<br />
Hekios, United Kingdom). Methanolic extract samples were evaluated at the final<br />
concentration <strong>of</strong> 20 mg/mL. Gallic acid st<strong>and</strong>ard solutions were used for<br />
constructing the calibration curve. Total <strong>phenols</strong> content were expressed as mg <strong>of</strong><br />
gallic acid equivalents/g <strong>of</strong> extract (GAEs).<br />
2.6. Scavenging <strong>of</strong> DPPH radicals<br />
The scavenging <strong>of</strong> 2,2-diphenyl-1-picrylhydrazyl (DPPH) radical was assayed<br />
following the method <strong>of</strong> Hatano et al. (1989). Solutions with different extract concentrations<br />
were prepared. One millilitre <strong>of</strong> the extract solution was dissolved in<br />
MeOH with 1:1 (v/v) <strong>of</strong> DPPH solution (0.1 mM). The mixture was shaken vigorously<br />
<strong>and</strong> left to st<strong>and</strong> for 50 min in the dark at room temperature (until stable<br />
absorbance values were obtained).<br />
The reduction <strong>of</strong> the DPPH-radical was measured by continuous monitoring the<br />
decrease <strong>of</strong> absorption at 517 nm (Unicam UV-Visible Spectrometry Hekios, United<br />
Kingdom). DPPH scavenging effect was calculated as a percentage <strong>of</strong> DPPH discolouration<br />
using the equation:% scavenging effect = [(ADPPH AS)/ADPPH] 100, where<br />
A S is the absorbance <strong>of</strong> the solution when the sample extract has been added at a<br />
particular level <strong>and</strong> A DPPH is the absorbance <strong>of</strong> the DPPH solution. The extract concentration<br />
providing 50% inhibition (EC 50) was calculated from the graph <strong>of</strong> scavenging<br />
effect percentage against extract concentration in solution.<br />
2.7. Reducing power<br />
The reducing power was determined according to the method described by Shi<br />
<strong>and</strong> Dalal (1991). The <strong>propolis</strong> extract (2.5 mL) was mixed with 2.5 mL <strong>of</strong> 0.2 M sodium<br />
phosphate buffer (pH 6.6) <strong>and</strong> 2.5 mL <strong>of</strong> 10 mg/mL potassium ferricyanide.<br />
The mixture was incubated at 50 °C for 20 min. After 2.5 mL <strong>of</strong> 100 mg/mL trichloroacetic<br />
acid were added, the mixture was centrifuged at 650g for 10 min<br />
(Eppendorf centrifuge 5810 R, Germany). The upper layer (2.5 mL) was mixed with<br />
2.5 mL <strong>of</strong> deionised water <strong>and</strong> 0.5 mL <strong>of</strong> 1.0 mg/mL <strong>of</strong> ferric chloride. The mixture<br />
absorbance was measured at 700 nm (higher absorbance indicates higher reducing<br />
power) in an spectrophotomer (Unicam UV-Visible Spectrometry Hekios, United<br />
Kingdom). Extract concentration providing 0.5 <strong>of</strong> absorbance (EC50) was calculated<br />
from the graph <strong>of</strong> absorbance against extract concentration in the solution.<br />
3. Results <strong>and</strong> discussion<br />
3.1. Pollen <strong>analysis</strong><br />
The <strong>pollen</strong> pr<strong>of</strong>ile obtained for the two <strong>propolis</strong> samples are<br />
present in Table 1. Marked differences were found among <strong>propolis</strong><br />
samples <strong>of</strong> different origin. Castanea sativa was the most predominant<br />
<strong>pollen</strong> in Bornes <strong>propolis</strong>, representing 45% <strong>of</strong> the <strong>total</strong> <strong>pollen</strong><br />
composition, being absent in Fundão <strong>propolis</strong>. On the other h<strong>and</strong>,<br />
Populus tremula was the main <strong>pollen</strong> in samples <strong>of</strong> Fundão (50%<br />
<strong>of</strong> the <strong>total</strong> <strong>pollen</strong> composition), while in Bornes <strong>propolis</strong> was the<br />
second predominant <strong>pollen</strong> (30%). Pinus sp. was observed only in<br />
Fundão samples (Table 1) <strong>and</strong> corresponds to the second most predominant<br />
<strong>pollen</strong>.<br />
3.2. Total phenolic contents<br />
The <strong>total</strong> <strong>phenols</strong> content in <strong>propolis</strong> extracts was different<br />
according to the provenience region (Table 2). Bornes <strong>propolis</strong><br />
showed the high amount <strong>of</strong> these compounds, with 329.00 mg/g<br />
<strong>of</strong> GAE, twice the value found in the Fundão <strong>propolis</strong> (151.00 mg/<br />
g <strong>of</strong> GAE).<br />
Table 1<br />
Pollen composition (%) <strong>of</strong> different <strong>propolis</strong> samples<br />
Species Pollen composition (%)<br />
Bornes Fundão<br />
Populus tremula 30 50<br />
Castanea sativa 45 0<br />
Pinus sp. 0 15<br />
Others a<br />
25 35<br />
a Some <strong>of</strong> <strong>pollen</strong>s with predominance less than 5%.