Characterisation of phenolic extracts from olive pulp and ... - ESAC
Characterisation of phenolic extracts from olive pulp and ... - ESAC
Characterisation of phenolic extracts from olive pulp and ... - ESAC

You also want an ePaper? Increase the reach of your titles
YUMPU automatically turns print PDFs into web optimized ePapers that Google loves.
Journal <strong>of</strong> the Science <strong>of</strong> Food <strong>and</strong> Agriculture J Sci Food Agric 85:21–32 (2005)<br />
DOI: 10.1002/jsfa.1925<br />
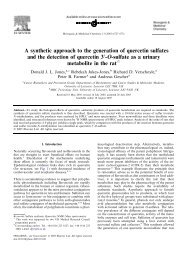
<strong>Characterisation</strong> <strong>of</strong> <strong>phenolic</strong> <strong>extracts</strong> <strong>from</strong><br />
<strong>olive</strong> <strong>pulp</strong> <strong>and</strong> <strong>olive</strong> pomace by electrospray<br />
mass spectrometry<br />
Susana M Cardoso, 1,2 Sylvain Guyot, 3 Nathalie Marnet, 3 José A Lopes-da-Silva, 1<br />
Catherine MGC Renard 3 <strong>and</strong> Manuel A Coimbra 1∗<br />
1 Departamento de Química, Universidade de Aveiro, P-3810-193 Aveiro, Portugal<br />
2 Escola Superior Agrária de Bragança, Instituto Superior Politécnico de Bragança, P-5301-855 Bragança, Portugal<br />
3 Unité de Recherches Cidricoles—Biotransformations des Fruits et Légumes, INRA, BP 35327, F-35653 Le Rheu Cédex, France<br />
Abstract: Methanol <strong>extracts</strong> <strong>of</strong> <strong>olive</strong> pomace (two-phase <strong>olive</strong> oil extraction) <strong>and</strong> <strong>olive</strong> <strong>pulp</strong> were analysed<br />
by reverse phase HPLC <strong>and</strong> the eluted fractions were characterised by electrospray ionisation mass<br />
spectrometry. This technique allowed the identification <strong>of</strong> some common <strong>phenolic</strong> compounds, namely,<br />
verbascoside, rutin, caffeoyl-quinic acid, luteolin-4-glucoside <strong>and</strong> 11-methyl-oleoside. Hydroxytyrosol-1 ′ -<br />
β-glucoside, luteolin-7-rutinoside <strong>and</strong> oleoside were also detected. Moreover, this technique enabled the<br />
identification, for the first time in Olea europaea tissues, <strong>of</strong> two oleoside derivatives, 6 ′ -β-glucopyranosyloleoside<br />
<strong>and</strong> 6 ′ -β-rhamnopyranosyl-oleoside, <strong>and</strong> <strong>of</strong> 10-hydroxy-oleuropein. Also, an oleuropein glucoside<br />
that had previously been identified in <strong>olive</strong> leaves was now detected in <strong>olive</strong> fruit, both in <strong>olive</strong> <strong>pulp</strong> <strong>and</strong><br />
<strong>olive</strong> pomace. With the exception <strong>of</strong> oleoside <strong>and</strong> oleuropein, the majority <strong>of</strong> <strong>phenolic</strong> compounds were<br />
found to occur in equivalent amounts in <strong>olive</strong> <strong>pulp</strong> <strong>and</strong> <strong>olive</strong> pomace. Oleoside was the main <strong>phenolic</strong><br />
compound in <strong>olive</strong> <strong>pulp</strong> (31.6 mg g −1 ) but was reduced to 3.6 mg g −1 in <strong>olive</strong> pomace, <strong>and</strong> oleuropein<br />
(2.7 mg g −1 in the <strong>pulp</strong>) almost disappeared (
SM Cardoso et al<br />
biological properties such as antimicrobial, hypoglycaemic,<br />
hypolipidemic, hypocholesterolic, antioxidant<br />
<strong>and</strong> free radical-scavenging actions. 11 – 15 The association<br />
<strong>of</strong> these properties with the prevention <strong>of</strong> several<br />
diseases such as atherosclerosis <strong>and</strong> heart diseases has<br />
raised interest in these <strong>phenolic</strong> compounds.<br />
The analysis <strong>of</strong> <strong>phenolic</strong> <strong>extracts</strong> <strong>from</strong> <strong>olive</strong> <strong>and</strong><br />
related products has been mostly performed by<br />
reverse phase HPLC coupled with diode array<br />
detection (DAD). More recently, the association <strong>of</strong><br />
this methodology with ionisation mass spectrometry<br />
has proved to be useful in the identification <strong>of</strong> the<br />
16 – 20<br />
major compounds in <strong>olive</strong> <strong>phenolic</strong> <strong>extracts</strong>.<br />
Moreover, this methodology has been <strong>of</strong> great help<br />
in the identification <strong>of</strong> new compounds even when<br />
present in trace amounts. 21 In order to contribute to<br />
the knowledge <strong>of</strong> the <strong>phenolic</strong> compounds present<br />
in <strong>olive</strong> pomace, the reversed phase HPLC/DAD<br />
separation <strong>of</strong> a methanol extract was performed, the<br />
collected fractions were characterised by electrospray<br />
ionisation mass spectrometry (ESI-MS n ) <strong>and</strong> the<br />
structures <strong>of</strong> new compounds were identified by MS 2<br />
<strong>and</strong> MS 3 experiments.<br />
MATERIALS AND METHODS<br />
Phenolic st<strong>and</strong>ards<br />
Caffeoyl-quinic acid, vanillic acid, protocatechuic<br />
acid, syringic acid, oleuropein, luteolin, luteolin-7-<br />
glucoside, cinnamic acid <strong>and</strong> tyrosol were purchased<br />
<strong>from</strong> Sigma Chemical Co (St Louis, MO, USA).<br />
Solvents <strong>and</strong> reagents<br />
n-Hexane, methanol, acetone <strong>and</strong> acetonitrile, all <strong>of</strong><br />
chromatographic grade, were purchased <strong>from</strong> Biosolve<br />
BV (Valkenswaard, The Netherl<strong>and</strong>s). Glacial<br />
acetic acid was also purchased <strong>from</strong> Biosolve Ltd.<br />
Folin–Ciocalteu reagent was purchased <strong>from</strong> Merck<br />
(Darmstadt, Germany). Deionised water was obtained<br />
with a Milli-Q water system (Millipore, Bedford, MA,<br />
USA).<br />
Sample origin<br />
The analyses were performed on two samples <strong>of</strong><br />
the same batch: <strong>olive</strong> pomace <strong>and</strong> <strong>olive</strong> <strong>pulp</strong> (Olea<br />
europaea L var Verdial). The samples were collected at<br />
Prolagar, an <strong>olive</strong> oil factory in Mir<strong>and</strong>ela, Portugal. A<br />
representative sample (2 kg, 912 <strong>olive</strong>s) was collected<br />
before processing. These <strong>olive</strong>s were stoned, immersed<br />
in 0.5% NaF solution <strong>and</strong> homogenised in a mixer. In<br />
the factory, <strong>olive</strong>s <strong>from</strong> the same batch were crushed<br />
with a hammer mill, malaxed (slowly mixed) in a<br />
sequential extractor at a temperature close to 40 ◦ C<br />
for 45 min <strong>and</strong> separated <strong>from</strong> the <strong>olive</strong> oil in a<br />
continuous two-phase centrifugation system. At this<br />
stage the <strong>olive</strong> pomace was collected. After collection,<br />
this residue was immediately immersed in 0.5% NaF.<br />
After arriving at the laboratory, the samples were<br />
immediately frozen, freeze-dried <strong>and</strong> kept at −20 ◦ C<br />
until used.<br />
Extraction <strong>of</strong> <strong>phenolic</strong> compounds<br />
The extraction procedure used for the <strong>olive</strong> <strong>pulp</strong> <strong>and</strong><br />
<strong>olive</strong> pomace was adapted <strong>from</strong> that <strong>of</strong> Guyot et al. 22<br />
Just before extraction the freeze-dried materials were<br />
sieved through a 700 µm filter to remove the nonpulverised<br />
peel <strong>and</strong> the stones that were present<br />
in the <strong>olive</strong> pomace. Each sample (30 g <strong>of</strong> powder)<br />
was defatted with n-hexane, which was subsequently<br />
discarded, <strong>and</strong> the residue was extracted with 300 ml<br />
<strong>of</strong> methanol. The solution was filtered, concentrated,<br />
frozen at −20 ◦ C <strong>and</strong> freeze-dried to give the nonpurified<br />
methanol extract. The resulting residue was<br />
extracted with acetone/water (6:4 v/v). Acetone was<br />
eliminated as described for methanol <strong>and</strong> the aqueous<br />
solution was frozen <strong>and</strong> freeze-dried to obtain the<br />
non-purified aqueous acetone extract. The insoluble<br />
residue was abundantly washed with water, frozen <strong>and</strong><br />
freeze-dried.<br />
Estimation <strong>of</strong> amount <strong>of</strong> smashed seed hull in<br />
<strong>olive</strong> pomace<br />
To relate the amount <strong>of</strong> material extracted <strong>from</strong><br />
<strong>olive</strong> pomace with <strong>olive</strong> <strong>pulp</strong>, a procedure to allow<br />
the estimation <strong>of</strong> the amount <strong>of</strong> <strong>olive</strong> hull in <strong>olive</strong><br />
pomace material was designed. As this lignified<br />
material contains low amounts <strong>of</strong> the typical <strong>phenolic</strong><br />
compounds found in the <strong>pulp</strong>, 5,23 it should be omitted<br />
<strong>from</strong> the basis <strong>of</strong> calculation <strong>of</strong> starting material rich in<br />
<strong>phenolic</strong> compounds. An <strong>olive</strong> pomace representative<br />
sample was freeze-dried <strong>and</strong> defatted <strong>and</strong> the resulting<br />
residue was sieved through a 300 µm filter in order<br />
to separate the smashed seed <strong>and</strong> stone particles<br />
still present <strong>from</strong> the <strong>pulp</strong> material. The seeds <strong>and</strong><br />
stones that are resistant to the grinding <strong>and</strong> malaxing,<br />
remain as coarser particles which are retained on the<br />
sieve, while the purified <strong>pulp</strong> passes through. The<br />
sieving through the 300 µm filter was only possible<br />
after defatting, since otherwise the fat present in the<br />
material would immediately have collapsed the fine<br />
pores <strong>of</strong> the filter. This procedure resulted in a residue<br />
without visible smashed particles, which accounted for<br />
90.1% <strong>of</strong> the defatted residue.<br />
Purification <strong>of</strong> methanol <strong>and</strong> acetone <strong>extracts</strong><br />
The purification step was performed on Sep Pack<br />
C18 cartridges (5 g, Waters, Milford, MA, USA).<br />
The cartridges were preconditioned by sequential<br />
treatment with methanol, H 2 O <strong>and</strong> 2% acetic<br />
acid. Two fractions <strong>of</strong> the <strong>phenolic</strong> compounds<br />
were recovered by elution <strong>of</strong> the cartridges with<br />
methanol/water/acetic acid (50:48:2 v/v/v) followed<br />
by methanol/acetic acid (98:2 v/v). The fractions<br />
corresponding to 50 <strong>and</strong> 100% methanol extractions<br />
(MeOH 50 <strong>and</strong> MeOH 100 respectively) were<br />
concentrated to an aqueous suspension, frozen <strong>and</strong><br />
freeze-dried.<br />
Colorimetric quantification <strong>of</strong> total <strong>phenolic</strong><br />
compounds by Folin–Ciocalteu method<br />
The total concentration <strong>of</strong> <strong>phenolic</strong> compounds in the<br />
non-purified <strong>and</strong> purified <strong>extracts</strong> was determined by<br />
22 J Sci Food Agric 85:21–32 (2005)
Phenolic compounds <strong>of</strong> <strong>olive</strong> pomace<br />
an adaptation <strong>of</strong> the Folin–Ciocalteu method 24 by<br />
dispersing the non-purified <strong>and</strong> purified <strong>extracts</strong> by<br />
sonication in aqueous acetic acid (2.5% v/v) <strong>and</strong> using<br />
a calibration curve <strong>of</strong> oleuropein st<strong>and</strong>ard (0–70 µg).<br />
Reverse phase HPLC conditions<br />
HPLC analysis was performed using a Waters 2690<br />
separation module equipped with an autosampler<br />
<strong>and</strong> a cooling system, set to 4 ◦ C, <strong>and</strong> a Waters<br />
996 photodiode array detector. Data acquisition <strong>and</strong><br />
remote control <strong>of</strong> the HPLC system were done<br />
by Millennium 32 version 3.20 s<strong>of</strong>tware (Waters,<br />
Milford, MA, USA). The column was a 250 mm ×<br />
4mm id, 5µm bead diameter, end-capped Purospher<br />
RP 18 column (Merck) maintained at 30 ◦ C. The<br />
mobile phase comprised (A) 2.5% acetic acid <strong>and</strong><br />
(B) acetonitrile, which were previously degassed <strong>and</strong><br />
then continuously sparged with high-purity helium<br />
during analysis to prevent air resaturation. The solvent<br />
gradient started with 97% A <strong>and</strong> 3% B, reaching 91%<br />
A at 4 min, 85% A at 15 min, 79% A at 75 min,<br />
70% A at 80 min <strong>and</strong> 10% A at 85 min, followed by<br />
an isocratic plateau for 5 min <strong>and</strong> a return to initial<br />
conditions.<br />
For the HPLC analysis the purified methanol<br />
<strong>extracts</strong> (5 mg) were dissolved in 1 ml <strong>of</strong> methanol/-<br />
acetic acid (99:1 v/v). All samples were filtered through<br />
a0.45 µm Teflon membrane (Millipore) <strong>and</strong> 10 µl <strong>of</strong><br />
each solution was injected.<br />
HPLC characterisation <strong>of</strong> <strong>phenolic</strong> compounds<br />
Compounds for which st<strong>and</strong>ards were available were<br />
first identified by comparison <strong>of</strong> the retention times<br />
<strong>and</strong> UV/vis spectra <strong>of</strong> the corresponding peaks. As<br />
on-line LC/MS does not give enough time to examine<br />
in detail the MS n patterns <strong>of</strong> the various fragments,<br />
the 27 peak-forming fractions were collected prior to<br />
their characterisation by electrospray ionisation mass<br />
spectrometry (ESI-MS n ).<br />
HPLC quantification <strong>of</strong> <strong>phenolic</strong> compounds<br />
Quantification <strong>of</strong> the identified compounds was performed<br />
by correlating the measured peak area with<br />
the calibration curves obtained with reference compounds.<br />
Oleuropein <strong>and</strong> hydroxytyrosol glucoside<br />
were quantified according to their absorbances at<br />
280 nm. In accordance with Mulinacci et al, 8 hydroxytyrosol<br />
glucoside was quantified using tyrosol as<br />
reference compound. Oleoside <strong>and</strong> its derivatives<br />
were evaluated at 240 nm using oleuropein as reference.<br />
Caffeoyl-quinic acid was evaluated at 320 nm<br />
using caffeoyl-quinic acid as reference. The flavones<br />
luteolin-7-glucoside, luteolin-4-glucoside, luteolin-7-<br />
rutinoside <strong>and</strong> rutin were evaluated at 340 nm <strong>and</strong><br />
expressed with the extinction coefficient <strong>of</strong> luteolin-7-<br />
glucoside.<br />
ESI-MS<br />
The mass spectrometry system was an LCQ DECA<br />
ion trap mass spectrometer (Therm<strong>of</strong>innigan, San<br />
Jose, CA, USA) equipped with an ESI source <strong>and</strong><br />
run by Xcalibur ® (Therm<strong>of</strong>innigan, San Jose, CA,<br />
USA) version 1.2 s<strong>of</strong>tware. Infusion analyses were<br />
performed in negative mode with an ion spray voltage<br />
<strong>of</strong> approximately 4500 kV, a −60 V orifice voltage, a<br />
225 ◦ C capillary temperature, a 50 au (arbitrary units)<br />
sheath nitrogen gas flow rate <strong>and</strong> a nominal mass<br />
range up to m/z 1800. Although <strong>phenolic</strong> compounds<br />
give lower-intensity peaks in negative than in positive<br />
mode, negative ion electrospray was used because<br />
cleaner spectra were obtained. Samples corresponding<br />
to collected HPLC peaks were directly introduced into<br />
the ESI source by a built-in syringe pump at a flow<br />
rate <strong>of</strong> 10 µl min −1 .<br />
RESULTS AND DISCUSSION<br />
Isolation <strong>and</strong> purification <strong>of</strong> <strong>phenolic</strong> compounds<br />
The yields <strong>of</strong> mass <strong>and</strong> <strong>phenolic</strong> compounds extracted<br />
<strong>from</strong> <strong>olive</strong> <strong>pulp</strong> <strong>and</strong> <strong>olive</strong> pomace using methanol <strong>and</strong><br />
aqueous acetone are presented in Table 1. Ponderal<br />
yields were calculated on a dried, defatted <strong>and</strong><br />
dehulled basis to facilitate comparisons between <strong>olive</strong><br />
<strong>pulp</strong> <strong>and</strong> <strong>olive</strong> pomace. Indeed, the two samples had<br />
different oil contents <strong>and</strong>, in contrast with the <strong>olive</strong><br />
<strong>pulp</strong>, the <strong>olive</strong> pomace still contained smashed seed<br />
hulls, the weight <strong>of</strong> which was estimated as 9.9% <strong>of</strong><br />
defatted <strong>olive</strong> pomace.<br />
For both samples the methanol extract was the<br />
most significant one, representing 68 <strong>and</strong> 66% <strong>of</strong><br />
the dried, defatted <strong>and</strong> dehulled <strong>olive</strong> <strong>pulp</strong> <strong>and</strong> <strong>olive</strong><br />
pomace respectively. The aqueous acetone extract <strong>of</strong><br />
both samples consisted <strong>of</strong> about 10% <strong>of</strong> the methanol<br />
extract. The remaining residues represented 23 <strong>and</strong><br />
28% <strong>of</strong> the <strong>olive</strong> <strong>pulp</strong> <strong>and</strong> <strong>olive</strong> pomace respectively.<br />
Mass recovery <strong>of</strong> the <strong>extracts</strong> <strong>and</strong> residues was about<br />
98% for <strong>olive</strong> <strong>pulp</strong> <strong>and</strong> total for <strong>olive</strong> pomace.<br />
The total <strong>phenolic</strong>s <strong>of</strong> each extract were expressed<br />
as oleuropein equivalents <strong>and</strong> the values are shown in<br />
Table 1. Depending on the considered material (<strong>pulp</strong><br />
or pomace), the non-purified methanol <strong>and</strong> aqueous<br />
acetone <strong>extracts</strong> showed total polyphenol proportions<br />
in the range <strong>of</strong> 20–36%. After C18 cartridge<br />
purification the <strong>phenolic</strong> content was raised, with a<br />
<strong>phenolic</strong> recovery <strong>of</strong> 97–99% in the methanol <strong>extracts</strong><br />
(MeOH 50 <strong>and</strong> MeOH 100) <strong>and</strong> total recovery in<br />
the acetone <strong>extracts</strong> (Acetone 50 <strong>and</strong> Acetone 100).<br />
The sum <strong>of</strong> the amounts <strong>of</strong> <strong>phenolic</strong> compounds<br />
obtained in methanol <strong>and</strong> acetone <strong>extracts</strong>, calculated<br />
on a dried, defatted <strong>and</strong> dehulled starting material<br />
basis, was similar (154 mg g −1 for <strong>olive</strong> <strong>pulp</strong> <strong>and</strong><br />
146 mg g −1 for <strong>olive</strong> pomace). For both samples,<br />
most <strong>of</strong> the <strong>phenolic</strong> material was present in the<br />
MeOH 50 fraction, which represented 73% <strong>of</strong> the<br />
extractable <strong>phenolic</strong>s <strong>and</strong> was therefore chosen for<br />
further investigation.<br />
Separation <strong>of</strong> <strong>phenolic</strong> compounds by reverse<br />
phase HPLC<br />
The MeOH 50 fractions <strong>of</strong> <strong>olive</strong> pomace <strong>and</strong> <strong>olive</strong><br />
<strong>pulp</strong> were fractionated <strong>and</strong> analysed by HPLC/DAD<br />
J Sci Food Agric 85:21–32 (2005) 23
SM Cardoso et al<br />
Table 1. Yields <strong>of</strong> mass <strong>and</strong> <strong>phenolic</strong> compounds in <strong>extracts</strong> <strong>and</strong> purified fractions (C18 cartridges)<br />
Fraction<br />
Mass (% <strong>of</strong> dry weight)<br />
Total <strong>phenolic</strong>s a<br />
(mg g −1 fraction)<br />
Total <strong>phenolic</strong>s<br />
recovered<br />
(%)<br />
Total <strong>phenolic</strong>s b<br />
(mg g −1 <strong>pulp</strong><br />
or pomace)<br />
Olive <strong>pulp</strong><br />
Non-purified methanol extract 68 c 204 — —<br />
MeOH 50 22 d 752 82 111<br />
MeOH 100 5 d 716 17 23<br />
Non-purified acetone extract 7 c 295 — —<br />
Acetone 50 33 d 726 81 16<br />
Acetone 100 13 d 459 20 4<br />
Olive pomace<br />
Non-purified methanol extract 66 c 198 — —<br />
MeOH 50 18 d 904 83 106<br />
MeOH 100 5 d 601 14 18<br />
Non-purified acetone extract 6 c 356 — —<br />
Acetone 50 35 d 830 82 18<br />
Acetone 100 14 d 480 19 4<br />
a Values expressed as oleuropein equivalents, as result <strong>of</strong> Folin–Ciocalteu assay.<br />
b Values expressed as mg <strong>phenolic</strong> compounds (oleuropein equivalents, as determined by Folin-Ciocalteu assay) g −1 dried, defatted <strong>and</strong> dehulled<br />
material.<br />
c Yield expressed as percentage <strong>of</strong> dried, defatted <strong>and</strong> dehulled starting material (<strong>olive</strong> <strong>pulp</strong> or <strong>olive</strong> pomace).<br />
d Yield expressed as percentage <strong>of</strong> non-purified extract (methanol or acetone).<br />
100<br />
1<br />
8<br />
10<br />
18<br />
<strong>olive</strong> <strong>pulp</strong><br />
Relative absorbance (%)<br />
75<br />
50<br />
25<br />
2,3<br />
6,7<br />
4 5<br />
9<br />
12,13<br />
17<br />
11 14 16<br />
15<br />
19<br />
20<br />
22<br />
21<br />
23 25<br />
24 26<br />
0<br />
100<br />
<strong>olive</strong> pomace<br />
Relative absorbance (%)<br />
75<br />
50<br />
25<br />
0<br />
5 15 25 35 45 55 65<br />
Time (min)<br />
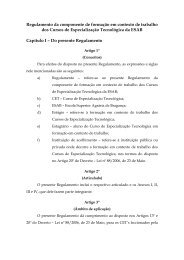
Figure 1. Chromatographic pr<strong>of</strong>iles <strong>of</strong> MeOH 50 fractions <strong>of</strong> <strong>olive</strong> pomace <strong>and</strong> <strong>olive</strong> <strong>pulp</strong> at 240 nm (bold curves) <strong>and</strong> 280 nm (light curves). The<br />
numbers on the figure correspond to the fractions that were collected <strong>and</strong> analysed by ESI-MS.<br />
<strong>and</strong> the respective chromatograms obtained at 240<br />
<strong>and</strong> 280 nm are presented in Fig 1. To improve the<br />
resolution <strong>of</strong> the chromatogram, fraction 27 was not<br />
included. Both samples had a high number <strong>of</strong> resolved<br />
fractions, suggesting a large variety <strong>of</strong> compounds.<br />
Although reasonable chromatographic separation was<br />
achieved, a significant rise <strong>of</strong> the baseline was observed<br />
in the first part <strong>of</strong> the chromatogram, suggesting<br />
co-elution <strong>of</strong> some compounds. The chromatographic<br />
pr<strong>of</strong>iles <strong>of</strong> <strong>olive</strong> pomace <strong>and</strong> <strong>olive</strong> <strong>pulp</strong> at 240<br />
<strong>and</strong> 280 nm (Fig 1) differed mostly in the relative<br />
abundance <strong>of</strong> the various peak-forming compounds.<br />
This was more evident at 240 nm, related to the<br />
presence <strong>of</strong> secoiridoid derivatives, namely fractions<br />
24 J Sci Food Agric 85:21–32 (2005)
Phenolic compounds <strong>of</strong> <strong>olive</strong> pomace<br />
Table 2. Identification <strong>of</strong> HPLC-eluting fractions <strong>from</strong> MeOH 50 (<strong>pulp</strong> or pomace) extract <strong>and</strong> correspondence with results obtained by mass<br />
spectrometry analysis<br />
Fraction<br />
number<br />
Retention<br />
Predominant<br />
(min) Ident a [M − H] − by ESI-MS b<br />
time<br />
negative ion<br />
Main fragments<br />
Compound<br />
1 10.0 B 315 153, 135, 179, 161 Hydroxytyrosol-1 ′ -β-Glucoside<br />
2a 11.2 — 421 389, 241, 239, 165, 195 Unknown<br />
2b 11.2 — 407 389, 375, 357, 313, 161 Unknown<br />
3 11.7 — NI —<br />
4 12.8 — NI —<br />
5 14.5 — 763 565, 341 Unknown<br />
6 15.5 C 353 191, 179, 161 Caffeoyl-quinic acid<br />
7 15.8 — NI —<br />
8 16.2 B, C 389 345, 209 Oleoside<br />
9 17.2 — NI —<br />
10 17.8 B 595 Unknown<br />
11 20.7 — 377 197, 179, 153 Oleuropein aglycone derivative<br />
12 22.9 — 383; 257 Unknown<br />
13a 23.3 B 403 11-Methyl-oleoside<br />
13b 23.3 B 151 123, 108 4-Hydroxyphenylacetic acid<br />
14 24.7 — NI —<br />
15a 28.5 C 555 537, 403, 393 Unknown c<br />
15b 28.5 — 579 337, 547, 561, 529 Unknown<br />
16 30.6 B 609 301, 179 Rutin<br />
17 31.0 B 593 447, 285 Luteolin-7-rutinoside<br />
18a 32.6 A 447 285 Luteolin-7-glucoside<br />
18b 32.6 B 623 461, 315, 135, 161, 297 Verbascoside<br />
19 33.3 B 593 447, 285 Luteolin-7-rutinoside (isomer)<br />
20 35.3 B, C 701 539, 377, 307 Oleuropein glucoside<br />
21 43.2 B 447 285 Luteolin-4-glucoside<br />
22 44.6 C 551 507, 341, 532, 389, 281 Unknown c<br />
23 47.2 — 335 199, 181, 153 Unknown<br />
24 48.9 — 663 479, 295 Unknown<br />
25 53.9 A 539 377, 197, 153 Oleuropein<br />
26 59.7 C 535 491, 389, 265, 325 Unknown c<br />
27 75.2 A 285 Luteolin<br />
a Identification was based on the following: A, retention time <strong>and</strong> DAD spectrum consistent with those <strong>of</strong> authentic st<strong>and</strong>ard; B, MS data consistent<br />
with literature; C, MS with fragmentation.<br />
b Ordered by decreasing intensity.<br />
c Compounds to be elucidated in the present study.<br />
NI, no main [M − H] − identified.<br />
The notation a,b for a peak number in the fraction number column indicates co-eluted compounds.<br />
8 <strong>and</strong> 10 (240 nm) <strong>and</strong> fraction 25 (240 <strong>and</strong> 280 nm),<br />
which were detected as intense peaks only in <strong>olive</strong><br />
<strong>pulp</strong>.<br />
Only three <strong>of</strong> the 27 fractions matched with the<br />
nine st<strong>and</strong>ard compounds used (see Table 2), namely<br />
fractions 18, 25 <strong>and</strong> 27, attributed to luteolin-<br />
7-glucoside, oleuropein <strong>and</strong> luteolin respectively,<br />
which correspond to compounds usually found in<br />
<strong>olive</strong>s. 23,25,26 However, tyrosol, vanillic acid <strong>and</strong><br />
syringic acid, which were among the st<strong>and</strong>ards <strong>and</strong><br />
are also frequently found in <strong>phenolic</strong> <strong>extracts</strong> <strong>from</strong><br />
<strong>olive</strong>, 17,27 although not always, 4,6 were not detected.<br />
The HPLC-eluting fractions were analysed by ESI-<br />
MS to complete the identification <strong>of</strong> the <strong>phenolic</strong><br />
compounds in <strong>olive</strong> <strong>pulp</strong> <strong>and</strong> <strong>olive</strong> pomace.<br />
Analysis <strong>of</strong> HPLC fractions by ESI-MS<br />
The identification <strong>of</strong> the corresponding compounds<br />
was based on the search <strong>of</strong> the main [M − H] − ion<br />
together with the interpretation <strong>of</strong> its collision-induced<br />
dissociation (CID) fragments. Table 2 summarises the<br />
data obtained for each <strong>of</strong> the analysed fractions. In<br />
some fractions the ionic species [M − H] − was not<br />
observed (marked with ‘NI’ in Table 2), probably<br />
because the solvent <strong>and</strong>/or MS conditions were not<br />
favourable to its ionisation. Also, 11 <strong>of</strong> the 26 detected<br />
molecular ions were compounds not yet known in O<br />
europaea.<br />
The compounds previously identified by HPLC/-<br />
DAD were confirmed by ESI-MS. Luteolin (peak 27)<br />
showed an intense molecular ion at m/z 285 <strong>and</strong> for its<br />
derivative luteolin-7-glucoside (peak 18a) a molecular<br />
ion at m/z 447 <strong>and</strong> also a strong fragment at m/z<br />
285 were obtained. The identification <strong>of</strong> peak 25<br />
as oleuropein was corroborated by detection <strong>of</strong> the<br />
molecular ion at m/z 539 <strong>and</strong> its aglycone fragment<br />
at m/z 377. Fraction 11 shows ions characteristic <strong>of</strong><br />
oleuropein aglycone or one <strong>of</strong> its is<strong>of</strong>orms. 28<br />
J Sci Food Agric 85:21–32 (2005) 25
SM Cardoso et al<br />
The comparison <strong>of</strong> the ESI-MS data with<br />
literature data also allowed the identification <strong>of</strong><br />
hydroxytyrosol-1 ′ -β-glucoside (peak 1), 11-methyloleoside<br />
(peak 13a), hydroxylphenylacetic acid (peak<br />
13b), three derivatives <strong>of</strong> luteolin (peaks 17, 19 <strong>and</strong><br />
21), verbascoside (peak 18b), oleoside (fraction 8) <strong>and</strong><br />
oleuropein glucoside (fraction 20).<br />
The main compound in fraction 1 had a molecular<br />
ion at m/z 315 <strong>and</strong> fragment ions at m/z 153,<br />
135, 180 <strong>and</strong> 161, which suggested the presence<br />
<strong>of</strong> a hydroxytyrosol hexoside. To our knowledge,<br />
three isomers <strong>of</strong> hydroxytyrosol glucoside have been<br />
characterised by NMR in <strong>olive</strong> fruit <strong>and</strong> <strong>olive</strong> oil. 29<br />
These isomers have also been detected in different<br />
table <strong>olive</strong> varieties, 30 in which hydroxytyrosol-4-βglucoside<br />
was the most abundant compound. This<br />
isomer was also the only one detected by Romero et al 9<br />
in <strong>olive</strong> <strong>pulp</strong>, <strong>olive</strong> pomace <strong>and</strong> waste waters. However,<br />
the similarity between the fragmentation pr<strong>of</strong>ile <strong>of</strong> the<br />
molecular ion at m/z 315 in fraction 1 to that published<br />
by De Nino et al 21 allowed us to infer that this<br />
compound should be hydroxytyrosol-1 ′ -β-glucoside.<br />
Fractions 13a <strong>and</strong> 13b were attributed to 11-methyloleoside<br />
<strong>and</strong> 4-hydroxylphenylacetic acid respectively<br />
based on their specific <strong>and</strong> characteristic molecular<br />
ions described in the literature for Oeuropaea. 23 The<br />
high absorbance at 240 nm <strong>of</strong> fraction 10 can possibly<br />
be attributed to a secoiridoid derivative.<br />
The presence <strong>of</strong> a fragment at m/z 285 is<br />
diagnostic <strong>of</strong> luteolin derivatives. According to the<br />
molecular ion at m/z 593 <strong>and</strong> its main fragments<br />
observed for both fractions 17 <strong>and</strong> 19, luteolin-<br />
7-rutinoside could be proposed for both fractions.<br />
To our knowledge, the flavone luteolin-7-rutinoside<br />
was previously detected only in <strong>olive</strong> leaves 23 <strong>and</strong><br />
its ESI-MS data were similar to those <strong>of</strong> peaks<br />
17 <strong>and</strong> 19. Since the luteolin-7-rutinoside detected<br />
by Ryan et al 23 eluted before luteolin-7-glucoside in<br />
HPLC reverse phase conditions, the same compound<br />
was tentatively attributed to fraction 17. Thus<br />
fraction 19 may correspond to a non-described<br />
isomer <strong>of</strong> that compound, probably with a different<br />
linkage position to the sugar. The MS analysis<br />
<strong>of</strong> fraction 21 demonstrated a molecular ion at<br />
m/z 447, suggesting the presence <strong>of</strong> a luteolin<br />
hexoside. Four luteolin glucosides have already<br />
been detected in <strong>olive</strong>s: luteolin-7-glucoside <strong>and</strong><br />
its three isomers 23 luteolin-4-glucoside, luteolin-6-<br />
glucoside <strong>and</strong> luteolin-8-glucoside. According to those<br />
authors, luteolin-4-glucoside was the only one eluting<br />
after luteolin-7-glucoside in HPLC reverse phase<br />
conditions <strong>and</strong> that was the reason why fraction 21<br />
was attributed to that isomer.<br />
ESI-MS <strong>of</strong> fraction 18b indicated a molecular ion at<br />
m/z 623 <strong>and</strong> various fragments that are in accordance<br />
with the fragmentation <strong>of</strong> verbascoside. These results<br />
were also corroborated with the fragmentation pr<strong>of</strong>ile<br />
<strong>of</strong> verbascoside described by Ryan et al. 18<br />
The comparison <strong>of</strong> the MS data with literature<br />
data was also possible for the compounds detected<br />
in fraction 8 (oleoside) <strong>and</strong> fraction 20 (oleuropein<br />
glucoside). However, as they had not been detected<br />
previously in <strong>olive</strong> <strong>pulp</strong>, the interpretation <strong>of</strong> their<br />
structures will be discussed in more detail. Also, the<br />
structures <strong>of</strong> some new oleoside derivatives corresponding<br />
to fractions 15a, 22 <strong>and</strong> 26 will be elucidated.<br />
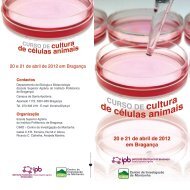
Structure determination <strong>of</strong> fraction 8<br />
The mass spectrum <strong>of</strong> fraction 8, eluted at 16.2 min,<br />
displayed an intense peak at m/z 389 which formed two<br />
major fragments by CID, one at m/z 345 <strong>and</strong> the other<br />
at m/z 209 (Fig 2). The former corresponded to the<br />
loss <strong>of</strong> 44 Da, which can be justified by the elimination<br />
<strong>of</strong> a CO 2 molecule <strong>of</strong> a carboxylic group, <strong>and</strong> the latter<br />
can be attributed to the Z fragment <strong>of</strong> a hexose (loss <strong>of</strong><br />
180 Da). This hexose residue was attributed to glucose<br />
in accordance with the literature. 16,23 The presence <strong>of</strong><br />
a hexose moiety was also supported by the detection <strong>of</strong><br />
minor ionic species at m/z 161 <strong>and</strong> 179 in the ESI-MS 2<br />
spectrum shown in Fig 2 (inset) <strong>and</strong> major ones in the<br />
ESI-MS 3 spectrum <strong>of</strong> the ion at m/z 345 (results<br />
not shown). These results are in agreement with the<br />
100<br />
389<br />
100<br />
345<br />
Intensity (%)<br />
75<br />
50<br />
25<br />
Intensity (%)<br />
75<br />
50<br />
209<br />
25<br />
389<br />
161<br />
179<br />
0<br />
150 250 350 450<br />
m/z<br />
0<br />
150 500 850 1200<br />
m/z<br />
Figure 2. ESI-MS spectrum <strong>of</strong> fraction 8 <strong>and</strong> (inset) ESI-MS 2 spectrum <strong>of</strong> molecular ion at m/z 389.<br />
26 J Sci Food Agric 85:21–32 (2005)
Phenolic compounds <strong>of</strong> <strong>olive</strong> pomace<br />
presence <strong>of</strong> oleoside, which has a molecular mass <strong>of</strong><br />
390 Da (represented by the fragment at m/z 389 in<br />
Fig 4). This compound has previously been detected<br />
in <strong>olive</strong> leaves by the use <strong>of</strong> ESI-MS in positive mode. 21<br />
However, to our knowledge, its presence in <strong>olive</strong> fruit<br />
is now demonstrated for the first time.<br />
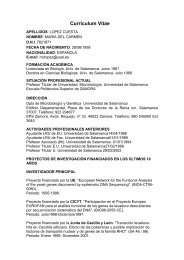
Structure determination <strong>of</strong> fraction 22<br />
A derivative <strong>of</strong> oleoside, also not yet reported to occur<br />
in Oeuropaea, was found in fraction 22. The mass<br />
spectrum <strong>of</strong> that fraction showed a strong peak at<br />
m/z 551 (Fig 3a) whose MS 2 fragmentation spectrum<br />
indicated various ionic species (Fig 3a, inset). As<br />
discussed for oleoside, the principal fragment was<br />
originated by the loss <strong>of</strong> 44 Da, giving rise to the<br />
intense signal at m/z 507. The ionic species at m/z 389,<br />
representing the oleoside structure, was also observed<br />
in the ESI-MS spectrum <strong>of</strong> the molecular ion. Its<br />
formation was accomplished by the loss <strong>of</strong> a hexose<br />
moiety (162 Da), suggesting that the compound was<br />
a hexoside derivative <strong>of</strong> oleoside. Moreover, the<br />
presence <strong>of</strong> a fragment at m/z 341, which corresponds<br />
to a disaccharide, indicated that this hexose molecule<br />
should be linked to the sugar moiety <strong>of</strong> oleoside<br />
(tentative structure <strong>of</strong> the molecular ion in Fig 4).<br />
The presence <strong>of</strong> the fragment at m/z 251 is<br />
31 – 33<br />
characteristic <strong>of</strong> a (1→6) disaccharide, <strong>and</strong> a<br />
low-intensity signal at m/z 221 can be diagnostic <strong>of</strong> a β<br />
isomer. 33 According to Fig 3b, it is probable that the<br />
oleoside derivative detected in fraction 22 was a 6 ′ -βhexopyranosyl-oleoside,<br />
possibly 6 ′ -β-glucopyranosyloleoside,<br />
with a scheme <strong>of</strong> fragmentation in negative<br />
mode as represented in Fig 4.<br />
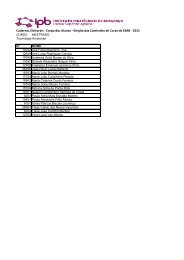
Structure determination <strong>of</strong> fraction 26<br />
Fraction 26 <strong>of</strong> the chromatogram was a distinct <strong>and</strong><br />
relatively intense peak. Its mass spectrum showed<br />
a high-intensity ion at m/z 535 that has not been<br />
detected so far in Oeuropaea(Fig 5). The ESI-MS 2<br />
spectrum <strong>of</strong> that ion (Fig 5, inset) demonstrated<br />
some similarities to the spectral pr<strong>of</strong>ile <strong>of</strong> the two<br />
compounds already described (Figs 2 <strong>and</strong> 3a, insets).<br />
Namely, the main signal was obtained by the loss<br />
<strong>of</strong> 44 Da (ion at m/z 491), <strong>and</strong> an ionic species<br />
corresponding to the oleoside ion (m/z 389) was<br />
also detected. In this case the oleoside fragment<br />
was originated by the elimination <strong>of</strong> 146 Da, which<br />
can be justified by the Y fragmentation <strong>of</strong> a<br />
deoxyhexose molecule (fragment Y in the tentative<br />
structure represented in Fig 5). In agreement with<br />
this hypothesis, in Fig 5 (inset) the signal observed<br />
Intensity (%)<br />
100<br />
75<br />
50<br />
25<br />
551<br />
Intensity (%)<br />
100<br />
75<br />
50<br />
25<br />
507<br />
341<br />
533<br />
389<br />
551<br />
251 281<br />
0<br />
150 300 450 600<br />
m/z<br />
a<br />
0<br />
300 600 900 1200<br />
m/z<br />
100<br />
75<br />
161<br />
345<br />
341<br />
Intensity (%)<br />
b<br />
50<br />
281<br />
251<br />
323<br />
393<br />
25<br />
221<br />
489507<br />
179<br />
463<br />
0<br />
150 250 350 450 550<br />
m/z<br />
Figure 3. Mass spectra <strong>of</strong> fraction 22: (a) ESI-MS spectrum <strong>and</strong> (inset) [551] ESI-MS 2 molecular ion spectrum; (b) [551→507] ESI-MS 3 spectrum.<br />
J Sci Food Agric 85:21–32 (2005) 27
SM Cardoso et al<br />
HO<br />
HO<br />
m/z 341<br />
OH<br />
O<br />
OH<br />
HO<br />
HO<br />
O<br />
HO<br />
HO<br />
Z<br />
O<br />
Z<br />
OH<br />
HO<br />
HO<br />
OH<br />
O<br />
OH<br />
HO<br />
HO<br />
Y<br />
O<br />
O<br />
OH<br />
O<br />
O<br />
(-H) -<br />
m/z 551 O<br />
Y<br />
(-H) - OH<br />
OH<br />
O<br />
(-H) -<br />
HO<br />
O<br />
OH<br />
- CO 2 HO<br />
OH<br />
O<br />
O OH<br />
OH<br />
m/z 389<br />
O<br />
O<br />
O<br />
OH<br />
O<br />
(-H) -<br />
HO<br />
O<br />
HO<br />
OH<br />
O OH<br />
m/z 507<br />
Z<br />
O<br />
OH<br />
O<br />
OH<br />
Y<br />
HO<br />
HO<br />
OH<br />
O<br />
O<br />
OH<br />
O<br />
m/z 345<br />
OH<br />
O<br />
(-H) -<br />
Figure 4. Proposed scheme for fragmentation <strong>of</strong> molecular ion at m/z 551 <strong>of</strong> fraction 22.<br />
100<br />
491<br />
75<br />
Intensity (%)<br />
100<br />
75<br />
50<br />
25<br />
535<br />
HO<br />
HO<br />
Intensity (%)<br />
OH<br />
O<br />
HO<br />
HO<br />
50<br />
25<br />
389<br />
265 325<br />
235 345<br />
535<br />
0<br />
150 300 450 600<br />
m/z<br />
(m/z = 389)<br />
Y<br />
O<br />
O<br />
HO<br />
(m/z = 325)<br />
Z<br />
O<br />
O<br />
O<br />
OH<br />
O<br />
(m/z = 491)<br />
OH<br />
0<br />
300 600 900 1200<br />
m/z<br />
Figure 5. ESI-MS spectrum <strong>of</strong> fraction 26 <strong>and</strong> (inset) ESI-MS 2 spectrum <strong>of</strong> molecular ion at m/z 491. The tentative structure <strong>of</strong> the compound is<br />
also shown.<br />
at m/z 325 (fragment Z) can correspond to a<br />
deoxyhexose—hexose disaccharide residue, which<br />
should correspond to a rhamnose-glucose residue,<br />
one <strong>of</strong> the most common disaccharides found in<br />
<strong>phenolic</strong> compounds. 34 The 535 MS 2 spectrum also<br />
showed the fragments <strong>of</strong> the disaccharide moiety that<br />
correspond to a pattern similar to that for glucose-<br />
(1→6)-glucose disaccharide residue, suggesting the<br />
presence <strong>of</strong> a rhamnose-(1→6)-glucose. In this<br />
manner, it can be concluded that this new compound<br />
is a 6 ′ -deoxyhexopyranosyl-oleoside, possibly 6 ′ -βrhamnopyranosyl-oleoside.<br />
Structure determination <strong>of</strong> fraction 20<br />
The ESI-MS analysis <strong>of</strong> fraction 20 showed an<br />
[M − H] − ion at m/z 701 (results not shown). Its MS 2<br />
28 J Sci Food Agric 85:21–32 (2005)
Phenolic compounds <strong>of</strong> <strong>olive</strong> pomace<br />
a<br />
100<br />
539<br />
75<br />
Intensity (%)<br />
50<br />
377<br />
701<br />
25<br />
307 162 Da 162 Da<br />
0<br />
300 400 500 600 700 800<br />
m/z<br />
b<br />
HO<br />
HO<br />
OH<br />
O<br />
OH<br />
Y<br />
O<br />
O<br />
O<br />
O<br />
O<br />
O<br />
Isomer I<br />
Y<br />
HO<br />
O<br />
OH<br />
O<br />
OH<br />
OH<br />
OH<br />
HO<br />
HO<br />
OH<br />
O<br />
OH<br />
Y 1<br />
O<br />
HO<br />
OH Y 2<br />
O<br />
O<br />
OH<br />
O<br />
Isomer II<br />
O<br />
O<br />
O<br />
O<br />
OH<br />
OH<br />
Figure 6. (a) ESI-MS 2 spectrum <strong>of</strong> molecular ion at m/z 701. (b) Structure <strong>of</strong> two diglucoside homologues <strong>of</strong> oleuropein.<br />
fragmentation pr<strong>of</strong>ile showed a main ionic species at<br />
m/z 539 that was formed by the loss <strong>of</strong> 162 Da, <strong>and</strong><br />
another intense peak at m/z 377 indicative <strong>of</strong> the<br />
elimination <strong>of</strong> another hexose unit (Fig 6a). These<br />
two main fragments correspond to oleuropein <strong>and</strong> its<br />
aglycone respectively <strong>and</strong> together they support the<br />
hypothesis <strong>of</strong> a hexose derivative <strong>of</strong> the oleuropein<br />
structure. To our knowledge, hexose derivatives <strong>of</strong><br />
oleuropein have never been described in <strong>olive</strong> fruit.<br />
However, angustifolioside A (isomer I represented in<br />
Fig 6b) was already described to occur in the family<br />
Oleaceae. 35 Also, De Nino et al 16 have proposed<br />
the presence <strong>of</strong> the same isomer in <strong>olive</strong> leaves,<br />
although their results did not allow the exact structural<br />
determination, <strong>and</strong> the exclusion <strong>of</strong> isomer II. In the<br />
present study the loss <strong>of</strong> 162 Da <strong>of</strong> the molecular<br />
ion at m/z 701 can fit for both isomer structures:<br />
the consecutive or simultaneous elimination <strong>of</strong> a Y-<br />
type hexose fragment would be possible for the two<br />
compounds, explaining the fragments at m/z 539 <strong>and</strong><br />
377. However, <strong>from</strong> the oleoside derivatives discussed<br />
in Figs 3 <strong>and</strong> 5, it can be expected that, if isomer II was<br />
present, the O-dihexosyl ion (at m/z 341) together with<br />
its fragments would have appeared in the ESI-MS 2<br />
spectrum <strong>of</strong> the molecular ion. Yet, the total absence<br />
<strong>of</strong> those species was confirmed, indicating that the<br />
isomer present in fraction 20 is angustifolioside A<br />
(isomer I in Fig 6b). These results together with those<br />
<strong>of</strong> De Nino et al 16 suggest that Oeuropaeahas the<br />
same glucoside derivative <strong>of</strong> oleuropein that is present<br />
in Fraxinus angustifolia. 35<br />
Structure determination <strong>of</strong> fraction 15a<br />
The MS analysis <strong>of</strong> fraction 15a showed a predominant<br />
[M − H] − signal at m/z 555. As for the oleoside<br />
derivatives, it was not possible to find any MS data in<br />
the literature about this compound. Alternatively, its<br />
structure elucidation was only based on its ESI-MS n<br />
analysis. Fig 7 shows the ESI-MS 2 spectrum <strong>of</strong> the<br />
ion at m/z 555. The main fragment ion represented in<br />
the spectrum was obtained by the loss <strong>of</strong> 18 Da (ion<br />
at m/z 537), suggesting that the compound has an OH<br />
group that is easily removed. Also, another two intense<br />
peaks at m/z 393 <strong>and</strong> 403 could be observed. The first<br />
corresponded to the aglycone (loss <strong>of</strong> 162 Da) <strong>and</strong><br />
the latter was equivalent to the mass <strong>of</strong> an 11-methyloleoside<br />
moiety. The aglycone at m/z 393 was already<br />
detected as 10-hydroxy-oleuropein aglycone in <strong>olive</strong><br />
oil using mass spectrometry, 36 which indicates that<br />
this compound should be 10-hydroxy-oleuropein. In<br />
this manner the fragments at m/z 537 <strong>and</strong> 393 arose<br />
<strong>from</strong> the loss <strong>of</strong> water <strong>from</strong> the 10-OH group <strong>and</strong><br />
<strong>from</strong> the Y-type cleavage <strong>of</strong> the molecule respectively.<br />
The fragment ion at m/z 403 could be originated by<br />
a cleavage X together with the loss <strong>of</strong> water. To our<br />
knowledge, 10-hydroxy-oleuropein has not previously<br />
been detected in any tissue <strong>of</strong> Oeuropaea.<br />
J Sci Food Agric 85:21–32 (2005) 29
SM Cardoso et al<br />
Intensity (%)<br />
100<br />
75<br />
50<br />
HO<br />
HO<br />
(m/z = 393)<br />
OH Y<br />
O<br />
O<br />
OH<br />
O<br />
OH<br />
X<br />
O<br />
O<br />
O<br />
O<br />
403<br />
393<br />
OH<br />
OH<br />
537<br />
555<br />
25<br />
179<br />
161<br />
291 375<br />
0<br />
150 300 450 600<br />
m/z<br />
512<br />
523<br />
Figure 7. ESI-MS 2 spectrum <strong>of</strong> molecular ion at m/z 555. The structure <strong>of</strong> the molecular compound is also represented.<br />
Table 3. Quantification <strong>of</strong> main identified compounds (mg g −1 ) in MeOH 50 <strong>extracts</strong> <strong>of</strong> <strong>olive</strong> <strong>pulp</strong> <strong>and</strong> <strong>olive</strong> pomace<br />
Fraction<br />
number Compound Olive <strong>pulp</strong> Olive pomace<br />
1 Hydroxytyrosol-1 ′ -β-glucoside 6.4 (0.4) 6.5 (0.3)<br />
6 Caffeoyl-quinic acid 0.10 (0.01) 0.09 (0.01)<br />
8 Oleoside 31.6 (7.9) 3.6 (0.1)<br />
16 Rutin 0.73 (0.03) 0.66 (0.03)<br />
17 Luteolin-7-rutinoside 0.10 (0.01) 0.32 (0.01)<br />
18 a Luteolin-7-glucoside + verbascoside 2.0 (0.1) 2.1 (0.0)<br />
19 Luteolin-7-rutinoside (isomer) 0.41 (0.03) 0.44 (0.01)<br />
21 Luteolin-4-glucoside 0.37 (0.03) 0.47 (0.01)<br />
22 6 ′ -β-Glucopyranosyl-oleoside 6.6 (0.2) 5.0 (0.0)<br />
25 Oleuropein 2.7 (0.14) V<br />
26 6 ′ -β-Rhamnopyranosyl-oleoside 3.8 (0.2) 6.5 (0.1)<br />
Total 54.8 25.7<br />
Phenolic compounds were determined as the mean value <strong>of</strong> two independent assays measured in duplicate. Values in parentheses represent the<br />
st<strong>and</strong>ard deviation. Values are expressed as mg <strong>phenolic</strong> g −1 dried, defatted <strong>and</strong> dehulled starting material. V, vestigial quantity.<br />
a Quantified as luteolin-7-glucoside.<br />
By the same reasoning (loss <strong>of</strong> respectively 32, ie<br />
a methoxyl, <strong>and</strong> 18, ie a hydroxyl, to give the ion at<br />
389), fractions 2a <strong>and</strong> 2b were respectively hydroxy<br />
<strong>and</strong> methoxy derivatives <strong>of</strong> oleoside, which were not<br />
investigated further.<br />
Quantification <strong>of</strong> main identified compounds<br />
separated by HPLC<br />
The amounts <strong>of</strong> the major identified compounds<br />
are shown in Table 3. Demethyloleuropein, tyrosol,<br />
hydroxytyrosol <strong>and</strong> vanillic acid, which are frequently<br />
detected in <strong>olive</strong> <strong>pulp</strong>, were not found in this sample.<br />
As the pr<strong>of</strong>ile <strong>of</strong> <strong>olive</strong> <strong>pulp</strong> <strong>phenolic</strong>s <strong>and</strong> derivatives<br />
can be influenced by various factors such as <strong>olive</strong><br />
cultivar, climatic conditions, degree <strong>of</strong> maturation <strong>and</strong><br />
agronomic practices, 9 the absence <strong>of</strong> these compounds<br />
can be accepted as possible. According to Table 1, the<br />
compounds identified in Table 3 represent 49% <strong>of</strong> the<br />
total <strong>phenolic</strong>s present in the MeOH 50 extract <strong>of</strong> <strong>olive</strong><br />
<strong>pulp</strong>, but only 24% <strong>of</strong> those present in the MeOH 50<br />
extract <strong>of</strong> <strong>olive</strong> pomace. These results can be related<br />
to the possible modification <strong>of</strong> <strong>olive</strong> <strong>phenolic</strong>s during<br />
<strong>olive</strong> oil extraction. The amounts <strong>of</strong> hydroxytyrosol-<br />
1 ′ -β-glucoside, caffeoyl-quinic acid <strong>and</strong> flavones, with<br />
the exception <strong>of</strong> rutin, were not greatly affected by the<br />
<strong>olive</strong> oil extraction process (Table 3). The secoiridoids<br />
were more affected by the extraction process: oleuropein<br />
was one <strong>of</strong> the main compounds in <strong>olive</strong> <strong>pulp</strong><br />
(2.7mgg −1 sample) but only a vestigial compound<br />
in <strong>olive</strong> pomace. This result suggests that oleuropein<br />
could be extracted to the oil phase, which is supported<br />
by its detection in the oil, 37 although this<br />
compound is mostly soluble in water. Alternatively,<br />
oleuropein could be degraded during the crushing<br />
<strong>and</strong> malaxation <strong>of</strong> the <strong>olive</strong>s, as its glycosydic linkage<br />
is easily hydrolysed by β-glucosidases, producing<br />
oleuropein aglycone which is more hydrophobic <strong>and</strong><br />
consequently more soluble in the oil. This is corroborated<br />
by the frequent detection <strong>of</strong> oleuropein aglycone<br />
<strong>and</strong> its isomer 3,4-(dihydroxyphenyl)ethanol elenoic<br />
acid ester (3,4-DHPEA-EA) in <strong>olive</strong> oil. 9–11,26,38,39<br />
Moreover, it is well known that oleuropein aglycone<br />
can be modified due to the keto–enol tautomeric equilibrium<br />
that involves the ring opening <strong>of</strong> secoiridoids,<br />
30 J Sci Food Agric 85:21–32 (2005)
Phenolic compounds <strong>of</strong> <strong>olive</strong> pomace<br />
usually originating secoiridoid derivatives, such as the<br />
dialdehydic form <strong>of</strong> elenoic acid linked to hydroxytyrosol<br />
(3,4-DHPEA-EDA) or to tyrosol (p-DHPEA-<br />
EDA). 9–11,26,38,39 In this way the lower quantity <strong>of</strong><br />
oleuropein in <strong>olive</strong> pomace, when compared with <strong>olive</strong><br />
<strong>pulp</strong>, is probably correlated with the formation <strong>of</strong> these<br />
compounds, which are major <strong>phenolic</strong>s in <strong>olive</strong> oil.<br />
Oleoside <strong>and</strong> its derivatives were very significant<br />
compounds in the <strong>phenolic</strong> extract <strong>of</strong> both samples.<br />
In <strong>olive</strong> <strong>pulp</strong>, oleoside was evaluated at 31.6mgg −1<br />
sample. However, its concentration was drastically<br />
diminished to 3.6mgg −1 in the <strong>olive</strong> pomace,<br />
indicating a loss <strong>of</strong> approximately 89% during oil<br />
extraction. As for oleuropein, this can probably be<br />
explained by its degradation during the malaxation<br />
<strong>of</strong> the pastes, with a concomitant loss to the oil or<br />
accumulation <strong>of</strong> newly formed oleoside derivatives<br />
in the <strong>olive</strong> pomace, which were not quantified or<br />
detected at 280 nm. The accumulation <strong>of</strong> oleoside<br />
derivatives in the <strong>olive</strong> pomace is in accordance<br />
with the different pr<strong>of</strong>iles demonstrated for the<br />
two samples at 240 nm (Fig 1). Compounds such<br />
as 6 ′ -β-rhamnopyranosyl-oleoside <strong>and</strong> the majority<br />
<strong>of</strong> luteolin derivatives, namely luteolin-7-rutinoside,<br />
showed higher concentrations in <strong>olive</strong> pomace than<br />
in <strong>olive</strong> <strong>pulp</strong>. As the contribution <strong>of</strong> the reserve<br />
endosperm was not taken into account in the<br />
calculations <strong>of</strong> <strong>olive</strong> pomace <strong>phenolic</strong>s, the higher<br />
amounts <strong>of</strong> these compounds suggest their presence<br />
in this tissue.<br />
CONCLUSION<br />
The analysis <strong>of</strong> the methanol extract by ESI-MS n<br />
allowed the detection <strong>of</strong> the common <strong>phenolic</strong><br />
compounds but also detected unusual ones. Moreover,<br />
these techniques were very useful in the structure<br />
elucidation <strong>of</strong> new compounds, which were mainly<br />
hexoside derivatives <strong>of</strong> oleoside <strong>and</strong> oleuropein.<br />
The described data surely contribute to a better<br />
underst<strong>and</strong>ing <strong>of</strong> <strong>phenolic</strong> <strong>extracts</strong> <strong>from</strong> <strong>olive</strong> <strong>and</strong> its<br />
residue obtained after <strong>olive</strong> oil extraction. Also, most<br />
<strong>of</strong> the <strong>phenolic</strong> compounds, including hydroxytyrosol<br />
glucoside, which can have biological activities, are not<br />
degraded during <strong>olive</strong> oil extraction, suggesting that<br />
the <strong>olive</strong> pomace <strong>from</strong> the two-phase system can be a<br />
good source <strong>of</strong> those compounds, as is <strong>olive</strong> <strong>pulp</strong>.<br />
ACKNOWLEDGEMENTS<br />
The authors acknowledge FCT (Portugal) <strong>and</strong> the<br />
University <strong>of</strong> Aveiro for funding Research Unit<br />
62/94 ‘Química Orgânica, Produtos Naturais e Agro-<br />
Alimentares’, <strong>and</strong> Fundação Calouste Gulbenkian.<br />
Susana Cardoso was supported by a PhD grant<br />
(PRODEP III 5.3/N/199.006/00).<br />
REFERENCES<br />
1 Saviozzi A, Riffaldi R, Levi-Minzi R, Scagnozzi A <strong>and</strong> Vanni G,<br />
Decomposition <strong>of</strong> vegetation-water sludge in soil. Bioresource<br />
Technol 44:223–228 (1993).<br />
2 Civantos L, Comparación entre sistemas de extracción, in<br />
Obtención del Aceite de Oliva Virgen, Ed by Civantos L.<br />
Editorial Agrícola Española, Madrid, pp 189–201 (1999).<br />
3 Di Giovacchino L, Resultados obtenidos de la extracción del<br />
aceite de las aceitunas com un nuevo decantador de dos fases.<br />
Olivae 50:42–44 (1994).<br />
4 Amiot M-J, Fleuriet A <strong>and</strong> Macheix J-J, Importance <strong>and</strong><br />
evolution <strong>of</strong> <strong>phenolic</strong> compounds in <strong>olive</strong> during growth <strong>and</strong><br />
maturation. J Agric Food Chem 34:823–826 (1986).<br />
5 Servili M, Baldioli M, Selvaggini R, Miniati E, Macchioni A<br />
<strong>and</strong> Montedoro G, Phenolic compounds <strong>of</strong> <strong>olive</strong> fruit:<br />
one- <strong>and</strong> two-dimensional nuclear magnetic resonance<br />
characterization <strong>of</strong> nuzhenide <strong>and</strong> its distribution in the<br />
constitutive parts <strong>of</strong> fruit. J Agric Food Chem 47:12–18 (1999).<br />
6 Esti M, Cinquanta L <strong>and</strong> La Notte E, Phenolic compounds in<br />
different <strong>olive</strong> varieties. J Agric Food Chem 46:32–35 (1998).<br />
7 Romani A, Mulinacci N, Pinelli P, Vincieri FF <strong>and</strong> Cimato A,<br />
Poly<strong>phenolic</strong> content in five Tuscany cultivars <strong>of</strong> Olea europaea<br />
L. J Agric Food Chem 47:946–967 (1999).<br />
8 Mulinacci N, Romani A, Galardi C, Pinelli P, Giaccherini C<br />
<strong>and</strong> Vincieri FF, Poly<strong>phenolic</strong> content in <strong>olive</strong> oil waste waters<br />
<strong>and</strong> related <strong>olive</strong> samples. J Agric Food Chem 49:3509–3514<br />
(2001).<br />
9 Romero C, Brenes M, Garcia P <strong>and</strong> Garrido A, Hydroxytyrosol<br />
4-β-D-glucoside, an important <strong>phenolic</strong> compound in <strong>olive</strong><br />
fruits <strong>and</strong> derived products. J Agric Food Chem 50:3835–3839<br />
(2002).<br />
10 Vierhuis E, Servili M, Baldioli M, Schols HA, Voragen AGJ<br />
<strong>and</strong> Montedoro GF, Effect <strong>of</strong> enzyme treatment during<br />
mechanical extraction <strong>of</strong> <strong>olive</strong> oil on <strong>phenolic</strong> compounds <strong>and</strong><br />
polysaccharides. J Agric Food Chem 49:1218–1223 (2001).<br />
11 Visioli F <strong>and</strong> Galli C, Olive oil phenols <strong>and</strong> their potential effects<br />
on human health. J Agric Food Chem 46:4292–4296 (1998).<br />
12 Visioli F <strong>and</strong> Galli C, The effect <strong>of</strong> minor constituents <strong>of</strong> <strong>olive</strong> oil<br />
on cardiovascular disease: new findings. Nutr Rev 56:142–147<br />
(1998).<br />
13 Arouma OI, Deiana M, Jenner A, Halliwell B, Kaur H, Banni S,<br />
Corongiu F, Dessí MA <strong>and</strong> Aeschbach R, Effect <strong>of</strong> hydroxytyrosol<br />
found in extra virgin <strong>olive</strong> oil on oxidative DNA<br />
damage <strong>and</strong> on low-density lipoprotein oxidation. J Agric<br />
Food Chem 46:5181–5187 (1998).<br />
14 Le Tutor B <strong>and</strong> Guedon D, Antioxidative activities <strong>of</strong> Olea<br />
europaea L. leaves <strong>and</strong> related <strong>phenolic</strong> compounds. Phytochemistry<br />
31:1173–1178 (1992).<br />
15 Bisignano G, Tomaino A, Cascio RL, Crisafi G, Uccella N <strong>and</strong><br />
Saija A, On the in-vitro antimicrobial activity <strong>of</strong> oleuropein<br />
<strong>and</strong> hydroxytyrosol. J Pharmaceut Pharmacol 51:971–974<br />
(1999).<br />
16 De Nino A, Lombardo N, Perri E, Procopio A, Raffaelli A <strong>and</strong><br />
Sindona G, Direct identification <strong>of</strong> <strong>phenolic</strong> glucosides <strong>from</strong><br />
<strong>olive</strong> leaf <strong>extracts</strong> by atmospheric pressure ionization t<strong>and</strong>em<br />
mass spectrometry. J Mass Spectrom 32:533–541 (1997).<br />
17 Ryan D, Robards K <strong>and</strong> Lavee S, Changes in <strong>phenolic</strong> content<br />
<strong>of</strong> <strong>olive</strong> during maturation. Int J Food Sci Technol 34:265–274<br />
(1999).<br />
18 Ryan D, Robards K, Prenzler P, Jardine D, Herlt T <strong>and</strong><br />
Antolovich M, Liquid chromatography with electrospray ionisation<br />
mass spectrometric detection <strong>of</strong> <strong>phenolic</strong> compounds<br />
<strong>from</strong> Olea europaea. J Chromatogr A 855:529–537 (1999).<br />
19 Ryan D, Robards K <strong>and</strong> Lavee S, Determination <strong>of</strong> <strong>phenolic</strong><br />
compounds in <strong>olive</strong>s by reversed-phase chromatography <strong>and</strong><br />
mass spectrometry. J Chromatogr A 832:87–96 (1999).<br />
20 De Nino A, Mazzotti F, Perri E, Procopio A, Raffaelli A <strong>and</strong><br />
Sindona G, Virtual freezing <strong>of</strong> the hemiacetal–aldehyde<br />
equilibrium <strong>of</strong> the aglycones <strong>of</strong> oleuropein <strong>and</strong> ligstroside<br />
present in <strong>olive</strong> oils <strong>from</strong> Carolea <strong>and</strong> Coratina cultivars<br />
by ionspray ionization t<strong>and</strong>em mass spectrometry. JMass<br />
Spectrom 35:461–467 (2000).<br />
21 De Nino A, Mazzotti F, Morrone SP, Perri E, Raffaelli A <strong>and</strong><br />
Sindona G, Characterization <strong>of</strong> Cassanese <strong>olive</strong> cultivar<br />
through the identification <strong>of</strong> new trace components by<br />
ionspray t<strong>and</strong>em mass spectrometry. J Mass Spectrom<br />
34:10–16 (1999).<br />
J Sci Food Agric 85:21–32 (2005) 31
SM Cardoso et al<br />
22 Guyot S, Marnet N, Larada D, Sannoner P <strong>and</strong> Drilleau J-F,<br />
Reversed-phase HPLC following thiolysis for quantitative<br />
estimation <strong>and</strong> characterization <strong>of</strong> the four main classes <strong>of</strong><br />
compounds in different tissues zones <strong>of</strong> a French cider apple<br />
variety (Malus domestica Var. Kermerrien). J Agric Food Chem<br />
46:1698–1705 (1998).<br />
23 Ryan D, Antolovich M, Herlt T, Prenzler PD, Lavee S <strong>and</strong><br />
Robards K, Identification <strong>of</strong> <strong>phenolic</strong> compounds in tissues<br />
<strong>of</strong> the novel <strong>olive</strong> cultivar Hardy’s Mammoth. J Agric Food<br />
Chem 50:6716–6724 (2002).<br />
24 Singleton V <strong>and</strong> Rossi JA, Colorimetry <strong>of</strong> total <strong>phenolic</strong>s with<br />
phosphomolybdic–phosphotungstic acid reagents. Am J Enol<br />
Vitic 16:144–158 (1965).<br />
25 Limiori R, Consonni R, Ranalli A, Bianchi G <strong>and</strong> Zetta L, 1 H<br />
NMR study <strong>of</strong> <strong>phenolic</strong>s in the vegetation water <strong>of</strong> three<br />
cultivars <strong>of</strong> Olea europaea: similarities <strong>and</strong> differences. JAgric<br />
Food Chem 44:2040–2048 (1996).<br />
26 Servili M, Baldioli M, Selvaggini R, Miniati E, Macchioni A<br />
<strong>and</strong> Montedoro G, High-performance liquid chromatography<br />
evaluation <strong>of</strong> phenols in <strong>olive</strong> fruit, virgin <strong>olive</strong> oil, vegetation<br />
waters, <strong>and</strong> pomace <strong>and</strong> 1 D- <strong>and</strong> 2 D-nuclear magnetic<br />
resonance characterization. J Am Oil Chem Soc 76:873–882<br />
(1999).<br />
27 Marsilio V, Campestre C <strong>and</strong> Lanza B, Phenolic compounds<br />
change during California-style ripe <strong>olive</strong> processing. Food<br />
Chem 74:55–60 (2001).<br />
28 Gariboldi P, Jommi G <strong>and</strong> Verotta L, Secoiridoids <strong>from</strong> Olea<br />
europaea. Phytochemistry 25:865–869 (1986).<br />
29 Bianco A, Mazzei RA, Melchioni C, Romeo G, Scarpati ML,<br />
Soriero A <strong>and</strong> Uccella N, Microcomponents <strong>of</strong> <strong>olive</strong> oil—III.<br />
Glucosides <strong>of</strong> 2(3,4-dihydroxyphenyl)ethanol. Food Chem<br />
63:461–464 (1998).<br />
30 Bianco A <strong>and</strong> Uccella N, Bio<strong>phenolic</strong> components <strong>of</strong> <strong>olive</strong>s.<br />
Food Res Int 33:475–485 (2000).<br />
31 Garozzo D, Giuffrida M <strong>and</strong> Impallomeni G, Determination <strong>of</strong><br />
linkage position <strong>and</strong> identification <strong>of</strong> the reducing end in linear<br />
oligosaccharides by negative ion fast atom bombardment mass<br />
spectrometry. Anal Chem 62:279–286 (1990).<br />
32 Mulroney B, Peel JB <strong>and</strong> Traeger JC, Theoretical study <strong>of</strong><br />
deprotonated glucopyranosyl disaccharide fragmentation.<br />
J Mass Spectrom 34:856–871 (1999).<br />
33 Mulroney B <strong>and</strong> Traeger JC, Determination <strong>of</strong> both linkage<br />
position <strong>and</strong> anomeric configuration in underivatized glucopyranosyl<br />
disaccharides by electrospray mass spectrometry.<br />
J Mass Spectrom 30:1277–1283 (1995).<br />
34 Ribéreau-Gayon P, Les Composés Phénoliques des Végétaux.<br />
Dunod, Paris (1968).<br />
35 Çalis I, Hosny M, Khalifa T <strong>and</strong> Nishibe S, Secoiridoids <strong>from</strong><br />
Fraxinus angustifolia. Phytochemistry 33:1453–1456 (1993).<br />
36 Caruso D, Colombo R, Patelli R, Giavarini F <strong>and</strong> Galli F,<br />
Rapid evaluation <strong>of</strong> <strong>phenolic</strong> component pr<strong>of</strong>ile <strong>and</strong> analysis<br />
<strong>of</strong> oleuropein aglycon in <strong>olive</strong> oil by atmospheric pressure<br />
chemical ionization mass spectrometry (APCI-MS). JAgric<br />
Food Chem 48:1182–1185 (2000).<br />
37 Montedoro G, Servili M, Baldioli M <strong>and</strong> Miniati E, Simple <strong>and</strong><br />
hydrolyzable <strong>phenolic</strong> compounds in virgin <strong>olive</strong> oil. 1. Their<br />
extraction, separation, <strong>and</strong> quantitative <strong>and</strong> semiquantitative<br />
evaluation by HPLC. J Agric Food Chem 40:1571–1576<br />
(1992).<br />
38 Pirisi FM, Cabras P, Cao CF, Migliorini M <strong>and</strong> Muggelli M,<br />
Phenolic compounds in virgin <strong>olive</strong> oil. 2. Reappraisal <strong>of</strong> the<br />
extraction, HPLC separation, <strong>and</strong> quantification procedures.<br />
J Agric Food Chem 48:1191–1196 (2000).<br />
39 Angerosa F, D’Aless<strong>and</strong>ro N, Corana F <strong>and</strong> Mellerio G, Characterization<br />
<strong>of</strong> <strong>phenolic</strong> <strong>and</strong> secoiridoid aglycons present in<br />
virgin <strong>olive</strong> oil by gas chromatography–chemical ionization<br />
mass spectrometry. J Chromatogr A 736:195–203 (1996).<br />
32 J Sci Food Agric 85:21–32 (2005)