A Detailed Analysis of Contemporary ARM and x86 Architectures
A Detailed Analysis of Contemporary ARM and x86 Architectures
A Detailed Analysis of Contemporary ARM and x86 Architectures

Create successful ePaper yourself
Turn your PDF publications into a flip-book with our unique Google optimized e-Paper software.
A <strong>Detailed</strong> <strong>Analysis</strong> <strong>of</strong> <strong>Contemporary</strong> <strong>ARM</strong> <strong>and</strong> <strong>x86</strong> <strong>Architectures</strong><br />
Emily Blem, Jaikrishnan Menon, <strong>and</strong> Karthikeyan Sankaralingam<br />
University <strong>of</strong> Wisconsin - Madison<br />
{blem,menon,karu}@cs.wisc.edu<br />
Abstract<br />
RISC vs. CISC wars raged in the 1980s when chip area <strong>and</strong><br />
processor design complexity were the primary constraints <strong>and</strong><br />
desktops <strong>and</strong> servers exclusively dominated the computing l<strong>and</strong>scape.<br />
Today, energy <strong>and</strong> power are the primary design constraints<br />
<strong>and</strong> the computing l<strong>and</strong>scape is significantly different:<br />
growth in tablets <strong>and</strong> smartphones running <strong>ARM</strong> (a RISC ISA)<br />
is surpassing that <strong>of</strong> desktops <strong>and</strong> laptops running <strong>x86</strong> (a CISC<br />
ISA). Further, the traditionally low-power <strong>ARM</strong> ISA is entering<br />
the high-performance server market, while the traditionally<br />
high-performance <strong>x86</strong> ISA is entering the mobile low-power device<br />
market. Thus, the question <strong>of</strong> whether ISA plays an intrinsic<br />
role in performance or energy efficiency is becoming important,<br />
<strong>and</strong> we seek to answer this question through a detailed measurement<br />
based study on real hardware running real applications.<br />
We analyze measurements on the <strong>ARM</strong> Cortex-A8 <strong>and</strong><br />
Cortex-A9 <strong>and</strong> Intel Atom <strong>and</strong> S<strong>and</strong>ybridge i7 microprocessors<br />
over workloads spanning mobile, desktop, <strong>and</strong> server computing.<br />
Our methodical investigation demonstrates the role <strong>of</strong> ISA<br />
in modern microprocessors’ performance <strong>and</strong> energy efficiency.<br />
We find that <strong>ARM</strong> <strong>and</strong> <strong>x86</strong> processors are simply engineering<br />
design points optimized for different levels <strong>of</strong> performance, <strong>and</strong><br />
there is nothing fundamentally more energy efficient in one ISA<br />
class or the other. The ISA being RISC or CISC seems irrelevant.<br />
1. Introduction<br />
The question <strong>of</strong> ISA design <strong>and</strong> specifically RISC vs. CISC<br />
ISA was an important concern in the 1980s <strong>and</strong> 1990s when<br />
chip area <strong>and</strong> processor design complexity were the primary<br />
constraints [24, 12, 17, 7]. It is questionable if the debate was<br />
settled in terms <strong>of</strong> technical issues. Regardless, both flourished<br />
commercially through the 1980s <strong>and</strong> 1990s. In the past decade,<br />
the <strong>ARM</strong> ISA (a RISC ISA) has dominated mobile <strong>and</strong> lowpower<br />
embedded computing domains <strong>and</strong> the <strong>x86</strong> ISA (a CISC<br />
ISA) has dominated desktops <strong>and</strong> servers.<br />
Recent trends raise the question <strong>of</strong> the role <strong>of</strong> the ISA <strong>and</strong><br />
make a case for revisiting the RISC vs. CISC question. First, the<br />
computing l<strong>and</strong>scape has quite radically changed from when the<br />
previous studies were done. Rather than being exclusively desktops<br />
<strong>and</strong> servers, today’s computing l<strong>and</strong>scape is significantly<br />
shaped by smartphones <strong>and</strong> tablets. Second, while area <strong>and</strong> chip<br />
design complexity were previously the primary constraints, energy<br />
<strong>and</strong> power constraints now dominate. Third, from a com-<br />
mercial st<strong>and</strong>point, both ISAs are appearing in new markets:<br />
<strong>ARM</strong>-based servers for energy efficiency <strong>and</strong> <strong>x86</strong>-based mobile<br />
<strong>and</strong> low power devices for higher performance. Thus, the<br />
question <strong>of</strong> whether ISA plays a role in performance, power, or<br />
energy efficiency is once again important.<br />
Related Work: Early ISA studies are instructive, but miss<br />
key changes in today’s microprocessors <strong>and</strong> design constraints<br />
that have shifted the ISA’s effect. We review previous comparisons<br />
in chronological order, <strong>and</strong> observe that all prior comprehensive<br />
ISA studies considering commercially implemented<br />
processors focused exclusively on performance.<br />
Bh<strong>and</strong>arkar <strong>and</strong> Clark compared the MIPS <strong>and</strong> VAX ISA by<br />
comparing the M/2000 to the Digital VAX 8700 implementations<br />
[7] <strong>and</strong> concluded: “RISC as exemplified by MIPS provides<br />
a significant processor performance advantage.” In another<br />
study in 1995, Bh<strong>and</strong>arkar compared the Pentium-Pro to<br />
the Alpha 21164 [6], again focused exclusively on performance<br />
<strong>and</strong> concluded: “...the Pentium Pro processor achieves 80% to<br />
90% <strong>of</strong> the performance <strong>of</strong> the Alpha 21164... It uses an aggressive<br />
out-<strong>of</strong>-order design to overcome the instruction set level<br />
limitations <strong>of</strong> a CISC architecture. On floating-point intensive<br />
benchmarks, the Alpha 21164 does achieve over twice the performance<br />
<strong>of</strong> the Pentium Pro processor.” Consensus had grown<br />
that RISC <strong>and</strong> CISC ISAs had fundamental differences that led<br />
to performance gaps that required aggressive microarchitecture<br />
optimization for CISC which only partially bridged the gap.<br />
Isen et al. [22] compared the performance <strong>of</strong> Power5+ to Intel<br />
Woodcrest considering SPEC benchmarks <strong>and</strong> concluded <strong>x86</strong><br />
matches the POWER ISA. The consensus was that “with aggressive<br />
microarchitectural techniques for ILP, CISC <strong>and</strong> RISC<br />
ISAs can be implemented to yield very similar performance.”<br />
Many informal studies in recent years claim the <strong>x86</strong>’s<br />
“crufty” CISC ISA incurs many power overheads <strong>and</strong> attribute<br />
the <strong>ARM</strong> processor’s power efficiency to the ISA [1, 2]. These<br />
studies suggest that the microarchitecture optimizations from the<br />
past decades have led to RISC <strong>and</strong> CISC cores with similar performance,<br />
but the power overheads <strong>of</strong> CISC are intractable.<br />
In light <strong>of</strong> the prior ISA studies from decades past, the significantly<br />
modified computing l<strong>and</strong>scape, <strong>and</strong> the seemingly vastly<br />
different power consumption <strong>of</strong> <strong>ARM</strong> implementations (1-2 W)<br />
to <strong>x86</strong> implementations (5 - 36 W), we feel there is need to<br />
revisit this debate with a rigorous methodology. Specifically,<br />
considering the dominance <strong>of</strong> <strong>ARM</strong> <strong>and</strong> <strong>x86</strong> <strong>and</strong> the multipronged<br />
importance <strong>of</strong> the metrics <strong>of</strong> power, energy, <strong>and</strong> perfor-
A version appears in the 19th IEEE Intl. Symposium on High Performance Computer Architecture (HPCA 2013) 2<br />
Cortex A8<br />
Beagle Board<br />
Atom N450<br />
Atom Dev Board<br />
Cortex A9<br />
P<strong>and</strong>a Board<br />
i7-Core2700<br />
S<strong>and</strong>yBridge<br />
Mobile<br />
CoreMark<br />
2 WebKit<br />
Desktop<br />
SPEC CPU2006<br />
10 INT<br />
10 FP<br />
Server<br />
Lighttpd<br />
CLucene<br />
Database kernels<br />
Four Platforms 26 Workloads<br />
Over 200 Measures<br />
mance, we need to compare <strong>ARM</strong> to <strong>x86</strong> on those three metrics.<br />
Macro-op cracking <strong>and</strong> decades <strong>of</strong> research in high-performance<br />
microarchitecture techniques <strong>and</strong> compiler optimizations seemingly<br />
help overcome <strong>x86</strong>’s performance <strong>and</strong> code-effectiveness<br />
bottlenecks, but these approaches are not free. The crux <strong>of</strong> our<br />
analysis is the following: After decades <strong>of</strong> research to mitigate<br />
CISC performance overheads, do the new approaches introduce<br />
fundamental energy inefficiencies?<br />
Challenges: Any ISA study faces challenges in separating<br />
out the multiple implementation factors that are orthogonal to<br />
the ISA from the factors that are influenced or driven by the<br />
ISA. ISA-independent factors include chip process technology<br />
node, device optimization (high-performance, low-power, or<br />
low-st<strong>and</strong>by power transistors), memory b<strong>and</strong>width, I/O device<br />
effects, operating system, compiler, <strong>and</strong> workloads executed.<br />
These issues are exacerbated when considering energy measurements/analysis,<br />
since chips implementing an ISA sit on boards<br />
<strong>and</strong> separating out chip energy from board energy presents additional<br />
challenges. Further, some microarchitecture features may<br />
be required by the ISA, while others may be dictated by performance<br />
<strong>and</strong> application domain targets that are ISA-independent.<br />
To separate out the implementation <strong>and</strong> ISA effects, we consider<br />
multiple chips for each ISA with similar microarchitectures,<br />
use established technology models to separate out the<br />
technology impact, use the same operating system <strong>and</strong> compiler<br />
front-end on all chips, <strong>and</strong> construct workloads that do not<br />
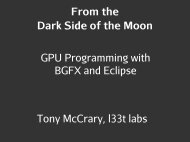
rely significantly on the operating system. Figure 1 presents an<br />
overview <strong>of</strong> our approach: the four platforms, 26 workloads,<br />
<strong>and</strong> set <strong>of</strong> measures collected for each workload on each platform.<br />
We use multiple implementations <strong>of</strong> the ISAs <strong>and</strong> specifically<br />
consider the <strong>ARM</strong> <strong>and</strong> <strong>x86</strong> ISAs representing RISC against<br />
CISC. We present an exhaustive <strong>and</strong> rigorous analysis using<br />
workloads that span smartphone, desktop, <strong>and</strong> server applications.<br />
In our study, we are primarily interested in whether <strong>and</strong>,<br />
if so, how the ISA impacts performance <strong>and</strong> power. We also<br />
discuss infrastructure <strong>and</strong> system challenges, missteps, <strong>and</strong> s<strong>of</strong>tware/hardware<br />
bugs we encountered. Limitations are addressed<br />
in Section 3. Since there are many ways to analyze the raw<br />
data, this paper is accompanied by a public release <strong>of</strong> all data<br />
at www.cs.wisc.edu/vertical/isa-power-struggles.<br />
Key Findings: The main findings from our study are:<br />
◦ Large performance gaps exist across the implementations, although<br />
average cycle count gaps are ≤ 2.5×.<br />
Figure 1. Summary <strong>of</strong> Approach.<br />
Perf interface to<br />
Hw performance counters<br />
Simulated <strong>ARM</strong><br />
instruction mix<br />
Binary Instrumentation<br />
for <strong>x86</strong> instruction info<br />
WattsUp<br />
Power<br />
Measures<br />
Power<br />
RISC v CISC<br />
appears<br />
irrelevant<br />
Performance<br />
Over 20,000 Data Points<br />
+ Careful <strong>Analysis</strong><br />
◦ Instruction count <strong>and</strong> mix are ISA-independent to first order.<br />
◦ Performance differences are generated by ISA-independent<br />
microarchitecture differences.<br />
◦ The energy consumption is again ISA-independent.<br />
◦ ISA differences have implementation implications, but modern<br />
microarchitecture techniques render them moot; one<br />
ISA is not fundamentally more efficient.<br />
◦ <strong>ARM</strong> <strong>and</strong> <strong>x86</strong> implementations are simply design points optimized<br />
for different performance levels.<br />
Implications: Our findings confirm known conventional (or<br />
suspected) wisdom, <strong>and</strong> add value by quantification. Our results<br />
imply that microarchitectural effects dominate performance,<br />
power, <strong>and</strong> energy impacts. The overall implication <strong>of</strong> this work<br />
is that the ISA being RISC or CISC is largely irrelevant for today’s<br />
mature microprocessor design world.<br />
Paper organization: Section 2 describes a framework we develop<br />
to underst<strong>and</strong> the ISA’s impacts on performance, power,<br />
<strong>and</strong> energy. Section 3 describes our overall infrastructure <strong>and</strong><br />
rationale for the platforms for this study <strong>and</strong> our limitations,<br />
Section 4 discusses our methodology, <strong>and</strong> Section 5 presents the<br />
analysis <strong>of</strong> our data. Section 7 concludes.<br />
2. Framing Key Impacts <strong>of</strong> the ISA<br />
In this section, we present an intellectual framework in<br />
which to examine the impact <strong>of</strong> the ISA—assuming a von Neumann<br />
model—on performance, power, <strong>and</strong> energy. We consider<br />
the three key textbook ISA features that are central to the<br />
RISC/CISC debate: format, operations, <strong>and</strong> oper<strong>and</strong>s. We do<br />
not consider other textbook features, data types <strong>and</strong> control, as<br />
they are orthogonal to RISC/CISC design issues <strong>and</strong> RISC/CISC<br />
approaches are similar. Table 1 presents the three key ISA features<br />
in three columns <strong>and</strong> their general RISC <strong>and</strong> CISC characteristics<br />
in the first two rows. We then discuss contrasts for<br />
each feature <strong>and</strong> how the choice <strong>of</strong> RISC or CISC potentially<br />
<strong>and</strong> historically introduced significant trade-<strong>of</strong>fs in performance<br />
<strong>and</strong> power. In the fourth row, we discuss how modern refinements<br />
have led to similarities, marginalizing the choice <strong>of</strong> RISC<br />
or CISC on performance <strong>and</strong> power. Finally, the last row raises<br />
empirical questions focused on each feature to quantify or validate<br />
this convergence. Overall, our approach is to underst<strong>and</strong><br />
all performance <strong>and</strong> power differences by using measured metrics<br />
to quantify the root cause <strong>of</strong> differences <strong>and</strong> whether or not
A version appears in the 19th IEEE Intl. Symposium on High Performance Computer Architecture (HPCA 2013) 3<br />
RISC /<br />
<strong>ARM</strong><br />
CISC /<br />
<strong>x86</strong><br />
Historical<br />
Contrasts<br />
Convergence<br />
Trends<br />
Empirical<br />
Questions<br />
Table 1. Summary <strong>of</strong> RISC <strong>and</strong> CISC Trends.<br />
Format Operations Oper<strong>and</strong>s<br />
◦ Fixed length instructions ◦ Simple, single function operations ◦ Oper<strong>and</strong>s: registers, immediates<br />
◦ Relatively simple encoding ◦ Single cycle ◦ Few addressing modes<br />
◦ <strong>ARM</strong>: 4B, THUMB(2B, optional) ◦ <strong>ARM</strong>: 16 general purpose registers<br />
◦ Variable length instructions ◦ Complex, multi-cycle instructions ◦ Oper<strong>and</strong>s: memory, registers, immediates<br />
◦ Common insts shorter/simpler ◦ Transcendentals ◦ Many addressing modes<br />
◦ Special insts longer/complex ◦ Encryption ◦ <strong>x86</strong>: 8 32b & 6 16b registers<br />
◦ <strong>x86</strong>: from 1B to 16B long ◦ String manipulation<br />
◦ CISC decode latency prevents pipelining ◦ Even w/ µcode, pipelining hard ◦ CISC decoder complexity higher<br />
◦ CISC decoders slower/more area ◦ CISC latency may be longer than ◦ CISC has more per inst work, longer cycles<br />
◦ Code density: RISC < CISC compiler’s RISC equivalent ◦ Static code size: RISC > CISC<br />
◦ µ-op cache minimizes decoding overheads ◦ CISC insts split into RISC-like micro-ops; ◦ <strong>x86</strong> decode optimized for common insts<br />
◦ <strong>x86</strong> decode optimized for common insts optimizations eliminated inefficiencies ◦ CISC insts split into RISC-like micro-ops;<br />
◦ I-cache minimizes code density impact ◦ Modern compilers pick mostly RISC insts; <strong>x86</strong> <strong>and</strong> <strong>ARM</strong> µ-op latencies similar<br />
µ-op counts similar for <strong>ARM</strong> <strong>and</strong> <strong>x86</strong> ◦ Number <strong>of</strong> data cache accesses similar<br />
◦ How much variance in <strong>x86</strong> inst length? ◦ Are macro-op counts similar? ◦ Number <strong>of</strong> data accesses similar?<br />
Low variance ⇒ common insts optimized Similar ⇒ RISC-like on both Similar ⇒ no data access inefficiencies<br />
◦ Are <strong>ARM</strong> <strong>and</strong> <strong>x86</strong> code densities similar? ◦ Are complex instructions used by <strong>x86</strong> ISA?<br />
Similar density ⇒ No ISA effect Few complex ⇒ Compiler picks RISC-like<br />
◦ What are instruction cache miss rates? ◦ Are µ-op counts similar?<br />
Low ⇒ caches hide low code densities Similar ⇒ CISC split into RISC-like µ-ops<br />
ISA differences contribute. The remainder <strong>of</strong> this paper is centered<br />
around these empirical questions framed by the intuition<br />
presented as the convergence trends.<br />
Although whether an ISA is RISC or CISC seems irrelevant,<br />
ISAs are evolving; expressing more semantic information has<br />
led to improved performance (<strong>x86</strong> SSE, larger address space),<br />
better security (<strong>ARM</strong> Trustzone), better virtualization, etc. Examples<br />
in current research include extensions to allow the hardware<br />
to balance accuracy with energy efficiency [15, 13] <strong>and</strong> extensions<br />
to use specialized hardware for energy efficiency [18].<br />
We revisit this issue in our conclusions.<br />
3. Infrastructure<br />
We now describe our infrastructure <strong>and</strong> tools. The key takeaway<br />
is that we pick four platforms, doing our best to keep them<br />
on equal footing, pick representative workloads, <strong>and</strong> use rigorous<br />
methodology <strong>and</strong> tools for measurement. Readers can skip<br />
ahead to Section 4 if uninterested in the details.<br />
3.1. Implementation Rationale <strong>and</strong> Challenges<br />
Choosing implementations presents multiple challenges due<br />
to differences in technology (technology node, frequency, high<br />
performance/low power transistors, etc.); ISA-independent microarchitecture<br />
(L2-cache, memory controller, memory size,<br />
etc.); <strong>and</strong> system effects (operating system, compiler, etc.). Finally,<br />
platforms must be commercially relevant <strong>and</strong> it is unfair<br />
to compare platforms from vastly different time-frames.<br />
We investigated a wide spectrum <strong>of</strong> platforms spanning Intel<br />
Nehalem, S<strong>and</strong>ybridge, AMD Bobcat, NVIDIA Tegra-2,<br />
NVIDIA Tegra-3, <strong>and</strong> Qualcomm Snapdragon. However, we<br />
did not find implementations that met all <strong>of</strong> our criteria: same<br />
technology node across the different ISAs, identical or similar<br />
microarchitecture, development board that supported necessary<br />
measurements, a well-supported operating system, <strong>and</strong> similar<br />
I/O <strong>and</strong> memory subsystems. We ultimately picked the Beagleboard<br />
(Cortex-A8), P<strong>and</strong>aboard (Cortex-A9), <strong>and</strong> Atom board,<br />
as they include processors with similar microarchitectural features<br />
like issue-width, caches, <strong>and</strong> main-memory <strong>and</strong> are from<br />
similar technology nodes, as described in Tables 2 <strong>and</strong> 7. They<br />
are all relevant commercially as shown by the last row in Table<br />
2. For a high performance <strong>x86</strong> processor, we use an Intel i7<br />
S<strong>and</strong>ybridge processor; it is significantly more power-efficient<br />
than any 45nm <strong>of</strong>fering, including Nehalem. Importantly, these<br />
choices provided usable s<strong>of</strong>tware platforms in terms <strong>of</strong> operating<br />
system, cross-compilation, <strong>and</strong> driver support. Overall, our<br />
choice <strong>of</strong> platforms provides a reasonably equal footing, <strong>and</strong> we<br />
perform detailed analysis to isolate out microarchitecture <strong>and</strong><br />
technology effects. We present system details <strong>of</strong> our platforms<br />
for context, although the focus <strong>of</strong> our work is the processor core.<br />
A key challenge in running real workloads was the relatively<br />
small memory (512MB) on the Cortex-A8 Beagleboard.<br />
While representative <strong>of</strong> the typical target (e.g., iPhone 4 has<br />
512MB RAM), it presents a challenge for workloads like SPEC-<br />
CPU2006; execution times are dominated by swapping <strong>and</strong> OS<br />
overheads, making the core irrelevant. Section 3.3 describes<br />
how we h<strong>and</strong>led this. In the remainder <strong>of</strong> this section, we discuss<br />
the platforms, applications, <strong>and</strong> tools for this study in detail.<br />
3.2. Implementation Platforms<br />
Hardware platform: We consider two chip implementations<br />
each for the <strong>ARM</strong> <strong>and</strong> <strong>x86</strong> ISAs as described in Table 2.<br />
Intent: Keep non-processor features as similar as possible.
A version appears in the 19th IEEE Intl. Symposium on High Performance Computer Architecture (HPCA 2013) 4<br />
Table 2. Platform Summary.<br />
Table 3. Benchmark Summary.<br />
32/64b <strong>x86</strong> ISA <strong>ARM</strong>v7 ISA<br />
Architecture S<strong>and</strong>ybridge Atom Cortex-A9 Cortex-A8<br />
Processor Core 2700 N450 OMAP4430 OMAP3530<br />
Cores 4 1 2 1<br />
Frequency 3.4 GHz 1.66 GHz 1 GHz 0.6 GHz<br />
Width 4-way 2-way 2-way 2-way<br />
Issue OoO In Order OoO In Order<br />
L1 Data 32 KB 24 KB 32 KB 16 KB<br />
L1 Inst 32 KB 32 KB 32 KB 16 KB<br />
L2 256 KB/core 512 KB 1 MB/chip 256 KB<br />
L3 8 MB/chip — — —<br />
Memory 16 GB 1 GB 1 GB 256 MB<br />
SIMD AVX SSE NEON NEON<br />
Area 216 mm 2 66 mm 2 70 mm 2 60 mm 2<br />
Tech Node 32 nm 45 nm 45 nm 65 nm<br />
Platform Desktop Dev Board P<strong>and</strong>aboard Beagleboard<br />
Products Desktop Netbook Galaxy S-III iPhone 4, 3GS<br />
Lava Xolo Galaxy S-II Motorola Droid<br />
Data from TI OMAP3530, TI OMAP4430, Intel Atom N450, <strong>and</strong> Intel<br />
i7-2700 datasheets, www.beagleboard.org & www.p<strong>and</strong>aboard.org<br />
Operating system: Across all platforms, we run the same<br />
stable Linux 2.6 LTS kernel with some minor board-specific<br />
patches to obtain accurate results when using the performance<br />
counter subsystem. We use perf’s 1 program sampling to find<br />
the fraction <strong>of</strong> time spent in the kernel while executing the SPEC<br />
benchmarks on all four boards; overheads were less than 5% for<br />
all but GemsFDTD <strong>and</strong> perlbench (both less than 10%) <strong>and</strong> the<br />
fraction <strong>of</strong> time spent in the operating system was virtually identical<br />
across platforms spanning ISAs.<br />
Intent: Keep OS effects as similar as possible across platforms.<br />
Compiler: Our toolchain is based on a validated gcc 4.4 based<br />
cross-compiler configuration. We intentionally chose gcc so<br />
that we can use the same front-end to generate all binaries. All<br />
target independent optimizations are enabled (O3); machinespecific<br />
tuning is disabled so there is a single set <strong>of</strong> <strong>ARM</strong> binaries<br />
<strong>and</strong> a single set <strong>of</strong> <strong>x86</strong> binaries. For <strong>x86</strong> we target 32-bit<br />
since 64-bit <strong>ARM</strong> platforms are still under development. For<br />
<strong>ARM</strong>, we disable THUMB instructions for a more RISC-like<br />
ISA. We ran experiments to determine the impact <strong>of</strong> machinespecific<br />
optimizations <strong>and</strong> found that these impacts were less<br />
than 5% for over half <strong>of</strong> the SPEC suite, <strong>and</strong> caused performance<br />
variations <strong>of</strong> ±20% on the remaining with speed-ups <strong>and</strong> slowdowns<br />
equally likely. None <strong>of</strong> the benchmarks include SIMD<br />
code, <strong>and</strong> although we allow auto-vectorization, very few SIMD<br />
instructions are generated for either architecture. Floating point<br />
is done natively on the SSE (<strong>x86</strong>) <strong>and</strong> NEON (<strong>ARM</strong>) units. Vendor<br />
compilers may produce better code for a platform, but we<br />
use gcc to eliminate compiler influence. As seen in Table 12 in<br />
Appendix I, static code size is within 8% <strong>and</strong> average instruction<br />
lengths are within 4% using gcc <strong>and</strong> icc for SPEC INT, so we<br />
expect that compiler does not make a significant difference.<br />
Intent: Hold compiler effects constant across platforms.<br />
3.3. Applications<br />
Since both ISAs are touted as c<strong>and</strong>idates for mobile clients,<br />
desktops, <strong>and</strong> servers, we consider a suite <strong>of</strong> workloads that span<br />
1 perf is a Linux utility to access performance counters.<br />
Domain Benchmarks Notes<br />
Mobile CoreMark Set to 4000 iterations<br />
client WebKit Similar to BBench<br />
Desktop SPECCPU2006 10 INT, 10 FP, test inputs<br />
Server lighttpd Represents web-serving<br />
CLucene Represents web-indexing<br />
Database kernels Represents data-streaming <strong>and</strong><br />
data-analytics<br />
these. We use prior workload studies to guide our choice, <strong>and</strong><br />
where appropriate we pick equivalent workloads that can run on<br />
our evaluation platforms. A detailed description follows <strong>and</strong> is<br />
summarized in Table 3. All workloads are single-threaded to<br />
ensure our single-core focus.<br />
Mobile client: This category presented challenges as mobile<br />
client chipsets typically include several accelerators <strong>and</strong> careful<br />
analysis is required to determine the typical workload executed<br />
on the programmable general-purpose core. We used CoreMark<br />
(www.coremark.org), widely used in industry white-papers,<br />
<strong>and</strong> two WebKit regression tests informed by the BBench<br />
study [19]. BBench, a recently proposed smartphone benchmark<br />
suite, is a “a web-page rendering benchmark comprising<br />
11 <strong>of</strong> the most popular sites on the internet today” [19]. To avoid<br />
web-browser differences across the platforms, we use the crossplatform<br />
WebKit with two <strong>of</strong> its built-in tests that mimic realworld<br />
HTML layout <strong>and</strong> performance scenarios for our study 2 .<br />
Desktop: We use the SPECCPU2006 suite (www.spec.org)<br />
as representative <strong>of</strong> desktop workloads. SPECCPU2006 is a<br />
well understood st<strong>and</strong>ard desktop benchmark, providing insights<br />
into core behavior. Due to the large memory footprint <strong>of</strong> the<br />
train <strong>and</strong> reference inputs, we found that for many benchmarks<br />
the memory constrained Cortex-A8, in particular, ran <strong>of</strong> memory<br />
<strong>and</strong> execution was dominated by system effects. Instead, we<br />
report results using the test inputs, which fit in the Cortex-A8’s<br />
memory footprint for 10 <strong>of</strong> 12 INT <strong>and</strong> 10 <strong>of</strong> 17 FP benchmarks.<br />
Server: We chose server workloads informed by the Cloud-<br />
Suite workloads recently proposed by Ferdman et al. [16]. Their<br />
study characterizes server/cloud workloads into data analytics,<br />
data streaming, media streaming, s<strong>of</strong>tware testing, web search,<br />
<strong>and</strong> web serving. The actual s<strong>of</strong>tware implementations they<br />
provide are targeted for large memory-footprint machines <strong>and</strong><br />
their intent is to benchmark the entire system <strong>and</strong> server cluster.<br />
This is unsuitable for our study since we want to isolate<br />
processor effects. Hence, we pick implementations with<br />
small memory footprints <strong>and</strong> single-node behavior. To represent<br />
data-streaming <strong>and</strong> data-analytics, we use three database kernels<br />
commonly used in database evaluation work [26, 23] that<br />
capture the core computation in Bayes classification <strong>and</strong> datastore<br />
3 . To represent web search, we use CLucene (clucene.<br />
2 Specifically coreLayout <strong>and</strong> DOMPerformance.<br />
3 CloudSuite uses Hadoop+Mahout plus additional s<strong>of</strong>tware infrastructure,<br />
ultimately running Bayes classification <strong>and</strong> data-store; we feel this kernel approach<br />
is better suited for our study while capturing the domain’s essence.
A version appears in the 19th IEEE Intl. Symposium on High Performance Computer Architecture (HPCA 2013) 5<br />
Scaling<br />
Table 4. Infrastructure Limitations.<br />
Limitation Implications<br />
No platform uniformity across ISAs Best effort<br />
No platform diversity within ISAs Best effort<br />
Design teams are different µarch effect, not ISA<br />
“Pure” RISC, CISC implementations Out <strong>of</strong> scope<br />
low power microcontrollers Out <strong>of</strong> scope<br />
Server style platforms See server benchmarks<br />
Why SPEC on mobile platforms? Tracks emerging uses<br />
DomainUltra<br />
Why not SPEC JBB or TPC-C? CloudSuite more relevant<br />
Cores Multicore effects: coherence, locking... 2nd order for core design<br />
Arch. specific compiler tuning
A version appears in the 19th IEEE Intl. Symposium on High Performance Computer Architecture (HPCA 2013) 6<br />
Measures Methodology<br />
Table 5. Methodology Summary.<br />
(a) Native Execution on Real Hardware<br />
Execution time, ◦ Approach: Use perf tool to sample cycle performance counters; sampling avoids potential counter overflow.<br />
Cycle counts ◦ <strong>Analysis</strong>: 5 - 20 trials (dependent on variance <strong>and</strong> benchmark runtime); report minimum from trials that complete normally.<br />
◦ Validation: Compare against wall clock time.<br />
Inst. count (<strong>ARM</strong>) ◦ Approach: Use perf tool to collect macro-ops from performance counters<br />
◦ <strong>Analysis</strong>: At least 3 trials; report minimum from trials that complete normally.<br />
◦ Validation: Performance counters within 10% <strong>of</strong> gem5 <strong>ARM</strong> simulation. Table 9 elaborates on challenges.<br />
Inst. count (<strong>x86</strong>) ◦ Approach: Use perf to collect macro-ops <strong>and</strong> micro-ops from performance counters.<br />
◦ <strong>Analysis</strong>: At least 3 trials; report minimum from trials that complete normally.<br />
◦ Validation: Counters within 2% <strong>of</strong> DynamoRIO trace count (macro-ops only). Table 9 elaborates on challenges.<br />
Inst. mix (Coarse) ◦ Approach: SIMD + FP + load/store performance counters.<br />
Inst. length (<strong>x86</strong>) ◦ Approach: Wrote Pin tool to find length <strong>of</strong> each instruction <strong>and</strong> keep running average.<br />
Microarch events ◦ Approach: Branch mispredictions, cache misses, <strong>and</strong> other uarch events measured using perf performance counters.<br />
◦ <strong>Analysis</strong>: At least 3 trials; additional if a particular counter varies by > 5%. Report minimum from normal trials.<br />
Full system power ◦ Set-up: Use Wattsup meter connected to board or desktop<br />
(no network connection, peripherals on separate supply, kernel DVFS disabled, cores at peak frequency, single-user mode).<br />
◦ Approach: Run benchmarks in loop to guarantee 3 minutes <strong>of</strong> samples (180 samples at maximum sampling rate).<br />
◦ <strong>Analysis</strong>: If outliers occur, rerun experiment; present average power across run without outliers.<br />
Board power ◦ Set-up: Use Wattsup meter connected to board or desktop<br />
(no network connection, peripherals on separate supply, kernel DVFS disabled, cores at peak frequency, single-user mode).<br />
◦ Approach: Run with kernel power saving enabled; force to lowest frequency. Issue halt; report power when it stabilizes.<br />
◦ <strong>Analysis</strong>: Report minimum observed power.<br />
Processor power ◦ Approach: Subtracting above two gives processor power.<br />
◦ Validation: compare core power against energy performance counters <strong>and</strong>/or reported TDP <strong>and</strong> power draw.<br />
Measures Methodology<br />
(b) Emulated Execution<br />
Inst. mix (<strong>Detailed</strong>) ◦ Approach (<strong>ARM</strong>): Use gem5 instruction trace <strong>and</strong> analyze using python script.<br />
◦ Approach (<strong>x86</strong>): Use DynamoRIO instruction trace <strong>and</strong> analyze using python script.<br />
◦ Validation: Compare against coarse mix from SIMD + FP + load/store performance counters.<br />
ILP ◦ Approach: Pin based MICA tool which reports ILP with window size 32, 64, 128, 256.<br />
mentations available to our group. The impact <strong>of</strong> higher performance<br />
emerging cores is included in our synthetic processor<br />
study.<br />
Domain: We picked a representative set <strong>of</strong> workloads we feel<br />
captures a significant subset <strong>of</strong> modern workloads. We do not<br />
make broad domain-specific arguments, since that requires truly<br />
representative inputs <strong>and</strong> IO subsystem control for the mobile<br />
<strong>and</strong> server domains. Our study focused on single-core, <strong>and</strong> thus<br />
intentionally avoids multi-core system issues (e.g., consistency<br />
models, coherence, virtualization, etc.).<br />
Measurement <strong>and</strong> tool errors: Our measurements are primarily<br />
on real hardware, <strong>and</strong> therefore include real world errors.<br />
We execute multiple runs <strong>and</strong> take a rigorous approach as detailed<br />
in Table 5. Eliminating all errors is impractical, <strong>and</strong> our<br />
final result trends are consistent <strong>and</strong> intuitive.<br />
<strong>Analysis</strong>: We have presented our analysis <strong>of</strong> this rich data set,<br />
<strong>and</strong> will release the data <strong>and</strong> our analysis scripts to allow interested<br />
readers to pursue their own detailed analysis.<br />
4. Methodology<br />
In this section, we describe how we use our tools <strong>and</strong> the<br />
overall flow <strong>of</strong> our analysis. Section 5 presents our data <strong>and</strong><br />
analysis. Table 5 describes how we employ the aforementioned<br />
tools <strong>and</strong> obtain the measures we are interested in, namely, execution<br />
time, execution cycles, instruction-mix, microarchitecture<br />
events, power, <strong>and</strong> energy.<br />
Our overall approach is to underst<strong>and</strong> all performance <strong>and</strong><br />
power differences <strong>and</strong> use the measured metrics to quantify the<br />
root cause <strong>of</strong> differences <strong>and</strong> whether or not ISA differences<br />
contribute, answering empirical questions from Section 2. Unless<br />
otherwise explicitly stated, all data is measured on real hardware.<br />
The flow <strong>of</strong> the next section is outlined below.<br />
4.1. Performance <strong>Analysis</strong> Flow<br />
Step 1: Present execution time for each benchmark.<br />
Step 2: Normalize frequency’s impact using cycle counts.<br />
Step 3: To underst<strong>and</strong> differences in cycle count <strong>and</strong> the influence<br />
<strong>of</strong> the ISA, present the dynamic instruction count measures,<br />
measured in both macro-ops <strong>and</strong> micro-ops.<br />
Step 4: Use instruction mix, code binary size, <strong>and</strong> average dynamic<br />
instruction length to underst<strong>and</strong> ISA’s influence.<br />
Step 5: To underst<strong>and</strong> performance differences not attributable<br />
to ISA, look at detailed microarchitecture events.<br />
Step 6: Attribute performance gaps to frequency, ISA, or ISA-
A version appears in the 19th IEEE Intl. Symposium on High Performance Computer Architecture (HPCA 2013) 7<br />
independent microarchitecture features. Qualitatively reason<br />
about whether the ISA forces microarchitecture features.<br />
4.2. Power <strong>and</strong> Energy <strong>Analysis</strong> Flow<br />
Step 1: Present per benchmark raw power measurements.<br />
Step 2: To factor out the impact <strong>of</strong> technology, present<br />
technology-independent power by scaling all processors to<br />
45nm <strong>and</strong> normalizing the frequency to 1 GHz.<br />
Step 3: To underst<strong>and</strong> the interplay between power <strong>and</strong> performance,<br />
examine raw energy.<br />
Step 4: Qualitatively reason about the ISA influence on microarchitecture<br />
in terms <strong>of</strong> energy.<br />
4.3. Trade-<strong>of</strong>f <strong>Analysis</strong> Flow<br />
Step 1: Combining the performance <strong>and</strong> power measures, compare<br />
the processor implementations using Pareto-frontiers.<br />
Step 2: Compare measured <strong>and</strong> synthetic processor implementations<br />
using Energy-Performance Pareto-frontiers.<br />
5. Measured Data <strong>Analysis</strong> <strong>and</strong> Findings<br />
We now present our measurements <strong>and</strong> analysis <strong>of</strong> performance,<br />
power, energy, <strong>and</strong> the trade-<strong>of</strong>fs between them. We<br />
conclude the section with sensitivity studies projecting performance<br />
<strong>of</strong> additional implementations <strong>of</strong> the <strong>ARM</strong> <strong>and</strong> <strong>x86</strong> ISA<br />
using a simple performance <strong>and</strong> power model.<br />
We present our data for all four platforms, <strong>of</strong>ten comparing<br />
A8 to Atom (both dual-issue in-order) <strong>and</strong> A9 to i7 (both OOO)<br />
since their implementations are pair-wise similar. For each step,<br />
we present the average measured data, average in-order <strong>and</strong> OoO<br />
ratios if applicable, <strong>and</strong> then our main findings. When our analysis<br />
suggests that some benchmarks are outliers, we give averages<br />
with the outliers included in parentheses.<br />
5.1. Performance <strong>Analysis</strong><br />
Step 1: Execution Time Comparison<br />
Data: Figure 2 shows execution time normalized to i7; averages<br />
including outliers are given using parentheses. Average<br />
ratios are in table below. Per benchmark data is in Figure 16 <strong>of</strong><br />
Appendix I.<br />
Normalized Time<br />
30<br />
25<br />
20<br />
15<br />
10<br />
5<br />
0<br />
(130) (72) (24) (344)<br />
A8 Atom A9 I7<br />
Mobile SPEC INT SPEC FP Server<br />
Figure 2. Execution Time Normalized to i7.<br />
Ratio Mobile SPEC INT SPEC FP Server<br />
A8 to Atom 3.4 (34) 3.5 4.2 (7.4) 3.7 (103)<br />
A9 to i7 5.8 8.4 7.2 (23) 7.4<br />
Outliers: A8 performs particularly poorly on WebKit tests<br />
<strong>and</strong> lighttpd, skewing A8/Atom differences in the mobile <strong>and</strong><br />
server data, respectively; see details in Step 2. Five SPEC FP<br />
benchmarks are also considered outliers; see Table 8. Where<br />
outliers are listed, they are in this set.<br />
Finding P1: Large performance gaps are platform <strong>and</strong> benchmark<br />
dependent: A9 to i7 performance gaps range from 5× to<br />
102× <strong>and</strong> A8 to Atom gaps range from 2× to 997×.<br />
Key Finding 1: Large performance gaps exist across the four<br />
platforms studied, as expected, since frequency ranges from 600<br />
MHz to 3.4 GHz <strong>and</strong> microarchitectures are very different.<br />
Step 2: Cycle-Count Comparison<br />
Data: Figure 3 shows cycle counts normalized to i7. Per<br />
benchmark data is in Figure 7.<br />
Normalized Cycles<br />
10<br />
8<br />
6<br />
4<br />
2<br />
0<br />
(23) (13) (7) (61)<br />
A8 Atom A9 I7<br />
Mobile SPEC INT SPEC FP Server<br />
Figure 3. Cycle Count Normalized to i7.<br />
Ratio Mobile SPEC INT SPEC FP Server<br />
A8 to Atom 1.2 (12) 1.2 1.5 (2.7) 1.3 (23)<br />
A9 to i7 1.7 2.5 2.1 (7.0) 2.2<br />
Finding P2: Per suite cycle count gaps between out-<strong>of</strong>-order<br />
implementations A9 <strong>and</strong> i7 are less than 2.5× (no outliers).<br />
Finding P3: Per suite cycle count gaps between in-order implementations<br />
A8 <strong>and</strong> Atom are less than 1.5× (no outliers).<br />
Key Finding 2: Performance gaps, when normalized to cycle<br />
counts, are less than 2.5× when comparing in-order cores to<br />
each other <strong>and</strong> out-<strong>of</strong>-order cores to each other.<br />
Step 3: Instruction Count Comparison<br />
Data: Figure 4a shows dynamic instruction (macro) counts on<br />
A8 <strong>and</strong> Atom normalized to Atom <strong>x86</strong> macro-instructions. Per<br />
benchmark data is in Figure 17a <strong>of</strong> Appendix I. Per benchmark<br />
data for CPIs is in Table 11 in Appendix I.<br />
Data: Figure 4b shows dynamic micro-op counts for Atom<br />
<strong>and</strong> i7 normalized to Atom macro-instructions 5 . Per benchmark<br />
data is in Figure 17b. <strong>of</strong> Appendix I<br />
Normalized Macro-Ops<br />
2.0<br />
1.5<br />
1.0<br />
0.5<br />
0.0<br />
<strong>ARM</strong><br />
<strong>x86</strong><br />
(3.2)<br />
Mobile SPEC INT SPEC FP Server<br />
Normalized Micro-Ops<br />
Mobile SPEC INT SPEC FP Server<br />
(a) Macro-Ops<br />
(b) Micro-Ops<br />
Figure 4. Instructions Normalized to i7 macro-ops.<br />
5For i7, we use issued micro-ops instead <strong>of</strong> retired micro-ops; we found that<br />
on average, this does not impact the micro-op/macro-op ratio.<br />
2.0<br />
1.5<br />
1.0<br />
0.5<br />
0.0<br />
Atom<br />
i7<br />
(1.5)
A version appears in the 19th IEEE Intl. Symposium on High Performance Computer Architecture (HPCA 2013) 8<br />
Outliers: For wkperf <strong>and</strong> lighttpd, A8 executes more than<br />
twice as many instructions as A9 6 . We report A9 instruction<br />
counts for these two benchmarks. For CLucene, <strong>x86</strong> machines<br />
execute 1.7× more instructions than <strong>ARM</strong> machines; this appears<br />
to be a pathological case <strong>of</strong> <strong>x86</strong> code generation inefficiencies.<br />
For cactusADM, Atom executes 2.7× more micro-ops<br />
than macro-ops; this extreme is not seen for other benchmarks.<br />
Finding P4: Instruction count similar across ISAs. Implies<br />
gcc picks the RISC-like instructions from the <strong>x86</strong> ISA.<br />
Finding P5: All <strong>ARM</strong> outliers in SPEC FP due to transcendental<br />
FP operations supported only by <strong>x86</strong>.<br />
Finding P6: <strong>x86</strong> micro-op to macro-op ratio is <strong>of</strong>ten less than<br />
1.3×, again suggesting gcc picks the RISC-like instructions.<br />
Key Finding 3: Instruction <strong>and</strong> cycle counts imply CPI is less<br />
on <strong>x86</strong> implementations: geometric mean CPI is 3.4 for A8, 2.2<br />
for A9, 2.1 for Atom, <strong>and</strong> 0.7 for i7 across all suites. <strong>x86</strong> ISA<br />
overheads, if any, are overcome by microarchitecture.<br />
Step 4: Instruction Format <strong>and</strong> Mix<br />
Data: Table 6a shows average <strong>ARM</strong> <strong>and</strong> <strong>x86</strong> static binary<br />
sizes, measuring only the binary’s instruction segment. Per<br />
benchmark data is in Table 12a in Appendix I.<br />
Data: Table 6b shows average dynamic <strong>ARM</strong> <strong>and</strong> <strong>x86</strong> instruction<br />
lengths. Per benchmark data is in Table 12b in Appendix<br />
I.<br />
Table 6. Instruction Size Summary.<br />
Mobile<br />
Desktop<br />
INT<br />
Desktop<br />
FP<br />
Server<br />
(a) Binary Size (MB) (b) Instruction Length (B)<br />
<strong>ARM</strong> <strong>x86</strong> <strong>ARM</strong> <strong>x86</strong><br />
Minimum 0.02 0.02 4.0 2.4<br />
Average 0.95 0.87 4.0 3.3<br />
Maximum 1.30 1.42 4.0 3.7<br />
Minimum 0.53 0.65 4.0 2.7<br />
Average 1.47 1.46 4.0 3.1<br />
Maximum 3.88 4.05 4.0 3.5<br />
Minimum 0.66 0.74 4.0 2.6<br />
Average 1.70 1.73 4.0 3.4<br />
Maximum 4.75 5.24 4.0 6.4<br />
Minimum 0.12 0.18 4.0 2.5<br />
Average 0.39 0.59 4.0 3.2<br />
Maximum 0.47 1.00 4.0 3.7<br />
Outliers: CLucene binary (from server suite) is almost 2×<br />
larger for <strong>x86</strong> than <strong>ARM</strong>; the server suite thus has the largest<br />
span in binary sizes. <strong>ARM</strong> executes correspondingly few instructions;<br />
see outliers discussion in Step 3.<br />
Finding P7: Average <strong>ARM</strong> <strong>and</strong> <strong>x86</strong> binary sizes are similar<br />
for SPEC INT, SPEC FP, <strong>and</strong> Mobile workloads, suggesting<br />
similar code densities.<br />
Finding P8: Executed <strong>x86</strong> instructions are on average up to<br />
25% shorter than <strong>ARM</strong> instructions: short, simple <strong>x86</strong> instructions<br />
are typical.<br />
Finding P9: <strong>x86</strong> FP benchmarks, which tend to have more<br />
complex instructions, have instructions with longer encodings<br />
(e.g., cactusADM with 6.4 Bytes/inst on average).<br />
6 A8 spins for IO, event-loops, <strong>and</strong> timeouts.<br />
Data: Figure 5 shows average coarse-grained <strong>ARM</strong> <strong>and</strong> <strong>x86</strong><br />
instruction mixes for each benchmark suite7 .<br />
Percent <strong>of</strong> psuedo-µops<br />
100%<br />
80%<br />
60%<br />
40%<br />
20%<br />
Other<br />
Branch<br />
Store<br />
Load<br />
<strong>ARM</strong> <strong>x86</strong><br />
Mobile<br />
<strong>ARM</strong> <strong>x86</strong><br />
SPEC INT<br />
<strong>ARM</strong> <strong>x86</strong><br />
SPEC FP<br />
<strong>ARM</strong> <strong>x86</strong><br />
Server<br />
Figure 5. Instruction Mix (Performance Counters).<br />
Data: Figure 6 shows fine-grained <strong>ARM</strong> <strong>and</strong> <strong>x86</strong> instruction<br />
mixes normalized to <strong>x86</strong> for a subset <strong>of</strong> SPEC benchmarks7 .<br />
Fraction <strong>of</strong> <strong>x86</strong> pseudo-µops<br />
4.0<br />
3.5<br />
3.0<br />
2.5<br />
2.0<br />
1.5<br />
1.0<br />
0.5<br />
0.0<br />
Load<br />
Store<br />
Branch<br />
Move<br />
ALU<br />
Logical<br />
Mul<br />
Div<br />
Special<br />
Other<br />
<strong>ARM</strong> <strong>x86</strong> <strong>ARM</strong> <strong>x86</strong> <strong>ARM</strong> <strong>x86</strong> <strong>ARM</strong> <strong>x86</strong><br />
gcc omnetpp soplex tonto<br />
Figure 6. Selected Instruction Counts (Emulated).<br />
Finding P10: Fraction <strong>of</strong> loads <strong>and</strong> stores similar across ISA<br />
for all suites, suggesting that the ISA does not lead to significant<br />
differences in data accesses.<br />
Finding P11: Large instruction counts for <strong>ARM</strong> are due<br />
to absence <strong>of</strong> FP instructions like fsincon, fyl2xpl, (e.g.,<br />
tonto in Figure 6’s many special <strong>x86</strong> instructions correspond<br />
to ALU/logical/multiply <strong>ARM</strong> instructions).<br />
Key Finding 4: Combining the instruction-count <strong>and</strong> mixfindings,<br />
we conclude that ISA effects are indistinguishable between<br />
<strong>x86</strong> <strong>and</strong> <strong>ARM</strong> implementations.<br />
Step 5: Microarchitecture<br />
Data: Figure 7 shows the per-benchmark cycle counts for<br />
more detailed analysis where performance gaps are large. The<br />
raw data for this figure is in the Cycles worksheet <strong>of</strong> our publicly<br />
released spreadsheet [10].<br />
Data: Table 7 compares the A8 microarchitecture to Atom,<br />
<strong>and</strong> A9 to i7, focusing on the primary structures. These details<br />
are from five Microprocessor Report articles 8 <strong>and</strong> the A9 numbers<br />
are estimates derived from publicly disclosed information<br />
on A15 <strong>and</strong> A9/A15 comparisons.<br />
7 <strong>x86</strong> instructions with memory oper<strong>and</strong>s are cracked into a memory operation<br />
<strong>and</strong> the original operation.<br />
8 “Cortex-A8 High speed, low power” (Nov 2005), “More applications for<br />
OMAP4” (Nov 2009), “ S<strong>and</strong>ybridge spans generations” (Sept 2010), “Intel’s<br />
Tiny Atom” (April 2008), “Cortex A-15 Eagle Flies the Coop” (Nov 2010).<br />
9 60 for A15.
A version appears in the 19th IEEE Intl. Symposium on High Performance Computer Architecture (HPCA 2013) 9<br />
Normalized Cycles<br />
Branch MPKI<br />
14<br />
12<br />
10<br />
8<br />
6<br />
4<br />
2<br />
0<br />
60<br />
50<br />
40<br />
30<br />
20<br />
10<br />
0<br />
coremark<br />
wk_layout<br />
wk_perf<br />
mean<br />
coremark<br />
wk_layout<br />
wk_perf<br />
mean<br />
64 23 15 25 38<br />
176 61<br />
373<br />
A8 Atom<br />
astar<br />
libquantum<br />
hmmer<br />
h264<br />
gobmk<br />
bzip2<br />
sjeng<br />
gcc<br />
perlbench<br />
omnetpp<br />
mean<br />
(a) In-Order<br />
A8 Atom<br />
astar<br />
libquantum<br />
hmmer<br />
h264<br />
gobmk<br />
bzip2<br />
sjeng<br />
gcc<br />
perlbench<br />
omnetpp<br />
mean<br />
soplex<br />
GemsFDTD<br />
calculix<br />
povray<br />
tonto<br />
namd<br />
leslie3D<br />
milc<br />
cactusADM<br />
bwaves<br />
mean<br />
lucene<br />
db_kernels<br />
lighttpd<br />
mean<br />
Normalized Cycles<br />
14<br />
12<br />
10<br />
8<br />
6<br />
4<br />
2<br />
0<br />
wk_perf<br />
wk_layout<br />
coremark<br />
mean<br />
Figure 7. Cycle Counts Normalized to i7.<br />
soplex<br />
GemsFDTD<br />
calculix<br />
povray<br />
tonto<br />
namd<br />
leslie3D<br />
milc<br />
cactusADM<br />
bwaves<br />
mean<br />
71<br />
lucene<br />
db_kernels<br />
lighttpd<br />
mean<br />
wk_perf<br />
wk_layout<br />
coremark<br />
mean<br />
A9 i7<br />
astar<br />
hmmer<br />
libquantum<br />
gobmk<br />
sjeng<br />
gcc<br />
perlbench<br />
h264<br />
bzip2<br />
omnetpp<br />
mean<br />
(b) Out-<strong>of</strong>-Order<br />
(a) In-Order<br />
(b) Out-<strong>of</strong>-Order<br />
Figure 8. Branch Misses per 1000 <strong>ARM</strong> Instructions.<br />
Table 7. Processor Microarchitecture Features.<br />
(a) In-Order Cores<br />
Pipeline Issue ALU/FP Br. Pred.<br />
Depth Width Threads Units BTB Entries<br />
A8 13 2 1 2/2 + NEON 512<br />
Atom 16+2 2 2 2/2 + IMul 128<br />
(b) Out-<strong>of</strong>-Order Cores<br />
Issue Threads ROB Entries for<br />
width Size LD/ST Rename Scheduler BTB<br />
A9 4 1 - 9 -/4 56 20 512<br />
i7 4(6) 2 64/36 160 168 54 8K - 16K<br />
Finding P12: A9 <strong>and</strong> i7’s different issue widths (2 versus<br />
4, respectively) 10 explain performance differences up to 2×, assuming<br />
sufficient ILP, a sufficient instruction window <strong>and</strong> a well<br />
balanced processor pipeline. We use MICA to confirm that our<br />
benchmarks all have limit ILP greater than 4 [20].<br />
Finding P13: Even with different ISAs <strong>and</strong> significant differences<br />
in microarchitecture, for 12 benchmarks, the A9 is within<br />
2× the cycle count <strong>of</strong> i7 <strong>and</strong> can be explained by the difference<br />
in issue width.<br />
Data: Figures 8, 9, <strong>and</strong> 10 show branch mispredictions & L1<br />
data <strong>and</strong> instruction cache misses per 1000 <strong>ARM</strong> instructions.<br />
The raw data for these figures is in the Branch Misses, L1<br />
Data Misses, <strong>and</strong> L1 Inst Misses worksheets, respectively,<br />
<strong>of</strong> our publicly released spreadsheet [10].<br />
10 We assume the conventional wisdom that A9 is dual issue, although its<br />
pipeline diagrams indicate it is quad-issue.<br />
Branch MPKI<br />
60<br />
50<br />
40<br />
30<br />
20<br />
10<br />
0<br />
A9 i7<br />
astar<br />
hmmer<br />
libquantum<br />
gobmk<br />
sjeng<br />
gcc<br />
perlbench<br />
h264<br />
bzip2<br />
omnetpp<br />
mean<br />
30<br />
soplex<br />
GemsFDTD<br />
calculix<br />
namd<br />
povray<br />
tonto<br />
cactusADM<br />
milc<br />
leslie3D<br />
bwaves<br />
mean<br />
soplex<br />
GemsFDTD<br />
calculix<br />
namd<br />
povray<br />
tonto<br />
cactusADM<br />
milc<br />
leslie3D<br />
bwaves<br />
mean<br />
lucene<br />
lighttpd<br />
db_kernels<br />
mean<br />
lucene<br />
lighttpd<br />
db_kernels<br />
mean<br />
Finding P14: Observe large microarchitectural event count<br />
differences (e.g., A9 branch misses are more common than i7<br />
branch misses). These differences are not because <strong>of</strong> the ISA,<br />
but rather due to microarchitectural design choices (e.g., A9’s<br />
BTB has 512 entries versus i7’s 16K entries).<br />
Finding P15: Per benchmark, we can attribute the largest<br />
gaps in i7 to A9 performance (<strong>and</strong> in Atom to A8 performance)<br />
to specific microachitectural events. In the interest <strong>of</strong> space,<br />
we present example analyses for those benchmarks with gaps<br />
greater than 3.0× in Table 8; bwaves details are in Appendix II.<br />
Key Finding 5: The microarchitecture has significant impact on<br />
performance. The <strong>ARM</strong> <strong>and</strong> <strong>x86</strong> architectures have similar instruction<br />
counts. The highly accurate branch predictor <strong>and</strong> large<br />
caches, in particular, effectively allow <strong>x86</strong> architectures to sustain<br />
high performance. <strong>x86</strong> performance inefficiencies, if any,<br />
are not observed. The microarchitecture, not the ISA, is responsible<br />
for performance differences.<br />
Step 6: ISA influence on microarchitecture<br />
Key Finding 6: As shown in Table 7, there are significant differences<br />
in microarchitectures. Drawing upon instruction mix<br />
<strong>and</strong> instruction count analysis, we feel that the only case where<br />
the ISA forces larger structures is on the ROB size, physical<br />
rename file size, <strong>and</strong> scheduler size since there are almost the<br />
same number <strong>of</strong> <strong>x86</strong> micro-ops in flight compared to <strong>ARM</strong> instructions.<br />
The difference is small enough that we argue it is not<br />
necessary to quantify further. Beyond the translation to microops,<br />
pipelined implementation <strong>of</strong> an <strong>x86</strong> ISA introduces no additional<br />
overheads over an <strong>ARM</strong> ISA for these performance levels.
A version appears in the 19th IEEE Intl. Symposium on High Performance Computer Architecture (HPCA 2013) 10<br />
L1 Data MPKI<br />
Inst Cache MPKI<br />
60<br />
50<br />
40<br />
30<br />
20<br />
10<br />
0<br />
498<br />
coremark<br />
wk_layout<br />
wk_perf<br />
mean<br />
60<br />
50<br />
40<br />
30<br />
20<br />
10<br />
0<br />
269<br />
coremark<br />
wk_layout<br />
wk_perf<br />
mean<br />
A8 Atom<br />
astar<br />
libquantum<br />
hmmer<br />
h264<br />
gobmk<br />
bzip2<br />
sjeng<br />
gcc<br />
perlbench<br />
omnetpp<br />
mean<br />
A8 Atom<br />
astar<br />
libquantum<br />
hmmer<br />
h264<br />
gobmk<br />
bzip2<br />
sjeng<br />
gcc<br />
perlbench<br />
omnetpp<br />
mean<br />
soplex<br />
GemsFDTD<br />
calculix<br />
povray<br />
tonto<br />
namd<br />
leslie3D<br />
milc<br />
cactusADM<br />
bwaves<br />
mean<br />
lucene<br />
db_kernels<br />
lighttpd<br />
mean<br />
L1 Data MPKI<br />
wk_perf<br />
wk_layout<br />
coremark<br />
mean<br />
astar<br />
hmmer<br />
libquantum<br />
gobmk<br />
sjeng<br />
gcc<br />
perlbench<br />
h264<br />
bzip2<br />
omnetpp<br />
mean<br />
(a) In-Order<br />
(b) Out-<strong>of</strong>-Order<br />
Figure 9. Data L1 Misses per 1000 <strong>ARM</strong> Instructions.<br />
soplex<br />
GemsFDTD<br />
calculix<br />
povray<br />
tonto<br />
namd<br />
leslie3D<br />
milc<br />
cactusADM<br />
bwaves<br />
mean<br />
lucene<br />
db_kernels<br />
lighttpd<br />
mean<br />
5.2. Power <strong>and</strong> Energy <strong>Analysis</strong><br />
In this section, we normalize to A8 as it uses the least power.<br />
Step 1: Average Power<br />
Data: Figure 11 shows average power normalized to the A8.<br />
Per benchmark data is in Figure 18 <strong>of</strong> Appendix I.<br />
Normalized Power<br />
40<br />
35<br />
30<br />
25<br />
20<br />
15<br />
10<br />
5<br />
0<br />
Inst Cache MPKI<br />
60<br />
50<br />
40<br />
30<br />
20<br />
10<br />
0<br />
wk_perf<br />
wk_layout<br />
coremark<br />
mean<br />
A9 i7<br />
astar<br />
hmmer<br />
libquantum<br />
gobmk<br />
sjeng<br />
gcc<br />
perlbench<br />
h264<br />
bzip2<br />
omnetpp<br />
mean<br />
(a) In-Order<br />
(b) Out-<strong>of</strong>-Order<br />
Figure 10. Instruction Misses per 1000 <strong>ARM</strong> Instructions.<br />
A8 Atom A9 I7<br />
Mobile SPEC INT SPEC FP Server<br />
Figure 11. Raw Average Power Normalized to A8.<br />
Ratio Mobile SPEC INT SPEC FP Server<br />
Atom to A8 3.0 3.1 3.1 3.0<br />
i7 to A9 20 17 20 21<br />
Key Finding 7: Overall <strong>x86</strong> implementations consume significantly<br />
more power than <strong>ARM</strong> implementations.<br />
Step 2: Average Technology Independent Power<br />
Data: Figure 12 shows technology-independent average<br />
power–cores are scaled to 1 GHz at 45nm (normalized to A8).<br />
Per benchmark data is in Figure 19 <strong>of</strong> Appendix I.<br />
Ratio Mobile SPEC INT SPEC FP Server<br />
Atom to A8 0.6 0.6 0.6 0.6<br />
i7 to A9 7.0 6.1 7.4 7.6<br />
Finding E1: With frequency <strong>and</strong> technology scaling, ISA appears<br />
irrelevant for power optimized cores: A8, A9, <strong>and</strong> Atom<br />
are all within 0.6× <strong>of</strong> each other (A8 consumes 29% more power<br />
than A9). Atom is actually lower power than A8 or A9.<br />
60<br />
50<br />
40<br />
30<br />
20<br />
10<br />
0<br />
Normalized TI Power<br />
8<br />
7<br />
6<br />
5<br />
4<br />
3<br />
2<br />
1<br />
0<br />
A9 i7<br />
soplex<br />
GemsFDTD<br />
calculix<br />
namd<br />
povray<br />
tonto<br />
cactusADM<br />
milc<br />
leslie3D<br />
bwaves<br />
mean<br />
soplex<br />
GemsFDTD<br />
calculix<br />
namd<br />
povray<br />
tonto<br />
cactusADM<br />
milc<br />
leslie3D<br />
bwaves<br />
mean<br />
lucene<br />
lighttpd<br />
db_kernels<br />
mean<br />
lucene<br />
lighttpd<br />
db_kernels<br />
mean<br />
A8 Atom A9 I7<br />
Mobile SPEC INT SPEC FP Server<br />
Figure 12. Tech. Independent Avg. Power Normalized to A8.<br />
Finding E2: i7 is performance, not power, optimized. Per<br />
suite power costs are 6.1× to 7.6× higher for i7 than A9 with<br />
1.7× to 7.0× higher frequency-independent performance (Figure<br />
3 cycle count performance).<br />
Key Finding 8: The choice <strong>of</strong> power or performance optimized<br />
core designs impacts core power use more than ISA.<br />
Step 3: Average Energy<br />
Data: Figure 13 shows energy (product <strong>of</strong> power <strong>and</strong> time).<br />
Per benchmark data is in Figure 20 <strong>of</strong> Appendix I.<br />
Normalized Energy<br />
1.6<br />
1.4<br />
1.2<br />
1.0<br />
0.8<br />
0.6<br />
0.4<br />
0.2<br />
0.0<br />
A8 Atom A9 I7<br />
Mobile SPEC INT SPEC FP Server<br />
Figure 13. Raw Average Energy Normalized to A8.
A version appears in the 19th IEEE Intl. Symposium on High Performance Computer Architecture (HPCA 2013) 11<br />
Benchmark Gap <strong>Analysis</strong><br />
Table 8. <strong>Detailed</strong> <strong>Analysis</strong> for Benchmarks with A9 to i7 Gap Greater Than 3×.<br />
omnetpp 3.4 Branch MPKI: 59 for A9 versus only 2.0 for i7; I-Cache MPKI: 33 for A9 versus only 2.2 for i7.<br />
db kernels 3.8 1.6× more instructions, 5× more branch MPKI for A9 than i7.<br />
tonto 6.2 Instructions: 4× more for <strong>ARM</strong> than <strong>x86</strong>.<br />
cactusADM 6.6 Instructions: 2.8× more for <strong>ARM</strong> than <strong>x86</strong>.<br />
milc 8.0 A9 <strong>and</strong> i7 both experience more than 50 data cache MPKI. i7’s microarchitecture hides these misses more effectively.<br />
leslie3D 8.4 4× as many L2 cache misses using the A8 than using the Atom explains the 2× A8 to Atom gap. On the A9, the data cache<br />
MPKI is 55, compared to only 30 for the i7.<br />
bwaves 30 324× more branch MPKI, 17.5× more instructions, 4.6× more instruction MPKI, <strong>and</strong> 6× more L2 cache misses on A8 than<br />
Atom. A9 has similar trends, including 1000× more branch MPKI than the i7.<br />
Ratio Mobile SPEC INT SPEC FP Server<br />
A8 to Atom 0.8(0.1) 0.9 0.8 (0.6) 0.8(0.2)<br />
i7 to A9 3.3 1.7 1.7 (1.0) 1.8<br />
Finding E3: Despite power differences, Atom consumes less<br />
energy than A8 <strong>and</strong> i7 uses only slightly more energy than A9<br />
due primarily to faster execution times, not ISA.<br />
Finding E4: For “hard” benchmarks with high cache miss<br />
rates that leave the core poorly utilized (e.g., many in SPEC<br />
FP), fixed energy costs from structures provided for highperformance<br />
make i7’s energy 2× to 3× worse than A9.<br />
Key Finding 9: Since power <strong>and</strong> performance are both primarily<br />
design choices, energy use is also primarily impacted by design<br />
choice. ISA’s impact on energy is insignificant.<br />
Step 4: ISA impact on microarchitecture.<br />
Data: Table 7 outlined microarchitecture features.<br />
Finding E5: The energy impact <strong>of</strong> the ISA is that it requires<br />
micro-ops translation <strong>and</strong> an additional micro-ops cache. Further,<br />
since the number <strong>of</strong> micro-ops is not significantly higher,<br />
the energy impact <strong>of</strong> <strong>x86</strong> support is small.<br />
Finding E6: Other power-hungry structures like a large L2cache,<br />
highly associative TLB, aggressive prefetcher, <strong>and</strong> large<br />
branch predictor seem dictated primarily by the performance<br />
level <strong>and</strong> application domain targeted by the Atom <strong>and</strong> i7 processors<br />
<strong>and</strong> are not necessitated by <strong>x86</strong> ISA features.<br />
5.3. Trade-<strong>of</strong>f <strong>Analysis</strong><br />
Step 1: Power- Performance Trade-<strong>of</strong>fs<br />
Data: Figure 14 shows the geometric mean powerperformance<br />
trade-<strong>of</strong>f for all benchmarks using technology node<br />
scaled power. We generate a cubic curve for the powerperformance<br />
trade-<strong>of</strong>f curve. Given our small sample set, a<br />
core’s location on the frontier does not imply that it is optimal.<br />
Power (W)<br />
35<br />
30<br />
25<br />
20<br />
15<br />
10<br />
5<br />
A8 A9<br />
Atom<br />
i7 - low perf<br />
0<br />
0 1 2 3 4 5 6<br />
Performance (BIPS)<br />
Figure 14. Power Performance Trade-<strong>of</strong>fs.<br />
Finding T1: A9 provides 3.5× better performance using 1.8×<br />
the power <strong>of</strong> A8.<br />
i7<br />
Finding T2: i7 provides 6.2× better performance using 10.9×<br />
the power <strong>of</strong> Atom.<br />
Finding T3: i7’s microarchitecture has high energy cost when<br />
performance is low: benchmarks with the smallest performance<br />
gap between i7 <strong>and</strong> A9 (star in Figure 14) 11 have only 6× better<br />
performance than A9 but use more than 10× more power.<br />
Key Finding 10: Regardless <strong>of</strong> ISA or energy-efficiency,<br />
high-performance processors require more power than lowerperformance<br />
processors. They follow well established cubic<br />
power/performance trade-<strong>of</strong>fs.<br />
Step 2: Energy-Performance Trade-<strong>of</strong>fs<br />
Data: Figure 15 shows the geometric mean energyperformance<br />
trade-<strong>of</strong>f using technology node scaled energy. We<br />
generate a quadratic energy-performance trade-<strong>of</strong>f curve. Again,<br />
a core’s location on the frontier does not imply optimality. Synthetic<br />
processor points beyond the four processors studied are<br />
shown using hollow points; we consider a performance targeted<br />
<strong>ARM</strong> core (A15) <strong>and</strong> frequency scaled A9, Atom, <strong>and</strong> i7 cores.<br />
A15 BIPS are from reported CoreMark scores; details on synthetic<br />
points are in Appendix III.<br />
Energy (J)<br />
30<br />
25<br />
20<br />
15<br />
10<br />
5<br />
A8<br />
Atom<br />
A9 2 Ghz<br />
A9<br />
Atom 1 Ghz<br />
A15 2 Ghz<br />
Synthetic Points Are Hollow<br />
i7 2Ghz<br />
0<br />
0 1 2 3 4 5 6<br />
Performance (BIPS)<br />
Figure 15. Energy Performance Trade-<strong>of</strong>fs.<br />
Finding T4: Regardless <strong>of</strong> ISA, power-only or performanceonly<br />
optimized cores have high energy overheads (e.g., A8 <strong>and</strong><br />
i7).<br />
Finding T5: Balancing power <strong>and</strong> performance leads to<br />
energy-efficient cores, regardless <strong>of</strong> the ISA: A9 <strong>and</strong> Atom processor<br />
energy requirements are within 24% <strong>of</strong> each other <strong>and</strong><br />
use up to 50% less energy than other cores.<br />
11 Seven SPEC, all mobile, <strong>and</strong> the non-database server benchmarks.<br />
i7
A version appears in the 19th IEEE Intl. Symposium on High Performance Computer Architecture (HPCA 2013) 12<br />
Finding T6: DVFS <strong>and</strong> microarchitectural techniques can<br />
provide high energy-efficiency to performance-optimized cores,<br />
regardless <strong>of</strong> the ISA: i7 at 2 GHz provides 6× performance at<br />
the same energy level as an A9.<br />
Finding T7: We consider the energy-delay metric (ED) to<br />
capture both performance <strong>and</strong> power. Cores designed balancing<br />
power <strong>and</strong> performance constraints show the best energy-delay<br />
product: A15 is 46% lower than any other design we considered.<br />
Finding T8: When weighting the importance <strong>of</strong> performance<br />
only slightly more than power, high-performance cores seem<br />
best suited. Considering ED 1.4 , i7–a performance optimized<br />
core–is best (lowest product, <strong>and</strong> 6× higher performance). Considering<br />
ED 2 , i7 is more than 2× better than the next best design.<br />
See Appendix IV for more details.<br />
Key Finding 11: It is the microarchitecture <strong>and</strong> design methodologies<br />
that really matter.<br />
6. Challenges<br />
During this study, we encountered infrastructure <strong>and</strong> system<br />
challenges, missteps, <strong>and</strong> s<strong>of</strong>tware/hardware bugs. Table 9 outlines<br />
these issues as a potentially useful guide for similar studies,<br />
<strong>and</strong> we describe them in more detail below.<br />
Board cooling: The A8 <strong>and</strong> A9 boards lack active cooling,<br />
<strong>and</strong> repeatedly rebooted due to over-heating while under test. A<br />
fan-based laptop cooling pad fixed the problem.<br />
Network over USB: The ssh connection to the A8 <strong>and</strong> A9<br />
boards used up to 20% <strong>of</strong> the CPU, which was unsuitable for<br />
performance benchmarking. We instead used a serial terminal<br />
to access these boards. The Atom board does not support USB<br />
networking; we used the Atom as a st<strong>and</strong>-alone terminal.<br />
Microprocessor PMU infrastructure: The performance<br />
counters on the <strong>ARM</strong> processor are poorly supported on<br />
community-supported boards. We backported over 150 TI<br />
patches to the Linux kernel to support performance counters <strong>and</strong><br />
PMU interrupts.<br />
Compilation: gcc works remarkably well as a cross-platform<br />
compiler for simple benchmarks like SPEC which relies on<br />
libc. However, for the <strong>ARM</strong> environment, the compiler <strong>of</strong>ten<br />
fails when compiling complex code bases that have not been rigorously<br />
tested on Linux, due to dependences on over 100 packages.<br />
Overcoming these linking errors is a tremendously tedious<br />
process. We either carefully choose equivalent highly portable<br />
workloads (e.g., lighttpd) or worked through the errors (e.g.,<br />
CLucene <strong>and</strong> WebKit).<br />
Tracing <strong>and</strong> debugging: <strong>ARM</strong> open-source tracing infrastructure<br />
is limited, <strong>and</strong> lacks dynamic binary translation tools<br />
like Pin or DynamoRIO. ptrace based approaches were too<br />
slow; QEMU correctly emulated, but its JIT obfuscated the instruction<br />
stream. We used gem5 for <strong>ARM</strong> traces; gem5 does not<br />
support all benchmarks (e.g., lighttpd).<br />
Performance<br />
Power<br />
Trade-<strong>of</strong>fs<br />
Table 9. Summary <strong>of</strong> Challenges.<br />
Challenge Description<br />
Board Cooling (<strong>ARM</strong>) No active cooling leading to failures<br />
Fix: use a fan-based laptop cooling pad<br />
Networking (<strong>ARM</strong>) ssh connection used up to 20% <strong>of</strong> CPU<br />
Fix: use a serial terminal<br />
Networking (Atom) USB networking not supported<br />
Fix: use as st<strong>and</strong>alone terminal<br />
Perf Counters (<strong>ARM</strong>) PMU poorly supported on selected boards<br />
Fix: backport over 150 TI patches<br />
Compilation (<strong>ARM</strong>) Failures due to dependences on > 100 packages<br />
Fix 1: pick portable equivalent (lighttpd)<br />
Fix 2: work through errors (CLucene & WebKit)<br />
Tracing (<strong>ARM</strong>) No dynamic binary emulation<br />
Fix: Use gem5 to generate instruction traces<br />
Table 10. Summary <strong>of</strong> Findings.<br />
# Finding Support Representative<br />
Data: A8/Atom<br />
1 Large performance gaps exist Fig-2 2× to 997×<br />
Cycle-count gaps are less than 2.5×<br />
2<br />
(A8 to Atom, A9 to i7)<br />
Fig-3 ≤ 2.5×<br />
<strong>x86</strong> CPI < <strong>ARM</strong> CPI:<br />
3<br />
<strong>x86</strong> ISA overheads hidden by µarch<br />
Fig-3 & 4<br />
A8: 3.4<br />
Atom: 2.2<br />
ISA performance effects indistinguishable Table-6<br />
4<br />
between <strong>x86</strong> <strong>and</strong> <strong>ARM</strong> Fig-5 & 6<br />
inst. mix same<br />
short <strong>x86</strong> insts<br />
µarchitecture, not the ISA, responsible<br />
5<br />
for performance differences<br />
Table-8<br />
324× Br MPKI<br />
4× L2-misses<br />
Beyond micro-op translation, <strong>x86</strong> ISA<br />
6<br />
introduces no overheads over <strong>ARM</strong> ISA<br />
Table-7<br />
<strong>x86</strong> implementations draw more power<br />
1<br />
than <strong>ARM</strong> implementations<br />
Fig-11<br />
Atom/A8 raw<br />
power: 3×<br />
Choice <strong>of</strong> power or perf. optimization<br />
2<br />
impacts power use more than ISA<br />
Fig-12<br />
Atom/A8 power<br />
@1 GHz: 0.6×<br />
Energy use primarily a design choice;<br />
3<br />
ISA’s impact insignificant<br />
Fig-13<br />
Atom/A8 raw<br />
energy: 0.8×<br />
1 High-perf processors require more power Fig-14 A8/A9: 1.8×<br />
than lower-performance processors i7/Atom: 10.9×<br />
It is the µ-architecture <strong>and</strong> design<br />
2<br />
methodology that really matters<br />
Fig-15<br />
ED: i7@2GHz
A version appears in the 19th IEEE Intl. Symposium on High Performance Computer Architecture (HPCA 2013) 13<br />
<strong>and</strong> Atom <strong>and</strong> is close to Atom’s. Further detailed analysis is<br />
required to determine how much the ISA <strong>and</strong> the microarchitecture<br />
structures for performance contribute to these differences.<br />
A related issue is the performance level for which our results<br />
hold. Considering very low performance processors, like<br />
the RISC ATmega324PA microcontroller with operating frequencies<br />
from 1 to 20 MHz <strong>and</strong> power consumption between<br />
2 <strong>and</strong> 50mW [3], the overheads <strong>of</strong> a CISC ISA (specifically the<br />
complete <strong>x86</strong> ISA) are clearly untenable. In similar domains,<br />
even <strong>ARM</strong>’s full ISA is too rich; the Cortex-M0, meant for low<br />
power embedded markets, includes only a 56 instruction subset<br />
<strong>of</strong> Thumb-2. Our study suggests that at performance levels in<br />
the range <strong>of</strong> A8 <strong>and</strong> higher, RISC/CISC is irrelevant for performance,<br />
power, <strong>and</strong> energy. Determining the lowest performance<br />
level at which the RISC/CISC ISA effects are irrelevant for all<br />
metrics is interesting future work.<br />
While our study shows that RISC <strong>and</strong> CISC ISA traits are<br />
irrelevant to power <strong>and</strong> performance characteristics <strong>of</strong> modern<br />
cores, ISAs continue to evolve to better support exposing<br />
workload-specific semantic information to the execution substrate.<br />
On <strong>x86</strong>, such changes include the transition to Intel64<br />
(larger word sizes, optimized calling conventions <strong>and</strong> shared<br />
code support), wider vector extensions like AVX, integer crypto<br />
<strong>and</strong> security extensions (NX), hardware virtualization extensions<br />
<strong>and</strong>, more recently, architectural support for transactions<br />
in the form <strong>of</strong> HLE. Similarly, the <strong>ARM</strong> ISA has introduced<br />
shorter fixed length instructions for low power targets (Thumb),<br />
vector extensions (NEON), DSP <strong>and</strong> bytecode execution extensions<br />
(Jazelle DBX), Trustzone security, <strong>and</strong> hardware virtualization<br />
support. Thus, while ISA evolution has been continuous,<br />
it has focused on enabling specialization <strong>and</strong> has been largely<br />
agnostic <strong>of</strong> RISC or CISC. Other examples from recent research<br />
include extensions to allow the hardware to balance accuracy<br />
<strong>and</strong> reliability with energy efficiency [15, 13] <strong>and</strong> extensions to<br />
use specialized hardware for energy efficiency [18].<br />
It appears decades <strong>of</strong> hardware <strong>and</strong> compiler research has<br />
enabled efficient h<strong>and</strong>ling <strong>of</strong> both RISC <strong>and</strong> CISC ISAs <strong>and</strong><br />
both are equally positioned for the coming years <strong>of</strong> energyconstrained<br />
innovation.<br />
Acknowledgments<br />
We thank the anonymous reviewers, the Vertical group, <strong>and</strong><br />
the PARSA group for comments. Thanks to Doug Burger, Mark<br />
Hill, Guri Sohi, David Wood, Mike Swift, Greg Wright, Jichuan<br />
Chang, <strong>and</strong> Brad Beckmann for comments on the paper <strong>and</strong><br />
thought-provoking discussions on ISA impact. Thanks for various<br />
comments on the paper <strong>and</strong> valuable input on ISA evolution<br />
<strong>and</strong> area/cost overheads <strong>of</strong> implementing CISC ISAs provided<br />
by David Patterson. Support for this research was provided by<br />
NSF grants CCF-0845751, CCF-0917238, <strong>and</strong> CNS-0917213,<br />
<strong>and</strong> the Cisco Systems Distinguished Graduate Fellowship.<br />
References<br />
[1] <strong>ARM</strong> on Ubuntu 12.04 LTS battling Intel <strong>x86</strong>? http:<br />
//www.phoronix.com/scan.php?page=article&item=<br />
ubuntu_1204_armfeb&num=1.<br />
[2] The <strong>ARM</strong> vs <strong>x86</strong> wars have begun: In-depth power analysis<br />
<strong>of</strong> Atom, Krait & Cortex A15 http://www.an<strong>and</strong>tech.com/<br />
show/6536/arm-vs-<strong>x86</strong>-the-real-showdown/.<br />
[3] Atmel Datasheet, http://www.atmel.com/Images/<br />
doc2503.pdf.<br />
[4] chip-architect, http://www.chip-architect.com/news/<br />
AMD_Ontario_Bobcat_vs_Intel_Pineview_Atom.jpg.<br />
[5] M. Baron. The single-chip cloud computer. Microprocessor Report,<br />
April 2010.<br />
[6] D. Bh<strong>and</strong>arkar. RISC versus CISC: a tale <strong>of</strong> two chips. SIGARCH<br />
Comp. Arch. News, 25(1):1–12, Mar. 1997.<br />
[7] D. Bh<strong>and</strong>arkar <strong>and</strong> D. W. Clark. Performance from architecture:<br />
comparing a RISC <strong>and</strong> a CISC with similar hardware organization.<br />
In ASPLOS ’91.<br />
[8] N. Binkert, B. Beckmann, G. Black, S. Reinhardt, A. Saidi,<br />
A. Basu, J. Hestness, D. Hower, T. Krishna, S. Sardashti, R. Sen,<br />
K. Sewell, M. Shoaib, N. Vaish, M. Hill, <strong>and</strong> D. Wood. The gem5<br />
simulator. SIGARCH Comp. Arch. News, 39(2), Aug. 2011.<br />
[9] W. L. Bircher <strong>and</strong> L. K. John. <strong>Analysis</strong> <strong>of</strong> dynamic power management<br />
on multi-core processors. In ICS ’08.<br />
[10] E. Blem, J. Menon, <strong>and</strong> K. Sankaralingam. Data to accompany<br />
a detailed analysis <strong>of</strong> contemporary arm <strong>and</strong> <strong>x86</strong> architectures,<br />
www.cs.wisc.edu/vertical/isa-power-struggles, 2013.<br />
[11] D. Bruening, T. Garnett, <strong>and</strong> S. Amarasinghe. An infrastructure<br />
for adaptive dynamic optimization. In CGO ’03.<br />
[12] R. Colwell, C. Y. Hitchcock, III, E. Jensen, H. Brinkley Sprunt,<br />
<strong>and</strong> C. Kollar. Instruction sets <strong>and</strong> beyond: Computers, complexity,<br />
<strong>and</strong> controversy. Computer, 18(9):8–19, Sept. 1985.<br />
[13] M. de Kruijf, S. Nomura, <strong>and</strong> K. Sankaralingam. Relax: An architectural<br />
framework for s<strong>of</strong>tware recovery <strong>of</strong> hardware faults.<br />
In ISCA ’10.<br />
[14] H. Esmaeilzadeh, T. Cao, Y. Xi, S. Blackburn, <strong>and</strong> K. McKinley.<br />
Looking back on the language <strong>and</strong> hardware revolutions: measured<br />
power, performance, <strong>and</strong> scaling. In ASPLOS ’11.<br />
[15] H. Esmaeilzadeh, A. Sampson, L. Ceze, <strong>and</strong> D. Burger. Architecture<br />
support for disciplined approximate programming. In AS-<br />
PLOS ’12.<br />
[16] M. Ferdman, A. Adileh, O. Kocberber, S. Volos, M. Alisafaee,<br />
D. Jevdjic, C. Kaynak, A. D. Popescu, A. Ailamaki, <strong>and</strong> B. Falsafi.<br />
Clearing the clouds: a study <strong>of</strong> emerging scale-out workloads<br />
on modern hardware. In ASPLOS ’12.<br />
[17] M. J. Flynn, C. L. Mitchell, <strong>and</strong> J. M. Mulder. And now a case<br />
for more complex instruction sets. Computer, 20(9), 1987.<br />
[18] V. Govindaraju, C.-H. Ho, <strong>and</strong> K. Sankaralingam. Dynamically<br />
specialized datapaths for energy efficient computing. In HPCA<br />
’11.<br />
[19] A. Gutierrez, R. G. Dreslinski, T. F. Wenisch, T. Mudge, A. Saidi,<br />
C. Emmons, <strong>and</strong> N. Paver. Full-system analysis <strong>and</strong> characterization<br />
<strong>of</strong> interactive smartphone applications. In IISWC ’11.<br />
[20] K. Hoste <strong>and</strong> L. Eeckhout. Microarchitecture-independent workload<br />
characterization. Micro, IEEE, 27(3):63 –72, 2007.<br />
[21] C. Isci <strong>and</strong> M. Martonosi. Runtime power monitoring in high-end<br />
processors: Methodology <strong>and</strong> empirical data. In MICRO ’03.<br />
[22] C. Isen, L. John, <strong>and</strong> E. John. A tale <strong>of</strong> two processors: Revisiting<br />
the RISC-CISC debate. In 2009 SPEC Benchmark Workshop.<br />
[23] C. Kim, T. Kaldewey, V. W. Lee, E. Sedlar, A. D. Nguyen,<br />
N. Satish, J. Chhugani, A. Di Blas, <strong>and</strong> P. Dubey. Sort vs. Hash<br />
revisited: fast join implementation on modern multi-core CPUs.<br />
VLDB ’09.<br />
[24] D. A. Patterson <strong>and</strong> D. R. Ditzel. The case for the reduced instruction<br />
set computer. SIGARCH Comp. Arch. News, 8(6), 1980.<br />
[25] G. Quirk. Improved <strong>ARM</strong> core, other changes in TI mobile<br />
app processor, http://www.cs.virginia.edu/~skadron/<br />
cs8535_s11/arm_cortex.pdf.<br />
[26] J. Rao <strong>and</strong> K. A. Ross. Making B+- trees cache conscious in main<br />
memory. In SIGMOD ’00.<br />
[27] W. Wang <strong>and</strong> T. Dey. http://www.cs.virginia.edu/<br />
~skadron/cs8535_s11/<strong>ARM</strong>_Cortex.pdf.
A version appears in the 19th IEEE Intl. Symposium on High Performance Computer Architecture (HPCA 2013) 14<br />
Appendices<br />
All raw data mentioned below can be found in the attached to this document (right click on link to save).<br />
Appendix I: <strong>Detailed</strong> Counts<br />
Data: Figure 16 shows execution time normalized to i7. The raw data for this figure is in the Time worksheet <strong>of</strong> our publicly<br />
released spreadsheet [10].<br />
Time<br />
35<br />
30<br />
25<br />
20<br />
15<br />
10<br />
5<br />
0<br />
363 130 40 54 54 75 86 142 213 72<br />
997 344<br />
coremark<br />
wk_layout<br />
wk_perf<br />
mean<br />
A8 Atom<br />
astar<br />
libquantum<br />
hmmer<br />
h264<br />
gobmk<br />
bzip2<br />
sjeng<br />
gcc<br />
perlbench<br />
omnetpp<br />
mean<br />
(a) In-Order<br />
soplex<br />
GemsFDTD<br />
calculix<br />
povray<br />
tonto<br />
namd<br />
leslie3D<br />
milc<br />
cactusADM<br />
bwaves<br />
mean<br />
lucene<br />
db_kernels<br />
lighttpd<br />
mean<br />
Time<br />
35<br />
30<br />
25<br />
20<br />
15<br />
10<br />
5<br />
0<br />
wk_perf<br />
wk_layout<br />
coremark<br />
mean<br />
A9 i7<br />
astar<br />
hmmer<br />
libquantum<br />
gobmk<br />
sjeng<br />
gcc<br />
Figure 16. Execution Time Normalized to i7.<br />
perlbench<br />
h264<br />
bzip2<br />
omnetpp<br />
mean<br />
(b) Out-<strong>of</strong>-Order<br />
102<br />
soplex<br />
GemsFDTD<br />
calculix<br />
namd<br />
povray<br />
tonto<br />
cactusADM<br />
milc<br />
leslie3D<br />
bwaves<br />
mean<br />
Data: Figure 17a shows dynamic instruction (macro) counts on A8 <strong>and</strong> Atom normalized to Atom <strong>x86</strong> macro-instructions. The<br />
raw data for this figure is in the Macro-ops worksheet <strong>of</strong> our publicly released spreadsheet [10].<br />
Data: Figure 17b shows dynamic micro-op counts for Atom <strong>and</strong> i7 normalized to Atom macro-instructions 12 . The raw data for<br />
this figure is in the Micro-ops worksheet <strong>of</strong> our publicly released spreadsheet [10]. Note: for icc results, preprocessor directives<br />
changed so that gcc <strong>and</strong> icc use the same alignment <strong>and</strong> compiler hints.<br />
Macro-Ops<br />
3.5<br />
3.0<br />
2.5<br />
2.0<br />
1.5<br />
1.0<br />
0.5<br />
0.0<br />
wk_perf<br />
wk_layout<br />
coremark<br />
mean<br />
<strong>ARM</strong> <strong>x86</strong><br />
astar<br />
hmmer<br />
libquantum<br />
gobmk<br />
sjeng<br />
gcc<br />
perlbench<br />
h264<br />
bzip2<br />
omnetpp<br />
mean<br />
(a) In-Order<br />
4.7 17<br />
soplex<br />
GemsFDTD<br />
calculix<br />
namd<br />
povray<br />
tonto<br />
cactusADM<br />
milc<br />
leslie3D<br />
bwaves<br />
mean<br />
lucene<br />
lighttpd<br />
db_kernels<br />
mean<br />
Micro-Ops<br />
3.5<br />
3.0<br />
2.5<br />
2.0<br />
1.5<br />
1.0<br />
0.5<br />
0.0<br />
wk_perf<br />
wk_layout<br />
coremark<br />
mean<br />
Atom i7<br />
astar<br />
hmmer<br />
libquantum<br />
gobmk<br />
sjeng<br />
gcc<br />
perlbench<br />
h264<br />
bzip2<br />
omnetpp<br />
mean<br />
(b) Out-<strong>of</strong>-Order<br />
Figure 17. Instruction Counts Normalized to i7 macro-ops.<br />
soplex<br />
GemsFDTD<br />
calculix<br />
namd<br />
povray<br />
tonto<br />
cactusADM<br />
milc<br />
leslie3D<br />
bwaves<br />
mean<br />
Data: Table 11 shows CPIs. This data is also in the CPI worksheet <strong>of</strong> our publicly released spreadsheet [10].<br />
Table 11. Cycles per Instruction (CPI) Per Benchmark.<br />
Mobile SPEC INT SPEC FP Server<br />
coremark<br />
wk - layout<br />
wk - perf<br />
astar<br />
libquantum<br />
hmmer<br />
h264<br />
gobmk<br />
bzip2<br />
sjeng<br />
gcc<br />
perlbench<br />
omnetpp<br />
soplex<br />
GemsFDTD<br />
calculix<br />
povray<br />
tonto<br />
namd<br />
leslie3D<br />
milc<br />
cactusADM<br />
<strong>ARM</strong> 0.02 1.3 1.3 0.6 0.6 0.9 1.7 2.1 0.5 0.6 3.9 1.9 2.0 1.4 1.3 2.7 2.0 4.8 0.9 0.9 0.7 1.7 0.8 0.4 0.47 0.1<br />
<strong>x86</strong> 0.02 1.4 1.4 0.7 0.7 0.9 1.5 2.1 0.7 0.7 4.1 1.7 1.7 1.5 1.3 2.6 1.8 5.2 0.9 0.9 0.7 1.5 0.8 1.0 0.6 0.2<br />
12 For i7, we use issued micro-ops instead <strong>of</strong> retired micro-ops; we found that on average, this does not impact the micro-op/macro-op ratio.<br />
bwaves<br />
lucene<br />
db kernel<br />
lucene<br />
lighttpd<br />
db_kernels<br />
mean<br />
lighttpd<br />
lucene<br />
lighttpd<br />
db_kernels<br />
mean
A version appears in the 19th IEEE Intl. Symposium on High Performance Computer Architecture (HPCA 2013) 15<br />
Data: Table 12a shows average <strong>ARM</strong> <strong>and</strong> <strong>x86</strong> static binary sizes, measuring only the binary’s instruction segment. Note that<br />
bwaves fails to run due incorrect code produced by ifort. This data is also in the Code Size worksheet <strong>of</strong> our publicly released<br />
spreadsheet [10].<br />
Data: Table 12b shows average dynamic <strong>ARM</strong> <strong>and</strong> <strong>x86</strong> instruction lengths. This data is also in the Inst Length worksheet <strong>of</strong> our<br />
publicly released spreadsheet [10].<br />
Table 12. Instruction Size Details: (a) Static Binary (MB), (b) Average Dynamic Instruction (B).<br />
Mobile SPEC INT SPEC FP Server<br />
Bin<br />
Inst<br />
coremark<br />
wk - layout<br />
wk - perf<br />
astar<br />
libquantum<br />
hmmer<br />
h264<br />
gobmk<br />
bzip2<br />
sjeng<br />
gcc<br />
perlbench<br />
omnetpp<br />
soplex<br />
GemsFDTD<br />
calculix<br />
povray<br />
tonto<br />
namd<br />
leslie3D<br />
milc<br />
cactusADM<br />
<strong>ARM</strong> 0.02 1.3 1.3 0.6 0.6 0.9 1.7 2.1 0.5 0.6 3.9 1.9 2.0 1.4 1.3 2.7 2.0 4.8 0.9 0.9 0.7 1.7 0.8 0.4 0.47 0.1<br />
<strong>x86</strong> - gcc 0.02 1.4 1.4 0.7 0.7 0.9 1.5 2.1 0.7 0.7 4.1 1.7 1.7 1.5 1.3 2.6 1.8 5.2 0.9 0.9 0.7 1.5 0.8 1.0 0.6 0.2<br />
<strong>x86</strong> - icc 0.6 1.5 1.5 0.7 0.7 1.0 1.3 2.2 0.7 0.8 4.3 1.9 2.2 1.5 1.7 3.1 2.2 6.8 1.0 1.4 0.8 2.0 — 1.4 1.8 0.2<br />
<strong>ARM</strong> 4.0 4.0 4.0 4.0 4.0 4.0 4.0 4.0 4.0 4.0 4.0 4.0 4.0 4.0 4.0 4.0 4.0 4.0 4.0 4.0 4.0 4.0 4.0 4.0 4.0 4.0<br />
<strong>x86</strong> - gcc 2.4 3.7 3.7 2.9 3.0 3.0 3.5 3.1 3.6 3.5 2.8 2.9 2.7 2.7 3.4 2.9 2.6 3.4 3.3 4.1 2.6 6.4 3.0 3.7 2.6 3.7<br />
<strong>x86</strong> - icc 2.5 3.2 3.2 3.2 2.9 3.6 3.3 3.3 3.4 3.6 2.9 3.2 2.8 3.1 3.6 3.3 3.5 4.2 4.9 5.0 4.1 6.1 — 2.7 2.7 2.8<br />
Data: Figure 18 shows average power normalized to the A8. The raw data for this figure is in the Avg Power worksheet <strong>of</strong> our<br />
publicly released spreadsheet [10].<br />
Average Power<br />
40<br />
35<br />
30<br />
25<br />
20<br />
15<br />
10<br />
5<br />
0<br />
coremark<br />
wk_layout<br />
wk_perf<br />
mean<br />
A8 Atom<br />
astar<br />
libquantum<br />
hmmer<br />
h264<br />
gobmk<br />
bzip2<br />
sjeng<br />
gcc<br />
perlbench<br />
omnetpp<br />
mean<br />
(a) In-Order<br />
soplex<br />
GemsFDTD<br />
calculix<br />
povray<br />
tonto<br />
namd<br />
leslie3D<br />
milc<br />
cactusADM<br />
bwaves<br />
mean<br />
lucene<br />
db_kernels<br />
lighttpd<br />
mean<br />
Average Power<br />
40<br />
35<br />
30<br />
25<br />
20<br />
15<br />
10<br />
5<br />
0<br />
wk_perf<br />
wk_layout<br />
coremark<br />
mean<br />
A9 i7<br />
astar<br />
hmmer<br />
libquantum<br />
gobmk<br />
sjeng<br />
gcc<br />
perlbench<br />
h264<br />
bzip2<br />
omnetpp<br />
mean<br />
(b) Our-<strong>of</strong>-Order<br />
Figure 18. Average Power Normalized to A8.<br />
bwaves<br />
lucene<br />
soplex<br />
GemsFDTD<br />
calculix<br />
namd<br />
povray<br />
tonto<br />
cactusADM<br />
milc<br />
leslie3D<br />
bwaves<br />
mean<br />
Data: Figure 19 shows technology-independent average power–cores are scaled to 1 GHz at 45 nm (normalized to A8). The raw<br />
data for this figure is in the Avg TI Power worksheet <strong>of</strong> our publicly released spreadsheet [10].<br />
Average Power<br />
10<br />
8<br />
6<br />
4<br />
2<br />
0<br />
coremark<br />
wk_layout<br />
wk_perf<br />
mean<br />
A8 Atom<br />
astar<br />
libquantum<br />
hmmer<br />
h264<br />
gobmk<br />
bzip2<br />
sjeng<br />
gcc<br />
perlbench<br />
omnetpp<br />
mean<br />
soplex<br />
GemsFDTD<br />
calculix<br />
povray<br />
tonto<br />
namd<br />
leslie3D<br />
milc<br />
cactusADM<br />
bwaves<br />
mean<br />
lucene<br />
db_kernels<br />
lighttpd<br />
mean<br />
Average Power<br />
wk_perf<br />
wk_layout<br />
coremark<br />
mean<br />
astar<br />
hmmer<br />
libquantum<br />
gobmk<br />
sjeng<br />
gcc<br />
perlbench<br />
h264<br />
bzip2<br />
omnetpp<br />
mean<br />
(a) In-Order<br />
(b) Out-<strong>of</strong>-Order<br />
Figure 19. Technology Independent Average Power Normalized to A8.<br />
10<br />
8<br />
6<br />
4<br />
2<br />
0<br />
A9 i7<br />
soplex<br />
GemsFDTD<br />
calculix<br />
namd<br />
povray<br />
tonto<br />
cactusADM<br />
milc<br />
leslie3D<br />
bwaves<br />
mean<br />
db kernel<br />
lighttpd<br />
lucene<br />
lighttpd<br />
db_kernels<br />
mean<br />
lucene<br />
lighttpd<br />
db_kernels<br />
mean
A version appears in the 19th IEEE Intl. Symposium on High Performance Computer Architecture (HPCA 2013) 16<br />
Data: Figure 20 shows raw energy (power <strong>and</strong> time). The raw data for this figure is in the Energy worksheet <strong>of</strong> our publicly<br />
released spreadsheet [10].<br />
Energy (J)<br />
4.0<br />
3.5<br />
3.0<br />
2.5<br />
2.0<br />
1.5<br />
1.0<br />
0.5<br />
0.0<br />
coremark<br />
wk_layout<br />
wk_perf<br />
mean<br />
A8 Atom<br />
astar<br />
libquantum<br />
hmmer<br />
h264<br />
gobmk<br />
bzip2<br />
sjeng<br />
gcc<br />
perlbench<br />
omnetpp<br />
mean<br />
(a) In-Order<br />
soplex<br />
GemsFDTD<br />
calculix<br />
povray<br />
tonto<br />
namd<br />
leslie3D<br />
milc<br />
cactusADM<br />
bwaves<br />
mean<br />
lucene<br />
db_kernels<br />
lighttpd<br />
mean<br />
Energy (J)<br />
4.0<br />
3.5<br />
3.0<br />
2.5<br />
2.0<br />
1.5<br />
1.0<br />
0.5<br />
0.0<br />
wk_perf<br />
wk_layout<br />
coremark<br />
mean<br />
astar<br />
hmmer<br />
libquantum<br />
gobmk<br />
sjeng<br />
gcc<br />
Figure 20. Energy Normalized to A8.<br />
A9 i7<br />
perlbench<br />
h264<br />
bzip2<br />
omnetpp<br />
mean<br />
(b) Out-<strong>of</strong>-Order<br />
soplex<br />
GemsFDTD<br />
calculix<br />
namd<br />
povray<br />
tonto<br />
cactusADM<br />
milc<br />
leslie3D<br />
bwaves<br />
mean<br />
Appendix II: <strong>Detailed</strong> bwaves <strong>Analysis</strong><br />
As noted in Section 5, the bwaves benchmark performed significantly worse (up to 30× more cycles) on <strong>ARM</strong> cores than on <strong>x86</strong><br />
cores. Contributing to this gap, we found that <strong>ARM</strong> cores executed 17.5× more instructions than <strong>x86</strong> cores. We believe that most<br />
<strong>of</strong> the <strong>ARM</strong> to <strong>x86</strong> gap for bwaves can be explained by this large differences in the number <strong>of</strong> instructions required to complete the<br />
same amount <strong>of</strong> work.<br />
We performed detailed analysis to find the source <strong>of</strong> the instruction count discrepancies. To begin, we found from the execution<br />
pr<strong>of</strong>ile that complex double floating point operations which the compiler translates to longer instruction sequences for <strong>ARM</strong> than for<br />
<strong>x86</strong> are a significant source <strong>of</strong> additional instructions: 37% <strong>of</strong> all cycles for <strong>ARM</strong> cores are spent in aeabi dadd <strong>and</strong> 29% <strong>of</strong> all<br />
cycles are spent in aeabi dmul, while neither <strong>of</strong> these routines appear in the <strong>x86</strong> summary).<br />
We use flags to force gcc to compile floating point instructions to SSE 2 (<strong>x86</strong>) <strong>and</strong> NEON (<strong>ARM</strong>) instructions. This decision is the<br />
most fair in general, since <strong>ARM</strong>’s VFP unit is known to be significantly slower than the NEON unit for single precision floating point<br />
operations. However, unlike the VFP unit, the NEON unit is not IEEE754 compliant, <strong>and</strong> double precision operations are mapped to<br />
library calls. The result is that for <strong>ARM</strong> architectures, gcc—in the absence <strong>of</strong> FP relaxation—compiles double-precision floating point<br />
arithmetic to library calls which add significant overhead compared to short instruction sequences on <strong>x86</strong>. One solution to bwave’s<br />
outlier status would be to use different compiler flags for benchmarks with significant amounts <strong>of</strong> double precision arithmetic.<br />
lucene<br />
lighttpd<br />
db_kernels<br />
mean
A version appears in the 19th IEEE Intl. Symposium on High Performance Computer Architecture (HPCA 2013) 17<br />
Appendix III: Synthetic Points<br />
A15: Using reported Coremark scores (Coremarks/MHz) <strong>and</strong> mW/MHz from Microprocessor Reports <strong>and</strong> <strong>ARM</strong> documentation, we<br />
assume a 2GHz operating frequency <strong>and</strong> compute the Coremark score <strong>and</strong> energy. We then scale A9 BIPS results by the ratio <strong>of</strong> the<br />
A15 Coremark score to the A9 Coremark score to get an A15 performance projection.<br />
Frequency scaled cores: For frequency scaled cores, we project performance by assuming a linear relationship between performance<br />
<strong>and</strong> frequency. We scale energy projections as detailed in the Technology scaling <strong>and</strong> projections paragraph <strong>of</strong> Section 3.4.<br />
Appendix IV: ED x <strong>Analysis</strong><br />
Data: Figure 21 shows the impact <strong>of</strong> the exponent x on the product ED x . Note that a lower product is better. When x is greater than<br />
1.4, i7 outperforms all other cores.<br />
Product (ED x )<br />
10 0<br />
10 1<br />
10 2<br />
10 3<br />
10 4<br />
10 5<br />
10 6<br />
10 7<br />
10 8<br />
10 9<br />
10 10<br />
10 11<br />
10 12<br />
2 -1<br />
2 0<br />
A8<br />
A9<br />
Exponent (x)<br />
Atom<br />
i7<br />
Figure 21. Impact <strong>of</strong> exponent, x, on product ED x .<br />
2 1<br />
A15<br />
i7 @ 2GHz<br />
2 2