Growth and sexual size dimorphism in Alberta populations of the ...
Growth and sexual size dimorphism in Alberta populations of the ...
Growth and sexual size dimorphism in Alberta populations of the ...

Create successful ePaper yourself
Turn your PDF publications into a flip-book with our unique Google optimized e-Paper software.
<strong>Growth</strong> <strong>and</strong> <strong>sexual</strong> <strong>size</strong> <strong>dimorphism</strong> <strong>in</strong> <strong>Alberta</strong> <strong>populations</strong> <strong>of</strong> <strong>the</strong> eastern<br />
short-horned lizard, Phrynosoma douglassi brevirostre<br />
G. LAwRENcE PowELL AND ANTHONY P. RussELL<br />
Department <strong>of</strong> Biology, University <strong>of</strong> Calgary, 2500 Universi~’ Drive NW., Calgary, Alta., Canada T2N 1N4<br />
Received February 13, 1984<br />
PowELL, G. L., <strong>and</strong> A. P. RuSSELL. 1985. <strong>Growth</strong> <strong>and</strong> <strong>sexual</strong> <strong>size</strong> <strong>dimorphism</strong> <strong>in</strong> <strong>Alberta</strong> <strong>populations</strong> <strong>of</strong> <strong>the</strong> eastern<br />
short-horned lizard, Phrvnosoma douglassi brevirostre. Can. J. Zool. 63: 139—154.<br />
<strong>Alberta</strong> <strong>populations</strong> <strong>of</strong> Phrynosoma douglassi brevirostre display marked <strong>sexual</strong> <strong>size</strong> <strong>dimorphism</strong>, adult females be<strong>in</strong>g<br />
considerably larger than adult males. Discrim<strong>in</strong>ant analyses <strong>of</strong> whole mensural characters <strong>and</strong> <strong>of</strong> scaled mensural characters<br />
<strong>in</strong>dicate that this <strong>dimorphism</strong> is present from birth, although it is more strongly expressed after <strong>sexual</strong> maturity. Recapture data<br />
were used to generate modified logistic by weight growth models for snout—vent length (SVL), <strong>and</strong> allometric models for each<br />
sex were generated for growth <strong>in</strong> tail length, head length. <strong>and</strong> head width. The SVL growth model for females <strong>in</strong>dicates delayed<br />
maturity lead<strong>in</strong>g to greater adult <strong>size</strong>, an expected feature <strong>of</strong> a female vivipar<strong>in</strong>e. The SVL growth model for males <strong>in</strong>dicates<br />
that growth ceases sooner than <strong>in</strong> females, result<strong>in</strong>g <strong>in</strong> a smaller adult <strong>size</strong>. This is possibly a result <strong>of</strong> male dispersal<br />
competition, an hypo<strong>the</strong>sis fur<strong>the</strong>r borne out by <strong>the</strong> results <strong>of</strong> a prelim<strong>in</strong>ary analysis <strong>of</strong> mobility <strong>in</strong> <strong>the</strong> two sexes, <strong>and</strong> may<br />
also be <strong>in</strong>fluenced by <strong>in</strong>ter<strong>sexual</strong> dietary competition. Differences <strong>in</strong> head dimensions between <strong>the</strong> sexes are a function <strong>of</strong> <strong>the</strong><br />
differences <strong>in</strong> SVL at adulthood, but <strong>the</strong>re is a significant <strong>sexual</strong> difference <strong>in</strong> <strong>the</strong> allometric relationship <strong>of</strong> tail length to SVL.<br />
No difference <strong>in</strong> <strong>the</strong> growth patterns <strong>and</strong> adult <strong>size</strong> <strong>of</strong> ei<strong>the</strong>r sex was found to exist over <strong>the</strong> range <strong>in</strong> <strong>Alberta</strong>.<br />
PowELL, G. L.. etA. P. RuSSELL. 1985. <strong>Growth</strong> <strong>and</strong> <strong>sexual</strong> <strong>size</strong> <strong>dimorphism</strong> <strong>in</strong> <strong>Alberta</strong> <strong>populations</strong> <strong>of</strong> <strong>the</strong> eastern short-horned<br />
lizard, PhG’nosoma douglassi brevirostre. Can. J. Zool. 63: 139—154.<br />
Les <strong>populations</strong> de Phrynosoma douglassi brevirostre d’<strong>Alberta</strong> se caractérisent par un <strong>dimorphism</strong>e sexuel important quant<br />
a Ia taille et les femelles adultes sont beaucoup plus grosses que les males. Des analyses discrim<strong>in</strong>antes des mesures dans leur<br />
ensemble et des mesures considérées par classes <strong>in</strong>diquent que le <strong>dimorphism</strong>e est déjà present a Ia naissance et qu’il se precise<br />
surtout après Ia maturation sexuelle. Des données sur Ia recapture ant servi a construire des modèles de croissance logistiques<br />
modifies, en fonction de Ia masse, de Ia longueur du museau a l’anus (SVL) et des modèles allometriques de croissance de<br />
Ia longueur de Ia queue, de Ia longueur de Ia tête et de Ia largeur de Ia tête, pour chacun des sexes. Le modèle de croissance<br />
SVL des femelles <strong>in</strong>dique que Ia maturité est retardée, cc qui permet aux femelles adultes d’atte<strong>in</strong>dre une plus gr<strong>and</strong>e taille,<br />
caractéristique qui n’a rien de surprenant chez une femelle vivipare. Le modèle de croissance SVL des males <strong>in</strong>dique que Ia<br />
croissance des males cesse avant celle des femelles, d’oü leur plus petite taille. Ces phénomènes sont peut-être causes par Ia<br />
competition entre les males au moment de Ia dispersion, une hypo<strong>the</strong>se corroborée par les résultats d’une analyse prélim<strong>in</strong>aire<br />
de Ia mobilité chez les deux sexes; Ia competition alimentaire entre les males et les femelles peut aussi jouer un role. Les<br />
differences entre males et femelles quant aux dimensions de Ia tête sont fonction des differences de longueurs SVL a l’âge<br />
adulte, mais il y a <strong>dimorphism</strong>e sexuel significatif dans Ia relation allometrique entre Ia longueur de Ia queue et Ia longueur<br />
SVL. II n’y a pas de differences dans les courbes de croissance ou Ia taille des adultes chez l’un ou l’autre des sexes chez les<br />
<strong>populations</strong> d’<strong>Alberta</strong>.<br />
[Traduit par Ic journal]<br />
Introduction<br />
The <strong>Alberta</strong> <strong>populations</strong> <strong>of</strong> Phiynosoma douglassi brevi<br />
rostre are range marg<strong>in</strong>al <strong>in</strong> <strong>the</strong>ir distribution <strong>and</strong> are markedly<br />
<strong>sexual</strong>ly dimorphic (Powell <strong>and</strong> Russell 1984). In <strong>the</strong> context<br />
<strong>of</strong> this, growth parameters were exam<strong>in</strong>ed for each sex to ga<strong>in</strong><br />
a better underst<strong>and</strong><strong>in</strong>g <strong>of</strong> <strong>the</strong> ma<strong>in</strong>tenance <strong>of</strong> <strong>the</strong> observed<br />
<strong>dimorphism</strong> <strong>and</strong> to <strong>in</strong>vestigate whe<strong>the</strong>r both sexes grow at <strong>the</strong><br />
same or at different rates. Thus, <strong>the</strong> primary objective <strong>of</strong> this<br />
study was to accrue mensural data from a sufficient sample <strong>of</strong><br />
recaptures from <strong>Alberta</strong> to be able to generate quantified<br />
growth models for both sexes. These data were also used to test<br />
whe<strong>the</strong>r <strong>the</strong>re were significant differences <strong>in</strong> adult <strong>size</strong> <strong>and</strong><br />
growth pattern between <strong>populations</strong> over <strong>the</strong> range <strong>in</strong> <strong>Alberta</strong>.<br />
The secondary objective, employ<strong>in</strong>g <strong>the</strong> mensural data base<br />
outl<strong>in</strong>ed above, was to attempt to formulate discrim<strong>in</strong>ant func<br />
tions that enable itidividuals to be classified to sex, to def<strong>in</strong>e <strong>the</strong><br />
observed <strong>sexual</strong> <strong>size</strong> <strong>dimorphism</strong> <strong>in</strong> an ontogenetic context.<br />
The tertiary objective was to utilize <strong>the</strong> data collected <strong>in</strong> this<br />
study to exam<strong>in</strong>e <strong>the</strong> hypo<strong>the</strong>sis that <strong>the</strong> <strong>sexual</strong> <strong>size</strong> dimor<br />
phism displayed by <strong>the</strong>se <strong>populations</strong> is produced <strong>and</strong> ma<strong>in</strong><br />
ta<strong>in</strong>ed by differ<strong>in</strong>g <strong>sexual</strong> selection pressures on <strong>the</strong> two sexes<br />
associated with mat<strong>in</strong>g strategy <strong>and</strong> parental <strong>in</strong>vestment.<br />
As a biological process, growth is amenable to ma<strong>the</strong>matical<br />
modell<strong>in</strong>g <strong>and</strong> a number <strong>of</strong> widely applicable growth models<br />
have been outl<strong>in</strong>ed (Ricklefs 1967; Turner, Bradley et al. 1976;<br />
Fitzhugh 1976; Dunham 1978; Schoener <strong>and</strong> Schoener 1978;<br />
Kaufmann 1981). In <strong>the</strong> context <strong>of</strong> growth <strong>in</strong> reptiles, <strong>the</strong>se<br />
have been reviewed by Andrews (1982) <strong>and</strong> it can be demon<br />
strated that <strong>the</strong>y all share a unity <strong>of</strong> ma<strong>the</strong>matical form, with<br />
<strong>the</strong> major types be<strong>in</strong>g recognizable as special cases <strong>of</strong> one<br />
“generic growth model.” The basic postulates <strong>of</strong> this have been<br />
outl<strong>in</strong>ed by Turner, Bradley et a!. (1976).<br />
For iguanid lizards a variety <strong>of</strong> modell<strong>in</strong>g methods have been<br />
applied to <strong>the</strong> study <strong>of</strong> growth. Notable among <strong>the</strong>se have been<br />
<strong>the</strong> approaches <strong>of</strong> Turner, Medica et a!. (1976), who <strong>in</strong>cluded<br />
<strong>in</strong>crease <strong>in</strong> weight as part <strong>of</strong> a computer simulation <strong>of</strong> popu<br />
lation energetics <strong>of</strong> Uta stansburiana; Andrews (1976), who<br />
employed Ricklef’s (1967) method <strong>of</strong> apply<strong>in</strong>g <strong>the</strong> logistic<br />
growth model <strong>in</strong> <strong>in</strong>traspecific comparisons <strong>of</strong> Anolis growth<br />
rates; <strong>and</strong> Van Devender (1978), who compared growth rates<br />
between <strong>populations</strong> <strong>of</strong> Basiliscus basiliscus by fitt<strong>in</strong>g his data<br />
to <strong>the</strong> Von Bertalanffy model. The most rigorous assessments<br />
<strong>of</strong> modell<strong>in</strong>g as applied to lizard growth, however, have been<br />
those <strong>of</strong> Dunham (1978) <strong>and</strong> Schoener <strong>and</strong> Schoener (1978).<br />
The latter authors concluded that <strong>the</strong> logistic by weight model,<br />
as modified for length, best def<strong>in</strong>ed growth <strong>in</strong> Anolis; Dunham<br />
(1978) arrived at <strong>the</strong> same decision for Urosaurus ornatus <strong>and</strong><br />
Sceloporus merriami. It is essentially this model that has been<br />
adopted <strong>in</strong> this study.<br />
Beh<strong>in</strong>d <strong>the</strong> application <strong>of</strong> any ma<strong>the</strong>matical modell<strong>in</strong>g<br />
technique to organismal growth lies <strong>the</strong> fundamental assump<br />
tion that <strong>the</strong>re is a regular, underly<strong>in</strong>g pattern <strong>of</strong> growth charac<br />
139
140 CAN. J. ZOOL. VOL. 63. 965<br />
112° W III°W<br />
‘30’ N<br />
490 N<br />
1100W<br />
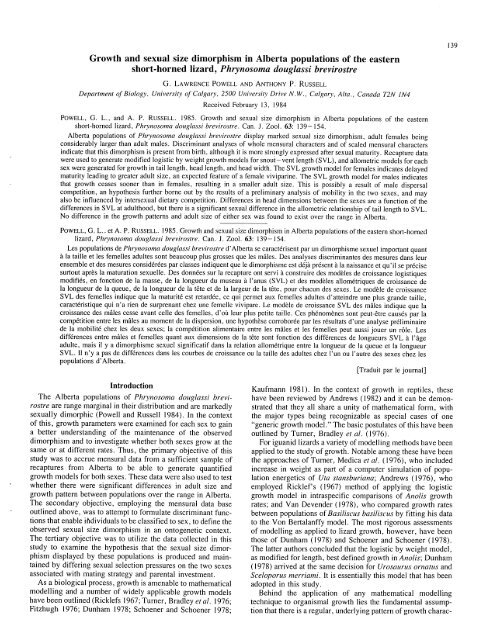
FIG. I. The range <strong>of</strong> Phn’nosorna douglassi brevirostre <strong>in</strong> sou<strong>the</strong>ast <strong>Alberta</strong> (hatched area <strong>of</strong> <strong>in</strong>set map). Locations marked with stars represent<br />
study sites discussed <strong>in</strong> this paper (B. Bow Isl<strong>and</strong>: R. Rose Ranch; M. Mck<strong>in</strong>ley’s Ranch: N. Nemiskam; C. Comrey).<br />
teristic <strong>of</strong> <strong>the</strong> species <strong>in</strong> question (Ricklefs 1967). However,<br />
this <strong>in</strong>nate, species-specific pattern may be altered <strong>in</strong> vary<strong>in</strong>g<br />
ways by environmental factors (Huxley 1932; Kaufmann 1981;<br />
Andrews 1982). Thus, any growth model generated from field<br />
data, such as that presented <strong>in</strong> this study, will <strong>in</strong>evitably be an<br />
approximation <strong>of</strong> <strong>the</strong> <strong>in</strong>tr<strong>in</strong>sic growth pattern <strong>of</strong> that population<br />
or species. If comparisons are to be made, careful attention<br />
must be given to <strong>the</strong> extr<strong>in</strong>sic environmental factors that may<br />
affect each case. In this context, appropriate use <strong>of</strong> growth<br />
models may cast light on <strong>the</strong> relative effects <strong>of</strong> such extr<strong>in</strong>sic<br />
factors (Dunham 1978).<br />
In <strong>the</strong> particular case <strong>of</strong> <strong>the</strong> genus Phrvnosoma, most consid<br />
erations <strong>of</strong> growth have been descriptive <strong>and</strong> feature little or<br />
no statistical analysis. Guyer (1978), however, utilized a<br />
regression <strong>of</strong> snout—vent length (SVL) on time <strong>of</strong> year to<br />
differentiate between growth rates <strong>of</strong> males <strong>and</strong> females <strong>of</strong><br />
P. d. douglassi <strong>in</strong> sou<strong>the</strong>rn Idaho. He also considered observed<br />
<strong>in</strong>dividual growth rates.<br />
Sexual <strong>size</strong> <strong>dimorphism</strong> <strong>in</strong> a species implies that <strong>the</strong> two<br />
sexes have somewhat different ecological or reproductive<br />
dem<strong>and</strong>s (Howard 1981). The <strong>sexual</strong> <strong>size</strong> <strong>dimorphism</strong> <strong>and</strong><br />
I F<br />
0 10 20 30 40 50<br />
km<br />
P50° N<br />
growth patterns characteristic <strong>of</strong> <strong>the</strong> <strong>Alberta</strong> <strong>populations</strong> <strong>of</strong><br />
P. d. brevirostre can <strong>in</strong>itially be attributed to one <strong>of</strong> two causes:<br />
ei<strong>the</strong>r <strong>in</strong>traspecific dietary competition (Schoener 1969) or<br />
<strong>in</strong>tra<strong>sexual</strong> selection (Ghisel<strong>in</strong> 1974). Fitch (1981) has con<br />
sidered <strong>sexual</strong> <strong>size</strong> <strong>dimorphism</strong> <strong>in</strong> reptiles <strong>in</strong> considerable<br />
detail <strong>and</strong> has found <strong>the</strong> emergent pattern to be extremely<br />
variable. Andrews (1982) has discussed this phenomenon <strong>in</strong><br />
<strong>the</strong> context <strong>of</strong> growth <strong>in</strong> reptiles.<br />
For Phrvnoso,’na Fitch noted that <strong>the</strong> female is <strong>the</strong> larger sex<br />
<strong>in</strong> <strong>the</strong> seven species that he exam<strong>in</strong>ed. Pianka <strong>and</strong> Parker<br />
(1975) noted this for P. douglassi <strong>and</strong> P. platyrh<strong>in</strong>os <strong>and</strong> <strong>in</strong>di<br />
cated a cl<strong>in</strong>al trend <strong>in</strong> <strong>the</strong> latter, with <strong>dimorphism</strong> be<strong>in</strong>g most<br />
strongly marked <strong>in</strong> <strong>the</strong> nor<strong>the</strong>rnmost extension <strong>of</strong> <strong>the</strong> range.<br />
Methods <strong>and</strong> materials<br />
Field <strong>in</strong>ethochv<br />
Lizards were captured by h<strong>and</strong> <strong>and</strong> subjected to measurement <strong>in</strong><br />
<strong>the</strong> field immediately after capture dur<strong>in</strong>g <strong>the</strong> spr<strong>in</strong>g <strong>and</strong> summer <strong>of</strong><br />
1979 <strong>and</strong> 1980. <strong>and</strong> <strong>in</strong> <strong>the</strong> spr<strong>in</strong>g <strong>of</strong> 1981. After all <strong>of</strong> <strong>the</strong> data had<br />
been recorded, each newly captured lizard was given a unique toe<br />
clip for that study site. The follow<strong>in</strong>g measurements were recorded:
(I) snout—vent length (SVL). distance from <strong>the</strong> tip <strong>of</strong> <strong>the</strong> snout to <strong>the</strong><br />
anterior lip <strong>of</strong> <strong>the</strong> vent, measured ventrally. to <strong>the</strong> nearest 0.5 mm:<br />
(ii) weight, mass <strong>of</strong> <strong>the</strong> lizard to <strong>the</strong> nearest 0.5 g: (iii) tail length<br />
(TL), distance from <strong>the</strong> posterior lip <strong>of</strong> <strong>the</strong> vent to <strong>the</strong> tip <strong>of</strong> <strong>the</strong> tail.<br />
measured ventrally, to <strong>the</strong> nearest 0.5 mm (phrynosomes are not<br />
autotomic. <strong>and</strong> so tail length can be used as a consistent <strong>and</strong> repeatable<br />
statistic); (iv) head width (HW). l<strong>in</strong>ear width <strong>of</strong> <strong>the</strong> jaws at <strong>the</strong> corners<br />
<strong>of</strong> <strong>the</strong> mouth, to <strong>the</strong> nearest 0.5 mm: (v) head length (HL). l<strong>in</strong>ear<br />
distance from <strong>the</strong> tip <strong>of</strong> <strong>the</strong> snout (rostral scale) to <strong>the</strong> occipital notch.<br />
to <strong>the</strong> nearest 0.5 mm.<br />
HW <strong>and</strong> HL were taken with a pair <strong>of</strong> vernier eallipers. Weight<br />
was measured with a 5 or 30 g Pesola spr<strong>in</strong>g balance, depend<strong>in</strong>g on<br />
<strong>size</strong>. SVL <strong>and</strong> TL measurements were recorded employ<strong>in</strong>g a sta<strong>in</strong>less<br />
steel ruler, <strong>the</strong> lizard be<strong>in</strong>g stretched firmly aga<strong>in</strong>st it to m<strong>in</strong>imize<br />
measurement error ow<strong>in</strong>g to muscular contraction. To m<strong>in</strong>imize <strong>the</strong><br />
mask<strong>in</strong>g effect <strong>of</strong> measurement error on growth <strong>in</strong>crement, no mea<br />
surements were taken on lizards recaptured less than 14 days after a<br />
previous set <strong>of</strong> measurements.<br />
The data used <strong>in</strong> this study were collected at five separate localities<br />
<strong>in</strong> sou<strong>the</strong>astern <strong>Alberta</strong> (Fig. I): Comrey (I lO°4l’ W, 49°05’ N).<br />
Nemiskam Community Pastures (I l0°31’ W, 49°l7’ N). Mck<strong>in</strong>ley’s<br />
Ranch (I l0~25’ W, 49°l7’ N), Rose Ranch (I lO°06’ W, 50°l7’ N),<br />
<strong>and</strong> Bow Isl<strong>and</strong> (II I030~ W, 49°55’ N). Detailed accounts <strong>of</strong> <strong>the</strong> five<br />
sites <strong>and</strong> <strong>the</strong> distribution <strong>of</strong> <strong>the</strong> lizards at each are available elsewhere<br />
(Powell 1982).<br />
Sexual <strong>dimorphism</strong><br />
Male lizards <strong>of</strong> all ages are immediately dist<strong>in</strong>guishable from<br />
females by <strong>the</strong> presence <strong>of</strong> enlarged postanal scales. Sexual dimor<br />
phism <strong>in</strong> SVL, weight. <strong>and</strong> TL are obvious after <strong>sexual</strong> maturity, but<br />
not <strong>in</strong> <strong>sexual</strong>ly immature <strong>in</strong>dividuals. The morphological data set for<br />
all captures was subjected to diserim<strong>in</strong>ant analysis to derive a discrim<br />
<strong>in</strong>ant function which would describe some aspects <strong>of</strong> this <strong>sexual</strong><br />
<strong>dimorphism</strong> (McRae et al. 1981). Weight, SVL. TL. HW. <strong>and</strong> HL<br />
were <strong>the</strong> variables used. No attempt was made to adjust <strong>the</strong> variables<br />
for <strong>the</strong> effect <strong>of</strong> <strong>size</strong> <strong>in</strong> <strong>the</strong> <strong>in</strong>itial analysis. s<strong>in</strong>ce weight <strong>and</strong> SVL were<br />
two <strong>of</strong> <strong>the</strong> variables be<strong>in</strong>g tested. A two-group stepwise discrim<strong>in</strong>ant<br />
analysis (Cooley <strong>and</strong> Lohnes 1971) was performed by means <strong>of</strong> <strong>the</strong><br />
SPSS (statistical package for <strong>the</strong> social sciences) subprogramme<br />
DISCRIMINANT (Nice! al. 1975). This yielded a discrim<strong>in</strong>ant func<br />
tion which can be used to classify any <strong>in</strong>dividual lizard by sex on <strong>the</strong><br />
basis <strong>of</strong> <strong>the</strong> five measurements used <strong>in</strong> <strong>the</strong> analysis.<br />
In addition, for each case, proportional values for several <strong>of</strong> <strong>the</strong><br />
morphological variables were derived (“case” here refers to a com<br />
plete set <strong>of</strong> measurements taken from one lizard at one capture). TL.<br />
HW, <strong>and</strong> HL were expressed as percentages <strong>of</strong> SVL (equivalent to <strong>the</strong><br />
“percra” <strong>of</strong> Werner(197I)) <strong>and</strong> for each case, <strong>the</strong> ratio <strong>of</strong> I-IL to HW<br />
was calculated. A two-group stepwise discrim<strong>in</strong>ant analysis. similar to<br />
that described above, was performed on <strong>the</strong> scaled values <strong>of</strong> <strong>the</strong> entire<br />
morphological data set to produce ano<strong>the</strong>r classificatory diserim<strong>in</strong>ant<br />
function.<br />
<strong>Growth</strong><br />
The results <strong>of</strong> <strong>the</strong> analysis <strong>of</strong> <strong>sexual</strong> <strong>size</strong> <strong>dimorphism</strong> <strong>in</strong>dicated that<br />
<strong>the</strong> growth patterns <strong>of</strong> each sex should be considered separately.<br />
Longitud<strong>in</strong>al data (successive measurements <strong>of</strong> an <strong>in</strong>dividual animal<br />
over a period <strong>of</strong> time (Fitzhugh 1976)) were used to fit <strong>the</strong> model to<br />
<strong>the</strong> growth patterns <strong>of</strong> each sex. Recapture data for each sex were<br />
organized <strong>in</strong>to cases, each case consist<strong>in</strong>g <strong>of</strong> a measurement taken at<br />
<strong>the</strong> first capture <strong>of</strong> an <strong>in</strong>dividual (L1). <strong>the</strong> number <strong>of</strong> days between<br />
capture <strong>and</strong> recapture (D). <strong>and</strong> <strong>the</strong> equivalent measurement taken at<br />
<strong>the</strong> recapture <strong>of</strong> <strong>the</strong> <strong>in</strong>dividual (L2). L1 <strong>and</strong> L2 are l<strong>in</strong>ear measurements<br />
such as SVL or HW. A number <strong>of</strong> <strong>in</strong>dividuals were recaptured more<br />
than once; <strong>in</strong> <strong>the</strong>se eases, L1 was given <strong>the</strong> value obta<strong>in</strong>ed at <strong>the</strong><br />
immediately preced<strong>in</strong>g recapture. Each case was considered sepa<br />
rately <strong>in</strong> <strong>the</strong> analyses, regardless <strong>of</strong> whe<strong>the</strong>r o<strong>the</strong>r cases <strong>of</strong> <strong>the</strong> same<br />
lizard were <strong>in</strong>cluded <strong>in</strong> <strong>the</strong> data set. This may have biased <strong>the</strong> results,<br />
but was unavoidable <strong>in</strong> view <strong>of</strong> <strong>the</strong> relatively small sample <strong>size</strong>s. If<br />
w<strong>in</strong>ter <strong>in</strong>tervened between capture <strong>and</strong> recapture, a value for D was<br />
approximated by subtract<strong>in</strong>g <strong>the</strong> estimated time spent <strong>in</strong> brumation<br />
POWELL AND RUSSELL 141<br />
from <strong>the</strong> actual number <strong>of</strong> days between capture <strong>and</strong> recapture. The<br />
estimated brumation period was determ<strong>in</strong>ed from <strong>the</strong> dates <strong>of</strong> <strong>the</strong> last<br />
capture <strong>in</strong> <strong>the</strong> fall <strong>and</strong> <strong>the</strong> first capture <strong>in</strong> <strong>the</strong> follow<strong>in</strong>g spr<strong>in</strong>g, as<br />
precise dates for onset <strong>of</strong> brumation <strong>and</strong> spr<strong>in</strong>g emergence could not<br />
be obta<strong>in</strong>ed, especially for any particular <strong>in</strong>dividual, Cases <strong>in</strong> which<br />
<strong>the</strong>re was an apparent decrease <strong>in</strong> <strong>size</strong> over time were assumed to be<br />
<strong>the</strong> result <strong>of</strong> measurement error <strong>and</strong> not used <strong>in</strong> <strong>the</strong> analysis: i.e.. <strong>the</strong><br />
data set was “fixed” (Dunham 1978. 1980: Schoener <strong>and</strong> Schoener<br />
1978).<br />
Dunham (1978) <strong>and</strong> Schoener <strong>and</strong> Schoener (1978) found that <strong>the</strong><br />
most suitable model for describ<strong>in</strong>g lizard growth was <strong>the</strong> logistic by<br />
weight model, modified for SVL. This model assumes a determ<strong>in</strong>ate<br />
asymptotic <strong>size</strong>, reached by an <strong>in</strong>flected. S-shaped growth pattern<br />
(Schoener <strong>and</strong> Schoener 1978). It is derived by substitut<strong>in</strong>g <strong>the</strong> cubed<br />
l<strong>in</strong>ear dimension for weight <strong>in</strong>to <strong>the</strong> simple logistic by weight growth<br />
model (Schoener <strong>and</strong> Schoener 1978). Andrews (1982), <strong>in</strong> a review <strong>of</strong><br />
<strong>the</strong> various models applied to reptile growth. recommended <strong>the</strong><br />
logistic by weight model for small iguanids. such as Phrvnosoma.<br />
However, weight <strong>in</strong> free-liv<strong>in</strong>g lizards can vary with condition. food<br />
availability, <strong>and</strong>, particularly <strong>in</strong> females. with reproductive condition,<br />
all <strong>of</strong> which will obscure growth rate (Dunham 1978. 1980: Schoener<br />
<strong>and</strong> Schoener 1978). Change <strong>in</strong> weight is thus not as satisfactory an<br />
<strong>in</strong>dex <strong>of</strong> growth as is a change <strong>in</strong> a l<strong>in</strong>ear measurement such as SVL<br />
for use <strong>in</strong> a static model such as that employed here.<br />
The differential form <strong>of</strong> <strong>the</strong> logistic by weight equation, as modified<br />
by Schoener <strong>and</strong> Schoener (1978) for length. is<br />
[I] dL/dt = (rL/3)(l — (L3/a~))<br />
where L is length (a l<strong>in</strong>ear dimension <strong>of</strong> <strong>the</strong> lizard). t is time. r is <strong>the</strong><br />
characteristic growth rate, <strong>and</strong> a1 is <strong>the</strong> asymptotic or maximum length<br />
atta<strong>in</strong>ed by <strong>the</strong> lizard. The <strong>in</strong>stantaneous solution to Eq. I is<br />
[2] L = (a~/(l + he”))~<br />
where e is <strong>the</strong> base <strong>of</strong> <strong>the</strong> natural logarithm <strong>and</strong><br />
[3] h = (a~/L~) —<br />
where L1 is <strong>the</strong> length at birth.<br />
Schoener <strong>and</strong> Schoener (1978) also derived an <strong>in</strong>terval equation for<br />
this model:<br />
[4] L~ = (a~L~/L~ + (a~ — L~)e “~‘~<br />
where L~ is <strong>the</strong> length <strong>of</strong> <strong>the</strong> lizard at <strong>the</strong> beg<strong>in</strong>n<strong>in</strong>g <strong>of</strong> <strong>the</strong> <strong>in</strong>terval. L2<br />
is <strong>the</strong> length at <strong>the</strong> end <strong>of</strong> <strong>the</strong> <strong>in</strong>terval, <strong>and</strong> D is <strong>the</strong> length <strong>of</strong> <strong>the</strong><br />
<strong>in</strong>terval. Equation 4 can be used to predict <strong>the</strong> <strong>size</strong> <strong>of</strong> a lizard <strong>of</strong> length<br />
L1 after <strong>the</strong> passage <strong>of</strong> D units <strong>of</strong> time.<br />
The parameters a1 <strong>and</strong> r can he estimated by <strong>the</strong> use <strong>of</strong> nonl<strong>in</strong>ear<br />
least squares regression techniques. In this study. <strong>the</strong> IMSL (Interna<br />
tional Ma<strong>the</strong>matical <strong>and</strong> Statistical Libraries. Inc.) computer rout<strong>in</strong>e<br />
RSMITZ (Anonymous 1979). as modified by <strong>the</strong> University <strong>of</strong><br />
Calgary Academic Computer Services (NONLIN). was used to esti<br />
mate <strong>the</strong>se parameters from <strong>the</strong> recapture cases. NONLIN converges<br />
on those values <strong>of</strong> <strong>the</strong> parameter nearest <strong>the</strong> hypo<strong>the</strong><strong>size</strong>d start<strong>in</strong>g<br />
values which give a m<strong>in</strong>imum sum <strong>of</strong> squares for a user-supplied<br />
model. The model <strong>in</strong> this case was Eq. 4. A data matrix <strong>of</strong> a series <strong>of</strong><br />
recapture cases with one dependent variable (L2) <strong>and</strong> two <strong>in</strong>dependent<br />
variables (L1 <strong>and</strong> D) was used to arrive at <strong>the</strong> parameter estimates.<br />
NONLIN used this data matrix <strong>in</strong> conjunction with Eq. 4 to estimate<br />
values for a1 <strong>and</strong> r that fit cases which resemble those <strong>in</strong> <strong>the</strong> orig<strong>in</strong>al<br />
data matrix. In addition, it yielded asymptotic st<strong>and</strong>ard deviations <strong>of</strong><br />
each estimate, which permit <strong>the</strong> calculation <strong>of</strong> two k<strong>in</strong>ds <strong>of</strong> confidence<br />
<strong>in</strong>tervals..~~conventional” confidence <strong>in</strong>tervals <strong>and</strong> support-plane con<br />
fidence <strong>in</strong>tervals. The support-plane confidence <strong>in</strong>terval is <strong>the</strong> more<br />
conservative <strong>of</strong> <strong>the</strong> two estimates (Dunham 1978: Schoener <strong>and</strong><br />
Schoener 1978).<br />
Maximum <strong>size</strong> (a1) <strong>and</strong> characteristic growth rate (r) were esti<br />
mated for <strong>the</strong> pooled SVL cases for each sex from all study sites.<br />
These parameters were also estimated for pooled TL. I-lW. <strong>and</strong> HL<br />
cases for each sex from all study sites. <strong>Growth</strong> curves for SVL. TL,
142 CAN. J. ZOOL. VOL. 63. 985<br />
TABLE I. Statistics perta<strong>in</strong><strong>in</strong>g to Eq. 5, discrimi<br />
nant analysis us<strong>in</strong>g whole morphological values,<br />
<strong>and</strong> classification success <strong>of</strong> Eq. 5.<br />
Canonical correlation 0.7362<br />
Wilks’ X 0.4580<br />
x2 331.86<br />
Box’sM 234.39. F,.=23.184*<br />
% <strong>of</strong> all cases<br />
classified correctly 86.01<br />
Predicted group<br />
niembership<br />
Actual group<br />
membership Males Females<br />
Males 83.6% 16.4%<br />
Females 12.5% 87.5%<br />
*SignhIicanl at p 0.001.<br />
HW, <strong>and</strong> HL, extrapolated to <strong>the</strong>ir respective asymptotes, were<br />
modelled by <strong>in</strong>sert<strong>in</strong>g <strong>the</strong> estimated parameters for each measurement<br />
<strong>in</strong>to Eq. 2; L, was determ<strong>in</strong>ed by averag<strong>in</strong>g <strong>the</strong> appropriate mea<br />
surement <strong>of</strong> lizards born <strong>in</strong> captivity <strong>and</strong> used to calculate b. The 95%<br />
confidence <strong>in</strong>tervals for each extrapolated curve were calculated by<br />
<strong>in</strong>sert<strong>in</strong>g <strong>the</strong> upper <strong>and</strong> lower 95% support-plane confidence <strong>in</strong>terval<br />
values for <strong>the</strong> two parameters <strong>in</strong>to <strong>the</strong> appropriate form <strong>of</strong> Eq. 2. In<br />
addition, SVL recaptures for each sex were grouped <strong>in</strong>to nor<strong>the</strong>rn<br />
(Bow Isl<strong>and</strong>, Rose Ranch) <strong>and</strong> sou<strong>the</strong>rn (Comrey, Nemiskam,<br />
McK<strong>in</strong>ley Ranch) location groups (Fig. I). The a <strong>and</strong> r values for<br />
SVL were estimated for each location group by sex <strong>and</strong> used to<br />
construct a growth curve <strong>and</strong> limits as described above. In all pairwise<br />
comparisons <strong>of</strong> parameter estimates, <strong>the</strong>y were considered to be dif<br />
ferent if <strong>the</strong>ir 95% support-plane confidence <strong>in</strong>tervals did not overlap<br />
(Dunham 1978, 1980).<br />
The difference <strong>in</strong> goodness <strong>of</strong> fit <strong>of</strong> <strong>the</strong> male <strong>and</strong> female SVL<br />
growth models was tested by means <strong>of</strong> an F test (Sokal <strong>and</strong> Rohlf<br />
1969). Error variance for each model was derived by generat<strong>in</strong>g pre<br />
dicted L2 values for each recapture case by means <strong>of</strong> <strong>the</strong> appropriate<br />
<strong>in</strong>terval equation (Eq. 4) <strong>and</strong> summ<strong>in</strong>g <strong>the</strong> differences between<br />
observed <strong>and</strong> predicted values.<br />
A two-tailed F statistic <strong>of</strong> 0.05 probability was used as <strong>the</strong> critical<br />
value. Change <strong>in</strong> growth rate with change <strong>in</strong> SVL was approximated<br />
by <strong>in</strong>sert<strong>in</strong>g <strong>the</strong> appropriate values <strong>of</strong> a1 <strong>and</strong> r <strong>in</strong>to Eq. I <strong>and</strong> calcu<br />
lat<strong>in</strong>g dL/dt over <strong>the</strong> SVL range to a1 for each <strong>of</strong> <strong>the</strong> sexes. The same<br />
was done with 95% support-plane confidence limits <strong>of</strong> a1 <strong>and</strong> r for<br />
each sex to establish upper <strong>and</strong> lower 95% confidence limits for<br />
dL/dt. Observed growth rates were calculated for each recapture<br />
series by (L2 — L~ )/D. The correspond<strong>in</strong>g SVL was approximated by<br />
(L2 — L)/2.<br />
As a basis for comparison for <strong>the</strong> logistic growth models <strong>of</strong> TL,<br />
HW, <strong>and</strong> HL, allometric models <strong>of</strong> growth <strong>in</strong> each <strong>of</strong> <strong>the</strong>se mea<br />
surements were generated for each sex. Each allometric model was<br />
derived from <strong>the</strong> l<strong>in</strong>ear regression <strong>of</strong> <strong>the</strong> logarithm <strong>of</strong> <strong>the</strong> measurement<br />
on <strong>the</strong> logarithm <strong>of</strong> SVL, us<strong>in</strong>g <strong>the</strong> entire morphological data base.<br />
Because <strong>the</strong> least squares regression method assumes no error <strong>in</strong> <strong>the</strong><br />
<strong>in</strong>dependent variable. Bartlett’s “best-fit” method or reduced major<br />
axis are normally advocated for deriv<strong>in</strong>g <strong>the</strong> parameters <strong>of</strong> an allo<br />
metric equation (Gr<strong>in</strong>e et a!. 1978: Kermack <strong>and</strong> Haldane 1950). It<br />
was felt, however, that <strong>the</strong> large sample <strong>size</strong> <strong>in</strong>volved here would<br />
adequately <strong>of</strong>fset <strong>the</strong> potential measurement error factor <strong>and</strong> would<br />
permit a least squares regression method to be employed for this data<br />
set. In addition, <strong>the</strong> aptness <strong>of</strong> a particular method depends upon <strong>the</strong><br />
degree <strong>of</strong> correlation between <strong>the</strong> two variables: when <strong>the</strong> correlation<br />
is high, <strong>the</strong> results given by <strong>the</strong> different methods are very similar<br />
(Gould 1966; Seim <strong>and</strong> Sae<strong>the</strong>r 1983). The correlations between each<br />
pair <strong>of</strong> variables <strong>in</strong> this study were sufficiently high that we felt<br />
justified <strong>in</strong> us<strong>in</strong>g least squares regression for our parameter estimates.<br />
The strength <strong>of</strong> <strong>the</strong> relationships between variables was exam<strong>in</strong>ed<br />
by means <strong>of</strong> <strong>the</strong>ir correlation coefficient (Smith 1980. 1981; Aiello<br />
1981) <strong>and</strong> by an <strong>in</strong>spection <strong>of</strong> residual plots (Smith 1980, 1981).<br />
Comparisons between <strong>the</strong> regression slopes <strong>of</strong> <strong>the</strong> two sexes for each<br />
measurement were performed by means <strong>of</strong> an analysis <strong>of</strong> covariance<br />
(ANCOVA). If <strong>the</strong>re was a significant difference between slopes, <strong>the</strong><br />
mensural character was held to be <strong>sexual</strong>ly dimorphic <strong>in</strong> allometry. All<br />
statistics for <strong>the</strong> allometric analysis were obta<strong>in</strong>ed by means <strong>of</strong> SPSS<br />
(Nie et a!. 1975). The allometric models were compared with <strong>the</strong><br />
logistic models for each sex by fitt<strong>in</strong>g <strong>the</strong> appropriate extrapolated<br />
l<strong>in</strong>es with confidence limits to scatterplots <strong>of</strong> <strong>the</strong> observed distribu<br />
tions <strong>of</strong> <strong>the</strong> mensural character aga<strong>in</strong>st SVL.<br />
Mobilit<br />
Sexual <strong>size</strong> <strong>dimorphism</strong> can possibly be promoted by male dispersal<br />
competition. <strong>in</strong> which males are <strong>in</strong> a race to f<strong>in</strong>d <strong>and</strong> <strong>in</strong>sem<strong>in</strong>ate as<br />
many females as possible (Ghisel<strong>in</strong> 1974). This sort <strong>of</strong> <strong>in</strong>tra<strong>sexual</strong><br />
selection will be associated with greater mobility <strong>in</strong> males than <strong>in</strong><br />
females (Ghisel<strong>in</strong> 1974).<br />
It was hypo<strong>the</strong><strong>size</strong>d that <strong>the</strong>re might be a difference <strong>in</strong> home range<br />
<strong>size</strong> between males <strong>and</strong> females if male dispersal competition is active<br />
<strong>in</strong> ma<strong>in</strong>ta<strong>in</strong><strong>in</strong>g <strong>the</strong> <strong>sexual</strong> <strong>size</strong> <strong>dimorphism</strong> characteristic <strong>of</strong> <strong>the</strong>se<br />
lizards. Consequently. an effort was made to exam<strong>in</strong>e home range <strong>size</strong><br />
<strong>in</strong> <strong>the</strong> <strong>Alberta</strong> <strong>populations</strong>. A strip <strong>of</strong> plastic surveyor’s tape with <strong>the</strong><br />
date <strong>and</strong> clip code was tied <strong>in</strong> place to <strong>the</strong> closest piece <strong>of</strong> vegetation<br />
to <strong>the</strong> po<strong>in</strong>t <strong>of</strong> capture or recapture <strong>of</strong> each lizard. The distance<br />
between <strong>the</strong> tags <strong>of</strong> successive recaptures was measured at <strong>the</strong> end <strong>of</strong><br />
each field season. In cases where an <strong>in</strong>terven<strong>in</strong>g tag was miss<strong>in</strong>g, <strong>the</strong><br />
distance between <strong>the</strong> tags for <strong>the</strong> immediately preced<strong>in</strong>g <strong>and</strong> immedi<br />
ately succeed<strong>in</strong>g captures was used.<br />
There were not enough sequential recapture series <strong>of</strong> <strong>in</strong>dividuals,<br />
particularly <strong>of</strong> males, to permit <strong>the</strong> computation <strong>of</strong> a sufficiently large<br />
sample <strong>of</strong> m<strong>in</strong>imum polygon home range estimates for statistical<br />
purposes. This lack precluded <strong>the</strong> use <strong>of</strong> Schoener’s (1981) test for<br />
<strong>in</strong>dependence <strong>of</strong> successive recaptures. The distance <strong>in</strong> metres<br />
between capture <strong>and</strong> recapture, <strong>the</strong> number <strong>of</strong> days between <strong>the</strong>se<br />
events, <strong>and</strong> <strong>the</strong> estimated rate <strong>of</strong> movement <strong>in</strong> metres per day were<br />
pooled by sex without regard to <strong>the</strong> <strong>in</strong>dividual lizards which yielded<br />
<strong>the</strong> data. Each pair <strong>of</strong> recaptures was considered as a “case,” <strong>in</strong> much<br />
<strong>the</strong> same manner as <strong>the</strong> morphological recapture data were treated <strong>in</strong><br />
<strong>the</strong> estimation <strong>of</strong> <strong>the</strong> growth parameters. The three variables were<br />
found to be normal <strong>in</strong> distribution by a Kolmogorov—Smirnov good<br />
ness <strong>of</strong> fit test. Differences <strong>in</strong> rate <strong>of</strong> movement, distance covered, <strong>and</strong><br />
number <strong>of</strong> days between recaptures between <strong>the</strong> sexes were tested by<br />
a Student’s t-test. Independence <strong>of</strong> successive recaptures was evalu<br />
ated by <strong>the</strong> mean number <strong>of</strong> days between <strong>the</strong>m. Schoener (1981)<br />
allowed at least 1/2 day between observations <strong>in</strong> an attempt to ma<strong>in</strong><br />
ta<strong>in</strong> <strong>in</strong>dependence, <strong>and</strong> this amount <strong>of</strong> time was used as a m<strong>in</strong>imum<br />
acceptable <strong>in</strong>terval. All statistical computations were performed by <strong>the</strong><br />
SPSS package (Nie et a!. 1975; Hull <strong>and</strong> Nie 1979).<br />
Results<br />
Capture <strong>and</strong> recapture success<br />
A total <strong>of</strong> 446 sets <strong>of</strong> measurements were taken from 316<br />
<strong>in</strong>dividuals <strong>in</strong> <strong>the</strong> course <strong>of</strong> <strong>the</strong> entire study. Sample <strong>size</strong> varied<br />
between locations, with Comrey, Nemiskam, <strong>and</strong> Bow Isl<strong>and</strong><br />
supply<strong>in</strong>g most <strong>of</strong> <strong>the</strong> captures. Elim<strong>in</strong>ation <strong>of</strong> cases with<br />
miss<strong>in</strong>g values resulted <strong>in</strong> a sample <strong>size</strong> <strong>of</strong> 429 cases which<br />
were used <strong>in</strong> <strong>the</strong> analyses.<br />
There was a high overall recapture rate <strong>of</strong> cases yield<strong>in</strong>g<br />
data useable <strong>in</strong> growth studies (29.2% <strong>of</strong> total captures). There<br />
were far more recaptures <strong>of</strong> females (102) than <strong>of</strong> males (30),<br />
although <strong>the</strong> degree <strong>of</strong> disparity varied from study bite to study<br />
site. Recapture success itself varied between study sites, partly<br />
as a function <strong>of</strong> <strong>the</strong> <strong>size</strong> <strong>of</strong> <strong>the</strong> study site itself <strong>and</strong> partly as a<br />
function <strong>of</strong> <strong>the</strong> amount <strong>of</strong> time spent <strong>in</strong>vestigat<strong>in</strong>g each. Thus,<br />
Comrey, which is a small site <strong>and</strong> was <strong>in</strong>tensively studied, is
TABLE 2. Statistics perta<strong>in</strong><strong>in</strong>g to Eq. 6, discrimi<br />
nant analysis us<strong>in</strong>g percrasr <strong>and</strong> HL/HW. <strong>and</strong><br />
classification success <strong>of</strong> Eq. 6.<br />
Canonical correlation 0.7119<br />
Wilks’ X 0.4933<br />
x2 300.35<br />
Box’sM 226.32. F,.=22.386t<br />
Predicted group<br />
membership<br />
Actual group<br />
membership Males Females<br />
Males 75.2% 24.8%<br />
Females 6.8% 93.2%<br />
See Materials <strong>and</strong> methods <strong>and</strong> Werner (1971).<br />
tSignilicant at p = 0.001.<br />
represented by a higher recapture rate than Bow Isl<strong>and</strong>, which<br />
has a much larger area.<br />
Sexual <strong>dimorphism</strong><br />
The two-group discrim<strong>in</strong>ant analysis us<strong>in</strong>g whole mor<br />
phological values yielded <strong>the</strong> follow<strong>in</strong>g function:<br />
[5] 5 = —0.2207(SVL) — 0.2549(HW) + 0.l714(HL)<br />
+ 0.4075(TL) + 2.2322<br />
where S1 is <strong>the</strong> determ<strong>in</strong>ant value <strong>of</strong> <strong>the</strong> sex. Lizards with a<br />
value <strong>of</strong> S~ > 0.449 are classed as male, those with an S~ <<br />
0.449 are classed as female. The pert<strong>in</strong>ent statistics for this<br />
analysis are presented <strong>in</strong> Table I. There is some overlap <strong>in</strong> <strong>the</strong><br />
distributions <strong>of</strong> <strong>the</strong> two sexes <strong>in</strong> <strong>the</strong> plot <strong>of</strong> case values along<br />
<strong>the</strong> discrim<strong>in</strong>ant function, but <strong>the</strong> two groups are dist<strong>in</strong>ct, as is<br />
evidenced by <strong>the</strong> high cannonical correlation <strong>and</strong> <strong>the</strong> large<br />
Box’s M with its associated significant F. The Wilks’ X is not<br />
great, but has a significant x2 value <strong>and</strong> can be considered<br />
adequate <strong>in</strong> view <strong>of</strong> <strong>the</strong> high percentage <strong>of</strong> cases classified<br />
correctly by <strong>the</strong> discrim<strong>in</strong>ant function. The majority <strong>of</strong> <strong>in</strong>cor<br />
rectly classified male cases are <strong>in</strong> <strong>the</strong> 28.0—39.0 mm SVL<br />
range. The total SVL range with<strong>in</strong> which misclassified male<br />
cases were found extends from 28.0 to 45.5 mm. Misclassified<br />
cases constituted 22.12% <strong>of</strong> all male cases with an SVL <strong>of</strong> less<br />
than 46.0 mm. Most <strong>in</strong>correctly classified female cases range<br />
from 22.5 to 39.0 mm SVL, with a total SVL range <strong>of</strong><br />
22.5—53.0 mm. With<strong>in</strong> this SVL range, 32.38% <strong>of</strong> all female<br />
cases were <strong>in</strong>correctly classified. The absolute values <strong>of</strong> <strong>the</strong><br />
st<strong>and</strong>ardized discrim<strong>in</strong>ant scores <strong>in</strong>dicate that TL is <strong>the</strong> most<br />
important variable, followed <strong>in</strong> order by SVL, HW, <strong>and</strong> HL.<br />
Weight was removed from <strong>the</strong> discrim<strong>in</strong>ant function as part <strong>of</strong><br />
<strong>the</strong> stepwise process. HL <strong>and</strong> HW contribute little to <strong>the</strong> dim<br />
<strong>in</strong>ution <strong>of</strong> Wilks’ X. The <strong>size</strong> <strong>of</strong> <strong>the</strong> TL <strong>and</strong> SVL coefficients<br />
<strong>in</strong>dicate that <strong>the</strong>se two variables account for most <strong>of</strong> <strong>the</strong> <strong>sexual</strong><br />
<strong>dimorphism</strong> <strong>in</strong> <strong>the</strong> data set.<br />
The two-group discrim<strong>in</strong>ant analysis us<strong>in</strong>g scaled mor<br />
phological values yielded <strong>the</strong> follow<strong>in</strong>g function:<br />
[6] S2 = l9.6663(TL/SVL) — 6l.6984(HW/SVL)<br />
+ 47.6984(HL/SVL) — l9.628l(HL/HW) + 3 1.9734<br />
where S2 is <strong>the</strong> discrim<strong>in</strong>ant value for <strong>the</strong> sex. Lizards with a<br />
value <strong>of</strong> S2 < —0.466 are classed as male, those with a value<br />
<strong>of</strong> 52 > —0.466 are classed as female. The statistics for this<br />
analysis are summarized <strong>in</strong> Table 2. The Wilks’ K for Eq. 6 is<br />
slightly larger than that for Eq. 5 (Table I), <strong>in</strong>dicat<strong>in</strong>g slightly<br />
POWELL AND RUSSELL 143<br />
less acuity <strong>in</strong> dist<strong>in</strong>guish<strong>in</strong>g between <strong>the</strong> sexes by Eq. 6. The<br />
Box’s M is large <strong>and</strong> its associated approximate F is signifi<br />
cant, <strong>in</strong>dicat<strong>in</strong>g that <strong>the</strong>re is a significant difference <strong>in</strong> <strong>the</strong><br />
group dispersions. Overlap along <strong>the</strong> discrim<strong>in</strong>ant function is<br />
greater than <strong>in</strong> <strong>the</strong> whole value analysis <strong>and</strong> <strong>the</strong> spread <strong>of</strong> <strong>the</strong><br />
male cases is greater than that <strong>of</strong> <strong>the</strong> female cases. The absolute<br />
value <strong>of</strong> <strong>the</strong> st<strong>and</strong>ardized discrim<strong>in</strong>ant coefficient for HL/SVL<br />
is <strong>the</strong> greatest, followed <strong>in</strong> order by those for HL/HW,<br />
HW/SVL, <strong>and</strong> TL/SVL. Thus, <strong>in</strong> this analysis scaled head<br />
dimensions are <strong>the</strong> most useful variables <strong>in</strong> discrim<strong>in</strong>at<strong>in</strong>g<br />
between <strong>the</strong> sexes, <strong>in</strong> contrast to <strong>the</strong> preced<strong>in</strong>g analysis <strong>in</strong><br />
which SVL <strong>and</strong> TL were <strong>the</strong> most useful. A slightly higher<br />
percentage <strong>of</strong> <strong>the</strong> total cases were classified correctly by Eq. 6<br />
than by Eq. 5 (Table I), but <strong>the</strong>re is a marked discrepancy<br />
between <strong>the</strong> percentages <strong>of</strong> each sex classified <strong>in</strong>correctly.<br />
Very few females (6.8%) were classified as males, whereas<br />
almost one-quarter <strong>of</strong> <strong>the</strong> males (24.8%) were classified as<br />
females by Eq. 6. All <strong>of</strong> <strong>the</strong> females classified <strong>in</strong>correctly are<br />
neonates or yearl<strong>in</strong>gs (total range, 23.0—54.0 mm SVL) <strong>and</strong><br />
<strong>the</strong>se cases constitute 15.38% <strong>of</strong> all female cases fall<strong>in</strong>g with<strong>in</strong><br />
this SVL range. Most <strong>of</strong> <strong>the</strong> misclassified males are neonates<br />
or early yearl<strong>in</strong>gs (25.0—37.0 mm SVL). The total SVL range<br />
<strong>of</strong> <strong>in</strong>correctly identified males is 25.0—46.0 mm <strong>and</strong> <strong>the</strong>se<br />
constitute 36.11% <strong>of</strong> all male cases below 46.0 mm SVL.<br />
The discrim<strong>in</strong>ant analysis us<strong>in</strong>g whole morphological values<br />
shows that <strong>the</strong> greater part <strong>of</strong> <strong>the</strong> obvious <strong>sexual</strong> <strong>dimorphism</strong> is<br />
<strong>in</strong> terms <strong>of</strong> SVL <strong>and</strong> TL, <strong>the</strong> two most conspicuously dimor<br />
phic features. The discrim<strong>in</strong>ant analysis us<strong>in</strong>g scaled values<br />
shows that head measurements proportional to SVL also differ<br />
between <strong>the</strong> sexes. The SVL distributions <strong>of</strong> misclassified<br />
cases <strong>of</strong> both sexes <strong>in</strong> both analyses are below <strong>the</strong> adult <strong>size</strong><br />
ranges. By <strong>the</strong> time that a lizard is large enough to breed for <strong>the</strong><br />
first time, it will be classified correctly to sex by both discrim<br />
<strong>in</strong>ant functions.<br />
<strong>Growth</strong><br />
Estimates <strong>of</strong> <strong>the</strong> values <strong>of</strong> a1 <strong>and</strong> r, toge<strong>the</strong>r with <strong>the</strong>ir 95%<br />
conventional <strong>and</strong> support-plane limits, for SVL <strong>of</strong> <strong>the</strong> two<br />
sexes are given <strong>in</strong> Table 3. There is considerable difference<br />
between <strong>the</strong> estimates <strong>of</strong> asymptotic SVL <strong>of</strong> <strong>the</strong> two sexes <strong>and</strong><br />
<strong>the</strong> 95% support-plane confidence <strong>in</strong>tervals <strong>of</strong> <strong>the</strong>se estimates<br />
do not overlap. The extrapolated relationships between TL,<br />
HL, <strong>and</strong> HW <strong>and</strong> SVL as modelled by <strong>the</strong> logistic equation for<br />
each <strong>of</strong> <strong>the</strong>se measurements did not fit <strong>the</strong> observed distribu<br />
tions for each sex as well as <strong>the</strong> extrapolated allometric l<strong>in</strong>es<br />
(Figs. 7, 8, <strong>and</strong> 9). For this reason <strong>the</strong> logistic models <strong>of</strong> TL,<br />
HW, <strong>and</strong> HL are not discussed fur<strong>the</strong>r, <strong>and</strong> subsequent dis<br />
cussions <strong>of</strong> <strong>sexual</strong> <strong>dimorphism</strong> <strong>in</strong> <strong>the</strong>se measurements will be<br />
based on <strong>the</strong> allometric models.<br />
The estimates <strong>of</strong> a1 <strong>and</strong> r for male <strong>and</strong> female SVL were<br />
<strong>in</strong>serted <strong>in</strong>to Eq. 2 to produce models <strong>of</strong> SVL growth for each<br />
sex. These models were used to generate a series <strong>of</strong> growth<br />
curves typify<strong>in</strong>g <strong>the</strong> expected SVL distributions <strong>and</strong> growth<br />
patterns <strong>of</strong> each sex over <strong>the</strong> entire study period. The 95%<br />
confidence <strong>in</strong>tervals <strong>of</strong> <strong>the</strong>se curves were <strong>in</strong>cluded to fur<strong>the</strong>r<br />
def<strong>in</strong>e <strong>the</strong> expected population SVL distributions aga<strong>in</strong>st <strong>the</strong><br />
observed distributions. SVL distributions <strong>of</strong> all males captured<br />
over <strong>the</strong> study period generally correspond with <strong>the</strong> extrapo<br />
lated SVL distributions (Fig. 2). Data po<strong>in</strong>ts for neonates <strong>and</strong><br />
very small males tend to fall outside <strong>the</strong> 95% confidence <strong>in</strong>ter<br />
vals <strong>of</strong> <strong>the</strong> extrapolated curves, probably because <strong>the</strong> <strong>in</strong>itial<br />
value <strong>of</strong> <strong>the</strong> model is <strong>the</strong> mean <strong>of</strong> observed neonate SVLs. It<br />
is possible that <strong>in</strong>stances <strong>of</strong> larger <strong>in</strong>dividuals also fall outside<br />
<strong>of</strong> <strong>the</strong> 95% confidence limits <strong>of</strong> <strong>the</strong> l<strong>in</strong>e that <strong>the</strong>y are associated
144 CAN. J. ZOOL. VOL. 63, 985<br />
S<br />
S<br />
-c 0,<br />
a<br />
C<br />
><br />
0<br />
C<br />
U,<br />
75.<br />
25,<br />
140 160 180 200 220 240 260120 140 160 180 200 220 240 260120 140 160<br />
1979<br />
a1 (asymptotic 95% conventional 95% support-plane<br />
length, mm) <strong>in</strong>terval (mm) <strong>in</strong>terval (mm)<br />
Female SVL 69.03 67.67~a1≤7l.23 67.23~a1~7l.68<br />
Male SVL 52.34 48.39≤a1≤56.29 47.34≤a1≤57.33<br />
(B) Estimates <strong>and</strong> confidence limits <strong>of</strong> characteristic growth rates (r)<br />
r (characteristic 95% conventional 95% support-plane<br />
growth rate) <strong>in</strong>terval <strong>in</strong>terval<br />
Female SVL 0.015661 0.0l2620≤r≤0.0l7750 0.01 l968~r≤0.0l8398<br />
Male SVL 0.023847 0.01 6980≤ r≤ 0.030720 0.0! 5162 ≤r≤ 0.032533<br />
with, but <strong>the</strong> overlap <strong>of</strong> confidence limits near <strong>the</strong> asymptote<br />
makes this impossible to ascerta<strong>in</strong>. No observations lie above<br />
<strong>the</strong> asymptote <strong>of</strong> <strong>the</strong> upper 95% confidence limit. S<strong>in</strong>ce <strong>the</strong><br />
asymptotic SVL is approached rapidly (Fig. 6) no clear differ<br />
entiation can be made between age—<strong>size</strong> classes above 45 mm<br />
SVL or after a cohort <strong>of</strong> recruits has f<strong>in</strong>ished <strong>the</strong> summer after<br />
<strong>the</strong>ir first brumation (Fig. 2). However, <strong>the</strong> observed SVLs <strong>in</strong><br />
Fig. 2 can be divided <strong>in</strong>to three age—<strong>size</strong> groups: (I) young <strong>of</strong><br />
<strong>the</strong> year (YoY), <strong>in</strong>dividuals <strong>of</strong> approximately 22—37 mm SVL,<br />
present between <strong>the</strong> end <strong>of</strong> July <strong>and</strong> <strong>the</strong> onset <strong>of</strong> brumation <strong>in</strong><br />
September; (ii) yearl<strong>in</strong>gs, <strong>in</strong>dividuals <strong>of</strong> approximately 3 I —46<br />
mm SVL, born <strong>in</strong> <strong>the</strong> previous summer <strong>and</strong> present throughout<br />
<strong>the</strong> active season; (iii) adults, <strong>in</strong>dividuals <strong>of</strong> ≥46 mm SVL,<br />
present throughout <strong>the</strong> active season.<br />
Recapture series <strong>of</strong> males do not extend over long periods <strong>of</strong><br />
time, <strong>and</strong> so it is not possible to say how long <strong>the</strong> life-span is<br />
after asymptotic SVL is reached. No histological exam<strong>in</strong>ations<br />
1980<br />
Time (days s<strong>in</strong>ce Jan. 1)<br />
FIG. 2. All observed male SVLs over entire study period (estimated brumation period excluded), with extrapolated male growth patterns (solid<br />
l<strong>in</strong>es) <strong>and</strong> <strong>the</strong>ir upper <strong>and</strong> lower 95% support-plane confidence limits (dashed l<strong>in</strong>es). Orig<strong>in</strong>s <strong>of</strong> extrapolated growth patterns were estimated from<br />
approximate time <strong>of</strong> parturition <strong>and</strong> average SVL <strong>of</strong> neonate males. L<strong>in</strong>es with no orig<strong>in</strong> on figure were extrapolated from preced<strong>in</strong>g years.<br />
TABLE 3. Parameter estimates with 95% conventional <strong>and</strong> support-plane confidence<br />
limits for SVL <strong>of</strong> females <strong>and</strong> males<br />
(A) Estimates <strong>and</strong> confidence limits <strong>of</strong> asymptotic length (a1)<br />
1981<br />
<strong>of</strong> yearl<strong>in</strong>g males were made to determ<strong>in</strong>e <strong>the</strong> age <strong>of</strong> onset <strong>of</strong><br />
<strong>sexual</strong> maturity, but enlargement <strong>of</strong> <strong>the</strong> hemipenial sacs beh<strong>in</strong>d<br />
<strong>the</strong> vent <strong>and</strong> production <strong>of</strong> femoral pore wax were taken as<br />
evidence <strong>of</strong> <strong>the</strong> onset <strong>of</strong> <strong>sexual</strong> maturity <strong>in</strong> males. These<br />
features became evident <strong>in</strong> yearl<strong>in</strong>gs between <strong>the</strong> end <strong>of</strong> May<br />
<strong>and</strong> <strong>the</strong> middle <strong>of</strong> June (90—120 active days afterbirth), when<br />
<strong>the</strong> yearl<strong>in</strong>gs are 32—38 mm SVL. On this basis, no <strong>sexual</strong>ly<br />
immature males were present <strong>in</strong> any population after <strong>the</strong> middle<br />
<strong>of</strong> June <strong>in</strong> 1979 <strong>and</strong> 1980, exclud<strong>in</strong>g each season’s YoY.<br />
Asymptotic SVL <strong>in</strong> males is reached <strong>in</strong> approximately 200—<br />
400 active days after birth, accord<strong>in</strong>g to <strong>the</strong> model (Fig. 6), or<br />
(on average) towards <strong>the</strong> end <strong>of</strong> <strong>the</strong> <strong>in</strong>dividual’s second full<br />
summer (Fig. 2). From <strong>the</strong> SVL distributions about <strong>the</strong> asymp<br />
tote <strong>in</strong> Fig. 2, a life-span <strong>of</strong> 3 years, at <strong>the</strong> least, is implied.<br />
The extrapolated growth rate <strong>of</strong> males, when plotted aga<strong>in</strong>st<br />
SVL (Fig. 3), <strong>in</strong>creases from birth to a peak with<strong>in</strong> <strong>the</strong> yearl<strong>in</strong>g<br />
SVL range, <strong>the</strong>n decl<strong>in</strong>es sharply as asymptotic SVL is
0.45<br />
0.40<br />
>, 0.35<br />
~0<br />
E<br />
0<br />
S<br />
0<br />
0.30<br />
0.25<br />
0.20<br />
0.15<br />
0.10<br />
0.05<br />
—<br />
.<br />
-‘. .<br />
..<br />
20.0 25.0 30.0 35.0 40.0 45.0 50.0 55.0 60.0 65.0 ~0.0 75.0 80.0<br />
Snout—vent length (mm)<br />
FIG. 3. Observed male growth rates ((L2 — L1)/D) plotted aga<strong>in</strong>st<br />
average SVL over grow<strong>in</strong>g period ((L1 + L2)/2). The extrapolated<br />
curve <strong>of</strong> growth rate aga<strong>in</strong>st SVL (solid l<strong>in</strong>e) with upper <strong>and</strong> lower<br />
95% support-plane confidence limits (dashed l<strong>in</strong>es) was plotted from<br />
a differential form <strong>of</strong> <strong>the</strong> male growth model.<br />
approached. The extrapolated 95% confidence <strong>in</strong>terval for <strong>the</strong><br />
growth rate <strong>in</strong>cludes most <strong>of</strong> <strong>the</strong> observed growth rates,<br />
although <strong>the</strong> model tends to underestimate growth rates with<strong>in</strong><br />
<strong>the</strong> yearl<strong>in</strong>g SVL range. Observed growth rates with<strong>in</strong> <strong>the</strong> large<br />
yearl<strong>in</strong>g—adult SVL range are almost all with<strong>in</strong> <strong>the</strong> 95%<br />
confidence <strong>in</strong>terval.<br />
The relationship <strong>of</strong> all observed female SVLs, over <strong>the</strong> entire<br />
study period, to <strong>the</strong> extrapolated SVL growth patterns with<br />
95% confidence <strong>in</strong>tervals (Fig. 4) is generally one <strong>of</strong> con<br />
formity, although <strong>the</strong>re are a number <strong>of</strong> observations ly<strong>in</strong>g<br />
above <strong>the</strong> upper 95% confidence limit <strong>of</strong> <strong>the</strong> asymptote <strong>and</strong> a<br />
few observations <strong>in</strong> <strong>the</strong> 40—55 mm SVL range which are not<br />
clearly associated with any growth curve cover<strong>in</strong>g that <strong>size</strong><br />
range. Aga<strong>in</strong>, observed SVLs <strong>of</strong> very young <strong>in</strong>dividuals <strong>and</strong><br />
neonates tend to lie outside <strong>of</strong> <strong>the</strong> 95% confidence limits<br />
<strong>of</strong> <strong>the</strong>ir associated curves because <strong>the</strong> model uses <strong>the</strong> average<br />
SVL <strong>of</strong> female neonates at parturition. Asymptotic SVL is<br />
approached at a slower rate <strong>in</strong> females than <strong>in</strong> males <strong>and</strong> female<br />
growth is more prolonged, although <strong>the</strong> growth patterns <strong>of</strong> <strong>the</strong><br />
two sexes are similar until approximately 120—160 active days<br />
after birth (Fig. 6). As with males, three age—<strong>size</strong> groups are<br />
evident: (I) Young <strong>of</strong> <strong>the</strong> year (Y0Y), <strong>in</strong>dividuals <strong>of</strong> approxi<br />
mately 22—35 mm SVL, present between <strong>the</strong> end <strong>of</strong> July <strong>and</strong><br />
<strong>the</strong> onset <strong>of</strong> brumation <strong>in</strong> September; (ii) yearl<strong>in</strong>gs, <strong>in</strong>dividuals<br />
<strong>of</strong> approximately 28—60 mm SVL, born <strong>the</strong> previous summer<br />
<strong>and</strong> present throughout <strong>the</strong> active season; (iii) adults, <strong>in</strong>divid<br />
uals <strong>of</strong> approximately ≥60 mm SVL, present throughout <strong>the</strong><br />
active season.<br />
Variable growth rates (Fig. 5) <strong>and</strong> <strong>the</strong> overlap <strong>of</strong> 95% con<br />
fidence <strong>in</strong>tervals near <strong>the</strong> asymptote (Fig. 4) make fur<strong>the</strong>r<br />
attempts to subdivide <strong>the</strong> female age—<strong>size</strong> groups <strong>in</strong>advisable.<br />
Longitud<strong>in</strong>al recapture series <strong>of</strong> some <strong>in</strong>dividuals, <strong>in</strong>terpreted<br />
<strong>in</strong> <strong>the</strong> light <strong>of</strong> <strong>the</strong> female SVL growth model, <strong>in</strong>dicate that <strong>the</strong><br />
female life-span may extend at least <strong>in</strong>to <strong>the</strong> fifth summer after<br />
birth. S<strong>in</strong>ce growth <strong>in</strong> SVL may cont<strong>in</strong>ue after <strong>the</strong> model’s<br />
asymptote is reached, statements about when asymptotic SVL<br />
is reached are perforce ra<strong>the</strong>r vague. Extrapolation from <strong>the</strong><br />
model (Fig. 6) <strong>in</strong>dicates that asymptotic SVL is reached be<br />
tween 350 <strong>and</strong> 600 active days after birth, <strong>in</strong> <strong>the</strong> summer after<br />
<strong>the</strong> second brumation, at <strong>the</strong> earliest (Fig. 4). There are no<br />
obvious external signs <strong>of</strong> <strong>sexual</strong> maturity <strong>in</strong> female lizards, <strong>and</strong><br />
no dissections were performed to determ<strong>in</strong>e at what SVL <strong>the</strong><br />
POWELL AND RUSSELL 145<br />
gonads mature. Sexual maturity most likely occurs <strong>in</strong> <strong>the</strong> year<br />
l<strong>in</strong>g age—<strong>size</strong> stage. s<strong>in</strong>ce <strong>in</strong>dividuals that were marked at that<br />
stage <strong>in</strong> 1979 were observed to breed <strong>in</strong> 1980.<br />
The extrapolated female growth rate curve plotted aga<strong>in</strong>st<br />
SVL (Fig. 5) is smoo<strong>the</strong>r than that for males (Fig. 3), with a<br />
lower maximum amplitude <strong>and</strong> without a well-marked peak.<br />
The extrapolated growth rate curve tends to underestimate <strong>the</strong><br />
growth rates <strong>of</strong> YoY <strong>and</strong> yearl<strong>in</strong>gs <strong>and</strong> to over- <strong>and</strong> under<br />
estimate <strong>the</strong> growth rates <strong>of</strong> adults. A similar phenomenon was<br />
noted by Dunham (1978) <strong>and</strong> Schoener <strong>and</strong> Schoener (1978).<br />
The variability <strong>of</strong> observed female growth rates is higher than<br />
that <strong>of</strong> observed male growth rates (Fig. 3). None<strong>the</strong>less, <strong>the</strong><br />
pattern <strong>of</strong> observed female growth rates broadly follows <strong>the</strong><br />
pattern set <strong>in</strong> <strong>the</strong> extrapolated growth rate curve. As <strong>in</strong> <strong>the</strong> male<br />
growth rate curve (Fig. 3), <strong>the</strong>re is an <strong>in</strong>crease <strong>in</strong> <strong>the</strong> extrapo<br />
lated female growth rate between <strong>the</strong> YoY <strong>and</strong> yearl<strong>in</strong>g SVL<br />
ranges <strong>and</strong> a decrease to <strong>the</strong> SVL asymptote from <strong>the</strong> yearl<strong>in</strong>g<br />
SVL range.<br />
The model SVL growth curves for <strong>the</strong> two sexes are similar<br />
<strong>in</strong> shape (Fig. 6). A mixed cohort <strong>of</strong> males <strong>and</strong> females would<br />
display similar growth rates until <strong>the</strong>y reached an age <strong>of</strong><br />
roughly 270 active days, by which time <strong>the</strong> slowest grow<strong>in</strong>g<br />
female with <strong>the</strong> lowest asymptotic SVL would have a greater<br />
SVL than that atta<strong>in</strong>ed by any male <strong>and</strong> growth would have<br />
virtually ceased <strong>in</strong> all but <strong>the</strong> slowest grow<strong>in</strong>g males. The<br />
females <strong>of</strong> <strong>the</strong> cohort would cont<strong>in</strong>ue grow<strong>in</strong>g until <strong>the</strong>y<br />
reached an asymptotic SVL at least 14 mm greater than <strong>the</strong><br />
greatest asymptotic SVL reached by any male. <strong>Growth</strong> <strong>in</strong><br />
females cont<strong>in</strong>ues as <strong>the</strong> lizards enter <strong>the</strong> adult SVL range <strong>and</strong><br />
slows down gradually with<strong>in</strong> this range, unlike growth <strong>in</strong><br />
males, which levels <strong>of</strong>f at <strong>the</strong> upper end <strong>of</strong> <strong>the</strong> yearl<strong>in</strong>g SVL<br />
range <strong>and</strong> cont<strong>in</strong>ues, if at all, at a very slow rate with<strong>in</strong> <strong>the</strong><br />
adult SVL range. There is no significant difference <strong>in</strong> goodness<br />
<strong>of</strong> fit between <strong>the</strong> male <strong>and</strong> female SVL growth models (F test,<br />
p > 0.05).<br />
Table 4 conta<strong>in</strong>s <strong>the</strong> statistics relevant to <strong>the</strong> least squares<br />
regressions used to arrive at <strong>the</strong> parameters <strong>of</strong> <strong>the</strong> allometric<br />
equations. In all cases, <strong>the</strong> correlation coefficient between <strong>the</strong><br />
variables is large. The distribution <strong>of</strong> <strong>the</strong> residuals from <strong>the</strong><br />
regression <strong>of</strong> TL on SVL <strong>in</strong> males <strong>in</strong>dicates that <strong>the</strong>re is some<br />
nonl<strong>in</strong>earity <strong>in</strong> <strong>the</strong> relationship between TL <strong>and</strong> SVL <strong>in</strong> <strong>the</strong><br />
lower reaches <strong>of</strong> <strong>the</strong> SVL range. This is also true <strong>of</strong> <strong>the</strong> residual<br />
plot <strong>of</strong> <strong>the</strong> HW regression <strong>in</strong> males, to a lesser extent, <strong>and</strong> <strong>of</strong><br />
<strong>the</strong> residual plot <strong>of</strong> HW <strong>in</strong> females. However, <strong>the</strong> variations are<br />
not great <strong>and</strong> <strong>the</strong> strength <strong>of</strong> <strong>the</strong> correlations (Table 4) <strong>in</strong>dicates<br />
that <strong>the</strong> allometric equations generated from <strong>the</strong>se regressions<br />
are a good approximation <strong>of</strong> <strong>the</strong> scal<strong>in</strong>g <strong>of</strong> <strong>the</strong> mensural charac<br />
ters with regard to SVL.<br />
There is considerable difference <strong>in</strong> <strong>the</strong> allometric relation<br />
ship <strong>of</strong> TL to SVL between <strong>the</strong> sexes (Fig. 7, Table 4), with a<br />
significant difference <strong>in</strong> <strong>the</strong> slopes <strong>of</strong> <strong>the</strong> regressions (Table 4),<br />
<strong>in</strong>dicat<strong>in</strong>g <strong>sexual</strong> <strong>dimorphism</strong> <strong>in</strong> both <strong>size</strong> <strong>and</strong> allometry. Males<br />
have a longer tail relative to SVL. However, <strong>the</strong>re are no<br />
significant differences between <strong>the</strong> slopes <strong>of</strong> <strong>the</strong> allometric<br />
equations <strong>of</strong> HW (Fig. 8, Table 4), nor between <strong>the</strong> slopes <strong>of</strong><br />
<strong>the</strong> allometric equations <strong>of</strong> HL (Fig. 9, Table 4) between <strong>the</strong><br />
sexes. These two features must be considered to be <strong>sexual</strong>ly<br />
dimorphic only as a function <strong>of</strong> SVL, s<strong>in</strong>ce <strong>the</strong>ir growth <strong>in</strong><br />
males can be expected to cease with <strong>the</strong> cessation <strong>of</strong> SVL<br />
growth <strong>and</strong> so <strong>the</strong>ir maximum <strong>size</strong>s will be smaller than <strong>in</strong><br />
females, which prolong SVL growth (Fig. 6), <strong>and</strong> thus growth<br />
<strong>in</strong> HL <strong>and</strong> 1-lW. No great difference <strong>in</strong> head dimensions is to be<br />
expected between a male <strong>and</strong> a similarly <strong>size</strong>d female.
146<br />
E<br />
E<br />
-c<br />
C<br />
a)<br />
C<br />
a)<br />
><br />
0<br />
C<br />
a.’)<br />
CAN. J. ZOOL. VOL. 63. 1985<br />
Time (days s<strong>in</strong>ce Jan. 1)<br />
FiG. 4. All observed female SVLs over entire study period (estimated brumation period excluded), with extrapolated female growth patterns<br />
(solid l<strong>in</strong>es) <strong>and</strong> <strong>the</strong>ir upper <strong>and</strong> lower 95% support-plane confidence limits (dashed l<strong>in</strong>es). Orig<strong>in</strong>s <strong>of</strong> extrapolated growth patterns were estimated<br />
from approximate time <strong>of</strong> parturition <strong>and</strong> average SVL <strong>of</strong> neonate females. L<strong>in</strong>es with no orig<strong>in</strong> on figure were extrapolated from preced<strong>in</strong>g years.<br />
0.45<br />
0.40<br />
5’<br />
(5 0.35<br />
~0<br />
E 0.30<br />
E<br />
CS<br />
0.25<br />
0.20<br />
0.15<br />
0<br />
0 0.10<br />
0.05<br />
.<br />
•.<br />
.<br />
.<br />
. .<br />
• .<br />
FIG. 5. Observed female growth rates ((L2 — L, )/D) plotted<br />
aga<strong>in</strong>st average SVL over grow<strong>in</strong>g period ((C1 + L2)/2). The extrapo<br />
lated curve <strong>of</strong> growth rate aga<strong>in</strong>st SVL (solid l<strong>in</strong>e) with upper <strong>and</strong><br />
lower 95% support-plane confidence limits (dashed l<strong>in</strong>es) was plotted<br />
from a differential form <strong>of</strong> <strong>the</strong> female growth model.<br />
The estimates <strong>of</strong> a1 <strong>and</strong> r, with <strong>the</strong>ir 95% confidence limits,<br />
for <strong>the</strong> grouped <strong>populations</strong> from <strong>the</strong> nor<strong>the</strong>rn <strong>and</strong> sou<strong>the</strong>rn<br />
parts <strong>of</strong> <strong>the</strong> range <strong>in</strong> <strong>Alberta</strong> are given <strong>in</strong> Table 6. Insufficient<br />
sample <strong>size</strong> prevented estimation <strong>of</strong> a1 <strong>and</strong> ,. for nor<strong>the</strong>rn males.<br />
There was no significant difference between <strong>the</strong> parameter<br />
estimates for <strong>the</strong> SVLs <strong>of</strong> <strong>the</strong> grouped sou<strong>the</strong>rn males <strong>and</strong> those<br />
<strong>of</strong> all males. That <strong>the</strong> elim<strong>in</strong>ation <strong>of</strong> <strong>the</strong> nor<strong>the</strong>rn male sample<br />
did not significantly alter <strong>the</strong> male parameter estimates implies<br />
that male growth patterns <strong>and</strong> asymptotic SVL do not vary<br />
significantly over <strong>the</strong> geographic range exam<strong>in</strong>ed. There is<br />
some overlap <strong>of</strong> <strong>the</strong> 95% support-plane confidence <strong>in</strong>tervals <strong>of</strong><br />
.<br />
._~_—~ .<br />
•I<br />
1979 1980 1981<br />
•.<br />
•<br />
.<br />
.<br />
• .<br />
20.0 25.0 3o.o 35.0 40.0 45.0 so.o 55.0 60.0<br />
Snout— vent length (mm)<br />
• .<br />
•<br />
•I<br />
asymptotic SVL between <strong>the</strong> nor<strong>the</strong>rn <strong>and</strong> sou<strong>the</strong>rn females<br />
<strong>and</strong> considerable overlap between <strong>the</strong> <strong>in</strong>tervals <strong>of</strong> r for <strong>the</strong>se<br />
two groups. <strong>Growth</strong> patterns <strong>and</strong> asymptotic SVL <strong>of</strong> females<br />
must, <strong>the</strong>refore, also be considered as nonvary<strong>in</strong>g over <strong>the</strong><br />
species’ range <strong>in</strong> <strong>Alberta</strong>.<br />
Mobility<br />
The statistics result<strong>in</strong>g from <strong>the</strong> analysis <strong>of</strong> <strong>the</strong> mobility data<br />
are summarized <strong>in</strong> Table 5. The mean distance between capture<br />
<strong>and</strong> recapture <strong>of</strong> males is considerably greater than <strong>the</strong> mean<br />
distance between capture <strong>and</strong> recapture <strong>of</strong> females, but <strong>the</strong><br />
difference between <strong>the</strong> means <strong>of</strong> <strong>the</strong> two sexes is only mar<br />
g<strong>in</strong>ally significant (p 0.05). This should be taken as <strong>in</strong>di<br />
cat<strong>in</strong>g that a difference does exist, but, due to <strong>the</strong> low level <strong>of</strong><br />
probability, it does not seem wise to predicate a great deal upon<br />
it. None<strong>the</strong>less, that <strong>the</strong>re were no significant differences <strong>in</strong> <strong>the</strong><br />
number <strong>of</strong> days between capture <strong>and</strong> recapture or <strong>in</strong> <strong>the</strong> rate <strong>of</strong><br />
movement between <strong>the</strong> sexes, <strong>in</strong>dicates that <strong>the</strong> difference <strong>in</strong><br />
<strong>the</strong> average distance between capture <strong>and</strong> recapture between<br />
<strong>the</strong> sexes is a real one. Independence <strong>of</strong> successive recaptures<br />
is suggested by <strong>the</strong> large mean number <strong>of</strong> days between <strong>the</strong>m<br />
(Table 5).<br />
Discussion<br />
Possible sources <strong>of</strong> error<br />
Despite efforts to reduce measur<strong>in</strong>g error, such error is<br />
<strong>in</strong>evitable <strong>in</strong> <strong>the</strong> tak<strong>in</strong>g <strong>of</strong> mensural data from a liv<strong>in</strong>g animal,<br />
as is evidenced by <strong>the</strong> necessity <strong>of</strong> fix<strong>in</strong>g <strong>the</strong> recapture data.<br />
The morphological data base is sufficiently large, however,<br />
that measurement error <strong>of</strong> any particular <strong>in</strong>dividual should be<br />
<strong>of</strong>fset. Similarly, sample <strong>size</strong> should compensate for mea<br />
surement error <strong>in</strong> <strong>in</strong>dividual recapture cases.<br />
The recapture sample for females is roughly thrice that <strong>of</strong> <strong>the</strong><br />
males. Few males were recaptured more than once, whereas
80.0<br />
75.0,<br />
70.0<br />
65.0<br />
60.0<br />
E<br />
E 55.0<br />
f 50.0<br />
0)<br />
C<br />
45•Q<br />
C<br />
5) 40.0<br />
><br />
35.0<br />
C<br />
ci) 30.0<br />
25.0<br />
sequential recaptures <strong>of</strong> <strong>in</strong>dividual females, extend<strong>in</strong>g over<br />
several months, were not uncommon. It is possible that male<br />
mortality is much higher, but this cannot be substantiated from<br />
<strong>the</strong> data available.<br />
The larger number <strong>of</strong> female recapture cases available for<br />
analysis <strong>of</strong> growth patterns means that <strong>the</strong> confidence <strong>in</strong>tervals<br />
(conventional or support plane) calculated for parameter esti<br />
mates used <strong>in</strong> <strong>the</strong> model <strong>of</strong> female growth are narrower than<br />
those for equivalent parameter estimates used <strong>in</strong> <strong>the</strong> model <strong>of</strong><br />
male growth. The degrees <strong>of</strong> freedom <strong>of</strong> <strong>the</strong>se statistics, <strong>and</strong><br />
POWELL AND RUSSELL<br />
0 30 60 90 120 150 180 210 240 270 300 330 380390 420 450 480510540 570 600 630 660<br />
Time (days s<strong>in</strong>ce birth)<br />
50 50- B<br />
A<br />
Females<br />
FIG. 6. Extrapolated male (solid l<strong>in</strong>e) <strong>and</strong> female (dashed <strong>and</strong> dotted l<strong>in</strong>e) SVL growth over time, from birth, with upper <strong>and</strong> lower 95%<br />
support-plane confidence limits (male, dotted l<strong>in</strong>es; female, dashed l<strong>in</strong>es). Orig<strong>in</strong>s <strong>of</strong> curves were estimated by average SVLs <strong>of</strong> male <strong>and</strong> female<br />
neonates.<br />
40 40-<br />
~30~ ~30-<br />
~20- ~20-<br />
I- I-.<br />
10- 10-<br />
FIG. 7. (A) Distribution <strong>of</strong> tail length aga<strong>in</strong>st SVL for all male captures, with allometric l<strong>in</strong>e (solid) <strong>and</strong> ± I SD <strong>of</strong> its exponent (dashed l<strong>in</strong>es).<br />
TL 0.181 ISVL’2979, n 165. (B) Distribution <strong>of</strong> tail length aga<strong>in</strong>st SVL for all female captures, with allometric l<strong>in</strong>e (solid) <strong>and</strong> ± I SD<br />
<strong>of</strong> its exponent (dashed l<strong>in</strong>es). TL 0.3651SVL1°584, n = 264.<br />
Males<br />
0— 0— 1<br />
20 30 40 50 60 70 80 20 30 40 50 60 70 80<br />
Snout— vent length (mm)<br />
Snout — vent length mm<br />
thus <strong>the</strong> absolute <strong>size</strong> <strong>of</strong> <strong>the</strong> result<strong>in</strong>g confidence limit, are<br />
partly determ<strong>in</strong>ed by <strong>the</strong> sample <strong>size</strong> (Sokal <strong>and</strong> Rohlf 1969;<br />
Schoener <strong>and</strong> Schoener 1978). The smaller number <strong>of</strong> male<br />
recapture cases results <strong>in</strong> a larger t or F statistic, as well as a<br />
larger st<strong>and</strong>ard deviation for <strong>the</strong> parameter estimate, <strong>and</strong> thus<br />
wider confidence <strong>in</strong>tervals will be calculated for estimates <strong>of</strong><br />
male parameters than for estimates <strong>of</strong> female parameters. It is<br />
possible that <strong>the</strong> degree <strong>of</strong> <strong>sexual</strong> <strong>size</strong> <strong>dimorphism</strong> displayed by<br />
P. d. brevirostre <strong>in</strong> <strong>the</strong> study area is greater than that <strong>in</strong>dicated<br />
by <strong>the</strong> model presented here, although <strong>the</strong>re is no significant<br />
147
148<br />
C<br />
C<br />
20<br />
6<br />
~ 12-<br />
I<br />
8-<br />
4<br />
A<br />
CAN. J. ZOOL. VOL. 63. 1985<br />
20 30 40 50 60 70 80 20 30 40 50 60 70 80<br />
Snout — vent length (mm) Snout— vent length (mm)<br />
FIG. 9. (A) Distribution <strong>of</strong> head length aga<strong>in</strong>st SVL for all male captures, with allometric l<strong>in</strong>e (solid) <strong>and</strong> ± I SD <strong>of</strong> its exponent (dashed<br />
l<strong>in</strong>es). HL = O.7OIOSVLO70v1, a = 165. (B) Distribution <strong>of</strong> head length aga<strong>in</strong>st SVL for all female captures, with allometric l<strong>in</strong>e (solid) <strong>and</strong><br />
± I SD <strong>of</strong> its exponent (dashed l<strong>in</strong>es). HL O.7157SVL°7°°2, a = 264.<br />
difference <strong>in</strong> goodness <strong>of</strong> fit between <strong>the</strong> two models. A larger<br />
male recapture sample should result <strong>in</strong> narrower 95% con<br />
fidence <strong>in</strong>tervals for <strong>the</strong> male parameter estimates <strong>and</strong> thus a<br />
reduced possibility <strong>of</strong> overlap between <strong>the</strong> support-plane con<br />
fidence limits <strong>of</strong> <strong>the</strong> two sexes’ parameter estimates. This is not<br />
likely true, however, <strong>of</strong> <strong>the</strong>a1 estimates for SVL <strong>of</strong> <strong>the</strong> nor<strong>the</strong>rn<br />
<strong>and</strong> sou<strong>the</strong>rn females. Both recapture samples <strong>in</strong> this case were<br />
sufficiently large that fur<strong>the</strong>r dim<strong>in</strong>ution <strong>of</strong> <strong>the</strong> t <strong>and</strong> F statistics<br />
with <strong>in</strong>creased sample <strong>size</strong> would have been negligible.<br />
One assumption made <strong>in</strong> us<strong>in</strong>g <strong>the</strong> modified logistic by<br />
weight growth model is that growth is determ<strong>in</strong>ate <strong>in</strong> P. d.<br />
brevirostre. This may not be <strong>the</strong> case. <strong>Growth</strong> is determ<strong>in</strong>ate<br />
<strong>in</strong> Anolis (Schoener <strong>and</strong> Schoener 1978), to which this model<br />
was first fitted, but <strong>the</strong>re is some evidence for nondeterm<strong>in</strong>ate<br />
growth <strong>in</strong> many o<strong>the</strong>r reptiles (Bellairs 1969). Cessation <strong>of</strong><br />
l<strong>in</strong>ear growth <strong>in</strong> lizards is signified by fusion <strong>of</strong> <strong>the</strong> epiphyses<br />
C<br />
C<br />
C<br />
I<br />
20<br />
12<br />
4<br />
11111’ I I<br />
20 30 40 50 60 70 80 20 30 40 50 60 70 80<br />
6-<br />
8<br />
Snout — vent length (mm) Snout — vent length (mm)<br />
FIG. 8. (A) Distribution <strong>of</strong> head width aga<strong>in</strong>st SVL for all male captures, with allometric l<strong>in</strong>e (solid) <strong>and</strong> ± I SD <strong>of</strong> its exponent (dashed l<strong>in</strong>es).<br />
HW = O.5295SVLov~e2, a = 165. (B) Distribution <strong>of</strong> head width aga<strong>in</strong>st SVL for all female captures, with allometric l<strong>in</strong>e (solid) <strong>and</strong> ± I SD<br />
<strong>of</strong> its exponent (dashed l<strong>in</strong>es). HW 0.461 lSVL°~’. a = 264.<br />
20- 20-<br />
A B<br />
<strong>and</strong> diaphysis <strong>of</strong> each long bone <strong>of</strong> <strong>the</strong> limbs (Ha<strong>in</strong>es 1969);<br />
this phenomenon does not seem to have been exam<strong>in</strong>ed <strong>in</strong><br />
Phiynoso<strong>in</strong>a. Effectively, however, growth <strong>in</strong> P. d. brevirostre<br />
appears to be determ<strong>in</strong>ate <strong>in</strong> that it slows down markedly <strong>and</strong><br />
<strong>in</strong> many <strong>in</strong>dividuals stops completely with<strong>in</strong> a def<strong>in</strong>ite SVL<br />
range, depend<strong>in</strong>g upon <strong>the</strong> sex.<br />
Sexual <strong>dimorphism</strong> <strong>and</strong> growth<br />
The degree to which males were correctly dist<strong>in</strong>guished from<br />
females by Eqs. 5 <strong>and</strong> 6 (Tables 1,2) <strong>in</strong>dicates that <strong>the</strong>re is<br />
significant <strong>sexual</strong> <strong>dimorphism</strong> <strong>in</strong> head, body, <strong>and</strong> tail dimen<br />
sions <strong>and</strong> <strong>in</strong> body proportions. The SVL range, which <strong>in</strong>cludes<br />
all <strong>of</strong> <strong>the</strong> <strong>in</strong>correctly classified cases for both analyses (“zone<br />
<strong>of</strong> uncerta<strong>in</strong>ty”), differs between <strong>the</strong> sexes, but <strong>in</strong>cludes only<br />
YoY- to yearl<strong>in</strong>g-<strong>size</strong>d <strong>in</strong>dividuals <strong>of</strong> ei<strong>the</strong>r sex. No adults<br />
were misclassified as to sex by ei<strong>the</strong>r <strong>of</strong> <strong>the</strong>se discrim<strong>in</strong>ant
POWELL AND RUSSELL 149<br />
TABLE 4. Components <strong>of</strong> allometric equations for TL, HW, <strong>and</strong> HL <strong>of</strong> <strong>the</strong><br />
two sexes<br />
Exponent<br />
n Constant (.~±SD) R2 F<br />
TL<br />
Males 165 0.1811 1.2979±0.027 0.934<br />
Females 264 0.3651 1.0584±0.013 0.964<br />
HW<br />
Males 165 0.5295 0.8062±0.016 0.939<br />
Females 264 0.461 I 0.8446±0.009 0.972<br />
HL<br />
Males 165 0.7010 0.7081±0.021 0.871<br />
37.03, df=2. 423<br />
(p
150 CAN. 3. ZOOL. VOL. 63. 1985<br />
TABLE 6. Parameter estimates with 95% conventional <strong>and</strong> support-plane confidence <strong>in</strong>tervals for SVL growth <strong>of</strong> males <strong>and</strong> females, grouped<br />
geographically<br />
a (asymptotic 95% conventional 95% support-plane r (characteristic 95% conventional 95% support-plane<br />
length, mm) <strong>in</strong>terval (mm) <strong>in</strong>terval (mm) growth rate) <strong>in</strong>terval <strong>in</strong>terval<br />
Nor<strong>the</strong>rn female 65.47 63. 17Sa, ≤67.77 62.54~a1 ~68.39 0.019592 0.0l352≤r~0.02566 0.0l202~r~0.027l7<br />
Sou<strong>the</strong>rn female 70.64 68.50~a1≤72.78 67.90≤a1 ≤73.38 0.014757 0.0l200≤r≤0.0175l 0.01 130≤r≤O.0l82l<br />
St<strong>and</strong>ard male* 52.34 48.39≤a1≤56.29 47.34≤a1~57.33 0.023847 0.01698≤r≤0.03072 O.0l5l6≤r≤0.03253<br />
Sou<strong>the</strong>rn male 49.74 44.55≤a ~54.93 43. l2≤a~ ≤56.36 0.025106 0.01961 ≤r≤0.03460 0.01300≤r≤0.03721<br />
*St<strong>and</strong>ard male statistics are derived from all male recaptures regardless <strong>of</strong> geographic location. They are provided br comparison with <strong>the</strong> sou<strong>the</strong>rn male statistics, s<strong>in</strong>ce an <strong>in</strong>adequate<br />
sample <strong>size</strong> prevented estimation <strong>of</strong> nor<strong>the</strong>rn male parameters.<br />
a difference <strong>in</strong> HL, accounts for <strong>the</strong> importance <strong>of</strong> HL/SVL <strong>in</strong><br />
Eq. 6. The zone <strong>of</strong> uncerta<strong>in</strong>ty <strong>of</strong> each sex for Eq. 6, as for Eq.<br />
5, is limited approximately by <strong>the</strong> SVL characteristic <strong>of</strong> lizards<br />
which are thought to be <strong>of</strong> an age capable <strong>of</strong> breed<strong>in</strong>g for <strong>the</strong><br />
first time. The logistic growth models for both sexes predict a<br />
close similarity <strong>in</strong> SVL between subadult males <strong>and</strong> subadult<br />
females, at least until male growth slows down. The SVL<br />
distributions <strong>of</strong> cases misclassified by both discrim<strong>in</strong>ant func<br />
tions reflects this predicted similarity. However, <strong>the</strong> number <strong>of</strong><br />
subadult lizards correctly classified to gender by <strong>the</strong> two<br />
functions shows that <strong>sexual</strong> <strong>dimorphism</strong> <strong>in</strong> <strong>the</strong> dimensions<br />
exam<strong>in</strong>ed is evident throughout <strong>the</strong> lizard’s life, though more<br />
strongly expressed after <strong>sexual</strong> maturity is reached. This is not<br />
unequivocally clear from <strong>the</strong> logistic growth curves (Fig. 6) or<br />
<strong>the</strong> allometric equations (Table 4) for <strong>the</strong> two sexes, but could<br />
reflect a difference <strong>in</strong> acuity between <strong>the</strong> two analyses.<br />
For <strong>the</strong> purposes <strong>of</strong> this discussion, <strong>sexual</strong> <strong>size</strong> <strong>dimorphism</strong><br />
can be categorized <strong>in</strong> a tripartite manner: male+, <strong>in</strong> which <strong>the</strong><br />
males <strong>of</strong> a species are <strong>the</strong> larger sex at adulthood (male<br />
SVL/female SVL > 1.0); female+, <strong>in</strong> which <strong>the</strong> females <strong>of</strong><br />
a species are <strong>the</strong> larger sex at adulthood (male SVL/female<br />
SVL < 1 .0); <strong>and</strong> monomorphic, <strong>in</strong> which <strong>the</strong>re is no significant<br />
<strong>size</strong> difference between <strong>the</strong> sexes at adulthood (male<br />
SVL/female SVL = 1.0). Fitch (1976) found a correlation<br />
between climatic seasonality <strong>and</strong> male+ <strong>dimorphism</strong> <strong>in</strong> Anolis,<br />
but noted that <strong>of</strong> <strong>the</strong> 50 species that he exam<strong>in</strong>ed, a greater<br />
proportion were nearly monomorphic than were dimorphic. In<br />
a survey <strong>of</strong> <strong>the</strong> genus Sceloporus, Fitch (1978) found that more<br />
than one-third <strong>of</strong> <strong>the</strong> species exam<strong>in</strong>ed were female+ dimor<br />
phic. This could be related to selection pressure imposed by<br />
large clutch <strong>size</strong> <strong>and</strong> (or) be<strong>in</strong>g s<strong>in</strong>gle clutched. Species from<br />
higher latitudes also tend to display female+ <strong>dimorphism</strong><br />
ow<strong>in</strong>g to <strong>the</strong> concentration <strong>of</strong> reproductive effort associated<br />
with a seasonal climate, which produces a similar result to that<br />
<strong>of</strong> be<strong>in</strong>g s<strong>in</strong>gle clutched.<br />
Schoener (1977) tabulated <strong>the</strong> available <strong>in</strong>formation on<br />
<strong>sexual</strong> <strong>size</strong> <strong>dimorphism</strong> <strong>in</strong> lizard species for which data on<br />
social structur<strong>in</strong>g are also available. Of <strong>the</strong> 59 species exam<br />
<strong>in</strong>ed, 57.75% are male+ dimorphic, 28.88% are female+<br />
dimorphic, <strong>and</strong> 13.37% are monomorphic. If attention is<br />
restricted to <strong>the</strong> iguanid species, <strong>the</strong> breakdown is as follows:<br />
male+ dimorphic, 73.53%; female+ dimorphic, 5.88%;<br />
monomorphic, 20.59%. These percentages <strong>in</strong>dicate that, <strong>in</strong><br />
general, lizard species which are monomorphic are <strong>in</strong> <strong>the</strong><br />
m<strong>in</strong>ority. Of <strong>the</strong> majority <strong>of</strong> species which are dimorphic, a<br />
greater percentage <strong>of</strong> <strong>the</strong> species tallied are male+ dimorphic<br />
<strong>and</strong> this is particularly true <strong>of</strong> <strong>the</strong> Iguanidae, to which Phryno<br />
soma belongs. Fitch (1981) performed a comprehensive census<br />
<strong>of</strong> <strong>sexual</strong> <strong>size</strong> <strong>dimorphism</strong> <strong>in</strong> <strong>the</strong> Reptilia <strong>and</strong> noted that male+<br />
<strong>dimorphism</strong> is more common <strong>in</strong> lizards <strong>and</strong> that monomorphic<br />
reptile species are very uncommon. He likewise po<strong>in</strong>ted out <strong>the</strong><br />
predom<strong>in</strong>ance <strong>of</strong> male+ <strong>dimorphism</strong> <strong>in</strong> <strong>the</strong> Iguanidae.<br />
Dietary niche partition<strong>in</strong>g <strong>in</strong> association with <strong>sexual</strong> <strong>size</strong><br />
<strong>dimorphism</strong> has been documented <strong>in</strong> some lizard species.<br />
Anolis lizards, which generally display male+ <strong>dimorphism</strong><br />
or monomorphism, have been discussed <strong>in</strong> this regard by<br />
Roughgarden (1974) <strong>and</strong> Schoener (1967, 1969, 1971, 1977).<br />
Female <strong>size</strong> can be strongly affected by requirements <strong>of</strong> clutch<br />
<strong>size</strong>, which may establish a m<strong>in</strong>imum adult <strong>size</strong> necessary for<br />
reproductive success. Selection for a particular <strong>size</strong> <strong>in</strong> one sex<br />
may result <strong>in</strong> <strong>the</strong> o<strong>the</strong>r sex be<strong>in</strong>g forced away from this <strong>size</strong> by<br />
<strong>in</strong>traspecific competition (Schoener 1970, 1977).<br />
Phrynosomes can all be classed as model I predators, def<strong>in</strong>ed<br />
simply as predators which sit <strong>and</strong> wait for <strong>the</strong>ir prey to come<br />
by, select<strong>in</strong>g it on <strong>the</strong> basis <strong>of</strong> its <strong>size</strong> <strong>and</strong> distance (Schoener<br />
1969). Model I predators, from considerations <strong>of</strong> forag<strong>in</strong>g<br />
<strong>the</strong>ory, are expected to display <strong>sexual</strong> <strong>size</strong> <strong>dimorphism</strong>,<br />
particularly when few competitors are present (Schoener<br />
1969), assum<strong>in</strong>g that food availability is a limit<strong>in</strong>g factor.<br />
S<strong>in</strong>ce <strong>the</strong> two sexes are <strong>of</strong> different <strong>size</strong>s, <strong>the</strong>y would be<br />
expected to have different prey-h<strong>and</strong>l<strong>in</strong>g capabilities, <strong>and</strong> thus<br />
to exploit differ<strong>in</strong>g prey <strong>size</strong> ranges. This would enable <strong>the</strong><br />
species as a whole to widen its dietary niche <strong>and</strong> to reduce<br />
<strong>in</strong>traspecific competition for food (Roughgarden 1974;<br />
Schoener 1969, 1977).<br />
Prey-h<strong>and</strong>l<strong>in</strong>g capabilities will depend upon jaw <strong>size</strong> <strong>in</strong><br />
phrynosomes, <strong>and</strong> jaw <strong>size</strong> is determ<strong>in</strong>ed by head dimensions.<br />
If jaw <strong>size</strong> is different between <strong>the</strong> sexes, some difference <strong>in</strong><br />
prey-h<strong>and</strong>l<strong>in</strong>g capability might be expected as well. The allo<br />
metric models <strong>of</strong> HL <strong>and</strong> HW growth (Figs. 8, 9, Table 4)<br />
<strong>in</strong>dicate that <strong>the</strong>re will be a considerable difference <strong>in</strong> jaw <strong>size</strong><br />
between <strong>the</strong> sexes at adulthood. This lends some weight to <strong>the</strong><br />
dietary niche partition<strong>in</strong>g hypo<strong>the</strong>sis. Sexual <strong>size</strong> <strong>dimorphism</strong><br />
would not be so important <strong>in</strong> subadult lizards, s<strong>in</strong>ce its ma<strong>in</strong><br />
importance <strong>in</strong> dietary niche partition<strong>in</strong>g would be to reduce<br />
dietary competition between breed<strong>in</strong>g females <strong>and</strong> adult males.<br />
Females must deal with <strong>the</strong> metabolic costs <strong>of</strong> vitellogenesis<br />
(Packard et al. 1977) <strong>and</strong>, <strong>in</strong> vivipar<strong>in</strong>es, gravidity (Guillette<br />
1982), while <strong>the</strong> males have no such energetic costs to meet.<br />
Dietary niche partition<strong>in</strong>g associated with <strong>sexual</strong> <strong>size</strong> dimor<br />
phism has been noted <strong>in</strong> Natrix natrix, ano<strong>the</strong>r female+ dimor<br />
phic vivipar<strong>in</strong>e (Madsen 1983). In this case, <strong>size</strong>-associated<br />
female fecundity was implicated as <strong>the</strong> selective force directly<br />
produc<strong>in</strong>g <strong>the</strong> <strong>dimorphism</strong>, dietary niche partition<strong>in</strong>g be<strong>in</strong>g<br />
regarded as a corollary re<strong>in</strong>forc<strong>in</strong>g <strong>the</strong> <strong>dimorphism</strong> (Madsen<br />
1983).<br />
A proper evaluation <strong>of</strong> this hypo<strong>the</strong>sis with regard to <strong>the</strong><br />
<strong>Alberta</strong> <strong>populations</strong> <strong>of</strong> P. d. brevirostre requires <strong>in</strong>formation<br />
on <strong>the</strong> diet, on whe<strong>the</strong>r <strong>the</strong>se <strong>populations</strong> are food limited, <strong>and</strong><br />
also on whe<strong>the</strong>r female+ <strong>dimorphism</strong> is less marked <strong>in</strong> this<br />
species <strong>in</strong> areas where <strong>the</strong>re are saurian competitors. Dietary<br />
analysis <strong>in</strong>dicates that <strong>the</strong> dietary niche is partitioned between
adult females on one h<strong>and</strong> <strong>and</strong> all males <strong>and</strong> subadult females<br />
on <strong>the</strong> o<strong>the</strong>r (Powell <strong>and</strong> Russell 1984), but it was not<br />
determ<strong>in</strong>ed if food was limit<strong>in</strong>g for <strong>the</strong>se <strong>populations</strong>, or if<br />
<strong>in</strong>ter<strong>sexual</strong> dietary competition did occur. <strong>in</strong>formation on <strong>the</strong><br />
geographical variation <strong>in</strong> <strong>sexual</strong> <strong>size</strong> <strong>dimorphism</strong> <strong>in</strong> this<br />
species, <strong>and</strong> its relationship to diet, are still lack<strong>in</strong>g, <strong>and</strong> so<br />
<strong>in</strong>traspecific dietary competition cannot be accepted as <strong>the</strong> sole<br />
force produc<strong>in</strong>g <strong>and</strong> ma<strong>in</strong>ta<strong>in</strong><strong>in</strong>g <strong>the</strong> <strong>sexual</strong> <strong>size</strong> <strong>dimorphism</strong><br />
characteristic <strong>of</strong> <strong>the</strong> <strong>Alberta</strong> <strong>populations</strong>. Possibly, dietary<br />
niche partition<strong>in</strong>g is a corollary <strong>of</strong> a <strong>sexual</strong> <strong>size</strong> <strong>dimorphism</strong><br />
produced by some o<strong>the</strong>r selective force, ra<strong>the</strong>r than <strong>the</strong> selec<br />
tive force itself. It is also possible that it works <strong>in</strong> conjunction<br />
with o<strong>the</strong>r selective forces to produce <strong>sexual</strong> <strong>size</strong> <strong>dimorphism</strong><br />
(for a more extensive consideration see Powell <strong>and</strong> Russell<br />
1984).<br />
Ghisel<strong>in</strong> (1974) discussed <strong>the</strong> phenomenon <strong>of</strong> <strong>sexual</strong> <strong>size</strong><br />
<strong>dimorphism</strong> <strong>in</strong> <strong>the</strong> context <strong>of</strong> <strong>sexual</strong> selection <strong>and</strong> set out four<br />
possible types <strong>of</strong> male— male competition which could promote<br />
it. Three <strong>of</strong> <strong>the</strong>se would most likely lead to male+ <strong>dimorphism</strong><br />
or to monomorphism. The fourth, male dispersal competition,<br />
puts a premium on mobility <strong>and</strong> early maturation <strong>in</strong> males,<br />
s<strong>in</strong>ce <strong>the</strong>y are <strong>in</strong> a race to f<strong>in</strong>d <strong>and</strong> <strong>in</strong>sem<strong>in</strong>ate as many females<br />
as possible. This last category <strong>of</strong> male—male competition is<br />
likely to lead to female+ <strong>dimorphism</strong>. if males are selected for<br />
mobility <strong>and</strong> early maturation, <strong>the</strong>y are likely to devote more<br />
resources to <strong>the</strong>se functions than to growth <strong>in</strong> body <strong>size</strong>, <strong>and</strong><br />
thus are likely to be smaller at maturity than females, which are<br />
under no such constra<strong>in</strong>ts. Dwarf males are more likely to<br />
occur under certa<strong>in</strong> circumstances: (i) when greater body <strong>size</strong><br />
reduces mobility; (ii) when <strong>the</strong>re is a premium on long life <strong>in</strong><br />
females, but not <strong>in</strong> males; (iii) when population densities are<br />
low, <strong>in</strong>traspecific encounters are rare, <strong>and</strong> <strong>the</strong>re is little selec<br />
tion for features associated with male—male agonistic encoun<br />
ters but much selection for features facilitat<strong>in</strong>g male mobility<br />
<strong>and</strong> mate-search<strong>in</strong>g abilities. Ghisel<strong>in</strong> (1974) considers this last<br />
condition to be <strong>the</strong> most important.<br />
Berry <strong>and</strong> Sh<strong>in</strong>e (1980) employed <strong>sexual</strong> selection <strong>the</strong>ory to<br />
expla<strong>in</strong> <strong>sexual</strong> <strong>size</strong> <strong>dimorphism</strong> <strong>in</strong> chelonians, <strong>and</strong> found that<br />
<strong>the</strong> mat<strong>in</strong>g system <strong>and</strong> <strong>the</strong> type <strong>of</strong> <strong>sexual</strong> <strong>size</strong> <strong>dimorphism</strong><br />
found <strong>in</strong> a particular species conformed to <strong>the</strong> predictions <strong>of</strong><br />
Ghisel<strong>in</strong>’s (1974) <strong>the</strong>ory. They also suggested that <strong>the</strong> rela<br />
tionship <strong>of</strong> <strong>size</strong> to fecundity is important <strong>in</strong> establish<strong>in</strong>g female<br />
<strong>size</strong>. A m<strong>in</strong>imum female <strong>size</strong> could be set by selection pres<br />
sures on clutch <strong>size</strong>. In addition, viviparity, particularly <strong>in</strong><br />
lizards, tends to be correlated with delayed maturity <strong>and</strong> greater<br />
body <strong>size</strong> at <strong>sexual</strong> maturity (T<strong>in</strong>kle eta!. 1970). These factors<br />
could serve to hold m<strong>in</strong>imum female <strong>size</strong> relatively <strong>in</strong>variable,<br />
while not constra<strong>in</strong><strong>in</strong>g m<strong>in</strong>imum male <strong>size</strong>.<br />
Delayed reproduction <strong>and</strong> fernale+ <strong>dimorphism</strong> are found <strong>in</strong><br />
<strong>the</strong> viviparous red-sided garter snake (Tha<strong>in</strong>nophis sirtalis<br />
parietatis) near <strong>the</strong> nor<strong>the</strong>rn extreme <strong>of</strong> its range <strong>in</strong> Manitoba<br />
(Gregory 1977) <strong>and</strong> viviparity has been suggested as a selective<br />
force contribut<strong>in</strong>g to female+ <strong>dimorphism</strong> <strong>in</strong> T.sirtalis <strong>in</strong> <strong>the</strong><br />
north-central United States (Benton 1980). Madsen (1983)<br />
found that females <strong>of</strong> <strong>the</strong> vivipar<strong>in</strong>e Natrix natrix <strong>in</strong> sou<strong>the</strong>rn<br />
Sweden exhibited delayed maturity compared with males <strong>and</strong><br />
also grow at a faster rate, result<strong>in</strong>g <strong>in</strong> female+ <strong>dimorphism</strong> at<br />
maturity. There is a positive correlation between female <strong>size</strong><br />
<strong>and</strong> fecundity, but no apparent relationship between greater<br />
male <strong>size</strong> <strong>and</strong> reproductive success, which probably accounts<br />
for this <strong>dimorphism</strong> (Madsen 1983).<br />
Delayed maturity <strong>in</strong> female P. d. brevirostre <strong>in</strong> <strong>Alberta</strong> is<br />
evident from Fig. 6, <strong>and</strong> <strong>the</strong> viviparity <strong>of</strong> <strong>the</strong> species is well<br />
POWELL AND RUSSELL 151<br />
documented. This suggests that female <strong>size</strong> is under <strong>the</strong> con<br />
stra<strong>in</strong>ts outl<strong>in</strong>ed above. The predicted SVL growth curves <strong>of</strong><br />
both sexes (Fig. 6) show that, while growth patterns are similar<br />
for <strong>the</strong> first 120—160 active days <strong>of</strong> growth, male growth<br />
ceases rapidly after this, with males reach<strong>in</strong>g a consequently<br />
smaller SVL at maturity. Female SVL growth cont<strong>in</strong>ues longer<br />
<strong>and</strong> tapers <strong>of</strong>f more slowly. A similar pattern was observed <strong>in</strong><br />
P. d. douglassi <strong>in</strong> idaho by Guyer (1978). The similarity <strong>of</strong><br />
growth rate until <strong>the</strong> smaller sex reaches asymptotic <strong>size</strong> is<br />
characteristic <strong>of</strong> freshwater turtles, but generally <strong>in</strong> reptiles <strong>the</strong><br />
sex which is larger at adulthood grows faster <strong>in</strong> <strong>the</strong> juvenile<br />
stage (Andrews 1982). These observations suggest that matura<br />
tion occurs earlier <strong>in</strong> male P. douglassi than <strong>in</strong> females. Pos<br />
sibly more resources are devoted to early maturation than to<br />
growth, with a consequent small <strong>size</strong> at maturity <strong>in</strong> males. If<br />
this, <strong>in</strong>deed, is <strong>the</strong> case, <strong>the</strong>n male P. d. brevirostre, when<br />
compared with females, exhibit relative paedomorphosis by<br />
means <strong>of</strong> truncation <strong>of</strong> somatic growth <strong>and</strong> acceleration <strong>of</strong> <strong>the</strong><br />
development <strong>of</strong> reproductive organs (Gould 1977).<br />
Densities <strong>in</strong> Phrvnosoma <strong>populations</strong> are usually low<br />
(Pianka <strong>and</strong> Parker 1975), considerably less than <strong>the</strong> geometric<br />
mean <strong>of</strong> 51 <strong>in</strong>dividuals/ha estimated for lizards by Turner<br />
(1977). The densities <strong>of</strong> <strong>the</strong> <strong>populations</strong> exam<strong>in</strong>ed <strong>in</strong> this study<br />
were not determ<strong>in</strong>ed with any degree <strong>of</strong> accuracy, but were<br />
certa<strong>in</strong>ly lower than Turner’s (1977) mean. Social behaviours<br />
<strong>and</strong> structur<strong>in</strong>g are generally held to be weakly developed <strong>in</strong><br />
phrynosomes (Carpenter <strong>and</strong> Ferguson 1977; Stamps 1977) <strong>and</strong><br />
associated display organs are not evident. However, Tollestrup<br />
(1981) found that P.~ <strong>and</strong> P. p!atvrh<strong>in</strong>os have welldeveloped<br />
display repertoires, imply<strong>in</strong>g that social structur<strong>in</strong>g<br />
is more complex <strong>in</strong> <strong>the</strong>se two species than is generally<br />
imag<strong>in</strong>ed. These f<strong>in</strong>d<strong>in</strong>gs cannot yet be extended to o<strong>the</strong>r<br />
species, although Montanucci <strong>and</strong> Bauer (1982) described a<br />
moderately complex courtship repertoire for P. doug/assi. In<br />
<strong>the</strong> course <strong>of</strong> this study, only one male—male <strong>in</strong>teraction, <strong>of</strong><br />
short duration <strong>and</strong> <strong>in</strong>tensity, was observed, <strong>in</strong> late May <strong>of</strong><br />
1979, <strong>and</strong> lizards were seldom found <strong>in</strong> close proximity to one<br />
ano<strong>the</strong>r. The low number <strong>of</strong> sequential male recaptures sug<br />
gests that males may be relatively mobile. The sedentary habits<br />
<strong>of</strong> females seem well established by <strong>the</strong> number <strong>of</strong> <strong>in</strong>dividuals<br />
for which long sequential recapture records exist. if <strong>the</strong> females<br />
are sedentary, males, by implication, will be mobile, as <strong>the</strong>y<br />
will have to seek <strong>the</strong> females out to mate with <strong>the</strong>m.<br />
This hypo<strong>the</strong>sis cannot be adopted with a great deal <strong>of</strong> cer<br />
ta<strong>in</strong>ty because <strong>the</strong>re is some question as to <strong>the</strong> underly<strong>in</strong>g<br />
reason for <strong>the</strong> paucity <strong>of</strong> sequential male recaptures. Guyer<br />
(1978) found a preponderance <strong>of</strong>. female P. doug/assi at his<br />
study site <strong>in</strong> Idaho <strong>and</strong> posited heavy w<strong>in</strong>ter mortality <strong>of</strong> year<br />
l<strong>in</strong>g males to expla<strong>in</strong> this. There was no significant difference<br />
<strong>in</strong> distribution <strong>of</strong> home range <strong>size</strong> between adults <strong>of</strong> <strong>the</strong> two<br />
sexes (males, ii = 3; females, n 5; Mann—Whitney U-test,<br />
p > 0.05) at this Idaho site (Guyer 1978), which casts some<br />
doubt on <strong>the</strong> hypo<strong>the</strong><strong>size</strong>d greater mobility <strong>of</strong> males. The<br />
results <strong>of</strong> <strong>the</strong> analysis <strong>of</strong> male <strong>and</strong> female mobility presented<br />
here (Table 5) are suggestive, however, but cannot be taken as<br />
strong evidence for <strong>the</strong> male dispersal competition hypo<strong>the</strong>sis.<br />
A sample <strong>of</strong> male <strong>and</strong> female home range <strong>size</strong>s to which statis<br />
tics could be applied is necessary to be able to establish whe<strong>the</strong>r<br />
or not <strong>the</strong>re is a difference <strong>in</strong> <strong>size</strong> between <strong>the</strong>m. An <strong>in</strong>vesti<br />
gation <strong>of</strong> sex-specific survivorship <strong>in</strong> <strong>the</strong> <strong>Alberta</strong> <strong>populations</strong> is<br />
also required to test <strong>the</strong> possibility that <strong>the</strong> difference <strong>in</strong> recap<br />
ture rate between <strong>the</strong> sexes is due to differential mortality rates<br />
ra<strong>the</strong>r than greater mobility <strong>in</strong> one sex.
152 CAN. 3. ZOOL. VOL. 63. 985<br />
If a smaller <strong>size</strong> at maturity <strong>in</strong> males is a result <strong>of</strong> <strong>the</strong><br />
rechannell<strong>in</strong>g <strong>of</strong> resources <strong>in</strong>to early maturation <strong>and</strong> vagility,<br />
<strong>the</strong>n <strong>the</strong> benefits <strong>of</strong> smallness are evident. There are no grounds<br />
for believ<strong>in</strong>g that smaller adult <strong>size</strong> <strong>of</strong> itself confers any advan<br />
tage <strong>in</strong> mobility to males. However, male dispersal competition<br />
as an explanation for fernale+ <strong>dimorphism</strong> <strong>in</strong> <strong>the</strong> <strong>Alberta</strong> pop<br />
ulations <strong>of</strong> P. d. brevirostre has considerable plausibility.<br />
Female phrynosomes will be under different selectional con<br />
stra<strong>in</strong>ts from males with regard to growth. It is evident from<br />
Fig. 4, <strong>and</strong> particularly from Fig. 6, that females exhibit rela<br />
tively delayed maturity compared with males. T<strong>in</strong>kle et at.<br />
(1970) observed that <strong>the</strong> females <strong>of</strong> viviparous lizard species<br />
display delayed maturity <strong>and</strong> a greater body <strong>size</strong> at maturity.<br />
Delayed reproduction confers a reproductive advantage to <strong>the</strong><br />
<strong>in</strong>dividual, because <strong>the</strong> larger a female is at <strong>the</strong> time <strong>of</strong> her first<br />
clutch, <strong>the</strong> larger <strong>the</strong> clutch mass that she can produce (T<strong>in</strong>kle<br />
<strong>and</strong> Hadley 1975). T<strong>in</strong>kle <strong>and</strong> Ball<strong>in</strong>ger (1972), <strong>in</strong> <strong>the</strong>ir study<br />
<strong>of</strong> <strong>in</strong>traspecific demographic variability <strong>in</strong> <strong>the</strong> oviparous Scelo<br />
porus undulatus, suggested that growth is faster <strong>in</strong> sou<strong>the</strong>rn<br />
<strong>populations</strong> ow<strong>in</strong>g to selection for rapid maturation, but that<br />
life-spans were longer <strong>in</strong> <strong>the</strong> nor<strong>the</strong>rn <strong>populations</strong> ow<strong>in</strong>g to <strong>the</strong><br />
selection for delayed reproduction.<br />
The viviparity <strong>of</strong> P. doug/assi is established (Pianka <strong>and</strong><br />
Parker 1975). SVL growth <strong>in</strong> females cont<strong>in</strong>ues until 480—600<br />
active days after birth, accord<strong>in</strong>g to extrapolation from <strong>the</strong><br />
model (Fig. 6), a considerable period after <strong>the</strong> cessation <strong>of</strong><br />
male growth as extrapolated from <strong>the</strong> male model. Placed <strong>in</strong> a<br />
seasonal context, curves extrapolated from <strong>the</strong> female SVL<br />
growth model show growth slow<strong>in</strong>g <strong>in</strong> <strong>the</strong> summer after <strong>the</strong><br />
second brumation <strong>and</strong> effectively ceas<strong>in</strong>g <strong>in</strong> <strong>the</strong> summer after<br />
<strong>the</strong> third brumation (Fig. 4). No yearl<strong>in</strong>g females were found<br />
to be gravid, although this cannot be stated with certa<strong>in</strong>ty<br />
ow<strong>in</strong>g to problems with <strong>the</strong> ascerta<strong>in</strong><strong>in</strong>g <strong>of</strong> gravidity (see<br />
above). The youngest females that can be said with assurance<br />
to have bred are estimated, from longitudal records, to have<br />
been <strong>in</strong> <strong>the</strong> summer after <strong>the</strong>ir second brumation, <strong>and</strong> by <strong>the</strong><br />
time <strong>of</strong> parturition (late July — early August) <strong>the</strong>y would have<br />
achieved near-asymptotic SVL (Fig. 4). Ball<strong>in</strong>ger (1973) found<br />
that females <strong>of</strong> <strong>the</strong> viviparous Sceloporus po<strong>in</strong>setti likewise did<br />
not breed until <strong>the</strong> summer after <strong>the</strong>ir second brumation,<br />
although <strong>the</strong>y atta<strong>in</strong>ed <strong>sexual</strong> maturity a year earlier. However,<br />
females <strong>of</strong> <strong>the</strong> lowl<strong>and</strong> <strong>populations</strong> <strong>of</strong> <strong>the</strong> vivipar<strong>in</strong>e S. jarrovi<br />
may breed for <strong>the</strong> first time <strong>in</strong> <strong>the</strong> summer after <strong>the</strong>ir first<br />
brumation (Ball<strong>in</strong>ger 1973; T<strong>in</strong>kle <strong>and</strong> Hadley 1975). Pilorge<br />
(198 Ia, 198lb) noted similar early maturity <strong>in</strong> females <strong>of</strong> <strong>the</strong><br />
vivipar<strong>in</strong>e Lacerta vivipara <strong>in</strong> central France, <strong>and</strong> stated that<br />
viviparity should not be considered as an adaptive strategy<br />
per Se, but as a component <strong>of</strong> each <strong>in</strong>dividual species’ repro<br />
ductive strategy (Pilorge 198 lb). Thus, delayed maturity is not<br />
necessarily a correlate <strong>of</strong> viviparity <strong>in</strong> lizards. None<strong>the</strong>less, <strong>in</strong><br />
high-latitude or montane vivipar<strong>in</strong>es, <strong>the</strong> association between<br />
delayed maturity <strong>in</strong> females <strong>and</strong> viviparity seems to be valid<br />
(T<strong>in</strong>kle ci at. 1970; Ball<strong>in</strong>ger 1973).<br />
Phrynoso<strong>in</strong>a d. douglassi <strong>in</strong> sou<strong>the</strong>rnidaho displays similar<br />
female SVL growth patterns tq P. d. brevirostre <strong>in</strong> <strong>Alberta</strong>,<br />
growth cont<strong>in</strong>u<strong>in</strong>g through <strong>the</strong> summer after <strong>the</strong> second<br />
brumation (Guyer 1978), although no data are available on<br />
breed<strong>in</strong>g age. Unfortunately, <strong>the</strong>re are no comparative data on<br />
growth patterns <strong>and</strong> breed<strong>in</strong>g age for P. douglassi elsewhere <strong>in</strong><br />
its range. However, <strong>the</strong> <strong>Alberta</strong> <strong>populations</strong> seem to conform<br />
to o<strong>the</strong>r predictions <strong>of</strong> T<strong>in</strong>kle ci at. (1970) with regard to<br />
viviparous lizards. They are long-lived accord<strong>in</strong>g to <strong>the</strong> longi<br />
tud<strong>in</strong>al records, although, as discussed above, this can be said<br />
with more assurance about <strong>the</strong> females than about <strong>the</strong> males.<br />
They are s<strong>in</strong>gle clutched <strong>in</strong> <strong>Alberta</strong>, a strategy which is appar<br />
ently characteristic <strong>of</strong> <strong>the</strong> species over its range (Pianka <strong>and</strong><br />
Parker 1975) <strong>and</strong> one to be expected <strong>in</strong> a viviparous lizard<br />
(T<strong>in</strong>kle et at. 1970). Slow growth <strong>and</strong> delayed maturity <strong>in</strong><br />
females would also be selected for <strong>in</strong> lizard <strong>populations</strong><br />
dwell<strong>in</strong>g <strong>in</strong> ecologically marg<strong>in</strong>al situations (T<strong>in</strong>kle 1967),<br />
such as montane areas or <strong>the</strong> nor<strong>the</strong>rn marg<strong>in</strong>s <strong>of</strong> <strong>the</strong> species’<br />
range (Ball<strong>in</strong>ger 1979; Ferguson <strong>and</strong> Brockman 1980). Fitch<br />
(1978) found <strong>the</strong>re to be a correlation between female+ dimor<br />
phism <strong>and</strong> a large clutch mass <strong>and</strong> (or) a s<strong>in</strong>gle clutch <strong>in</strong> <strong>the</strong><br />
genus Scetoporus, <strong>and</strong> a greater tendency towards female+<br />
<strong>dimorphism</strong> <strong>in</strong> temperate zone species <strong>of</strong> this genus.<br />
Selection for delayed maturity <strong>and</strong> greater <strong>size</strong> at maturity<br />
would naturally affect females but not males, s<strong>in</strong>ce <strong>the</strong> selec<br />
tion pressure is related to viviparity <strong>and</strong> (or) clutch <strong>size</strong>.<br />
Male dispersal competition would put a premium on rapid,<br />
<strong>in</strong>variate growth <strong>in</strong> males, as a certa<strong>in</strong> <strong>size</strong> must be reached to<br />
make mat<strong>in</strong>g physically possible; after this po<strong>in</strong>t is reached,<br />
resources would be diverted <strong>in</strong>to gonadal maturation <strong>and</strong><br />
vagility. Males are engaged <strong>in</strong> a race to reach a m<strong>in</strong>imum<br />
breed<strong>in</strong>g <strong>size</strong> <strong>and</strong> mature <strong>sexual</strong>ly as quickly as possible. By<br />
this hypo<strong>the</strong>sis, selection will constra<strong>in</strong> growth. Females, on<br />
<strong>the</strong> o<strong>the</strong>r h<strong>and</strong>, are not compet<strong>in</strong>g to atta<strong>in</strong> a particular <strong>size</strong> <strong>and</strong><br />
mate as frequently as possible. Selection pressures require<br />
<strong>the</strong>m to delay maturity <strong>and</strong> maximize <strong>size</strong> at first breed<strong>in</strong>g, but<br />
after that po<strong>in</strong>t is reached <strong>the</strong>re is no reason to believe that <strong>the</strong>se<br />
selection pressures will operate with such force, <strong>and</strong> so sub<br />
sequent growth may be more variable. Atta<strong>in</strong>ment <strong>of</strong> great <strong>size</strong><br />
<strong>in</strong> a female entails great clutch <strong>size</strong> <strong>and</strong> thus reproductive<br />
success, but maximum <strong>size</strong> atta<strong>in</strong>able will be controlled by<br />
grow<strong>in</strong>g season length (Stewart 1979) <strong>and</strong> <strong>the</strong> various environ<br />
mental factors enumerated above which affect growth.<br />
The above data <strong>and</strong> discussion thus <strong>in</strong>dicate that males atta<strong>in</strong><br />
<strong>the</strong>ir asymptotic <strong>size</strong> more rapidly than females do <strong>the</strong>irs, by<br />
early cessation <strong>of</strong> growth, <strong>and</strong> that females atta<strong>in</strong> a greater<br />
asymptotic SVL by relative prolongation <strong>and</strong> a more gradual<br />
taper<strong>in</strong>g <strong>of</strong>f <strong>of</strong> growth. The male growth pattern corresponds to<br />
that expected if selection is for early maturation. This con<br />
forms, at least <strong>in</strong> part, to <strong>the</strong> explanation <strong>of</strong> female+ dimor<br />
phism <strong>in</strong> <strong>the</strong>se <strong>populations</strong> as be<strong>in</strong>g related to male dispersal<br />
competition.<br />
The female SVL model also reveals positive factors related<br />
to survival <strong>in</strong> a range-marg<strong>in</strong>al area <strong>and</strong> can be <strong>in</strong>terpreted as<br />
<strong>the</strong> result <strong>of</strong> selection for delayed maturity. Selection pressure<br />
on growth rate <strong>and</strong> asymptotic <strong>size</strong> would not be so extreme <strong>in</strong><br />
females. Thus, <strong>the</strong> degree to which maturity is delayed, <strong>and</strong> <strong>the</strong><br />
associated growth rate <strong>and</strong> asymptotic <strong>size</strong>, would be expected<br />
to be more variable than is <strong>the</strong> case with males. The major<br />
criteria be<strong>in</strong>g selected for <strong>in</strong> females, if this l<strong>in</strong>e <strong>of</strong> reason<strong>in</strong>g<br />
is followed, would be associated with <strong>the</strong> m<strong>in</strong>imum body <strong>size</strong><br />
at which a reasonably <strong>size</strong>d clutch could be carried. Associated<br />
with this may be <strong>the</strong> delay<strong>in</strong>g <strong>of</strong> reproduction until <strong>the</strong> <strong>size</strong> <strong>of</strong><br />
<strong>the</strong> female’s cloaca is sufficient to allow <strong>the</strong> unh<strong>in</strong>dered<br />
passage <strong>of</strong> neonates <strong>of</strong> a certa<strong>in</strong> m<strong>in</strong>imum <strong>size</strong>, this threshold<br />
<strong>size</strong> be<strong>in</strong>g associated with a reasonable chance <strong>of</strong> surviv<strong>in</strong>g <strong>the</strong><br />
first brumation. The <strong>size</strong> <strong>of</strong> neonates tends to <strong>in</strong>crease towards<br />
<strong>the</strong> nor<strong>the</strong>rn limits <strong>of</strong> <strong>the</strong> geographical range <strong>in</strong> vivipar<strong>in</strong>es<br />
(Stewart 1979). Such factors would set a premium on female<br />
cloaca (<strong>and</strong> hence body) <strong>size</strong> at <strong>the</strong> time she first breeds.<br />
Toge<strong>the</strong>r with <strong>the</strong> selection for adequate clutch <strong>size</strong>, this factor<br />
will also likely promote delayed maturity.<br />
While dietary competition cannot be ruled out as <strong>the</strong> selec
tive force produc<strong>in</strong>g <strong>and</strong> ma<strong>in</strong>ta<strong>in</strong><strong>in</strong>g <strong>the</strong> <strong>sexual</strong> <strong>size</strong> dimor<br />
phism found <strong>in</strong> <strong>the</strong>se <strong>populations</strong> (Powell <strong>and</strong> Russell 1984),<br />
<strong>the</strong> evidence presented here argues strongly for <strong>sexual</strong> selection<br />
more closely associated with reproductive strategy <strong>and</strong><br />
viviparity. At present, nei<strong>the</strong>r alternative can be ruled out as<br />
<strong>the</strong> ma<strong>in</strong> selective force, <strong>and</strong> it is quite possible that <strong>the</strong> two<br />
work <strong>in</strong> conjunction to produce <strong>and</strong> ma<strong>in</strong>ta<strong>in</strong> this <strong>sexual</strong> <strong>size</strong><br />
<strong>dimorphism</strong>.<br />
Acknowledgements<br />
We would like to thank Leonard <strong>and</strong> Mary Jane Piotrowski,<br />
Phil Flaig, Dick <strong>and</strong> Janet Rose, Will <strong>and</strong> Rose McK<strong>in</strong>ley, <strong>and</strong><br />
<strong>the</strong> Laidlaw family for permission to work on <strong>the</strong>ir l<strong>and</strong>s.<br />
Dr. E. Swierstra <strong>of</strong> <strong>the</strong> Dom<strong>in</strong>ion Agricultural Research<br />
Station <strong>in</strong> Lethbridge is to be thanked for permission to use <strong>the</strong><br />
Onefour schoolhouse as field headquarters. We are obliged to<br />
Jan Vrbik, David Schro<strong>the</strong>, <strong>and</strong> Judy Szikora, all <strong>of</strong> <strong>the</strong><br />
University <strong>of</strong> Calgary Academic Computer Services, for help<br />
with various parts <strong>of</strong> <strong>the</strong> computer analysis, <strong>and</strong> Dr. Gordon<br />
Fick for a discussion <strong>of</strong> regression methods. We are grateful to<br />
Mr. Larry L<strong>in</strong>ton for assistance <strong>in</strong> regard to <strong>the</strong>se matters also.<br />
Thanks are also owed to Dr. Thomas Schoener, for his helpful<br />
comments; Dr. Michael Ryan, for his methodological critique;<br />
Craig Guyer, for shar<strong>in</strong>g some unpublished material; <strong>and</strong> to<br />
Drs. Ronald Davies. Gordon Pritchard, <strong>and</strong> Robert Weyant for<br />
read<strong>in</strong>g <strong>and</strong> constructively criticiz<strong>in</strong>g an earlier draft <strong>of</strong> this<br />
manuscript. The comments <strong>of</strong> two anonymous reviewers<br />
greatly improved <strong>the</strong> f<strong>in</strong>al product. F<strong>in</strong>ancial support for this<br />
project was provided partially by <strong>the</strong> Department <strong>of</strong> Biology,<br />
University <strong>of</strong> Calgary, <strong>and</strong> partially by a Natural Sciences <strong>and</strong><br />
Eng<strong>in</strong>eer<strong>in</strong>g Research Council <strong>of</strong> Canada grant (A-9745) to<br />
A. P. Russell. The manuscript was typed by Marg Hunik.<br />
AIELLO. L. C. 1981. The allometry <strong>of</strong> body <strong>size</strong> proportions. Symp.<br />
Zool. Soc. London, 48: 331—358.<br />
ANDREw5, R. M. 1976. <strong>Growth</strong> rate <strong>in</strong> isl<strong>and</strong> <strong>and</strong> ma<strong>in</strong>l<strong>and</strong> anol<strong>in</strong>e<br />
lizards. Copeia. 1976: 477—482.<br />
1982. Patterns <strong>of</strong> growth <strong>in</strong> reptiles. Biol. Reptilia 1969. 13:<br />
273—3 12.<br />
ANONYMOUS. 1979. IMSL reference manual. Vol. 4. 7th ed. <strong>in</strong>ter<br />
national Ma<strong>the</strong>matical <strong>and</strong> Statistical Libraries. Inc.. Houston, TX.<br />
BALLINGER, R. E. 1973. Comparative demography <strong>of</strong> two viviparous<br />
iguanid lizards (Sceloporus jarrovi <strong>and</strong> Sceloporuspo<strong>in</strong>setti). Ecol<br />
ogy. 54: 269—283.<br />
1979. Intraspecific variation <strong>in</strong> demography <strong>and</strong> life history <strong>of</strong><br />
<strong>the</strong> lizard, Sceloporus jarrovi. along an altitud<strong>in</strong>al transect <strong>in</strong> south<br />
eastern Arizona. Ecology, 60: 901—909.<br />
BELLAIR5, A. 1969. The life <strong>of</strong> reptiles. Vol. 2. Weidenfeld &<br />
N icolson (Educational) Ltd., London.<br />
BENT0N, M. J. 1980. Geographic variation <strong>in</strong> <strong>the</strong> garter snakes<br />
(Tha<strong>in</strong>nophis sirralis) <strong>of</strong> <strong>the</strong> north-central United States, a multivariate<br />
study. Zool. J. L<strong>in</strong>n. Soc. 68: 307—323.<br />
BERRY, J. F., <strong>and</strong> R. SHINE. 1980. Sexual <strong>size</strong> <strong>dimorphism</strong> <strong>and</strong> <strong>sexual</strong><br />
selection <strong>in</strong> turtles (Order Testud<strong>in</strong>es). Oecologia. 44: 185—191.<br />
CARPENTER, C. C.. <strong>and</strong> G. W. FERGUSON. 1977. Variation <strong>and</strong><br />
evolution <strong>of</strong> stereotyped behavior <strong>in</strong> reptiles. Biol. Reptilia 1969.<br />
7: 335—554.<br />
C0OLEY, W. W., <strong>and</strong> P. R. LOHNES. 1971. Multivariate data analysis.<br />
John Wiley <strong>and</strong> Sons, New York.<br />
DUNHAM, A. E. 1978. Food availability as a proximate factor <strong>in</strong>flu<br />
enc<strong>in</strong>g <strong>in</strong>dividual growth rates <strong>in</strong> <strong>the</strong> iguanid lizard Sceloporus<br />
merriarni. Ecology. 59: 770—778.<br />
1980. An experimental study <strong>of</strong> <strong>in</strong>terspecific competition<br />
between <strong>the</strong> iguanid lizards Sceloporus merriami <strong>and</strong> Urosaurus<br />
ornatus. Ecol. Monogr. 50: 309—330.<br />
FERGUSON, G. W., <strong>and</strong> T. BR0cKMAN. 1980. Geographical differ-<br />
POWELL AND RUSSELL 153<br />
ences <strong>of</strong> growth rates <strong>of</strong> Sceloporus lizards (Sauna: Iguanidae).<br />
Copeia, 1980: 259—264.<br />
FITCH, H. 5. 1976. Sexual <strong>size</strong> differences <strong>in</strong> <strong>the</strong> ma<strong>in</strong>l<strong>and</strong> anoles.<br />
Occas. Pap. Mus. Nat. Hist. Univ. Kans. 50: 1—21.<br />
1978. Sexual <strong>size</strong> differences <strong>in</strong> <strong>the</strong> genus Sceloporus. Univ.<br />
Kans. Sci. Bull. 51: 441—461.<br />
1981. Sexual <strong>size</strong> differences <strong>in</strong> reptiles. Univ. Kans. PubI.<br />
Mus. Nat. Hist. 70: 1—72.<br />
FITzHUGH, H. A., JR. 1976. Analysis <strong>of</strong> growth curves <strong>and</strong> strategies<br />
for alter<strong>in</strong>g <strong>the</strong>ir shape. J. Anim. Sci. 42: 1036—1051.<br />
GHIsELIN, M. T. 1974. The economy <strong>of</strong> nature <strong>and</strong> <strong>the</strong> evolution <strong>of</strong><br />
sex. University <strong>of</strong> California Press, Berkeley, CA.<br />
GOULD, S. J. 1966. Allometry <strong>and</strong> <strong>size</strong> <strong>in</strong> ontogeny <strong>and</strong> phylogeny.<br />
Biol. Rev. Cambridge Philos. Soc. 41: 587—640.<br />
1977. Ontogeny <strong>and</strong> Phylogeny. Belknap Press, Cambridge,<br />
MA.<br />
GREGORY, P. T. 1977. Life-history parameters <strong>of</strong> <strong>the</strong> red-sided garter<br />
snake (Thamnophis sirtali.r parietahs) <strong>in</strong> an extreme environment,<br />
<strong>the</strong> <strong>in</strong>terlake region <strong>of</strong> Manitoba. Nat. Mus. Nat. Sci. (Ottawa)<br />
Publ. Zool. No. 13. pp. 1—44.<br />
GRINE, F. E., B. D. HAHN, <strong>and</strong> C. B. Gow. 1978. Aspects <strong>of</strong> relative<br />
growth <strong>and</strong> variability <strong>in</strong> Diade<strong>in</strong>odon (Reptilia: Therapsida).<br />
S. Afr. J. Sci. 74: 50—58.<br />
GUILLETrE, L. J., JR. 1982. Effect <strong>of</strong> gravidity on <strong>the</strong> metabolism <strong>of</strong><br />
<strong>the</strong> reproductively bimodal lizard. Sceloporus aeneus. J. Exp. Zool.<br />
223: 33—36.<br />
GUYER. C. 1978. Comparative ecology <strong>of</strong> <strong>the</strong> short-horned lizard<br />
(Phrvnoso,na douglassi) <strong>and</strong> <strong>the</strong> sagebrush lizard (Sceloporus gra—<br />
ciosus). Master’s <strong>the</strong>sis, Idaho State University. Pocatello, ID.<br />
HAINES, R. W. 1969. Epiphyses <strong>and</strong> sesamoids. Biol. Reptilia 1969,<br />
1:81—115.<br />
HOwARD, R. D. 1981. Sexual <strong>dimorphism</strong> <strong>in</strong> bullfrogs. Ecology. 62:<br />
303—310.<br />
HULL, C. H., <strong>and</strong> N. H. NIE. 1979. SPSS Update. New procedures<br />
<strong>and</strong> facilities for releases 7 <strong>and</strong> 8. McGraw-Hill Book Co.. Toronto.<br />
HUXLEY, J. 5. 1932. Problems <strong>of</strong> relative growth. 2nd ed. Dover<br />
Publications. Inc., New York.<br />
KAUFMANN, K. W. 1981. Fitt<strong>in</strong>g<strong>and</strong>us<strong>in</strong>ggrowthcurves. Oecologia.<br />
49: 293—299.<br />
KERMACK, K. A.. <strong>and</strong> J. B. S. HALDANE. 1950. Organic correlation<br />
<strong>and</strong> allometry. Biometrika. 37: 30—41.<br />
MADsEN. T. 1983. <strong>Growth</strong> rates, maturation <strong>and</strong> <strong>sexual</strong> <strong>size</strong> dimor<br />
phism <strong>in</strong> a population <strong>of</strong> grass snakes, Natrix natrix, <strong>in</strong> sou<strong>the</strong>rn<br />
Sweden. Oikos. 40: 277—282.<br />
MCRAE, W. A..J. L. LANDERs. <strong>and</strong>G. D. CLEvEL~\ND. 1981. Sexual<br />
<strong>dimorphism</strong> <strong>in</strong> <strong>the</strong> gopher tortoise (Gopherus polvphemus). Her—<br />
petologica. 37: 46—52.<br />
MONTANUCCI, R. R.. <strong>and</strong> B. B. BAUER. 1982. Mat<strong>in</strong>g <strong>and</strong> courtshiprelated<br />
behaviours <strong>of</strong> <strong>the</strong> short—horned lizard, Phrrnoso,na<br />
douglassi. Copeia. 1982: 971—974.<br />
NIE. N. H.. C. H. HULL. J. G. JENKINS. K. STEINBRENNER. <strong>and</strong><br />
D. H. BENT. 1975. Statistical package for <strong>the</strong> social sciences. 2nd<br />
Ed. McGraw-Hill Book Co.. Toronto.<br />
PACKARD. G. C., C. R. TRACY. <strong>and</strong> J. J. ROTH. 1977. The physiol<br />
ogical ecology <strong>of</strong> reptilian eggs <strong>and</strong> embryos. <strong>and</strong> <strong>the</strong> evolution <strong>of</strong><br />
viviparity with<strong>in</strong> <strong>the</strong> class Reptilia. Biol. Rev. Cambridge Philos.<br />
Soc. 52: 71—105.<br />
PIANKA. E. R., <strong>and</strong> W. S. PARKER. 1975. Ecology <strong>of</strong> horned lizards:<br />
a review with special reference to Phrvnoso<strong>in</strong>a platvrh<strong>in</strong>os. Copeia,<br />
1975: 141—162.<br />
PILORGE, T. 198 Ia. Determ<strong>in</strong>ation de l’âge dans une population natu<br />
relIc du lCzard vivipare. Acta Oecol. 2: 3— 16.<br />
198lb. Structure et dynamique d’une population du lCzard<br />
vivipare. Signification adaptive de Ia viviparité chez les lézards.<br />
Ecole Normale Superieur. Publication de Laboratoire de Zoologie,<br />
18: 1—153.<br />
POWELL, G. L. 1982. The eastern short-horned lizard <strong>in</strong> <strong>Alberta</strong>: basic<br />
field ecology <strong>of</strong> nor<strong>the</strong>rn marg<strong>in</strong>al <strong>populations</strong>. Master’s <strong>the</strong>sis,<br />
University <strong>of</strong> Calgary, Calgary, Alta.
154 CAN. J. ZOOL. VOL. 63. 985<br />
POwELL, G. L., <strong>and</strong> A. P. RUssELL. 1984. The diet <strong>of</strong> <strong>the</strong> eastern<br />
short—horned lizard (Phrvnosoma donglassi brevirostre) <strong>in</strong> <strong>Alberta</strong><br />
<strong>and</strong> its relationship to <strong>sexual</strong> <strong>size</strong> <strong>dimorphism</strong>. Can. J. Zool. 62:<br />
428—440.<br />
RIcKLEFs, R. E. 1967. A graphical method <strong>of</strong> fitt<strong>in</strong>g equations to<br />
growth curves. Ecology. 48: 978—983.<br />
R0UGHGARDEN. J. 1974. Niche width: biogeographic patterns among<br />
Anolis lizard <strong>populations</strong>. Am. Nat. 108: 429—442.<br />
ScHOENER, T. W. 1967. The ecological significance <strong>of</strong> <strong>sexual</strong> dimor<br />
phism <strong>in</strong> <strong>size</strong> <strong>in</strong> <strong>the</strong> lizard Anolis conspersus. Science (Wash<strong>in</strong>gton.<br />
D.C.), 155: 474—477.<br />
1969. Models <strong>of</strong> optimal <strong>size</strong> for solitary predators. Am. Nat.<br />
103: 277—313.<br />
1970. Size patterns <strong>in</strong> West Indian Anolis lizards. 11. Cor<br />
relations with <strong>the</strong> <strong>size</strong>s <strong>of</strong> particular sympatric species—<br />
displacement <strong>and</strong> convergence. Am. Nat. 104: 155—174.<br />
1971. Theory <strong>of</strong> feed<strong>in</strong>g strategies. Annu. Rev. Ecol. Syst. 2:<br />
369—404.<br />
1977. Competition <strong>and</strong> <strong>the</strong> niche. Biol. Reptilia 1969, 7:<br />
35—136.<br />
1981. An empirically based estimate <strong>of</strong> home range. Theor.<br />
Popul. Biol. 20: 281—325.<br />
ScHOENER. T. W., <strong>and</strong> A. ScHOENER. 1978. Estimat<strong>in</strong>g <strong>and</strong> <strong>in</strong>ter<br />
pret<strong>in</strong>g body-<strong>size</strong> growth <strong>in</strong> some Anolis lizards. Copeia, 1978:<br />
390—405.<br />
SEIM, E., <strong>and</strong> B.-E. SAETHER. 1983. On reth<strong>in</strong>k<strong>in</strong>g allometry: which<br />
regression model to use? J. Theor. Biol. 104: 161—168.<br />
SMITH, R. J. 1980. Reth<strong>in</strong>k<strong>in</strong>g allometry. J. Theor. Biol. 87: 97—Ill.<br />
1981. Interpretation <strong>of</strong> correlations <strong>in</strong> <strong>in</strong>traspecific <strong>and</strong> <strong>in</strong>ter<br />
specific allometry. <strong>Growth</strong>, 45: 291 —297.<br />
SOKAL, R. R., <strong>and</strong> F. J. ROHLF. 1969. Biometry. W. H. Freeman <strong>and</strong><br />
Co., San Francisco.<br />
STAMPs, J. A. 1977. Social behavior <strong>and</strong> spac<strong>in</strong>g patterns <strong>in</strong> lizards.<br />
Biol. Reptilia 1969, 7: 265—334.<br />
STEwART. J. R. 1979. The balance between number <strong>and</strong> <strong>size</strong> <strong>of</strong> young<br />
<strong>in</strong> <strong>the</strong> live bear<strong>in</strong>g lizard Gerrhonotus coeruleu.v. Herpetologica, 35:<br />
342—350.<br />
TINKLE. D. W. 1967. The life <strong>and</strong> demography <strong>of</strong> <strong>the</strong> side-blotched<br />
lizard. Uta stansburiana. Misc. PubI. Mus. Zool. Univ. Mich. 132:<br />
1—182.<br />
TINKLE, D. W.. <strong>and</strong> R. E. BALLINGER. 1972. Sceloporus undulatus:<br />
a study <strong>of</strong> <strong>the</strong> <strong>in</strong>traspecific comparative demography <strong>of</strong> a lizard.<br />
Ecology. 53: 570—584.<br />
TINKLE. D. W., <strong>and</strong> N. F. HADLEY. 1975. Lizard reproductive effort:<br />
caloric estimates <strong>and</strong> comments on its evolution. Ecology, 56:<br />
427—434.<br />
TINKLE. D. W., H. M. WILBUR. <strong>and</strong> S. G. TILLEY. 1970. Evo<br />
lutionary strategies <strong>in</strong> lizard reproduction. Evolution (Lawrence,<br />
Kans.), 24: 55—74.<br />
TOLLEsTRUP. K. 1981. The social behavior <strong>and</strong> displays <strong>of</strong> two spe<br />
cies <strong>of</strong> horned lizards. Phrvnoso<strong>in</strong>a plarrrlnnos <strong>and</strong> Phrvnosoma<br />
coronatu<strong>in</strong>. Herpetologica. 37: 130—141.<br />
TURNER. F. B. 1977. The dynamics <strong>of</strong> <strong>populations</strong> <strong>of</strong> squamates,<br />
crocodilians <strong>and</strong> rhynchocephalians. Biol. Reptilia 1969. 7: 157—<br />
264.<br />
TURNER. F. B., P. A. MEDICA. <strong>and</strong> B. W. KowALEwsKy. 1976.<br />
Energy utilization by a desert lizard (Cia stansburiana). US/IBP<br />
Desert Biome Monogr. No. I. pp. 1—57.<br />
TURNER, M. E.. E. L. BRADLEY. JR.. <strong>and</strong> K. A. KIRK. 1976. A <strong>the</strong>ory<br />
<strong>of</strong> growth. Math. Biosci. 29: 367—373.<br />
VAN DEvENDER. R. W. 1978. <strong>Growth</strong> ecology <strong>of</strong> a tropical lizard,<br />
Ba,riliscus basiliscus. Ecology. 59: 1031 — 1038.<br />
WERNER, Y. L. 1971. Some suggestions for <strong>the</strong> st<strong>and</strong>ard expression<br />
<strong>of</strong> measurements. Syst. Zool. 20: 249—252.