Gender Diversity within Asia Global Markets - Heidrick & Struggles
Gender Diversity within Asia Global Markets - Heidrick & Struggles
Gender Diversity within Asia Global Markets - Heidrick & Struggles

You also want an ePaper? Increase the reach of your titles
YUMPU automatically turns print PDFs into web optimized ePapers that Google loves.
Talk to anyone in a senior management position <strong>within</strong> sales and trading<br />
and they’ll tell you they’re keen to improve the diversity of their organization.<br />
Ask them why and, you get a mixed message generally falling into one of<br />
two camps. For the believers, the main driver is profitability – more diverse<br />
organizations are more productive, have less attrition, more easily attract<br />
top talent, avoid the negative publicity and costs of sex discrimination<br />
court cases and are more attractive to clients. 1 For the skeptics, the driver<br />
is ‘the quota’ – they’ve been told they have to fill a certain quota of senior<br />
positions with women and they want to achieve this goal.<br />
Ultimately, both the believers and the skeptics are driven to the same goal<br />
and at a global management level all the banks have a senior believer<br />
working to redress the balance.<br />
The <strong>Asia</strong> Picture<br />
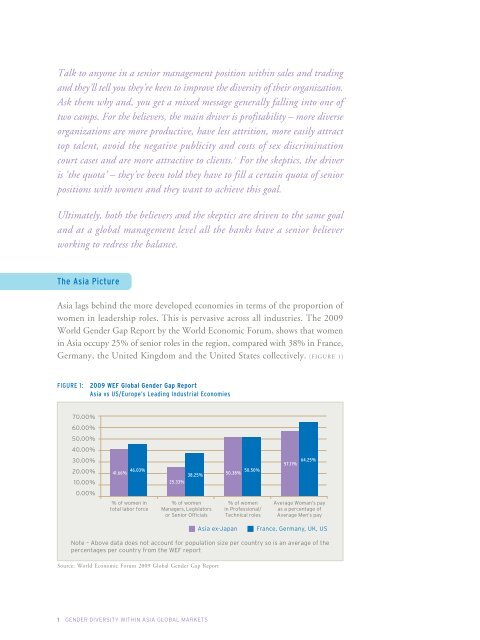
<strong>Asia</strong> lags behind the more developed economies in terms of the proportion of<br />
women in leadership roles. This is pervasive across all industries. The 2009<br />
World <strong>Gender</strong> Gap Report by the World Economic Forum, shows that women<br />
in <strong>Asia</strong> occupy 25% of senior roles in the region, compared with 38% in France,<br />
Germany, the United Kingdom and the United States collectively. [FIGURE 1]<br />
FIGURE 1: 2009 WEF <strong>Global</strong> <strong>Gender</strong> Gap Report<br />
<strong>Asia</strong> vs US/Europe’s Leading Industrial Economies<br />
70.00%<br />
60.00%<br />
50.00%<br />
40.00%<br />
30.00%<br />
20.00%<br />
10.00%<br />
0.00%<br />
41.66% 46.03%<br />
% of women in<br />
total labor force<br />
38.25%<br />
25.33%<br />
% of women<br />
Managers, Legislators<br />
or Senior Officials<br />
Figure 1 Insert chart from powerpoint<br />
1 GENDER DIVERSITY WITHIN ASIA GLOBAL MARKETS<br />
<strong>Asia</strong> ex-Japan<br />
50.38% 50.50%<br />
% of women<br />
in Professional/<br />
Technical roles<br />
57.11% 64.25%<br />
Average Woman’s pay<br />
as a percentage of<br />
Average Men’s pay<br />
France, Germany, UK, US<br />
Note – Above data does not account for population size per country so is an average of the<br />
percentages per country from the WEF report<br />
Source: World Economic Forum 2009 <strong>Global</strong> <strong>Gender</strong> Gap Report