Report - Heidrick & Struggles
Report - Heidrick & Struggles
Report - Heidrick & Struggles

Create successful ePaper yourself
Turn your PDF publications into a flip-book with our unique Google optimized e-Paper software.
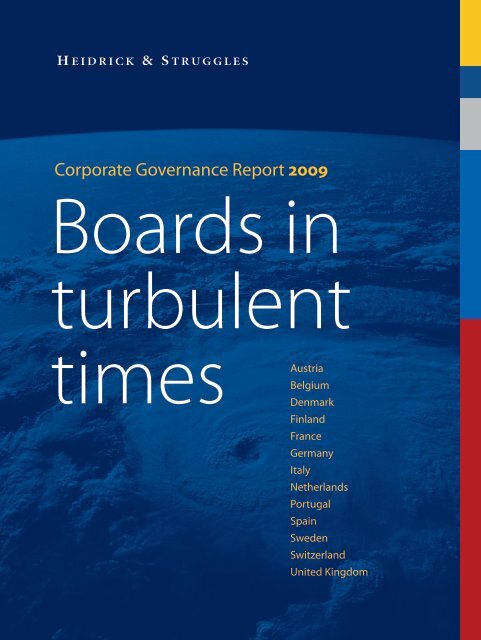
Corporate Governance <strong>Report</strong> 2009<br />
Boards in<br />
turbulent<br />
times Austria<br />
Belgium<br />
Denmark<br />
Finland<br />
France<br />
Germany<br />
Italy<br />
Netherlands<br />
Portugal<br />
Spain<br />
Sweden<br />
Switzerland<br />
United Kingdom
Corporate Governance Ratings 2009<br />
77% United Kingdom<br />
71% Netherlands<br />
66% Sweden<br />
64% Switzerland<br />
62% Finland<br />
60% France<br />
53% Italy<br />
52% Spain<br />
47% Belgium<br />
41% Portugal<br />
39% Germany<br />
37% Denmark<br />
36% Austria<br />
Portugal<br />
Morocco<br />
Spain<br />
For a breakdown of how these<br />
ratings are generated, please<br />
refer to page 4<br />
Ireland<br />
United Kingdom<br />
Andorra<br />
Algeria<br />
France<br />
Belgium<br />
Netherlands<br />
Luxembourg<br />
Switzerland<br />
Tunisia<br />
Denmark<br />
Liech.<br />
Norway<br />
Germany<br />
Malta<br />
Czech Republic<br />
Austria<br />
Slovenia<br />
Italy<br />
Sweden<br />
Poland<br />
Croatia<br />
Bosnia &<br />
Herz.<br />
Slovakia<br />
Hungary<br />
Serbia<br />
Mont.<br />
Kosovo<br />
Albania<br />
Lithuania<br />
Macedonia<br />
Greece<br />
Finland<br />
Estonia<br />
Latvia<br />
Belarus<br />
Romania<br />
Bulgaria
Foreword<br />
The global financial crisis has heralded a<br />
new international order that has yet to be<br />
understood fully or accepted widely. The<br />
economic changes happening now are<br />
structural, not cyclical, and therefore truly<br />
transformative. These changes will affect<br />
every company in every sector across<br />
the world.<br />
There has been a chronic loss of trust<br />
in the world’s systems and institutions:<br />
company boards must be the vanguard<br />
of the effort to win back the confidence<br />
of customers and investors alike. A<br />
well-balanced board is critical to the<br />
effective strategic direction and running<br />
of any company. Good governance and<br />
leadership will help rebuild confidence in<br />
our business systems, providing a stable<br />
framework for sustainable growth.<br />
The tenth anniversary report by <strong>Heidrick</strong> &<br />
<strong>Struggles</strong> (and their sixth comprehensive<br />
survey of Europe’s progress in Corporate<br />
Governance) is particularly timely. The<br />
2007 report was entitled Raising the bar<br />
and the findings of the 2009 report reveal<br />
the vast majority of companies have<br />
continued to raise the bar in terms of<br />
the calibre of their board, enabling them<br />
to better address the shifting economic<br />
landscape.<br />
At the same time, the report does quietly<br />
flag countries who have not addressed<br />
improvements in corporate governance<br />
with the urgency they should have – we<br />
can expect to see still more convergence<br />
to best practice here and across the world<br />
in the coming year.<br />
In these turbulent times emotions run<br />
high and perspectives can become<br />
skewed. I commend this report and the<br />
objective scrutiny it provides.<br />
Professor Klaus Schwab<br />
Founder and Executive Chairman,<br />
World Economic Forum<br />
<strong>Heidrick</strong> & <strong>Struggles</strong>
contents<br />
Boards in turbulent times, 1<br />
Section one: European trends, 2<br />
European overview, 2<br />
Methodology – introducing a new rating, 4<br />
European boards – how do they work? 6<br />
Board committees in Europe, 9<br />
Composition of boards in Europe<br />
– managing independence and diversity, 11<br />
European boards – remuneration, 16<br />
Board evaluation, 18<br />
Section two: local perspectives, 20<br />
Austria, 20<br />
Belgium, 22<br />
Denmark, 24<br />
Finland, 26<br />
France, 28<br />
Germany, 30<br />
Italy, 32<br />
Netherlands, 34<br />
Portugal, 36<br />
Spain, 38<br />
Sweden, 40<br />
Switzerland, 42<br />
United Kingdom, 44<br />
Company index, 46<br />
Boards in turbulent times: Corporate Governance <strong>Report</strong> 2009<br />
“…the greatest divergence<br />
between European<br />
companies is on board<br />
composition which is<br />
troubling, as optimal board<br />
membership is one of the<br />
ultimate goals for<br />
all boards…”<br />
Project Manager<br />
Dr Catherine Albert-Roulhac<br />
+33 (0)1 44 34 17 25<br />
To order further copies of the Corporate Governance<br />
<strong>Report</strong> 2009, and supplements exploring corporate<br />
governance standards in South Africa and Turkey,<br />
please email cg2009@heidrick.com<br />
For press inquiries please contact<br />
emeamarketing@heidrick.com<br />
First published by <strong>Heidrick</strong> & <strong>Struggles</strong> International, Inc. 2009.<br />
Copyright ©2009 <strong>Heidrick</strong> & <strong>Struggles</strong> International, Inc.<br />
All rights reserved. No part of this publication may be reproduced,<br />
stored in a retrieval system, or transmitted, in any form or by<br />
any means, electronic, mechanical, photocopying, recording or<br />
otherwise, without the prior permission of the publisher.
Boards in turbulent times<br />
Ten years ago when <strong>Heidrick</strong> & <strong>Struggles</strong><br />
launched the first biennial report into the<br />
governance practices of European boards,<br />
it would have been hard to imagine the<br />
severe economic climate that would<br />
prevail for the publication of this, its<br />
sixth edition.<br />
The state of the global economy, the unprecedented<br />
collapse of so many large organisations and the<br />
criticism of many boards and leadership teams<br />
makes the current turbulence a particularly relevant<br />
theme for this report.<br />
When we launched the first study in 1999 we did<br />
so to enable boards striving for excellence to<br />
benchmark their own practices against those of the<br />
largest companies in Europe. Back then, before the<br />
Higgs Combined Code came into practice in the UK<br />
and Sarbanes Oxley was introduced in the US, it was<br />
arguably only the most enlightened boards that<br />
focused on better governance. Now, with effective<br />
leadership no longer taken for granted, boards are<br />
being forced into greater transparency to rebuild<br />
trust. We are certain that this report, which this<br />
year covers thirteen countries with supplements<br />
for Turkey and South Africa, will continue to be a<br />
practical tool in this endeavour.<br />
This year also sees the introduction of a new, more<br />
exhaustive ratings system. This ‘second generation’<br />
rating is based on an extended set of criteria to<br />
offer a more in-depth and refined observation of<br />
individual boards.<br />
We hope that its ten year track record of rigorous<br />
data collection and analysis along with this new<br />
greater scope will ensure that this report continues<br />
to earn its reputation as <strong>Heidrick</strong> & <strong>Struggles</strong>’<br />
signature study across Europe. The fact that it is<br />
consistently among the top three most viewed<br />
documents on our website is testament to its<br />
popularity.<br />
We are also proud to have been a founding content<br />
partner, in partnership with other leading advisory<br />
companies, of the new GCC Board Directors Institute,<br />
backed by major Middle East corporations, aiming<br />
to advise on and develop governance strategies that<br />
leapfrog mere compliance to ensure superior board<br />
effectiveness. A similar initiative in Asia Pacific is in<br />
the planning phase.<br />
<strong>Heidrick</strong> & <strong>Struggles</strong> 1
European overview<br />
Turbulent times demand a greater focus<br />
on board effectiveness. While adherence<br />
to strong rules on corporate governance<br />
remain essential – as this report was in its final<br />
production stages, the Indian Satyam scandal<br />
highlighted the dangers of non-compliance<br />
in a part of the world not known for<br />
governance standards – the world economic<br />
crisis has introduced a need for discipline<br />
rarely seen in Europe over the last decade.<br />
Variously impressed or shocked by the financial<br />
performance of private equity owned companies over<br />
the last few years, boards are increasingly adopting<br />
working methods with a single-minded focus on far-<br />
sighted strategies and hard-nosed delivery; driving<br />
shareholder value in a way not seen before. Privately<br />
owned or governed companies are also seeing the value<br />
of improved governance, evidenced by the growth of<br />
advisory boards. These are very often a precursor to the<br />
introduction of a fully balanced main board with strong<br />
independent representation playing as important a role as<br />
in publicly listed corporations.<br />
Distilling the trends which we have tracked since<br />
launching this report in 1999 we can highlight the<br />
following as the features which best equip European<br />
boards for maximum effectiveness:<br />
• Improving board composition and balance – ensuring<br />
diverse and rich perspectives from each board<br />
member.<br />
• Allowing sufficient time for non-executive board<br />
members and chairmen to attend to their duties and<br />
responsibilities.<br />
• Increasing international expertise, because very few<br />
companies these days are reliant purely on national<br />
revenues or ownership.<br />
2 Boards in turbulent times: Corporate Governance <strong>Report</strong> 2009<br />
figure 1<br />
2009 Corporate governance ratings<br />
(conformity with stated governance criteria)<br />
CG09<br />
United Kingdom 77<br />
Netherlands 71<br />
• Emphasising the value of properly independent<br />
directors, the global consensus is that independent<br />
directors should exceed 50% of board membership.<br />
• Increasing use of specialised committees which meet<br />
separately from the main board meetings, reflecting<br />
the increased workload for boards these days.<br />
• Improving board meeting dynamics and undertaking<br />
regular – certainly annual – formalised evaluations of<br />
the board and its performance.<br />
The ten year history of our report shows a relative<br />
stabilisation in the implementation of best practices,<br />
following the rapid progress of corporate governance<br />
practices in virtually all European top listed companies in<br />
the first years of the new century. Disappointingly, there<br />
has been no improvement since 2007 among many of<br />
the lowest performers after a period of strong progress<br />
between 2005 and 2007.<br />
Sweden 66<br />
Switzerland 64<br />
Finland 62<br />
France 60<br />
Italy 53<br />
Spain 52<br />
Belgium 47<br />
Portugal 41<br />
Germany 39<br />
Denmark 37<br />
Austria 36<br />
2009 European average 56
figure 2<br />
Europe at a glance<br />
CG09<br />
85%<br />
Transparency<br />
Disclosure levels of<br />
board info about:<br />
• Directors<br />
• Remuneration<br />
• Committees<br />
48%<br />
Composition<br />
• Board<br />
independence<br />
• Diversity<br />
• Composition<br />
of committees<br />
51% 56%<br />
Working style<br />
• Availability<br />
• Committee<br />
structure<br />
• Inertia factors<br />
Total rating<br />
figure 3<br />
Spread of company ratings<br />
(minimum, maximum and country average)<br />
CG09<br />
United Kingdom 63<br />
85<br />
Netherlands 56<br />
82<br />
Sweden 43<br />
82<br />
Switzerland 33<br />
76<br />
Finland 39<br />
79<br />
France 42<br />
Italy<br />
Spain 32<br />
Belgium 12<br />
Portugal 15<br />
Germany 7<br />
Denmark 15<br />
Austria 15<br />
30 69<br />
denotes country average rating<br />
57<br />
60<br />
60<br />
61<br />
67<br />
Using our new rating methodology the top 371 European<br />
companies achieve an average rating of 56%. The UK,<br />
Netherlands and Sweden hold their position as the ‘top<br />
countries’ and adhere to best practices more than their<br />
other European counterparts (figure 1).<br />
If we look at the three components of this rating<br />
– transparency, board composition and working style<br />
(figure 2) – European companies perform best on<br />
transparency. The greatest divergence between European<br />
companies is on board composition which is troubling, as<br />
optimal board membership is one of the ultimate goals<br />
for all boards.<br />
If we look at individual country results (figure 3) and<br />
compare the spread between the lowest and highest<br />
rated companies in each country, we find the highest<br />
convergence between company ratings in the top<br />
countries (the UK and Netherlands). At the opposite end<br />
of the spectrum, we observe the greatest spread between<br />
company ratings in Austria, Denmark, Germany, Portugal,<br />
and Belgium.<br />
71<br />
74<br />
<strong>Heidrick</strong> & <strong>Struggles</strong> 3
Methodology<br />
introducing a new rating<br />
An upgraded company rating<br />
Ten years after the successful launch of our company<br />
rating, we are pleased to introduce a more exhaustive<br />
rating, though broadly consistent with the structure of<br />
our original approach. We have upgraded our rating<br />
methodology to adapt to the new best practices that have<br />
emerged over the last decade. Company boards want<br />
to be benchmarked against the best of their peers and<br />
the most demanding practices. Our ‘second generation’<br />
rating is based on 41 criteria to offer a more in-depth and<br />
refined observation of individual boards. It is based on<br />
more stringent definitions and higher expectations so that<br />
companies can continue to raise the bar.<br />
The process<br />
Our data collection process remains unchanged: the<br />
report is based on published information – mainly annual<br />
reports and data provided by the company’s investor-<br />
Transparency Composition<br />
of the board<br />
relations department. Desk research is intense, as we<br />
collected over 270 items of data on every board, i.e. as<br />
many as 100,000 in total. The growing success of our<br />
report shows the demand for fact-based research on a<br />
full country sample, which cannot be achieved by other<br />
methods, such as questionnaires or interviews.<br />
Data collection is conducted locally, for a better<br />
understanding of national specificities, though<br />
coordinated and controlled centrally, to ensure quality and<br />
consistency.<br />
The rating of each of the 371 companies studied is<br />
based on this quantitative research. Thus, this report<br />
does not attempt to make a qualitative assessment on<br />
board performance. Insights from the Chair and Building<br />
High-Performance Boards are publications by <strong>Heidrick</strong><br />
& <strong>Struggles</strong> that focus on the ‘soft factors’. These can be<br />
downloaded and read as a complement to this report.<br />
figure 4<br />
The three dimensions of our rating<br />
(based on 41 criteria to offer a more in-depth and refined observation of individual boards)<br />
CG09<br />
Disclosure levels of board<br />
information about:<br />
• Directors<br />
• Remuneration<br />
• Committees<br />
• Board independence<br />
• Diversity<br />
(e.g. internationalisation,<br />
diversity of expertise, gender)<br />
• Composition of committees<br />
(e.g. independent<br />
chairmanship and<br />
membership)<br />
4 Boards in turbulent times: Corporate Governance <strong>Report</strong> 2009<br />
Working style<br />
of the board<br />
• Availability<br />
(e.g. frequency of meetings,<br />
attendance, availability of<br />
the directors)<br />
• Committee structure<br />
• Board evaluation<br />
(e.g. frequency, leadership,<br />
process)<br />
• Inertia factors<br />
(e.g. length of tenure,<br />
time on board, turnover)
figure 5<br />
Three types of non-executive and supervisory board structures<br />
(countries in italics denote those where the majority use the specific board structure)<br />
CG09<br />
Unitary board Two-tier board Mixed system<br />
The board<br />
Non-executive<br />
chair<br />
Non-executive<br />
directors<br />
Perimeter of study<br />
Company and country samples<br />
As in the past, we selected the top companies based on<br />
the reference stock exchange, as follows: Austria (ATX),<br />
Belgium (BEL20), Denmark (C20), Finland (OMX Helsinki),<br />
France (CAC40), Germany (DAX30), Italy (S&PMIB),<br />
Netherlands (AEX), Portugal (PSI20), Spain (IBEX35),<br />
Sweden (OMX Stockholm), Switzerland (SMI) and the<br />
United Kingdom (top 50 of the FTSE).<br />
As corporate boards rediscover the value of best practices<br />
in turbulent times, we have enlarged the scope of our<br />
research to include Denmark and Finland (as in our 2001<br />
<strong>Report</strong>). We have also published two supplements to this<br />
report on Turkey and South Africa. In the Middle East,<br />
we are a founding content partner, along with McKinsey,<br />
Allen & Overy and PricewaterhouseCoopers, of the Gulf<br />
Co-operation Council Board of Directors’ Institute, focusing<br />
on best corporate governance practice and standards<br />
– initially of the Gulf, but targeted to roll out progressively<br />
across the region.<br />
The three dimensions of best practice<br />
As before, our rating takes into account three main<br />
dimensions of best practice. Each company in the report<br />
was rated individually on 41 weighted criteria (figure 4), on<br />
a scale of 100 points.<br />
CEO<br />
Executive<br />
directors<br />
Supervisory<br />
board<br />
Nonexecutive<br />
chair<br />
Nonexecutive<br />
directors<br />
Perimeter of study<br />
Executive<br />
board<br />
CEO<br />
Executive<br />
directors<br />
One single agenda for the board Distinct meetings and agenda Distinct meetings and agenda<br />
UK, Italy, Spain Austria, Denmark, Finland, Germany,<br />
Switzerland, Netherlands and<br />
France (“conseil de surveillance”)<br />
Board structure<br />
Board structures in Europe can be grouped into three main<br />
types (figure 5):<br />
Nonexecutive<br />
board<br />
Nonexecutive<br />
directors<br />
Perimeter of study<br />
Some executives sit on both boards<br />
Belgium, Portugal, Sweden, France<br />
(“conseil d’administration”)<br />
Executive<br />
board<br />
Chairman and CEO<br />
Executive directors<br />
Executive<br />
directors<br />
• The fully unitary system, as in the UK, Italy, Spain and<br />
some Portuguese companies. This is where there is a<br />
single board made up of executive management and<br />
non-executive directors. In the UK, in particular, the<br />
chairman of the board is usually non-executive.<br />
• The two-tier system, compulsory in Germany and<br />
Austria, is found in various proportions in every<br />
country except the UK and Spain; a majority of boards<br />
adhere to this system in Denmark, Finland, Netherlands<br />
and Switzerland. This consists of a supervisory board of<br />
outside directors and a separate management board<br />
of executive directors, each meeting separately. In<br />
Europe, 38% of companies adhere to this system.<br />
• A mixed system of two boards (an executive and a<br />
non-executive) meeting separately, but where some<br />
executive directors sit on the non-executive board,<br />
in particular the chairman and the chief executive,<br />
as in the majority of companies in France (conseil<br />
d’administration), Sweden, Belgium and Portugal.<br />
<strong>Heidrick</strong> & <strong>Struggles</strong> 5
European boards<br />
how do they work?<br />
Frequency of board meetings<br />
The average number of board meetings has increased<br />
by 9% in two years to 9.6 full board meetings per year<br />
(figure 6), reflecting the growing involvement of boards.<br />
Just as in previous reports, two-tier boards meet less<br />
frequently than unitary structures (10.1 meetings for<br />
unitary boards versus 8.6 meetings for two-tier boards).<br />
Yet the growth in the frequency of meetings is spectacular<br />
in two-tier boards (+29%).<br />
The number of committee meetings has now stabilised<br />
to about 14 meetings following strong growth after 2000.<br />
This is largely due to the pressure on, and desire of, board<br />
members to stay more regularly in tune with company<br />
dynamics.<br />
figure 6<br />
Frequency of board meetings<br />
(average number of meetings per year)<br />
CG09<br />
Finland 12.6<br />
Italy 12.1<br />
Spain 11.4<br />
Sweden 10.9<br />
Portugal 10.6<br />
United Kingdom 9.6<br />
Netherlands 9.3<br />
Denmark 8.9<br />
Belgium 8.6<br />
Switzerland 8.2<br />
France 8.1<br />
Germany 5.8<br />
Austria 5.6<br />
2009 European average 9.6<br />
GROWTH<br />
39% in last 10 years<br />
17% in last 6 years<br />
9% in last 2 years<br />
1999 2009<br />
6 Boards in turbulent times: Corporate Governance <strong>Report</strong> 2009<br />
Attendance at board meetings<br />
There is a 7% increase in average attendance in two<br />
years (figure 7), but very little disclosure of attendance in<br />
Germany, Austria and Denmark. Attendance remains low<br />
in France and Belgium, despite the high proportion of<br />
variable fee, based on attendance (in turn suggesting that<br />
variable fees are less appropriate these days).<br />
Some suggest the presence of foreign nationals on<br />
boards, especially from other continents, undermines<br />
attendance rates. This is not supported by the evidence:<br />
we found that highly international boards in Switzerland,<br />
UK and the Netherlands achieve high attendance ratios.<br />
However, international board appointments require a<br />
deep assessment of the candidate’s motivations and<br />
commitment.<br />
figure 7<br />
Attendance ratio<br />
CG09 (average attendance at board meetings, data<br />
sample for Austria, Denmark and Germany is not<br />
representative and therefore not published)<br />
Sweden 96%<br />
Finland 95%<br />
Switzerland 95%<br />
Netherlands 93%<br />
Spain 93%<br />
United Kingdom 93%<br />
Portugal 91%<br />
Belgium 89%<br />
Italy 89%<br />
France 87%<br />
2009 European average 92%<br />
GROWTH<br />
7% in last 2 years<br />
2007 2009
Availability of the chairman<br />
and the directors<br />
As a new item in the 2009 report, we have examined the<br />
number of positions that directors and chairmen hold,<br />
taking into account current executive positions and non-<br />
executive positions in public companies.<br />
While we cannot yet pinpoint the causal link, we can<br />
observe that countries with the least available directors<br />
(figure 8) and chairmen (figure 9) achieve a low corporate<br />
governance rating; whereas the top countries in our rating<br />
have the most available directors and chairmen.<br />
Finding directors who are really available is probably<br />
one of the key requests of company boards, alongside<br />
expertise. In turbulent times, chairmen and CEOs need the<br />
full attention and commitment of their board colleagues.<br />
This is why most governance codes in Europe formally flag<br />
the importance of restricting the number of boards on<br />
which non-executives serve.<br />
Length of tenure<br />
The length of tenure of board directors continues to<br />
decrease (figure 10), now standing at 3.1 years, with less<br />
than 15% of companies with a mandate of 5 years or over<br />
(compared to 24% four years ago). Spain, Germany, Austria<br />
and France have the longest terms. Long terms contribute<br />
to board ineffectiveness, allowing fewer opportunities to<br />
adjust board composition to reflect changing priorities<br />
– particularly in turbulent times.<br />
Time on board<br />
Short terms alone do not prevent inertia (figure 11).<br />
Sweden, Denmark and Switzerland have a low turnover<br />
in the boardroom, with directors staying a long time<br />
on their boards despite a short initial length of tenure.<br />
In these cases, boards are failing to be as flexible in<br />
their composition as they could be. It is likely that the<br />
nomination process in these companies favours the re-<br />
appointment of current directors rather than the search<br />
for new talent.<br />
figure 8<br />
Availability of directors on boards<br />
(CG ratings, red are above average, blue below)<br />
CG09<br />
rank country CG rating<br />
1 United Kingdom 77<br />
2 Spain 52<br />
3 Switzerland 64<br />
4 Netherlands 71<br />
5 Portugal 41<br />
6 Finland 62<br />
7 Belgium 47<br />
8 France 60<br />
9 Sweden 66<br />
10 Italy 53<br />
11 Denmark 37<br />
12 Germany 39<br />
13 Austria 36<br />
figure 9<br />
Availability of chairmen on boards<br />
(CG ratings, red are above average, blue below)<br />
CG09<br />
rank country CG rating<br />
1 Netherlands 71<br />
2 United Kingdom 77<br />
3 Sweden 66<br />
4 Finland 62<br />
5 Germany 39<br />
6 Switzerland 64<br />
7 Belgium 47<br />
8 Portugal 41<br />
9 Denmark 37<br />
10 Austria 36<br />
11 Spain 52<br />
12 France 60<br />
13 Italy 53<br />
more available less available more available less available<br />
<strong>Heidrick</strong> & <strong>Struggles</strong> 7
figure 10<br />
Average length of tenure of board directors<br />
(length of appointment)<br />
CG09<br />
Spain 4.7<br />
Germany 4.4<br />
Austria 4.2<br />
France 4.1<br />
Netherlands 3.6<br />
Belgium 3.5<br />
Portugal 3.5<br />
United Kingdom 3.0<br />
Italy 2.9<br />
Switzerland 2.8<br />
Denmark 1.6<br />
Finland 1.1<br />
Sweden 1.0<br />
2009 European average 3.1<br />
figure 11<br />
Average time on the board<br />
(length of actual time on the board)<br />
CG09<br />
Denmark 6.8<br />
France 6.8<br />
Belgium 6.7<br />
Sweden 6.7<br />
Switzerland 6.2<br />
Spain 6.1<br />
Austria 5.8<br />
Germany 5.7<br />
Finland 5.1<br />
Portugal 4.8<br />
Netherlands 4.3<br />
Italy 4.2<br />
United Kingdom 4.2<br />
2009 European average 5.5<br />
8 Boards in turbulent times: Corporate Governance <strong>Report</strong> 2009<br />
“finding directors who are<br />
really available is probably<br />
one of the key requests<br />
of company boards,<br />
alongside expertise”
Board committees in Europe<br />
The average number of committees has stabilised to 3<br />
per company (figure 12). We have noted a 25% growth<br />
in this number in 6 years and a doubling in 10 years. We<br />
expect more progress in Denmark, Spain, Italy and Finland,<br />
particularly in the splitting up of combined remuneration<br />
and nomination committees.<br />
The audit committee can now be found in 94% of<br />
companies (figure 13) – from 56% ten years ago. Audit<br />
committees meet 6 times per year on average as in<br />
our previous report. One-third of companies have a<br />
100% independent audit committee. Full independent<br />
representation has become a standard in Belgium,<br />
France, Italy, Netherlands, Spain, Switzerland and the UK.<br />
We still find many non-independent audit committees:<br />
independent directors represent 25% of members in<br />
Austria, 31% of members in Germany and 46% of members<br />
in Denmark.<br />
The remuneration committee is the second most<br />
common committee, found in 89% of companies. There<br />
has been little change in this over the years. Audit<br />
committees still continue to be more independent than<br />
remuneration committees.<br />
figure 13<br />
Presence of board committees in Europe<br />
(key findings across study)<br />
CG09<br />
Audit committee Remuneration<br />
committee<br />
100% presence<br />
Belgium, France, Germany,<br />
Netherlands, Spain,<br />
Sweden, United Kingdom<br />
Less than 75%<br />
presence<br />
Denmark, Italy<br />
Separate<br />
remuneration<br />
committees<br />
Italy, Portugal, Sweden,<br />
United Kingdom<br />
Below European<br />
average<br />
Denmark, Germany<br />
figure 12<br />
Average number of board committees<br />
(for example: audit, remuneration, nomination, etc)<br />
CG09<br />
Germany 4.5<br />
United Kingdom 3.8<br />
Switzerland 3.5<br />
France 3.3<br />
Sweden 3.2<br />
Netherlands 3.0<br />
Belgium 2.9<br />
Portugal 2.8<br />
Austria 2.7<br />
Finland 2.3<br />
Italy 2.3<br />
Spain 2.3<br />
Denmark 1.1<br />
2009 European average 3.0<br />
GROWTH<br />
100% in last 10 years<br />
25% in last 6 years<br />
10% in last 2 years<br />
Nomination<br />
committee<br />
Separate nomination<br />
committees<br />
Germany, Sweden, United<br />
Kingdom<br />
Below European<br />
average<br />
Denmark, Italy, Portugal<br />
1999 2009<br />
Strategy<br />
committee<br />
Higher than European<br />
average<br />
Austria, France, Germany<br />
No presence<br />
Sweden, United Kingdom,<br />
Portugal, Denmark<br />
<strong>Heidrick</strong> & <strong>Struggles</strong> 9
Of the 270 nomination committees in our sample, 40%<br />
are combined remuneration and nomination committees<br />
(from 47% two years ago). In France, Italy and Germany,<br />
boards are starting to split these committees into two.<br />
There is a growing awareness that remuneration and<br />
nomination are major talent challenges, requiring the<br />
commitment of a dedicated and expert group of directors.<br />
Combined committees are not found in the UK, Sweden,<br />
Germany, Italy and Denmark.<br />
Strategy committees are not a European norm, as they<br />
do not exist in Sweden, UK, Portugal and Denmark.<br />
Primarily present in French companies, their number<br />
grew by 50% and we have found them in the majority of<br />
companies in France and Germany.<br />
One third of ethics, corporate governance and<br />
corporate social responsibility committees are still<br />
found in the UK, but in lower numbers and in lower<br />
proportion than in Germany for the first time. One in five<br />
French companies also has an ethics committee.<br />
Composition of committees<br />
Compliance standards can quickly improve if the<br />
composition of committees is addressed: one-third of<br />
audit, remuneration and nomination committees currently<br />
have a non-independent chairman. In Austria, Sweden,<br />
Portugal and Germany, over two-thirds of committee<br />
chairmen are not independent.<br />
In 20% of companies some committees do not include<br />
a single independent member. That situation does not<br />
exist in the UK but is found in Portugal, Austria, Denmark<br />
and in one-third of German companies. Given that these<br />
committees are very important extensions of the board,<br />
their representation should be similarly balanced if they<br />
are to discharge their roles effectively.<br />
“There is a growing awareness that<br />
remuneration and nomination are<br />
major talent challenges, requiring<br />
the commitment of a dedicated<br />
and expert group of directors”<br />
10 Boards in turbulent times: Corporate Governance <strong>Report</strong> 2009
Composition of boards in Europe<br />
managing independence and diversity<br />
Chairmen and CEOs<br />
84% of European companies split the function of chairman<br />
and CEO. In Austria, Finland, Germany, Netherlands,<br />
Sweden and the UK, the role is always split. 60% of<br />
companies in Spain and 42% of French companies<br />
combine the roles of chairman and CEO.<br />
A disturbingly high proportion of former CEOs are still<br />
moving to the chairman role (figure 14): 19% of non-<br />
executive chairmen are the former company CEO. This is,<br />
with a minority of exceptions, contrary to best practice<br />
– potentially tying the hands of a new CEO with the<br />
presence of his predecessor and inhibiting change.<br />
Number of directors<br />
We record an average of 11.8 members per board (figure 15),<br />
compared with 13.5 in 1999. There is very little variance,<br />
country by country, on the 2003, 2005 and 2007 figures.<br />
Opinions are still sharply divided regarding the<br />
advantages and disadvantages of large or small boards.<br />
Many who favour large boards do so, on the basis that<br />
they allow considerable scope for the representation of<br />
diverse interests. Advocates of smaller boards cite the ease<br />
of debate among a smaller number of people suggesting<br />
that the effectiveness of any group of people is in inverse<br />
proportion to its size.<br />
figure 14<br />
Board chairmen in Europe: proportion of executive chairmen and former CEOs<br />
(background of chairmen)<br />
CG09<br />
United Kingdom 6%<br />
94%<br />
Switzerland 25% 15%<br />
60%<br />
Sweden 16%<br />
84%<br />
Spain 60% 9%<br />
31%<br />
Portugal 30%<br />
25%<br />
45%<br />
Netherlands 9%<br />
91%<br />
Italy 13% 13%<br />
74%<br />
Germany 53%<br />
47%<br />
France 42%<br />
30%<br />
28%<br />
Finland 20%<br />
80%<br />
Denmark 5%<br />
21%<br />
74%<br />
Belgium 15%<br />
20%<br />
65%<br />
Austria 10%<br />
90%<br />
2009 European average 16%<br />
19%<br />
65%<br />
Executive chairman, chairman and CEO<br />
Non-executive chairman is the former CEO<br />
Non-executive chairman is not the former CEO<br />
<strong>Heidrick</strong> & <strong>Struggles</strong> 11
figure 15<br />
Number of directors per board<br />
(total membership of the non-executive board)<br />
CG09<br />
Germany 17.7<br />
France 14.6<br />
Spain 14.3<br />
Italy 13.4<br />
Portugal 13.0<br />
Belgium 12.7<br />
Austria 10.8<br />
Sweden 10.8<br />
Switzerland 10.5<br />
Denmark 9.7<br />
Netherlands 8.9<br />
United Kingdom 8.5<br />
Finland 7.7<br />
2009 European average 11.8<br />
GROWTH<br />
-8% in last 10 years<br />
0% in last 6 years<br />
-2% in last 2 years<br />
1999 2009<br />
figure 16<br />
Board composition by<br />
category of director<br />
CG09<br />
Other nonindependent<br />
directors 14%<br />
Independent<br />
non-executive<br />
directors 45%<br />
Executive<br />
directors 10%<br />
Former executive<br />
directors 4%<br />
Reference<br />
shareholders 16%<br />
Employee<br />
representatives 11%<br />
12 Boards in turbulent times: Corporate Governance <strong>Report</strong> 2009<br />
Independence<br />
In contrast to the situation in 1999, the proportion of<br />
independent directors outweighs the proportion of non-<br />
independent directors – those who represent particular<br />
interests, for example, shareholder representatives,<br />
employees and executive directors (figure 16). At 45%,<br />
independent non-executive directors remain the largest,<br />
though no longer a growing, category. In corollary we<br />
notice an increase in the proportion of non-executive<br />
directors who do not qualify as independent according<br />
to the most stringent definitions (e.g. directors on<br />
boards for over 9 years or with commercial links with the<br />
company). Some of these directors may be considered as<br />
independent according to national codes – which could<br />
usefully be reconsidered.<br />
Board diversity<br />
We use a broad definition of diversity with the following<br />
indicators: international diversity, diversity of functional<br />
expertise as well as gender diversity.<br />
Complex global markets and particularly the current<br />
economic situation provide a compelling business<br />
argument for more diverse boards. The assumption is<br />
that the more diverse boards are in terms of experience<br />
the more likely they are to generate innovative and<br />
creative thinking in the boardroom, allowing for better<br />
business solutions. Diversity creates a better stakeholder<br />
representation and ensures sustainable performance.
figure 17<br />
The profile of the boardroom in Europe<br />
(a summary of the average European board)<br />
CG09<br />
Average size of board: 11.8<br />
Average age: 59 years<br />
Average age of new directors: 55 years<br />
9.6 meetings of the full board<br />
1 committee meeting every 4 weeks<br />
Attendance: 92%<br />
Average length of tenure: 3.1 years<br />
Average time on board: 5.5 years<br />
1.2 woman<br />
1 new director<br />
0.9 non-European<br />
1.8 European non-national<br />
figure 18<br />
Proportion of non-national directors<br />
CG09 Netherlands 54%<br />
Switzerland 45%<br />
United Kingdom 41%<br />
Belgium 36%<br />
France 26%<br />
Sweden 21%<br />
Portugal 21%<br />
Finland 19%<br />
Denmark 19%<br />
Austria 12%<br />
Italy 11%<br />
Spain 10%<br />
Germany 8%<br />
2009 European average 23%<br />
Board internationalisation<br />
We record an encouraging 11% increase in the proportion<br />
of non-national directors to 23% (figure 18). However,<br />
this growth hides wide discrepancies among European<br />
countries which we can broadly classify in three groups:<br />
• The pan-European boards (Netherlands, Switzerland,<br />
UK) where non-nationals represent more than 40% of<br />
board members<br />
• Boards comprising a small group of three to five non-<br />
national board members (Belgium, France, Sweden,<br />
Portugal, Denmark and Finland)<br />
• Countries with small international representation<br />
(Germany, Spain, Italy and Austria) – less than 12% non-<br />
nationals, i.e. one or two members per board<br />
The absence of non-national directors remains a challenge<br />
for many companies: one in four European boards include<br />
no foreign directors at present and this proportion has<br />
remained stable over two years – despite the majority of<br />
these companies having significant non-national revenues<br />
and operating locations.<br />
Matching regional business<br />
priorities and competence<br />
We analysed the correlation between international<br />
revenues by region and the international capabilities<br />
of each board by region, represented by its non-<br />
national directors. Hence the rating values not only the<br />
international make-up of European boardrooms, but<br />
the match between regional business priorities and<br />
competence.<br />
Two out of three international directors are still Europeans<br />
(figure 19). One in four is North American. The Asia Pacific<br />
(APAC) region is still under-represented in European<br />
boardrooms compared with the aspirations of European<br />
companies in this region and we confidently predict that<br />
this will change – despite the logistical challenges.<br />
<strong>Heidrick</strong> & <strong>Struggles</strong> 13
figure 19<br />
Country and region of origin<br />
of non-national directors<br />
CG09<br />
United Kingdom 15%<br />
North America 21%<br />
Latin and South America 3%<br />
Asia Pacific 6%<br />
Diversity of functional expertise<br />
When analysing functional diversity on European<br />
boardrooms, we found that 48% of European boards have<br />
no director with a sales and marketing profile. No director<br />
has this type of expertise in 90% of German boards, in 83%<br />
of Spanish boards and 70% of Dutch boards.<br />
Germany 15%<br />
Also, we noticed that 37% of audit committees do not<br />
comprise a CFO or former CFO. Countries where CFO<br />
expertise is lacking in over 50% of the audit committees<br />
are Portugal, Denmark, Finland and Switzerland.<br />
Gender diversity<br />
While our statistics have been showing a 12% to 22%<br />
increase (figure 20) in the number of women on boards,<br />
since 2005; the proportion of women reaches 9.9% of<br />
14 Boards in turbulent times: Corporate Governance <strong>Report</strong> 2009<br />
Middle East and Africa 3%<br />
Other European<br />
countries 5%<br />
Northern<br />
Europe 14%<br />
France 19%<br />
Central and Eastern<br />
Europe 6%<br />
Spain and Portugal 6%<br />
Italy 6%<br />
Benelux 14%<br />
board members this year. One European company out of<br />
three has no women board members (against 46% in 2005<br />
and 54% in 2003). Sweden and Finland are leading the way<br />
with over 20% female directors, while Portugal and Italy<br />
come last, with about 3% (figure 21).<br />
Age of directors<br />
The issue of age versus experience has edged its way<br />
into the boardroom. While companies are introducing<br />
younger executives to their top teams to gain fresh<br />
ideas and insights, the markets have been spooked by<br />
governance issues and are now calling for a greater depth<br />
of experience (figure 22).
figure 20<br />
Proportion of women on the board<br />
CG09<br />
Sweden 22%<br />
Finland 21%<br />
United Kingdom 15%<br />
Denmark 13%<br />
Netherlands 13%<br />
Germany 11%<br />
Switzerland 9%<br />
France 8%<br />
Belgium 8%<br />
Austria 6%<br />
Spain 6%<br />
Italy 3%<br />
Portugal 3%<br />
2009 European average 10%<br />
GROWTH<br />
10% in last 10 years<br />
54% in last 6 years<br />
12% in last 2 years<br />
Sweden 0%<br />
Finland 13%<br />
Denmark 16%<br />
United Kingdom 18%<br />
2001 2009<br />
figure 21<br />
Proportion of companies with<br />
no women on the board<br />
CG09<br />
Germany 20%<br />
France 23%<br />
Netherlands 30%<br />
Switzerland 35%<br />
Spain 43%<br />
Belgium 45%<br />
Austria 65%<br />
Italy 67%<br />
Portugal 70%<br />
2009 European average 31%<br />
figure 22<br />
Average age of directors<br />
CG09<br />
Netherlands 62.4<br />
France 61.6<br />
Germany 60.1<br />
United Kingdom 59.7<br />
Italy 59.6<br />
Switzerland 59.5<br />
Spain 58.9<br />
Belgium 57.6<br />
Sweden 57.1<br />
Denmark 56.9<br />
Finland 56.7<br />
Portugal 55.9<br />
Austria 55.9<br />
2009 European average 59.0<br />
GROWTH<br />
2% in last 6 years<br />
1% in last 2 years<br />
2003 2009<br />
“Sweden and Finland are<br />
leading the way with over<br />
20% female directors,<br />
while Portugal and Italy<br />
come last, with about 3%”<br />
<strong>Heidrick</strong> & <strong>Struggles</strong> 15
European boards<br />
remuneration<br />
Total non-executive board fees<br />
We found a significant disparity among European<br />
companies when analysing the total spent on non-<br />
executive fees (figure 23). Switzerland has the highest non-<br />
executive board budget, three times higher than the UK<br />
and 50% more than the budget of German boards.<br />
Directors’ remuneration<br />
During the last ten years, the average remuneration of<br />
directors has gone up by 164% to 83,500 Euros (figure 24).<br />
The growth is steady at 23% in the last two years. The<br />
highest remuneration – at above 100,000 Euros per year<br />
– are found in Switzerland, Germany, Spain and the UK.<br />
Companies in Austria, France, Finland and Sweden still<br />
offer the lowest directors fees (less than 55,000 Euros).<br />
figure 23<br />
Average board budget<br />
(non-executive board fees in 1000 €)<br />
CG09<br />
Switzerland 3,600<br />
Germany 2,200<br />
Spain 1,690<br />
Italy 1,540<br />
United Kingdom 1,200<br />
Portugal 880<br />
Belgium 840<br />
France 705<br />
Denmark 670<br />
Netherlands 662<br />
Sweden 550<br />
Finland 450<br />
Austria 220<br />
2009 European average 1,200<br />
16 Boards in turbulent times: Corporate Governance <strong>Report</strong> 2009<br />
Turbulent times should put pressure for less disparity<br />
in directors’ remuneration among European top public<br />
companies. The highest fees will drop as the variable fee<br />
component shrinks. At the other end of the scale there<br />
will be calls to increase fees to attract international, high-<br />
profile candidates and reflect the greater responsibilities<br />
of directors in hard times.<br />
Remuneration structure<br />
Remuneration structures vary in complexity. In Finland,<br />
Sweden, Austria and the UK the fixed basic fee represents<br />
over 75% of the total fee (figure 26). Companies in other<br />
countries added other layers of fees: the most common<br />
figure 24<br />
Average remuneration of directors<br />
(values shown in 1000 €)<br />
CG09<br />
Switzerland 194<br />
Germany 110<br />
Spain 108<br />
United Kingdom 108<br />
Italy 79<br />
Portugal 68<br />
Netherlands 67<br />
Belgium 65<br />
Denmark 60<br />
Sweden 54<br />
Finland 50<br />
France 48<br />
Austria 25<br />
2009 European average 83<br />
GROWTH<br />
164% in last 10 years<br />
61% in last 6 years<br />
23% in last 2 years<br />
1999 2009
figure 25<br />
Average basic fixed fee of directors<br />
CG09 (values in 1000 €, data sample for Portugal is not<br />
representative and therefore not published)<br />
are attendance fees, variable fees based on company<br />
performance, basic fees for committee membership and<br />
chairmanship, and committee attendance fees.<br />
The proportion of the fixed remuneration (fixed basic<br />
and fixed committee fees) is on average 83% of the<br />
total remuneration (figure 26). In Denmark, Sweden,<br />
Switzerland, Italy, Netherlands and the UK, fixed<br />
remuneration represents over 90% of the total. At the<br />
other end of the spectrum, remuneration is over 40%<br />
variable in France (based on attendance fees) and<br />
Germany (mainly based on company performance).<br />
It comes as no surprise that countries offering the lowest<br />
basic fixed fees (figure 25) are precisely those where<br />
variable fees represent a greater proportion of the total<br />
(figure 26). High basic fixed fees in Switzerland make it<br />
difficult for directors’ fees to be adjusted in response to<br />
turbulent times.<br />
Switzerland 132<br />
United Kingdom 84<br />
Spain 75<br />
Italy 57<br />
Netherlands 48<br />
Sweden 45<br />
Finland 43<br />
Denmark 41<br />
Germany 40<br />
Belgium 31<br />
France 22<br />
Austria 20<br />
2009 European average 55<br />
GROWTH<br />
39% in last 2 years<br />
2007 2009<br />
figure 26<br />
Proportion of the fixed fees in the total<br />
CG09 remuneration of board directors<br />
(data sample for Portugal is not representative<br />
and therefore not published)<br />
figure 27<br />
Average remuneration of committee<br />
CG09 chairmen and members<br />
(shown in Euros)<br />
Audit chairman 29,200<br />
Remuneration chairman 19,800<br />
Nomination chairman 13,000<br />
Audit member 16,700<br />
Remuneration member 13,000<br />
Nomination member 8,600<br />
Remuneration of committee<br />
chairmen and members<br />
The remuneration of the chairmen and members of<br />
the audit, remuneration and nomination committees<br />
(figure 27) has remained stable since 2007.<br />
<strong>Heidrick</strong> & <strong>Struggles</strong> 17
Board evaluation<br />
Our report confirms the standardisation of board<br />
evaluation: 75% of European companies have done a<br />
board evaluation in the last two years (figure 28), from<br />
44% in our last report. Evaluation has become a standard<br />
in the UK, Sweden, Germany, Netherlands and Finland<br />
– over 90% of companies in these countries conducted<br />
an evaluation of their board in 2006 or 2007 – but is still<br />
uncommon in Portugal, Belgium and Austria. Half of<br />
European companies intended to evaluate their board<br />
in 2008.<br />
Board evaluation leadership<br />
Our research found that one company out of four did not<br />
disclose who led the board evaluation (figure 29).<br />
Out of the companies who do disclose this information,<br />
we found the following:<br />
• Executive chairmen lead 9% of the evaluations but<br />
when involved in France and Spain, they are regularly<br />
acting alone, which contradicts best practices. In Italy,<br />
the executive chairman conducts the evaluation, but<br />
is always accompanied by another party, usually an<br />
independent director. However, when an executive<br />
chairman leads the evaluation, an independent party<br />
is involved in only 27% of the cases.<br />
• The non-executive chairman leads the evaluation in<br />
another 23% of the cases, sometimes supported by the<br />
corporate board secretary or external consultants.<br />
• Committees (nomination, governance) do not often<br />
lead the process (9%), but more frequently in France,<br />
Italy and Spain than in the rest of Europe.<br />
• It is likely that the involvement of the corporate<br />
board secretary (2%) will increase over the years with<br />
this role becoming better defined as boards grow in<br />
complexity.<br />
• External consultants conduct 22% of board<br />
evaluations, especially in the UK, France and Austria.<br />
Consultants work on their own in 89% of the cases.<br />
18 Boards in turbulent times: Corporate Governance <strong>Report</strong> 2009<br />
figure 28<br />
Board evaluation<br />
(percentage of boards undertaking evaluation)<br />
CG09<br />
United Kingdom 98%<br />
We found that in 42% of companies that evaluated their<br />
board in the past two years, at least one of the persons<br />
responsible for leading the evaluation was independent.<br />
Board evaluation process<br />
In a majority of companies, we have no information<br />
on how the evaluation took place. Where we do<br />
have information, board evaluations are based on a<br />
questionnaire in 16% of the cases; individual interviews<br />
with members of the board in 11%; and a combination of<br />
the two in 17% (figure 30).<br />
Sweden 96%<br />
Germany 93%<br />
Netherlands 91%<br />
Finland 90%<br />
France 78%<br />
Denmark 74%<br />
Italy 72%<br />
Spain 71%<br />
Switzerland 65%<br />
Austria 40%<br />
Belgium 25%<br />
Portugal 20%<br />
2009 European average 75%<br />
GROWTH<br />
70% in last 2 years<br />
2007 2009
We see a growing trend to rely less on the questionnaire<br />
alone. In Sweden, where an annual evaluation is the norm,<br />
the use of a questionnaire is more frequent than in the<br />
UK, where 55% of companies use a mix of a questionnaire<br />
and interviews. Non-executive chairmen rely more on a<br />
combination of interviews and questionnaires (42%) than<br />
executive chairmen do.<br />
In a new item in our report, we found that 42% of the<br />
companies that evaluated their board in the last two years<br />
also included an individual evaluation of each director.<br />
Low transparency on<br />
board evaluation<br />
Transparency about the board evaluation process and<br />
leadership is very low. Only one-third of companies<br />
undertaking board evaluation publish the subjects<br />
discussed during the evaluation and the measures being<br />
taken to remedy any issues, whereas we have detailed<br />
information in 90% of British companies.<br />
figure 29<br />
Board evaluation leadership<br />
(breakdown of who leads the evaluation)<br />
CG09<br />
Leadership not<br />
disclosed 27%<br />
Corporate board<br />
secretary 2%<br />
Committee 9%<br />
Lead director 8%<br />
Executive<br />
chairman 9%<br />
External<br />
consultant 22%<br />
Non-executive<br />
chairman 23%<br />
“…42% of the companies<br />
that evaluated their board<br />
in the last two years also<br />
included an individual<br />
evaluation of each director”<br />
figure 30<br />
Board evaluation process<br />
(method of evaluation)<br />
CG09<br />
Not disclosed 56%<br />
Questionnaire 16%<br />
Interview 11%<br />
Questionnaire<br />
and interview 17%<br />
<strong>Heidrick</strong> & <strong>Struggles</strong> 19
Corporate Governance Rating<br />
Austria<br />
Austrian boards are not as well prepared<br />
for the economic turbulence as they<br />
could be. The 52 point spread between<br />
best and worst performing boards is<br />
the second greatest in Europe but the<br />
disparity is a positive sign.<br />
Top companies are moving ahead to become corporate<br />
governance champions while the mass of small under-<br />
performing businesses have remained the same.<br />
Austrian business strategy has been focused on the<br />
growth opportunities in European Union accession states,<br />
notably Bulgaria, Romania and the Czech Republic. But the<br />
banking crisis that has fanned outwards from the United<br />
States has temporarily halted investment in transitioning<br />
economies. It is fair to say that the scale of the present<br />
crisis took Austrian boards by surprise.<br />
The crisis in banking in particular has left the strong<br />
impression that Austrian boards are exercising insufficient<br />
governance. Chairmen have a clear responsibility to<br />
ensure that they bring the necessary expertise onto their<br />
boards. This will present the two-tier Austrian boards with<br />
a problem. Many non-executives have been appointed to<br />
represent shareholders and other external interest groups.<br />
Therefore, boards sometimes lack true independence, a<br />
situation that will be exacerbated by a trend for greater<br />
shareholder activism and a call for tougher regulation.<br />
Austrian boards are very stable. Directors serve for a long<br />
time (the third highest tenure in Europe). The formality of<br />
accounting procedures and the legalistic structure of two-<br />
tier boards springs from a command and control mindset.<br />
This deters excessive risk-taking but equally it prevents<br />
directors delving deep into management practices and<br />
gaining a thorough understanding of the businesses they<br />
supervise.<br />
Fundamental issues like the composition of the board,<br />
the lack of independent committee chairmanship, the<br />
20 Boards in turbulent times: Corporate Governance <strong>Report</strong> 2009<br />
Austria<br />
Denmark<br />
Germany<br />
Portugal<br />
infrequency of board meetings and the fact that both<br />
chairmen and directors hold too many simultaneous<br />
positions have eroded trust. Austrian boards meet on<br />
average 5.6 times a year which is the lowest number in<br />
Europe (the European average is 9.6).<br />
Audit committees are now found in 95% of Austrian<br />
companies, while 85% of companies have a remuneration<br />
committee, half of which hold a combined remuneration<br />
and nomination brief. The average number of committees<br />
per company has stabilised at 2.7 – slightly under the<br />
European average.<br />
It is encouraging to note that 40% of Austrian boards<br />
now carry out an evaluation, a figure that has increased<br />
significantly from a very low base. Most board evaluations<br />
are based on a self-evaluation model that is an essential<br />
first step towards the more sophisticated evaluative<br />
methodology carried out by independent organisation.<br />
Following the traditional Austrian model, there is a<br />
systematic split between the role of chairman and<br />
CEO and 10% of chairmen are the former CEOs of their<br />
company. The percentage of non-national directors on<br />
Austrian boards (12%) is low by European standards and<br />
there is an over representation of German nationals. It<br />
is interesting that given the stated strategy of Austrian<br />
companies to expand into Central and Eastern Europe<br />
how few directors there are from Eastern Europe. This is an<br />
obvious opportunity that needs to be grasped in the near<br />
future, notably by the 40% of boards with no international<br />
representation.<br />
With an average age of 55.9 years Austria has the youngest<br />
boards in Europe. But remuneration is extremely low at an<br />
average of 25,000 Euros and needs to be raised if Austrian<br />
boards are to attract more diverse and talented non-<br />
executives.<br />
Austria still has to achieve a massive mindset change to<br />
achieve better corporate governance. Overall corporate<br />
governance does not enjoy the dedicated attention it<br />
ought to.<br />
Belgium
Spain<br />
Italy<br />
European average<br />
2009<br />
2007<br />
France<br />
Former<br />
executive<br />
directors<br />
Finland<br />
Switzerland<br />
Sweden<br />
Independent non-executive<br />
directors<br />
3% 28%<br />
Netherlands<br />
Reference<br />
shareholders<br />
24%<br />
United Kingdom<br />
North America 19%<br />
United Kingdom 15%<br />
Germany 38%<br />
Benelux 4%<br />
France 4%<br />
Central and Eastern Europe 4%<br />
Northern Europe 8%<br />
Middle East and Africa 8%<br />
Employee representatives<br />
30%<br />
2%23% 17% 34%<br />
24%<br />
AT09<br />
Identification of<br />
independent directors<br />
2009 2007<br />
95% 100%<br />
Frequency of meetings 85% 89%<br />
Age of directors 30% 0%<br />
Start and end of tenure 45% 32%<br />
Directors’ main executive position 55% 53%<br />
AT09<br />
Board composition by category of director<br />
Transparency of directors’ information<br />
(% of companies providing information)<br />
AT09<br />
Ratio of non-national directors<br />
to national directors<br />
Other non-independent<br />
directors<br />
16%<br />
2009 2007<br />
Directors’ other board positions 60% 42%<br />
Directors’ company shares held 45% 11%<br />
Remuneration of directors 50% 32%<br />
Remuneration structure 50% n/a<br />
List of committee members 85% 53%<br />
<strong>Report</strong> of activity of<br />
each committee 55% n/a<br />
Corporate Governance <strong>Report</strong><br />
2009<br />
<strong>Heidrick</strong> & <strong>Struggles</strong> 21
Corporate Governance Rating<br />
Belgium<br />
Recession has come as a setback for<br />
Belgian boards. In 2007 we found Belgian<br />
companies raising the bar through two<br />
corporate governance codes, Lippens for<br />
public companies and Buysse for small<br />
family-owned businesses.<br />
These improvements have, at least for the short-term,<br />
been overshadowed by concerns for the health of the<br />
economy and a focus on operational survival.<br />
In the wake of the Lippens scandal, three trends are<br />
forming: large companies are strengthening corporate<br />
governance and transparency in line with international<br />
best practice, and smaller companies that floated in the<br />
past decade are starting to think about going private<br />
again. While major shareholders of companies that sold<br />
out to large conglomerates in boom times now want to<br />
buy them back.<br />
The 48 points between the best and worst performing<br />
boards shows Belgian companies are heterogeneous. A<br />
divide persists between big international companies and<br />
small long established family businesses which are more<br />
conservative in outlook. A few companies totally ignore<br />
corporate governance standards.<br />
There is very low turnover of directors on Belgian boards<br />
as directors stay on boards for an average of 6.7 years (the<br />
third highest average in Europe).<br />
The number of meetings Belgian boards hold each year<br />
is stable at 8.6. But this should not hide the fact that 15%<br />
of companies hold 5 meetings or less per year and 25%<br />
hold 6 meetings or less. At 89%, attendance is the second<br />
lowest in Europe.<br />
The number of committees has increased by 7% to an<br />
average of 2.9 per company and for the first time, all<br />
companies in the BEL20 have at least one committee.<br />
Audit committees are found in all Belgian companies;<br />
75% operate a combined remuneration and nomination<br />
22 Boards in turbulent times: Corporate Governance <strong>Report</strong> 2009<br />
Austria<br />
Denmark<br />
Germany<br />
Portugal<br />
committee. In terms of nomination, the appointment<br />
of non-executive directors is too often influenced by a<br />
powerful chairman selecting via a closed network rather<br />
than by objective criteria. Remuneration needs to be more<br />
open and there is a role for independent review if Belgium<br />
is to improve standards of corporate governance.<br />
Independent board evaluation is at the heart of good<br />
governance but only one in four Belgian companies has<br />
carried out an evaluation in the last two years, while only<br />
40% of these evaluations were led by an independent<br />
board member. 60% of companies carrying out the<br />
process included an evaluation of individual directors.<br />
<strong>Report</strong>ing is infrequent and transparency is consequently<br />
low.<br />
A majority of Belgian boards (85%) split the role of<br />
chairman and chief executive but 20% of non-executive<br />
chairmen are the company’s former CEO. Consensus plays<br />
a very strong role; decisions must be unanimous and when<br />
there is a strong chairman, non-executive directors often<br />
feel constrained from raising concerns.<br />
Belgian boards have reported a 9% increase in non-<br />
nationals to 36% which means they are evolving rapidly.<br />
However, averages can be misleading and the 19% of<br />
North-Americans on boards is confined to a relatively<br />
small number of global companies while the French<br />
account for 43% of the total. 45% of Belgian boards have<br />
no individuals with a sales and marketing background and<br />
women are under represented at 7.5%.<br />
Directors’ remuneration needs to be more open and<br />
transparent judging by shareholder activism and the low<br />
esteem the public hold towards corporate governance.<br />
Historic growth in profits means that in the period of<br />
this report, director remuneration increased by 12% to<br />
65,000 Euros. The basic fee remained stable at 31,000 Euros<br />
suggesting that total remuneration will fall back as profits<br />
decline.<br />
This is the time for Belgian boards to do away with the<br />
ghosts of the past and seize the opportunity to become<br />
more transparent, professional and effective.<br />
Belgium
Spain<br />
Italy<br />
European average<br />
2009<br />
2007<br />
2005<br />
2003<br />
2001<br />
France<br />
Executive<br />
directors<br />
13%<br />
Finland<br />
Switzerland<br />
Sweden<br />
Former<br />
executive<br />
directors<br />
3<br />
Netherlands<br />
Independent non-executive<br />
directors<br />
40%<br />
United Kingdom<br />
North<br />
America 19%<br />
Latin and<br />
South America 4%<br />
Reference<br />
shareholders<br />
32%<br />
United<br />
Kingdom 9%<br />
Germany 10%<br />
France 43%<br />
Netherlands<br />
and Luxembourg 8%<br />
Other European<br />
countries 4%<br />
APAC 3%<br />
Employee representatives<br />
3<br />
Other nonindependent<br />
directors<br />
13% 5% 41% 35%<br />
6%<br />
15% 139%<br />
33%<br />
12%<br />
14%<br />
20% 124%<br />
BE09<br />
4%<br />
39%<br />
Identification of<br />
independent directors<br />
2009 2007 2005<br />
47%<br />
100% 100% 95%<br />
Frequency of meetings 70% 100% 80%<br />
Age of directors 70% 58% 50%<br />
Start and end of tenure 60% 63% 70%<br />
Directors’ main executive position 60% 79% 95%<br />
BE09<br />
BE09<br />
Ratio of non-national directors<br />
to national directors<br />
Board composition by category of director<br />
Transparency of directors’ information<br />
(% of companies providing information)<br />
41%<br />
Corporate Governance <strong>Report</strong><br />
2009<br />
9%<br />
8%<br />
2009 2007 2005<br />
Directors’ other board positions 55% 68% 55%<br />
Directors’ company shares held 30% 32% 15%<br />
Remuneration of directors 75% 89% 55%<br />
Remuneration structure 45% n/a n/a<br />
List of committee members 100% 95% 100%<br />
<strong>Report</strong> of activity of<br />
each committee 60% n/a n/a<br />
1<br />
<strong>Heidrick</strong> & <strong>Struggles</strong> 23
Corporate Governance Rating<br />
Denmark<br />
As the economy worsens, Denmark is<br />
tightening corporate regulation in an<br />
attempt to avoid company failure and<br />
boost best practice.<br />
The corporate governance committee of the Danish<br />
Companies’ Register has introduced guidelines, first<br />
introduced by the Norby Commission, to support the<br />
voluntary code that applies to boards. In future, minimum<br />
standards including the number of board meetings a year,<br />
board composition and risk management procedures will<br />
all be strengthened.<br />
One of the big issues is control. Danish boards will be<br />
expected to report on their risk management processes.<br />
Accurate management information is critical and the<br />
present two-tier board system distances non-executive<br />
directors from what is happening at company level.<br />
Greater levels of dialogue and accountability are needed.<br />
The need for diversity on boards will become increasingly<br />
important. At 19%, the proportion of non-nationals on<br />
Danish boards is below the European average and those<br />
they do have tend to be Nordic in origin. On the positive<br />
side, at 13%, women are relatively well represented.<br />
The perception lingers that Danish directors are drawn<br />
from a restricted talent pool that is overly reliant on<br />
personal connections. Internationalisation of boards will<br />
only begin to increase when a younger generation starts<br />
to take over.<br />
Danish boards are better prepared for turbulent times<br />
than they were five years ago. Boards are evaluating<br />
their contribution in an increasingly structured fashion.<br />
There is a strong consensus that non-executive boards<br />
need to challenge and be a ‘critical friend’ to executive<br />
management.<br />
The 46 point spread between the highest and lowest<br />
company rating shows that Denmark is heterogeneous.<br />
Some of Denmark’s biggest companies are strong, family-<br />
24 Boards in turbulent times: Corporate Governance <strong>Report</strong> 2009<br />
Austria<br />
Denmark<br />
Germany<br />
Portugal<br />
run businesses with limited board independence and<br />
accountability. Elsewhere smaller businesses are modestly<br />
raising standards.<br />
With about 9 full board meetings a year, Danish boards do<br />
not meet as frequently as the rest of Europe but they do<br />
meet more often than other countries with the two-tier<br />
board system. Danish board directors have many more<br />
simultaneous positions than their European peers, a<br />
handicap that also applies to chairmen.<br />
The average number of committees per company is 1.1,<br />
which is the lowest proportion in Europe by far. Only 42%<br />
of Danish companies now have an audit committee and<br />
only one-third of audit committees include an individual<br />
with a CFO profile. The lack of committees reflects not<br />
only the preponderance of family-run enterprises but<br />
also the deeply ingrained philosophy that the board is a<br />
collective body that must act together. Groups that meet<br />
to conduct business outside of the main board meetings<br />
are suspected of undermining collective debate.<br />
Danish companies have made good progress in board<br />
evaluation. 74% of Danish companies conducted an<br />
evaluation in the last two years; progress has been largely<br />
due to shareholder pressure. On the other hand, the<br />
evaluation process is opaque. In most cases the evaluation<br />
is internal and led by the non-executive chairman in 79%<br />
of cases. In only 14% of cases are external consultants<br />
called in to assist in the process. Companies do not publish<br />
the results of evaluation.<br />
As in most countries which have two-tier boards, the role<br />
of the chairman and CEO is split although in 21% of cases<br />
the chairman is the former CEO. Directors have the third<br />
shortest tenure in Europe at 1.6 years due to a system of<br />
annual board elections but usually the entire board is<br />
voted back in; Danish directors are among the longest<br />
serving in Europe at an average of 6.8 years.<br />
Despite 13% growth in the last two years, remuneration is a<br />
small budget for Danish boardrooms. At 60,000 Euros the<br />
remuneration of the average Danish director is well below<br />
their counterparts in Spain, UK, Germany and Switzerland.<br />
Belgium
Spain<br />
Italy<br />
European average<br />
Executive<br />
directors<br />
2009<br />
2007<br />
2005<br />
France<br />
Former<br />
executive<br />
directors<br />
Finland<br />
Switzerland<br />
Sweden<br />
Independent non-executive<br />
directors<br />
Netherlands<br />
United Kingdom<br />
Reference<br />
shareholders<br />
North America 11%<br />
United Kingdom 3%<br />
Germany 6%<br />
Benelux 3%<br />
Northern Europe 71%<br />
Other European countries 6%<br />
Employee representatives<br />
Other non-independent<br />
directors<br />
15% 32% 16% 31% 15%<br />
14 30% 18%<br />
31%<br />
16%<br />
2 128%<br />
10% 29%<br />
30%<br />
DK09<br />
Identification of<br />
independent directors<br />
2009 2007 2005<br />
89% 70% 100%<br />
Frequency of meetings 74% 70% 55%<br />
Age of directors 95% 90% 75%<br />
Start and end of tenure 79% 75% 65%<br />
Directors’ main executive position 84% 35% 75%<br />
DK09<br />
Transparency of directors’ information<br />
(% of companies providing information)<br />
DK09<br />
Ratio of non-national directors<br />
to national directors<br />
Board composition by category of director<br />
Corporate Governance <strong>Report</strong><br />
2009<br />
2009 2007 2005<br />
Directors’ other board positions 95% 95% 95%<br />
Directors’ company shares held 53% 40% 30%<br />
Remuneration of directors 63% 50% 55%<br />
Remuneration structure 32% n/a n/a<br />
List of committee members 37% 0% 0%<br />
<strong>Report</strong> of activity of<br />
each committee 5% n/a n/a<br />
<strong>Heidrick</strong> & <strong>Struggles</strong> 25
Corporate Governance Rating<br />
Finland<br />
With the experience of a steep recession<br />
in the early 1990s still fresh in the minds<br />
of directors, Finnish boards are better<br />
prepared for these turbulent times than<br />
many countries in Europe.<br />
Finnish boards tend to engage with the executives of their<br />
companies and actively challenge business decisions; we<br />
have found that non-executives feel highly valued. The<br />
greater convergence between best and worst performing<br />
boards and the absence of any Finnish company at the<br />
lower end of the scale shows that the need for higher<br />
standards is taken seriously.<br />
Boards meet frequently in Finland – on average 12.6<br />
times a year – and the 95% attendance rate is evidence of<br />
active involvement and a strong work ethic. Finnish non-<br />
executives and chairmen hold less simultaneous board<br />
positions than their European counterparts giving them<br />
more time to focus on critical business decisions.<br />
The 18% increase in the number of board committees<br />
over the last two years illustrates a greater reliance on<br />
committee work although the number of committees<br />
per company (2.3) is still low by European standards.<br />
The most important committees in Finland are audit<br />
and remuneration, both of which are found in 93% of<br />
companies. However, in 57% of cases the audit committee<br />
does not include an acting or former CFO. Remuneration<br />
and nomination are still discussed in a single committee in<br />
the majority of companies.<br />
At 1.1 years, a board director’s average length of tenure<br />
is the shortest in Europe but this reflects the tradition<br />
in Finland of electing a board to serve for one year. The<br />
length of time directors have served on their boards (5.1<br />
years) counterbalances this. A small but significant cadre<br />
of young professional board directors is emerging, many<br />
of whom have been to international business schools.<br />
26 Boards in turbulent times: Corporate Governance <strong>Report</strong> 2009<br />
Austria<br />
Denmark<br />
Germany<br />
Portugal<br />
The vast majority of Finnish boards are under regular<br />
evaluation; 90% of Finnish companies have undertaken<br />
an assessment in the last two years. However despite<br />
Finland’s high disclosure scores the board evaluations are<br />
not transparent. There is no legal obligation on Finnish<br />
companies to disclose information about board evaluation<br />
and this lack of transparency makes it much harder to<br />
benchmark Finnish boards against international best<br />
practice.<br />
The lack of international diversity on Finnish boards is a<br />
negative factor that is preventing Finnish companies from<br />
competing more strongly in international markets. The<br />
lack of foreign influence also introduces a certain amount<br />
of inertia and conservatism into boardroom decision-<br />
making. At 19% non-national board membership is mainly<br />
drawn from other Nordic countries. One in two boards of<br />
global Finnish companies have no non-national director,<br />
which is exceptionally high in Europe. Finnish boards are<br />
not doing enough to attract talent from the USA, Western<br />
Europe or emerging markets.<br />
This can be explained by the low spending by the board,<br />
which at an average of 450,000 Euros, is the second<br />
lowest in Europe. Since 2007 directors’ remuneration<br />
has increased by about 50,000 Euros but it still remains<br />
low. We expect these rates to rise significantly in the<br />
future as Finland’s strongest companies attempt to gain<br />
competitive advantage on the world stage.<br />
Finland has good reason to be proud of its corporate<br />
governance record, particularly as it possesses the second<br />
highest proportion of women in the boardroom at 21%.<br />
However, given the Finnish culture of transparency, it is<br />
quite surprising that the results of board evaluations are<br />
not published as widely as they could, and indeed, should<br />
be. Only through open, transparent and professional<br />
board evaluations – including international benchmarking<br />
– can Finnish boards significantly differentiate themselves<br />
from other European countries.<br />
Belgium
Spain<br />
Italy<br />
European average<br />
2009<br />
2007<br />
2005<br />
2003<br />
2001<br />
France<br />
Finland<br />
Switzerland<br />
Sweden<br />
FI09<br />
Ratio of non-national directors<br />
to national directors<br />
Executive<br />
directors<br />
Former<br />
executive<br />
directors<br />
Netherlands<br />
Independent non-executive<br />
directors<br />
United Kingdom<br />
North America 11%<br />
United Kingdom 5%<br />
France 7%<br />
Germany 2%<br />
Benelux 11%<br />
Central and Eastern Europe 7%<br />
Northern Europe 50%<br />
APAC 7%<br />
Reference<br />
shareholders<br />
Employee<br />
representatives<br />
Other non-independent<br />
directors<br />
6% 4 68%<br />
11% 110%<br />
5%<br />
8%<br />
10%<br />
19%<br />
FI09<br />
3 68% 13% 1 10%<br />
2 63% 15% 2 10%<br />
4 53% 22% 2 9%<br />
Identification of<br />
independent directors<br />
Corporate Governance <strong>Report</strong><br />
2009<br />
4 39% 32% 6%<br />
2009 2007 2005<br />
97% 87% 50%<br />
Frequency of meetings 100% 100% 97%<br />
Age of directors 100% 100% 93%<br />
Start and end of tenure 97% 100% 97%<br />
Directors’ main executive position 100% 100% 100%<br />
FI09<br />
Board composition by category of director<br />
Transparency of directors’ information<br />
(% of companies providing information)<br />
2009 2007 2005<br />
Directors’ other board positions 100% 97% 93%<br />
Directors’ company shares held 97% 100% 97%<br />
Remuneration of directors 93% 97% 73%<br />
Remuneration structure 100% 97% 93%<br />
List of committee members 100% 87% 63%<br />
<strong>Report</strong> of activity of<br />
each committee<br />
90% 87% 50%<br />
<strong>Heidrick</strong> & <strong>Struggles</strong> 27
Corporate Governance Rating<br />
France<br />
In the face of a deepening credit crisis,<br />
French boards must ask whether they are<br />
sufficiently prepared for the challenges<br />
ahead. The answer is not entirely<br />
reassuring.<br />
French directors are the second oldest in Europe (average<br />
age: 61.6), they have the fourth longest length of tenure<br />
and at over six years, the time they serve on boards is<br />
greater than every other country. All of these are inertia<br />
factors that could hinder boards looking to renew their<br />
expertise with fresh talent. Effectiveness is also limited<br />
by the multiple directorships many board members hold.<br />
This dilutes the talent pool and limits the ability of board<br />
members to become active participants in business<br />
improvement by challenging or supporting senior<br />
management.<br />
On a positive note, companies are well aware of the<br />
gravity of the economic situation and are taking steps to<br />
improve corporate governance. French companies are<br />
homogeneous with only a narrow gap (32 points) between<br />
the best and worst performing boards.<br />
So what is changing in these turbulent times? Companies<br />
are making more demands of directors by increasing the<br />
number of committee meetings. There has been a 12% rise<br />
since 2007, to 13 meetings a year. The average number of<br />
committees per company has risen to 3.3 per company.<br />
98% of companies have a remuneration committee but<br />
43% of those are combined remuneration and nomination<br />
committees; a feature that will have to change if French<br />
boards are to improve their overall ranking.<br />
All companies have an audit committee and, at 55%,<br />
France has the second highest proportion of strategy<br />
committees in Europe. One in five French companies also<br />
has an ethics and a corporate governance committee. This<br />
proliferation of committees probably has less to do with<br />
the turbulent economic environment and more to do with<br />
the French culture of bureaucracy. Strategy committees<br />
28 Boards in turbulent times: Corporate Governance <strong>Report</strong> 2009<br />
Austria<br />
Denmark<br />
Germany<br />
Portugal<br />
encourage debate particularly around mergers and<br />
acquisitions, and diversification, but the fact that many<br />
non-executive directors sit on other boards means they<br />
probably lack sufficient knowledge of their company’s<br />
core business to challenge the CEO.<br />
Over the last two years there has been a significant rise<br />
in board evaluation up from 50% to 78%. In 61% of the<br />
companies that evaluated their board, at least one person<br />
responsible for leading the evaluation was independent.<br />
French companies perform well on transparency of<br />
reporting but when it comes to board evaluation, 42% of<br />
companies provide no information on how the evaluation<br />
took place. Boards carrying out an independent evaluation<br />
are generally the same boards (45%) that publish full<br />
details.<br />
Independence is an issue. 58% of companies split the<br />
functions of CEO and chairman. But when the roles<br />
are split, the chairman is often the former CEO of the<br />
company. 30% of France’s chairmen are former CEOs and<br />
42% are current CEOs. The split role here is not a sign of<br />
improved corporate governance as it is in the UK and<br />
Germany, but rather a sign of continuity. We believe that,<br />
over time, the combined roles will significantly decline<br />
and more independent chairmen will be demanded by<br />
shareholders.<br />
At 26% French boards are slightly above the average in<br />
terms of internationalisation; of the non-nationals, 71%<br />
are European. French boards are very receptive to non-<br />
executive directors with international experience and<br />
there is a younger cadre of board members emerging.<br />
The low percentage of women (8.1%) reflects the fact that<br />
it is extremely hard to find individuals with the requisite<br />
experience.<br />
Despite a 10% increase over the last two years, the average<br />
directors’ remuneration of 48,000 Euros remains one of the<br />
lowest in Europe; this explains why directors sit on several<br />
boards. If remuneration levels were to change perhaps<br />
fewer directors would be tempted to sit on multiple<br />
boards.<br />
Belgium
Spain<br />
Italy<br />
European average<br />
2009<br />
2007<br />
2005<br />
2003<br />
2001<br />
France<br />
8%<br />
Finland<br />
Switzerland<br />
Sweden<br />
FR09<br />
Ratio of non-national directors<br />
to national directors<br />
Executive<br />
directors<br />
Former<br />
executive<br />
directors<br />
4<br />
Netherlands<br />
Independent non-executive<br />
directors<br />
42%<br />
United Kingdom<br />
Reference<br />
shareholders<br />
17%<br />
North America 18%<br />
Latin and South America 3%<br />
United Kingdom 15%<br />
APAC 8%<br />
Germany 11%<br />
Benelux 25%<br />
Italy 9%<br />
Spain and Portugal 5%<br />
Other European countries 7%<br />
Employee representatives<br />
6%<br />
Other non-independent directors<br />
23%<br />
13% 5% 51%<br />
16% 9% 6%<br />
13% 7% 45%<br />
19%<br />
8% 8%<br />
13%<br />
5%<br />
40% 39%<br />
11% 5% 36%<br />
FR09<br />
Identification of<br />
independent directors<br />
2009 2007 2005<br />
90% 95% 90%<br />
Frequency of meetings 98% 95% 100%<br />
Age of directors 98% 90% 93%<br />
Start and end of tenure 95% 93% 95%<br />
Directors’ main executive position 100% 98% 100%<br />
FR09<br />
Board composition by category of director<br />
Transparency of directors’ information<br />
(% of companies providing information)<br />
40%<br />
33%<br />
Corporate Governance <strong>Report</strong><br />
2009<br />
7% 2<br />
7%<br />
2009 2007 2005<br />
Directors’ other board positions 100% 98% 100%<br />
Directors’ company shares held 93% 78% 68%<br />
Remuneration of directors 95% 95% 88%<br />
Remuneration structure 70% n/a n/a<br />
List of committee members 100% 100% 100%<br />
<strong>Report</strong> of activity of<br />
each committee 88% n/a n/a<br />
1<br />
<strong>Heidrick</strong> & <strong>Struggles</strong> 29
Corporate Governance Rating<br />
Germany<br />
Corporate governance discussions in<br />
Germany shifted focus during 2008. In the<br />
past, emphasis has primarily been on the<br />
Cromme Codex, but anti-trust and bribery<br />
discussions have moved issues such as<br />
corporate compliance to centre stage.<br />
The bail out of major state banks with German taxpayer<br />
money and the government’s financial participation in<br />
private banking has sparked debate regarding insufficient<br />
supervision of the public banking sector. This and the<br />
focus on legal compliance have overshadowed other<br />
essential governance issues.<br />
Where does Germany currently stand in relation to those<br />
corporate governance issues? Our study reveals a mixed<br />
picture. The quality of corporate governance is highly<br />
uneven. While a number of companies have achieved<br />
quite respectable ratings, there are those companies<br />
who still ignore corporate governance standards. Overall,<br />
Germany is one of the lowest ranking countries in Europe.<br />
The number of meetings held by German boards is<br />
among the lowest in Europe, although an increase of<br />
approximately one-third has been achieved in absolute<br />
terms, bringing the number of meetings up to six a<br />
year. That ranking stands when comparing Germany to<br />
countries with a similar bicameral system.<br />
In about 50% of cases, a former CEO sits at the head of the<br />
board. This limits the freedom of the board of directors<br />
and is generally considered to be bad governance. In<br />
comparison to the rest of Europe, Germany has the largest<br />
supervisory committees due to statutory provisions. The<br />
disadvantages of large committees are explained in detail<br />
in the Corporate Governance in Europe 2007 report Raising<br />
the Bar.<br />
The number of independent board members has<br />
decreased in the last two years, reaching the worst level<br />
in Europe. Moreover, insufficient use is made of the<br />
30 Boards in turbulent times: Corporate Governance <strong>Report</strong> 2009<br />
Austria<br />
Denmark<br />
Germany<br />
Portugal<br />
opportunities presented by diverse and interdisciplinary<br />
teams. The number of foreign supervisory board members<br />
is stagnating and is now at the lowest level in Europe while<br />
the average age of German supervisory board members is<br />
over 60, making them among the oldest in Europe.<br />
There are also some positive aspects. German companies<br />
have an average of more than 4.5 specialised board<br />
committees (audit, remuneration, nomination, etc.)<br />
– the highest level in Europe. 87% of the German<br />
companies have a strategy committee, which is the<br />
highest among the countries measured in this report.<br />
Germany is also in the lead in terms of setting up ethics,<br />
corporate governance and corporate social responsibility<br />
committees.<br />
It has now become customary to perform a general<br />
evaluation of the work undertaken by German supervisory<br />
boards; this is practiced by 93% of companies. However,<br />
detailed information, including information about the<br />
impartiality of the evaluation, is not disclosed. German<br />
boards score highly for transparency.<br />
New members appointed to boards in Germany are<br />
younger than the European average. This suggests that<br />
the average age of German board members may fall in the<br />
medium term.<br />
The remuneration of board members is high and includes<br />
significant variable components. These factors create<br />
proper conditions for the continual improvement of the<br />
quality of the board’s work and the potential to limit costs<br />
in times of crisis.<br />
While the practice of corporate governance in Germany<br />
still leaves room for improvement, some key aspects raise<br />
hopes that Germany may reach European standards in<br />
the medium term. Against the backdrop of the prevailing<br />
crisis, it may prove useful to revise the Corporate<br />
Governance Code for the financial sector. However, we<br />
are concerned by the current tendency to introduce yet<br />
more governmental regulation instead of the necessary<br />
deregulation.<br />
Belgium
Spain<br />
Italy<br />
European average<br />
2009<br />
2007<br />
2005<br />
2003<br />
2001<br />
France<br />
Former<br />
executive<br />
directors<br />
5%<br />
Finland<br />
Switzerland<br />
Sweden<br />
Independent non-executive<br />
directors<br />
30%<br />
Netherlands<br />
United Kingdom<br />
Reference<br />
shareholders<br />
North America 25%<br />
Latin and South America 2%<br />
United Kingdom 9%<br />
France 18%<br />
Benelux 7%<br />
Northern Europe 5%<br />
Central and Eastern Europe 9%<br />
Other European countries 20%<br />
APAC 5%<br />
Employee representatives<br />
4 48%<br />
Other non-independent<br />
directors<br />
13%<br />
6% 28% 8% 49%<br />
9%<br />
5% 36%<br />
4% 33%<br />
4% 28% 13% 49%<br />
DE09<br />
Identification of<br />
independent directors<br />
9%<br />
8%<br />
2009 2007 2005<br />
0% 7% 0%<br />
Frequency of meetings 100% 97% 100%<br />
Age of directors 30% 27% 27%<br />
Start and end of tenure 20% 47% 40%<br />
Directors’ main executive position 97% 97% 97%<br />
DE09<br />
Board composition by category of director<br />
Transparency of directors’ information<br />
(% of companies providing information)<br />
DE09<br />
Ratio of non-national directors<br />
to national directors<br />
50%<br />
Corporate Governance <strong>Report</strong><br />
2009<br />
50% 4%<br />
6%<br />
2009 2007 2005<br />
Directors’ other board positions 97% 100% 90%<br />
Directors’ company shares held 0% 17% 17%<br />
Remuneration of directors 93% 93% 77%<br />
Remuneration structure 97% n/a n/a<br />
List of committee members 93% 100% 83%<br />
<strong>Report</strong> of activity of<br />
each committee 97% n/a n/a<br />
1<br />
<strong>Heidrick</strong> & <strong>Struggles</strong> 31
Corporate Governance Rating<br />
Italy<br />
Italian companies are rising to the<br />
challenge of a global downturn. Over the<br />
past two years, boards have introduced<br />
small but significant changes which will<br />
enable them to improve performance.<br />
The Preda Code is tightening the rules on who can<br />
become non-executive board members and companies<br />
are looking to recruit more directors with practical<br />
experience in areas such as marketing, sales and finance.<br />
This is of particular relevance to Italy’s many state-owned<br />
companies whose boards currently recruit from a limited<br />
pool of directors who move from one publicly-owned<br />
company to the next.<br />
Most boards in Italy are unitary and the role of the<br />
chairman and chief executive is increasingly being split in<br />
conformance with European best practice. This is now the<br />
case in 87% of Italian companies. Many small and medium<br />
businesses have an advisory board too.<br />
Transparency and communication is another priority as<br />
chairmen now see the importance of informing the stock<br />
market and the financial press about trading conditions,<br />
as well as establishing more direct conversations between<br />
the board and senior management. State-run businesses<br />
are becoming more balanced and accountable and better<br />
able to respond to change.<br />
Italian boards meet more frequently than European<br />
boards with an average of one meeting per month, but<br />
the attendance ratio is low. Italy also has the second<br />
lowest number of committees in Europe (an average of 2.3<br />
per company); this has not improved significantly since<br />
2007 though there has been an increase in the number of<br />
strategy committees.<br />
90% of Italian companies have a remuneration committee<br />
which is no change on 2007; only 15% of companies have<br />
a nomination committee. In more than half of these<br />
cases the nomination and remuneration committee are<br />
combined. In Italy it is current practice for the chairman<br />
32 Boards in turbulent times: Corporate Governance <strong>Report</strong> 2009<br />
Austria<br />
Denmark<br />
Germany<br />
Portugal<br />
to recruit new non-executive directors, but we see this<br />
changing in future to favour the nomination committee.<br />
Board evaluation now takes place in 72% of Italian<br />
companies, which is just below the European average. In<br />
82% of cases, at least one of the individuals leading the<br />
evaluation is an independent non-executive. Transparency<br />
is another matter, with 96% of companies failing to<br />
provide information on how the evaluation took place.<br />
International diversity is still a major issue for Italian<br />
boards with only 11% of non-national directors on Italian<br />
boards and many boards 100% national. The lack of<br />
women on Italian boards is a reflection of Italian corporate<br />
culture and is well below the European average with two<br />
out of three boards comprising no women.<br />
An equally concerning trend is the tendency of Italian<br />
directors and chairmen to hold multiple board positions<br />
simultaneously. Remuneration at an average of 79,000<br />
Euros per director is somewhat lower than the European<br />
norm.<br />
With relatively slow progress in the adoption of best<br />
practice, we see the narrow spread of ratings in Italy<br />
as a matter of concern, with few, or no role models for<br />
Italian companies to aspire to. At the same time, neither<br />
state-owned nor family-owned companies are motivated<br />
to change their governance models with the speed we<br />
observe in some of the highly rated countries.<br />
Preparing for this report we discerned a greater sense of<br />
responsibility among Italian boards, contributing to clearer<br />
governance, with more open communication. This is in the<br />
context of a market characterised by a large number of<br />
small or mid-sized corporations, which are also improving<br />
their standards and governance practices. Board<br />
evaluation is a growing trend, but looking at practices in<br />
other countries, it is clear that the Italian process could<br />
benefit from being conducted more comprehensively,<br />
concentrating less on self-evaluation and utilising external<br />
third parties. This would help bring Italian companies<br />
more in line with practices elsewhere in Europe.<br />
Belgium
Spain<br />
Italy<br />
European average<br />
2009<br />
2007<br />
2005<br />
2003<br />
2001<br />
France<br />
Finland<br />
Executive directors<br />
17%<br />
13%<br />
13%<br />
19%<br />
10%<br />
IT09<br />
Switzerland<br />
Sweden<br />
Former<br />
executive<br />
directors<br />
4<br />
Netherlands<br />
United Kingdom<br />
Independent non-executive directors<br />
45%<br />
North America 14%<br />
United Kingdom 3%<br />
Latin and South America 8%<br />
Germany 19%<br />
France 24%<br />
Spain and Portugal 7%<br />
Central and Eastern Europe 8%<br />
Other European countries 15%<br />
APAC 2%<br />
152% 34%<br />
Reference<br />
shareholders<br />
12%<br />
Other non-independent directors<br />
22%<br />
3 47% 28% 9%<br />
137% 29% 14%<br />
35% 154%<br />
(unclassified)<br />
Identification of<br />
independent directors<br />
2009 2007 2005<br />
100% 100% 93%<br />
Frequency of meetings 100% 98% 88%<br />
Age of directors 33% 38% 13%<br />
Start and end of tenure 100% 43% 43%<br />
Directors’ main executive position 74% 98% 100%<br />
IT09<br />
Board composition by category of director<br />
Transparency of directors’ information<br />
(% of companies providing information)<br />
IT09<br />
Ratio of non-national directors<br />
to national directors<br />
Corporate Governance <strong>Report</strong><br />
2009<br />
2009 2007 2005<br />
Directors’ other board positions 95% 98% 100%<br />
Directors’ company shares held 62% 13% 23%<br />
Remuneration of directors 97% 33% 13%<br />
Remuneration structure 64% n/a n/a<br />
List of committee members 100% 100% 94%<br />
<strong>Report</strong> of activity of<br />
each committee 97% n/a n/a<br />
<strong>Heidrick</strong> & <strong>Struggles</strong> 33
Corporate Governance Rating<br />
Netherlands<br />
Remuneration, transparency and risk<br />
management are all major issues in the<br />
Netherlands as the government seeks<br />
to impose greater accountability on<br />
Dutch companies through the Frijns<br />
Committee, following the Tabaksblat<br />
Code of Corporate Governance. The<br />
recommendation is that boards will need<br />
to report on what steps they are taking to<br />
manage and report risk.<br />
So how prepared are boards for turbulent times? The two-<br />
tier structure of Dutch boards is being reinforced in some<br />
companies by additional advisory directors. Overall, the<br />
high quality of corporate governance in the Netherlands is<br />
an indication that boards will do what is necessary to ride<br />
out the economic turbulence.<br />
In the Netherlands, boards are highly accountable to<br />
shareholders. But excellent standards and strict rules of<br />
corporate governance may not be enough on their own<br />
to see companies through recession. The composition of<br />
the board, its evaluation mechanisms and committees are<br />
untested in these uncertain times.<br />
The frequency of board meetings has increased to 9.3<br />
meetings per year and now meets the European average.<br />
Attendance is slightly above average at 93%. At the<br />
same time, there has been a 13% increase in committee<br />
meetings. Regulation plays a part in this as all Dutch<br />
companies have by law an audit and a remuneration<br />
committee. The practice of combining remuneration and<br />
nomination committees is declining but at 39% is still far<br />
higher than the European average. Strategy committees<br />
are found in 17% of Dutch companies.<br />
34 Boards in turbulent times: Corporate Governance <strong>Report</strong> 2009<br />
Austria<br />
Denmark<br />
Germany<br />
Portugal<br />
Board evaluation has become standard in the Netherlands<br />
and 91% of companies have conducted an evaluation<br />
in the last two years. Transparency is good and 81% of<br />
companies disclose information on who is leading the<br />
evaluation. In most cases this is carried out internally<br />
by the non-executive chairman and it remains rare for<br />
external consultants to become involved. There is little<br />
disclosure about the evaluation process, apart from the<br />
individual evaluation of directors in half of the cases.<br />
By law the roles of the CEO and chairman are split in the<br />
Netherlands, a fact that corresponds with the segregated<br />
two-tier executive and non-executive board structure. But<br />
just 9% of chairmen are the former CEO of the company,<br />
making Dutch non-executive boards more independent<br />
and accountable.<br />
International diversity, however, is excellent and at 54%,<br />
the percentage of non-nationals on Dutch boards is the<br />
highest in Europe. Functional diversity is not so high:<br />
one-third of audit committees do not include an active<br />
or former CFO while 70% of boards have no director<br />
with a sales and marketing profile. In addition to a lack<br />
of financial expertise, Dutch boards are short of directors<br />
with strong IT and risk management skills. Gender<br />
diversity is low; 13% of board members are female and<br />
one-third of AEX boards include no women.<br />
Dutch directors are the oldest in Europe with an average<br />
age of 62.4. It could be argued that Dutch directors are<br />
bringing a lot of valuable experience to the board, or that<br />
Dutch boards are not as open to new ideas as in countries<br />
where the boards are younger. The average remuneration<br />
for a director (67,000 Euros) is one of the lowest in Europe<br />
despite having doubled in ten years and risen significantly<br />
in the last two years. The greater responsibilities of Dutch<br />
board members, and the extra time spent in board<br />
meetings and committees, means non-executive pay will<br />
have to keep pace if Dutch companies are to attract new<br />
talent and maintain the high quality and commitment of<br />
existing directors.<br />
Belgium
Spain<br />
Italy<br />
European average<br />
2009<br />
2007<br />
2005<br />
2003<br />
2001<br />
France<br />
Finland<br />
Switzerland<br />
North<br />
America 21%<br />
Sweden<br />
Latin and<br />
South America 1%<br />
NL09<br />
Ratio of non-national directors<br />
to national directors<br />
Executive<br />
directors<br />
5%<br />
5%<br />
10%<br />
10%<br />
5%<br />
4<br />
Former<br />
executive<br />
directors<br />
NL09<br />
Netherlands<br />
Independent non-executive<br />
directors<br />
79%<br />
United<br />
Kingdom 20%<br />
United Kingdom<br />
Germany 11%<br />
France 16%<br />
Benelux 13%<br />
Central and<br />
Eastern Europe 5%<br />
Other European<br />
countries 5%<br />
APAC 6%<br />
Middle East<br />
and Africa 1% Employee<br />
Reference<br />
shareholders<br />
2<br />
2009<br />
representatives<br />
Other nonindependent<br />
directors<br />
8% 85% 11<br />
7% 75% 7% 1<br />
9% 76% 4% 1<br />
5% 82% 5% 2 1<br />
Identification of<br />
independent directors<br />
2009 2007 2005<br />
100% 91% 100%<br />
Frequency of meetings 91% 100% 88%<br />
Age of directors 100% 100% 100%<br />
Start and end of tenure 87% 83% 76%<br />
Directors’ main executive position 100% 100% 96%<br />
NL09<br />
Board composition by category of director<br />
Transparency of directors’ information<br />
(% of companies providing information)<br />
8%<br />
2009 2007 2005<br />
Directors’ other board positions 100% 100% 96%<br />
Directors’ company shares held 87% 78% 88%<br />
Corporate Governance <strong>Report</strong><br />
Remuneration of directors 100% 100% 100%<br />
Remuneration structure 87% n/a n/a<br />
List of committee members 96% 96% 100%<br />
<strong>Report</strong> of activity of<br />
each committee 87% n/a n/a<br />
<strong>Heidrick</strong> & <strong>Struggles</strong> 35
Corporate Governance Rating<br />
Portugal<br />
Major improvements in corporate<br />
governance are on the way for<br />
Portuguese companies which are<br />
beginning to feel the effect of recession.<br />
This is in no small part the result of a new Portuguese code<br />
of corporate governance in 2007, aimed at spreading best<br />
practice among state-owned and public companies.<br />
Recent history reveals that Portuguese companies have<br />
not been well governed and have a long way to go if they<br />
are to catch up with their European counterparts. There<br />
is a 45 point gap between the best and worst performing<br />
boards indicating that the adherence of Portuguese<br />
companies to good governance is heterogeneous. The<br />
PSI20 top companies in Portugal range widely from<br />
international companies complying to European standards<br />
of corporate governance to smaller companies with<br />
rudimentary board accountability.<br />
The roles of chairman and chief executive are split in 70%<br />
of Portuguese companies, but 25% of Portugal’s chairmen<br />
are former CEOs while 30% are current CEOs. Contrary<br />
to best corporate governance practice, the Portuguese<br />
tradition of appointing the former CEO as the incoming<br />
chairman, to ensure continuity of leadership and direction,<br />
is particularly inappropriate in view of the dramatically<br />
altered economic environment ahead. Adding to the<br />
problem, Portuguese chairmen, and directors, also tend<br />
to hold more board positions simultaneously than their<br />
European counterparts; this can be seen as compromising<br />
their availability and ultimately their efficient and effective<br />
contribution to the management of the board.<br />
Portuguese boards are preparing for turbulent times by<br />
balancing their composition. A unitary board made up<br />
of two-thirds non-executive members can appoint half<br />
as independent and half as shareholder representatives.<br />
The interaction between the two kinds of non-executive<br />
director has been highly beneficial in difficult times;<br />
36 Boards in turbulent times: Corporate Governance <strong>Report</strong> 2009<br />
Austria<br />
Denmark<br />
Germany<br />
Portugal<br />
feeding concerns about the company’s performance and<br />
direction directly to the board.<br />
Audit and remuneration committees are now mandatory<br />
under corporate governance rules and so will be found<br />
in every company. The recent appearance of nomination<br />
committees is not associated with the existence of the<br />
remuneration committees; members of this committee are<br />
directly chosen at the general assembly of shareholders,<br />
independent of any board influence. This development<br />
is linked to the creation of committees responsible for<br />
evaluating the performance of boards. The latter are a<br />
new feature among Portuguese boards (with the highest<br />
number of separate governance committees in Europe).<br />
Alongside the expected growth in the currently low<br />
(2.8) number of committees per company, Portuguese<br />
boards will need to improve the composition of these<br />
committees. As mentioned there is a relative shortage of<br />
independent committee members and a low number of<br />
independent committee chairmen.<br />
Only 20% of Portuguese companies in our sample have<br />
carried out an evaluation of their boards over the past two<br />
years and these tend to be self-evaluations. As the benefits<br />
of evaluation are better understood and as the process<br />
becomes embedded, Portuguese companies are likely to<br />
consider independent evaluation.<br />
Portuguese boards have a stable 21% of non-national<br />
directors, which is around the European average. But<br />
boards retain a Continental European bias with 82% of<br />
directors drawn from Western Europe, principally France<br />
(19%) and Spain (28%). Portugal continues to have the<br />
lowest gender diversity in Europe with only 3% of women<br />
on the board; functional diversity also remains low, with<br />
few CFO profiles on the audit committee.<br />
Finally, at 68,000 Euros, directors’ remuneration is 82% of<br />
the European average and has no variable component in<br />
80% of companies. In Portugal remuneration committees<br />
are elected by shareholders.<br />
Belgium
Spain<br />
Italy<br />
European average<br />
2009<br />
2007<br />
2005<br />
2003<br />
2001<br />
France<br />
Finland<br />
Switzerland<br />
Sweden<br />
PT09<br />
Ratio of non-national directors<br />
to national directors<br />
Executive directors<br />
40%<br />
45%<br />
45%<br />
58%<br />
57%<br />
PT09<br />
Identification of<br />
independent directors<br />
Netherlands<br />
United Kingdom<br />
Former<br />
executive<br />
directors<br />
2009 2007 2005<br />
80% 100% 90%<br />
Frequency of meetings 100% 90% 90%<br />
Age of directors 55% 70% 40%<br />
Start and end of tenure 100% 100% 90%<br />
Directors’ main executive position 100% 100% 100%<br />
PT09<br />
Board composition by category of director<br />
Transparency of directors’ information<br />
(% of companies providing information)<br />
North America 4%<br />
Latin and South America 8%<br />
United Kingdom 6%<br />
Germany 8%<br />
France 19%<br />
Spain 28%<br />
Italy 9%<br />
Other European countries 13%<br />
Middle East and Africa 6%<br />
Independent<br />
non-executive directors Reference shareholders<br />
3 22% 26% 2 9% 8%<br />
135% 12% 7%<br />
Other nonindependent<br />
directors<br />
128% 24% 2<br />
126% 15%<br />
18% 13% 120% (unclassified)<br />
Corporate Governance <strong>Report</strong><br />
2009<br />
2009 2007 2005<br />
Directors’ other board positions 100% 100% 100%<br />
Directors’ company shares held 100% 90% 70%<br />
Remuneration of directors 0% 0% 0%<br />
Remuneration structure 0% n/a n/a<br />
List of committee members 95% 90% 90%<br />
<strong>Report</strong> of activity of<br />
each committee 70% n/a n/a<br />
<strong>Heidrick</strong> & <strong>Struggles</strong> 37
Corporate Governance Rating<br />
Spain<br />
Separating the role of the CEO and the<br />
chairman is one of the major issues facing<br />
Spanish boards. 60% of Spain’s companies<br />
combine both positions and nearly one<br />
in four non-executive chairmen are the<br />
former CEO.<br />
Institutional Investment Funds and small investors would<br />
appreciate a clear separation between the two positions to<br />
ensure appropriate supervision of the management team.<br />
The concentration of company ownership – in either<br />
family or dominant shareholder hands – is particularly<br />
evident in Spain’s IBEX35 companies and is a markedly<br />
different model from the businesses listed on other<br />
European bourses. This situation can be interpreted as<br />
compromising board independence and accountability;<br />
damaging the image of large Spanish companies despite<br />
their proven effort to commit to transparency and good<br />
governance.<br />
Spanish chairmen and non-executive directors hold<br />
many more board positions than elsewhere in Europe.<br />
However, Spanish companies perform better in terms of<br />
transparency. The divergence between the highest and<br />
lowest performing companies indicates that best practice<br />
is not as widespread as it could be. Spain is home to both<br />
some of the highest and the lowest rated companies in<br />
Europe.<br />
The frequency of board meetings is on a rising curve – up<br />
to 11.4 meetings per year from 10.9 in 2007, placing Spain<br />
above the European average, added to which attendance<br />
has risen sharply to 93%, which some say justifies the<br />
higher remuneration level.<br />
The average number of board committees in Spain is<br />
up 10%, but at 2.3 per company this is lower than the<br />
European average. The majority of companies (97%)<br />
have a remuneration committee but all are combined<br />
with the nomination committee. Following government<br />
38 Boards in turbulent times: Corporate Governance <strong>Report</strong> 2009<br />
Austria<br />
Denmark<br />
Germany<br />
Portugal<br />
guidelines, audit committees are now found in all Spanish<br />
companies (up from 22% in 1999), a positive model which<br />
reinforces financial accountability.<br />
Board evaluation is now widespread though not<br />
standardised. 71% of Spanish companies carried out an<br />
evaluation in the last two years, but in only 20% of cases<br />
was this carried out by an independent board member.<br />
This is one of the lowest proportions in Europe. In Spain,<br />
24% of board evaluations considered directors’ individual<br />
performance, while only 12% of companies publish the<br />
results of board evaluation, considerably lower than the<br />
European average of 32%.<br />
Spanish boards are dominated by long-serving directors<br />
combining the longest office tenure (4.7 years) and a high<br />
average time on the board (6.1 years). The age profile is<br />
something that can only be lowered by moving outside<br />
the traditional recruiting networks.<br />
In terms of internationalisation Spain still has a low<br />
percentage of non-nationals on its boards (10%) with the<br />
majority of foreign directors coming from France, Italy and<br />
Portugal. Still 37% of Spanish boardrooms comprise no<br />
foreign directors (compared with 46% in the 2007 report).<br />
Gender diversity is an even bigger issue; women make up<br />
just 6% of board members. At an average of 108,000 Euros,<br />
directors’ remuneration is one of the highest in Europe and<br />
fixed fees account for 79% of the total.<br />
Some of the largest IBEX35 companies offer a role model<br />
for Spanish companies as they continue to upgrade their<br />
corporate governance practices. However, disappointingly<br />
some companies have not made any real progress<br />
over the last two years. The two biggest challenges for<br />
Spain are linked to the independent supervision of the<br />
management by the board. Firstly, the separation between<br />
the roles of chief executive and chairman remains an issue<br />
– often exacerbated by the fact that the first executive and<br />
chairman are often also linked to the major shareholders<br />
of the firm. The second is the need to rejuvenate boards,<br />
by adding directors with the right experience and<br />
international exposure to navigate through this difficult<br />
economic environment.<br />
Belgium
Spain<br />
Italy<br />
European average<br />
2009<br />
2007<br />
2005<br />
2003<br />
2001<br />
France<br />
Executive<br />
directors<br />
18%<br />
18%<br />
18%<br />
19%<br />
17%<br />
Finland<br />
ES09<br />
Switzerland<br />
Sweden<br />
Netherlands<br />
United Kingdom<br />
North America 6%<br />
Latin and South America 6%<br />
United Kingdom 10%<br />
France 20%<br />
Italy 27%<br />
Portugal 8%<br />
Central and Eastern Europe 8%<br />
Other European countries 8%<br />
APAC 8%<br />
Middle East and Africa 2%<br />
Independent non-executive<br />
directors Reference shareholders<br />
30%<br />
Former executive directors<br />
43%<br />
Corporate Governance <strong>Report</strong><br />
2009<br />
Other nonindependent<br />
directors<br />
9%<br />
40% 41% 1<br />
2 39% 40% 1<br />
4% 46% 25% 6%<br />
3 35% 39% 6%<br />
Identification of<br />
independent directors<br />
2009 2007 2005<br />
100% 100% 100%<br />
Frequency of meetings 100% 100% 86%<br />
Age of directors 37% 43% 54%<br />
Start and end of tenure 94% 100% 89%<br />
Directors’ main executive position 100% 100% 100%<br />
ES09<br />
Board composition by category of director<br />
Transparency of directors’ information<br />
(% of companies providing information)<br />
ES09<br />
Ratio of non-national directors<br />
to national directors<br />
Employee representatives<br />
2009 2007 2005<br />
Directors’ other board positions 100% 100% 100%<br />
Directors’ company shares held 97% 100% 100%<br />
Remuneration of directors 71% 60% 37%<br />
Remuneration structure 100% n/a n/a<br />
List of committee members 100% 97% 100%<br />
<strong>Report</strong> of activity of<br />
each committee 49% n/a n/a<br />
<strong>Heidrick</strong> & <strong>Struggles</strong> 39
Corporate Governance Rating<br />
Sweden<br />
Sweden, along with other Nordic<br />
countries, went through a minor recession<br />
in the early 1990s which led the country to<br />
temporarily nationalise its leading banks.<br />
The economy recovered and government<br />
loans were repaid; as a result, Swedish<br />
banks and companies are better prepared<br />
for these turbulent times.<br />
Today, the major corporate governance concern is<br />
the conflict between compliance with the regulatory<br />
requirements of Sarbanes Oxley and the need to focus on<br />
sustainable growth.<br />
The evidence that Swedish companies are starting to plan<br />
for the long-term, is the increased frequency of board<br />
and committee meetings, respectively up 16% and 10%<br />
on 2007. There are still few strategy, ethics or governance<br />
committees despite a 15% to 22% presence across Europe.<br />
But boards are rising to the challenge of this economic<br />
crisis in other ways – namely through closer scrutiny of<br />
the contribution and role of individual directors. Audit<br />
committees now meet more often than in the past and at<br />
5.6 meetings a year reach the European average although<br />
half of these committees do not comprise a member<br />
with CFO experience. The frequency of remuneration and<br />
nomination committee meetings is in line with European<br />
levels. Swedish boards have on average 3.2 committees<br />
and the increase in the number of board meetings is partly<br />
explained by the need for boards to fully consider the<br />
work of their committees, as well as an appreciation of the<br />
greater responsibility of non-executive directors in helping<br />
their companies steer a course through turbulent times.<br />
Sweden is noted for its exceptional transparency about<br />
corporate governance in general, and about board<br />
evaluation in particular. 96% of companies have carried<br />
out a board evaluation in the past two years. 63% of<br />
evaluation processes included an interview with every<br />
40 Boards in turbulent times: Corporate Governance <strong>Report</strong> 2009<br />
Austria<br />
Denmark<br />
Germany<br />
Portugal<br />
board member. However, three quarters of non-executive<br />
chairmen are not independent and only one third of<br />
evaluations are led by an independent board member.<br />
The chairman’s role is a key one and as the old guard<br />
of chairmen who were former CEOs retire, a younger<br />
generation are emerging, more inclined to favour<br />
independent external evaluation.<br />
At 6.7 years, the directors’ time on the board is high in<br />
Sweden despite the shortest length of tenure – appointed<br />
for one year only.<br />
Swedish boards have 21% of non-nationals but the largest<br />
percentage of this come from Nordic countries (41%).<br />
Partly this is a function of older directors’ preference for<br />
holding meetings in their native language. Swedish boards<br />
contain 22% of women, who, tending to be younger, also<br />
help to bring down the average age.<br />
Directors’ remuneration has an impact on the<br />
internationalisation of boards. At an average of 54,000<br />
Euros the salary offers little inducement for foreign<br />
nationals thinking of joining boards in Sweden. The fee<br />
does not reflect either the additional responsibilities or<br />
greater number and frequency of board and committee<br />
meetings. Remuneration committees are finding that the<br />
solution to attracting new blood onto the board is to offer<br />
a combination of fixed fee and long–term share incentives.<br />
Companies are struggling against the public perception in<br />
the Nordic countries that directors’ remuneration is over-<br />
generous. They are having to make the case that when<br />
times are tough, professionalism and improved business<br />
performance need to be rewarded and that Sweden needs<br />
to do more to attract high calibre international board<br />
members.<br />
Succession planning has received a notable increase in<br />
attention among Swedish boards and is now increasingly<br />
viewed as an important strategic issue both in the short<br />
and long term. Corporate social responsibility receives<br />
more attention as global warming and sustainability<br />
become high priority issues in the eyes of owners,<br />
customers and the general public, despite the prevailing<br />
economic uncertainty.<br />
Belgium
Spain<br />
Italy<br />
European average<br />
2009<br />
2007<br />
2005<br />
2003<br />
2001<br />
France<br />
Finland<br />
Switzerland<br />
Sweden<br />
SE09<br />
Ratio of non-national directors<br />
to national directors<br />
Executive<br />
directors<br />
Former<br />
executive<br />
directors<br />
Netherlands<br />
Independent non-executive directors<br />
United Kingdom<br />
Reference<br />
shareholders<br />
North America 21%<br />
United Kingdom 16%<br />
Germany 5%<br />
Benelux 4%<br />
Northern Europe 41%<br />
APAC 4%<br />
France 4%<br />
Central and Eastern Europe 5%<br />
8% 4 45% 16% 19%<br />
8%<br />
8%<br />
10%<br />
11%<br />
SE09<br />
Employee<br />
representatives<br />
Other nonindependent<br />
directors<br />
5% 42% 21% 20% 4%<br />
6% 45% 20% 21%<br />
3 43% 17% 26% 1<br />
41% 28% 20%<br />
Identification of<br />
independent directors<br />
2009 2007 2005<br />
100% 81% 83%<br />
Frequency of meetings 100% 100% 96%<br />
Age of directors 100% 100% 100%<br />
Start and end of tenure 100% 100% 100%<br />
Directors’ main executive position 100% 100% 100%<br />
SE09<br />
Board composition by category of director<br />
Transparency of directors’ information<br />
(% of companies providing information)<br />
Corporate Governance <strong>Report</strong><br />
2009<br />
7%<br />
2009 2007 2005<br />
Directors’ other board positions 100% 100% 100%<br />
Directors’ company shares held 100% 100% 100%<br />
Remuneration of directors 100% 100% 92%<br />
Remuneration structure 100% n/a n/a<br />
List of committee members 100% 100% 100%<br />
<strong>Report</strong> of activity of<br />
each committee 100% n/a n/a<br />
<strong>Heidrick</strong> & <strong>Struggles</strong> 41
Corporate Governance Rating<br />
Switzerland<br />
A daunting task rests on the shoulders<br />
of the non-executive directors of<br />
Switzerland’s top companies who<br />
– according to the country’s corporate<br />
governance codes – are ultimately<br />
responsible for adjusting strategy through<br />
turbulent times.<br />
Traditionally drawn from a narrow elite, Swiss directors are<br />
seen as role models with considerable personal prestige<br />
at risk. The fear is that, with a culture of blame fuelled<br />
by shareholder activists, analysts and an acerbic press,<br />
business leaders may be less concerned with ’steering the<br />
boat’ and taking bold steps, than with protecting their<br />
own reputation. This applies particularly to chairmen who<br />
accumulate board memberships and therefore face issues<br />
of availability and ultimately efficiency.<br />
On a more positive note, two years ago 80% of Swiss<br />
companies were still governed by unitary boards yet there<br />
has been a major shift and 55% of all boards are now two-<br />
tier. Since our 2007 report Swiss companies have also seen<br />
a large increase in the number of committee meetings to<br />
19 per year, higher than the European average. Although<br />
full boards still meet infrequently (8.2 meetings per year)<br />
the greater reliance on committee work is a sign that<br />
companies are responding to the complex challenges of<br />
today’s world.<br />
We note with satisfaction that all companies now have<br />
an audit committee. The appearance of corporate social<br />
responsibility committees is a reaction to the increased<br />
responsibilities of operating in a global marketplace.<br />
The percentage of companies undertaking a board<br />
evaluation has increased from 30% to 65% in the<br />
space of two years. Yet evaluating board performance<br />
needs to be more prevalent, more transparent (with<br />
current disclosure levels under 50%) and executed with<br />
independent leadership (currently only one in three<br />
42 Boards in turbulent times: Corporate Governance <strong>Report</strong> 2009<br />
Austria<br />
Denmark<br />
Germany<br />
Portugal<br />
evaluations are overseen by an independent non-<br />
executive). 38% of companies evaluate board performance<br />
by questionnaire and only 46% conduct an individual<br />
evaluation of directors. To restore investor confidence<br />
in board effectiveness these numbers need to increase<br />
substantially.<br />
Independence is still an issue for committees and only 71%<br />
of audit, remuneration and nomination committees are<br />
chaired by independent directors. Of more significance in<br />
a downturn is the fact that only 45% of Swiss companies<br />
have an active or former CFO on the audit committee.<br />
On the positive side the high number of board members<br />
in their late 50s and early 60s makes for homogeneity<br />
and there is usually a shared culture of working together.<br />
In terms of geographical diversity Swiss boards compare<br />
well to the rest of Europe. The share of non-nationals on<br />
Swiss boards is the second highest after the Netherlands.<br />
However, at 1%, there are still too few participants from<br />
APAC. One in three boards includes no female directors, a<br />
figure that is up only slightly from 50% two years ago.<br />
Switzerland continues to lead Europe in terms of directors’<br />
remuneration which has increased by another 39% on<br />
2007 levels. There is however pressure to move away<br />
from a culture of high remuneration towards one of<br />
renewed accountability. Indeed directors must be ready<br />
to live up to their responsibilities in every situation.<br />
Controversial strategic decisions which – if they ultimately<br />
fail – could endanger the director’s board seat, should<br />
not be discarded too lightly. There is no space for self-<br />
preservation amongst board members.<br />
Overall, governance performance will move from<br />
emphasising normative elements to issues of quality,<br />
diversity and the composition of the directorship. This<br />
will challenge another peculiarity of Swiss boards where<br />
directors’ time on the board is very long at 6.2 years on<br />
average. With clear signs of corporate underperformance,<br />
will shareholders have a say in what remains one of the<br />
lowest director turnover rates in Europe?<br />
Belgium
Spain<br />
Italy<br />
European average<br />
2009<br />
2007<br />
2005<br />
2003<br />
France<br />
Finland<br />
Switzerland<br />
Sweden<br />
North<br />
America 29%<br />
CH09<br />
Ratio of non-national directors<br />
to national directors<br />
Netherlands<br />
Former<br />
executive<br />
directors<br />
Executive<br />
directors Independent non-executive directors<br />
United Kingdom<br />
Latin and<br />
South America 1%<br />
United Kingdom 16%<br />
Germany 22%<br />
France 9%<br />
Reference<br />
shareholders<br />
Benelux 5%<br />
Italy 2%<br />
Central and<br />
Eastern Europe 5%<br />
Northern Europe 5%<br />
APAC 1%<br />
Middle East<br />
and Africa 3%<br />
Employee<br />
representatives<br />
Other nonindependent<br />
directors<br />
6% 7% 63%<br />
6% 117%<br />
9%<br />
10%<br />
9%<br />
CH09<br />
2009<br />
7% 75% 4% 14%<br />
16% 62% 9% 12<br />
12% 66% 5% 17%<br />
Board composition by category of director<br />
Identification of<br />
independent directors<br />
2009 2007 2005<br />
85% 85% 90%<br />
Frequency of meetings 100% 100% 100%<br />
Age of directors 95% 95% 90%<br />
Start and end of tenure 100% 100% 100%<br />
Directors’ main executive position 100% 100% 100%<br />
Transparency of directors’ information<br />
CH09 (% of companies providing information)<br />
2009 2007 2005<br />
Corporate Governance <strong>Report</strong><br />
Directors’ other board positions 100% 100% 100%<br />
Directors’ company shares held 80% 20% 20%<br />
Remuneration of directors 95% 95% 85%<br />
Remuneration structure 55% n/a n/a<br />
List of committee members 100% 100% 100%<br />
<strong>Report</strong> of activity of<br />
each committee 0% n/a n/a<br />
<strong>Heidrick</strong> & <strong>Struggles</strong> 43
Corporate Governance Rating<br />
Austria<br />
Denmark<br />
United Kingdom<br />
For a country that is consistently in<br />
the top three in Europe for corporate<br />
governance, UK boards are facing a severe<br />
test of nerve. The departing chairmen of<br />
some of the UK’s leading banks<br />
have rightly taken full responsibility<br />
for corporate failure and a collapse in<br />
share price.<br />
At no time have boards been so acutely sensitive to public<br />
perception of the company and its ranking in terms of<br />
how it is governed and non-executive board directors<br />
are increasingly exposed to public scrutiny, alongside the<br />
chairman and CEO.<br />
In the distant past being a non-executive director was<br />
seen as a post suitable for people approaching the end<br />
of their careers – even a sinecure. Not any more. The<br />
demands of corporate governance compliance and<br />
the impact of the credit crunch make the role of the<br />
non-executive as challenging as any full-time executive<br />
position. This is why UK directors and chairmen hold<br />
less positions simultaneously than their European<br />
counterparts.<br />
The growth of committees has been a consistent factor<br />
in the UK since the Cadbury <strong>Report</strong> of the early 1990s.<br />
The average of 3.8 committees per company is among<br />
the highest in Europe. All companies have at least<br />
three committees covering audit, remuneration and<br />
nomination. One-third of all ethics, corporate governance<br />
and corporate social responsibility committees are found<br />
in the UK. Independent of executive control, the audit<br />
committee is one of a number of vital checks and balances.<br />
Remuneration committees are now more pressured but<br />
also more cautious and are replacing directors’ bonuses<br />
with long-term stock based incentives, a policy which<br />
– apart from being good practice – reflects the Labour<br />
Government’s intention to increase tax on higher earners.<br />
44 Boards in turbulent times: Corporate Governance <strong>Report</strong> 2009<br />
Germany<br />
Portugal<br />
Over the last two years, 98% of UK companies reported<br />
that they had completed a board evaluation – up from<br />
88% in 2007. Companies are more transparent, too, and<br />
most provide details of the leadership of the board review<br />
process. 55% of evaluations are a combination of interview<br />
and questionnaire.<br />
Board evaluation by an external consultant should<br />
probe the role of board directors and the dynamic of<br />
board interaction, while being a platform for open and<br />
confidential conversations. The evaluation increasingly<br />
includes asking directors how many key executives they<br />
have met outside the boardroom, with coaching and<br />
mentoring of executives being an increasing expectation.<br />
Roles work best when clearly defined and in all UK<br />
companies the role of the CEO and chairman is split.<br />
The composition of boards and in particular diversity – in<br />
its broadest definition – will be a big issue in the future.<br />
With an average of 8.5 directors, the UK remains among<br />
those countries with small non-executive boards. There<br />
is an encouraging increase of the proportion of non-<br />
national directors from 37% to 41%. On average UK boards<br />
comprise 15% women, although this proportion has not<br />
grown over the last four years.<br />
To steer their companies through turbulent times, UK<br />
board directors need innovators and leaders with vision,<br />
as well as seasoned professionals; the average age of<br />
boards continues to rise to nearly 60 years. Over the past<br />
two years the average remuneration of directors rose to<br />
£80,000 from £71,000 in 2007 (comparisons in Euros are<br />
not used because of changing exchange rates).<br />
British boards continue to set a global standard for good<br />
practice in corporate governance, with the fabled British<br />
pragmatism driving the trend for increasing value-add<br />
outside, as well as inside the boardroom. The ‘Sarbanes-<br />
Oxley model of box-ticking’ is not regarded as a guarantee<br />
of good corporate governance. UK boards’ preparedness to<br />
submit themselves to public scrutiny is a healthy indicator<br />
of their corresponding readiness to adapt themselves and<br />
their behaviour to ensure flexibility in turbulent times.<br />
Belgium
Spain<br />
Italy<br />
European average<br />
2009<br />
2007<br />
2005<br />
2003<br />
2001<br />
France<br />
Finland<br />
Switzerland<br />
Sweden<br />
GB09<br />
Ratio of non-national directors<br />
to national directors<br />
Former<br />
executive<br />
directors<br />
Independent non-executive directors<br />
Netherlands<br />
United Kingdom<br />
North<br />
America 34%<br />
Latin and<br />
South America 3%<br />
Germany 6%<br />
France 5%<br />
Benelux 7%<br />
Central and<br />
Eastern Europe 2%<br />
Northern Europe 4%<br />
Other European<br />
countries 10%<br />
APAC 16%<br />
Middle East<br />
and Africa 12%<br />
Reference<br />
shareholders<br />
Other nonindependent<br />
directors<br />
286% 111%<br />
2<br />
2 95% 2 1<br />
4%<br />
91% 7%<br />
12 91% 3 3<br />
91% 3 2<br />
Executive directors<br />
GB09<br />
Identification of<br />
independent directors<br />
2009 2007 2005<br />
100% 100% 100%<br />
Frequency of meetings 98% 98% 96%<br />
Age of directors 100% 100% 98%<br />
Start and end of tenure 92% 100% 94%<br />
Directors’ main executive position 100% 100% 98%<br />
GB09<br />
Board composition by category of director<br />
Transparency of directors’ information<br />
(% of companies providing information)<br />
Corporate Governance <strong>Report</strong><br />
2009<br />
2009 2007 2005<br />
Directors’ other board positions 100% 100% 98%<br />
Directors’ company shares held 100% 94% 100%<br />
Remuneration of directors 100% 100% 100%<br />
Remuneration structure 78% n/a n/a<br />
List of committee members 98% 100% 100%<br />
<strong>Report</strong> of activity of<br />
each committee 100% n/a n/a<br />
<strong>Heidrick</strong> & <strong>Struggles</strong> 45
Company index<br />
A.P. Møller-Mærsk (Denmark)<br />
ABB (Switzerland)<br />
Abertis (Spain)<br />
Acciona (Spain)<br />
Accor (France)<br />
Acerinox (Spain)<br />
Ackermans & van Haaren<br />
(Belgium)<br />
ACS (Spain)<br />
Adecco (Switzerland)<br />
Adidas (Germany)<br />
AEGON (Netherlands)<br />
AEM (Italy)<br />
Agfa-Gevaert (Belgium)<br />
Aguas de Barcelona (Spain)<br />
Ahold (Netherlands)<br />
Air France KLM (France)<br />
Akzo Nobel (Netherlands)<br />
Alcatel Lucent (France)<br />
Alfa Laval (Sweden)<br />
Alitalia (Italy)<br />
Alleanza (Italy)<br />
Allianz (Germany)<br />
Alstom (France)<br />
Altri (Portugal)<br />
Amer Sports (Finland)<br />
Andritz (Austria)<br />
Anglo American (UK)<br />
Antena 3 TV (Spain)<br />
Antofagasta (UK)<br />
Arcelor Mittal (France-<br />
Netherlands)<br />
ASML Holding (Netherlands)<br />
ASSA ABLOY (Sweden)<br />
Associated British Foods (UK)<br />
AstraZeneca (UK)<br />
Atlantia (Italy)<br />
Atlas Copco (Sweden)<br />
Autogrill (Italy)<br />
Aviva (UK)<br />
Axa (France)<br />
BAE Systems (UK)<br />
Bâloise (Switzerland)<br />
Banca Monte Paschi Siena (Italy)<br />
Banca Popolare di Milano (Italy)<br />
Banco Popolare (Italy)<br />
Banco Popular (Spain)<br />
Banco Sabadell (Spain)<br />
Banco Santander (Spain)<br />
Banesto (Spain)<br />
Bankinter (Spain)<br />
Barclays (UK)<br />
BASF (Germany)<br />
Bayer (Germany)<br />
BBVA (Spain)<br />
BCP (Portugal)<br />
Bekaert (Belgium)<br />
Belgacom (Belgium)<br />
BES (Portugal)<br />
BG Group (UK)<br />
BHP Billiton (UK)<br />
BME (Spain)<br />
BMW (Germany)<br />
BNP Paribas (France)<br />
Boehler Uddeholm (Austria)<br />
Boliden (Sweden)<br />
Bouygues (France)<br />
BP (UK)<br />
BPI (Portugal)<br />
Brisa (Portugal)<br />
British American Tobacco (UK)<br />
British Energy (UK)<br />
British Sky Broadcasting (UK)<br />
BT (UK)<br />
Bulgari (Italy)<br />
Buzzi Unicem (Italy)<br />
Bwin (Austria)<br />
Cadbury (UK)<br />
Cap Gemini (France)<br />
Cargotec (Finland)<br />
Carlsberg (Denmark)<br />
Carrefour (France)<br />
Centrica (UK)<br />
Cimpor (Portugal)<br />
Cintra (Spain)<br />
Clariant (Switzerland)<br />
CNP (Belgium)<br />
Cofinimmo (Belgium)<br />
Colruyt (Belgium)<br />
Commerzbank (Germany)<br />
Compass (UK)<br />
Continental (Germany)<br />
Corporate Express (Netherlands)<br />
Credit Agricole (France)<br />
46 Boards in turbulent times: Corporate Governance <strong>Report</strong> 2009<br />
Credit Suisse (Switzerland)<br />
Criteria Caixacorp (Spain)<br />
Daimler (Germany)<br />
Dampskibsselskabet NORDEN<br />
(Denmark)<br />
Danisco (Denmark)<br />
Danone (France)<br />
Danske Bank (Denmark)<br />
Delhaize (Belgium)<br />
Deutsche Bank (Germany)<br />
Deutsche Börse (Germany)<br />
Deutsche Lufthansa (Germany)<br />
Deutsche Post (Germany)<br />
Deutsche Postbank (Germany)<br />
Deutsche Telekom (Germany)<br />
Dexia (Belgium-France)<br />
Diageo (UK)<br />
DSM (Netherlands)<br />
DSV (Denmark)<br />
E.ON (Germany)<br />
EADS (France)<br />
EDP (Portugal)<br />
Electricité de France (France)<br />
Electrolux (Sweden)<br />
Elekta (Sweden)<br />
Elisa (Finland)<br />
Enagas (Spain)<br />
Endesa (Spain)<br />
ENEL (Italy)<br />
ENI (Italy)<br />
ENRC (UK)<br />
Ericsson (Sweden)<br />
Erste Bank (Austria)<br />
Essilor (France)<br />
F. Hoffmann-La Roche<br />
(Switzerland)<br />
Fastweb (Italy)<br />
FCC (Spain)<br />
Ferrovial (Spain)<br />
Fiat (Italy)<br />
Finmeccanica (Italy)<br />
Finnair (Finland)<br />
Fiskars (Finland)<br />
FLSmidth (Denmark)<br />
Flughafen Wien (Austria)<br />
Fondiaria Sai (Italy)<br />
Fortis (Belgium-Netherlands)<br />
the country / countries in which each company<br />
was analysed are listed after each entry<br />
Fortum (Finland)<br />
France Telecom (France)<br />
Fresenius Medical Care<br />
(Germany)<br />
GALP (Portugal)<br />
Gamesa (Spain)<br />
Gas Natural (Spain)<br />
Gaz de France (France)<br />
GBL (Belgium)<br />
Generali (Italy)<br />
Genmab (Denmark)<br />
GlaxoSmithKline (UK)<br />
GN Store Nord (Denmark)<br />
Gruppo Editoriale L’Espresso<br />
(Italy)<br />
Hagemeyer (Netherlands)<br />
HBOS (UK)<br />
Heineken (Netherlands)<br />
Henkel (Germany)<br />
Hennes & Mauritz (Sweden)<br />
Holcim (Switzerland)<br />
HSBC (UK)<br />
Hypo Real Estate (Germany)<br />
Iberdrola (Spain)<br />
Iberia (Spain)<br />
Imperial Tobacco (UK)<br />
Impregilo (Italy)<br />
InBev (Belgium)<br />
Inditex (Spain)<br />
Indra (Spain)<br />
Industrivärden (Sweden)<br />
Infineon Technologies<br />
(Germany)<br />
ING (Netherlands)<br />
Inmobiliaria Colonial (Spain)<br />
Intercell (Austria)<br />
International Power (UK)<br />
Intesa Sanpaolo (Italy)<br />
Investor (Sweden)<br />
Italcementi (Italy)<br />
J Sainsbury (UK)<br />
Jerónimo Martins (Portugal)<br />
Julius Bär (Switzerland)<br />
Kazakhmys (UK)<br />
KBC (Belgium)<br />
Kemira (Finland)<br />
Kesko (Finland)
KONE (Finland)<br />
Konecranes (Finland)<br />
KPN (Netherlands)<br />
Lafarge (France)<br />
Lagardère (France)<br />
L’Air Liquide (France)<br />
Land Securities (UK)<br />
Legal & General (UK)<br />
Linde (Germany)<br />
Lloyds TSB (UK)<br />
L’Oréal (France)<br />
Lottomatica (Italy)<br />
Lundbeck (Denmark)<br />
Luxottica (Italy)<br />
LVMH (France)<br />
MAN (Germany)<br />
Man Group (UK)<br />
MAPFRE (Spain)<br />
Mediaset (Italy)<br />
Mediolanum (Italy)<br />
Merck (Germany)<br />
Metro (Germany)<br />
Metso (Finland)<br />
Meyr Melnhof (Austria)<br />
Michelin (France)<br />
Mobistar (Belgium)<br />
Mondadori Editore (Italy)<br />
Morrisons (UK)<br />
Mota-Engil (Portugal)<br />
M-real (Finland)<br />
Münchener Rück (Germany)<br />
National Grid (UK)<br />
Neste Oil (Finland)<br />
Nestlé (Switzerland)<br />
NH Hoteles (Spain)<br />
NKT Holding (Denmark)<br />
Nobel Biocare (Switzerland)<br />
Nokia (Finland)<br />
Nokian Renkaat (Finland)<br />
Nordea Bank (Denmark-Sweden)<br />
Novartis (Switzerland)<br />
Novo Nordisk (Denmark)<br />
Novozymes (Denmark)<br />
Nyrstar (Belgium)<br />
Oesterreichische Post (Austria)<br />
Omega Pharma (Belgium)<br />
OMV (Austria)<br />
Orion (Finland)<br />
Outokumpu (Finland)<br />
Outotec (Finland)<br />
Palfinger (Austria)<br />
Parmalat (Italy)<br />
Pernod Ricard (France)<br />
Philips (Netherlands)<br />
Pirelli (Italy)<br />
Pohjola Pankki (Finland)<br />
Portucel (Portugal)<br />
Portugal Telecom (Portugal)<br />
Pöyry (Finland)<br />
PPR (France)<br />
Prudential (UK)<br />
Prysmian (Italy)<br />
PSA (France)<br />
R.E.E. (Spain)<br />
Raiffeisen International (Austria)<br />
Randstad (Netherlands)<br />
Rautaruukki (Finland)<br />
Reckitt Benckiser (UK)<br />
Reed Elsevier (Netherlands-UK)<br />
REN (Portugal)<br />
Renault (France)<br />
Repsol YPF (Spain)<br />
RHI (Austria)<br />
Richemont (Switzerland)<br />
Rio Tinto (UK)<br />
Rolls Royce (UK)<br />
Royal Bank of Scotland (UK)<br />
Royal Dutch Shell A<br />
(Netherlands-UK)<br />
RWE (Germany)<br />
SABMiller (UK)<br />
Sacyr Vallehermoso (Spain)<br />
Saint Gobain (France)<br />
Saipem (Italy)<br />
Sampo (Finland)<br />
Sandvik (Sweden)<br />
Sanofi Aventis (France)<br />
SanomaWSOY (Finland)<br />
SAP (Germany)<br />
SBM Offshore (Netherlands)<br />
SCA (Sweden)<br />
Scania (Sweden)<br />
Schneider (France)<br />
Schoeller Bleckmann (Austria)<br />
Scottish & Southern Energy (UK)<br />
Seat Pagine Gialle (Italy)<br />
SEB (Sweden)<br />
Semapa (Portugal)<br />
Siemens (Germany)<br />
Skanska (Sweden)<br />
SKF (Sweden)<br />
Snam Rete Gas (Italy)<br />
Soares da Costa (Portugal)<br />
Société Générale (France)<br />
Sogecable (Spain)<br />
Solvay (Belgium)<br />
Sonae (Portugal)<br />
Sonae Indústria (Portugal)<br />
Sonaecom (Portugal)<br />
Sponda (Finland)<br />
SSAB (Sweden)<br />
Standard Chartered (UK)<br />
STMicroelectronics (France-Italy)<br />
Stockmann (Finland)<br />
Stora Enso (Finland)<br />
Strabag (Austria)<br />
Suez (Belgium-France)<br />
Svenska Handelsbanken<br />
(Sweden)<br />
Swatch (Switzerland)<br />
Swedbank (Sweden)<br />
Swedish Match (Sweden)<br />
Swiss Life (Switzerland)<br />
Swiss Re (Switzerland)<br />
Swisscom (Switzerland)<br />
Sydbank (Denmark)<br />
Syngenta International<br />
(Switzerland)<br />
Synthes (Switzerland)<br />
Teixeira Duarte (Portugal)<br />
Tele2 (Sweden)<br />
Telecinco (Spain)<br />
Telecom Italia (Italy)<br />
Telefónica (Spain)<br />
Telekom Austria (Austria)<br />
TeliaSonera (Sweden)<br />
Tenaris (Italy)<br />
Terna (Italy)<br />
Tesco (UK)<br />
ThyssenKrupp (Germany)<br />
TietoEnator (Finland)<br />
TNT (Netherlands)<br />
TomTom (Netherlands)<br />
Topdanmark (Denmark)<br />
Total (France)<br />
Trelleborg (Sweden)<br />
TrygVesta (Denmark)<br />
TUI (Germany)<br />
Tullow Oil (UK)<br />
Ubi Banca (Italy)<br />
UBS (Switzerland)<br />
UCB (Belgium)<br />
Umicore (Belgium)<br />
Unibail-Rodamco (France-<br />
Netherlands)<br />
Unicredito Italiano (Italy)<br />
Unilever (Netherlands-UK)<br />
Unión Fenosa (Spain)<br />
Unipol (Italy)<br />
United Utilities (UK)<br />
UPM-Kymmene (Finland)<br />
Vallourec (France)<br />
Vedanta Resources (UK)<br />
Vedior (Netherlands)<br />
Veolia Environnement (France)<br />
Verbund (Austria)<br />
Vestas Wind Systems (Denmark)<br />
Vienna Insurance Group (Austria)<br />
Vinci (France)<br />
Vivendi (France)<br />
Vodafone (UK)<br />
Voestalpine (Austria)<br />
Volkswagen (Germany)<br />
Volvo (Sweden)<br />
Wärtsilä (Finland)<br />
Wienerberger (Austria)<br />
William Demant Holding<br />
(Denmark)<br />
Wolters Kluwer (Netherlands)<br />
WPP (UK)<br />
Xstrata (UK)<br />
YIT (Finland)<br />
ZON Multimédia (Portugal)<br />
Zumtobel (Austria)<br />
Zürich Financial Services<br />
(Switzerland)<br />
<strong>Heidrick</strong> & <strong>Struggles</strong> 47
2009<br />
2007<br />
2005<br />
2003<br />
2001<br />
Europe<br />
EU09<br />
European ratio of<br />
non-national directors<br />
to national directors<br />
Executive<br />
directors<br />
Former<br />
executive<br />
directors<br />
Independent non-executive<br />
directors<br />
North<br />
America 21%<br />
Latin and<br />
South America 3%<br />
United Kingdom 10%<br />
Reference<br />
shareholders<br />
Germany 10%<br />
France 12%<br />
Benelux 10%<br />
Italy 4%<br />
Spain and Portugal 4%<br />
Central and Eastern Europe 4%<br />
Northern Europe 10%<br />
Other European countries 3%<br />
APAC 6%<br />
Middle East and Africa 3%<br />
Employee<br />
representatives<br />
Other<br />
non-independent<br />
directors<br />
10% 4 45%<br />
16% 11% 14%<br />
11%<br />
11%<br />
12%<br />
11%<br />
EU09<br />
Corporate Governance <strong>Report</strong><br />
2009<br />
3 54% 19% 10% 3<br />
5% 50% 20% 10% 4<br />
4 48% 20% 11% 5%<br />
3 43% 25% 10% 2 6%<br />
European board composition by category of director<br />
(unclassified)<br />
Identification of<br />
independent directors<br />
2009 2007 2005<br />
88% 86% 79%<br />
Frequency of meetings 95% 98% 93%<br />
Age of directors 73% 72% 68%<br />
Start and end of tenure 84% 82% 79%<br />
Directors’ main executive position 92% 98% 99%<br />
EU09<br />
European transparency of<br />
directors’ information<br />
(% of companies providing information)<br />
2009 2007 2005<br />
Directors’ other board positions 94% 97% 95%<br />
Directors’ company shares held 75% 64% 63%<br />
Remuneration of directors 84% 80% 68%<br />
Remuneration structure 72% n/a n/a<br />
List of committee members 95% 99% 97%<br />
<strong>Report</strong> of activity of<br />
each committee 75% n/a n/a
CEO & Board practice<br />
Our CEO & Board practice combines expertise in Search and Leadership<br />
Consulting to help boards of directors respond to the challenges of our<br />
rapidly changing business world.<br />
Established in 1953, with sixty-six offices in thirty-five countries, we possess<br />
an unrivalled track record of helping companies expand into emerging<br />
markets and grow their presence in established economies. We are as<br />
comfortable operating in the Private Equity and privately owned sectors,<br />
as in the listed, public arena.<br />
We build diverse, high-performing boards because we understand the<br />
ever-transforming nature of leadership and thrive on this dynamism. Our<br />
team has in-depth experience in succession planning for chairman and CEO<br />
transitions and we pride ourselves on being our clients’ most trusted advisor:<br />
assisting not just with the identification of leaders but with their onboarding<br />
and in the delivery of measurable successes via our comprehensive<br />
leadership advisory services.
Connecting leaders around the globe is what <strong>Heidrick</strong> & <strong>Struggles</strong> does<br />
best. For over fifty years we have been building deep relationships with the<br />
world’s most talented individuals on behalf of the world’s most successful<br />
companies. Through the strategic acquisition, development and retention of<br />
talent we help our clients – from the most established market giants to the<br />
newest market disrupters – build winning leadership teams.<br />
Amsterdam +31 (0)20 462 77 77<br />
Atlanta +1 404 577 2410<br />
Auckland +64 (0)9 3066630<br />
Bangalore +91 80 4022 4140<br />
Bangkok +66 2 664 1011<br />
Barcelona +34 93 225 7300<br />
Beijing +86 (0)10 6598 8288<br />
Beirut +961 1 964 671<br />
Bogotá +57 1 587 7878<br />
Boston +1 617 737 6300<br />
Brussels +32 (0)2 5420750<br />
Buenos Aires +54 (0)11 43209950<br />
Chicago +1 312 496 1000<br />
Chongqing +86 (0)23 63001588<br />
Cleveland +1 216 241 7410<br />
Copenhagen +45 33 377 600<br />
Dallas +1 214 706 7700<br />
Denver +1 720 932 3839<br />
Dubai +971 4 509 6675<br />
Düsseldorf +49 (0)211 82820<br />
El Segundo +1 310 321 3220<br />
Encino +1 818 905 6010<br />
Frankfurt +49 (0)69 697 0020<br />
Geneva +41 (0)22 322 29 39<br />
Guangzhou +86 (0)20 3813 5588<br />
Hamburg +49 (0)40 3405770<br />
Helsinki +358 9 251 1250<br />
Hong Kong +852 21039300<br />
Houston +1 713 237 9000<br />
Istanbul +90 (0)212 3510904<br />
Johannesburg +27 (0)11 685 6910<br />
Lisbon +351 21 351 4530<br />
London +44 (0)20 7075 4000<br />
Copyright ©2009 <strong>Heidrick</strong> & <strong>Struggles</strong> International, Inc.<br />
All rights reserved. Reproduction without permission is prohibited. Trademarks and logos are copyrights of their respective owners.<br />
200901PBTSMI5<br />
Los Angeles +1 213 625 8811<br />
Madrid +34 91 391 5256<br />
Melbourne +61 (0)3 9012 3000<br />
Menlo Park +1 650 234 1500<br />
Mexico City +52 55 9138 0370<br />
Miami +1 305 262 2606<br />
Milan +39 02 762 521<br />
Minneapolis +1 612 215 6913<br />
Moscow +7 495 225 9368<br />
Mumbai +91 (0)22 6666 3021<br />
Munich +49 (0)89 998 110<br />
New Delhi +91 (0)124 465 5300<br />
New York City +1 212 867 9876<br />
Paris +33 (0)1 4434 1700<br />
Philadelphia +1 215 988 1000<br />
Rome +39 06 8537 5801<br />
San Francisco +1 415 981 2854<br />
Santiago +56 (0)2 2033660<br />
Sao Paulo +55 11 550 44000<br />
Seoul +82 (0)2 3430 6000<br />
Shanghai +86 (0)21 6136 1988<br />
Singapore +65 6332 5001<br />
Stamford +1 203 252 2900<br />
Stockholm +46 (0)8 406 7100<br />
Sydney +61 (0)2 8205 2000<br />
Taipei +886 (0)2 2757 6123<br />
Tokyo +81 (0)3 4520 7800<br />
Toronto +1 416 361 4700<br />
Tysons Corner +1 703 848 2500<br />
Vienna +43 (0)1 5331 0070<br />
Warsaw +48 (0)22 584 9898<br />
Washington DC +1 202 331 4900<br />
Zurich +41 (0)44 488 1313