Genova Protocol: P09-003A Bradford Protein Assay - Jenway
Genova Protocol: P09-003A Bradford Protein Assay - Jenway
Genova Protocol: P09-003A Bradford Protein Assay - Jenway

Create successful ePaper yourself
Turn your PDF publications into a flip-book with our unique Google optimized e-Paper software.
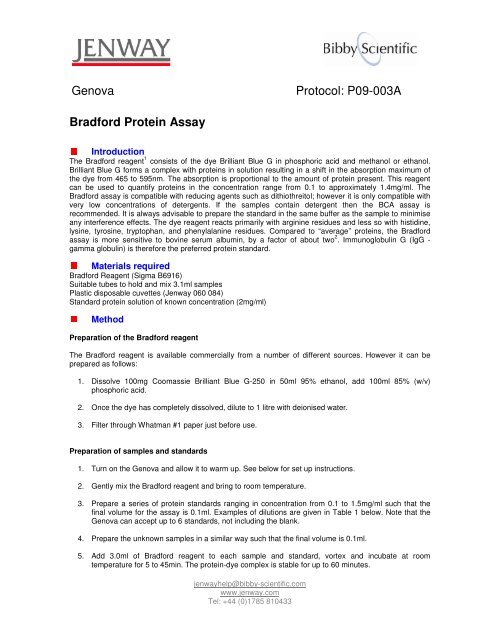
<strong>Genova</strong> <strong>Protocol</strong>: <strong>P09</strong>-<strong>003A</strong><br />
<strong>Bradford</strong> <strong>Protein</strong> <strong>Assay</strong><br />
Introduction<br />
The <strong>Bradford</strong> reagent 1 consists of the dye Brilliant Blue G in phosphoric acid and methanol or ethanol.<br />
Brilliant Blue G forms a complex with proteins in solution resulting in a shift in the absorption maximum of<br />
the dye from 465 to 595nm. The absorption is proportional to the amount of protein present. This reagent<br />
can be used to quantify proteins in the concentration range from 0.1 to approximately 1.4mg/ml. The<br />
<strong>Bradford</strong> assay is compatible with reducing agents such as dithiothreitol; however it is only compatible with<br />
very low concentrations of detergents. If the samples contain detergent then the BCA assay is<br />
recommended. It is always advisable to prepare the standard in the same buffer as the sample to minimise<br />
any interference effects. The dye reagent reacts primarily with arginine residues and less so with histidine,<br />
lysine, tyrosine, tryptophan, and phenylalanine residues. Compared to “average” proteins, the <strong>Bradford</strong><br />
assay is more sensitive to bovine serum albumin, by a factor of about two 2 . Immunoglobulin G (IgG -<br />
gamma globulin) is therefore the preferred protein standard.<br />
Materials required<br />
<strong>Bradford</strong> Reagent (Sigma B6916)<br />
Suitable tubes to hold and mix 3.1ml samples<br />
Plastic disposable cuvettes (<strong>Jenway</strong> 060 084)<br />
Standard protein solution of known concentration (2mg/ml)<br />
Method<br />
Preparation of the <strong>Bradford</strong> reagent<br />
The <strong>Bradford</strong> reagent is available commercially from a number of different sources. However it can be<br />
prepared as follows:<br />
1. Dissolve 100mg Coomassie Brilliant Blue G-250 in 50ml 95% ethanol, add 100ml 85% (w/v)<br />
phosphoric acid.<br />
2. Once the dye has completely dissolved, dilute to 1 litre with deionised water.<br />
3. Filter through Whatman #1 paper just before use.<br />
Preparation of samples and standards<br />
1. Turn on the <strong>Genova</strong> and allow it to warm up. See below for set up instructions.<br />
2. Gently mix the <strong>Bradford</strong> reagent and bring to room temperature.<br />
3. Prepare a series of protein standards ranging in concentration from 0.1 to 1.5mg/ml such that the<br />
final volume for the assay is 0.1ml. Examples of dilutions are given in Table 1 below. Note that the<br />
<strong>Genova</strong> can accept up to 6 standards, not including the blank.<br />
4. Prepare the unknown samples in a similar way such that the final volume is 0.1ml.<br />
5. Add 3.0ml of <strong>Bradford</strong> reagent to each sample and standard, vortex and incubate at room<br />
temperature for 5 to 45min. The protein-dye complex is stable for up to 60 minutes.<br />
jenwayhelp@bibby-scientific.com<br />
www.jenway.com<br />
Tel: +44 (0)1785 810433
6. Transfer the samples to cuvettes and measure the absorbance at 595nm using the <strong>Bradford</strong> protein<br />
mode on the <strong>Genova</strong> as detailed below.<br />
Final concentration Volume of a 2mg/ml Volume of water or<br />
(mg/ml)<br />
standard (µl) dilution buffer (µl)<br />
0 (blank) 0 100<br />
0.2 10 90<br />
0.4 20 80<br />
0.6 30 70<br />
0.8 40 60<br />
1.0 50 50<br />
1.5 75 25<br />
Table 1: Examples of standard dilutions for preparation of a calibration curve.<br />
Setting up the <strong>Genova</strong> for the <strong>Bradford</strong> assay<br />
1. From the main screen of the <strong>Genova</strong> select PROTEIN MODE and then BRADFORD.<br />
2. Select SETUP. Adjust the wavelength to 595nm. Adjust the units to mg/ml or other units as<br />
appropriate.<br />
3. Select the required resolution. Note that at high resolution i.e. 0.001, the concentrations will appear to<br />
fluctuate more.<br />
4. Select EXIT and then CURVE. Select a METHOD number (0-9); the standard curve data generated will<br />
be stored with the method number displayed.<br />
5. Enter the number of standards (maximum of 6).<br />
6. In the table under the unit heading (mg/ml), enter the concentration values of each of the standards.<br />
7. Place the sample blank into the <strong>Genova</strong> and press CAL to begin the calibration procedure. Press CAL<br />
again to zero the instrument on the blank.<br />
8. Following the instructions on the screen, insert each standard as requested pressing CAL each time.<br />
Once all standards have been measured, the ABS column of the table will be updated with the actual<br />
absorbance.<br />
9. To view the standard curve, select VIEW. To obtain the equation of the curve, select STATISTICS. The<br />
curve fit is quadratic of the form y = ax 2 + bx + c.<br />
10. Press any key to clear the statistics then exit back to the main measurement screen.<br />
11. Place the sample blank in the <strong>Genova</strong> and press CAL to zero.<br />
12. Remove the blank and insert each sample. Read the concentration from the screen in the chosen<br />
units.<br />
An example calibration curve is shown in Figure 1.<br />
jenwayhelp@bibby-scientific.com<br />
www.jenway.com<br />
Tel: +44 (0)1785 810433
Absorbance<br />
0.6<br />
0.5<br />
0.4<br />
0.3<br />
0.2<br />
0.1<br />
0<br />
<strong>Bradford</strong> assay standard curve<br />
y = -0.0082x 2 + 0.3458x - 0.0148<br />
R 2 = 0.9943<br />
-0.1<br />
-0.1<br />
0.1 0.3 0.5 0.7 0.9 1.1 1.3 1.5<br />
Concentration (mg/ml)<br />
Figure 1: A typical <strong>Bradford</strong> assay standard curve with samples ranging from 0.2 to 1.5mg/ml protein.<br />
References<br />
1. <strong>Bradford</strong>, M.M. A rapid and sensitive for the quantitation of microgram quantities of protein utilizing<br />
the principle of protein-dye binding. Anal. Biochem. 72: 248-254, (1976).<br />
2. http://www.ruf.rice.edu/~bioslabs/methods/protein/bradford.html<br />
The protocols described here are for guidance only. Be aware of any hazardous compounds, take<br />
precautions where necessary and dispose of any waste in the appropriate manner.<br />
jenwayhelp@bibby-scientific.com<br />
www.jenway.com<br />
Tel: +44 (0)1785 810433