Geochemistry of organic carbon and nitrogen in surface ... - YIC-IR
Geochemistry of organic carbon and nitrogen in surface ... - YIC-IR
Geochemistry of organic carbon and nitrogen in surface ... - YIC-IR

Create successful ePaper yourself
Turn your PDF publications into a flip-book with our unique Google optimized e-Paper software.
1152 X. Gao et al. / Mar<strong>in</strong>e Pollution Bullet<strong>in</strong> 64 (2012) 1148–1155<br />
13 C (‰)<br />
δ<br />
-16<br />
-18<br />
-20<br />
-22<br />
-24<br />
-26<br />
-28<br />
-30<br />
DH-3<br />
DH-2<br />
DH-1<br />
M-1<br />
M-2<br />
M-3<br />
M-4<br />
M-5<br />
JY-2<br />
JY-1<br />
CB-1<br />
HH-2<br />
HH-1<br />
YDX-5<br />
YDX-4<br />
YDX-3<br />
YDX-2<br />
YDX-1<br />
K-1<br />
K-2<br />
K-3<br />
K-4<br />
K-5<br />
K-6<br />
K-7<br />
K-8<br />
<strong>organic</strong> matter <strong>in</strong> <strong>surface</strong> sediments <strong>of</strong> coastal Bohai Bay is basically<br />
the mixture <strong>of</strong> cont<strong>in</strong>ental derived material <strong>and</strong> mar<strong>in</strong>e material.<br />
In addition, the apparent fluctuation <strong>of</strong> d 13 C values <strong>in</strong> the<br />
samples from rivers reflects that some local additional factors<br />
probably exert an important <strong>in</strong>fluence on the d 13 C signatures <strong>of</strong><br />
SOM. Guo et al. (2006) reported that C3 plant ecosystem dom<strong>in</strong>ated<br />
North Ch<strong>in</strong>a; therefore, the portion <strong>of</strong> <strong>organic</strong> matter with terrestrial<br />
higher plant orig<strong>in</strong> <strong>in</strong> <strong>surface</strong> sediments <strong>of</strong> the studied area<br />
is ma<strong>in</strong>ly derived from C 3 vascular plants.<br />
Accord<strong>in</strong>g to previous studies, there is a net seaward <strong>in</strong>crease <strong>in</strong><br />
d 13 C <strong>in</strong> mar<strong>in</strong>e sediments (Ramaswamy et al., 2008; Hu et al.,<br />
2009). A straightforward explanation for this trend is a progressive<br />
seaward decrease <strong>in</strong> the proportions <strong>of</strong> terrigenous <strong>organic</strong> matter<br />
relative to mar<strong>in</strong>e autogenous <strong>organic</strong> matter. This explanation is<br />
also consistent with the seaward decrease <strong>in</strong> d 15 N <strong>and</strong> C/N. However,<br />
such a distribution pattern is not dist<strong>in</strong>ct <strong>in</strong> the mar<strong>in</strong>e region<br />
<strong>of</strong> coastal Bohai Bay except at transect M, which may be due to that<br />
the hydrodynamic condition <strong>and</strong> flat sea-floor <strong>of</strong> this area make <strong>organic</strong><br />
matter from different sources well mixed.<br />
Given that the C/N ratio is also an <strong>in</strong>dicator for the sources <strong>of</strong><br />
<strong>organic</strong> matter, it is expected that there exists a significant negative<br />
correlation between d 13 C <strong>and</strong> C/N ratios, i.e. <strong>organic</strong> matter<br />
with high C/N ratio has much lighter d 13 C value (Wu et al.,<br />
2002). However, it is shown that d 13 C aga<strong>in</strong>st C/N ratios has no pronounced<br />
relationship at the studied areas no matter analyz<strong>in</strong>g the<br />
data from river<strong>in</strong>e <strong>and</strong> mar<strong>in</strong>e regions separately or together<br />
(Fig. 9a). This should be attributed to the decomposition processes<br />
(e.g. autolysis, leach<strong>in</strong>g <strong>and</strong> microbial m<strong>in</strong>eralization) <strong>of</strong> <strong>organic</strong><br />
matter (Thornton <strong>and</strong> McManus, 1994; Wu et al., 2003) <strong>and</strong>/or<br />
the anthropogenic disturbances. The anthropogenic disturbances<br />
might be a more probable reason because the samples <strong>of</strong> this study<br />
are <strong>surface</strong> sediments experienc<strong>in</strong>g a short period <strong>of</strong> degrad<strong>in</strong>g,<br />
<strong>and</strong> the d 15 N data which are discussed below will provide further<br />
evidence <strong>of</strong> this.<br />
a<br />
δ 13 C (‰)<br />
-15<br />
-18<br />
-21<br />
-24<br />
-27<br />
-30<br />
Station ID<br />
DLJ-3<br />
DLJ-2<br />
T-1<br />
T-2<br />
T-3<br />
T-4<br />
T-5<br />
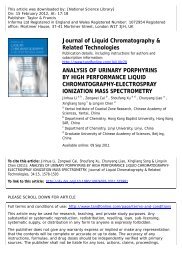
Fig. 8. Spatial variations <strong>of</strong> d 13 C <strong>and</strong> d 15 N <strong>in</strong> <strong>surface</strong> sediments <strong>of</strong> coastal Bohai Bay.<br />
Mar<strong>in</strong>e data River<strong>in</strong>e data<br />
0 10 20 30 40 50<br />
C/N<br />
QJH-2<br />
QJH-1<br />
ZYX-2<br />
ZYX-1<br />
U-1<br />
U-2<br />
U-3<br />
U-4<br />
U-5<br />
3.2.3. Distribution <strong>of</strong> d 15 N values <strong>of</strong> TN<br />
Similar to that <strong>of</strong> d 13 C, the spatial variation <strong>of</strong> d 15 N <strong>in</strong> the river<strong>in</strong>e<br />
region <strong>of</strong> coastal Bohai Bay is greater than <strong>in</strong> the mar<strong>in</strong>e region<br />
(Fig. 8). Apparently higher d 15 N values <strong>of</strong> >7‰ were measured <strong>in</strong><br />
samples from Dou River, Chaobai River <strong>and</strong> Duliujian River. For<br />
each transect M, T <strong>and</strong> U, the d 15 N difference among mar<strong>in</strong>e samples<br />
is small. The samples from river<strong>in</strong>e sites have an average d 15 N<br />
value <strong>of</strong> 6.06 ± 2.81‰, which is heavier than that <strong>of</strong> the mar<strong>in</strong>e<br />
sediments’ 4.05 ± 0.53‰.<br />
Mar<strong>in</strong>e <strong>organic</strong> matter usually has the d 15 N value <strong>of</strong> 3–12‰<br />
with the mean <strong>of</strong> 5–7‰ as derived from phytoplankton which normally<br />
use dissolved nitrate (Br<strong>and</strong>es <strong>and</strong> Devol, 2002; Lamb et al.,<br />
2006). Organic matter derived from <strong>nitrogen</strong> fix<strong>in</strong>g l<strong>and</strong> plants has<br />
d 15 N values around zero, whereas plants us<strong>in</strong>g only m<strong>in</strong>eral N from<br />
soil ðNO 3 or NH þ<br />
4 ) have usually positive d15 N values. Generally, river<br />
suspension has quite variable d 15 N values that are mostly lower<br />
than oceanic values (Maksymowska et al., 2000; Gaye-Haake et al.,<br />
2005). Low d 15 N <strong>in</strong> rivers could be due to contributions from forest<br />
<strong>and</strong> soil <strong>nitrogen</strong> as terrestrial plant ecosystems have low d 15 N. Unlike<br />
that <strong>of</strong> natural orig<strong>in</strong>s, generally, the waste that experienced<br />
anthropogenic disturbances is isotopically rich <strong>in</strong> heavy <strong>nitrogen</strong>ous<br />
components (Cole et al., 2006; Bănaru et al., 2007). Compared<br />
with atmospheric deposition (d 15 N<strong>of</strong>+2‰ to +8‰) <strong>and</strong> commercial,<br />
<strong>in</strong><strong>organic</strong> fertilizers (d 15 N<strong>of</strong> 3‰ to +3‰), <strong>nitrogen</strong> derived<br />
from human wastewater <strong>and</strong> livestock (d 15 N <strong>of</strong> +10‰ to +22‰)<br />
is relatively enriched <strong>in</strong> N 15 (McClell<strong>and</strong> et al., 1997). In this study,<br />
as mentioned above, the d 15 N values <strong>in</strong> <strong>surface</strong> sediments from<br />
many river<strong>in</strong>e sampl<strong>in</strong>g sites are apparently higher than that from<br />
the mar<strong>in</strong>e region reflect<strong>in</strong>g that the <strong>in</strong>put <strong>of</strong> <strong>organic</strong> matter from<br />
anthropogenic activities has a more significant <strong>in</strong>fluence on its spatial<br />
distribution than from natural processes. As just mentioned,<br />
the terrigenous detrital <strong>organic</strong> matter is generally characterized<br />
by a low d 15 N signature while the mar<strong>in</strong>e component has a relatively<br />
higher d 15 N value. Based on this, some dist<strong>in</strong>ct progressive<br />
δ 15 N (‰)<br />
15<br />
12<br />
9<br />
6<br />
3<br />
0<br />
δ 13 C<br />
δ 15 N<br />
Mar<strong>in</strong>e data River<strong>in</strong>e data<br />
0 10 20 30 40 50<br />
Fig. 9. Relationship between d 13 C <strong>and</strong> C/N ratios (a) <strong>and</strong> d 15 N <strong>and</strong> C/N ratios (b) <strong>in</strong> <strong>surface</strong> sediments <strong>of</strong> coastal Bohai Bay.<br />
b<br />
C/N<br />
14<br />
12<br />
10<br />
8<br />
6<br />
4<br />
2<br />
0<br />
15<br />
δ N (‰)