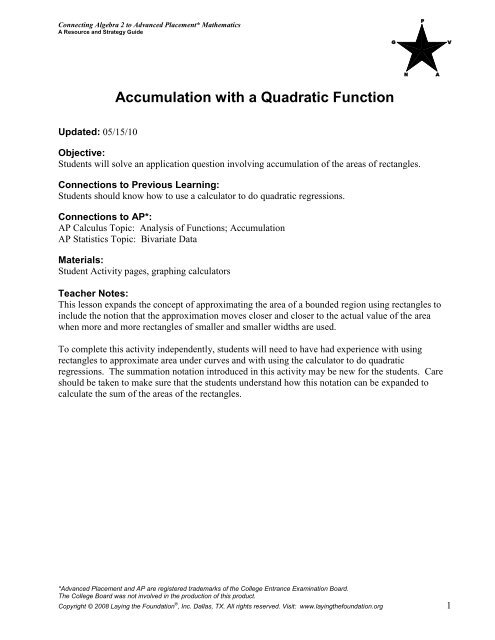
Accumulation with a Quadratic Function - Moore Public Schools
Accumulation with a Quadratic Function - Moore Public Schools
Accumulation with a Quadratic Function - Moore Public Schools

Create successful ePaper yourself
Turn your PDF publications into a flip-book with our unique Google optimized e-Paper software.
Connecting Algebra 2 to Advanced Placement* Mathematics<br />
A Resource and Strategy Guide<br />
Updated: 05/15/10<br />
<strong>Accumulation</strong> <strong>with</strong> a <strong>Quadratic</strong> <strong>Function</strong><br />
Objective:<br />
Students will solve an application question involving accumulation of the areas of rectangles.<br />
Connections to Previous Learning:<br />
Students should know how to use a calculator to do quadratic regressions.<br />
Connections to AP*:<br />
AP Calculus Topic: Analysis of <strong>Function</strong>s; <strong>Accumulation</strong><br />
AP Statistics Topic: Bivariate Data<br />
Materials:<br />
Student Activity pages, graphing calculators<br />
Teacher Notes:<br />
This lesson expands the concept of approximating the area of a bounded region using rectangles to<br />
include the notion that the approximation moves closer and closer to the actual value of the area<br />
when more and more rectangles of smaller and smaller widths are used.<br />
To complete this activity independently, students will need to have had experience <strong>with</strong> using<br />
rectangles to approximate area under curves and <strong>with</strong> using the calculator to do quadratic<br />
regressions. The summation notation introduced in this activity may be new for the students. Care<br />
should be taken to make sure that the students understand how this notation can be expanded to<br />
calculate the sum of the areas of the rectangles.<br />
*Advanced Placement and AP are registered trademarks of the College Entrance Examination Board.<br />
The College Board was not involved in the production of this product.<br />
Copyright © 2008 Laying the Foundation ® , Inc. Dallas, TX. All rights reserved. Visit: www.layingthefoundation.org 1
<strong>Accumulation</strong> <strong>with</strong> a <strong>Quadratic</strong> <strong>Function</strong><br />
Student Activity<br />
Julián Guerrera, who owns a small farm near San Marcos, Texas, has recently installed a small tank<br />
on his property to provide flood control for the creek that flows near his home. Under normal<br />
circumstances no water flows into the tank; however, on a particularly rainy day, the creek rises and<br />
begins to flow into the tank. Mr. Guerrera collects data from his water gauge every hour beginning<br />
when the water first starts running into the tank at 8:00 a.m. He records the rate of flow in cubic<br />
meters per hour every hour for the first four hours of the storm. His table is provided below. The<br />
weather report predicts that the flood will continue to increase in its intensity until 1:00 p.m. and<br />
then quickly subside. Mr. Guerrera knows that if his tank, which can hold up to 22,000 cubic meters<br />
of water, is no more than half full at the end of the first five hours, his home is safe from the flooding<br />
water. Eduardo, Mr. Guerrera’s son, is taking Algebra II, so he volunteers to monitor the gauge and<br />
to evaluate the data. He, of course, needs your help. The gauge readings taken from 8:00 a.m. to<br />
noon are recorded in the table provided below.<br />
8:00 a.m. 9:00 a.m. 10:00 a.m. 11:00 a.m. 12:00 noon<br />
500 m 3<br />
/hr.<br />
3<br />
700 m /hr.<br />
3<br />
1300 m /hr.<br />
2300 m /hr.<br />
Copyright © 2008 Laying the Foundation ® , Inc. Dallas, TX. All rights reserved. Visit: www.layingthefoundation.org 2<br />
3<br />
3<br />
3700 m /hr.<br />
1. The first task is to create a graph of the data.<br />
a) Code the data so that 8:00 a.m. is at time 0 and so that 500 m 3<br />
/hr is represented by 5.<br />
b) Sketch a scatterplot of the data.<br />
60<br />
55<br />
50<br />
45<br />
40<br />
35<br />
30<br />
25<br />
20<br />
15<br />
10<br />
5<br />
0<br />
0<br />
1 2 3 4 5 6<br />
c) Label the axes <strong>with</strong> words.
Student Activity<br />
d) Draw a smooth continuous curve to connect the data points for this time period. Explain<br />
how the statement about the weather report given in the opening paragraph indicates that<br />
a smooth continuous curve may be drawn for the given time period.<br />
e) What type of function does the data appear to represent?<br />
2. Since the flood is predicted to subside after 5 hours, you need to know the rate at which the<br />
water will be flowing at 1:00 p.m.; however, you cannot wait until then to start moving<br />
furniture. You decide to take a chance on the fact that a quadratic function will fit the data<br />
relatively well.<br />
a) Enter the data into L1 and L2 on your graphing calculator and adjust the window to<br />
display the data.<br />
b) Calculate a quadratic regression on the data, and graph the function to make sure that it<br />
gives an acceptable fit.<br />
c) What is the function?<br />
d) Using your function, calculate the rate at which the water is flowing into the tank at<br />
1:00 p.m.<br />
e) Add this data point to your table and to your graph.<br />
3. The information that has been gathered represents the rate of flow of the water in cubic meters<br />
per hour, but you need to calculate the total amount of water that will collect in the tank over<br />
the five hour period. You make a quick phone call to your teacher, and she suggests that what<br />
you should approximate the area under the curve.<br />
a) Consider the units of the x-axis (time-axis) and the units of the y-axis (rate-axis). If you<br />
calculate the area of a rectangle on this grid, what units will be on the area?<br />
b) Following your teacher’s suggestion, draw 5 vertical line segments, one at each hour,<br />
from the time-axis to the curve. Now draw five horizontal segments beginning on the<br />
left-side of the curve to form 5 rectangles so that the height of the first rectangle is 5, the<br />
second is 7, the third is 13, etc. (Since this is a continually increasing function, the<br />
rectangles will all lie completely below the curve.)<br />
60<br />
55<br />
50<br />
45<br />
40<br />
35<br />
30<br />
25<br />
20<br />
15<br />
10<br />
5<br />
0<br />
0<br />
1 2 3 4 5 6<br />
Copyright © 2008 Laying the Foundation ® , Inc. Dallas, TX. All rights reserved. Visit: www.layingthefoundation.org 3
c) What is the area (include the units) of the first rectangle? ________<br />
d) What is the area (include the units) of the second rectangle? ________<br />
e) What is the area (include the units) of the third rectangle? ________<br />
f) What is the area (include the units) of the fourth rectangle? ________<br />
g) What is the area (include the units) of the fifth rectangle? ________<br />
Student Activity<br />
h) Total the areas of the five rectangles, and explain what this measurement represents.<br />
i) Is this measurement too small or too large? Explain your choice based on the graph that<br />
you drew.<br />
4. a) Draw another sketch of the data; however, this time sketch in rectangles that use the<br />
right-hand side of the region for the height. These are called “right-hand” rectangles.<br />
60<br />
55<br />
50<br />
45<br />
40<br />
35<br />
30<br />
25<br />
20<br />
15<br />
10<br />
5<br />
0<br />
0<br />
1 2 3 4 5 6<br />
b) What is the area (include the units) of the first rectangle? ________<br />
c) What is the area (include the units) of the second rectangle? ________<br />
d) What is the area (include the units) of the third rectangle? ________<br />
e) What is the area (include the units) of the fourth rectangle? ________<br />
f) What is the area (include the units) of the fifth rectangle? ________<br />
g) Total the areas of the five rectangles, and explain what this measurement represents.<br />
h) Is this approximation too small or too large? Explain your choice based on the graph that<br />
you drew.<br />
Copyright © 2008 Laying the Foundation ® , Inc. Dallas, TX. All rights reserved. Visit: www.layingthefoundation.org 4
5. According to your calculation the amount of water in the tank will be between<br />
_________________________ and ________________________.<br />
Student Activity<br />
If the amount of water is greater than ____________ , the Guerrera family needs to prepare<br />
the house for flooding so the situation looks bad. Your under estimation looks acceptable;<br />
however, the over estimation means that you need to help move furniture to the second floor<br />
of the house.<br />
6. You and Eduardo decide to refine your estimate instead of moving furniture; you need more<br />
data points in order to get rectangles <strong>with</strong> smaller widths.<br />
a) You make a new table and add in values for every half-hour by calculating the rate<br />
predicted by your function at 0.5, 1.5, 2.5, 3.5, and 4.5.<br />
0 0.5 1 1.5 2 2.5 3 3.5 4 4.5 5<br />
5 7 13 23 37 55<br />
b) You sketch a new graph and draw in 10 right-hand rectangles to represent a new upper<br />
bound for the amount of water in the tank.<br />
60<br />
55<br />
50<br />
45<br />
40<br />
35<br />
30<br />
25<br />
20<br />
15<br />
10<br />
5<br />
0<br />
0<br />
1 2 3 4 5 6<br />
c) Use the 10 right-hand rectangles to calculate the new upper bound for the amount of<br />
water in the tank.<br />
This is better, but it still predicts that you must move furniture.<br />
Copyright © 2008 Laying the Foundation ® , Inc. Dallas, TX. All rights reserved. Visit: www.layingthefoundation.org 5
Student Activity<br />
7. To simplify your work, you decide to use the mathematical notation for this process which is<br />
last t-value<br />
∑<br />
first t-value, (step= ∆t)<br />
f() t ⋅∆t<br />
.<br />
This says to sum the product of the height and the width of the rectangles beginning at t = first<br />
t-value and stopping at t = last t-value, making a calculation every ∆t units.<br />
5−0 ∆ t = , where n is the number of rectangles that you want to use.<br />
n<br />
To use this notation for the set of 5 left-hand rectangles you write<br />
4<br />
∑<br />
t=<br />
0, (step = 1)<br />
2<br />
(2t + 5) ⋅1<br />
(Notice that 0 is the first value of t for the left-hand rectangles)<br />
To use this notation for the set of 5 right-hand rectangles you write<br />
5<br />
∑<br />
t=<br />
1, (step = 1)<br />
2<br />
(2t + 5) ⋅1<br />
(Notice that 1 is the first value of t for this set of right-hand rectangles)<br />
The set of 10 right-hand rectangles is written as<br />
5<br />
∑<br />
t=<br />
0.5, (step = 0.5)<br />
t<br />
+ ⋅ =<br />
2<br />
(2 5) 0.5<br />
a) Explain why 0.5 is the first t-value for this set of right-hand rectangles.<br />
b) Complete the expanded version of this statement<br />
2 2 2<br />
(2(0.5) + 5) ⋅ 0.5 + (2(1) + 5) ⋅ 0.5 + (2(1.5) + 5) ⋅ 0.5 +<br />
Copyright © 2008 Laying the Foundation ® , Inc. Dallas, TX. All rights reserved. Visit: www.layingthefoundation.org 6
Student Activity<br />
8. You remember that there is a way to do this <strong>with</strong> your calculator, but you cannot remember<br />
the details. Again you call your teacher for assistance, and she reminds you that the calculator<br />
has a set of commands that will allow you to sum a sequence. She tells you to make sure that<br />
your equation is entered in y1 of your calculator and then to go back to the home screen.<br />
On the calculator<br />
last x<br />
∑ f( x) ⋅∆x<br />
is entered as sum(seq (f ( x) × ∆x, x, first x, last x, ∆ x)<br />
) .<br />
first x,(step = ∆x)<br />
For right-hand rectangles<br />
5<br />
∑ y1⋅∆t is entered as sum(seq (y1× ∆xx , , 0+ ∆x, 5, ∆ x))<br />
.<br />
0 +∆t,(step = ∆t)<br />
You decide to check that you understand the process by repeating your calculation of 10<br />
5−0 right-hand rectangles. ∆ t = = .5,<br />
and the first t-value is 0.5.<br />
10<br />
Remember that in your calculator the equation is written as a function of x instead of t.<br />
On a TI83 or a TI84 calculator:<br />
Press 2 nd<br />
Stat List<br />
Arrow over to Math<br />
Choose #5 Sum(<br />
Press 2 nd<br />
Stat List again<br />
Arrow over to OPS<br />
Choose #5 Seq( Your screen now shows sum(seq(<br />
Press VARS<br />
Arrow over to Y-VARS<br />
Choose #1 <strong>Function</strong><br />
Select #1 Y1 Your screen now shows sum(seq(y1<br />
Type × .5,<br />
comma<br />
Complete the statement by typing<br />
x, comma, 0.5, comma, 5, comma, and 0.5, close parenthesis.<br />
Your screen now shows sum(seq (y1×0.5, x , 0.5, 5, 0.5))<br />
Press enter to get the total area <strong>with</strong> 10 rectangles.<br />
Remember that you have coded your data so that you will need to multiply the final answer<br />
by 100 to get back to the original units.<br />
Check to be sure that your answers agree.<br />
Copyright © 2008 Laying the Foundation ® , Inc. Dallas, TX. All rights reserved. Visit: www.layingthefoundation.org 7
9. You decide to try using 20 rectangles.<br />
a) What is the value of ∆ t for 20 rectangles?<br />
b) What is the first t-value for 20 right-hand rectangles?<br />
c) What is the mathematical notation for summing 20 right-hand rectangles?<br />
d) Using your calculator, calculate the amount of water predicted by 20 right-hand<br />
rectangles. Do you still have to move furniture?<br />
Student Activity<br />
10. Continue the process, doubling the number of rectangles, until you can show that the amount<br />
of water in the tank at 1:00 p.m. will be less than 11,000 cubic meters.<br />
a) Your final predicted amount of water is ____________________ .<br />
b) The final number of rectangles used is ___________ .<br />
c) The final width of each rectangle is ____________.<br />
11. Write a summary of the results of the activity that explains the thinking process used to get<br />
the final results.<br />
Copyright © 2008 Laying the Foundation ® , Inc. Dallas, TX. All rights reserved. Visit: www.layingthefoundation.org 8
Connecting Algebra II to Advanced Placement* Mathematics<br />
A Resource and Strategy Guide<br />
<strong>Accumulation</strong> <strong>with</strong> a <strong>Quadratic</strong> <strong>Function</strong><br />
Answers:<br />
1. a) 0 1 2 3 4<br />
5 7 13 23 37<br />
b), c), d)<br />
2. a)<br />
100 cubic meters per hour<br />
60<br />
55<br />
50<br />
45<br />
40<br />
35<br />
30<br />
25<br />
20<br />
15<br />
10<br />
5<br />
0<br />
1 2 3 4 5 6<br />
Hours after 8:00 am<br />
e) Use the table and calculate the difference between each of the y-values. (2, 6, 10, 14)<br />
b)<br />
c)<br />
0 1 2 3 4<br />
5 7 13 23 37<br />
Calculate the second difference between the y values which is always 4. Since the<br />
second difference is the same, the function is quadratic.<br />
y = x +<br />
2<br />
2 5<br />
d) At 1:00 p.m. there the water will be increasing at 5500 m 3<br />
/hour.<br />
e)<br />
Copyright © 2008 Laying the Foundation ® , Inc. Dallas, TX. All rights reserved. Visit: www.layingthefoundation.org 9
3. a) The units will be 100<br />
4. a)<br />
100 cubic meters per hour<br />
3<br />
c) 500 m<br />
3<br />
d) 700 m<br />
60<br />
55<br />
50<br />
45<br />
40<br />
35<br />
30<br />
25<br />
20<br />
15<br />
10<br />
5<br />
3<br />
e) 1300 m<br />
3<br />
f) 2300 m<br />
3<br />
g) 3700 m<br />
100 cubic meters per hour<br />
0<br />
60<br />
55<br />
50<br />
45<br />
40<br />
35<br />
30<br />
25<br />
20<br />
15<br />
10<br />
5<br />
0<br />
3<br />
meters 3<br />
hour = meters<br />
hour<br />
1 2 3 4 5 6<br />
Hours after 8:00 am<br />
h) The total area represents 8500 m 3<br />
.<br />
1 2 3 4 5 6<br />
Hours after 8:00 am<br />
⋅ .<br />
i) This measurement is too small; the rectangles all fall below the curve leaving space<br />
between the curve and the rectangles.<br />
j) The data is coded so that the scale is 100 cubic meters.<br />
Answers<br />
Copyright © 2008 Laying the Foundation ® , Inc. Dallas, TX. All rights reserved. Visit: www.layingthefoundation.org 10
5.<br />
6. a)<br />
3<br />
b) 700 m<br />
3<br />
c) 1300 m<br />
3<br />
d) 2300 m<br />
3<br />
e) 3700 m<br />
3<br />
f) 5500 m<br />
3<br />
g) The total area represents 13,500 m<br />
h) This measurement is too large; the rectangles include space that is above the curve.<br />
Answers<br />
3 3<br />
8,500 m ≤ amount of water ≤ 13,500 m If the amount of water is greater than 11,000 m 3<br />
at 1:00 p.m. the house will probably be flooded.<br />
b) The drawing is similar to the one in 4a <strong>with</strong> widths of 0.5 instead of 1.<br />
3<br />
c) 12,125 m<br />
7. a) Since the rectangles are right-hand rectangles, the height is calculated on the right side of<br />
the rectangle thus 0.5 is the right side of the first rectangle.<br />
b)<br />
0 0.5 1.0 1.5 2.0 2.5 3.0 3.5 4.0 4.5 5.0<br />
5 5.5 7 9.5 13 17.5 23 29.5 37 45.5 55<br />
2<br />
(2(0.5) 5) 0.5<br />
2<br />
(2(1) 5) 0.5<br />
2<br />
(2(1.5) 5) 0.5<br />
2 2 2<br />
(2(2.0) + 5) ⋅ 0.5 + (2(2.5) + 5) ⋅ 0.5 + (2(3.0) + 5) ⋅ 0.5 +<br />
2<br />
(2(3.5) 5) 0.5<br />
2<br />
(2(4.0) 5) 0.5<br />
2<br />
(2(4.5) 5) 0.5<br />
2<br />
(2(5.0) 5) 0.5<br />
2.75+3.5+4.75+6.5+8.75+11.5+14.75+18.5+22.75+27.5 = 121.25 or 12,125 m 3<br />
.<br />
3<br />
8. sum(seq(y1*0.5, x, 0.5, 5, 0.5)) = 121.25 or 12,125 m<br />
5−0 9. a) ∆ t = = .25<br />
20<br />
b) 0.25<br />
+ ⋅ + + ⋅ + + ⋅ +<br />
+ ⋅ + + ⋅ + + ⋅ + + ⋅ =<br />
Copyright © 2008 Laying the Foundation ® , Inc. Dallas, TX. All rights reserved. Visit: www.layingthefoundation.org 11
5<br />
2<br />
c) ∑ ( t )<br />
t=<br />
0.25, (step = 0.25)<br />
2 + 5 × 0.25<br />
Answers<br />
d) 11,468.75 m 3 . This amount is still more than 11,000 m 3<br />
; therefore, the furniture still has<br />
to be moved.<br />
10. a) The sum is 10,990 m<br />
b) 80 rectangles<br />
c) Width 0.0625 hours.<br />
3<br />
11. Mr. Guerrera explained that if the water had not filled more than half of the tank by 1:00 p.m.,<br />
the predicted peak of the flood, that the tank would hold the flood water. In order to calculate<br />
the amount of water that would be collected by 1:00 p.m. Eduardo and I used the flood gauge<br />
data that gave the rate of flow for the water in m 3 /hour. Since we had four data points, we<br />
plotted the curve and predicted that a quadratic function would be a good fit for the data. We<br />
used the graphing calculator to do a quadratic regression on the data, then, <strong>with</strong> this equation,<br />
we predicted the flow rate at 1:00 p.m. to be 5500 m 3 /hour. Using 80 right-hand rectangles of<br />
width 0.0625 hours, we calculated an upper bound for the amount of water that would be in<br />
the tank to be 10,990 m 3 . Since this amount is less than the critical amount of 11,000 m 3<br />
, we<br />
predicted that the tank would safely hold the flood water.<br />
Copyright © 2008 Laying the Foundation ® , Inc. Dallas, TX. All rights reserved. Visit: www.layingthefoundation.org 12