

Economic Freedom World
Economic Freedom World
Economic Freedom World

Create successful ePaper yourself
Turn your PDF publications into a flip-book with our unique Google optimized e-Paper software.
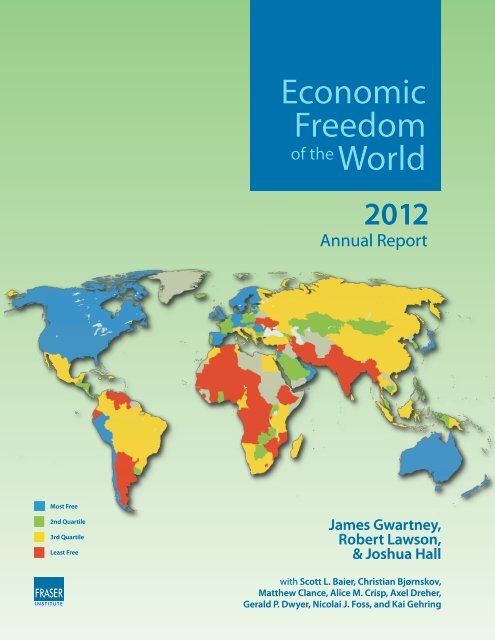
Most Free<br />
2nd Quartile<br />
3rd Quartile<br />
Least Free<br />
<strong>Economic</strong><br />
<strong>Freedom</strong><br />
of the <strong>World</strong><br />
2012<br />
Annual Report<br />
James Gwartney,<br />
Robert Lawson,<br />
& Joshua Hall<br />
with Scott L. Baier, Christian Bjørnskov,<br />
Matthew Clance, Alice M. Crisp, Axel Dreher,<br />
Gerald P. Dwyer, Nicolai J. Foss, and Kai Gehring
<strong>Economic</strong> <strong>Freedom</strong><br />
of the <strong>World</strong><br />
2012 Annual Report<br />
James Gwartney Robert Lawson Joshua Hall<br />
Florida State University Southern Methodist University Beloit College<br />
with<br />
Scott L. Baier Christian Bjørnskov Matthew Clance Alice M. Crisp<br />
Clemson University Aarhus University Clemson University Florida State University<br />
Axel Dreher Gerald P. Dwyer Nicolai J. Foss Kai Gehring<br />
Heidelberg University University of Carlos III Copenhagen Business School University of Göttingen<br />
& Norwegian School of <strong>Economic</strong>s<br />
& Business Administration<br />
2012
Fraser Institute ©2012 • www.fraserinstitute.org • www.freetheworld.com<br />
Copyright ©2012 by the Fraser Institute. All rights reserved. No part of this book may be reproduced in<br />
any manner whatsoever without written permission except in the case of brief quotations embodied in<br />
critical articles and reviews.<br />
The authors of this book have worked independently and opinions expressed by them are, therefore, their<br />
own and do not necessarily reflect the opinions of the supporters, trustees, or staff of the Fraser Institute.<br />
This publication in no way implies that the Fraser Institute, its trustees, or staff are in favor of, or oppose<br />
the passage of, any bill; or that they support or oppose any particular political party or candidate.<br />
Published in cooperation with the <strong>Economic</strong> <strong>Freedom</strong> Network<br />
Editing, design, and typesetting by Lindsey Thomas Martin<br />
Cover design by Bill Ray<br />
Printed and bound in Canada<br />
Data available to researchers<br />
The full data set, including all of the data published in this report as well as data omitted due to limited<br />
space, can be downloaded for free at . The data file available there contains<br />
the most up-to-date and accurate data for the <strong>Economic</strong> <strong>Freedom</strong> of the <strong>World</strong> index. Some variable<br />
names and data sources have evolved over the years since the first publication in 1996; users should<br />
consult earlier editions of <strong>Economic</strong> <strong>Freedom</strong> of the <strong>World</strong> for details regarding sources and descriptions<br />
for those years. All editions of the report are available in PDF and can be downloaded for free from<br />
. However, users are always strongly encouraged<br />
to use the data from this most recent data file as updates and corrections, even to earlier years’ data, do<br />
occur. Users doing long-term or longitudinal studies are encouraged to use the chain-linked index as<br />
it is the most consistent through time. If you have difficulty downloading the data, please contact Fred<br />
McMahon via e-mail to . If you have technical questions about the<br />
data itself, please contact Robert Lawson via e-mail to . Please cite the<br />
data set as:<br />
Authors: James Gwartney, Robert Lawson, and Joshua Hall<br />
Title: 2012 <strong>Economic</strong> <strong>Freedom</strong> Dataset, published in <strong>Economic</strong> <strong>Freedom</strong> of the <strong>World</strong>: 2012 Annual Report<br />
Publisher: Fraser Institute<br />
Year: 2012<br />
URL: <br />
Cite this publication<br />
Authors: James Gwartney, Robert Lawson, and Joshua Hall<br />
Title: <strong>Economic</strong> <strong>Freedom</strong> of the <strong>World</strong>: 2012 Annual Report<br />
Publisher: Fraser Institute<br />
Date of publication: 2012<br />
Digital copy available from and <br />
Publishing history<br />
See page 309 for a list of all volumes of <strong>Economic</strong> <strong>Freedom</strong> of the <strong>World</strong> and associated publications.<br />
Cataloguing Information<br />
Gwartney, James D.<br />
<strong>Economic</strong> freedom of the world … annual report / James D. Gwartney.<br />
Annual.<br />
Description based on: 1997<br />
2012 issue by James Gwartney, Robert Lawson, and Joshua Hall, with Scott L. Baier, Christian Bjørnskov,<br />
Matthew Clance, Alice M. Crisp, Axel Dreher, Gerald P. Dwyer, Nicolai J. Foss, and Kai Gehring.<br />
Issued also online.<br />
ISSN 1482-471X; ISBN 978-0-88975-258-0 (2012 edition).<br />
1. <strong>Economic</strong> history--1990- --Periodicals. 2. <strong>Economic</strong> indicators--Periodicals.<br />
I. Fraser Institute (Vancouver, B.C.) II. Title
Table of Contents<br />
Executive Summary / v<br />
Chapter 1 <strong>Economic</strong> <strong>Freedom</strong> of the <strong>World</strong> in 2010 / 1<br />
Chapter 2 Country Data Tables / 27<br />
Chapter 3 Institutions and <strong>Economic</strong>, Political, and Civil Liberty in Latin America / 173<br />
by Alice M. Crisp and James Gwartney<br />
Chapter 4 Banking Crises and <strong>Economic</strong> <strong>Freedom</strong> / 201<br />
by Scott L. Baier, Matthew Clance, and Gerald P. Dwyer<br />
Chapter 5 Does Aid Buy (<strong>Economic</strong>) <strong>Freedom</strong>? / 219<br />
by Axel Dreher and Kai Gehring<br />
Chapter 6 How Institutions of Liberty Promote Entrepreneurship and Growth / 247<br />
by Christian Bjørnskov and Nicolai J. Foss<br />
Appendix Explanatory Notes and Data Sources / 271<br />
About the Authors / 285<br />
About the Contributors / 286<br />
Acknowledgments / 288<br />
The <strong>Economic</strong> <strong>Freedom</strong> Network / 289<br />
www.freetheworld.com • www.fraserinstitute.org • Fraser Institute ©2012
Fraser Institute ©2012 • www.fraserinstitute.org • www.freetheworld.com
Executive Summary<br />
<strong>Economic</strong> <strong>Freedom</strong> of the <strong>World</strong>: 2012 Annual Report • v<br />
<strong>Economic</strong> <strong>Freedom</strong> of the <strong>World</strong><br />
The index published in <strong>Economic</strong> <strong>Freedom</strong> of the <strong>World</strong> measures the degree to which<br />
the policies and institutions of countries are supportive of economic freedom. The<br />
cornerstones of economic freedom are personal choice, voluntary exchange, freedom<br />
to compete, and security of privately owned property. Forty-two variables are<br />
used to construct a summary index and to measure the degree of economic freedom<br />
in five broad areas:<br />
1 Size of Government;<br />
2 Legal System and Property Rights;<br />
3 Sound Money;<br />
4 <strong>Freedom</strong> to Trade Internationally;<br />
5 Regulation.<br />
An important anniversary<br />
This year is the 100th anniversary of Milton Friedman’s birth. Milton Friedman was<br />
the godfather of <strong>Economic</strong> <strong>Freedom</strong> of the <strong>World</strong>. He believed that, if economic freedom<br />
could be measured with greater accuracy, it would be possible to isolate its<br />
impact on the performance of economies and other factors of interest. This led to<br />
the <strong>Economic</strong> <strong>Freedom</strong> of the <strong>World</strong> project, headed by Milton and Rose Friedman<br />
and Michael Walker, then executive director of the Fraser Institute.<br />
Since our first publication in 1996, numerous studies have used data from<br />
<strong>Economic</strong> <strong>Freedom</strong> of the <strong>World</strong> to examine the impact of economic freedom on<br />
investment, economic growth, income levels, and poverty rates. Virtually without<br />
exception, these studies have found that countries with institutions and policies<br />
more consistent with economic freedom have higher investment rates, more rapid<br />
economic growth, higher income levels, and more rapid reductions in poverty rates.<br />
<strong>Economic</strong> freedom from around the world<br />
• In the chain-linked index, average economic freedom rose from 5.30 (out of 10) in<br />
1980 to 6.88 in 2007. It then fell for two consecutive years, resulting in a score of<br />
6.79 in 2009 but has risen slightly to 6.83 in 2010, the most recent year available.<br />
It appears that responses to the economic crisis have reduced economic freedom<br />
in the short term and perhaps prosperity over the long term, but the upward<br />
movement this year is encouraging.<br />
www.freetheworld.com • www.fraserinstitute.org • Fraser Institute ©2012
vi • <strong>Economic</strong> <strong>Freedom</strong> of the <strong>World</strong>: 2012 Annual Report<br />
• In this year’s index, Hong Kong retains the highest rating for economic freedom,<br />
8.90 out of 10. The other top 10 nations are: Singapore, 8.69; New Zealand, 8.36;<br />
Switzerland, 8.24; Australia, 7.97; Canada, 7.97; Bahrain, 7.94; Mauritius, 7.90;<br />
Finland, 7.88; and Chile, 7.84.<br />
• The rankings (and scores) of other large economies in this year’s index are the United<br />
Kingdom, 12th (7.75); the United States, 18th (7.69); Japan, 20th (7.64); Germany,<br />
31st (7.52); France, 47th (7.32); Italy, 83rd (6.77); Mexico, 91st, (6.66); Russia, 95th<br />
(6.56); Brazil, 105th (6.37); China, 107th (6.35); and India, 111th (6.26).<br />
• The scores of the bottom ten nations in this year’s index are: Venezuela, 4.07;<br />
Myanmar, 4.29; Zimbabwe, 4.35; Republic of the Congo, 4.86; Angola, 5.12;<br />
Democratic Republic of the Congo, 5.18; Guinea-Bissau, 5.23; Algeria, 5.34; Chad,<br />
5.41; and, tied for 10th worst, Mozambique and Burundi, 5.45.<br />
• The United States, long considered the standard bearer for economic freedom<br />
among large industrial nations, has experienced a substantial decline in economic<br />
freedom during the past decade. From 1980 to 2000, the United States was generally<br />
rated the third freest economy in the world, ranking behind only Hong Kong and<br />
Singapore. After increasing steadily during the period from 1980 to 2000, the chainlinked<br />
EFW rating of the United States fell from 8.65 in 2000 to 8.21 in 2005 and<br />
7.70 in 2010. The chain-linked ranking of the United States has fallen precipitously<br />
from second in 2000 to eighth in 2005 and 19 th in 2010 (unadjusted ranking of 18 th ).<br />
Nations that are economically free out-perform<br />
non-free nations in indicators of well-being<br />
• Nations in the top quartile of economic freedom had an average per-capita GDP of<br />
$37,691 in 2010, compared to $5,188 for bottom quartile nations in 2010 current<br />
international dollars (Exhibit 1.7).<br />
• In the top quartile, the average income of the poorest 10% was $11,382, compared<br />
to $1,209 in the bottom in 2010 current international dollars (Exhibit 1.10).<br />
Interestingly, the average income of the poorest 10% in the most economically free<br />
nations is more than twice the overall average income in the least free nations.<br />
• Life expectancy is 79.5 years in the top quartile compared to 61.6 years in the<br />
bottom quartile (Exhibit 1.11).<br />
• Political and civil liberties are considerably higher in economically free nations than<br />
in unfree nations (Exhibit 1.12).<br />
Fraser Institute ©2012 • www.fraserinstitute.org • www.freetheworld.com<br />
Chapter 1: <strong>Economic</strong> <strong>Freedom</strong> of the <strong>World</strong> in 2010<br />
The authors of the report, James Gwartney (Florida State University), Robert<br />
Lawson (Southern Methodist University), and Joshua Hall (Beloit College) provide<br />
an overview of the report and discuss why economic freedom is important.<br />
They also consider the key factors underlying the decline in economic freedom of<br />
the United States since 2000.
<strong>Economic</strong> <strong>Freedom</strong> of the <strong>World</strong>: 2012 Annual Report • vii<br />
Chapter 2: Country Data Tables<br />
Detailed historical information is provided for each of the 144 countries and territories<br />
in the index.<br />
Chapter 3: Institutions and <strong>Economic</strong>, Political,<br />
and Civil Liberty in Latin America<br />
In this chapter, Alice M. Crisp and James Gwartney take a closer look at the economic,<br />
political, and civil institutions of 22 Latin American countries. These institutions<br />
are interrelated and they work as a combination to influence economic<br />
performance. To a large degree, researchers know the bundle of economic institutions<br />
and policies that lead to economic growth and prosperity. But economic<br />
institutions are an outgrowth of the political process. Similarly, civil liberties influence<br />
the public discourse and thereby have an impact on both economic and political<br />
decision-making. The quality of economic and political institutions is generally<br />
related. In Latin America, five countries—Chile, Peru, Panama, Trinidad & Tobago,<br />
and Uruguay—rank in the top eight in both economic and political institutional<br />
quality. Similarly, six countries—Venezuela, Ecuador, Haiti, Bolivia, Guyana, and<br />
Honduras—rank in the bottom eight in both the economic and political categories.<br />
The chapter provides detailed information on the strengths and weaknesses<br />
and changes in the institutional quality of Latin American countries during the<br />
past two decades.<br />
Chapter 4: Banking Crises and <strong>Economic</strong> <strong>Freedom</strong><br />
Scott L. Baier, Matthew Clance, and Gerald P. Dwyer examine the connection<br />
between banking crises and measures of economic freedom from <strong>Economic</strong><br />
<strong>Freedom</strong> of the <strong>World</strong>: 2011 Annual Report. They find that higher economic freedom—more<br />
personal choice, freedom of exchange, and protection of private<br />
property—is associated with a lower probability of a banking crisis. This is contrary<br />
to conventional wisdom that financial “deregulation” contributes to financial<br />
and banking crises. This finding appears in estimates from both a linear probability<br />
and a probit model and is also unaffected by inclusion of the growth of<br />
real Gross Domestic Product (GDP), deposit insurance, time or country dummy<br />
variables, or the level of real GDP. The authors also find that economic freedom<br />
falls after a financial crisis.<br />
Chapter 5: Does Aid Buy (<strong>Economic</strong>) <strong>Freedom</strong>?<br />
In this chapter, Axel Dreher and Kai Gehring survey the literature investigating the<br />
effects of development aid on economic freedom. The authors discuss the theoretical<br />
channels by which development aid can affect freedom and review the existing<br />
empirical literature. Overall, this literature does not establish a final answer to the<br />
question of whether aid works. However, multilateral aid seems to be more effective<br />
in increasing freedom than bilateral aid, and aid disbursed in the period after<br />
the Cold War seems to be more effective as well. This highlights the importance of<br />
changes in the prevailing aid paradigm over time when analyzing the effectiveness<br />
of aid. Moreover, the authors stress that a unified framework is required to conclusively<br />
investigate the effect of aid on freedom, including a common sample and<br />
method of estimation, common control variables, and changing one parameter of<br />
the empirical setup at a time rather than all of them together.<br />
www.freetheworld.com • www.fraserinstitute.org • Fraser Institute ©2012
viii • <strong>Economic</strong> <strong>Freedom</strong> of the <strong>World</strong>: 2012 Annual Report<br />
Fraser Institute ©2012 • www.fraserinstitute.org • www.freetheworld.com<br />
Chapter 6: How Institutions of Liberty Promote<br />
Entrepreneurship and Growth<br />
Christian Bjørnskov and Nicolai J. Foss report on previous research on the links<br />
between institutions of freedom, entrepreneurship, and economic growth and add<br />
some new findings. Specifically, they discuss how economic policy and institutional<br />
design affect entrepreneurship, and how entrepreneurship in turn affects total factor<br />
productivity. In a panel of 25 developed countries observed between 1980 and<br />
2005, they find that government size and sound money positively affect entrepreneurial<br />
activity while legal quality does so negatively. Further evidence shows that<br />
both entrepreneurship and legal quality exert a positive impact on productivity. The<br />
main effects of improvements to economic freedom are mediated through entrepreneurship<br />
and are substantial.<br />
Data available to researchers<br />
The full data set, including all of the data published in this report as well as data omitted<br />
due to limited space, can be downloaded for free at .<br />
The data file available there contains the most up-to-date and accurate data for the<br />
<strong>Economic</strong> <strong>Freedom</strong> of the <strong>World</strong> index. Some variable names and data sources<br />
have evolved over the years since the first publication in 1996; users should consult<br />
earlier editions of <strong>Economic</strong> <strong>Freedom</strong> of the <strong>World</strong> for details regarding sources and<br />
descriptions for those years. All editions of the report are available in PDF and can<br />
be downloaded for free at . However, users are always<br />
strongly encouraged to use the data from this most recent data file as updates and<br />
corrections, even to earlier years’ data, do occur. Users doing long-term or longitudinal<br />
studies are encouraged to use the chain-linked index as it is the most consistent<br />
through time.<br />
If you have difficulty downloading the data, please contact Fred McMahon via<br />
e-mail to . If you have technical questions about the<br />
data itself, please contact Robert Lawson via e-mail to .<br />
Please cite the data set as:<br />
Authors James Gwartney, Robert Lawson, and Joshua Hall<br />
Title 2012 <strong>Economic</strong> <strong>Freedom</strong> Dataset, published in <strong>Economic</strong> <strong>Freedom</strong> of the <strong>World</strong>:<br />
2012 Annual Report<br />
Publisher Fraser Institute<br />
Year 2012<br />
URL .
Chapter 1 <strong>Economic</strong> <strong>Freedom</strong> of the <strong>World</strong> in 2010<br />
This year is the 100 th anniversary of Milton Friedman’s birth. Milton Friedman was the<br />
godfather of the <strong>Economic</strong> <strong>Freedom</strong> of the <strong>World</strong> (EFW) project. He believed that, if<br />
economic freedom could be measured with greater accuracy, this would make it possible<br />
for researchers to identify its impact on economic performance with greater clarity.<br />
This has been the case. Since our first publication in 1996, numerous studies have used<br />
data from <strong>Economic</strong> <strong>Freedom</strong> of the <strong>World</strong> to examine the impact of economic freedom<br />
on investment, economic growth, income levels, and poverty rates. Virtually without<br />
exception, these studies have found that countries with institutions and policies<br />
more consistent with economic freedom have higher investment rates, more rapid<br />
economic growth, higher income levels, and more rapid reduction in poverty rates.<br />
Nonetheless, the battle over the merits of economic freedom continues to rage.<br />
Several high-income economies are now experiencing high unemployment rates,<br />
sluggish growth, and rising levels of government debt. In spite of the evidence to the<br />
contrary, many believe that the financial crisis of 2008 was the result of lax regulation<br />
and insufficient government oversight. Both central planning and Keynesian<br />
economics have made a comeback. Budget deficits have soared recently to historic<br />
highs, and popular Keynesian economists like Paul Krugman argue that the continued<br />
sluggishness merely reflects that the deficits have not been large enough<br />
(Krugman, 2010, July 28). Democratic governments to a large degree centrally plan<br />
key sectors of many western economies, including energy, health care, and education.<br />
Against this background, both the measurement of economic freedom and the<br />
ideas of Milton Friedman are perhaps more relevant than ever before.<br />
What is economic freedom?<br />
The key ingredients of economic freedom are:<br />
• personal choice<br />
• voluntary exchange coordinated by markets;<br />
• freedom to enter and compete in markets; and<br />
• protection of persons and their property from aggression by others.<br />
These four cornerstones imply that economic freedom is present when individuals are<br />
permitted to choose for themselves and engage in voluntary transactions as long as<br />
they do not harm the person or property of others. While individuals have a right<br />
to their own time, talents, and resources, they do not have a right to those of others.<br />
Thus, individuals do not have a right to take things from others or demand that others<br />
provide things for them. Use of violence, theft, fraud, and physical invasions are<br />
www.freetheworld.com • www.fraserinstitute.org • Fraser Institute ©2012
2 • <strong>Economic</strong> <strong>Freedom</strong> of the <strong>World</strong>: 2012 Annual Report<br />
Fraser Institute ©2012 • www.fraserinstitute.org • www.freetheworld.com<br />
not permissible but, otherwise, individuals are free to choose, trade, and cooperate<br />
with others, and compete as they see fit. In an economically free society, the primary<br />
role of government is to protect individuals and their property from aggression by<br />
others. The EFW index is designed to measure the extent to which the institutions<br />
and policies of a nation are consistent with this protective function.<br />
Why is measurement of economic freedom important?<br />
Building on the work of Nobel laureates Friedrich Hayek and Douglass North, there<br />
has been an explosion of research examining the impact of economic, political, and<br />
legal institutions on the performance of economies during the past two decades.<br />
Economists refer to this body of literature as the New Institutional <strong>Economic</strong>s. This<br />
research illustrates that institutions exert a major impact on cross-country differences<br />
in both per capita income and economic growth.1 Other factors, including<br />
cultural characteristics, climate, and location may also be important, but institutional<br />
attributes generally have more explanatory power. Debate continues on the<br />
set of institutions most important for the growth process and the cause and effect<br />
relationships among various economic and political arrangements. Research indicates<br />
that economic institutions exert a stronger and more consistent impact on<br />
economic growth than political democracy. However, the two may be complementary.<br />
Moves toward a more democratic political structure often occur either shortly<br />
before or shortly after economic reforms. This has led to debate about how the<br />
ordering of economic and political reforms influence performance and why reforms<br />
occur in some countries, but not others.<br />
The New Institutional <strong>Economic</strong>s highlights the importance of the <strong>Economic</strong><br />
<strong>Freedom</strong> of the <strong>World</strong> project. The EFW data set provides the most comprehensive<br />
measure of the degree to which countries rely on markets rather than political<br />
decision-making to allocate resources. Obviously, a reliable measure of the degree to<br />
which countries rely on market institutions is central to the ongoing scholarly efforts<br />
to disentangle the importance of both economic and political institutions as determinants<br />
of economic performance, as well as the potential importance of other factors.<br />
How does democracy affect economic freedom?<br />
A larger share of the world’s population now lives in democratic countries than at<br />
any time in history. However, there is little popular understanding of the limitations<br />
of democracy and why, if unconstrained, it is likely to result in outcomes that<br />
most would consider undesirable. A majority vote rule is a highly useful method of<br />
deciding who will carry out the protective functions of government. But, it is quite<br />
another thing to use majority voting to decide how resources will be used in the<br />
economy. As public choice analysis highlights, majoritarian democracy tends to be<br />
shortsighted. It is biased toward the adoption of programs that provide immediate,<br />
highly visible, benefits at the expense of future costs that are difficult to identify. This<br />
shortsighted nature of democratic politics explains why unconstrained democracies<br />
throughout the world are plagued by excessive debt and unfunded promises. Budget<br />
deficits, debt financing, and promises that cannot be kept without higher future<br />
taxes are not an aberration. They are reflective of the incentive structure accompanying<br />
unconstrained democracy.<br />
1 See Acemoglu and Robinson, 2012 for an important recent contribution that focuses on the role<br />
of institutions in the growth and development process.
<strong>Economic</strong> <strong>Freedom</strong> of the <strong>World</strong> in 2010 • 3<br />
Moreover, unconstrained democracy will enhance the power of well-organized<br />
special interests relative to the ordinary citizen. Political incentives will lead politicians<br />
to “trade” favors to interest groups in exchange for political contributions<br />
that will help them win the next election. When the government becomes heavily<br />
involved in activities that provide favors to some at the expense of others, people<br />
will be encouraged to divert resources away from productive activities and toward<br />
lobbying, campaign contributions, and other forms of political favor seeking. All of<br />
these shortcomings tend to corrupt the political process and lead even democratic<br />
governments to adopt counterproductive policies.<br />
However, research also indicates that shifts from authoritarian to democratic<br />
political regimes often precede the adoption of reforms that promote economic<br />
freedom. This raises an interesting possibility: perhaps democracy initially enhances<br />
economic freedom, but with time, this positive impact reverses.2 As democracies<br />
mature, interest groups become more powerful, transfers and subsidies more widespread,<br />
and the share of the citizenry dependent on the government increases. This<br />
suggests that more mature democracies will tend to be characterized by declining<br />
economic freedom, a dependent population, and economic stagnation. Clearly,<br />
these issues are complex and accurate measurement of economic freedom is an<br />
essential element of scholarly research on these vitally important topics.<br />
The <strong>Economic</strong> <strong>Freedom</strong> of the <strong>World</strong> index for 2010<br />
The construction of the index published in <strong>Economic</strong> <strong>Freedom</strong> of the <strong>World</strong> is based<br />
on three important methodological principles. First, objective components are<br />
always preferred to those that involve surveys or value judgments. Given the multidimensional<br />
nature of economic freedom and the importance of legal and regulatory<br />
elements, it is sometimes necessary to use data based on surveys, expert panels, and<br />
generic case studies. To the fullest extent possible, however, the index uses objective<br />
components. Second, the data used to construct the index ratings are from external<br />
sources such as the International Monetary Fund, <strong>World</strong> Bank, and <strong>World</strong> <strong>Economic</strong><br />
Forum that provide data for a large number of countries. Data provided directly from<br />
a source within a country are rarely used, and only when the data are unavailable from<br />
international sources. Importantly, the value judgments of the authors or others in<br />
the <strong>Economic</strong> <strong>Freedom</strong> Network are never used to alter the raw data or the rating of<br />
any country. Third, transparency is present throughout. The report provides information<br />
about the data sources, the methodology used to transform raw data into component<br />
ratings, and how the component ratings are used to construct both the area and<br />
summary ratings. Complete methodological details can be found in the Appendix:<br />
Explanatory Notes and Data Sources (page 271). The entire data set used in the<br />
construction of the index is freely available to researchers at .<br />
Structure of the EFW index<br />
Exhibit 1.1 indicates the structure of the EFW index. The index measures the degree<br />
of economic freedom present in five major areas: [1] Size of Government; [2] Legal<br />
System and Security of Property Rights; [3] Sound Money; [4] <strong>Freedom</strong> to Trade<br />
Internationally; [5] Regulation.<br />
2 This theory is highly consistent with the analysis of Olson, 1982.<br />
www.freetheworld.com • www.fraserinstitute.org • Fraser Institute ©2012
4 • <strong>Economic</strong> <strong>Freedom</strong> of the <strong>World</strong>: 2012 Annual Report<br />
Fraser Institute ©2012 • www.fraserinstitute.org • www.freetheworld.com<br />
Within the five major areas, there are 24 components in this year’s index. Many<br />
of those components are themselves made up of several sub-components. In total,<br />
the index comprises 42 distinct variables. Each component and sub-component is<br />
placed on a scale from 0 to 10 that reflects the distribution of the underlying data.<br />
The sub-component ratings are averaged to determine each component. The component<br />
ratings within each area are then averaged to derive ratings for each of the<br />
five areas. In turn, the five area ratings are averaged to derive the summary rating for<br />
each country. The following section provides an overview of the five major areas.<br />
1 Size of Government<br />
The four components of Area 1 indicate the extent to which countries rely on the<br />
political process to allocate resources and goods and services. When government<br />
spending increases relative to spending by individuals, households, and businesses,<br />
government decision-making is substituted for personal choice and economic freedom<br />
is reduced. The first two components address this issue. Government consumption<br />
as a share of total consumption (1A) and transfers and subsidies as a share<br />
of GDP (1B) are indicators of the size of government. When government consumption<br />
is a larger share of the total, political choice is substituted for personal choice.<br />
Similarly, when governments tax some people in order to provide transfers to others,<br />
they reduce the freedom of individuals to keep what they earn.<br />
The third component (1C) in this area measures the extent to which countries<br />
use private investment and firms rather than government investment and firms to<br />
direct resources. Governments and state-owned enterprises play by rules that are<br />
different from those to which private enterprises are subject. They are not dependent<br />
on consumers for their revenue or on investors for capital. They often operate<br />
in protected markets. Thus, economic freedom is reduced as government enterprises<br />
produce a larger share of total output.<br />
The fourth component (1D) is based on (1Di) the top marginal income tax rate<br />
and (1Dii) the top marginal income and payroll tax rate and the income threshold<br />
at which these rates begin to apply. These two sub-components are averaged to calculate<br />
the top marginal tax rate (1D). High marginal tax rates that apply at relatively<br />
low income levels are also indicative of reliance upon government. Such rates deny<br />
individuals the fruits of their labor. Thus, countries with high marginal tax rates and<br />
low income thresholds are rated lower.<br />
Taken together, the four components of Area 1 measure the degree to which<br />
a country relies on personal choice and markets rather than government budgets<br />
and political decision-making. Therefore, countries with low levels of government<br />
spending as a share of the total, a smaller government enterprise sector, and lower<br />
marginal tax rates earn the highest ratings in this area.<br />
2 Legal System and Property Rights<br />
Protection of persons and their rightfully acquired property is a central element<br />
of economic freedom and a civil society. Indeed, it is the most important function<br />
of government. Area 2 focuses on this issue. The key ingredients of a legal system<br />
consistent with economic freedom are rule of law, security of property rights, an<br />
independent judiciary, and an impartial court system. Components indicating how<br />
well the protective function of government is performed were assembled from three<br />
primary sources: the International Country Risk Guide, the Global Competitiveness<br />
Report, and the <strong>World</strong> Bank’s Doing Business project.
<strong>Economic</strong> <strong>Freedom</strong> of the <strong>World</strong> in 2010 • 5<br />
Exhibit 1.1: Areas, Components, and Sub-components of the EFW Index<br />
1. Size of Government<br />
A. Government consumption<br />
B. Transfers and subsidies<br />
C. Government enterprises and investment<br />
2. Legal System and Property Rights<br />
A. Judicial independence<br />
B. Impartial courts<br />
C. Protection of property rights<br />
D. Military interference in rule of law and politics<br />
E. Integrity of the legal system<br />
3. Sound Money<br />
A. Money growth<br />
B. Standard deviation of inflation<br />
4. <strong>Freedom</strong> to Trade Internationally<br />
A. Tariffs<br />
(i) Revenue from trade taxes (% of trade sector)<br />
(ii) Mean tariff rate<br />
(iii) Standard deviation of tariff rates<br />
B. Regulatory trade barriers<br />
(i) Non-tariff trade barriers<br />
(ii) Compliance costs of importing and exporting<br />
5. Regulation<br />
A. Credit market regulations<br />
(i) Ownership of banks<br />
(ii) Private sector credit<br />
(iii) Interest rate controls/negative real interest rates<br />
B. Labor market regulations<br />
(i) Hiring regulations and minimum wage<br />
(ii) Hiring and firing regulations<br />
(iii) Centralized collective bargaining<br />
(iv) Hours regulations<br />
(v) Mandated cost of worker dismissal<br />
(vi) Conscription<br />
D. Top marginal tax rate<br />
(i) Top marginal income tax rate<br />
(ii) Top marginal income and payroll tax rate<br />
F. Legal enforcement of contracts<br />
G. Regulatory restrictions on the sale of real property<br />
H. Reliability of police<br />
I. Business costs of crime<br />
C. Inflation: most recent year<br />
D. <strong>Freedom</strong> to own foreign currency bank accounts<br />
C. Black-market exchange rates<br />
D. Controls of the movement of capital and people<br />
(i) Foreign ownership/investment restrictions<br />
(ii) Capital controls<br />
(iii) <strong>Freedom</strong> of foreigners to visit<br />
C. Business regulations<br />
(i) Administrative requirements<br />
(ii) Bureaucracy costs<br />
(iii) Starting a business<br />
(iv) Extra payments/bribes/favoritism<br />
(v) Licensing restrictions<br />
(vi) Cost of tax compliance<br />
www.freetheworld.com • www.fraserinstitute.org • Fraser Institute ©2012
6 • <strong>Economic</strong> <strong>Freedom</strong> of the <strong>World</strong>: 2012 Annual Report<br />
Fraser Institute ©2012 • www.fraserinstitute.org • www.freetheworld.com<br />
Security of property rights, protected by the rule of law, provides the foundation<br />
for both economic freedom and the efficient operation of markets. <strong>Freedom</strong><br />
to exchange, for example, is meaningless if individuals do not have secure rights to<br />
property, including the fruits of their labor. When individuals and businesses lack<br />
confidence that contracts will be enforced and the fruits of their productive efforts<br />
protected, their incentive to engage in productive activity is eroded. Perhaps more<br />
than any other area, this area is essential for the efficient allocation of resources.<br />
Countries with major deficiencies in this area are unlikely to prosper regardless of<br />
their policies in the other four areas.<br />
3 Sound Money<br />
Money oils the wheels of exchange. An absence of sound money undermines gains<br />
from trade. As Milton Friedman informed us long ago, inflation is a monetary phenomenon,<br />
caused by too much money chasing too few goods. High rates of monetary<br />
growth invariably lead to inflation. Similarly, when the rate of inflation increases,<br />
it also tends to become more volatile. High and volatile rates of inflation distort relative<br />
prices, alter the fundamental terms of long-term contracts, and make it virtually<br />
impossible for individuals and businesses to plan sensibly for the future. Sound<br />
money is essential to protect property rights and, thus, economic freedom. Inflation<br />
erodes the value of property held in monetary instruments. When governments<br />
finance their expenditures by creating money, in effect, they are expropriating the<br />
property and violating the economic freedom of their citizens.<br />
The important thing is that individuals have access to sound money: who provides<br />
it makes little difference. Thus, in addition to data on a country’s inflation and<br />
its government’s monetary policy, it is important to consider how difficult it is to<br />
use alternative, more credible, currencies. If bankers can offer saving and checking<br />
accounts in other currencies or if citizens can open foreign bank accounts, then<br />
access to sound money is increased and economic freedom expanded.<br />
There are four components to the EFW index in Area 3. All of them are objective<br />
and relatively easy to obtain and all have been included in the earlier editions<br />
of the index. The first three are designed to measure the consistency of monetary<br />
policy (or institutions) with long-term price stability. Component 3D is designed to<br />
measure the ease with which other currencies can be used via domestic and foreign<br />
bank accounts. In order to earn a high rating in this area, a country must follow policies<br />
and adopt institutions that lead to low (and stable) rates of inflation and avoid<br />
regulations that limit the ability to use alternative currencies.<br />
4 <strong>Freedom</strong> to Trade Internationally<br />
In our modern world of high technology and low costs for communication and<br />
transportation, freedom of exchange across national boundaries is a key ingredient<br />
of economic freedom. Many goods and services are now either produced abroad<br />
or contain resources supplied from abroad. Voluntary exchange is a positive-sum<br />
activity: both trading partners gain and the pursuit of the gain provides the motivation<br />
for the exchange. Thus, freedom to trade internationally also contributes substantially<br />
to our modern living standards.<br />
At the urging of protectionist critics and special-interest groups, virtually all<br />
countries adopt trade restrictions of various types. Tariffs and quotas are obvious<br />
examples of roadblocks that limit international trade. Because they reduce the convertibility<br />
of currencies, controls on the exchange rate also hinder international
<strong>Economic</strong> <strong>Freedom</strong> of the <strong>World</strong> in 2010 • 7<br />
trade. The volume of trade is also reduced if the passage of goods through customs<br />
is onerous and time consuming. Sometimes these delays are the result of administrative<br />
inefficiency while in other instances they reflect the actions of corrupt officials<br />
seeking to extract bribes. In both cases, economic freedom is reduced.<br />
The components in this area are designed to measure a wide variety of restraints<br />
that affect international exchange: tariffs, quotas, hidden administrative restraints,<br />
and controls on exchange rates and capital. In order to get a high rating in this area,<br />
a country must have low tariffs, easy clearance and efficient administration of customs,<br />
a freely convertible currency, and few controls on the movement of physical<br />
and human capital.<br />
5 Regulation<br />
When regulations restrict entry into markets and interfere with the freedom to<br />
engage in voluntary exchange, they reduce economic freedom. The fifth area of the<br />
index focuses on regulatory restraints that limit the freedom of exchange in credit,<br />
labor, and product markets. The first component (5A) reflects conditions in the<br />
domestic credit market. One sub-component provides evidence on the extent to<br />
which the banking industry is privately owned. The final two sub-components indicate<br />
the extent to which credit is supplied to the private sector and whether controls<br />
on interest rates interfere with the market in credit. Countries that use a private<br />
banking system to allocate credit to private parties and refrain from controlling<br />
interest rates receive higher ratings for this regulatory component.<br />
Many types of labor-market regulations infringe on the economic freedom of<br />
employees and employers. Among the more prominent are minimum wages, dismissal<br />
regulations, centralized wage setting, extension of union contracts to nonparticipating<br />
parties, and conscription. The labor-market component (5B) is<br />
designed to measure the extent to which these restraints upon economic freedom<br />
are present. In order to earn high marks in the component rating regulation of the<br />
labor market, a country must allow market forces to determine wages and establish<br />
the conditions of hiring and firing, and refrain from the use of conscription.<br />
Like the regulation of credit and labor markets, the regulation of business activities<br />
(component 5C) inhibits economic freedom. The sub-components of 5C are<br />
designed to identify the extent to which regulations and bureaucratic procedures<br />
restrain entry and reduce competition. In order to score high in this portion of the<br />
index, countries must allow markets to determine prices and refrain from regulatory<br />
activities that retard entry into business and increase the cost of producing products.<br />
They also must refrain from “playing favorites,” that is, from using their power<br />
to extract financial payments and reward some businesses at the expense of others.<br />
Construction of Area and Summary ratings<br />
Theory provides us with some direction regarding elements that should be included<br />
in the five areas and the summary index, but it does not indicate what weights should<br />
be attached to the components within the areas or among the areas in the construction<br />
of the summary index. It would be nice if these factors were independent of each<br />
other and a weight could be attached to each of them. During the past several years,<br />
we have investigated several methods of weighting the various components, including<br />
principle component analysis and a survey of economists. We have also invited others<br />
to use their own weighting structure if they believe that it is preferable. In the final analysis,<br />
the summary index is not very sensitive to substantial variations in the weights.<br />
www.freetheworld.com • www.fraserinstitute.org • Fraser Institute ©2012
8 • <strong>Economic</strong> <strong>Freedom</strong> of the <strong>World</strong>: 2012 Annual Report<br />
Fraser Institute ©2012 • www.fraserinstitute.org • www.freetheworld.com<br />
Furthermore, there is reason to question whether the areas (and components)<br />
are independent or work together like the wheels, motor, transmission, drive shaft,<br />
and frame of a car. Just as it is these interconnected parts that provide the mobility of<br />
an automobile, it may be the working of a number of interrelated factors that brings<br />
about economic freedom. Which is more important for the mobility of an automobile:<br />
the motor, wheels, or transmission? The question cannot be easily answered<br />
because the parts work together. If any of these key parts break down, the car is<br />
immobile. Institutional quality may be much the same. If any of the key parts are<br />
absent, the overall effectiveness is undermined.<br />
As the result of these two considerations, we organize the elements of the index<br />
in a manner that seems sensible to us but we make no attempt to weight the components<br />
in any special way when deriving either area or summary ratings. Of course,<br />
the component and sub-component data are available to researchers who would like<br />
to consider alternative weighting schemes and we encourage them to do so.<br />
Changes in this year’s index<br />
Every five years we consider significant revisions that will improve the accuracy<br />
and comprehensiveness of the EFW index. This process has been undertaken during<br />
the past year. We are constantly looking for new data that might improve the<br />
quality of the index. In addition, external data sources might substantially modify<br />
or discontinue a data series used in the EFW index. Thus, while we recognize the<br />
value of continuity, occasional review and modification are necessary and prudent.<br />
There have been 42 variables, organized into 23 components, in the EFW index<br />
since the last major revision five years ago. One component (size of the trade sector)<br />
and one sub-component (foreign bank regulations) were dropped from this year’s<br />
index because of concerns expressed by many, including members of the <strong>Economic</strong><br />
<strong>Freedom</strong> Network, that they were not effectively capturing constraints on economic<br />
freedom. One sub-component (price controls) was dropped from this year’s index<br />
because it is no longer available from its original sources or elsewhere.<br />
We added two new components and one new sub-component to this year’s<br />
report. In Area 2 we are adding two components (2H and 2I) related to crime<br />
and the effectiveness of police. Both new components in this area come from the<br />
<strong>World</strong> <strong>Economic</strong> Forum’s Global Competitiveness Report. In Area 4, we added a<br />
third sub-component to the component measuring international capital market<br />
controls. This new sub-component (4Diii) measures the freedom foreigners have<br />
to visit a country without a travel visa. This revised component (4D) is now called<br />
“Controls on the movement of capital and people”. The three additions along with<br />
the three deletions result in an index that is comprised of 24 components (still<br />
based on 42 variables).<br />
The methodology and basic structure of the index remains unchanged. As in<br />
previous years, the index still has a summary rating and ratings for each of the five<br />
major areas. Areas 1 and 3 remain unchanged. Area 2 has the two new components<br />
for a total of nine components. Area 4 has one fewer component, because the measure<br />
of the size of the trade sector was dropped, but one additional sub-component<br />
(4Diii: <strong>Freedom</strong> of foreigners to visit). In Area 5, Component 5A goes from four to<br />
three sub-components, since consideration of the regulation of foreign banks has<br />
been dropped, and Component 5C goes from seven to six sub-components with<br />
the dropping of the measure of price controls.
<strong>Economic</strong> <strong>Freedom</strong> of the <strong>World</strong> in 2010 • 9<br />
In addition, three countries were added to the index this year: Qatar, Cambodia,<br />
and Saudi Arabia. We expect to add additional countries in the next few years.<br />
Summary <strong>Economic</strong> <strong>Freedom</strong> Ratings for 2010<br />
Exhibit 1.2 presents summary economic freedom ratings, sorted from highest to lowest.<br />
These ratings are for the year 2010, the most recent year for which comprehensive<br />
data are available. Hong Kong and Singapore, once again, occupy the top two<br />
positions. The other nations in the top 10 are New Zealand, Switzerland, Australia,<br />
Canada, Bahrain, Mauritius, Finland, and Chile. The rankings of some other major<br />
countries are the United States (18 th ), Japan (20 th ), Germany (31 st ), Korea (37 th ),<br />
France (47 th ), Italy (83 rd ), Mexico (91 st ), Russia (95 th ), Brazil (105 th ), China (107 th ),<br />
and India (111 th ). It is worth noting that several oil-rich, middle-eastern nations<br />
including Bahrain, United Arab Emirates, Qatar, Kuwait, and Oman score reasonably<br />
well on the index. The 10 lowest-rated countries are Mozambique, Algeria, Guinea-<br />
Bissau, Democratic Republic of Congo, Angola, Republic of Congo, Zimbabwe,<br />
Myanmar, and—in last place—Venezuela. The results for the three newly added<br />
countries are: Qatar (7.70, 17 th ), Cambodia (7.16, 58 th ), and Saudi Arabia (7.06, 65 th ).<br />
The EFW index is calculated back to 1970 as the availability of data allows; see<br />
the Country Data Tables in chapter 2 or our website, ,<br />
for information from past years. Because some data for earlier years may have been<br />
updated or corrected, researchers are always encouraged to use the data from the<br />
most recent annual report to assure the best-quality data.<br />
Area <strong>Economic</strong> <strong>Freedom</strong> Ratings (and Rankings) for 2010<br />
Exhibit 1.3 presents the ratings (and rankings) for each of the five areas of the index<br />
and for Components 5A, 5B, and 5C. A number of interesting patterns emerge from<br />
an analysis of these data. High-income industrial economies generally rank quite<br />
high for Legal System and Property Rights (Area 2), Sound Money (Area 3), and<br />
<strong>Freedom</strong> to Trade Internationally (Area 4). Their ratings were lower, however, for<br />
Size of Government (Area 1) and Regulation (Area 5). This was particularly true<br />
for western European countries.<br />
On the other hand, a number of developing nations have a small fiscal size of<br />
government but rate low in other areas and, as a result, have a low overall rating. The<br />
lesson from this is clear: a small fiscal size of government is insufficient to ensure<br />
economic freedom. The institutions of economic freedom, such as the rule of law<br />
and property rights, as well as sound money, trade openness, and sensible regulation<br />
are also required.<br />
Weakness in the rule of law and property rights is particularly pronounced in sub-<br />
Saharan Africa, among Islamic nations, and for several nations that were part of the<br />
Soviet bloc, though many of the last have made impressive strides toward improvement.<br />
Many nations in Latin America and Southeast Asia also score poorly for rule<br />
of law and property rights. The nations that rank poorly in this category also tend to<br />
score poorly in the trade and regulation areas, even though several have reasonably<br />
sized governments and sound money.<br />
www.freetheworld.com • www.fraserinstitute.org • Fraser Institute ©2012
10 • <strong>Economic</strong> <strong>Freedom</strong> of the <strong>World</strong>: 2012 Annual Report<br />
Exhibit 1.2: Summary <strong>Economic</strong> <strong>Freedom</strong> Ratings for 2010<br />
Hong Kong 1<br />
Singapore 2<br />
New Zealand 3<br />
Switzerland 4<br />
Australia 5<br />
Canada 5<br />
Bahrain 7<br />
Mauritius 8<br />
Finland 9<br />
Chile 10<br />
United Arab Emirates 11<br />
Ireland 12<br />
United Kingdom 12<br />
Estonia 14<br />
Taiwan 15<br />
Denmark 16<br />
Qatar 17<br />
United States 18<br />
Kuwait 19<br />
Cyprus 20<br />
Japan 20<br />
Oman 20<br />
Jordan 23<br />
Peru 24<br />
Malta 25<br />
Norway 25<br />
Austria 27<br />
Lithuania 28<br />
Montenegro 28<br />
Sweden 30<br />
Germany 31<br />
Luxembourg 32<br />
Slovak Republic 33<br />
Spain 34<br />
Armenia 35<br />
Romania 36<br />
Korea, South 37<br />
Netherlands 37<br />
Panama 37<br />
Bahamas 40<br />
Belgium 41<br />
Albania 42<br />
Costa Rica 42<br />
Georgia 42<br />
Bulgaria 45<br />
Rwanda 45<br />
France 47<br />
Poland 48<br />
Zambia 48<br />
Uganda 50<br />
Uruguay 51<br />
Honduras 52<br />
Israel 52<br />
Nicaragua 52<br />
Guatemala 55<br />
El Salvador 56<br />
Fiji 56<br />
Cambodia 58<br />
Czech Republic 58<br />
Portugal 60<br />
Latvia 61<br />
Philippines 61<br />
Dominican Republic 63<br />
Hungary 64<br />
Iceland 65<br />
Saudi Arabia 65<br />
Botswana 67<br />
Papua New Guinea 67<br />
Mongolia 69<br />
Kazakhstan 70<br />
Ghana 71<br />
Malaysia 71<br />
0 2 4 6 8 10<br />
8.90<br />
8.69<br />
8.36<br />
8.24<br />
7.97<br />
7.97<br />
7.94<br />
7.90<br />
7.88<br />
7.84<br />
7.83<br />
7.75<br />
7.75<br />
7.74<br />
7.72<br />
7.71<br />
7.70<br />
7.69<br />
7.66<br />
7.64<br />
7.64<br />
7.64<br />
7.63<br />
7.61<br />
7.57<br />
7.57<br />
7.56<br />
7.54<br />
7.54<br />
7.53<br />
7.52<br />
7.47<br />
7.45<br />
7.43<br />
7.42<br />
7.41<br />
7.40<br />
7.40<br />
7.40<br />
7.36<br />
7.35<br />
7.34<br />
7.34<br />
7.34<br />
7.33<br />
7.33<br />
7.32<br />
7.31<br />
7.31<br />
7.30<br />
7.29<br />
7.24<br />
7.24<br />
7.24<br />
7.21<br />
7.20<br />
7.20<br />
7.16<br />
7.16<br />
7.14<br />
7.12<br />
7.12<br />
7.09<br />
7.08<br />
7.06<br />
7.06<br />
7.03<br />
7.03<br />
7.01<br />
6.97<br />
6.96<br />
6.96<br />
Fraser Institute ©2012 • www.fraserinstitute.org • www.freetheworld.com<br />
Barbados 73<br />
Macedonia 73<br />
Turkey 75<br />
Indonesia 76<br />
Trinidad & Tobago 76<br />
Kenya 78<br />
Jamaica 79<br />
Tunisia 80<br />
Greece 81<br />
Paraguay 81<br />
Italy 83<br />
Croatia 84<br />
Moldova 85<br />
South Africa 85<br />
Thailand 87<br />
Belize 88<br />
Kyrgyz Republic 88<br />
Malawi 88<br />
Mexico 91<br />
Slovenia 92<br />
Bosnia & Herzegovina 93<br />
Namibia 94<br />
Russia 95<br />
Vietnam 96<br />
Colombia 97<br />
Haiti 97<br />
Egypt 99<br />
Sri Lanka 100<br />
Madagascar 101<br />
Morocco 102<br />
Serbia 102<br />
Bolivia 104<br />
Brazil 105<br />
Cameroon 106<br />
China 107<br />
Tanzania 107<br />
Bangladesh 109<br />
Nepal 110<br />
India 111<br />
Iran 111<br />
Pakistan 111<br />
Guyana 114<br />
Benin 115<br />
Azerbaijan 116<br />
Mali 117<br />
Burkina Faso 118<br />
Syria 119<br />
Nigeria 120<br />
Sierra Leone 121<br />
Ukraine 122<br />
Gabon 123<br />
Senegal 123<br />
Lesotho 125<br />
Ecuador 126<br />
Argentina 127<br />
Niger 128<br />
Côte d’Ivoire 129<br />
Central African Rep. 130<br />
Ethiopia 131<br />
Mauritania 132<br />
Togo 133<br />
Burundi 134<br />
Mozambique 134<br />
Chad 136<br />
Algeria 137<br />
Guinea-Bissau 138<br />
Congo, Dem. Rep. of 139<br />
Angola 140<br />
Congo, Republic of 141<br />
Zimbabwe 142<br />
Myanmar 143<br />
Venezuela 144<br />
0 2 4 6 8 10<br />
6.94<br />
6.94<br />
6.92<br />
6.88<br />
6.88<br />
6.87<br />
6.84<br />
6.81<br />
6.78<br />
6.78<br />
6.77<br />
6.76<br />
6.75<br />
6.75<br />
6.70<br />
6.68<br />
6.68<br />
6.68<br />
6.66<br />
6.63<br />
6.61<br />
6.59<br />
6.56<br />
6.54<br />
6.50<br />
6.50<br />
6.49<br />
6.48<br />
6.42<br />
6.41<br />
6.41<br />
6.39<br />
6.37<br />
6.36<br />
6.35<br />
6.35<br />
6.34<br />
6.33<br />
6.26<br />
6.26<br />
6.26<br />
6.24<br />
6.18<br />
6.17<br />
6.12<br />
6.09<br />
6.08<br />
6.07<br />
5.99<br />
5.94<br />
5.88<br />
5.88<br />
5.81<br />
5.80<br />
5.79<br />
5.78<br />
5.76<br />
5.73<br />
5.72<br />
5.67<br />
5.59<br />
5.45<br />
5.45<br />
5.41<br />
5.34<br />
5.23<br />
5.18<br />
5.12<br />
4.86<br />
4.35<br />
4.29<br />
4.07
Exhibit 1.3: Area <strong>Economic</strong> <strong>Freedom</strong> Ratings (Rankings) for 2010<br />
1<br />
Size of<br />
Government<br />
2<br />
Legal System<br />
and Property<br />
Rights<br />
<strong>Economic</strong> <strong>Freedom</strong> of the <strong>World</strong> in 2010 • 11<br />
Areas Components of Area 5<br />
3<br />
Sound<br />
Money<br />
4<br />
<strong>Freedom</strong><br />
to trade<br />
internationally<br />
5<br />
Regulation<br />
5A<br />
Credit market<br />
regulations<br />
5B<br />
Labor market<br />
regulations<br />
5C<br />
Business<br />
regulations<br />
Rating (Rank) Rating (Rank) Rating (Rank) Rating (Rank) Rating (Rank) Rating (Rank) Rating (Rank) Rating (Rank)<br />
Albania 8.04 (15) 5.36 (78) 9.73 (4) 7.30 (64) 6.29 (111) 7.04 (117) 5.93 (89) 5.91 (78)<br />
Algeria 3.65 (142) 4.44 (107) 8.42 (72) 5.65 (136) 4.56 (142) 3.72 (144) 5.17 (116) 4.80 (127)<br />
Angola 4.63 (133) 3.74 (130) 5.57 (140) 6.47 (108) 5.18 (137) 7.38 (113) 3.79 (138) 4.36 (135)<br />
Argentina 6.29 (81) 4.31 (115) 6.59 (118) 6.24 (120) 5.52 (133) 6.57 (124) 5.27 (113) 4.72 (130)<br />
Armenia 7.64 (29) 5.56 (72) 9.18 (47) 7.59 (48) 7.12 (60) 8.80 (60) 6.61 (68) 5.94 (73)<br />
Australia 6.67 (62) 8.09 (13) 9.43 (29) 7.28 (66) 8.40 (11) 9.69 (14) 7.90 (26) 7.60 (25)<br />
Austria 4.90 (127) 8.08 (14) 9.64 (13) 7.66 (43) 7.54 (40) 8.97 (54) 6.33 (80) 7.31 (27)<br />
Azerbaijan 4.88 (129) 5.97 (55) 6.27 (128) 6.79 (91) 6.94 (72) 8.00 (94) 6.86 (61) 5.95 (72)<br />
Bahamas 8.19 (12) 6.57 (40) 7.21 (100) 5.95 (132) 8.89 (5) 8.79 (61) 9.17 (2) 8.73 (2)<br />
Bahrain 6.88 (55) 7.00 (32) 9.18 (48) 7.90 (27) 8.73 (6) 9.00 (51) 8.87 (5) 8.33 (9)<br />
Bangladesh 8.83 (3) 3.61 (132) 6.48 (124) 6.10 (126) 6.69 (91) 8.19 (84) 6.58 (69) 5.32 (112)<br />
Barbados 6.73 (60) 7.79 (18) 6.57 (120) 6.68 (98) 6.91 (75) 7.00 (119) 6.93 (59) 6.81 (43)<br />
Belgium 3.99 (138) 7.08 (30) 9.69 (6) 7.96 (21) 8.00 (21) 9.52 (20) 7.38 (46) 7.11 (35)<br />
Belize 6.44 (72) 4.36 (112) 8.48 (69) 6.23 (121) 7.91 (24) 9.70 (13) 8.18 (18) 5.84 (82)<br />
Benin 7.12 (44) 4.52 (102) 6.80 (113) 5.81 (134) 6.66 (94) 9.23 (37) 5.87 (92) 4.87 (126)<br />
Bolivia 6.31 (78) 4.09 (120) 8.70 (65) 7.00 (82) 5.85 (128) 9.00 (51) 4.54 (130) 4.02 (138)<br />
Bosnia & Herzegovina 5.53 (108) 4.57 (98) 8.27 (77) 7.64 (46) 7.02 (66) 9.49 (24) 6.43 (75) 5.13 (114)<br />
Botswana 5.03 (121) 6.81 (35) 8.33 (74) 7.35 (61) 7.63 (35) 8.87 (57) 7.09 (55) 6.94 (40)<br />
Brazil 6.63 (63) 5.16 (85) 8.00 (84) 7.13 (75) 4.91 (140) 6.53 (125) 4.47 (131) 3.73 (140)<br />
Bulgaria 6.46 (68) 4.99 (90) 9.51 (24) 7.90 (25) 7.76 (30) 9.98 (8) 7.74 (30) 5.57 (101)<br />
Burkina Faso 6.17 (84) 4.33 (114) 6.97 (109) 6.41 (110) 6.58 (99) 6.24 (130) 7.66 (37) 5.83 (83)<br />
Burundi 5.24 (114) 2.98 (137) 6.98 (108) 5.29 (141) 6.76 (86) 7.60 (106) 7.97 (23) 4.70 (131)<br />
Cambodia 7.89 (25) 4.61 (95) 9.26 (42) 7.50 (53) 6.54 (101) 7.03 (118) 7.51 (43) 5.09 (117)<br />
Cameroon 7.98 (21) 4.00 (121) 6.74 (114) 6.51 (106) 6.55 (100) 7.50 (107) 7.53 (41) 4.63 (133)<br />
Canada 6.12 (89) 8.16 (11) 9.46 (26) 7.53 (50) 8.59 (8) 9.30 (33) 8.49 (11) 7.99 (15)<br />
Central African Rep. 7.00 (50) 2.34 (143) 6.95 (110) 6.64 (100) 5.71 (131) 7.43 (111) 3.79 (139) 5.92 (76)<br />
Chad 7.57 (32) 3.08 (136) 5.75 (135) 5.72 (135) 4.94 (139) 6.03 (134) 5.92 (90) 2.87 (143)<br />
Chile 7.77 (27) 7.17 (27) 8.94 (55) 8.20 (10) 7.10 (64) 8.28 (81) 5.79 (96) 7.22 (32)<br />
China 4.98 (123) 6.25 (49) 7.89 (92) 6.57 (104) 6.05 (122) 6.91 (122) 5.57 (106) 5.67 (97)<br />
Colombia 6.13 (87) 4.36 (111) 8.20 (79) 6.82 (90) 6.99 (68) 8.73 (63) 5.88 (91) 6.35 (55)<br />
Congo, Dem. Rep. of 5.19 (116) 2.40 (142) 7.12 (102) 5.41 (139) 5.79 (130) 6.11 (132) 5.67 (101) 5.60 (98)<br />
Congo, Rep. of 5.08 (119) 3.28 (133) 3.91 (143) 6.07 (128) 5.96 (125) 6.10 (133) 6.37 (78) 5.43 (108)<br />
Costa Rica 7.85 (26) 6.11 (54) 8.00 (85) 8.05 (16) 6.71 (89) 7.45 (110) 6.55 (70) 6.13 (64)<br />
Côte d’Ivoire 6.45 (70) 2.95 (138) 6.56 (121) 6.43 (109) 6.41 (108) 9.00 (51) 5.70 (98) 4.54 (134)<br />
Croatia 4.96 (124) 5.76 (63) 8.42 (73) 7.71 (37) 6.95 (70) 9.01 (50) 6.40 (76) 5.45 (106)<br />
Cyprus 6.93 (51) 6.88 (33) 9.44 (28) 8.04 (18) 6.89 (78) 7.82 (100) 6.17 (83) 6.69 (45)<br />
www.freetheworld.com • www.fraserinstitute.org • Fraser Institute ©2012
12 • <strong>Economic</strong> <strong>Freedom</strong> of the <strong>World</strong>: 2012 Annual Report<br />
Exhibit 1.3 (continued): Area <strong>Economic</strong> <strong>Freedom</strong> Ratings (Rankings) for 2010<br />
1<br />
Size of<br />
Government<br />
2<br />
Legal System<br />
and Property<br />
Rights<br />
Fraser Institute ©2012 • www.fraserinstitute.org • www.freetheworld.com<br />
Areas Components of Area 5<br />
3<br />
Sound<br />
Money<br />
4<br />
<strong>Freedom</strong><br />
to trade<br />
internationally<br />
5<br />
Regulation<br />
5A<br />
Credit market<br />
regulations<br />
5B<br />
Labor market<br />
regulations<br />
5C<br />
Business<br />
regulations<br />
Rating (Rank) Rating (Rank) Rating (Rank) Rating (Rank) Rating (Rank) Rating (Rank) Rating (Rank) Rating (Rank)<br />
Czech Republic 4.96 (125) 6.16 (52) 9.45 (27) 7.77 (33) 7.47 (46) 9.22 (38) 7.67 (36) 5.51 (105)<br />
Denmark 3.78 (140) 8.67 (3) 9.60 (16) 7.99 (20) 8.52 (10) 9.69 (15) 7.46 (44) 8.41 (7)<br />
Dominican Republic 8.18 (13) 4.22 (119) 9.24 (45) 7.52 (51) 6.29 (110) 7.15 (114) 6.31 (81) 5.42 (109)<br />
Ecuador 5.63 (102) 3.97 (123) 6.38 (126) 6.88 (88) 6.16 (116) 9.30 (32) 4.21 (135) 4.97 (119)<br />
Egypt 6.58 (66) 5.24 (83) 8.81 (61) 6.33 (116) 5.49 (134) 5.88 (138) 4.90 (121) 5.68 (95)<br />
El Salvador 8.46 (6) 3.84 (129) 9.25 (44) 7.46 (58) 6.97 (69) 8.52 (74) 6.38 (77) 6.01 (68)<br />
Estonia 6.06 (93) 7.29 (25) 9.43 (30) 8.08 (14) 7.84 (26) 9.81 (10) 5.96 (88) 7.74 (21)<br />
Ethiopia 6.10 (91) 5.44 (77) 5.58 (139) 5.41 (138) 6.08 (121) 4.45 (143) 7.59 (40) 6.21 (62)<br />
Fiji 7.51 (34) 5.77 (62) 6.67 (116) 7.07 (78) 8.98 (2) 9.67 (16) 8.98 (4) 8.30 (10)<br />
Finland 4.98 (122) 8.85 (1) 9.62 (15) 7.89 (28) 8.04 (19) 10.00 (1) 5.63 (102) 8.49 (4)<br />
France 4.66 (131) 7.43 (24) 9.67 (9) 7.67 (40) 7.16 (58) 8.52 (73) 5.83 (94) 7.14 (34)<br />
Gabon 5.73 (100) 4.35 (113) 5.65 (137) 6.17 (123) 7.48 (43) 7.10 (116) 8.68 (7) 6.67 (46)<br />
Georgia 6.24 (83) 5.71 (66) 8.80 (62) 8.20 (11) 7.75 (32) 8.18 (85) 7.80 (29) 7.28 (28)<br />
Germany 5.46 (111) 7.97 (16) 9.59 (18) 7.65 (45) 6.93 (73) 7.99 (97) 5.35 (112) 7.46 (26)<br />
Ghana 8.28 (10) 5.58 (71) 7.13 (101) 6.94 (84) 6.87 (79) 8.13 (90) 6.52 (71) 5.96 (70)<br />
Greece 5.80 (96) 5.51 (74) 9.67 (10) 7.52 (52) 5.38 (136) 6.00 (135) 4.36 (133) 5.78 (87)<br />
Guatemala 8.00 (19) 3.93 (126) 9.37 (33) 8.25 (8) 6.49 (102) 9.15 (44) 4.57 (127) 5.74 (89)<br />
Guinea-Bissau 4.46 (135) 2.85 (139) 6.26 (130) 6.12 (125) 6.45 (106) 8.74 (62) 3.32 (141) 7.28 (29)<br />
Guyana 4.28 (136) 4.44 (106) 7.96 (89) 7.07 (77) 7.46 (47) 8.43 (77) 8.05 (19) 5.92 (77)<br />
Haiti 8.48 (5) 2.12 (144) 8.03 (83) 7.17 (71) 6.72 (88) 8.17 (86) 8.20 (16) 3.78 (139)<br />
Honduras 8.21 (11) 4.29 (116) 9.35 (36) 7.60 (47) 6.77 (85) 9.04 (48) 4.98 (119) 6.29 (57)<br />
Hong Kong 8.89 (2) 8.18 (10) 9.31 (38) 9.02 (2) 9.08 (1) 9.37 (27) 9.28 (1) 8.57 (3)<br />
Hungary 3.94 (139) 6.34 (47) 9.60 (17) 7.92 (24) 7.62 (36) 9.28 (34) 7.32 (51) 6.27 (59)<br />
Iceland 4.83 (130) 8.33 (8) 8.42 (71) 6.31 (118) 7.41 (48) 6.33 (127) 7.72 (32) 8.19 (12)<br />
India 6.37 (75) 5.55 (73) 6.42 (125) 6.28 (119) 6.70 (90) 6.97 (120) 8.00 (21) 5.13 (115)<br />
Indonesia 7.90 (23) 4.48 (105) 8.99 (53) 6.74 (93) 6.29 (112) 8.27 (82) 4.66 (125) 5.93 (74)<br />
Iran 6.42 (74) 5.78 (60) 8.53 (68) 5.18 (142) 5.40 (135) 6.31 (129) 4.37 (132) 5.52 (104)<br />
Ireland 5.72 (101) 7.79 (17) 9.48 (25) 8.50 (4) 7.23 (54) 6.00 (135) 7.93 (25) 7.75 (20)<br />
Israel 6.10 (92) 6.16 (53) 8.88 (57) 7.95 (22) 7.11 (61) 9.27 (35) 5.19 (115) 6.88 (42)<br />
Italy 3.68 (141) 5.95 (57) 9.66 (11) 7.66 (42) 6.91 (76) 8.65 (68) 6.48 (72) 5.59 (100)<br />
Jamaica 7.62 (30) 4.88 (92) 7.98 (86) 7.11 (76) 6.59 (98) 6.33 (127) 7.61 (39) 5.83 (84)<br />
Japan 5.80 (97) 7.52 (22) 9.89 (1) 7.16 (73) 7.83 (27) 8.14 (88) 8.30 (14) 7.04 (38)<br />
Jordan 6.92 (52) 6.47 (43) 9.19 (46) 7.79 (32) 7.79 (29) 8.05 (92) 8.41 (13) 6.90 (41)<br />
Kazakhstan 7.09 (45) 5.66 (70) 8.24 (78) 6.37 (111) 7.48 (44) 9.21 (39) 7.14 (54) 6.08 (66)<br />
Kenya 7.04 (48) 4.56 (100) 8.74 (63) 6.87 (89) 7.11 (62) 8.41 (78) 7.52 (42) 5.41 (110)<br />
Korea, South 6.85 (56) 6.50 (41) 9.58 (20) 7.21 (70) 6.86 (80) 9.33 (28) 4.58 (126) 6.66 (47)
Exhibit 1.3 (continued): Area <strong>Economic</strong> <strong>Freedom</strong> Ratings (Rankings) for 2010<br />
1<br />
Size of<br />
Government<br />
2<br />
Legal System<br />
and Property<br />
Rights<br />
<strong>Economic</strong> <strong>Freedom</strong> of the <strong>World</strong> in 2010 • 13<br />
Areas Components of Area 5<br />
3<br />
Sound<br />
Money<br />
4<br />
<strong>Freedom</strong><br />
to trade<br />
internationally<br />
5<br />
Regulation<br />
5A<br />
Credit market<br />
regulations<br />
5B<br />
Labor market<br />
regulations<br />
5C<br />
Business<br />
regulations<br />
Rating (Rank) Rating (Rank) Rating (Rank) Rating (Rank) Rating (Rank) Rating (Rank) Rating (Rank) Rating (Rank)<br />
Kuwait 6.45 (69) 7.10 (29) 9.26 (43) 7.66 (41) 7.81 (28) 10.00 (1) 6.93 (60) 6.51 (51)<br />
Kyrgyz Republic 7.36 (39) 4.39 (108) 8.14 (81) 6.92 (86) 6.61 (97) 7.48 (109) 6.63 (67) 5.71 (92)<br />
Latvia 5.22 (115) 6.40 (46) 8.93 (56) 7.90 (26) 7.14 (59) 8.37 (79) 6.82 (62) 6.23 (61)<br />
Lesotho 5.08 (118) 4.48 (104) 5.82 (134) 6.37 (112) 7.29 (53) 10.00 (1) 7.09 (56) 4.77 (129)<br />
Lithuania 6.79 (57) 6.45 (45) 9.37 (34) 7.49 (54) 7.60 (37) 8.70 (64) 7.65 (38) 6.45 (54)<br />
Luxembourg 4.13 (137) 8.29 (9) 9.35 (35) 8.06 (15) 7.55 (39) 9.15 (43) 5.55 (107) 7.93 (16)<br />
Macedonia 6.11 (90) 5.23 (84) 7.97 (87) 7.29 (65) 8.11 (16) 9.84 (9) 7.85 (28) 6.65 (48)<br />
Madagascar 8.97 (1) 3.10 (135) 7.85 (93) 6.02 (130) 6.16 (115) 7.72 (104) 5.07 (117) 5.70 (94)<br />
Malawi 7.45 (37) 5.47 (76) 6.98 (107) 6.62 (103) 6.90 (77) 8.03 (93) 6.95 (57) 5.71 (91)<br />
Malaysia 6.13 (88) 6.86 (34) 6.52 (123) 7.25 (69) 8.03 (20) 9.12 (46) 7.87 (27) 7.10 (36)<br />
Mali 6.44 (71) 4.49 (103) 6.86 (111) 6.66 (99) 6.14 (118) 8.00 (96) 5.21 (114) 5.22 (113)<br />
Malta 5.80 (98) 7.52 (23) 9.54 (23) 8.15 (13) 6.86 (81) 9.03 (49) 6.76 (63) 4.77 (128)<br />
Mauritania 5.59 (105) 4.60 (96) 5.24 (141) 6.22 (122) 6.69 (92) 8.00 (94) 7.14 (53) 4.92 (124)<br />
Mauritius 7.89 (24) 6.21 (50) 9.28 (40) 8.17 (12) 7.97 (22) 9.52 (21) 7.38 (47) 7.02 (39)<br />
Mexico 7.18 (43) 4.57 (97) 8.07 (82) 6.74 (95) 6.74 (87) 8.65 (69) 5.53 (108) 6.03 (67)<br />
Moldova 7.19 (42) 5.48 (75) 7.38 (96) 6.92 (85) 6.77 (84) 9.13 (45) 5.59 (104) 5.60 (99)<br />
Mongolia 7.45 (36) 5.67 (69) 7.22 (99) 7.26 (68) 7.47 (45) 9.50 (22) 7.23 (52) 5.67 (96)<br />
Montenegro 6.00 (94) 6.47 (42) 9.57 (21) 7.77 (35) 7.90 (25) 9.78 (12) 8.01 (20) 5.91 (79)<br />
Morocco 6.25 (82) 5.97 (56) 7.07 (103) 6.76 (92) 5.99 (123) 7.39 (112) 4.12 (137) 6.47 (53)<br />
Mozambique 4.66 (132) 4.23 (118) 5.86 (133) 6.62 (102) 5.90 (127) 9.20 (40) 2.76 (143) 5.75 (88)<br />
Myanmar 6.33 (77) 3.19 (134) 5.73 (136) 1.78 (144) 4.39 (143) 5.08 (141) — — — —<br />
Namibia 5.60 (104) 6.68 (39) 6.36 (127) 6.36 (114) 7.94 (23) 10.00 (1) 7.69 (35) 6.13 (65)<br />
Nepal 8.34 (8) 3.85 (128) 6.26 (129) 6.74 (94) 6.47 (103) 8.52 (75) 5.81 (95) 5.09 (116)<br />
Netherlands 3.36 (144) 8.10 (12) 9.56 (22) 8.31 (7) 7.67 (33) 8.61 (70) 6.72 (66) 7.68 (22)<br />
New Zealand 5.94 (95) 8.69 (2) 9.73 (3) 8.45 (6) 8.98 (3) 10.00 (1) 8.51 (9) 8.42 (6)<br />
Nicaragua 8.45 (7) 4.53 (101) 8.29 (76) 7.72 (36) 7.19 (57) 9.42 (25) 6.73 (64) 5.43 (107)<br />
Niger 6.79 (58) 3.95 (125) 6.65 (117) 5.56 (137) 5.96 (126) 9.62 (19) 3.30 (142) 4.97 (121)<br />
Nigeria 6.16 (85) 3.95 (124) 6.59 (119) 6.55 (105) 7.11 (63) 8.68 (66) 7.97 (22) 4.67 (132)<br />
Norway 5.55 (107) 8.65 (4) 9.32 (37) 6.98 (83) 7.32 (52) 10.00 (1) 4.34 (134) 7.63 (24)<br />
Oman 5.35 (113) 7.58 (20) 8.86 (59) 7.69 (38) 8.72 (7) 9.63 (17) 8.75 (6) 7.79 (18)<br />
Pakistan 8.68 (4) 4.27 (117) 6.04 (131) 5.87 (133) 6.44 (107) 8.57 (71) 5.68 (99) 5.06 (118)<br />
Panama 8.02 (17) 5.06 (88) 9.04 (51) 8.00 (19) 6.85 (82) 9.18 (41) 5.40 (111) 5.98 (69)<br />
Papua New Guinea 7.34 (40) 4.71 (94) 7.27 (98) 7.46 (56) 8.36 (12) 8.70 (65) 8.64 (8) 7.75 (19)<br />
Paraguay 8.01 (18) 3.63 (131) 8.65 (66) 7.49 (55) 6.15 (117) 8.33 (80) 4.56 (128) 5.54 (102)<br />
Peru 7.53 (33) 5.10 (86) 9.27 (41) 8.60 (3) 7.55 (38) 9.33 (28) 7.36 (49) 5.96 (71)<br />
Philippines 8.31 (9) 4.37 (110) 9.29 (39) 6.69 (97) 6.92 (74) 8.91 (56) 6.02 (87) 5.83 (85)<br />
www.freetheworld.com • www.fraserinstitute.org • Fraser Institute ©2012
14 • <strong>Economic</strong> <strong>Freedom</strong> of the <strong>World</strong>: 2012 Annual Report<br />
Exhibit 1.3 (continued): Area <strong>Economic</strong> <strong>Freedom</strong> Ratings (Rankings) for 2010<br />
1<br />
Size of<br />
Government<br />
2<br />
Legal System<br />
and Property<br />
Rights<br />
Fraser Institute ©2012 • www.fraserinstitute.org • www.freetheworld.com<br />
Areas Components of Area 5<br />
3<br />
Sound<br />
Money<br />
4<br />
<strong>Freedom</strong><br />
to trade<br />
internationally<br />
5<br />
Regulation<br />
5A<br />
Credit market<br />
regulations<br />
5B<br />
Labor market<br />
regulations<br />
5C<br />
Business<br />
regulations<br />
Rating (Rank) Rating (Rank) Rating (Rank) Rating (Rank) Rating (Rank) Rating (Rank) Rating (Rank) Rating (Rank)<br />
Poland 6.35 (76) 6.33 (48) 9.39 (31) 7.27 (67) 7.20 (56) 8.24 (83) 7.42 (45) 5.93 (75)<br />
Portugal 5.52 (110) 6.69 (38) 9.75 (2) 7.93 (23) 5.80 (129) 6.44 (126) 4.67 (124) 6.28 (58)<br />
Qatar 6.59 (65) 7.53 (21) 8.64 (67) 7.68 (39) 8.04 (18) 7.95 (98) 7.69 (34) 8.48 (5)<br />
Romania 7.04 (49) 5.72 (65) 9.02 (52) 7.86 (30) 7.39 (50) 9.38 (26) 6.93 (58) 5.85 (81)<br />
Russia 6.75 (59) 5.27 (80) 8.47 (70) 6.08 (127) 6.24 (114) 7.77 (103) 6.05 (86) 4.90 (125)<br />
Rwanda 5.57 (106) 6.72 (37) 9.05 (49) 7.02 (81) 8.30 (13) 8.55 (72) 8.48 (12) 7.88 (17)<br />
Saudi Arabia 5.04 (120) 7.66 (19) 7.51 (95) 7.04 (79) 8.04 (17) 7.92 (99) 7.96 (24) 8.24 (11)<br />
Senegal 5.40 (112) 4.39 (109) 7.03 (105) 6.50 (107) 6.10 (120) 8.84 (58) 4.55 (129) 4.92 (123)<br />
Serbia 5.78 (99) 4.92 (91) 7.94 (90) 7.03 (80) 6.38 (109) 8.50 (76) 5.70 (97) 4.95 (122)<br />
Sierra Leone 6.68 (61) 4.00 (122) 7.02 (106) 6.12 (124) 6.13 (119) 5.66 (139) 5.67 (100) 7.06 (37)<br />
Singapore 8.06 (14) 8.38 (6) 9.05 (50) 9.05 (1) 8.92 (4) 10.00 (1) 7.72 (31) 9.04 (1)<br />
Slovak Republic 6.29 (80) 5.78 (61) 9.71 (5) 8.04 (17) 7.40 (49) 9.16 (42) 7.33 (50) 5.72 (90)<br />
Slovenia 4.54 (134) 6.20 (51) 8.30 (75) 7.65 (44) 6.47 (104) 7.50 (108) 5.42 (109) 6.49 (52)<br />
South Africa 5.52 (109) 5.70 (67) 8.18 (80) 7.16 (72) 7.21 (55) 8.94 (55) 6.07 (85) 6.62 (49)<br />
Spain 6.15 (86) 6.76 (36) 9.67 (8) 7.77 (34) 6.80 (83) 9.08 (47) 4.72 (123) 6.61 (50)<br />
Sri Lanka 7.08 (46) 5.25 (82) 6.55 (122) 6.90 (87) 6.64 (96) 7.12 (115) 6.44 (73) 6.35 (56)<br />
Sweden 3.60 (143) 8.38 (7) 9.64 (12) 7.88 (29) 8.13 (15) 9.78 (11) 6.43 (74) 8.19 (13)<br />
Switzerland 7.60 (31) 8.55 (5) 9.39 (32) 7.14 (74) 8.54 (9) 9.33 (28) 8.19 (17) 8.10 (14)<br />
Syria 6.52 (67) 5.06 (87) 7.28 (97) 5.99 (131) 5.57 (132) 5.59 (140) 5.58 (105) 5.54 (103)<br />
Taiwan 7.45 (35) 7.02 (31) 9.63 (14) 7.55 (49) 6.94 (71) 8.67 (67) 4.93 (120) 7.22 (33)<br />
Tanzania 5.60 (103) 5.73 (64) 7.71 (94) 6.05 (129) 6.68 (93) 8.83 (59) 5.84 (93) 5.36 (111)<br />
Thailand 7.43 (38) 5.35 (79) 7.06 (104) 6.63 (101) 7.05 (65) 9.27 (36) 5.63 (103) 6.26 (60)<br />
Togo 7.26 (41) 2.55 (140) 6.69 (115) 6.32 (117) 5.11 (138) 6.17 (131) 4.19 (136) 4.97 (120)<br />
Trinidad & Tobago 6.91 (53) 4.56 (99) 7.96 (88) 7.43 (60) 7.52 (42) 9.33 (28) 7.38 (48) 5.86 (80)<br />
Tunisia 7.05 (47) 6.45 (44) 6.85 (112) 6.34 (115) 7.35 (51) 8.12 (91) 6.72 (65) 7.22 (31)<br />
Turkey 6.91 (54) 5.25 (81) 8.86 (60) 7.33 (63) 6.25 (113) 7.79 (101) 4.76 (122) 6.19 (63)<br />
Uganda 7.66 (28) 5.05 (89) 8.71 (64) 7.44 (59) 7.64 (34) 9.49 (23) 7.71 (33) 5.70 (93)<br />
Ukraine 6.62 (64) 4.79 (93) 5.60 (138) 6.72 (96) 5.97 (124) 8.14 (89) 6.08 (84) 3.69 (141)<br />
United Arab Emirates 7.94 (22) 7.27 (26) 7.93 (91) 7.84 (31) 8.18 (14) 7.64 (105) 8.50 (10) 8.40 (8)<br />
United Kingdom 5.18 (117) 7.97 (15) 9.58 (19) 8.48 (5) 7.53 (41) 6.69 (123) 8.24 (15) 7.65 (23)<br />
United States 6.43 (73) 7.14 (28) 9.68 (7) 7.46 (57) 7.76 (31) 6.95 (121) 9.06 (3) 7.26 (30)<br />
Uruguay 6.31 (79) 5.89 (58) 8.98 (54) 8.24 (9) 7.01 (67) 8.15 (87) 6.20 (82) 6.69 (44)<br />
Venezuela 4.96 (126) 2.48 (141) 4.72 (142) 3.91 (143) 4.27 (144) 5.93 (137) 3.61 (140) 3.26 (142)<br />
Vietnam 8.04 (16) 5.88 (59) 5.93 (132) 6.37 (113) 6.46 (105) 9.63 (18) 5.40 (110) 4.35 (136)<br />
Zambia 7.99 (20) 5.70 (68) 8.87 (58) 7.34 (62) 6.64 (95) 7.78 (102) 6.34 (79) 5.80 (86)<br />
Zimbabwe 4.90 (128) 3.90 (127) 2.87 (144) 5.40 (140) 4.70 (141) 4.79 (142) 5.05 (118) 4.25 (137)
The Chain-Linked Summary Index<br />
<strong>Economic</strong> <strong>Freedom</strong> of the <strong>World</strong> in 2010 • 15<br />
The data published in <strong>Economic</strong> <strong>Freedom</strong> of the <strong>World</strong> are available for many countries<br />
back to 1970. Through time, the index has become more comprehensive and<br />
the available data more complete. As a result, the number and composition of the<br />
components for many countries will vary across time. This presents a problem similar<br />
to that confronted when calculating GDP or a price index over time when we<br />
know that the underlying bundle of goods and services is changing from one year<br />
to another. In order to correct for this problem and assure comparability across<br />
time, we have done the same thing that statisticians analyzing national income do:<br />
we have chain-linked the data.<br />
The base year for the chain-linked index is 2000, and as a result the chain-linked<br />
index is not available for any countries added since that year. Changes in a country’s<br />
chain-linked index through time are based only on changes in components<br />
that were present in adjoining years. For example, the 2005 chain-linked rating is<br />
based on the 2004 rating but is adjusted based on the changes in the underlying data<br />
between 2004 and 2005 for those components that were present in both years. If<br />
the common components for a country in 2005 were the same as in 2004, then no<br />
adjustment was made to the country’s 2005 summary rating. However, if the 2005<br />
components were lower than those for 2004 for the components present in both<br />
years, then the country’s 2005 summary rating was adjusted downward proportionally<br />
to reflect this fact.<br />
Correspondingly, in cases where the ratings for the common components were<br />
higher in 2005 than for 2004, the country’s 2005 summary rating was adjusted<br />
upward proportionally. The chain-linked ratings were constructed by repeating this<br />
procedure backward in time to 1970 and forward in time to 2010. The chain-linked<br />
methodology means that a country’s rating will change across time periods only<br />
when there is a change in ratings for components present during adjacent years. This<br />
is precisely what one would want when making comparisons across time periods.<br />
Average chain-linked economic freedom rating<br />
Exhibit 1.4 shows the average chain-linked economic freedom rating for the 102<br />
countries with ratings since 1980. The average level of economic freedom, as measured<br />
by this chain-linked EFW index, has increased from 5.30 in 1980 to 5.76 in<br />
1990 to 6.71 in 2000 and finally to 6.83 in 2010. After seeing the global average drop<br />
for two consecutive years in 2008 and 2009, the average summary rating increased<br />
again in 2010. Much of the long-term increase since 1980 was driven by reductions<br />
in marginal income-tax rates, improvements in monetary policy, eliminations of<br />
military conscription, and global trade liberalization.<br />
Chain-linked summary ratings from 1970 to 2010<br />
The chain-linked summary ratings for all years are found in Exhibit 1.6. The chainlinked<br />
methodology was also used to derive ratings for Area 1 to Area 5 and for<br />
Components 5A, 5B, and 5C. These are shown at the top of the country tables<br />
above the unadjusted ratings. Please note that there can be significant differences<br />
between the unadjusted and the chain-linked ratings; this is especially true for<br />
countries with less complete data in earlier years. Researchers conducting longterm<br />
studies should use the chain-linked data.<br />
www.freetheworld.com • www.fraserinstitute.org • Fraser Institute ©2012
16 • <strong>Economic</strong> <strong>Freedom</strong> of the <strong>World</strong>: 2012 Annual Report<br />
Average Chain-linked EFW Rating<br />
10<br />
9<br />
8<br />
7<br />
6<br />
5<br />
4<br />
3<br />
2<br />
1<br />
0<br />
Big movers<br />
Fraser Institute ©2012 • www.fraserinstitute.org • www.freetheworld.com<br />
Exhibit 1.4: Average Chain-linked EFW Rating for the 102 countries<br />
with ratings since 1980<br />
5.30<br />
1980<br />
5.37<br />
1985<br />
5.76<br />
1990<br />
6.34<br />
1995<br />
6.71 6.82 6.86 6.88 6.80 6.79 6.83<br />
2000<br />
2005<br />
2006<br />
2007<br />
2008<br />
2009<br />
2010<br />
The chain-linked summary ratings are most useful for tracking changes over time.<br />
Since 1990, the chain-linked summary ratings of Uganda, Zambia, and Nicaragua<br />
have increased by 4 points; and many formerly Communist nations, such as Poland,<br />
Bulgaria, Albania, and Romania are among the countries with the sharpest increases<br />
in economic freedom since 1990. In Latin America, Peru and El Salvador have<br />
shown marked improvements as well. In contrast, the summary ratings of Venezuela,<br />
Zimbabwe, United States, and Malaysia fell.3<br />
In the last 10 years, both African and formerly Communist nations—such as<br />
Rwanda, Malawi, and Ghana, and Romania, Bulgaria, and Albania—show the largest<br />
increases in economic freedom. Countries showing the biggest declines since<br />
2000 include Venezuela, Argentina, Iceland, and the United States.<br />
The declining economic freedom of the United States<br />
The United States, long considered the standard bearer for economic freedom among<br />
large industrial nations, has experienced a remarkable plunge in economic freedom<br />
during the past decade. From 1980 to 2000, the United States was generally rated the<br />
third freest economy in the world, ranking behind only Hong Kong and Singapore.<br />
After increasing steadily during the period from 1980 to 2000, the chain-linked EFW<br />
rating of the United States fell from 8.65 in 2000 to 8.21 in 2005 and 7.70 in 2010<br />
(Exhibit 1.5). The chain-linked ranking of the United States has fallen precipitously<br />
from second in 2000 to eighth in 2005 and 19 th in 2010 (unadjusted ranking of 18 th ).<br />
By 2009, the United States had fallen behind Switzerland, Canada, Australia, Chile,<br />
and Mauritius, countries that chose not to follow the path of massive growth in<br />
government financed by borrowing that is now the most prominent characteristic<br />
of US fiscal policy. By 2010, the United States had also fallen behind Finland and<br />
Denmark, two European welfare states. Moreover, it now trails Bahrain, the United<br />
Arab Emirates, Estonia, Taiwan, and Qatar, countries that are not usually perceived of<br />
3 See Chapter 3: Institutions and <strong>Economic</strong>, Political, and Civil Liberty in Latin America (p. 173)<br />
for additional details on the economic and political institutions of Latin American countries.
Average Chain-linked EFW Rating<br />
10<br />
9<br />
8<br />
7<br />
6<br />
5<br />
4<br />
3<br />
2<br />
1<br />
0<br />
<strong>Economic</strong> <strong>Freedom</strong> of the <strong>World</strong> in 2010 • 17<br />
Exhibit 1.5: Average Chain-linked EFW Rating for the United States<br />
from 1980 to 2010<br />
7.92<br />
1980<br />
8.11<br />
1985<br />
8.35 8.50 8.65<br />
1990<br />
1995<br />
2000<br />
8.21 8.13 8.21<br />
2005<br />
2006<br />
2007<br />
2008<br />
2009<br />
2010<br />
as bastions of economic freedom. The United States has now reached a point where<br />
even small additional decreases in the rating will cause large ranking changes because<br />
there are so many more countries clustered in this range of the index.<br />
US ratings have declined in four of the five Areas of the EFW index. The rating<br />
in Legal System and Protection of Property Rights (Area 2) dropped by more than<br />
2 points between 2000 and 2010. While it is difficult to pinpoint the precise reason<br />
for this decline, the increased use of eminent domain to transfer property to powerful<br />
political interests, the ramifications of the wars on terrorism and drugs, and the<br />
violation of the property rights of bondholders in the bailout of automobile companies<br />
have all weakened the United States’ tradition of the rule of law and, we believe,<br />
contributed to the sharp decline of the Area 2 rating. The rating for <strong>Freedom</strong> to Trade<br />
Internationally (Area 4) fell by over one point, and the ratings for Size of Government<br />
(Area 1) and Regulation (Area 5) by more than a half point. The only Area where the<br />
United States’ rating was basically unchanged was Access to Sound Money (Area 3).<br />
Government consumption, transfers and subsidies, and government investment<br />
all rose during the decade, while their private-sector counterparts were lower. These<br />
changes were the major reason underlying the decline in the rating for Area 1. The<br />
time cost of clearing customs increased and government borrowing consumed a substantially<br />
larger share of the credit market, contributing to the rating reductions in<br />
Areas 4 and 5. Some of the declines between 2000 and 2010 in the ratings of individual<br />
components and sub-components were very large. For example, the rating for<br />
Protection of property rights (2C) fell to 6.8 from 9.1. The rating reflecting import and<br />
export compliance costs (4Bii) fell to 7.2 from 9.5. Reflecting the large fiscal deficits<br />
of recent years, the private-sector credit rating (5Aii) plummeted to 0.8 from 9.4. The<br />
rating reflecting burdensome administrative regulations (5Ci) plunged to 4.0 from 7.9.<br />
The approximate one-point decline in the summary rating between 2000 and<br />
2010 on the 10-point scale of the index may not sound like much, but scholarly<br />
work on this topic indicates that a one-point decline is associated with a reduction<br />
in the long-term growth of GDP of between 1.0 and 1.5 percentage points annually<br />
(Gwartney, Holcombe and Lawson, 2006). This implies that, unless policies<br />
undermining economic freedom are reversed, the future annual growth of the US<br />
economy will be half its historic average of 3%.<br />
7.99<br />
7.72 7.70<br />
www.freetheworld.com • www.fraserinstitute.org • Fraser Institute ©2012
18 • <strong>Economic</strong> <strong>Freedom</strong> of the <strong>World</strong>: 2012 Annual Report<br />
Exhibit 1.6: Chain-linked summary ratings from 1970 to 2010<br />
1970 1975 1980 1985 1990 1995 2000 2001 2002 2003 2004 2005 2006 2007 2008 2009 2010<br />
Albania 4.37 5.07 6.23 6.28 6.64 7.13 6.92 7.12 7.31 7.45 7.44 7.47 7.49<br />
Algeria 3.82 3.60 3.43 4.06 4.66 4.68 4.60 4.63 4.76 5.25 5.17 5.02 4.82 4.88 4.88<br />
Argentina 4.36 2.76 3.96 3.30 4.42 7.04 7.40 6.73 6.23 6.09 6.23 5.97 6.09 6.30 6.07 5.95 5.77<br />
Australia 6.96 6.07 6.86 7.17 7.57 7.98 8.07 7.93 7.97 8.11 8.02 8.24 8.28 8.32 8.22 8.20 8.14<br />
Austria 6.08 5.93 6.33 6.34 6.98 7.16 7.55 7.38 7.40 7.96 7.86 7.84 7.81 7.79 7.68 7.62 7.55<br />
Bahamas 6.38 6.26 6.33 6.43 6.41 6.69 6.78 6.75 6.79 6.89 6.85 6.69 6.81 6.79 6.69 6.59<br />
Bahrain 7.42 6.92 6.91 7.21 7.74 7.64 7.62 7.56 7.34 7.39 7.65 7.81 7.72 7.75 7.89<br />
Bangladesh 3.03 3.38 3.68 4.57 5.49 6.02 5.81 5.99 5.89 5.69 6.17 6.34 6.29 6.29 6.51 6.43<br />
Barbados 5.53 5.66 6.10 6.15 6.14 6.20 6.21 6.11 6.12 6.20 6.39 6.22 6.39 6.26 6.28 6.50<br />
Belgium 7.44 6.80 7.06 7.03 7.35 7.43 7.89 7.53 7.48 7.67 7.54 7.53 7.50 7.54 7.46 7.42 7.47<br />
Belize 5.69 5.42 6.10 6.86 6.54 6.48 6.93 6.96 6.90 6.90 6.82 6.81 6.78 6.81 6.68<br />
Benin 5.23 4.98 5.25 4.92 5.49 5.51 5.64 5.59 5.41 5.55 5.85 5.83 5.78 5.81 5.79<br />
Bolivia 4.18 3.44 5.42 6.60 6.97 6.70 6.55 6.49 6.38 6.38 6.40 6.17 6.12 6.34 6.36<br />
Botswana 5.25 5.57 5.92 6.40 7.42 7.39 7.42 7.21 7.24 7.11 7.08 7.58 7.44 7.18 7.24<br />
Brazil 5.10 4.06 3.83 3.28 4.46 4.72 5.93 5.86 6.16 6.01 6.03 6.27 6.21 6.16 6.42 6.32 6.42<br />
Bulgaria 5.02 3.90 4.60 5.37 5.88 6.45 6.69 6.63 6.85 7.00 7.18 7.10 7.24 7.23<br />
Burundi 3.83 3.94 4.37 4.58 3.89 4.73 4.95 4.73 4.50 4.61 4.66 5.00 5.16 4.73 5.22 5.17<br />
Cameroon 5.62 5.73 5.81 5.68 5.92 6.04 6.07 6.10 6.18 6.19 6.27 6.28 6.14 6.28 6.62<br />
Canada 7.91 7.12 7.68 7.78 8.09 8.11 8.36 8.25 8.22 8.33 8.29 8.34 8.31 8.29 8.25 8.14 8.09<br />
Central African Rep. 4.35 4.80 4.39 5.27 5.35 5.21 5.75 5.82 5.48 5.69 5.77 5.70 5.80 6.28<br />
Chad 5.00 5.00 4.96 5.40 5.83 5.90 5.81 5.62 5.30 5.38 5.37 5.36 5.52 5.64<br />
Chile 3.96 3.62 5.38 5.83 6.78 7.53 7.41 7.57 7.70 7.89 7.75 7.92 7.93 8.05 7.96 7.89 7.87<br />
China 3.74 4.74 4.43 5.17 5.75 5.81 5.79 5.87 5.54 5.88 5.98 6.09 6.07 6.12 6.16<br />
Colombia 5.28 4.84 4.74 5.22 5.07 5.59 5.51 5.58 5.57 5.82 5.82 5.84 5.97 6.18 6.12 6.27 6.31<br />
Congo, Dem. Rep. of 4.05 3.49 2.60 3.61 3.03 3.28 3.85 3.73 4.58 4.53 4.55 4.46 5.06 4.76 4.61 4.70 4.96<br />
Congo, Rep. of 4.50 4.31 4.97 5.02 4.28 4.62 4.48 4.72 4.81 4.71 4.81 4.73 4.94 5.19 5.02<br />
Costa Rica 5.92 5.07 5.03 6.64 6.97 7.51 7.32 7.21 7.44 7.20 7.66 7.85 7.67 7.45 7.48 7.44<br />
Côte d’Ivoire 5.39 6.08 5.57 5.20 5.99 5.96 5.82 5.90 5.90 6.11 6.12 6.10 5.86 6.10 5.94<br />
Croatia 5.06 6.35 6.28 6.43 6.54 6.68 6.75 6.82 6.92 7.04 7.05 7.03<br />
Cyprus 5.80 5.53 5.53 6.04 6.41 6.51 6.52 6.98 6.87 7.63 7.55 7.53 7.77 7.73 7.60 7.55<br />
Czech Republic 5.84 6.53 6.56 6.67 6.84 6.89 6.92 6.91 7.14 7.12 7.09 7.08<br />
Denmark 6.84 6.24 6.39 6.53 7.26 7.73 7.92 7.69 7.78 8.06 8.00 7.94 7.96 7.97 7.87 7.64 7.76<br />
Fraser Institute ©2012 • www.fraserinstitute.org • www.freetheworld.com
Exhibit 1.6 (continued): Chain-linked summary ratings from 1970 to 2010<br />
<strong>Economic</strong> <strong>Freedom</strong> of the <strong>World</strong> in 2010 • 19<br />
1970 1975 1980 1985 1990 1995 2000 2001 2002 2003 2004 2005 2006 2007 2008 2009 2010<br />
Dominican Republic 5.16 4.91 4.34 5.99 6.76 6.73 6.69 6.19 5.59 6.53 6.33 6.42 6.39 6.82 6.98<br />
Ecuador 3.87 4.89 5.29 4.38 5.35 6.15 5.82 5.61 6.22 6.21 5.47 5.85 5.93 5.77 5.80 5.79 5.70<br />
Egypt 3.59 4.40 4.86 4.60 5.99 6.81 6.60 6.22 6.10 6.08 6.59 6.72 6.97 6.79 6.69 6.78<br />
El Salvador 4.47 4.19 4.69 7.47 7.69 7.64 7.57 7.61 7.62 7.66 7.75 7.75 7.75 7.52 7.41<br />
Estonia 6.08 7.61 7.67 7.75 7.86 7.81 7.97 7.95 8.02 7.76 7.72 7.75<br />
Fiji 5.28 5.58 5.98 5.73 6.12 6.24 6.12 6.17 6.14 6.13 6.54 6.49 6.49 6.54 6.42 6.46<br />
Finland 6.82 6.16 6.65 6.92 7.24 7.50 7.73 7.61 7.63 7.95 7.87 7.97 7.87 7.91 7.81 7.81 7.89<br />
France 6.63 5.93 6.09 5.99 7.07 7.02 7.31 6.97 7.14 7.38 7.39 7.38 7.38 7.58 7.60 7.47 7.39<br />
Gabon 4.50 5.08 5.47 5.38 5.81 5.64 5.58 5.65 5.68 5.60 5.78 5.69 5.73 5.69 5.66<br />
Germany 7.44 6.85 7.16 7.25 7.65 7.63 7.67 7.45 7.54 7.83 7.73 7.76 7.70 7.61 7.53 7.57 7.53<br />
Ghana 3.64 3.05 3.20 5.06 5.53 5.66 5.78 6.14 6.64 6.36 6.49 7.00 7.01 6.93 7.13 7.09<br />
Greece 6.33 5.86 5.76 5.14 5.99 6.44 6.91 6.79 6.99 7.32 7.26 7.31 7.27 7.13 6.96 6.60 6.73<br />
Guatemala 5.98 6.46 5.87 4.68 5.62 6.96 6.57 6.62 6.80 6.91 6.84 7.15 7.26 7.28 7.17 7.16 7.14<br />
Guinea-Bissau 3.24 3.45 4.43 4.84 4.89 5.10 4.97 5.20 5.50 5.19 5.24 5.66 5.66<br />
Guyana 5.20 6.72 6.65 6.41 6.28 6.01 6.36 6.53 6.74 6.96 6.89 6.75<br />
Haiti 6.51 5.76 5.61 5.59 6.89 6.60 6.56 6.67 6.75 6.77 6.75 6.72 6.88 6.99 6.83<br />
Honduras 5.97 5.38 5.45 6.26 6.68 6.47 6.72 6.78 6.75 6.86 7.19 7.22 7.14 6.96 7.03<br />
Hong Kong 8.69 8.71 9.02 8.63 8.59 9.14 8.86 8.81 8.79 8.84 8.74 8.93 8.94 9.01 9.05 8.95 8.80<br />
Hungary 3.94 4.67 5.04 6.19 6.56 6.90 6.68 7.21 7.35 7.23 7.13 7.14 7.18 7.19 7.10<br />
Iceland 6.13 4.40 5.25 5.53 6.95 7.69 8.04 7.93 7.91 8.05 8.01 8.09 7.96 7.84 7.15 7.02 7.02<br />
India 5.36 4.50 5.35 5.02 5.05 5.80 6.32 6.16 6.39 6.50 6.40 6.89 6.68 6.55 6.55 6.47 6.42<br />
Indonesia 4.54 5.21 5.06 6.14 6.52 6.62 6.07 5.70 6.03 6.38 6.20 6.63 6.69 6.77 6.74 6.78 7.04<br />
Iran 5.80 5.64 3.36 3.83 4.39 4.31 5.90 6.27 6.11 6.21 6.36 6.47 6.34 6.29 6.31 6.41 6.49<br />
Ireland 6.79 5.97 6.47 6.54 7.13 8.29 8.20 8.01 8.06 8.05 8.11 8.41 8.26 8.30 8.20 7.82 7.92<br />
Israel 4.58 3.87 3.48 4.03 4.66 6.04 6.77 6.70 7.20 7.20 7.14 7.37 7.25 7.26 7.22 7.13 7.25<br />
Italy 5.98 5.17 5.37 5.57 6.60 6.66 7.36 7.20 7.29 7.15 7.18 7.33 7.23 6.85 6.76 6.72 6.73<br />
Jamaica 3.92 4.85 5.48 6.65 7.57 7.34 7.38 7.36 7.48 7.62 7.60 7.45 7.25 7.25 6.95<br />
Japan 6.78 6.38 6.88 7.05 7.58 7.50 7.90 7.51 7.46 7.88 7.77 7.83 7.79 7.78 7.65 7.59 7.61<br />
Jordan 5.28 5.32 5.71 5.81 6.45 7.40 7.09 7.41 7.39 7.17 7.61 7.51 7.64 7.41 7.14 7.61<br />
Kenya 4.80 4.63 4.80 5.29 5.43 5.89 6.72 6.80 6.81 6.96 6.59 7.09 7.01 7.05 6.68 6.91 6.91<br />
Korea, South 5.39 5.26 5.49 5.54 6.31 6.67 6.79 7.10 7.15 7.27 7.31 7.26 7.44 7.47 7.26 7.23 7.20<br />
Kuwait 4.99 6.85 5.46 6.93 7.07 7.49 7.58 7.59 7.48 7.46 7.57 7.73 7.46 7.76 7.75<br />
www.freetheworld.com • www.fraserinstitute.org • Fraser Institute ©2012
20 • <strong>Economic</strong> <strong>Freedom</strong> of the <strong>World</strong>: 2012 Annual Report<br />
Exhibit 1.6 (continued): Chain-linked summary ratings from 1970 to 2010<br />
1970 1975 1980 1985 1990 1995 2000 2001 2002 2003 2004 2005 2006 2007 2008 2009 2010<br />
Latvia 5.28 6.96 6.97 7.34 7.18 7.15 7.30 7.43 7.36 7.26 7.11 7.00<br />
Lithuania 5.31 6.60 6.55 6.96 6.97 6.90 7.05 7.05 7.13 6.99 7.10 7.12<br />
Luxembourg 7.48 7.63 7.51 7.83 7.80 7.94 8.02 8.02 7.89 7.93 7.98 7.72 7.70 7.76 7.77 7.68 7.59<br />
Madagascar 4.01 4.59 4.49 4.61 5.96 6.27 5.83 6.03 5.78 5.79 5.89 6.19 6.13 6.22 6.41<br />
Malawi 5.17 4.62 4.96 5.40 4.57 4.95 5.42 5.48 5.89 5.58 5.41 5.58 5.87 6.05 6.14 6.46<br />
Malaysia 6.51 6.29 6.94 7.00 7.40 7.62 6.79 6.39 6.58 6.66 6.69 6.98 6.90 6.97 6.70 6.65 6.94<br />
Mali 5.41 5.73 4.81 5.11 5.22 6.19 5.94 5.59 6.06 5.87 6.03 6.34 6.38 6.04 6.13 6.13<br />
Malta 5.50 5.28 5.48 6.92 6.76 6.73 6.84 6.53 7.45 7.68 7.51 7.81 7.60 7.58 7.62<br />
Mauritius 4.80 4.73 6.12 6.06 7.55 7.60 7.38 7.20 7.11 6.97 7.57 7.41 7.95 8.04 7.93 7.90<br />
Mexico 6.45 5.76 5.13 4.61 6.13 6.43 6.44 6.31 6.64 6.62 6.62 6.87 6.91 6.83 6.77 6.60 6.65<br />
Morocco 5.65 5.07 4.45 5.20 5.18 6.28 6.14 6.14 6.13 6.32 6.15 6.37 6.21 6.33 6.33 6.35 6.36<br />
Myanmar 4.50 4.15 3.13 3.80 3.67 3.44 3.09 3.19 3.67 3.63 3.93 3.52 3.62 3.78 3.89<br />
Namibia 5.11 6.14 6.38 6.35 6.39 6.51 6.24 6.46 6.36 6.57 6.35 6.41 6.40<br />
Nepal 5.49 5.01 5.11 5.15 5.87 5.88 5.83 5.51 5.51 6.18 6.40 6.02 5.88 5.68 5.90<br />
Netherlands 7.04 6.55 7.23 7.28 7.60 7.95 8.21 7.91 7.94 7.88 7.83 7.92 7.84 7.84 7.78 7.58 7.58<br />
New Zealand 6.32 5.69 6.35 6.21 7.82 8.84 8.52 8.39 8.52 8.56 8.56 8.56 8.26 8.50 8.41 8.37 8.38<br />
Nicaragua 3.69 1.78 2.75 5.47 6.69 6.38 6.75 6.80 6.61 6.86 7.00 7.01 6.81 6.76 6.88<br />
Niger 4.63 5.07 5.16 4.33 5.44 5.07 5.03 5.24 5.63 5.62 5.70 5.64 5.59 5.67 5.90<br />
Nigeria 3.55 3.36 3.25 3.68 3.31 3.76 5.30 5.03 5.53 5.57 5.56 6.03 6.42 6.28 5.98 5.84 6.01<br />
Norway 5.93 5.58 5.79 6.46 7.13 7.56 7.27 7.12 7.03 7.60 7.53 7.69 7.54 7.69 7.59 7.56 7.53<br />
Oman 6.78 6.34 6.99 7.53 7.57 7.53 7.58 7.45 7.39 7.42 7.72 7.61 7.71 8.00<br />
Pakistan 4.20 3.54 4.30 4.91 4.87 5.67 5.41 5.42 5.62 5.40 5.41 5.86 5.93 5.89 5.72 5.93 5.94<br />
Panama 6.67 5.55 6.12 6.45 7.44 7.56 7.53 7.52 7.59 7.51 7.60 7.56 7.64 7.13 7.15 7.44<br />
Papua New Guinea 5.89 6.06 6.37 5.83 5.80 5.74 5.69 5.75 6.16 6.14 6.42 6.48 6.53 6.68<br />
Paraguay 5.68 4.82 5.60 6.53 6.44 6.47 6.32 6.27 6.14 6.36 6.33 6.30 6.43 6.49 6.65<br />
Peru 4.42 3.54 3.90 2.61 3.97 6.50 7.30 7.29 7.29 7.30 7.23 7.30 7.33 7.33 7.44 7.43 7.52<br />
Philippines 5.29 5.22 5.33 5.07 5.79 7.30 6.97 6.81 6.92 6.94 6.64 7.00 7.05 6.93 6.82 6.78 7.06<br />
Poland 3.46 3.55 5.37 6.34 6.13 6.45 6.50 6.89 6.89 6.99 7.04 7.14 7.28 7.29<br />
Portugal 5.89 3.73 5.53 5.37 6.25 7.46 7.55 7.41 7.64 7.63 7.65 7.43 7.49 7.46 7.36 7.18 7.22<br />
Romania 4.39 4.31 3.81 5.27 5.24 5.83 6.19 6.17 7.08 6.82 7.33 7.15 7.34 7.27<br />
Russia 4.43 5.15 5.14 5.62 5.73 5.91 6.08 6.09 6.27 6.31 6.23 6.35<br />
Rwanda 5.02 3.78 5.40 5.51 5.85 5.64 5.62 5.85 6.17 6.44 6.75 6.73 7.25<br />
Fraser Institute ©2012 • www.fraserinstitute.org • www.freetheworld.com
Exhibit 1.6 (continued): Chain-linked summary ratings from 1970 to 2010<br />
<strong>Economic</strong> <strong>Freedom</strong> of the <strong>World</strong> in 2010 • 21<br />
1970 1975 1980 1985 1990 1995 2000 2001 2002 2003 2004 2005 2006 2007 2008 2009 2010<br />
Senegal 4.43 5.17 5.31 4.56 5.88 5.65 5.73 5.63 5.67 5.72 5.62 5.73 5.64 5.73 5.63<br />
Sierra Leone 4.97 4.97 3.67 3.86 4.33 5.23 4.99 5.50 5.93 5.77 6.06 6.19 6.62 6.21 6.28 6.43<br />
Singapore 7.61 7.41 7.76 8.00 8.59 8.90 8.61 8.51 8.74 8.68 8.58 8.73 8.64 8.65 8.62 8.59 8.56<br />
Slovak Republic 5.55 6.20 6.53 6.55 6.92 7.47 7.64 7.54 7.55 7.59 7.39 7.46<br />
Slovenia 5.15 6.72 6.91 6.87 6.97 6.93 6.95 7.02 7.02 7.08 7.04 6.62<br />
South Africa 6.30 5.71 5.85 5.49 5.50 6.57 7.08 7.05 7.04 7.20 7.02 7.00 6.94 6.95 6.67 6.61 6.88<br />
Spain 6.41 5.85 6.10 6.08 6.57 7.25 7.54 7.26 7.31 7.72 7.65 7.60 7.55 7.52 7.44 7.32 7.40<br />
Sri Lanka 4.77 4.95 4.81 6.07 6.16 6.12 6.08 6.26 6.05 6.21 6.39 6.20 6.04 6.15 6.25<br />
Sweden 5.51 5.35 5.68 6.47 7.11 7.28 7.62 7.31 7.56 7.70 7.51 7.59 7.54 7.53 7.49 7.48 7.62<br />
Switzerland 7.45 7.46 7.99 8.15 8.15 8.19 8.63 8.37 8.53 8.42 8.32 8.19 8.17 8.20 8.02 8.04 8.07<br />
Syria 3.96 4.19 3.31 3.07 3.53 4.23 4.92 5.20 4.83 4.76 5.23 5.46 5.20 5.46 5.27 5.46 5.53<br />
Taiwan 6.65 5.83 6.58 6.84 7.30 7.41 7.45 7.34 7.53 7.54 7.62 7.70 7.74 7.67 7.63 7.54 7.81<br />
Tanzania 4.41 3.19 3.65 3.47 3.87 5.43 6.07 6.14 5.94 5.98 6.03 6.44 6.56 6.47 6.36 6.22 6.44<br />
Thailand 6.05 6.01 6.09 6.17 6.83 7.18 6.51 6.16 6.63 6.68 6.56 6.68 6.80 6.80 6.78 6.69 6.66<br />
Togo 4.07 5.15 5.73 5.46 5.81 5.99 6.16 5.93 5.76 6.13 6.29 5.57 5.55 5.56 5.79<br />
Trinidad & Tobago 4.57 4.83 4.80 5.52 7.29 7.55 7.49 7.33 7.21 7.08 7.14 7.25 7.26 7.20 7.06 6.90<br />
Tunisia 4.54 4.57 4.82 4.60 5.32 5.73 6.08 6.08 5.94 5.94 5.96 6.02 6.36 6.35 6.28 6.26 6.21<br />
Turkey 3.49 3.87 3.77 4.85 5.06 5.89 5.81 5.20 5.48 5.93 6.07 6.09 6.20 6.33 6.65 6.57 6.56<br />
Uganda 3.14 2.82 2.86 5.15 6.83 6.76 6.90 7.00 6.92 7.13 7.29 7.41 7.38 7.31 7.47<br />
Ukraine 3.39 4.56 4.69 5.32 5.22 5.43 5.74 5.87 5.84 5.79 5.82 5.87<br />
United Arab Emirates 6.03 6.83 7.20 6.95 7.28 7.30 7.52 7.43 7.26 7.50 7.65 7.74 7.70 7.42 7.61<br />
United Kingdom 5.98 5.92 6.57 7.53 8.08 8.20 8.50 8.38 8.41 8.52 8.38 8.38 8.25 8.15 8.08 7.97 7.87<br />
United States 7.60 7.73 7.92 8.11 8.35 8.50 8.65 8.44 8.40 8.36 8.37 8.21 8.13 8.21 7.99 7.72 7.70<br />
Uruguay 6.07 5.97 6.34 6.47 7.08 6.85 7.09 6.92 7.00 7.02 6.98 7.08 7.12 7.16 7.25<br />
Venezuela 7.31 6.17 6.69 6.08 5.69 4.40 5.83 5.71 4.57 4.18 4.57 4.52 4.54 4.15 4.10 4.16 3.88<br />
Zambia 4.00 4.60 3.54 3.09 4.76 6.90 6.75 6.78 7.02 7.08 7.37 7.74 7.85 7.76 7.79 7.85<br />
Zimbabwe 4.57 4.51 4.83 5.77 4.60 3.64 3.63 3.71 3.24 2.88 2.94 3.19 4.30 4.32 4.26<br />
www.freetheworld.com • www.fraserinstitute.org • Fraser Institute ©2012
22 • <strong>Economic</strong> <strong>Freedom</strong> of the <strong>World</strong>: 2012 Annual Report<br />
Fraser Institute ©2012 • www.fraserinstitute.org • www.freetheworld.com<br />
<strong>Economic</strong> freedom and human progress<br />
As is customary, this chapter concludes with some graphs illustrating simple relationships<br />
between economic freedom and various other indicators of human and<br />
political progress (Exhibits 1.7–1.12, pp. 22–24). The graphs use the average of the<br />
chain-linked EFW index for the period from 1990 to 2010, breaking the data into<br />
four quartiles ordered from low to high. Because persistence is important and the<br />
impact of economic freedom will be felt over a lengthy time period, it is better to<br />
use the average rating over a fairly long time span rather than the current rating to<br />
observe the impact of economic freedom on performance.<br />
The graphs begin with the data on the relationship between economic freedom<br />
and the level of per-capita GDP and economic growth. In recent years, numerous<br />
scholarly studies have analyzed these relationships in detail and, almost without<br />
exception, have found that countries with higher and improving economic freedom<br />
grow more rapidly and achieve higher levels of per-capita GDP.<br />
Many of the relationships illustrated in the graphs below reflect the impact of<br />
economic freedom as it works through increasing economic growth. In other cases,<br />
the observed relationships may reflect the fact that some of the variables that influence<br />
economic freedom may also influence political factors like trust, honesty in<br />
government, and protection of civil liberties. Thus, we are not necessarily arguing<br />
that there is a direct causal relation between economic freedom and the variables<br />
considered below. In other words, these graphics are no substitute for real, scholarly<br />
investigation that controls for other factors. Nonetheless, we believe that the<br />
graphs provide some insights about the contrast between the nature and characteristics<br />
of market-oriented economies and those dominated by government regulation<br />
and planning. At the very least, these figures suggest potential fruitful areas<br />
for future research.
Exhibit 1.7: <strong>Economic</strong> <strong>Freedom</strong> and Income per Capita, 2010<br />
Countries with more economic<br />
freedom have substantially higher<br />
per-capita incomes.<br />
Sources: Fraser Institute, <strong>Economic</strong><br />
<strong>Freedom</strong> of the <strong>World</strong>: 2012 Annual<br />
Report; <strong>World</strong> Bank, <strong>World</strong> Development<br />
Indicators 2011.<br />
GDP per capita, 2010<br />
(current international $)<br />
40,000<br />
35,000<br />
30,000<br />
25,000<br />
20,000<br />
15,000<br />
10,000<br />
5,000<br />
0<br />
$5,188<br />
Least Free<br />
$6,596<br />
Exhibit 1.8: <strong>Economic</strong> <strong>Freedom</strong> and <strong>Economic</strong> Growth, 1990–2010<br />
Countries with more economic<br />
freedom tend to grow more rapidly.<br />
Sources: Fraser Institute, <strong>Economic</strong><br />
<strong>Freedom</strong> of the <strong>World</strong>: 2012 Annual<br />
Report; <strong>World</strong> Bank, <strong>World</strong> Development<br />
Indicators 2011.<br />
Note: The growth data were adjusted to<br />
control for the initial level of income.<br />
Growth (%) in GDP per capita<br />
4.0<br />
3.5<br />
3.0<br />
2.5<br />
2.0<br />
1.5<br />
1.0<br />
0.5<br />
0.0<br />
1.58%<br />
Least Free<br />
<strong>Economic</strong> <strong>Freedom</strong> of the <strong>World</strong> in 2010 • 23<br />
$16,957<br />
Third Second<br />
<strong>Economic</strong> <strong>Freedom</strong> Quartile<br />
2.38%<br />
2.78%<br />
Third Second<br />
<strong>Economic</strong> <strong>Freedom</strong> Quartile<br />
Exhibit 1.9: <strong>Economic</strong> <strong>Freedom</strong> and the Income Share of the Poorest 10%, 2000–2010<br />
The share of income earned by the<br />
poorest 10% of the population is<br />
unrelated to economic freedom.<br />
Sources: Fraser Institute, <strong>Economic</strong><br />
<strong>Freedom</strong> of the <strong>World</strong>: 2012 Annual<br />
Report; <strong>World</strong> Bank, <strong>World</strong> Development<br />
Indicators 2011.<br />
Income Share (%)<br />
3.0<br />
2.5<br />
2.0<br />
1.5<br />
1.0<br />
0.5<br />
0.0<br />
2.56%<br />
Least Free<br />
2.37%<br />
2.26%<br />
Third Second<br />
<strong>Economic</strong> <strong>Freedom</strong> Quartile<br />
$37,691<br />
Most Free<br />
3.56%<br />
Most Free<br />
2.75%<br />
Most Free<br />
www.freetheworld.com • www.fraserinstitute.org • Fraser Institute ©2012
24 • <strong>Economic</strong> <strong>Freedom</strong> of the <strong>World</strong>: 2012 Annual Report<br />
Exhibit 1.10: <strong>Economic</strong> <strong>Freedom</strong> and the Income Level of the Poorest 10%, 2010<br />
The amount of income, as opposed<br />
to the share, earned by the poorest<br />
10% of the population is much<br />
higher in countries with higher<br />
economic freedom.<br />
Sources: Fraser Institute, <strong>Economic</strong><br />
<strong>Freedom</strong> of the <strong>World</strong>: 2012 Annual<br />
Report; <strong>World</strong> Bank, <strong>World</strong> Development<br />
Indicators 2011.<br />
Exhibit 1.11: <strong>Economic</strong> <strong>Freedom</strong> and Life Expectancy, 2010<br />
Life expectancy is about 20 years<br />
longer in countries with the<br />
most economic freedom than in<br />
countries with the least.<br />
Sources: Fraser Institute, <strong>Economic</strong><br />
<strong>Freedom</strong> of the <strong>World</strong>: 2012 Annual<br />
Report; <strong>World</strong> Bank, <strong>World</strong> Development<br />
Indicators 2011.<br />
Exhibit 1.12: <strong>Economic</strong> <strong>Freedom</strong> and Political Rights and Civil Liberties<br />
Greater economic freedom is<br />
associated with more political<br />
rights and civil liberties.<br />
Sources: Fraser Institute, <strong>Economic</strong><br />
<strong>Freedom</strong> of the <strong>World</strong>: 2012 Annual Report;<br />
<strong>Freedom</strong> House, <strong>Freedom</strong> in the <strong>World</strong> 2011.<br />
Note: Political rights and civil liberties<br />
are measured on a scale from 1 to 7:<br />
1 = the highest degree of political rights<br />
and civil liberties; 7 = the lowest.<br />
Income earned per capita by poorest<br />
10%, 2010 (current international $, est.)<br />
Life Expectancy at birth,<br />
total (years), 2010<br />
12,000<br />
10,000<br />
8,000<br />
6,000<br />
4,000<br />
2,000<br />
Political Rights and Civil Liberties<br />
10<br />
0<br />
Fraser Institute ©2012 • www.fraserinstitute.org • www.freetheworld.com<br />
0<br />
90<br />
80<br />
70<br />
60<br />
50<br />
40<br />
30<br />
20<br />
17<br />
26<br />
35<br />
4<br />
53<br />
62<br />
71<br />
$1,209<br />
Least Free<br />
Least Free<br />
4.6<br />
61.6<br />
4.4<br />
Least Free<br />
$1,733<br />
Third Second<br />
<strong>Economic</strong> <strong>Freedom</strong> Quartile<br />
67.2<br />
Third Second<br />
<strong>Economic</strong> <strong>Freedom</strong> Quartile<br />
3.4 3.3<br />
$3,402<br />
73.7<br />
2.1 2.4<br />
Third Second<br />
<strong>Economic</strong> <strong>Freedom</strong> Quartile<br />
$11,382<br />
Most Free<br />
79.5<br />
Most Free<br />
1.7 1.6<br />
Pol Civ Pol Civ Pol Civ Pol Civ<br />
Most Free
References<br />
<strong>Economic</strong> <strong>Freedom</strong> of the <strong>World</strong> in 2010 • 25<br />
Acemoglu, Daron, and James Robinson (2012). Why Nations Fail. Crown.<br />
Gwartney, James, Randall Holcombe, and Robert Lawson (2006). Institutions<br />
and the Impact of Investment on Growth. Kyklos 59, 2: 255–276.<br />
Krugman, Paul (2010, July 28). How Did We Know the Stimulus Was<br />
Too Small? New York Times: .<br />
Olson, Mancur (1982). The Rise and Decline of Nations: <strong>Economic</strong> Growth,<br />
Stagflation, and Social Rigidities. Yale University Press.<br />
<strong>World</strong> Bank (2011). <strong>World</strong> Development Indicators 2011. .<br />
<strong>Freedom</strong> House (2011). <strong>Freedom</strong> in the <strong>World</strong> 2011: The Authoritarian Challenge to<br />
Democracy. .<br />
www.freetheworld.com • www.fraserinstitute.org • Fraser Institute ©2012
26 • <strong>Economic</strong> <strong>Freedom</strong> of the <strong>World</strong>: 2012 Annual Report<br />
Data available to researchers<br />
Fraser Institute ©2012 • www.fraserinstitute.org • www.freetheworld.com<br />
The full data set, including all of the data published in this report as well as data<br />
omitted due to limited space, can be downloaded for free at . The data file available there contains the most up-to-date and accurate data for<br />
the <strong>Economic</strong> <strong>Freedom</strong> of the <strong>World</strong> index. Some variable names and data sources<br />
have evolved over the years since the first publication in 1996; users should consult<br />
earlier editions of <strong>Economic</strong> <strong>Freedom</strong> of the <strong>World</strong> for details regarding sources and<br />
descriptions for those years. All editions of the report are available in PDF and can<br />
be downloaded for free at . However, users are always<br />
strongly encouraged to use the data from this most recent data file as updates and<br />
corrections, even to earlier years’ data, do occur. Users doing long-term or longitudinal<br />
studies are encouraged to use the chain-linked index as it is the most consistent<br />
through time.<br />
If you have difficulty downloading the data, please contact Fred McMahon via<br />
e-mail to . If you have technical questions about the<br />
data itself, please contact Robert Lawson via e-mail to .<br />
Please cite the data set as:<br />
Authors James Gwartney, Robert Lawson, and Joshua Hall<br />
Title 2012 <strong>Economic</strong> <strong>Freedom</strong> Dataset, published in <strong>Economic</strong> <strong>Freedom</strong> of the <strong>World</strong>:<br />
2012 Annual Report<br />
Publisher <strong>Economic</strong> <strong>Freedom</strong> Network<br />
Year 2012<br />
URL <br />
Published work using research ratings<br />
from <strong>Economic</strong> <strong>Freedom</strong> of the <strong>World</strong><br />
A list of published papers that have used the economic freedom ratings from<br />
<strong>Economic</strong> <strong>Freedom</strong> of the <strong>World</strong> is available on line at . In most cases, a brief abstract of the article is provided. If you know<br />
of any other papers current or forthcoming that should be included on this page,<br />
or have further information about any of these papers or authors, please write to<br />
.
Chapter 2 Country Data Tables<br />
This chapter presents detailed data on the compo nents used in constructing the<br />
EFW index for the 144 countries included in this study. For each country for which<br />
data were available, we present the overall EFW index rating and the rank of that<br />
country for the years 1980, 1985, 1990, 1995, 2000, 2005, 2009, and 2010. (Ratings<br />
are also available for many countries for 1970, 1975, 2001, 2002, 2003, 2004, 2006,<br />
2007, and 2008, but these data are not shown in the tables because of limited space.)<br />
Like all the ratings in the index, these are values out of 10; 10 is the highest possible<br />
rating and zero (0) is the lowest. A higher rating indicates a greater degree of economic<br />
freedom.<br />
Chain-Linked The country data tables show both unadjusted and chain-linked ratings<br />
and ranks. See chapter 1 for a full explanation of the chain-linked method. The<br />
top row under the “Chain-linked” section shows the country’s chain-linked summary<br />
rating for each year and, in parentheses, its overall rank. In the rows below,<br />
titles on the left in bold face indicate the five areas of economic freedom that are<br />
combined to generate an overall rating. The cells to their right give the chain-linked<br />
rating and, in parentheses, the rank for that par ticular area for each year.<br />
Unadjusted The top row under the “Unadjusted” section shows the country’s summary<br />
rating for each year and, in parentheses, its overall rank. In the rows below,<br />
titles on the left in bold face indicate the five areas of economic freedom that are<br />
combined to generate an overall score. The cells to their right give the rating for that<br />
area for each year. Underneath each area title are the titles of the components and<br />
sub-components that are combined to generate that area’s score. In these rows are<br />
the scores for each year presented, where data are available. Shown in italic beside<br />
some scores are the actual data used to derive that particular component rating.<br />
For some countries, data for other components for certain years may be reported<br />
even though there were insufficient data to compute area or summary ratings. A<br />
more complete description of each compo nent, including the methodology used<br />
to calculate the ratings, can be found in the Appen dix: Explanatory Notes and Data<br />
Sources (p. 271).<br />
www.freetheworld.com • www.fraserinstitute.org • Fraser Institute ©2012
28 • <strong>Economic</strong> <strong>Freedom</strong> of the <strong>World</strong>: 2012 Annual Report<br />
Albania<br />
Fraser Institute ©2012 • www.fraserinstitute.org • www.freetheworld.com<br />
1980 1985 1990 1995 2000 2005 2009 2010<br />
Chain-Linked Rating (Rank) Rating (Rank) Rating (Rank) Rating (Rank) Rating (Rank) Rating (Rank) Rating (Rank) Rating (Rank)<br />
Summary Rating (Rank) 4.37 (97) 5.07 (97) 6.23 (77) 7.12 (51) 7.47 (31) 7.49 (32)<br />
Area 1. Size of Government 3.51 (102) 6.54 (40) 7.63 (18) 8.89 (5) 8.55 (8) 8.89 (2)<br />
Area 2. Legal System and Property Rights 5.25 (50) 5.21 (58) 4.85 (89) 4.77 (84) 5.22 (76) 6.14 (60) 5.82 (64)<br />
Area 3. Sound Money 4.89 (94) 4.90 (91) 3.26 (105) 7.40 (71) 9.64 (9) 9.63 (7) 9.73 (4)<br />
Area 4. <strong>Freedom</strong> to Trade Internationally 6.24 (72) 5.88 (89) 6.29 (85) 7.20 (59) 7.25 (56)<br />
Area 5. Regulation 2.62 (112) 4.57 (103) 5.47 (100) 5.69 (101) 5.94 (102) 5.88 (105)<br />
Unadjusted<br />
Summary Rating (Rank) 4.60 (90) 4.98 (97) 6.19 (77) 6.98 (64) 7.32 (41) 7.34 (42)<br />
Rating (Data) Rating (Data) Rating (Data) Rating (Data) Rating (Data) Rating (Data) Rating (Data) Rating (Data)<br />
Area 1. Size of Government 4.19 6.54 7.63 8.04 7.73 8.04<br />
A. Government consumption 7.70 (13.81) 7.83 (13.39) 4.87 (23.44) 7.78 (13.55) 9.10 (9.07) 8.99 (9.42) 9.08 (9.13) 9.29 (8.41)<br />
B. Transfers and subsidies 3.51 (24.30) 7.85 (8.40) 7.80 (8.57) 9.66 (1.73) 7.35 (10.21) 7.39 (10.09)<br />
C. Government enterprises and investment 4.00 (39.00) 6.00 (26.70) 8.00 (19.45) 6.00 (28.93) 7.00 (21.28)<br />
D. Top marginal tax rate 5.50 8.50 8.50<br />
(i) Top marginal income tax rate 9.00 (25) 10.00 (10) 10.00 (10)<br />
(ii) Top marginal income and payroll tax rate 2.00 (51) 7.00 (35) 7.00 (32)<br />
Area 2. Legal System and Property Rights 5.25 5.21 4.64 4.58 4.80 5.65 5.36<br />
A. Judicial independence 2.38 3.77 3.29<br />
B. Impartial courts 3.94 4.31 2.66 4.70 4.51<br />
C. Protection of property rights 3.36 3.91 4.05<br />
D. Military interference in rule of law and politics 3.65 6.67 8.33 8.33 8.33<br />
E. Integrity of the legal system 6.96 3.33 3.68 4.17 4.17<br />
F. Legal enforcement of contracts 5.17 5.17 5.36<br />
G. Regulatory restrictions on sale of real property 8.06 8.09 5.46<br />
H. Reliability of police 4.91 5.77 7.17<br />
I. Business costs of crime 4.64 6.93 5.86<br />
Area 3. Sound Money 6.52 6.54 3.26 7.40 9.64 9.63 9.73<br />
A. Money growth 0.00 (78.90) 9.57 (2.16) 9.50 (2.50) 9.24 (3.80) 9.86 (0.71)<br />
B. Standard deviation of inflation 9.64 (0.91) 9.62 (0.95) 0.00 (86.94) 5.03 (12.43) 9.53 (1.16) 9.75 (0.63) 9.75 (0.62)<br />
C. Inflation: most recent year 9.93 (0.35) 10.00 (0.00) 8.03 (9.83) 9.99 (0.05) 9.53 (2.37) 9.54 (2.28) 9.29 (3.55)<br />
D. <strong>Freedom</strong> to own foreign currency bank accounts 0.00 0.00 0.00 5.00 5.00 10.00 10.00 10.00<br />
Area 4. <strong>Freedom</strong> to Trade Internationally 5.90 5.88 6.33 7.24 7.30<br />
A. Tariffs 5.70 6.11 8.24 8.45 8.45<br />
(i) Revenue from trade taxes (% of trade sector) 5.70 (6.45) 5.14 (7.29) 8.14 (2.79) 8.57 (2.14) 8.57 (2.14)<br />
(ii) Mean tariff rate 6.60 (17.00) 8.74 (6.30) 9.00 (5.00) 9.00 (5.00)<br />
(iii) Standard deviation of tariff rates 6.60 (8.50) 7.83 (5.42) 7.78 (5.55) 7.78 (5.55)<br />
B. Regulatory trade barriers 4.89 6.90 7.08<br />
(i) Non-tariff trade barriers 4.41 6.35 6.28<br />
(ii) Compliance cost of importing and exporting 5.36 7.45 7.88<br />
C. Black-market exchange rates 0.00 0.00 0.00 10.00 10.00 10.00 10.00 10.00<br />
D. Controls of the movement of capital and people 0.00 0.00 0.00 2.00 1.54 2.19 3.62 3.68<br />
(i) Foreign ownership/investment restrictions 5.02 6.26 6.41<br />
(ii) Capital controls 0.00 0.00 0.00 2.00 1.54 1.54 4.62 4.62<br />
(iii) <strong>Freedom</strong> of foreigners to visit 0.00 0.00 0.00<br />
Area 5. Regulation 2.47 4.57 5.47 6.09 6.35 6.29<br />
A. Credit market regulations 0.00 4.55 4.61 7.49 7.00 7.04<br />
(i) Ownership of banks 0.00 2.00 2.00 5.00 5.00 5.00<br />
(ii) Private sector credit 5.64 2.83 8.46 6.00 6.12<br />
(iii) Interest rate controls/negative real interest rates 0.00 6.00 9.00 9.00 10.00 10.00<br />
B. Labor market regulations 5.97 5.94 5.93<br />
(i) Hiring regulations and minimum wage 5.60 5.57 5.57<br />
(ii) Hiring and firing regulations 6.69 6.05 6.11<br />
(iii) Centralized collective bargaining 7.74 7.02 6.86<br />
(iv) Hours regulations 8.00 8.00 8.00<br />
(v) Mandated cost of worker dismissal 4.81 6.03 6.03<br />
(vi) Conscription 0.00 0.00 0.00 3.00 10.00 3.00 3.00 3.00<br />
C. Business regulations 4.82 6.11 5.91<br />
(i) Administrative requirements 2.66 5.01 5.68<br />
(ii) Bureaucracy costs 0.99 6.30 4.81<br />
(iii) Starting a business 8.40 9.66 9.54<br />
(iv) Extra payments/bribes/favoritism 4.94 4.91 4.78<br />
(v) Licensing restrictions 4.63 4.83 4.83<br />
(vi) Cost of tax compliance 7.31 5.96 5.84
Algeria<br />
Country Data Tables • 29<br />
1980 1985 1990 1995 2000 2005 2009 2010<br />
Chain-Linked Rating (Rank) Rating (Rank) Rating (Rank) Rating (Rank) Rating (Rank) Rating (Rank) Rating (Rank) Rating (Rank)<br />
Summary Rating (Rank) 3.82 (90) 3.60 (98) 3.43 (106) 4.06 (115) 4.66 (117) 5.25 (116) 4.88 (119) 4.88 (120)<br />
Area 1. Size of Government 4.72 (62) 3.55 (93) 5.02 (73) 6.71 (36) 5.65 (80) 4.84 (105) 3.80 (117) 3.65 (120)<br />
Area 2. Legal System and Property Rights 3.77 (59) 3.52 (84) 3.50 (83) 3.52 (111) 2.39 (120) 3.48 (105) 3.14 (115) 2.90 (116)<br />
Area 3. Sound Money 5.23 (87) 6.30 (74) 4.50 (97) 5.37 (84) 7.00 (80) 7.51 (79) 7.01 (94) 8.42 (67)<br />
Area 4. <strong>Freedom</strong> to Trade Internationally 1.97 (79) 1.45 (87) 1.31 (101) 1.91 (110) 4.80 (115) 5.34 (111) 5.28 (109) 5.04 (115)<br />
Area 5. Regulation 2.83 (109) 2.78 (123) 3.45 (123) 4.67 (119) 4.76 (120) 4.20 (121)<br />
Unadjusted<br />
Summary Rating (Rank) 3.97 (89) 3.74 (96) 3.45 (107) 4.09 (116) 4.75 (117) 5.74 (126) 5.34 (132) 5.34 (137)<br />
Rating (Data) Rating (Data) Rating (Data) Rating (Data) Rating (Data) Rating (Data) Rating (Data) Rating (Data)<br />
Area 1. Size of Government 4.32 3.25 4.60 6.71 5.65 4.84 3.80 3.65<br />
A. Government consumption 4.65 (24.19) 4.50 (24.69) 5.19 (22.35) 5.29 (22.01) 4.53 (24.60) 3.90 (26.74) 3.24 (28.98) 2.80 (30.47)<br />
B. Transfers and subsidies 7.84 (8.43) 8.41 (6.32) 8.63 (5.52) 8.15 (7.29) 8.15 (7.29)<br />
C. Government enterprises and investment 4.00 (32.50) 2.00 (47.90) 4.00 (30.40) 7.00 (24.90) 4.00 (37.80) 2.00 (48.40) 0.00 (61.26) 0.00 (61.26)<br />
D. Top marginal tax rate<br />
(i) Top marginal income tax rate<br />
(ii) Top marginal income and payroll tax rate<br />
Area 2. Legal System and Property Rights 3.77 3.52 3.50 3.68 2.87 5.32 4.81 4.44<br />
A. Judicial independence 4.57 3.00 2.54<br />
B. Impartial courts 3.61 3.84 5.11 3.62 3.28<br />
C. Protection of property rights 5.80 4.29 3.47<br />
D. Military interference in rule of law and politics 0.00 0.00 5.00 5.00 5.00<br />
E. Integrity of the legal system 6.96 3.33 5.00 5.00 5.00<br />
F. Legal enforcement of contracts 4.39 4.39 4.39<br />
G. Regulatory restrictions on sale of real property 6.57 6.78 6.76<br />
H. Reliability of police 6.89 4.94 4.94<br />
I. Business costs of crime 4.58 6.32 4.56<br />
Area 3. Sound Money 5.23 6.30 4.50 5.37 7.00 7.51 7.01 8.42<br />
A. Money growth 8.35 (8.24) 7.81 (10.96) 9.35 (3.25) 8.11 (9.44) 7.95 (10.26) 7.84 (10.81) 8.01 (9.95) 8.35 (8.25)<br />
B. Standard deviation of inflation 7.70 (5.75) 8.33 (4.17) 5.53 (11.17) 4.07 (14.83) 5.14 (12.16) 7.52 (6.20) 6.19 (9.52) 6.13 (9.67)<br />
C. Inflation: most recent year 4.87 (25.66) 9.07 (4.64) 3.12 (34.40) 4.31 (28.46) 9.93 (0.34) 9.67 (1.64) 8.85 (5.74) 9.22 (3.91)<br />
D. <strong>Freedom</strong> to own foreign currency bank accounts 0.00 0.00 0.00 5.00 5.00 5.00 5.00 10.00<br />
Area 4. <strong>Freedom</strong> to Trade Internationally 2.55 1.89 1.69 1.91 4.80 5.98 5.92 5.65<br />
A. Tariffs 7.66 5.66 5.08 3.72 4.95 6.95 5.96 5.96<br />
(i) Revenue from trade taxes (% of trade sector) 3.58 (9.63) 6.36 (5.46) 8.21 (2.69) 5.77 (6.35) 5.77 (6.35)<br />
(ii) Mean tariff rate 7.66 (11.70) 5.66 (21.70) 5.08 (24.60) 5.42 (22.90) 5.08 (24.60) 6.84 (15.80) 6.28 (18.60) 6.28 (18.60)<br />
(iii) Standard deviation of tariff rates 2.16 (19.60) 3.40 (16.50) 5.81 (10.47) 5.83 (10.42) 5.83 (10.42)<br />
B. Regulatory trade barriers 6.35 6.76 6.27<br />
(i) Non-tariff trade barriers 5.16 6.21 4.73<br />
(ii) Compliance cost of importing and exporting 7.53 7.30 7.81<br />
C. Black-market exchange rates 0.00 0.00 0.00 0.00 7.78 7.93 9.18 8.57<br />
D. Controls of the movement of capital and people 0.00 0.00 0.00 2.00 1.67 2.70 1.77 1.80<br />
(i) Foreign ownership/investment restrictions 6.07 3.41 4.27<br />
(ii) Capital controls 0.00 0.00 0.00 2.00 1.67 0.91 0.77 0.00<br />
(iii) <strong>Freedom</strong> of foreigners to visit 1.13 1.13 1.13<br />
Area 5. Regulation 2.93 2.78 3.45 5.06 5.17 4.56<br />
A. Credit market regulations 0.00 0.00 0.87 0.48 2.26 4.45 4.72 3.72<br />
(i) Ownership of banks 0.00 0.00 0.00 0.00 0.00 0.00 0.00 0.00<br />
(ii) Private sector credit 1.74 1.44 1.78 3.34 4.17 4.15<br />
(iii) Interest rate controls/negative real interest rates 0.00 5.00 10.00 10.00 7.00<br />
B. Labor market regulations 5.16 5.32 5.17<br />
(i) Hiring regulations and minimum wage 5.60 5.57 5.57<br />
(ii) Hiring and firing regulations 4.35 4.70 4.74<br />
(iii) Centralized collective bargaining 5.59 5.85 4.91<br />
(iv) Hours regulations 6.00 6.00 6.00<br />
(v) Mandated cost of worker dismissal 8.42 8.79 8.79<br />
(vi) Conscription 5.00 0.00 1.00 1.00 1.00 1.00 1.00 1.00<br />
C. Business regulations 5.58 5.47 4.80<br />
(i) Administrative requirements 3.31 2.12 2.10<br />
(ii) Bureaucracy costs 3.74 5.91 3.31<br />
(iii) Starting a business 8.94 8.98 8.97<br />
(iv) Extra payments/bribes/favoritism 5.66 3.92 3.20<br />
(v) Licensing restrictions 6.90 6.93 6.29<br />
(vi) Cost of tax compliance 4.94 4.94 4.94<br />
www.freetheworld.com • www.fraserinstitute.org • Fraser Institute ©2012
30 • <strong>Economic</strong> <strong>Freedom</strong> of the <strong>World</strong>: 2012 Annual Report<br />
Angola<br />
Fraser Institute ©2012 • www.fraserinstitute.org • www.freetheworld.com<br />
1980 1985 1990 1995 2000 2005 2009 2010<br />
Chain-Linked Rating (Rank) Rating (Rank) Rating (Rank) Rating (Rank) Rating (Rank) Rating (Rank) Rating (Rank) Rating (Rank)<br />
Summary Rating (Rank) <br />
Area 1. Size of Government<br />
Area 2. Legal System and Property Rights<br />
Area 3. Sound Money<br />
Area 4. <strong>Freedom</strong> to Trade Internationally<br />
Area 5. Regulation<br />
Unadjusted<br />
Summary Rating (Rank) 3.69 (140) 4.89 (138) 5.12 (140)<br />
Rating (Data) Rating (Data) Rating (Data) Rating (Data) Rating (Data) Rating (Data) Rating (Data) Rating (Data)<br />
Area 1. Size of Government 3.72 4.63 4.63<br />
A. Government consumption 2.59 (31.20) 0.00 (41.60) 0.02 (39.93)<br />
B. Transfers and subsidies 8.58 (5.71) 9.00 (4.17) 9.00 (4.17)<br />
C. Government enterprises and investment 0.00 (62.50) 0.00 (83.75) 0.00 (83.33)<br />
D. Top marginal tax rate 9.50 9.50<br />
(i) Top marginal income tax rate 10.00 (17) 10.00 (17)<br />
(ii) Top marginal income and payroll tax rate 9.00 (25) 9.00 (25)<br />
Area 2. Legal System and Property Rights 3.15 3.69 3.74<br />
A. Judicial independence 3.08 3.26 2.36<br />
B. Impartial courts 2.92 3.37 2.51<br />
C. Protection of property rights 4.11 3.11 2.85<br />
D. Military interference in rule of law and politics 3.33 3.33 3.33<br />
E. Integrity of the legal system 5.00 5.00 5.00<br />
F. Legal enforcement of contracts 2.30 2.30 2.30<br />
G. Regulatory restrictions on sale of real property 1.35 2.74 5.47<br />
H. Reliability of police 3.84 4.69 5.62<br />
I. Business costs of crime 2.40 5.41 4.23<br />
Area 3. Sound Money 1.26 5.24 5.57<br />
A. Money growth 0.00 (53.88) 4.81 (25.94) 5.12 (24.41)<br />
B. Standard deviation of inflation 0.00 (40.17) 3.89 (15.28) 5.06 (12.36)<br />
C. Inflation: most recent year 5.05 (24.76) 7.25 (13.73) 7.11 (14.47)<br />
D. <strong>Freedom</strong> to own foreign currency bank accounts 0.00 5.00 5.00<br />
Area 4. <strong>Freedom</strong> to Trade Internationally 6.10 5.75 6.47<br />
A. Tariffs<br />
(i) Revenue from trade taxes (% of trade sector)<br />
7.92 7.91 7.91<br />
(ii) Mean tariff rate 8.48 (7.60) 8.54 (7.30) 8.54 (7.30)<br />
(iii) Standard deviation of tariff rates 7.35 (6.62) 7.28 (6.79) 7.28 (6.79)<br />
B. Regulatory trade barriers 4.02 3.62 5.45<br />
(i) Non-tariff trade barriers 6.67 4.49 4.71<br />
(ii) Compliance cost of importing and exporting 1.38 2.75 6.19<br />
C. Black-market exchange rates 10.00 10.00 10.00<br />
D. Controls of the movement of capital and people 2.46 1.49 2.50<br />
(i) Foreign ownership/investment restrictions 5.83 3.70 5.20<br />
(ii) Capital controls 1.54 0.77 2.31<br />
(iii) <strong>Freedom</strong> of foreigners to visit 0.00 0.00 0.00<br />
Area 5. Regulation 4.22 5.16 5.18<br />
A. Credit market regulations 5.20 6.55 7.38<br />
(i) Ownership of banks 5.00 5.00 8.00<br />
(ii) Private sector credit 5.61 5.65 6.15<br />
(iii) Interest rate controls/negative real interest rates 5.00 9.00 8.00<br />
B. Labor market regulations 3.99 3.87 3.79<br />
(i) Hiring regulations and minimum wage 3.30 3.33 3.33<br />
(ii) Hiring and firing regulations 4.39 4.60 4.17<br />
(iii) Centralized collective bargaining 7.62 6.34 6.28<br />
(iv) Hours regulations 4.00 4.00 4.00<br />
(v) Mandated cost of worker dismissal 4.62 4.98 4.98<br />
(vi) Conscription 0.00 0.00 0.00<br />
C. Business regulations 3.46 5.04 4.36<br />
(i) Administrative requirements 2.17 1.67 1.76<br />
(ii) Bureaucracy costs 0.46 7.93 2.86<br />
(iii) Starting a business 3.09 6.02 6.49<br />
(iv) Extra payments/bribes/favoritism 4.88 3.47 2.89<br />
(v) Licensing restrictions 3.18 4.31 5.36<br />
(vi) Cost of tax compliance 6.95 6.84 6.84
Country Data Tables • 31<br />
Argentina 1980 1985 1990 1995 2000 2005 2009 2010<br />
Chain-Linked Rating (Rank) Rating (Rank) Rating (Rank) Rating (Rank) Rating (Rank) Rating (Rank) Rating (Rank) Rating (Rank)<br />
Summary Rating (Rank) 3.96 (84) 3.30 (103) 4.42 (95) 7.04 (33) 7.40 (34) 5.97 (100) 5.95 (102) 5.77 (110)<br />
Area 1. Size of Government 5.44 (38) 4.66 (63) 6.18 (41) 8.22 (7) 7.78 (17) 7.56 (31) 6.25 (67) 6.29 (69)<br />
Area 2. Legal System and Property Rights 4.20 (52) 4.56 (62) 6.03 (37) 5.45 (73) 5.41 (71) 3.68 (104) 3.78 (105) 3.76 (105)<br />
Area 3. Sound Money 2.50 (102) 2.50 (106) 2.50 (108) 6.57 (63) 9.71 (5) 5.44 (114) 7.03 (91) 6.59 (104)<br />
Area 4. <strong>Freedom</strong> to Trade Internationally 3.91 (55) 1.43 (88) 4.13 (73) 8.61 (21) 7.62 (51) 6.28 (86) 6.27 (88) 6.09 (99)<br />
Area 5. Regulation 3.78 (91) 3.65 (95) 3.38 (105) 6.36 (44) 6.49 (52) 6.81 (62) 6.29 (93) 5.96 (102)<br />
Unadjusted<br />
Summary Rating (Rank) 4.30 (80) 3.58 (100) 4.54 (91) 7.01 (36) 7.40 (32) 5.99 (111) 5.97 (119) 5.79 (127)<br />
Rating (Data) Rating (Data) Rating (Data) Rating (Data) Rating (Data) Rating (Data) Rating (Data) Rating (Data)<br />
Area 1. Size of Government 6.10 5.22 6.18 8.22 7.78 7.56 6.25 6.29<br />
A. Government consumption 6.91 (16.50) 7.94 (13.00) 8.53 (11.00) 8.06 (12.60) 6.88 (16.62) 6.98 (16.26) 5.71 (20.60) 5.89 (19.98)<br />
B. Transfers and subsidies 7.49 (9.70) 6.95 (11.70) 8.17 (7.20) 7.33 (10.30) 7.22 (10.69) 8.28 (6.82) 8.28 (6.82) 8.28 (6.82)<br />
C. Government enterprises and investment 4.00 (39.50) 4.00 (38.30) 4.00 (30.00) 10.00 (8.50) 10.00 (6.44) 10.00 (11.03) 6.00 (12.65) 6.00 (12.65)<br />
D. Top marginal tax rate 6.00 2.00 4.00 7.50 7.00 5.00 5.00 5.00<br />
(i) Top marginal income tax rate 6.00 (45) 2.00 (62) 7.00 (35) 9.00 (30) 8.00 (35) 7.00 (35) 7.00 (35) 7.00 (35)<br />
(ii) Top marginal income and payroll tax rate 1.00 (57) 6.00 (40) 6.00 (36-43) 3.00 (46) 3.00 (49) 3.00 (49)<br />
Area 2. Legal System and Property Rights 4.20 4.56 6.03 5.45 5.41 4.22 4.34 4.31<br />
A. Judicial independence 3.87 3.17 1.96 2.60 2.63<br />
B. Impartial courts 4.20 5.18 2.62 2.40 2.61<br />
C. Protection of property rights 4.57 3.72 3.18 2.75 2.92<br />
D. Military interference in rule of law and politics 7.66 6.67 7.22 7.50 7.50<br />
E. Integrity of the legal system 6.96 8.33 5.00 4.17 4.17<br />
F. Legal enforcement of contracts 5.02 5.02 5.02<br />
G. Regulatory restrictions on sale of real property 6.74 6.72 6.70<br />
H. Reliability of police 3.11 3.36 4.11<br />
I. Business costs of crime 3.16 4.53 3.17<br />
Area 3. Sound Money 2.50 2.50 2.50 6.57 9.71 5.44 7.03 6.59<br />
A. Money growth 0.00 (90.34) 0.00 (252.73) 0.00 (441.58) 7.07 (14.66) 9.50 (−2.48) 3.33 (33.35) 7.80 (10.99) 7.53 (12.34)<br />
B. Standard deviation of inflation 0.00 (119.77) 0.00 (208.29) 0.00 (1198.84) 0.00 (52.44) 9.52 (1.20) 5.37 (11.56) 8.50 (3.74) 9.14 (2.16)<br />
C. Inflation: most recent year 0.00 (92.02) 0.00 (620.84) 0.00 (2064.19) 9.23 (3.87) 9.81 (−0.94) 8.07 (9.64) 6.80 (16.00) 4.70 (26.60)<br />
D. <strong>Freedom</strong> to own foreign currency bank accounts 10.00 10.00 10.00 10.00 10.00 5.00 5.00 5.00<br />
Area 4. <strong>Freedom</strong> to Trade Internationally 4.62 1.69 4.40 8.54 7.62 6.43 6.42 6.24<br />
A. Tariffs 4.05 3.07 3.19 7.46 7.47 6.49 6.26 6.28<br />
(i) Revenue from trade taxes (% of trade sector) 3.67 (9.50) 1.53 (12.70) 3.40 (9.90) 7.53 (3.70) 7.92 (3.12) 5.58 (6.62) 5.58 (6.62) 5.58 (6.62)<br />
(ii) Mean tariff rate 4.44 (27.80) 4.60 (27.00) 5.90 (20.50) 7.90 (10.50) 7.48 (12.60) 7.88 (10.60) 7.48 (12.60) 7.48 (12.60)<br />
(iii) Standard deviation of tariff rates 0.28 (24.30) 6.96 (7.60) 7.00 (7.50) 6.00 (10.00) 5.72 (10.71) 5.77 (10.58)<br />
B. Regulatory trade barriers 7.17 6.42 5.69 5.56 5.04<br />
(i) Non-tariff trade barriers 7.17 6.18 3.81 3.05 2.58<br />
(ii) Compliance cost of importing and exporting 6.66 7.57 8.08 7.50<br />
C. Black-market exchange rates 9.80 2.00 10.00 10.00 10.00 10.00 10.00 10.00<br />
D. Controls of the movement of capital and people 0.00 0.00 0.00 9.53 6.58 3.55 3.86 3.63<br />
(i) Foreign ownership/investment restrictions 9.06 9.31 5.88 5.26 5.36<br />
(ii) Capital controls 0.00 0.00 0.00 10.00 3.85 0.00 1.54 0.77<br />
(iii) <strong>Freedom</strong> of foreigners to visit 4.76 4.76 4.76<br />
Area 5. Regulation 4.09 3.95 3.58 6.28 6.49 6.31 5.82 5.52<br />
A. Credit market regulations 4.45 4.20 3.70 7.54 7.32 8.26 6.96 6.57<br />
(i) Ownership of banks 5.00 5.00 5.00 5.00 5.00 5.00 5.00 5.00<br />
(ii) Private sector credit 8.34 7.61 6.09 7.61 6.95 9.78 5.88 5.72<br />
(iii) Interest rate controls/negative real interest rates 0.00 0.00 0.00 10.00 10.00 10.00 10.00 9.00<br />
B. Labor market regulations 3.73 3.70 3.46 5.94 6.11 5.12 5.32 5.27<br />
(i) Hiring regulations and minimum wage 5.95 4.42 5.60 3.90 3.90<br />
(ii) Hiring and firing regulations 3.00 3.00 5.28 2.50 2.76 2.82<br />
(iii) Centralized collective bargaining 5.18 5.18 5.18 5.18 4.83 4.60 3.32 2.91<br />
(iv) Hours regulations 5.01 4.93 4.66 5.55 6.01 8.00 10.00 10.00<br />
(v) Mandated cost of worker dismissal 0.00 1.97 1.97<br />
(vi) Conscription 1.00 1.00 1.00 10.00 10.00 10.00 10.00 10.00<br />
C. Business regulations 5.36 6.05 5.54 5.18 4.72<br />
(i) Administrative requirements 6.78 2.48 2.68 2.43<br />
(ii) Bureaucracy costs 6.70 7.50 7.09 5.74 3.50<br />
(iii) Starting a business 6.22 4.83 8.87 9.01 9.04<br />
(iv) Extra payments/bribes/favoritism 3.16 5.07 4.98 3.57 3.20<br />
(v) Licensing restrictions 4.91 5.16 4.81<br />
(vi) Cost of tax compliance 4.92 4.92 5.35<br />
www.freetheworld.com • www.fraserinstitute.org • Fraser Institute ©2012
32 • <strong>Economic</strong> <strong>Freedom</strong> of the <strong>World</strong>: 2012 Annual Report<br />
Armenia 1980 1985 1990 1995 2000 2005 2009 2010<br />
Chain-Linked Rating (Rank) Rating (Rank) Rating (Rank) Rating (Rank) Rating (Rank) Rating (Rank) Rating (Rank) Rating (Rank)<br />
Summary Rating (Rank) <br />
Area 1. Size of Government<br />
Area 2. Legal System and Property Rights<br />
Area 3. Sound Money<br />
Area 4. <strong>Freedom</strong> to Trade Internationally<br />
Area 5. Regulation<br />
Unadjusted<br />
Summary Rating (Rank) 7.31 (47) 7.41 (32) 7.42 (35)<br />
Rating (Data) Rating (Data) Rating (Data) Rating (Data) Rating (Data) Rating (Data) Rating (Data) Rating (Data)<br />
Area 1. Size of Government 7.75 7.63 7.64<br />
A. Government consumption 8.16 (12.26) 7.54 (14.36) 7.51 (14.46)<br />
B. Transfers and subsidies 8.33 (6.62) 7.98 (7.91) 8.05 (7.67)<br />
C. Government enterprises and investment 6.00 6.00 6.00<br />
D. Top marginal tax rate 8.50 9.00 9.00<br />
(i) Top marginal income tax rate 9.00 10.00 (20) 10.00 (20)<br />
(ii) Top marginal income and payroll tax rate 8.00 8.00 (26) 8.00 (26)<br />
Area 2. Legal System and Property Rights 5.56 5.55 5.56<br />
A. Judicial independence 2.11 2.71 3.01<br />
B. Impartial courts 2.97 3.40 3.88<br />
C. Protection of property rights 5.53 4.45 4.62<br />
D. Military interference in rule of law and politics 5.83 5.83 5.83<br />
E. Integrity of the legal system 5.00 5.00 5.00<br />
F. Legal enforcement of contracts 7.16 7.16 5.99<br />
G. Regulatory restrictions on sale of real property 9.79 9.77 9.77<br />
H. Reliability of police 4.63 3.82 7.82<br />
I. Business costs of crime 7.00 7.79 4.10<br />
Area 3. Sound Money 9.21 9.44 9.18<br />
A. Money growth 7.56 (12.20) 9.46 (2.71) 9.64 (1.82)<br />
B. Standard deviation of inflation 9.41 (1.48) 8.97 (2.57) 8.72 (3.21)<br />
C. Inflation: most recent year 9.87 (0.64) 9.32 (3.41) 8.36 (8.18)<br />
D. <strong>Freedom</strong> to own foreign currency bank accounts 10.00 10.00 10.00<br />
Area 4. <strong>Freedom</strong> to Trade Internationally 7.08 7.63 7.59<br />
A. Tariffs 7.71 8.85 8.85<br />
(i) Revenue from trade taxes (% of trade sector) 9.37 (0.95) 9.01 (1.49) 9.01 (1.48)<br />
(ii) Mean tariff rate 9.40 (3.00) 9.44 (2.80) 9.44 (2.80)<br />
(iii) Standard deviation of tariff rates 4.36 (14.10) 8.11 (4.73) 8.11 (4.73)<br />
B. Regulatory trade barriers 5.16 6.64 6.56<br />
(i) Non-tariff trade barriers 5.31 5.33 5.25<br />
(ii) Compliance cost of importing and exporting 5.00 7.95 7.88<br />
C. Black-market exchange rates 10.00 10.00 10.00<br />
D. Controls of the movement of capital and people 5.45 5.03 4.96<br />
(i) Foreign ownership/investment restrictions 6.76 5.63 5.42<br />
(ii) Capital controls 8.46 8.33 8.33<br />
(iii) <strong>Freedom</strong> of foreigners to visit 1.13 1.13 1.13<br />
Area 5. Regulation 6.95 6.83 7.12<br />
A. Credit market regulations 9.55 8.41 8.80<br />
(i) Ownership of banks 10.00 10.00 10.00<br />
(ii) Private sector credit 9.66 6.22 7.39<br />
(iii) Interest rate controls/negative real interest rates 9.00 9.00 9.00<br />
B. Labor market regulations 6.05 6.23 6.61<br />
(i) Hiring regulations and minimum wage 6.70 5.00 6.67<br />
(ii) Hiring and firing regulations 5.15 5.79 6.31<br />
(iii) Centralized collective bargaining 7.64 7.02 7.36<br />
(iv) Hours regulations 8.00 10.00 10.00<br />
(v) Mandated cost of worker dismissal 8.79 9.60 9.32<br />
(vi) Conscription 0.00 0.00 0.00<br />
C. Business regulations 5.25 5.84 5.94<br />
(i) Administrative requirements 3.04 3.42 4.12<br />
(ii) Bureaucracy costs 2.93 6.52 4.04<br />
(iii) Starting a business 9.36 9.49 9.71<br />
(iv) Extra payments/bribes/favoritism 5.19 3.64 3.85<br />
(v) Licensing restrictions 7.47 8.46 9.53<br />
(vi) Cost of tax compliance 3.49 3.49 4.40<br />
Fraser Institute ©2012 • www.fraserinstitute.org • www.freetheworld.com
Country Data Tables • 33<br />
Australia 1980 1985 1990 1995 2000 2005 2009 2010<br />
Chain-Linked Rating (Rank) Rating (Rank) Rating (Rank) Rating (Rank) Rating (Rank) Rating (Rank) Rating (Rank) Rating (Rank)<br />
Summary Rating (Rank) 6.86 (13) 7.17 (10) 7.57 (12) 7.98 (9) 8.07 (10) 8.24 (7) 8.20 (4) 8.14 (4)<br />
Area 1. Size of Government 5.08 (48) 4.42 (73) 5.35 (65) 5.68 (73) 5.47 (81) 6.38 (73) 6.62 (47) 6.67 (53)<br />
Area 2. Legal System and Property Rights 7.26 (14) 7.88 (11) 7.86 (15) 8.96 (11) 9.49 (3) 9.13 (7) 8.73 (11) 8.70 (13)<br />
Area 3. Sound Money 9.00 (9) 9.35 (10) 9.15 (18) 9.40 (28) 9.40 (27) 9.44 (31) 9.62 (10) 9.43 (28)<br />
Area 4. <strong>Freedom</strong> to Trade Internationally 5.90 (35) 6.97 (22) 7.87 (19) 8.28 (24) 8.33 (34) 7.89 (34) 7.92 (35) 7.67 (38)<br />
Area 5. Regulation 7.11 (9) 7.20 (11) 7.54 (9) 7.56 (9) 7.63 (12) 8.32 (8) 8.04 (8) 8.17 (9)<br />
Unadjusted<br />
Summary Rating (Rank) 6.85 (12) 7.16 (12) 7.73 (10) 7.95 (9) 8.07 (10) 8.07 (10) 8.03 (5) 7.97 (5)<br />
Rating (Data) Rating (Data) Rating (Data) Rating (Data) Rating (Data) Rating (Data) Rating (Data) Rating (Data)<br />
Area 1. Size of Government 5.08 4.42 5.35 5.68 5.47 6.38 6.62 6.67<br />
A. Government consumption 4.93 (23.23) 4.77 (23.79) 5.20 (22.33) 5.47 (21.40) 4.79 (23.70) 4.72 (23.95) 4.49 (24.74) 4.36 (25.18)<br />
B. Transfers and subsidies 7.38 (10.10) 6.89 (11.90) 7.22 (10.70) 6.27 (14.20) 7.09 (11.17) 6.80 (12.26) 6.51 (13.32) 6.80 (12.23)<br />
C. Government enterprises and investment 6.00 (28.40) 4.00 (30.20) 6.00 (25.20) 7.00 (21.50) 7.00 (21.50) 10.00 (10.61) 10.00 (11.20) 10.00 (11.20)<br />
D. Top marginal tax rate 2.00 2.00 3.00 4.00 3.00 4.00 5.50 5.50<br />
(i) Top marginal income tax rate 2.00 (62) 2.00 (60) 3.00 (49) 4.00 (47) 3.00 (47) 4.00 (47) 6.00 (45) 6.00 (45)<br />
(ii) Top marginal income and payroll tax rate 3.00 (49) 4.00 (48) 3.00 (49) 4.00 (49) 5.00 (47) 5.00 (47)<br />
Area 2. Legal System and Property Rights 7.26 7.88 7.86 8.96 9.49 8.48 8.11 8.09<br />
A. Judicial independence 9.05 9.52 8.80 8.79 8.53<br />
B. Impartial courts 9.00 9.69 8.31 6.99 6.62<br />
C. Protection of property rights 7.32 8.27 8.97 8.11 7.59<br />
D. Military interference in rule of law and politics 9.46 10.00 10.00 10.00 10.00<br />
E. Integrity of the legal system 10.00 10.00 9.79 9.17 9.17<br />
F. Legal enforcement of contracts 6.23 6.23 6.16<br />
G. Regulatory restrictions on sale of real property 8.33 8.26 8.26<br />
H. Reliability of police 8.07 8.17 8.19<br />
I. Business costs of crime 7.82 7.26 8.24<br />
Area 3. Sound Money 9.00 9.35 9.15 9.40 9.40 9.44 9.62 9.43<br />
A. Money growth 8.57 (7.17) 9.50 (2.50) 8.06 (9.70) 8.43 (7.83) 9.19 (4.04) 8.61 (6.94) 8.94 (5.30) 9.13 (4.37)<br />
B. Standard deviation of inflation 9.40 (1.51) 9.13 (2.17) 9.19 (2.02) 9.74 (0.64) 9.31 (1.72) 9.68 (0.79) 9.92 (0.20) 9.18 (2.04)<br />
C. Inflation: most recent year 8.03 (9.84) 8.79 (6.06) 9.35 (3.26) 9.42 (2.90) 9.10 (4.48) 9.47 (2.67) 9.64 (1.82) 9.43 (2.85)<br />
D. <strong>Freedom</strong> to own foreign currency bank accounts 10.00 10.00 10.00 10.00 10.00 10.00 10.00 10.00<br />
Area 4. <strong>Freedom</strong> to Trade Internationally 6.38 7.53 8.15 8.10 8.33 7.48 7.51 7.28<br />
A. Tariffs 7.35 7.60 6.46 7.71 8.43 8.43 8.79 8.83<br />
(i) Revenue from trade taxes (% of trade sector) 7.60 (3.60) 7.87 (3.20) 7.93 (3.10) 8.80 (1.80) 9.06 (1.41) 8.97 (1.55) 9.25 (1.12) 9.25 (1.12)<br />
(ii) Mean tariff rate 7.10 (14.50) 7.34 (13.30) 7.16 (14.20) 8.36 (8.20) 8.84 (5.80) 9.14 (4.30) 9.30 (3.50) 9.44 (2.80)<br />
(iii) Standard deviation of tariff rates 4.28 (14.30) 5.96 (10.10) 7.40 (6.50) 7.17 (7.07) 7.80 (5.50) 7.80 (5.49)<br />
B. Regulatory trade barriers 6.42 8.78 8.18 8.04 7.32<br />
(i) Non-tariff trade barriers 6.42 8.07 7.44 7.16 7.65<br />
(ii) Compliance cost of importing and exporting 9.50 8.91 8.91 7.00<br />
C. Black-market exchange rates 9.80 10.00 10.00 10.00 10.00 10.00 10.00 10.00<br />
D. Controls of the movement of capital and people 2.00 5.00 8.00 8.27 6.11 3.33 3.24 2.97<br />
(i) Foreign ownership/investment restrictions 8.53 9.14 7.57 7.29 7.26<br />
(ii) Capital controls 2.00 5.00 8.00 8.00 3.08 2.31 2.31 1.54<br />
(iii) <strong>Freedom</strong> of foreigners to visit 0.11 0.11 0.11<br />
Area 5. Regulation 6.53 6.62 8.12 7.63 7.63 8.55 8.27 8.40<br />
A. Credit market regulations 8.38 8.67 9.68 9.73 10.00 10.00 9.69 9.69<br />
(i) Ownership of banks 8.00 8.00 10.00 10.00 10.00 10.00 10.00 10.00<br />
(ii) Private sector credit 7.14 8.00 9.03 9.19 10.00 10.00 9.07 9.07<br />
(iii) Interest rate controls/negative real interest rates 10.00 10.00 10.00 10.00 10.00 10.00 10.00 10.00<br />
B. Labor market regulations 6.56 5.43 5.57 8.36 8.39 7.90<br />
(i) Hiring regulations and minimum wage 3.58 4.55 10.00 10.00 8.90<br />
(ii) Hiring and firing regulations 4.50 4.50 3.08 4.60 4.64 4.14<br />
(iii) Centralized collective bargaining 5.18 5.18 5.18 5.18 5.52 5.93 5.69 5.44<br />
(iv) Hours regulations 3.88 4.68 10.00 10.00 10.00<br />
(v) Mandated cost of worker dismissal 9.63 10.00 8.89<br />
(vi) Conscription 10.00 10.00 10.00 10.00 10.00 10.00 10.00 10.00<br />
C. Business regulations 7.72 7.33 7.29 6.72 7.60<br />
(i) Administrative requirements 6.73 3.49 3.99 3.64<br />
(ii) Bureaucracy costs 7.21 6.20 5.32 2.00 7.12<br />
(iii) Starting a business 6.80 7.37 9.92 9.93 9.93<br />
(iv) Extra payments/bribes/favoritism 9.16 9.01 8.94 8.35 7.64<br />
(v) Licensing restrictions 7.29 7.29 8.50<br />
(vi) Cost of tax compliance 8.80 8.78 8.78<br />
www.freetheworld.com • www.fraserinstitute.org • Fraser Institute ©2012
34 • <strong>Economic</strong> <strong>Freedom</strong> of the <strong>World</strong>: 2012 Annual Report<br />
Austria<br />
Fraser Institute ©2012 • www.fraserinstitute.org • www.freetheworld.com<br />
1980 1985 1990 1995 2000 2005 2009 2010<br />
Chain-Linked Rating (Rank) Rating (Rank) Rating (Rank) Rating (Rank) Rating (Rank) Rating (Rank) Rating (Rank) Rating (Rank)<br />
Summary Rating (Rank) 6.33 (22) 6.34 (24) 6.98 (23) 7.16 (32) 7.55 (25) 7.84 (16) 7.62 (20) 7.55 (27)<br />
Area 1. Size of Government 2.71 (97) 2.63 (106) 3.11 (106) 2.82 (115) 2.77 (122) 5.23 (96) 4.85 (107) 4.90 (105)<br />
Area 2. Legal System and Property Rights 8.04 (6) 7.88 (10) 8.35 (8) 8.85 (14) 9.34 (5) 9.04 (10) 8.58 (16) 8.42 (16)<br />
Area 3. Sound Money 8.40 (13) 8.31 (23) 9.63 (10) 9.55 (19) 9.63 (9) 9.55 (17) 9.58 (15) 9.64 (13)<br />
Area 4. <strong>Freedom</strong> to Trade Internationally 6.60 (26) 6.66 (27) 7.65 (25) 8.92 (17) 9.11 (13) 8.07 (24) 7.96 (30) 7.58 (47)<br />
Area 5. Regulation 6.02 (36) 6.35 (32) 6.26 (39) 5.70 (68) 6.91 (39) 7.30 (30) 7.13 (42) 7.22 (36)<br />
Unadjusted<br />
Summary Rating (Rank) 6.45 (19) 6.46 (21) 6.95 (24) 7.14 (32) 7.55 (22) 7.85 (16) 7.63 (17) 7.56 (27)<br />
Rating (Data) Rating (Data) Rating (Data) Rating (Data) Rating (Data) Rating (Data) Rating (Data) Rating (Data)<br />
Area 1. Size of Government 3.14 3.05 3.11 2.82 2.77 5.23 4.85 4.90<br />
A. Government consumption 4.46 (24.82) 4.35 (25.22) 4.40 (25.03) 4.01 (26.37) 4.16 (25.86) 4.58 (24.44) 3.87 (26.86) 4.07 (26.16)<br />
B. Transfers and subsidies 4.11 (22.10) 3.84 (23.10) 4.03 (22.40) 3.27 (25.20) 2.93 (26.44) 2.84 (26.78) 2.02 (29.80) 2.02 (29.78)<br />
C. Government enterprises and investment 2.00 (44.50) 2.00 (42.00) 2.00 (42.00) 2.00 (42.00) 2.00 (42.00) 10.00 (5.21) 10.00 (11.31) 10.00 (10.36)<br />
D. Top marginal tax rate 2.00 2.00 2.00 2.00 2.00 3.50 3.50 3.50<br />
(i) Top marginal income tax rate 2.00 (62) 2.00 (62) 4.00 (50) 4.00 (50) 4.00 (50) 4.00 (50) 4.00 (50) 4.00 (50)<br />
(ii) Top marginal income and payroll tax rate 0.00 (62) 0.00 (66) 0.00 (66) 3.00 (54) 3.00 (54) 3.00 (54)<br />
Area 2. Legal System and Property Rights 8.04 7.88 8.35 8.85 9.34 8.68 8.24 8.08<br />
A. Judicial independence 8.82 9.02 8.15 7.96 7.57<br />
B. Impartial courts 7.72 9.02 8.56 6.98 6.51<br />
C. Protection of property rights 7.73 8.65 9.08 8.59 8.23<br />
D. Military interference in rule of law and politics 9.97 10.00 10.00 10.00 10.00<br />
E. Integrity of the legal system 10.00 10.00 10.00 10.00 10.00<br />
F. Legal enforcement of contracts 6.70 6.38 6.38<br />
G. Regulatory restrictions on sale of real property 7.92 8.12 8.09<br />
H. Reliability of police 8.63 7.89 7.74<br />
I. Business costs of crime 9.04 8.22 8.21<br />
Area 3. Sound Money 8.40 8.31 9.63 9.55 9.63 9.55 9.58 9.64<br />
A. Money growth 9.97 (−0.17) 9.36 (3.22) 9.46 (2.69) 8.92 (5.39) 9.18 (4.10) 8.77 (6.15) 8.67 (6.67) 9.19 (4.06)<br />
B. Standard deviation of inflation 9.64 (0.90) 9.51 (1.23) 9.75 (0.63) 9.69 (0.78) 9.80 (0.50) 9.91 (0.23) 9.74 (0.64) 9.74 (0.64)<br />
C. Inflation: most recent year 9.00 (5.00) 9.38 (3.08) 9.31 (3.45) 9.57 (2.13) 9.53 (2.35) 9.54 (2.30) 9.90 (0.49) 9.64 (1.81)<br />
D. <strong>Freedom</strong> to own foreign currency bank accounts 5.00 5.00 10.00 10.00 10.00 10.00 10.00 10.00<br />
Area 4. <strong>Freedom</strong> to Trade Internationally 6.87 6.93 7.64 8.84 9.11 8.16 8.04 7.66<br />
A. Tariffs 8.61 8.80 7.92 8.72 9.18 8.39 8.22 8.34<br />
(i) Revenue from trade taxes (% of trade sector) 9.53 (0.70) 9.60 (0.60) 9.53 (0.70) 9.87 (0.20) 9.78 (0.33) 9.59 (0.62) 9.44 (0.84) 9.63 (0.55)<br />
(ii) Mean tariff rate 7.68 (11.60) 8.00 (10.00) 8.26 (8.70) 8.66 (6.70) 9.52 (2.40) 9.46 (2.70) 8.94 (5.30) 8.98 (5.10)<br />
(iii) Standard deviation of tariff rates 5.96 (10.10) 7.64 (5.90) 8.24 (4.40) 6.13 (9.67) 6.29 (9.28) 6.41 (8.98)<br />
B. Regulatory trade barriers 8.13 9.15 8.39 8.31 6.89<br />
(i) Non-tariff trade barriers 8.13 8.80 7.84 7.53 6.77<br />
(ii) Compliance cost of importing and exporting 9.50 8.93 9.08 7.00<br />
C. Black-market exchange rates 10.00 10.00 10.00 10.00 10.00 10.00 10.00 10.00<br />
D. Controls of the movement of capital and people 2.00 2.00 5.00 8.50 8.11 5.86 5.65 5.41<br />
(i) Foreign ownership/investment restrictions 9.00 9.30 7.93 7.29 6.57<br />
(ii) Capital controls 2.00 2.00 5.00 8.00 6.92 3.08 3.08 3.08<br />
(iii) <strong>Freedom</strong> of foreigners to visit 6.58 6.58 6.58<br />
Area 5. Regulation 5.79 6.11 6.05 5.67 6.91 7.62 7.44 7.54<br />
A. Credit market regulations 6.96 7.59 7.46 6.82 9.72 9.75 9.64 8.97<br />
(i) Ownership of banks 5.00 5.00 5.00 5.00 10.00 10.00 10.00 8.00<br />
(ii) Private sector credit 7.88 7.78 7.39 7.47 9.16 9.24 8.91 8.91<br />
(iii) Interest rate controls/negative real interest rates 8.00 10.00 10.00 8.00 10.00 10.00 10.00 10.00<br />
B. Labor market regulations 4.63 4.63 4.63 4.28 3.86 5.91 6.21 6.33<br />
(i) Hiring regulations and minimum wage 4.58 4.56 8.90 10.00 10.00<br />
(ii) Hiring and firing regulations 4.82 4.82 3.05 4.25 3.94 4.26<br />
(iii) Centralized collective bargaining 4.49 4.49 4.49 4.49 3.50 2.77 2.33 2.71<br />
(iv) Hours regulations 4.40 4.40 4.22 4.50 5.18 6.70 8.00 8.00<br />
(v) Mandated cost of worker dismissal 9.81 10.00 10.00<br />
(vi) Conscription 5.00 5.00 5.00 3.00 3.00 3.00 3.00 3.00<br />
C. Business regulations 5.90 7.16 7.21 6.48 7.31<br />
(i) Administrative requirements 7.53 4.27 4.39 4.21<br />
(ii) Bureaucracy costs 6.52 7.43 5.54 1.46 7.40<br />
(iii) Starting a business 3.72 5.42 8.85 8.87 8.88<br />
(iv) Extra payments/bribes/favoritism 7.48 8.27 8.92 8.41 7.65<br />
(v) Licensing restrictions 7.61 7.62 7.65<br />
(vi) Cost of tax compliance 8.09 8.09 8.09
Country Data Tables • 35<br />
Azerbaijan 1980 1985 1990 1995 2000 2005 2009 2010<br />
Chain-Linked Rating (Rank) Rating (Rank) Rating (Rank) Rating (Rank) Rating (Rank) Rating (Rank) Rating (Rank) Rating (Rank)<br />
Summary Rating (Rank) <br />
Area 1. Size of Government<br />
Area 2. Legal System and Property Rights<br />
Area 3. Sound Money<br />
Area 4. <strong>Freedom</strong> to Trade Internationally<br />
Area 5. Regulation<br />
Unadjusted<br />
Summary Rating (Rank) 6.02 (108) 6.12 (112) 6.17 (116)<br />
Rating (Data) Rating (Data) Rating (Data) Rating (Data) Rating (Data) Rating (Data) Rating (Data) Rating (Data)<br />
Area 1. Size of Government 5.02 4.62 4.88<br />
A. Government consumption 6.00 (19.61) 3.89 (26.76) 4.85 (23.50)<br />
B. Transfers and subsidies 7.09 (11.19) 7.09 (11.19) 9.57 (2.06) 9.67 (1.71)<br />
C. Government enterprises and investment 2.00 0.00 (65.55) 0.00 (65.42)<br />
D. Top marginal tax rate 5.00 5.00 5.00<br />
(i) Top marginal income tax rate 7.00 (35) 7.00 (35) 7.00 (35)<br />
(ii) Top marginal income and payroll tax rate 3.00 (49) 3.00 (49) 3.00 (49)<br />
Area 2. Legal System and Property Rights 5.87 5.94 5.97<br />
A. Judicial independence 2.98 3.86 4.05<br />
B. Impartial courts 3.40 4.19 4.23<br />
C. Protection of property rights 4.39 4.76 4.73<br />
D. Military interference in rule of law and politics 6.67 5.83 5.83<br />
E. Integrity of the legal system 6.04 5.83 5.83<br />
F. Legal enforcement of contracts 7.33 7.55 7.55<br />
G. Regulatory restrictions on sale of real property 8.85 9.73 9.73<br />
H. Reliability of police 5.75 4.43 7.14<br />
I. Business costs of crime 7.44 7.25 4.64<br />
Area 3. Sound Money 7.25 6.58 6.27<br />
A. Money growth 8.57 (7.17) 7.58 (12.09) 7.01 (14.97)<br />
B. Standard deviation of inflation 7.77 (5.58) 4.00 (14.99) 4.22 (14.45)<br />
C. Inflation: most recent year 7.68 (11.59) 9.72 (1.40) 8.87 (5.67)<br />
D. <strong>Freedom</strong> to own foreign currency bank accounts 5.00 5.00 5.00<br />
Area 4. <strong>Freedom</strong> to Trade Internationally 5.92 6.38 6.79<br />
A. Tariffs 6.91 7.83 7.83<br />
(i) Revenue from trade taxes (% of trade sector) 8.47 (2.29) 8.47 (2.29)<br />
(ii) Mean tariff rate 7.92 (10.40) 8.22 (8.90) 8.22 (8.90)<br />
(iii) Standard deviation of tariff rates 5.89 (10.27) 6.80 (8.01) 6.80 (8.01)<br />
B. Regulatory trade barriers 3.51 3.95 5.98<br />
(i) Non-tariff trade barriers 4.38 4.21 4.59<br />
(ii) Compliance cost of importing and exporting 2.64 3.69 7.38<br />
C. Black-market exchange rates 10.00 10.00 10.00<br />
D. Controls of the movement of capital and people 3.25 3.74 3.33<br />
(i) Foreign ownership/investment restrictions 6.68 5.84 5.38<br />
(ii) Capital controls 3.08 5.38 4.62<br />
(iii) <strong>Freedom</strong> of foreigners to visit 0.00 0.00 0.00<br />
Area 5. Regulation 6.03 7.10 6.94<br />
A. Credit market regulations 6.84 8.33 8.00<br />
(i) Ownership of banks 5.00 5.00 5.00<br />
(ii) Private sector credit 7.66 6.52 6.52 10.00 10.00<br />
(iii) Interest rate controls/negative real interest rates 9.00 10.00 9.00<br />
B. Labor market regulations 6.51 6.80 6.86<br />
(i) Hiring regulations and minimum wage 6.70 8.33 8.33<br />
(ii) Hiring and firing regulations 7.78 6.66 7.24<br />
(iii) Centralized collective bargaining 7.60 8.02 7.82<br />
(iv) Hours regulations 8.00 8.00 8.00<br />
(v) Mandated cost of worker dismissal 7.96 8.79 8.79<br />
(vi) Conscription 1.00 1.00 1.00<br />
C. Business regulations 4.74 6.18 5.95<br />
(i) Administrative requirements 3.96 4.49 4.48<br />
(ii) Bureaucracy costs 5.89 5.58 3.68<br />
(iii) Starting a business 8.27 9.71 9.72<br />
(iv) Extra payments/bribes/favoritism 4.65 3.90 3.46<br />
(v) Licensing restrictions 5.67 6.84 6.85<br />
(vi) Cost of tax compliance 0.00 6.57 7.48<br />
www.freetheworld.com • www.fraserinstitute.org • Fraser Institute ©2012
36 • <strong>Economic</strong> <strong>Freedom</strong> of the <strong>World</strong>: 2012 Annual Report<br />
Bahamas 1980 1985 1990 1995 2000 2005 2009 2010<br />
Chain-Linked Rating (Rank) Rating (Rank) Rating (Rank) Rating (Rank) Rating (Rank) Rating (Rank) Rating (Rank) Rating (Rank)<br />
Summary Rating (Rank) 6.26 (23) 6.33 (25) 6.43 (33) 6.41 (54) 6.69 (60) 6.85 (68) 6.69 (73) 6.59 (80)<br />
Area 1. Size of Government 8.45 (6) 8.47 (2) 8.51 (3) 8.19 (11) 7.79 (16) 8.06 (19) 8.12 (11) 8.19 (13)<br />
Area 2. Legal System and Property Rights 5.72 (43) 5.70 (48) 5.19 (79) 6.35 (55) 6.79 (43) 6.48 (49) 6.08 (57)<br />
Area 3. Sound Money 6.25 (54) 6.48 (66) 7.02 (44) 7.05 (55) 6.87 (87) 6.82 (92) 7.07 (88) 7.21 (87)<br />
Area 4. <strong>Freedom</strong> to Trade Internationally 3.40 (61) 3.78 (63) 3.59 (82) 4.15 (104) 4.96 (113) 5.20 (112) 4.61 (119) 4.51 (119)<br />
Area 5. Regulation 6.98 (13) 7.27 (10) 7.41 (12) 7.51 (10) 7.51 (13) 7.36 (27) 7.34 (27) 7.19 (38)<br />
Unadjusted<br />
Summary Rating (Rank) 6.28 (24) 6.35 (26) 6.46 (33) 6.44 (52) 6.69 (58) 7.43 (36) 7.47 (29) 7.36 (40)<br />
Fraser Institute ©2012 • www.fraserinstitute.org • www.freetheworld.com<br />
Rating (Data) Rating (Data) Rating (Data) Rating (Data) Rating (Data) Rating (Data) Rating (Data) Rating (Data)<br />
Area 1. Size of Government 8.45 8.47 8.51 8.19 7.79 8.06 8.12 8.19<br />
A. Government consumption 6.81 (16.85) 6.90 (16.54) 7.18 (15.60) 6.21 (18.90) 5.18 (22.40) 6.46 (18.04) 6.61 (17.54) 6.77 (16.97)<br />
B. Transfers and subsidies 10.00 (0.50) 10.00 (0.10) 9.86 (1.00) 9.56 (2.10) 8.97 (4.29) 8.78 (4.96) 8.88 (4.63) 8.97 (4.28)<br />
C. Government enterprises and investment 7.00 (24.20) 7.00 (24.20) 7.00 (24.20) 7.00 7.00 7.00 7.00 7.00<br />
D. Top marginal tax rate 10.00 10.00 10.00 10.00 10.00 10.00 10.00 10.00<br />
(i) Top marginal income tax rate 10.00 (0) 10.00 (0) 10.00 (0) 10.00 (0) 10.00 (0) 10.00 (0) 10.00 (0) 10.00 (0)<br />
(ii) Top marginal income and payroll tax rate 10.00 (5-9) 10.00 (5-9) 10.00 (9) 10.00 (10)<br />
Area 2. Legal System and Property Rights 5.72 5.70 5.19 6.35 8.47 6.99 6.57<br />
A. Judicial independence 5.00 5.00<br />
B. Impartial courts 6.56 7.07 7.90 7.00 6.80<br />
C. Protection of property rights 3.00 3.00<br />
D. Military interference in rule of law and politics 7.30 10.00 10.00 10.00 10.00<br />
E. Integrity of the legal system 4.11 6.67 7.50 7.50 7.50<br />
F. Legal enforcement of contracts 5.49 5.49<br />
G. Regulatory restrictions on sale of real property 4.98 3.06<br />
H. Reliability of police<br />
I. Business costs of crime<br />
Area 3. Sound Money 6.25 6.48 7.02 7.05 6.87 6.82 7.07 7.21<br />
A. Money growth 8.43 (7.84) 9.72 (1.41) 9.38 (3.08) 9.40 (2.99) 8.05 (9.74) 8.61 (6.95) 9.47 (2.66) 9.93 (0.34)<br />
B. Standard deviation of inflation 8.58 (3.54) 7.88 (5.29) 9.32 (1.70) 9.35 (1.63) 9.64 (0.90) 8.97 (2.57) 9.25 (1.89) 9.19 (2.02)<br />
C. Inflation: most recent year 8.00 (10.01) 8.31 (8.46) 9.37 (3.16) 9.44 (2.81) 9.79 (1.04) 9.68 (1.59) 9.59 (2.06) 9.73 (1.34)<br />
D. <strong>Freedom</strong> to own foreign currency bank accounts 0.00 0.00 0.00 0.00 0.00 0.00 0.00 0.00<br />
Area 4. <strong>Freedom</strong> to Trade Internationally 3.44 3.82 3.67 4.24 4.96 6.37 6.08 5.95<br />
A. Tariffs 4.32 3.67 3.60 3.13 3.33 4.26 2.07 2.64<br />
(i) Revenue from trade taxes (% of trade sector) 4.60 (8.10) 3.80 (9.30) 3.60 (9.60) 3.13 (10.30) 3.67 (9.50) 4.14 (8.79) 0.40 (14.40) 2.13 (11.80)<br />
(ii) Mean tariff rate 4.04 (29.80) 3.54 (32.30) 3.00 (35.00) 3.96 (30.20) 2.84 (35.80) 2.82 (35.90)<br />
(iii) Standard deviation of tariff rates 4.68 (13.29) 2.98 (17.54) 2.96 (17.59)<br />
B. Regulatory trade barriers<br />
(i) Non-tariff trade barriers<br />
7.76 6.69<br />
(ii) Compliance cost of importing and exporting 7.76 6.69<br />
C. Black-market exchange rates 6.00 7.80 7.40 9.60 10.00 10.00 10.00 10.00<br />
D. Controls of the movement of capital and people<br />
(i) Foreign ownership/investment restrictions<br />
0.00 0.00 0.00 0.00 1.54 4.85 4.47 4.47<br />
(ii) Capital controls 0.00 0.00 0.00 0.00 1.54 1.54 0.77 0.77<br />
(iii) <strong>Freedom</strong> of foreigners to visit 8.16 8.16 8.16<br />
Area 5. Regulation 6.98 7.27 7.41 7.51 7.51 7.41 9.08 8.89<br />
A. Credit market regulations 8.62 9.38 9.73 10.00 10.00 9.76 9.28 8.79<br />
(i) Ownership of banks 10.00 10.00 10.00 10.00 10.00 10.00 10.00 10.00<br />
(ii) Private sector credit 7.86 8.13 9.20 10.00 10.00 9.28 7.85 6.36<br />
(iii) Interest rate controls/negative real interest rates 8.00 10.00 10.00 10.00 10.00 10.00 10.00 10.00<br />
B. Labor market regulations 9.44 9.17<br />
(i) Hiring regulations and minimum wage<br />
(ii) Hiring and firing regulations<br />
(iii) Centralized collective bargaining<br />
10.00 8.90<br />
(iv) Hours regulations 10.00 10.00<br />
(v) Mandated cost of worker dismissal 7.78 7.78<br />
(vi) Conscription 10.00 10.00 10.00 10.00 10.00 10.00 10.00 10.00<br />
C. Business regulations<br />
(i) Administrative requirements<br />
(ii) Bureaucracy costs<br />
8.52 8.73<br />
(iii) Starting a business<br />
(iv) Extra payments/bribes/favoritism<br />
8.91 8.92<br />
(v) Licensing restrictions 7.30 7.91<br />
(vi) Cost of tax compliance 9.35 9.35
Bahrain<br />
Country Data Tables • 37<br />
1980 1985 1990 1995 2000 2005 2009 2010<br />
Chain-Linked Rating (Rank) Rating (Rank) Rating (Rank) Rating (Rank) Rating (Rank) Rating (Rank) Rating (Rank) Rating (Rank)<br />
Summary Rating (Rank) 7.42 (7) 6.92 (15) 6.91 (25) 7.21 (30) 7.74 (16) 7.39 (38) 7.75 (14) 7.89 (10)<br />
Area 1. Size of Government 7.26 (10) 6.00 (26) 5.91 (46) 6.18 (59) 6.80 (43) 6.48 (69) 6.56 (50) 6.88 (46)<br />
Area 2. Legal System and Property Rights 5.72 (41) 5.70 (47) 6.60 (41) 6.54 (49) 5.84 (62) 6.71 (43) 6.94 (39)<br />
Area 3. Sound Money 8.10 (18) 8.61 (19) 8.79 (22) 9.43 (27) 9.12 (35) 8.82 (49) 9.00 (48) 9.18 (45)<br />
Area 4. <strong>Freedom</strong> to Trade Internationally 7.13 (18) 7.18 (19) 7.09 (30) 7.02 (55) 8.71 (23) 8.57 (11) 8.85 (4) 8.82 (3)<br />
Area 5. Regulation 7.23 (7) 7.11 (14) 7.05 (18) 6.79 (31) 7.51 (13) 7.23 (37) 7.61 (16) 7.60 (22)<br />
Unadjusted<br />
Summary Rating (Rank) 7.39 (7) 6.87 (14) 6.91 (26) 7.07 (33) 7.60 (19) 7.20 (53) 7.80 (10) 7.94 (7)<br />
Rating (Data) Rating (Data) Rating (Data) Rating (Data) Rating (Data) Rating (Data) Rating (Data) Rating (Data)<br />
Area 1. Size of Government 7.26 6.00 5.91 6.18 6.80 6.48 6.56 6.88<br />
A. Government consumption 3.25 (28.95) 0.00 (43.46) 0.00 (43.78) 1.41 (35.20) 3.78 (27.15) 2.94 (29.99) 2.72 (30.75) 4.09 (26.10)<br />
B. Transfers and subsidies 9.81 (1.20) 10.00 (0.00) 9.64 (1.80) 9.30 (3.06) 9.43 (2.59) 8.99 (4.21) 9.53 (2.24) 9.44 (2.56)<br />
C. Government enterprises and investment 6.00 (29.80) 4.00 (31.70) 4.00 (31.70) 4.00 (31.70) 4.00 (31.70) 4.00 4.00 4.00<br />
D. Top marginal tax rate 10.00 10.00 10.00 10.00 10.00 10.00 10.00 10.00<br />
(i) Top marginal income tax rate 10.00 (0) 10.00 (0) 10.00 (0) 10.00 (0) 10.00 (0) 10.00 (0) 10.00 (0) 10.00 (0)<br />
(ii) Top marginal income and payroll tax rate 10.00 (0) 10.00 (0) 10.00 (17) 10.00 (17)<br />
Area 2. Legal System and Property Rights 5.72 5.70 5.90 5.86 5.76 6.76 7.00<br />
A. Judicial independence 4.07 6.73 7.18<br />
B. Impartial courts 6.74 6.30 4.12 4.95 6.02<br />
C. Protection of property rights 6.62 7.71 7.86<br />
D. Military interference in rule of law and politics 6.11 5.00 5.00 5.00 5.00<br />
E. Integrity of the legal system 6.96 8.33 8.33 8.33 8.33<br />
F. Legal enforcement of contracts 4.79 4.79<br />
G. Regulatory restrictions on sale of real property 8.53 8.53<br />
H. Reliability of police 5.70 7.36 7.31<br />
I. Business costs of crime 6.48 7.47 7.96<br />
Area 3. Sound Money 8.10 8.61 8.79 9.43 9.12 8.82 9.00 9.18<br />
A. Money growth 6.38 (18.10) 8.46 (7.70) 9.60 (1.99) 9.24 (−3.82) 9.71 (1.46) 8.40 (7.99) 8.05 (9.77) 8.56 (7.20)<br />
B. Standard deviation of inflation 6.81 (7.98) 6.33 (9.17) 6.92 (7.71) 8.70 (3.26) 6.91 (7.73) 7.38 (6.54) 8.51 (3.72) 8.53 (3.66)<br />
C. Inflation: most recent year 9.22 (3.90) 9.64 (−1.82) 8.63 (6.84) 9.80 (1.00) 9.86 (−0.70) 9.48 (2.59) 9.44 (2.80) 9.61 (1.96)<br />
D. <strong>Freedom</strong> to own foreign currency bank accounts 10.00 10.00 10.00 10.00 10.00 10.00 10.00 10.00<br />
Area 4. <strong>Freedom</strong> to Trade Internationally 7.13 7.06 7.09 7.02 8.71 7.65 7.93 7.90<br />
A. Tariffs 9.39 9.17 9.27 9.07 9.19 8.37 8.26 8.26<br />
(i) Revenue from trade taxes (% of trade sector) 9.39 (0.91) 9.53 (0.70) 9.27 (1.10) 9.07 (1.40) 9.19 (1.21) 8.83 (1.75) 9.53 (0.70) 9.53 (0.70)<br />
(ii) Mean tariff rate 8.80 (6.00) 8.98 (5.10) 8.98 (5.10) 8.98 (5.10)<br />
(iii) Standard deviation of tariff rates 7.31 (6.73) 6.26 (9.36) 6.26 (9.36)<br />
B. Regulatory trade barriers 7.59 8.19 7.92<br />
(i) Non-tariff trade barriers 7.59 8.07 8.28<br />
(ii) Compliance cost of importing and exporting 8.31 7.56<br />
C. Black-market exchange rates 10.00 10.00 10.00 10.00 10.00 10.00 10.00 10.00<br />
D. Controls of the movement of capital and people 2.00 2.00 2.00 2.00 6.92 4.62 5.27 5.40<br />
(i) Foreign ownership/investment restrictions 7.14 7.75 8.15<br />
(ii) Capital controls 2.00 2.00 2.00 2.00 6.92 6.15 7.50 7.50<br />
(iii) <strong>Freedom</strong> of foreigners to visit 0.57 0.57 0.57<br />
Area 5. Regulation 7.07 6.95 7.05 6.79 7.51 7.29 8.74 8.73<br />
A. Credit market regulations 8.71 8.35 8.80 8.11 10.00 10.00 10.00 9.00<br />
(i) Ownership of banks 8.00 8.00 8.00 8.00 10.00 10.00 10.00 10.00<br />
(ii) Private sector credit 9.42 8.71 8.41 8.32 10.00 10.00 10.00 10.00<br />
(iii) Interest rate controls/negative real interest rates 10.00 8.00 10.00 10.00 10.00 7.00<br />
B. Labor market regulations 7.03 8.74 8.87<br />
(i) Hiring regulations and minimum wage 10.00 10.00<br />
(ii) Hiring and firing regulations 3.25 4.15 4.79<br />
(iii) Centralized collective bargaining 7.85 8.28 8.42<br />
(iv) Hours regulations 10.00 10.00<br />
(v) Mandated cost of worker dismissal 10.00 10.00<br />
(vi) Conscription 10.00 10.00 10.00 10.00 10.00 10.00 10.00 10.00<br />
C. Business regulations 4.83 7.48 8.33<br />
(i) Administrative requirements 4.04 5.01 6.45<br />
(ii) Bureaucracy costs 2.93 3.82 7.36<br />
(iii) Starting a business 8.81 8.85<br />
(iv) Extra payments/bribes/favoritism 7.51 7.76 7.72<br />
(v) Licensing restrictions 9.86 9.98<br />
(vi) Cost of tax compliance 9.60 9.60<br />
www.freetheworld.com • www.fraserinstitute.org • Fraser Institute ©2012
38 • <strong>Economic</strong> <strong>Freedom</strong> of the <strong>World</strong>: 2012 Annual Report<br />
Bangladesh 1980 1985 1990 1995 2000 2005 2009 2010<br />
Chain-Linked Rating (Rank) Rating (Rank) Rating (Rank) Rating (Rank) Rating (Rank) Rating (Rank) Rating (Rank) Rating (Rank)<br />
Summary Rating (Rank) 3.38 (96) 3.68 (94) 4.57 (91) 5.49 (82) 6.02 (86) 6.17 (90) 6.51 (80) 6.43 (87)<br />
Area 1. Size of Government 4.52 (70) 4.56 (68) 7.37 (11) 8.07 (13) 8.07 (11) 8.62 (9) 9.09 (2) 8.83 (4)<br />
Area 2. Legal System and Property Rights 2.26 (79) 2.19 (103) 2.17 (107) 4.78 (92) 3.23 (115) 3.35 (109) 4.08 (99) 4.09 (100)<br />
Area 3. Sound Money 4.64 (95) 6.10 (84) 6.95 (49) 6.42 (67) 7.02 (79) 6.65 (97) 6.74 (101) 6.48 (110)<br />
Area 4. <strong>Freedom</strong> to Trade Internationally 0.00 (91) 0.00 (97) 0.24 (103) 2.19 (108) 5.71 (96) 5.77 (92) 5.86 (95) 6.11 (98)<br />
Area 5. Regulation 4.87 (74) 5.15 (70) 5.72 (56) 5.49 (79) 6.06 (78) 6.44 (79) 6.82 (60) 6.71 (75)<br />
Unadjusted<br />
Summary Rating (Rank) 3.34 (101) 3.64 (99) 4.50 (92) 5.34 (85) 6.07 (82) 6.08 (104) 6.42 (96) 6.34 (109)<br />
Fraser Institute ©2012 • www.fraserinstitute.org • www.freetheworld.com<br />
Rating (Data) Rating (Data) Rating (Data) Rating (Data) Rating (Data) Rating (Data) Rating (Data) Rating (Data)<br />
Area 1. Size of Government 4.30 4.33 7.00 7.67 8.07 8.62 9.09 8.83<br />
A. Government consumption 9.89 (6.38) 10.00 (5.39) 10.00 (4.82) 10.00 (5.33) 10.00 (5.60) 9.69 (7.04) 9.89 (6.36) 9.84 (6.53)<br />
B. Transfers and subsidies 9.28 (3.15) 9.78 (1.29) 9.47 (2.45) 9.47 (2.45)<br />
C. Government enterprises and investment 2.00 (44.40) 2.00 (46.60) 2.00 (47.10) 4.00 (34.00) 4.00 (30.03) 6.00 (25.30) 8.00 (19.29) 7.00 (20.54)<br />
D. Top marginal tax rate 1.00 1.00 9.00 9.00 9.00 9.00 9.00 9.00<br />
(i) Top marginal income tax rate 1.00 (60) 1.00 (60) 9.00 (25) 9.00 (25) 9.00 (25) 9.00 (25) 9.00 (25) 9.00 (25)<br />
(ii) Top marginal income and payroll tax rate 9.00 (25) 9.00 (25) 9.00 (25) 9.00 (25) 9.00 (25) 9.00 (25)<br />
Area 2. Legal System and Property Rights 2.54 2.46 2.44 5.02 3.47 2.96 3.60 3.61<br />
A. Judicial independence 2.48 3.98 3.70<br />
B. Impartial courts 3.91 4.22 2.97 3.30 3.70<br />
C. Protection of property rights 2.02 4.70 4.07 4.44<br />
D. Military interference in rule of law and politics 5.25 3.33 4.58 5.00 4.17<br />
E. Integrity of the legal system 6.96 3.33 3.33 4.17 3.33<br />
F. Legal enforcement of contracts 1.15 1.15 1.15<br />
G. Regulatory restrictions on sale of real property 1.61 3.20 3.20<br />
H. Reliability of police 2.27 3.19 5.32<br />
I. Business costs of crime 3.52 4.34 3.44<br />
Area 3. Sound Money 4.64 6.10 6.95 6.42 7.02 6.65 6.74 6.48<br />
A. Money growth 7.03 (14.86) 7.84 (10.82) 9.62 (1.89) 7.99 (10.03) 9.07 (4.64) 8.55 (7.24) 8.63 (6.85) 8.08 (9.61)<br />
B. Standard deviation of inflation 4.23 (14.43) 8.76 (3.10) 9.16 (2.10) 9.05 (2.38) 9.46 (1.36) 9.45 (1.38) 9.40 (1.51) 9.48 (1.30)<br />
C. Inflation: most recent year 7.32 (13.39) 7.79 (11.07) 9.03 (4.87) 8.65 (6.73) 9.56 (2.21) 8.59 (7.04) 8.92 (5.42) 8.37 (8.13)<br />
D. <strong>Freedom</strong> to own foreign currency bank accounts 0.00 0.00 0.00 0.00 0.00 0.00 0.00 0.00<br />
Area 4. <strong>Freedom</strong> to Trade Internationally 0.18 0.00 0.21 1.94 5.71 5.77 5.86 6.10<br />
A. Tariffs 0.53 0.00 0.64 1.42 5.19 5.76 6.23 6.23<br />
(i) Revenue from trade taxes (% of trade sector) 1.07 (13.40) 0.00 (17.90) 1.93 (12.10) 4.27 (8.60) 5.33 (7.00) 4.12 (8.82) 5.09 (7.37) 5.09 (7.37)<br />
(ii) Mean tariff rate 0.00 (99.90) 0.00 (86.00) 0.00 (102.20) 0.00 (81.20) 5.68 (21.60) 6.64 (16.80) 7.06 (14.70) 7.06 (14.70)<br />
(iii) Standard deviation of tariff rates 0.00 (50.40) 0.00 (26.10) 4.56 (13.60) 6.53 (8.66) 6.53 (8.67) 6.53 (8.67)<br />
B. Regulatory trade barriers 4.73 4.54 5.66 6.19<br />
(i) Non-tariff trade barriers 4.73 5.40 5.18 5.32<br />
(ii) Compliance cost of importing and exporting 3.67 6.13 7.06<br />
C. Black-market exchange rates 0.00 0.00 0.00 4.40 10.00 10.00 10.00 10.00<br />
D. Controls of the movement of capital and people 0.00 0.00 0.00 0.00 2.93 2.76 1.54 2.00<br />
(i) Foreign ownership/investment restrictions 5.86 7.52 4.62 6.01<br />
(ii) Capital controls 0.00 0.00 0.00 0.00 0.00 0.77 0.00 0.00<br />
(iii) <strong>Freedom</strong> of foreigners to visit 0.00 0.00 0.00<br />
Area 5. Regulation 5.03 5.31 5.91 5.66 6.06 6.42 6.80 6.69<br />
A. Credit market regulations 3.44 4.19 5.76 5.12 6.68 8.21 8.19 8.19<br />
(i) Ownership of banks 0.00 0.00 0.00 0.00 2.00 5.00 5.00 5.00<br />
(ii) Private sector credit 4.31 6.56 7.28 7.37 8.05 9.64 9.57 9.57<br />
(iii) Interest rate controls/negative real interest rates 6.00 6.00 10.00 8.00 10.00 10.00 10.00 10.00<br />
B. Labor market regulations 6.55 6.76 6.54 6.58<br />
(i) Hiring regulations and minimum wage 4.60 6.70 5.57 5.57<br />
(ii) Hiring and firing regulations 4.97 6.00 6.09 6.23<br />
(iii) Centralized collective bargaining 6.63 7.52 6.86 6.94<br />
(iv) Hours regulations 10.00 10.00 10.00<br />
(v) Mandated cost of worker dismissal 0.36 0.73 0.73<br />
(vi) Conscription 10.00 10.00 10.00 10.00 10.00 10.00 10.00 10.00<br />
C. Business regulations 4.94 4.29 5.66 5.32<br />
(i) Administrative requirements 7.55 2.40 3.15 3.40<br />
(ii) Bureaucracy costs 5.73 2.40 6.37 2.88<br />
(iii) Starting a business 4.58 7.85 9.04 9.07<br />
(iv) Extra payments/bribes/favoritism 1.91 2.35 2.67 2.58<br />
(v) Licensing restrictions 5.22 6.14 7.36<br />
(vi) Cost of tax compliance 5.52 6.61 6.61
Country Data Tables • 39<br />
Barbados 1980 1985 1990 1995 2000 2005 2009 2010<br />
Chain-Linked Rating (Rank) Rating (Rank) Rating (Rank) Rating (Rank) Rating (Rank) Rating (Rank) Rating (Rank) Rating (Rank)<br />
Summary Rating (Rank) 5.66 (38) 6.10 (31) 6.15 (38) 6.14 (63) 6.20 (78) 6.39 (81) 6.28 (89) 6.50 (82)<br />
Area 1. Size of Government 6.04 (22) 6.14 (21) 6.42 (32) 6.40 (47) 6.85 (39) 6.59 (65) 6.33 (60) 6.73 (51)<br />
Area 2. Legal System and Property Rights 5.92 (33) 5.90 (41) 4.76 (94) 5.20 (76) 6.52 (51) 6.33 (53) 6.54 (48)<br />
Area 3. Sound Money 5.06 (90) 6.67 (52) 6.67 (57) 7.19 (50) 6.70 (91) 6.29 (107) 6.66 (104) 6.57 (106)<br />
Area 4. <strong>Freedom</strong> to Trade Internationally 4.87 (44) 4.93 (49) 4.96 (59) 5.53 (85) 5.33 (103) 5.56 (103) 5.41 (106) 5.57 (107)<br />
Area 5. Regulation 6.45 (24) 6.89 (17) 6.84 (22) 6.83 (28) 6.89 (41) 6.80 (63) 6.49 (83) 6.85 (59)<br />
Unadjusted<br />
Summary Rating (Rank) 5.72 (36) 6.13 (30) 6.06 (41) 6.07 (63) 6.20 (75) 6.81 (74) 6.77 (80) 6.94 (73)<br />
Rating (Data) Rating (Data) Rating (Data) Rating (Data) Rating (Data) Rating (Data) Rating (Data) Rating (Data)<br />
Area 1. Size of Government 6.27 6.38 6.42 6.40 6.85 6.59 6.33 6.73<br />
A. Government consumption 6.09 (19.28) 4.52 (24.62) 4.69 (24.07) 5.09 (22.70) 3.91 (26.70) 4.44 (24.92) 6.34 (18.45) 6.43 (18.15)<br />
B. Transfers and subsidies 10.00 (0.20) 10.00 (0.00) 10.00 (0.50) 10.00 (0.00) 10.00 (0.00) 8.43 (6.28) 5.50 (17.02) 5.50 (17.02)<br />
C. Government enterprises and investment 8.00 (19.00) 10.00 (11.90) 8.00 (18.30) 7.00 (22.78) 10.00 (12.00) 10.00 (3.68) 10.00 (3.68) 10.00 (3.68)<br />
D. Top marginal tax rate 1.00 1.00 3.00 3.50 3.50 3.50 3.50 5.00<br />
(i) Top marginal income tax rate 1.00 (60) 1.00 (60) 4.00 (50) 5.00 (40) 5.00 (40) 5.00 (40) 5.00 (40) 7.00 (35)<br />
(ii) Top marginal income and payroll tax rate 2.00 (54) 2.00 (53) 2.00 (53) 2.00 (53) 2.00 (53) 3.00 (47)<br />
Area 2. Legal System and Property Rights 5.72 5.70 4.60 5.20 7.65 7.54 7.79<br />
A. Judicial independence 5.00 5.00 8.12 7.89 8.20<br />
B. Impartial courts 6.29 7.61 7.15 6.40 6.26<br />
C. Protection of property rights 3.00 3.00 7.35 7.69 8.04<br />
D. Military interference in rule of law and politics 9.40 9.20 9.20<br />
E. Integrity of the legal system 4.11<br />
F. Legal enforcement of contracts<br />
G. Regulatory restrictions on sale of real property<br />
H. Reliability of police 7.22 8.29 6.70<br />
I. Business costs of crime 6.64 5.78 8.34<br />
Area 3. Sound Money 5.06 6.67 6.67 7.19 6.70 6.29 6.66 6.57<br />
A. Money growth 7.17 (14.16) 8.92 (5.41) 9.12 (4.38) 9.32 (−3.38) 7.89 (10.55) 7.66 (11.68) 8.22 (8.88) 8.22 (8.88)<br />
B. Standard deviation of inflation 7.59 (6.03) 8.59 (3.52) 8.64 (3.39) 9.49 (1.28) 9.40 (1.50) 8.70 (3.26) 9.14 (2.15) 9.22 (1.96)<br />
C. Inflation: most recent year 5.49 (22.56) 9.18 (4.12) 8.91 (5.45) 9.95 (0.25) 9.51 (2.44) 8.78 (6.08) 9.27 (3.64) 8.84 (5.82)<br />
D. <strong>Freedom</strong> to own foreign currency bank accounts 0.00 0.00 0.00 0.00 0.00 0.00 0.00 0.00<br />
Area 4. <strong>Freedom</strong> to Trade Internationally 5.11 4.99 4.69 5.33 5.33 6.66 6.48 6.68<br />
A. Tariffs 7.53 7.17 6.06 6.58 6.20 5.63 5.31 5.31<br />
(i) Revenue from trade taxes (% of trade sector) 7.53 (3.70) 7.73 (3.40) 7.60 (3.60) 7.80 (3.30) 7.90 (3.16) 6.89 (4.67) 6.89 (4.67)<br />
(ii) Mean tariff rate 6.60 (17.00) 7.18 (14.10) 6.20 (19.00) 7.30 (13.50) 7.30 (13.50) 7.30 (13.50)<br />
(iii) Standard deviation of tariff rates 4.52 (13.70) 4.76 (13.10) 1.68 (20.79) 1.74 (20.66) 1.74 (20.66)<br />
B. Regulatory trade barriers 5.21 5.47 5.79<br />
(i) Non-tariff trade barriers<br />
(ii) Compliance cost of importing and exporting<br />
5.21 5.47 5.79<br />
C. Black-market exchange rates 7.80 7.80 8.00 9.40 9.80 10.00 10.00 10.00<br />
D. Controls of the movement of capital and people 0.00 0.00 0.00 0.00 0.00 5.81 5.14 5.62<br />
(i) Foreign ownership/investment restrictions 7.42 5.43 6.85<br />
(ii) Capital controls 0.00 0.00 0.00 0.00 0.00 0.00 0.00 0.00<br />
(iii) <strong>Freedom</strong> of foreigners to visit 10.00 10.00 10.00<br />
Area 5. Regulation 6.45 6.89 6.84 6.83 6.89 6.86 6.82 6.91<br />
A. Credit market regulations 7.19 8.36 8.25 8.21 8.37 8.34 7.00 7.00<br />
(i) Ownership of banks 8.00 8.00 8.00 8.00 8.00 8.00 8.00 8.00<br />
(ii) Private sector credit 7.58 7.08 6.74 6.62 7.11 7.02 2.99 2.99<br />
(iii) Interest rate controls/negative real interest rates 6.00 10.00 10.00 10.00 10.00 10.00 10.00 10.00<br />
B. Labor market regulations<br />
(i) Hiring regulations and minimum wage<br />
7.21 7.62 6.93<br />
(ii) Hiring and firing regulations 5.03 4.60 4.85<br />
(iii) Centralized collective bargaining 6.61 5.88 5.94<br />
(iv) Hours regulations<br />
(v) Mandated cost of worker dismissal<br />
10.00<br />
(vi) Conscription 10.00 10.00 10.00 10.00 10.00 10.00 10.00 10.00<br />
C. Business regulations 5.03 5.83 6.81<br />
(i) Administrative requirements 4.01 5.47 6.13<br />
(ii) Bureaucracy costs<br />
(iii) Starting a business<br />
3.43 4.51 7.06<br />
(iv) Extra payments/bribes/favoritism<br />
(v) Licensing restrictions<br />
(vi) Cost of tax compliance<br />
7.64 7.51 7.24<br />
www.freetheworld.com • www.fraserinstitute.org • Fraser Institute ©2012
40 • <strong>Economic</strong> <strong>Freedom</strong> of the <strong>World</strong>: 2012 Annual Report<br />
Belgium 1980 1985 1990 1995 2000 2005 2009 2010<br />
Chain-Linked Rating (Rank) Rating (Rank) Rating (Rank) Rating (Rank) Rating (Rank) Rating (Rank) Rating (Rank) Rating (Rank)<br />
Summary Rating (Rank) 7.06 (10) 7.03 (12) 7.35 (14) 7.43 (24) 7.89 (15) 7.53 (33) 7.42 (35) 7.47 (34)<br />
Area 1. Size of Government 3.42 (92) 3.40 (96) 4.19 (91) 4.04 (102) 4.57 (102) 4.34 (115) 3.91 (116) 3.99 (115)<br />
Area 2. Legal System and Property Rights 7.83 (10) 7.88 (13) 8.35 (14) 7.52 (27) 8.29 (19) 7.93 (21) 8.01 (24) 8.05 (21)<br />
Area 3. Sound Money 9.58 (2) 9.58 (3) 9.74 (3) 9.73 (6) 9.62 (10) 9.53 (21) 9.64 (6) 9.69 (6)<br />
Area 4. <strong>Freedom</strong> to Trade Internationally 9.12 (3) 9.16 (5) 9.15 (7) 9.23 (9) 9.30 (9) 8.30 (16) 8.25 (18) 7.97 (24)<br />
Area 5. Regulation 5.48 (52) 5.26 (65) 5.43 (69) 6.63 (35) 7.65 (11) 7.55 (20) 7.29 (30) 7.61 (19)<br />
Unadjusted<br />
Summary Rating (Rank) 7.35 (9) 7.32 (10) 7.56 (12) 7.39 (23) 7.89 (15) 7.41 (40) 7.30 (42) 7.35 (41)<br />
Fraser Institute ©2012 • www.fraserinstitute.org • www.freetheworld.com<br />
Rating (Data) Rating (Data) Rating (Data) Rating (Data) Rating (Data) Rating (Data) Rating (Data) Rating (Data)<br />
Area 1. Size of Government 3.62 3.60 4.19 4.04 4.57 4.34 3.91 3.99<br />
A. Government consumption 5.43 (21.55) 5.79 (20.30) 6.44 (18.10) 6.20 (18.93) 3.45 (28.26) 2.95 (29.96) 2.35 (32.00) 2.53 (31.39)<br />
B. Transfers and subsidies 3.05 (26.00) 2.62 (27.60) 3.32 (25.00) 2.97 (26.30) 3.81 (23.21) 3.39 (24.77) 2.29 (28.81) 2.43 (28.29)<br />
C. Government enterprises and investment 6.00 (26.80) 6.00 (25.30) 6.00 (27.00) 6.00 (27.00) 10.00 (11.86) 10.00 (8.70) 10.00 (13.77) 10.00 (13.30)<br />
D. Top marginal tax rate 0.00 0.00 1.00 1.00 1.00 1.00 1.00 1.00<br />
(i) Top marginal income tax rate 0.00 (76) 0.00 (76) 2.00 (55-61) 1.00 (58-64) 2.00 (58-62.7) 2.00 (50-55) 2.00 (50-55) 2.00 (50-55)<br />
(ii) Top marginal income and payroll tax rate 0.00 (70) 1.00 (58-64) 0.00 (71) 0.00 (67-71) 0.00 (68-71) 0.00 (68-71)<br />
Area 2. Legal System and Property Rights 7.83 7.88 8.35 7.52 8.29 6.97 7.05 7.08<br />
A. Judicial independence 5.78 7.35 6.98 7.01 7.11<br />
B. Impartial courts 6.42 8.18 6.32 5.10 5.22<br />
C. Protection of property rights 6.90 7.57 8.20 7.41 7.28<br />
D. Military interference in rule of law and politics 8.49 10.00 10.00 10.00 10.00<br />
E. Integrity of the legal system 10.00 8.33 8.33 8.33 8.33<br />
F. Legal enforcement of contracts 5.65 5.65 5.58<br />
G. Regulatory restrictions on sale of real property 3.33 4.33 4.62<br />
H. Reliability of police 7.03 7.60 7.87<br />
I. Business costs of crime 6.91 8.00 7.70<br />
Area 3. Sound Money 9.58 9.58 9.74 9.73 9.62 9.53 9.64 9.69<br />
A. Money growth 9.78 (1.10) 9.78 (1.11) 9.97 (0.17) 9.63 (1.85) 9.10 (4.48) 8.79 (6.06) 8.73 (6.33) 9.35 (3.25)<br />
B. Standard deviation of inflation 9.38 (1.56) 9.76 (0.59) 9.62 (0.95) 9.64 (0.90) 9.89 (0.28) 9.89 (0.28) 9.85 (0.38) 9.87 (0.34)<br />
C. Inflation: most recent year 9.16 (4.18) 8.79 (6.05) 9.37 (3.14) 9.67 (1.67) 9.49 (2.54) 9.44 (2.78) 9.99 (−0.05) 9.56 (2.19)<br />
D. <strong>Freedom</strong> to own foreign currency bank accounts 10.00 10.00 10.00 10.00 10.00 10.00 10.00 10.00<br />
Area 4. <strong>Freedom</strong> to Trade Internationally 9.67 9.72 9.49 9.07 9.30 8.29 8.24 7.96<br />
A. Tariffs 9.02 9.15 8.46 8.68 9.18 8.39 8.22 8.34<br />
(i) Revenue from trade taxes (% of trade sector) 9.80 (0.30) 9.80 (0.30) 9.73 (0.40) 9.73 (0.40) 9.78 (0.33) 9.59 (0.62) 9.44 (0.84) 9.63 (0.55)<br />
(ii) Mean tariff rate 8.24 (8.80) 8.50 (7.50) 8.52 (7.40) 8.66 (6.70) 9.52 (2.40) 9.46 (2.70) 8.94 (5.30) 8.98 (5.10)<br />
(iii) Standard deviation of tariff rates 7.12 (7.20) 7.64 (5.90) 8.24 (4.40) 6.13 (9.67) 6.29 (9.28) 6.41 (8.98)<br />
B. Regulatory trade barriers 8.28 8.86 8.07 8.53 7.35<br />
(i) Non-tariff trade barriers 8.28 8.22 7.21 8.12 7.69<br />
(ii) Compliance cost of importing and exporting 9.50 8.93 8.93 7.00<br />
C. Black-market exchange rates 10.00 10.00 10.00 10.00 10.00 10.00 10.00 10.00<br />
D. Controls of the movement of capital and people 10.00 10.00 10.00 9.31 9.17 6.69 6.20 6.15<br />
(i) Foreign ownership/investment restrictions 8.61 9.87 8.10 7.41 7.25<br />
(ii) Capital controls 10.00 10.00 10.00 10.00 8.46 5.38 4.62 4.62<br />
(iii) <strong>Freedom</strong> of foreigners to visit 6.58 6.58 6.58<br />
Area 5. Regulation 6.05 5.80 6.02 6.60 7.65 7.94 7.67 8.00<br />
A. Credit market regulations 8.60 8.11 8.40 9.47 10.00 9.61 9.23 9.52<br />
(i) Ownership of banks 10.00 10.00 10.00 10.00 10.00 10.00 10.00 10.00<br />
(ii) Private sector credit 5.80 4.33 5.21 8.41 10.00 8.84 7.68 8.57<br />
(iii) Interest rate controls/negative real interest rates 10.00 10.00 10.00 10.00 10.00 10.00 10.00 10.00<br />
B. Labor market regulations 3.49 3.49 3.63 4.93 5.01 6.64 7.39 7.38<br />
(i) Hiring regulations and minimum wage 3.87 5.12 8.90 8.90 8.90<br />
(ii) Hiring and firing regulations 3.77 3.77 3.10 2.59 3.15 3.17<br />
(iii) Centralized collective bargaining 4.49 4.49 4.49 4.49 4.17 3.84 4.27 4.23<br />
(iv) Hours regulations 2.99 2.99 3.25 2.55 2.67 6.00 8.00 8.00<br />
(v) Mandated cost of worker dismissal 8.52 10.00 10.00<br />
(vi) Conscription 3.00 3.00 3.00 10.00 10.00 10.00 10.00 10.00<br />
C. Business regulations 5.40 7.95 7.57 6.39 7.11<br />
(i) Administrative requirements 8.20 3.04 2.70 2.49<br />
(ii) Bureaucracy costs 6.49 8.88 7.94 1.90 6.72<br />
(iii) Starting a business 4.60 6.42 9.00 9.75 9.76<br />
(iv) Extra payments/bribes/favoritism 5.11 8.28 8.09 7.72 7.37<br />
(v) Licensing restrictions 8.04 8.05 8.07<br />
(vi) Cost of tax compliance 9.33 8.25 8.25
Belize<br />
Country Data Tables • 41<br />
1980 1985 1990 1995 2000 2005 2009 2010<br />
Chain-Linked Rating (Rank) Rating (Rank) Rating (Rank) Rating (Rank) Rating (Rank) Rating (Rank) Rating (Rank) Rating (Rank)<br />
Summary Rating (Rank) 5.69 (35) 5.42 (49) 6.10 (40) 6.86 (41) 6.54 (66) 6.90 (62) 6.81 (65) 6.68 (73)<br />
Area 1. Size of Government 5.19 (46) 5.38 (43) 5.20 (69) 6.79 (34) 6.68 (48) 6.84 (55) 6.57 (49) 6.44 (60)<br />
Area 2. Legal System and Property Rights 7.01 (40) 6.48 (54) 6.11 (61) 5.67 (70)<br />
Area 3. Sound Money 6.18 (57) 6.56 (60) 7.01 (45) 7.16 (52) 6.65 (93) 8.27 (62) 8.32 (63) 8.48 (64)<br />
Area 4. <strong>Freedom</strong> to Trade Internationally 4.13 (52) 2.58 (76) 4.27 (68) 5.71 (81) 5.19 (110) 5.52 (104) 5.43 (104) 5.34 (109)<br />
Area 5. Regulation 6.88 (15) 6.79 (18) 7.48 (10) 7.31 (14) 7.19 (31) 7.18 (40) 7.30 (29) 7.16 (40)<br />
Unadjusted<br />
Summary Rating (Rank) 5.59 (42) 5.40 (53) 5.90 (47) 6.36 (55) 6.38 (70) 7.33 (46) 7.23 (46) 6.68 (88)<br />
Rating (Data) Rating (Data) Rating (Data) Rating (Data) Rating (Data) Rating (Data) Rating (Data) Rating (Data)<br />
Area 1. Size of Government 5.18 5.03 4.86 6.34 6.68 6.84 6.57 6.44<br />
A. Government consumption 6.10 (19.25) 4.96 (23.15) 5.62 (20.90) 6.56 (17.70) 6.35 (18.42) 6.82 (16.81) 6.02 (19.53) 5.63 (20.87)<br />
B. Transfers and subsidies 9.43 (2.60) 9.16 (3.60) 9.81 (1.20) 9.81 (1.20) 9.69 (1.64) 9.69 (1.64) 9.69 (1.64) 9.69 (1.64)<br />
C. Government enterprises and investment 0.00 (51.00) 2.00 (49.80) 0.00 (55.40) 4.00 (36.10) 4.00 (36.10) 4.00 (36.10) 4.00 4.00<br />
D. Top marginal tax rate 4.00 4.00 5.00<br />
(i) Top marginal income tax rate 4.00 (50) 4.00 (45) 5.00 (45)<br />
(ii) Top marginal income and payroll tax rate<br />
Area 2. Legal System and Property Rights 5.26 6.19 5.84 5.50 4.36<br />
A. Judicial independence 3.43<br />
B. Impartial courts 5.72 6.87 5.60 4.90 3.48<br />
C. Protection of property rights 4.73<br />
D. Military interference in rule of law and politics 7.15 7.10 6.50 6.30<br />
E. Integrity of the legal system<br />
F. Legal enforcement of contracts 3.33 3.33 3.33<br />
G. Regulatory restrictions on sale of real property 7.32 7.29 7.32<br />
H. Reliability of police 3.03<br />
I. Business costs of crime 3.24<br />
Area 3. Sound Money 6.18 6.56 7.01 7.16 6.65 8.27 8.32 8.48<br />
A. Money growth 8.50 (7.48) 9.12 (4.39) 9.29 (3.53) 9.83 (−0.84) 8.46 (7.70) 9.74 (−1.28) 9.14 (4.32) 9.80 (1.01)<br />
B. Standard deviation of inflation 8.50 (3.76) 7.50 (6.25) 8.81 (2.98) 9.61 (0.98) 8.28 (4.30) 9.07 (2.31) 9.35 (1.63) 9.30 (1.74)<br />
C. Inflation: most recent year 7.72 (11.40) 9.62 (−1.88) 9.95 (0.26) 9.21 (3.94) 9.88 (0.61) 9.27 (3.64) 9.78 (−1.08) 9.82 (0.89)<br />
D. <strong>Freedom</strong> to own foreign currency bank accounts 0.00 0.00 0.00 0.00 0.00 5.00 5.00 5.00<br />
Area 4. <strong>Freedom</strong> to Trade Internationally 4.13 3.22 4.27 5.71 5.19 6.59 6.47 6.23<br />
A. Tariffs 4.20 4.67 2.80 2.73 5.61 6.20 6.13 6.13<br />
(i) Revenue from trade taxes (% of trade sector) 4.20 (8.70) 2.73 (10.90) 2.80 (10.80) 2.73 (10.90) 5.61 (6.59) 5.61 (6.59) 5.61 (6.59) 5.61 (6.59)<br />
(ii) Mean tariff rate 6.60 (17.00) 7.84 (10.80) 7.80 (11.00) 7.80 (11.00)<br />
(iii) Standard deviation of tariff rates 5.16 (12.10) 4.98 (12.54) 4.98 (12.54)<br />
B. Regulatory trade barriers 7.09 7.09 5.29<br />
(i) Non-tariff trade barriers 3.90<br />
(ii) Compliance cost of importing and exporting 7.09 7.09 6.69<br />
C. Black-market exchange rates 3.20 0.00 5.00 9.40 9.20 10.00 10.00 10.00<br />
D. Controls of the movement of capital and people 5.00 5.00 5.00 5.00 0.77 3.05 2.66 3.50<br />
(i) Foreign ownership/investment restrictions 5.16<br />
(ii) Capital controls 5.00 5.00 5.00 5.00 0.77 0.77 0.00 0.00<br />
(iii) <strong>Freedom</strong> of foreigners to visit 5.33 5.33 5.33<br />
Area 5. Regulation 6.87 6.78 7.48 7.31 7.19 9.12 9.27 7.91<br />
A. Credit market regulations 8.11 7.83 9.94 9.48 9.15 9.49 9.80 9.70<br />
(i) Ownership of banks 10.00 10.00 10.00 10.00 10.00 10.00<br />
(ii) Private sector credit 8.22 7.67 9.82 8.44 8.46 8.46 9.39 9.11<br />
(iii) Interest rate controls/negative real interest rates 8.00 8.00 10.00 10.00 9.00 10.00 10.00 10.00<br />
B. Labor market regulations 9.17 9.26 8.18<br />
(i) Hiring regulations and minimum wage 8.90 8.90 7.77<br />
(ii) Hiring and firing regulations 6.03<br />
(iii) Centralized collective bargaining 7.12<br />
(iv) Hours regulations 10.00 10.00 10.00<br />
(v) Mandated cost of worker dismissal 7.78 8.15 8.15<br />
(vi) Conscription 10.00 10.00 10.00 10.00 10.00 10.00 10.00 10.00<br />
C. Business regulations 8.70 8.75 5.84<br />
(i) Administrative requirements 3.16<br />
(ii) Bureaucracy costs 3.26<br />
(iii) Starting a business 7.96 8.09 8.05<br />
(iv) Extra payments/bribes/favoritism 2.84<br />
(v) Licensing restrictions 9.81 9.81 9.38<br />
(vi) Cost of tax compliance 8.35 8.35 8.35<br />
www.freetheworld.com • www.fraserinstitute.org • Fraser Institute ©2012
42 • <strong>Economic</strong> <strong>Freedom</strong> of the <strong>World</strong>: 2012 Annual Report<br />
Benin<br />
Fraser Institute ©2012 • www.fraserinstitute.org • www.freetheworld.com<br />
1980 1985 1990 1995 2000 2005 2009 2010<br />
Chain-Linked Rating (Rank) Rating (Rank) Rating (Rank) Rating (Rank) Rating (Rank) Rating (Rank) Rating (Rank) Rating (Rank)<br />
Summary Rating (Rank) 5.23 (56) 4.98 (67) 5.25 (69) 4.92 (101) 5.49 (103) 5.55 (111) 5.81 (106) 5.79 (108)<br />
Area 1. Size of Government 4.67 (64) 3.60 (92) 4.17 (92) 4.04 (103) 4.72 (98) 5.17 (97) 5.36 (94) 5.42 (93)<br />
Area 2. Legal System and Property Rights 4.67 (46) 4.25 (68) 4.42 (69) 4.60 (96) 4.42 (94) 5.25 (75) 6.21 (57) 5.95 (60)<br />
Area 3. Sound Money 6.23 (55) 6.40 (70) 6.57 (62) 5.26 (86) 6.62 (95) 6.56 (102) 6.72 (102) 6.80 (99)<br />
Area 4. <strong>Freedom</strong> to Trade Internationally 5.87 (90) 5.57 (101) 5.51 (103) 5.59 (106)<br />
Area 5. Regulation 5.01 (69) 5.31 (62) 5.45 (68) 5.43 (80) 5.80 (91) 5.45 (107) 5.69 (108) 5.57 (112)<br />
Unadjusted<br />
Summary Rating (Rank) 4.98 (60) 4.64 (82) 5.03 (74) 4.67 (103) 5.47 (104) 5.97 (112) 6.20 (108) 6.18 (115)<br />
Rating (Data) Rating (Data) Rating (Data) Rating (Data) Rating (Data) Rating (Data) Rating (Data) Rating (Data)<br />
Area 1. Size of Government 4.67 3.60 4.17 4.04 4.72 7.00 7.03 7.12<br />
A. Government consumption 9.35 (8.22) 7.21 (15.50) 8.34 (11.66) 8.08 (12.53) 7.45 (14.68) 6.99 (16.23) 7.40 (14.83) 7.82 (13.40)<br />
B. Transfers and subsidies 10.00 (0.20) 9.71 (1.55) 9.64 (1.83)<br />
C. Government enterprises and investment 0.00 (53.70) 0.00 (53.50) 0.00 (55.20) 0.00 (60.10) 2.00 (40.31) 4.00 (35.40) 4.00 (38.37) 4.00 (38.15)<br />
D. Top marginal tax rate 7.00 7.00<br />
(i) Top marginal income tax rate 7.00 (35) 7.00 (35)<br />
(ii) Top marginal income and payroll tax rate<br />
Area 2. Legal System and Property Rights 4.67 4.25 4.42 4.46 4.33 3.99 4.72 4.52<br />
A. Judicial independence 4.59 3.75 3.47<br />
B. Impartial courts 4.81 4.55 4.07 4.26 3.93<br />
C. Protection of property rights 4.39 6.12 5.55<br />
D. Military interference in rule of law and politics 3.82 4.70 7.10 7.50 7.10<br />
E. Integrity of the legal system 5.18 4.00<br />
F. Legal enforcement of contracts 1.07 1.07 1.07<br />
G. Regulatory restrictions on sale of real property 2.73 3.85 3.85<br />
H. Reliability of police 3.87 5.85 5.17<br />
I. Business costs of crime 4.06 5.36 6.04<br />
Area 3. Sound Money 6.23 6.40 6.57 5.26 6.62 6.56 6.72 6.80<br />
A. Money growth 8.22 (8.91) 9.32 (3.38) 9.18 (4.08) 9.11 (4.44) 8.05 (9.76) 8.42 (−7.91) 8.30 (8.48) 8.73 (6.35)<br />
B. Standard deviation of inflation 8.74 (3.15) 7.24 (6.89) 8.34 (4.16) 4.98 (12.54) 9.26 (1.86) 8.89 (2.79) 9.01 (2.47) 8.95 (2.64)<br />
C. Inflation: most recent year 7.96 (10.19) 9.02 (−4.88) 8.78 (6.11) 6.93 (15.37) 9.17 (4.17) 8.93 (5.36) 9.57 (2.16) 9.54 (2.31)<br />
D. <strong>Freedom</strong> to own foreign currency bank accounts 0.00 0.00 0.00 0.00 0.00 0.00 0.00 0.00<br />
Area 4. <strong>Freedom</strong> to Trade Internationally 4.18 4.11 5.87 5.79 5.73 5.81<br />
A. Tariffs 2.93 2.52 7.60 5.86 5.39 4.97<br />
(i) Revenue from trade taxes (% of trade sector) 2.93 (10.60) 3.20 (10.20) 1.27 (13.10) 0.00 (15.70)<br />
(ii) Mean tariff rate 2.52 (37.40) 7.60 (12.00) 7.12 (14.40) 7.62 (11.90) 7.62 (11.90)<br />
(iii) Standard deviation of tariff rates 7.26 (6.84) 7.29 (6.78) 7.29 (6.78)<br />
B. Regulatory trade barriers 5.31 5.46 6.03<br />
(i) Non-tariff trade barriers 5.67 5.26 5.05<br />
(ii) Compliance cost of importing and exporting 4.94 5.65 7.00<br />
C. Black-market exchange rates 9.60 9.80 9.20 9.80 10.00 10.00 10.00 10.00<br />
D. Controls of the movement of capital and people 0.00 0.00 0.00 0.00 0.00 1.99 2.07 2.24<br />
(i) Foreign ownership/investment restrictions 5.97 5.43 5.94<br />
(ii) Capital controls 0.00 0.00 0.00 0.00 0.00 0.00 0.77 0.77<br />
(iii) <strong>Freedom</strong> of foreigners to visit 0.00 0.00 0.00<br />
Area 5. Regulation 5.15 4.83 4.96 4.94 5.80 6.51 6.80 6.66<br />
A. Credit market regulations 5.31 5.92 6.25 6.20 9.42 9.13 9.23 9.23<br />
(i) Ownership of banks 0.00 0.00 2.00 10.00 10.00 10.00 10.00 10.00<br />
(ii) Private sector credit 9.94 9.76 8.76 6.60 8.84 9.38 9.69 9.69<br />
(iii) Interest rate controls/negative real interest rates 6.00 8.00 8.00 2.00 8.00 8.00 8.00<br />
B. Labor market regulations 5.38 5.84 5.87<br />
(i) Hiring regulations and minimum wage 6.10 6.10 6.10<br />
(ii) Hiring and firing regulations 5.70 5.78 5.61<br />
(iii) Centralized collective bargaining 6.83 7.10 7.42<br />
(iv) Hours regulations 6.00 8.00 8.00<br />
(v) Mandated cost of worker dismissal 6.66 7.09 7.09<br />
(vi) Conscription 1.00 1.00 1.00 1.00 1.00 1.00 1.00<br />
C. Business regulations 5.03 5.32 4.87<br />
(i) Administrative requirements 2.40 4.43 4.12<br />
(ii) Bureaucracy costs 6.51 5.67 3.54<br />
(iii) Starting a business 5.57 6.47 6.58<br />
(iv) Extra payments/bribes/favoritism 3.85 3.14 3.23<br />
(v) Licensing restrictions 4.89 5.25 4.76<br />
(vi) Cost of tax compliance 6.97 6.97 6.97
Bolivia<br />
Country Data Tables • 43<br />
1980 1985 1990 1995 2000 2005 2009 2010<br />
Chain-Linked Rating (Rank) Rating (Rank) Rating (Rank) Rating (Rank) Rating (Rank) Rating (Rank) Rating (Rank) Rating (Rank)<br />
Summary Rating (Rank) 4.18 (81) 3.44 (102) 5.42 (64) 6.60 (46) 6.97 (44) 6.38 (82) 6.34 (87) 6.36 (94)<br />
Area 1. Size of Government 4.95 (56) 7.06 (6) 6.94 (21) 6.68 (37) 7.97 (13) 6.14 (82) 6.30 (64) 6.31 (66)<br />
Area 2. Legal System and Property Rights 1.79 (86) 1.29 (108) 2.45 (99) 4.59 (97) 3.43 (111) 3.40 (107) 3.23 (112) 3.59 (107)<br />
Area 3. Sound Money 0.00 (107) 0.00 (111) 5.59 (84) 8.10 (39) 9.32 (28) 8.90 (43) 8.73 (53) 8.70 (61)<br />
Area 4. <strong>Freedom</strong> to Trade Internationally 4.03 (54) 5.05 (48) 6.02 (42) 7.35 (47) 7.97 (38) 7.41 (48) 7.20 (58) 7.12 (61)<br />
Area 5. Regulation 6.22 (40) 5.93 (56) 6.18 (71) 6.03 (93) 6.25 (95) 6.04 (97)<br />
Unadjusted<br />
Summary Rating (Rank) 4.10 (84) 3.47 (103) 5.65 (52) 6.80 (39) 6.97 (42) 6.41 (95) 6.37 (100) 6.39 (104)<br />
Rating (Data) Rating (Data) Rating (Data) Rating (Data) Rating (Data) Rating (Data) Rating (Data) Rating (Data)<br />
Area 1. Size of Government 4.86 6.93 6.81 6.56 7.97 6.14 6.30 6.31<br />
A. Government consumption 6.75 (17.05) 8.08 (12.52) 7.86 (13.27) 7.28 (15.24) 7.12 (15.80) 6.03 (19.51) 6.37 (18.34) 6.42 (18.17)<br />
B. Transfers and subsidies 9.70 (1.60) 9.65 (1.80) 9.37 (2.80) 9.46 (2.50) 8.76 (5.04) 8.54 (5.86) 8.84 (4.77) 8.84 (4.77)<br />
C. Government enterprises and investment 0.00 (50.10) 2.00 (42.50) 0.00 (60.60) 0.00 (51.20) 6.00 (28.30) 0.00 (50.70) 0.00 (59.86) 0.00 (57.02)<br />
D. Top marginal tax rate 3.00 8.00 10.00 9.50 10.00 10.00 10.00 10.00<br />
(i) Top marginal income tax rate 3.00 (48) 8.00 (30) 10.00 (10) 10.00 (13) 10.00 (13) 10.00 (13) 10.00 (13) 10.00 (13)<br />
(ii) Top marginal income and payroll tax rate 10.00 (16) 9.00 (22) 10.00 (13) 10.00 (13) 10.00 (13)<br />
Area 2. Legal System and Property Rights 2.32 1.67 3.17 5.43 3.43 3.88 3.68 4.09<br />
A. Judicial independence 2.17 2.49 2.19 3.37<br />
B. Impartial courts 4.93 3.34 2.48 2.32 3.20<br />
C. Protection of property rights 1.65 3.48 1.99 2.80<br />
D. Military interference in rule of law and politics 5.93 5.00 5.00 5.00 5.00<br />
E. Integrity of the legal system 6.96 5.00 5.00 4.17 4.17<br />
F. Legal enforcement of contracts 3.99 3.99 3.99<br />
G. Regulatory restrictions on sale of real property 6.62 6.68 6.68<br />
H. Reliability of police 2.17 1.88 4.77<br />
I. Business costs of crime 3.65 4.93 2.85<br />
Area 3. Sound Money 5.38 0.00 5.59 8.10 9.32 8.90 8.73 8.70<br />
A. Money growth 7.19 (14.07) 0.00 (546.64) 5.62 (21.92) 6.28 (18.59) 9.54 (2.28) 7.69 (11.54) 7.88 (10.60) 7.58 (12.10)<br />
B. Standard deviation of inflation 3.81 (15.47) 0.00 (4769.22) 0.00 (85.90) 8.42 (3.95) 8.66 (3.36) 9.00 (2.50) 7.72 (5.70) 7.72 (5.71)<br />
C. Inflation: most recent year 0.54 (47.30) 0.00 (12336.70) 6.75 (16.26) 7.71 (11.43) 9.08 (4.60) 8.92 (5.40) 9.33 (3.35) 9.50 (2.50)<br />
D. <strong>Freedom</strong> to own foreign currency bank accounts 10.00 0.00 10.00 10.00 10.00 10.00 10.00 10.00<br />
Area 4. <strong>Freedom</strong> to Trade Internationally 4.13 5.30 6.32 7.85 7.97 7.29 7.08 7.00<br />
A. Tariffs 4.80 5.69 7.56 8.74 8.62 8.84 8.26 7.92<br />
(i) Revenue from trade taxes (% of trade sector) 4.80 (7.80) 5.33 (7.00) 8.47 (2.30) 8.60 (2.10) 8.41 (2.38) 9.16 (1.26) 9.24 (1.14) 9.24 (1.14)<br />
(ii) Mean tariff rate 6.04 (19.80) 6.66 (16.70) 8.06 (9.70) 8.10 (9.50) 8.56 (7.20) 7.94 (10.30) 7.76 (11.20)<br />
(iii) Standard deviation of tariff rates 9.56 (1.10) 9.36 (1.60) 8.80 (2.99) 7.61 (5.97) 6.77 (8.06)<br />
B. Regulatory trade barriers 5.49 4.90 5.70 5.72<br />
(i) Non-tariff trade barriers 4.82 3.90 4.26 4.38<br />
(ii) Compliance cost of importing and exporting 6.16 5.90 7.14 7.06<br />
C. Black-market exchange rates 5.60 8.20 9.40 9.80 10.00 10.00 10.00 10.00<br />
D. Controls of the movement of capital and people 2.00 2.00 2.00 5.00 7.78 5.42 4.35 4.35<br />
(i) Foreign ownership/investment restrictions 8.63 4.91 4.02 4.02<br />
(ii) Capital controls 2.00 2.00 2.00 5.00 6.92 6.92 4.62 4.62<br />
(iii) <strong>Freedom</strong> of foreigners to visit 4.42 4.42 4.42<br />
Area 5. Regulation 3.81 6.37 6.08 6.18 5.84 6.06 5.85<br />
A. Credit market regulations 2.49 0.00 9.33 8.55 9.21 8.69 9.00 9.00<br />
(i) Ownership of banks 10.00 8.00 10.00 8.00 8.00 8.00<br />
(ii) Private sector credit 4.97 10.00 9.65 9.63 9.06 10.00 10.00<br />
(iii) Interest rate controls/negative real interest rates 0.00 0.00 8.00 8.00 8.00 9.00 9.00 9.00<br />
B. Labor market regulations 4.73 4.57 4.60 4.54<br />
(i) Hiring regulations and minimum wage 3.09 2.20 2.23 2.23<br />
(ii) Hiring and firing regulations 4.90 5.45 3.66 4.12<br />
(iii) Centralized collective bargaining 7.13 7.50 6.09 5.37<br />
(iv) Hours regulations 5.51 4.70 8.00 8.00<br />
(v) Mandated cost of worker dismissal<br />
(vi) Conscription 3.00 3.00 3.00 3.00 3.00 3.00 3.00 3.00<br />
C. Business regulations 4.59 4.26 4.57 4.02<br />
(i) Administrative requirements 5.50 2.55 3.66 3.65<br />
(ii) Bureaucracy costs 3.85 4.00 6.43 3.25<br />
(iii) Starting a business 3.87 6.81 7.33 7.44<br />
(iv) Extra payments/bribes/favoritism 5.14 4.72 3.33 3.05<br />
(v) Licensing restrictions 7.51 6.66 6.72<br />
(vi) Cost of tax compliance 0.00 0.00 0.00<br />
www.freetheworld.com • www.fraserinstitute.org • Fraser Institute ©2012
44 • <strong>Economic</strong> <strong>Freedom</strong> of the <strong>World</strong>: 2012 Annual Report<br />
Bosnia and Herzegovina<br />
1980 1985 1990 1995 2000 2005 2009 2010<br />
Chain-Linked Rating (Rank) Rating (Rank) Rating (Rank) Rating (Rank) Rating (Rank) Rating (Rank) Rating (Rank) Rating (Rank)<br />
Summary Rating (Rank) <br />
Area 1. Size of Government<br />
Area 2. Legal System and Property Rights<br />
Area 3. Sound Money<br />
Area 4. <strong>Freedom</strong> to Trade Internationally<br />
Area 5. Regulation<br />
Unadjusted<br />
Summary Rating (Rank) 6.20 (101) 6.48 (92) 6.61 (93)<br />
Rating (Data) Rating (Data) Rating (Data) Rating (Data) Rating (Data) Rating (Data) Rating (Data) Rating (Data)<br />
Area 1. Size of Government 5.48 5.49 5.53<br />
A. Government consumption 5.76 (20.42) 5.58 (21.03) 5.64 (20.82)<br />
B. Transfers and subsidies 5.65 (16.46) 5.87 (15.66) 6.00 (15.19)<br />
C. Government enterprises and investment 4.00 (33.18) 4.00 (35.25) 4.00 (37.09)<br />
D. Top marginal tax rate 6.50 6.50 6.50<br />
(i) Top marginal income tax rate 10.00 (15) 10.00 (10) 10.00 (10)<br />
(ii) Top marginal income and payroll tax rate 3.00 (50) 3.00 (47) 3.00 (47)<br />
Area 2. Legal System and Property Rights 3.58 4.44 4.57<br />
A. Judicial independence 3.54 2.62 3.44<br />
B. Impartial courts 3.26 2.23 3.09<br />
C. Protection of property rights 3.26 2.82 3.22<br />
D. Military interference in rule of law and politics<br />
E. Integrity of the legal system<br />
4.20 4.80 4.50<br />
F. Legal enforcement of contracts 3.65 3.53 3.53<br />
G. Regulatory restrictions on sale of real property 3.36 7.63 7.63<br />
H. Reliability of police 2.83 5.24 5.76<br />
I. Business costs of crime 4.51 6.66 5.40<br />
Area 3. Sound Money 8.42 8.30 8.27<br />
A. Money growth 9.80 (1.00) 9.59 (2.06) 9.88 (0.58)<br />
B. Standard deviation of inflation 9.32 (1.70) 8.69 (3.27) 8.62 (3.46)<br />
C. Inflation: most recent year 9.57 (2.13) 9.93 (−0.37) 9.56 (2.19)<br />
D. <strong>Freedom</strong> to own foreign currency bank accounts 5.00 5.00 5.00<br />
Area 4. <strong>Freedom</strong> to Trade Internationally 6.75 7.43 7.64<br />
A. Tariffs 5.93 8.34 8.44<br />
(i) Revenue from trade taxes (% of trade sector) 3.89 (9.16) 10.00 (0.00) 10.00 (0.00)<br />
(ii) Mean tariff rate 8.56 (7.20) 8.68 (6.60) 8.70 (6.50)<br />
(iii) Standard deviation of tariff rates 5.33 (11.66) 6.33 (9.17) 6.62 (8.45)<br />
B. Regulatory trade barriers 6.22 6.66 7.08<br />
(i) Non-tariff trade barriers 5.67 5.49 5.66<br />
(ii) Compliance cost of importing and exporting 6.76 7.82 8.50<br />
C. Black-market exchange rates 10.00 10.00 10.00<br />
D. Controls of the movement of capital and people 4.85 4.74 5.06<br />
(i) Foreign ownership/investment restrictions 5.25 4.92 5.12<br />
(ii) Capital controls 3.85 3.85 4.62<br />
(iii) <strong>Freedom</strong> of foreigners to visit 5.44 5.44 5.44<br />
Area 5. Regulation 6.77 6.73 7.02<br />
A. Credit market regulations 9.33 8.24 9.49<br />
(i) Ownership of banks 8.00 8.00 10.00<br />
(ii) Private sector credit 10.00 6.71 8.48<br />
(iii) Interest rate controls/negative real interest rates 10.00 10.00 10.00<br />
B. Labor market regulations 6.09 6.62 6.43<br />
(i) Hiring regulations and minimum wage 3.30 3.33 3.33<br />
(ii) Hiring and firing regulations 4.57 6.69 5.87<br />
(iii) Centralized collective bargaining 7.87 7.40 7.03<br />
(iv) Hours regulations 8.70 10.00 10.00<br />
(v) Mandated cost of worker dismissal 7.13 7.32 7.32<br />
(vi) Conscription 5.00 5.00 5.00<br />
C. Business regulations 4.90 5.34 5.13<br />
(i) Administrative requirements 1.99 3.05 2.97<br />
(ii) Bureaucracy costs 6.16 6.27 4.00<br />
(iii) Starting a business 7.72 7.95 8.44<br />
(iv) Extra payments/bribes/favoritism 5.22 3.78 4.13<br />
(v) Licensing restrictions 2.41 5.71 5.95<br />
(vi) Cost of tax compliance 5.87 5.27 5.27<br />
Fraser Institute ©2012 • www.fraserinstitute.org • www.freetheworld.com
Country Data Tables • 45<br />
Botswana 1980 1985 1990 1995 2000 2005 2009 2010<br />
Chain-Linked Rating (Rank) Rating (Rank) Rating (Rank) Rating (Rank) Rating (Rank) Rating (Rank) Rating (Rank) Rating (Rank)<br />
Summary Rating (Rank) 5.25 (55) 5.57 (44) 5.92 (45) 6.40 (56) 7.42 (32) 7.11 (52) 7.18 (45) 7.24 (46)<br />
Area 1. Size of Government 3.62 (89) 3.78 (88) 4.74 (82) 4.29 (99) 4.76 (96) 4.54 (110) 4.90 (103) 5.03 (101)<br />
Area 2. Legal System and Property Rights 6.31 (28) 6.28 (32) 7.23 (31) 7.81 (27) 7.83 (24) 8.04 (23) 8.16 (19)<br />
Area 3. Sound Money 5.49 (80) 5.46 (90) 5.84 (76) 7.85 (43) 9.09 (37) 8.80 (50) 8.42 (61) 8.33 (69)<br />
Area 4. <strong>Freedom</strong> to Trade Internationally 5.81 (36) 5.76 (37) 6.63 (39) 6.26 (71) 7.92 (42) 7.15 (60) 7.18 (61) 7.33 (53)<br />
Area 5. Regulation 5.96 (37) 6.46 (29) 6.12 (42) 6.37 (43) 7.51 (13) 7.26 (33) 7.44 (22) 7.40 (29)<br />
Unadjusted<br />
Summary Rating (Rank) 5.34 (51) 5.66 (41) 5.92 (45) 6.23 (58) 7.21 (39) 6.91 (68) 6.98 (67) 7.03 (67)<br />
Rating (Data) Rating (Data) Rating (Data) Rating (Data) Rating (Data) Rating (Data) Rating (Data) Rating (Data)<br />
Area 1. Size of Government 3.62 3.78 4.74 4.29 4.76 4.54 4.90 5.03<br />
A. Government consumption 3.68 (27.50) 0.97 (36.71) 1.63 (34.45) 0.00 (45.92) 0.00 (49.02) 0.00 (43.91) 3.44 (28.29) 3.94 (26.59)<br />
B. Transfers and subsidies 8.80 (4.90) 8.15 (7.30) 8.34 (6.60) 8.17 (7.20) 8.04 (7.70) 7.16 (10.91) 7.16 (10.91) 7.16 (10.91)<br />
C. Government enterprises and investment 2.00 (44.90) 4.00 (39.40) 6.00 (26.50) 2.00 (46.20) 2.00 (46.20) 2.00 (40.60) 0.00 (53.63) 0.00 (50.17)<br />
D. Top marginal tax rate 0.00 2.00 3.00 7.00 9.00 9.00 9.00 9.00<br />
(i) Top marginal income tax rate 0.00 (75) 2.00 (60) 3.00 (50) 7.00 (35) 9.00 (25) 9.00 (25) 9.00 (25) 9.00 (25)<br />
(ii) Top marginal income and payroll tax rate 3.00 (50) 7.00 (35) 9.00 (25) 9.00 (25) 9.00 (25) 9.00 (25)<br />
Area 2. Legal System and Property Rights 6.31 6.28 6.35 6.77 6.53 6.71 6.81<br />
A. Judicial independence 7.22 7.00 7.27<br />
B. Impartial courts 6.45 6.76 6.57 5.94 6.32<br />
C. Protection of property rights 6.43 7.17 6.86<br />
D. Military interference in rule of law and politics 8.29 10.00 10.00 10.00 10.00<br />
E. Integrity of the legal system 6.96 6.67 6.67 5.83 5.83<br />
F. Legal enforcement of contracts 3.30 4.05 4.05<br />
G. Regulatory restrictions on sale of real property 8.18 8.05 8.05<br />
H. Reliability of police 5.22 6.36 6.41<br />
I. Business costs of crime 5.15 5.95 6.45<br />
Area 3. Sound Money 5.49 5.46 5.84 7.85 9.09 8.80 8.42 8.33<br />
A. Money growth 9.32 (3.41) 9.91 (0.44) 8.00 (9.98) 9.98 (−0.09) 9.86 (0.72) 8.55 (−7.27) 8.83 (5.87) 8.37 (8.14)<br />
B. Standard deviation of inflation 6.44 (8.90) 6.46 (8.86) 6.55 (8.62) 8.28 (4.30) 8.24 (4.40) 8.40 (4.01) 6.47 (8.82) 6.36 (9.11)<br />
C. Inflation: most recent year 6.18 (19.08) 5.47 (22.67) 8.79 (6.03) 8.14 (9.31) 8.28 (8.60) 8.28 (8.61) 8.39 (8.03) 8.61 (6.95)<br />
D. <strong>Freedom</strong> to own foreign currency bank accounts 0.00 0.00 0.00 5.00 10.00 10.00 10.00 10.00<br />
Area 4. <strong>Freedom</strong> to Trade Internationally 5.93 5.88 6.63 6.26 7.92 7.17 7.20 7.35<br />
A. Tariffs 4.79 7.03 6.29 4.18 6.84 6.27 6.57 6.50<br />
(i) Revenue from trade taxes (% of trade sector) 1.47 (12.80) 5.27 (7.10) 5.60 (6.60) 5.25 (7.13) 5.96 (6.06) 5.96 (6.06) 5.96 (6.06) 5.96 (6.06)<br />
(ii) Mean tariff rate 8.12 (9.40) 8.80 (6.00) 7.80 (11.00) 6.06 (19.70) 8.56 (7.20) 8.02 (9.90) 8.46 (7.70) 8.46 (7.70)<br />
(iii) Standard deviation of tariff rates 5.48 (11.30) 1.24 (21.90) 6.00 (10.00) 4.82 (12.96) 5.29 (11.78) 5.07 (12.32)<br />
B. Regulatory trade barriers 5.52 5.77 6.40<br />
(i) Non-tariff trade barriers 6.33 6.27 6.36<br />
(ii) Compliance cost of importing and exporting 4.71 5.26 6.44<br />
C. Black-market exchange rates 8.00 5.60 8.60 9.60 10.00 10.00 10.00 10.00<br />
D. Controls of the movement of capital and people 5.00 5.00 5.00 5.00 6.92 6.88 6.45 6.52<br />
(i) Foreign ownership/investment restrictions 6.90 7.15 7.37<br />
(ii) Capital controls 5.00 5.00 5.00 5.00 6.92 6.92 5.38 5.38<br />
(iii) <strong>Freedom</strong> of foreigners to visit 6.80 6.80 6.80<br />
Area 5. Regulation 6.32 6.86 6.12 6.37 7.51 7.49 7.67 7.63<br />
A. Credit market regulations 6.47 8.07 6.33 7.00 10.00 9.33 9.11 8.87<br />
(i) Ownership of banks 5.00 5.00 10.00 8.00 8.00 8.00<br />
(ii) Private sector credit 8.95 8.14 10.00 10.00 10.00 10.00 9.33 9.60<br />
(iii) Interest rate controls/negative real interest rates 4.00 8.00 4.00 6.00 10.00 10.00 10.00 9.00<br />
B. Labor market regulations 7.09 7.21 7.09<br />
(i) Hiring regulations and minimum wage 10.00 10.00 10.00<br />
(ii) Hiring and firing regulations 4.14 4.88 4.12<br />
(iii) Centralized collective bargaining 6.72 6.14 6.21<br />
(iv) Hours regulations 10.00 10.00 10.00<br />
(v) Mandated cost of worker dismissal 1.66 2.21 2.21<br />
(vi) Conscription 10.00 10.00 10.00 10.00 10.00 10.00 10.00 10.00<br />
C. Business regulations 6.04 6.68 6.94<br />
(i) Administrative requirements 3.55 4.31 4.71<br />
(ii) Bureaucracy costs 3.41 5.15 5.99<br />
(iii) Starting a business 6.56 8.02 8.03<br />
(iv) Extra payments/bribes/favoritism 6.91 6.59 6.44<br />
(v) Licensing restrictions 7.41 7.72 8.19<br />
(vi) Cost of tax compliance 8.43 8.30 8.30<br />
www.freetheworld.com • www.fraserinstitute.org • Fraser Institute ©2012
46 • <strong>Economic</strong> <strong>Freedom</strong> of the <strong>World</strong>: 2012 Annual Report<br />
Brazil<br />
Fraser Institute ©2012 • www.fraserinstitute.org • www.freetheworld.com<br />
1980 1985 1990 1995 2000 2005 2009 2010<br />
Chain-Linked Rating (Rank) Rating (Rank) Rating (Rank) Rating (Rank) Rating (Rank) Rating (Rank) Rating (Rank) Rating (Rank)<br />
Summary Rating (Rank) 3.83 (89) 3.28 (104) 4.46 (93) 4.72 (103) 5.93 (89) 6.27 (86) 6.32 (88) 6.42 (89)<br />
Area 1. Size of Government 4.61 (68) 4.44 (72) 6.07 (44) 6.13 (60) 5.98 (71) 6.73 (59) 6.58 (48) 6.63 (54)<br />
Area 2. Legal System and Property Rights 5.86 (34) 5.72 (42) 6.19 (36) 5.76 (59) 5.35 (74) 4.77 (83) 5.19 (78) 5.24 (77)<br />
Area 3. Sound Money 0.00 (107) 0.00 (111) 0.00 (118) 0.00 (121) 6.14 (106) 7.64 (76) 7.93 (75) 8.00 (76)<br />
Area 4. <strong>Freedom</strong> to Trade Internationally 1.36 (82) 1.13 (90) 5.14 (53) 6.83 (59) 6.67 (74) 7.13 (61) 6.97 (69) 7.11 (62)<br />
Area 5. Regulation 5.16 (63) 4.58 (81) 4.74 (89) 4.99 (90) 5.53 (96) 5.05 (117) 4.89 (119) 5.06 (116)<br />
Unadjusted<br />
Summary Rating (Rank) 4.18 (82) 3.22 (105) 4.18 (98) 4.65 (104) 5.93 (86) 6.22 (100) 6.27 (105) 6.37 (105)<br />
Rating (Data) Rating (Data) Rating (Data) Rating (Data) Rating (Data) Rating (Data) Rating (Data) Rating (Data)<br />
Area 1. Size of Government 5.27 5.08 6.07 6.13 5.98 6.73 6.58 6.63<br />
A. Government consumption 8.34 (11.65) 7.93 (13.05) 4.55 (24.55) 4.51 (24.66) 4.44 (24.90) 4.43 (24.94) 4.09 (26.10) 4.15 (25.90)<br />
B. Transfers and subsidies 6.76 (12.40) 7.41 (10.00) 7.22 (10.70) 6.52 (13.27) 5.96 (15.33) 8.98 (4.24) 7.75 (8.76) 7.86 (8.34)<br />
C. Government enterprises and investment 2.00 (49.20) 4.00 (36.00) 7.00 (24.90) 8.00 (17.80) 8.00 (17.80) 8.00 (17.80) 8.00 (15.15) 8.00 (15.15)<br />
D. Top marginal tax rate 4.00 1.00 5.50 5.50 5.50 5.50 6.50 6.50<br />
(i) Top marginal income tax rate 4.00 (55) 1.00 (60) 9.00 (25) 8.00 (35) 8.00 (28) 8.00 (28) 8.00 (28) 8.00 (28)<br />
(ii) Top marginal income and payroll tax rate 2.00 (53) 3.00 (60) 3.00 (50) 3.00 (50) 5.00 (36) 5.00 (36)<br />
Area 2. Legal System and Property Rights 5.86 5.72 6.19 5.76 5.35 4.69 5.10 5.16<br />
A. Judicial independence 5.55 5.51 3.03 4.20 4.56<br />
B. Impartial courts 6.67 6.18 3.42 4.06 4.30<br />
C. Protection of property rights 4.15 5.08 6.02 5.45 5.69<br />
D. Military interference in rule of law and politics 5.45 6.67 6.67 6.67 6.67<br />
E. Integrity of the legal system 6.96 3.33 4.17 3.33 3.33<br />
F. Legal enforcement of contracts 4.82 4.82 4.00<br />
G. Regulatory restrictions on sale of real property 8.19 8.32 8.51<br />
H. Reliability of police 3.11 5.18 3.97<br />
I. Business costs of crime 2.76 3.90 5.42<br />
Area 3. Sound Money 1.66 0.00 0.00 0.00 6.14 7.64 7.93 8.00<br />
A. Money growth 3.26 (33.71) 0.00 (111.36) 0.00 (458.38) 0.00 (479.01) 8.07 (9.63) 7.92 (10.39) 8.27 (8.67) 8.55 (7.27)<br />
B. Standard deviation of inflation 3.37 (16.57) 0.00 (53.14) 0.00 (878.93) 0.00 (851.49) 7.88 (5.29) 9.02 (2.45) 9.44 (1.40) 9.46 (1.34)<br />
C. Inflation: most recent year 0.00 (87.47) 0.00 (231.72) 0.00 (2509.47) 0.00 (77.59) 8.59 (7.04) 8.63 (6.87) 9.02 (4.89) 8.99 (5.04)<br />
D. <strong>Freedom</strong> to own foreign currency bank accounts 0.00 0.00 0.00 0.00 0.00 5.00 5.00 5.00<br />
Area 4. <strong>Freedom</strong> to Trade Internationally 3.24 0.94 4.28 6.49 6.67 7.16 6.99 7.13<br />
A. Tariffs 3.33 2.62 4.84 7.66 7.18 7.20 7.14 7.12<br />
(i) Revenue from trade taxes (% of trade sector) 3.33 (10.00) 7.87 (3.20) 7.53 (3.70) 8.13 (2.81) 7.21 (4.18) 7.21 (4.18) 8.05 (2.92) 8.05 (2.92)<br />
(ii) Mean tariff rate 0.00 (55.60) 4.00 (30.00) 7.60 (12.00) 7.12 (14.40) 7.54 (12.30) 7.28 (13.60) 7.26 (13.70)<br />
(iii) Standard deviation of tariff rates 0.00 (26.20) 3.00 (17.50) 7.24 (6.90) 7.20 (7.00) 6.85 (7.87) 6.08 (9.79) 6.05 (9.86)<br />
B. Regulatory trade barriers 5.27 5.34 6.14 6.39 6.44<br />
(i) Non-tariff trade barriers 5.27 4.02 5.12 4.77 4.95<br />
(ii) Compliance cost of importing and exporting 6.66 7.16 8.01 7.94<br />
C. Black-market exchange rates 6.40 0.20 8.00 9.40 10.00 9.04 9.30 9.78<br />
D. Controls of the movement of capital and people 0.00 0.00 0.00 3.64 4.17 6.26 5.14 5.18<br />
(i) Foreign ownership/investment restrictions 7.29 7.56 6.16 5.89 5.99<br />
(ii) Capital controls 0.00 0.00 0.00 0.00 0.77 6.15 3.08 3.08<br />
(iii) <strong>Freedom</strong> of foreigners to visit 6.46 6.46 6.46<br />
Area 5. Regulation 4.89 4.33 4.37 4.88 5.53 4.90 4.75 4.91<br />
A. Credit market regulations 5.26 3.43 3.95 4.41 5.29 6.67 6.20 6.53<br />
(i) Ownership of banks 5.00 5.00 5.00 5.00 5.00 5.00 5.00 5.00<br />
(ii) Private sector credit 6.79 5.30 6.85 8.23 5.87 10.00 7.59 7.59<br />
(iii) Interest rate controls/negative real interest rates 4.00 0.00 0.00 0.00 5.00 5.00 6.00 7.00<br />
B. Labor market regulations 4.78 5.30 4.65 3.84 4.43 4.47<br />
(i) Hiring regulations and minimum wage 6.67 3.46 2.20 2.23 2.23<br />
(ii) Hiring and firing regulations 6.18 6.18 5.25 2.85 3.00 3.19<br />
(iii) Centralized collective bargaining 5.18 5.18 5.18 5.18 5.52 5.25 5.44 5.46<br />
(iv) Hours regulations 5.47 6.01 4.00 6.00 6.00<br />
(v) Mandated cost of worker dismissal 5.74 6.91 6.91<br />
(vi) Conscription 3.00 3.00 3.00 3.00 3.00 3.00 3.00 3.00<br />
C. Business regulations 4.94 6.64 4.20 3.61 3.73<br />
(i) Administrative requirements 7.70 1.46 1.54 1.74<br />
(ii) Bureaucracy costs 5.61 7.38 5.26 3.96 4.39<br />
(iii) Starting a business 5.95 5.73 6.56 6.59 6.61<br />
(iv) Extra payments/bribes/favoritism 3.27 5.73 6.28 4.65 4.69<br />
(v) Licensing restrictions 5.65 4.92 4.93<br />
(vi) Cost of tax compliance 0.00 0.00 0.00
Country Data Tables • 47<br />
Bulgaria 1980 1985 1990 1995 2000 2005 2009 2010<br />
Chain-Linked Rating (Rank) Rating (Rank) Rating (Rank) Rating (Rank) Rating (Rank) Rating (Rank) Rating (Rank) Rating (Rank)<br />
Summary Rating (Rank) 5.02 (64) 3.90 (101) 4.60 (105) 5.37 (108) 6.85 (69) 7.24 (42) 7.23 (47)<br />
Area 1. Size of Government 3.73 (91) 2.11 (112) 3.63 (109) 4.51 (105) 6.30 (78) 6.73 (44) 6.46 (57)<br />
Area 2. Legal System and Property Rights 6.03 (32) 6.03 (38) 5.47 (72) 5.41 (72) 4.84 (81) 4.86 (80) 4.85 (80)<br />
Area 3. Sound Money 8.29 (24) 4.45 (98) 1.99 (112) 3.23 (118) 8.89 (44) 9.44 (29) 9.51 (23)<br />
Area 4. <strong>Freedom</strong> to Trade Internationally 1.99 (80) 2.83 (90) 7.13 (52) 7.33 (59) 7.09 (64) 7.55 (48) 7.75 (35)<br />
Area 5. Regulation 3.90 (101) 4.69 (100) 6.37 (58) 7.15 (42) 7.63 (15) 7.57 (23)<br />
Unadjusted<br />
Summary Rating (Rank) 5.65 (43) 4.17 (99) 4.65 (104) 5.37 (107) 6.95 (67) 7.34 (40) 7.33 (45)<br />
Rating (Data) Rating (Data) Rating (Data) Rating (Data) Rating (Data) Rating (Data) Rating (Data) Rating (Data)<br />
Area 1. Size of Government 6.74 2.54 4.03 4.51 6.30 6.73 6.46<br />
A. Government consumption 9.04 (9.26) 8.12 (12.40) 4.91 (23.31) 6.54 (17.77) 5.24 (22.20) 5.60 (20.96) 5.73 (20.51) 5.73 (20.53)<br />
B. Transfers and subsidies 5.37 (17.50) 2.72 (27.20) 6.59 (13.00) 5.81 (15.90) 5.60 (16.63) 5.69 (16.32) 5.61 (16.63)<br />
C. Government enterprises and investment 0.00 (96.40) 0.00 (55.60) 4.00 (38.95) 8.00 (19.02) 8.00 (17.37) 7.00 (20.48)<br />
D. Top marginal tax rate 3.00 3.00 6.00 7.50 7.50<br />
(i) Top marginal income tax rate 3.00 (50) 5.00 (38) 9.00 (24) 10.00 (10) 10.00 (10)<br />
(ii) Top marginal income and payroll tax rate 1.00 (56) 3.00 (50) 5.00 (38) 5.00 (38)<br />
Area 2. Legal System and Property Rights 7.25 7.25 5.88 5.41 4.98 5.00 4.99<br />
A. Judicial independence 4.18 2.51 3.26 3.23<br />
B. Impartial courts 5.29 4.51 2.55 2.93 2.91<br />
C. Protection of property rights 3.35 4.58 3.72 3.82<br />
D. Military interference in rule of law and politics 7.46 8.33 8.33 8.33 8.33<br />
E. Integrity of the legal system 6.96 6.67 6.67 4.17 4.17<br />
F. Legal enforcement of contracts 4.77 4.77 4.77<br />
G. Regulatory restrictions on sale of real property 8.88 8.73 8.73<br />
H. Reliability of police 2.90 3.83 4.94<br />
I. Business costs of crime 3.64 5.26 3.99<br />
Area 3. Sound Money 6.47 4.45 1.99 3.23 8.89 9.44 9.51<br />
A. Money growth 7.38 (13.10) 2.97 (35.15) 0.00 (76.68) 7.29 (13.53) 9.59 (2.05) 9.89 (−0.57)<br />
B. Standard deviation of inflation 9.44 (1.39) 5.64 (10.90) 0.00 (66.37) 0.00 (409.71) 9.28 (1.80) 8.73 (3.17) 8.64 (3.39)<br />
C. Inflation: most recent year 9.95 (0.23) 4.76 (26.19) 0.00 (62.85) 7.94 (10.32) 8.99 (5.04) 9.45 (2.75) 9.51 (2.44)<br />
D. <strong>Freedom</strong> to own foreign currency bank accounts 0.00 0.00 0.00 5.00 5.00 10.00 10.00 10.00<br />
Area 4. <strong>Freedom</strong> to Trade Internationally 2.13 2.81 6.79 7.33 7.23 7.70 7.90<br />
A. Tariffs 6.40 8.43 6.37 7.85 7.75 8.37 9.15<br />
(i) Revenue from trade taxes (% of trade sector) 6.40 (5.40) 9.13 (1.30) 7.87 (3.20) 9.53 (0.71) 9.59 (0.62) 9.87 (0.20) 9.63 (0.55)<br />
(ii) Mean tariff rate 7.72 (11.40) 6.56 (17.20) 7.26 (13.70) 7.86 (10.70) 8.94 (5.30) 8.98 (5.10)<br />
(iii) Standard deviation of tariff rates 4.68 (13.30) 6.76 (8.11) 5.80 (10.50) 6.29 (9.28) 8.84 (2.91)<br />
B. Regulatory trade barriers 6.42 5.72 6.01 6.08<br />
(i) Non-tariff trade barriers 4.35 5.02 5.10 5.23<br />
(ii) Compliance cost of importing and exporting 8.50 6.42 6.92 6.94<br />
C. Black-market exchange rates 0.00 0.00 0.00 9.00 10.00 10.00 10.00 10.00<br />
D. Controls of the movement of capital and people 0.00 0.00 0.00 5.00 5.04 5.47 6.43 6.39<br />
(i) Foreign ownership/investment restrictions 7.01 5.21 5.03 4.89<br />
(ii) Capital controls 0.00 0.00 0.00 5.00 3.08 4.62 7.69 7.69<br />
(iii) <strong>Freedom</strong> of foreigners to visit 6.58 6.58 6.58<br />
Area 5. Regulation 3.80 4.57 6.37 7.33 7.83 7.76<br />
A. Credit market regulations 0.00 0.00 3.52 5.23 8.90 10.00 9.98 9.98<br />
(i) Ownership of banks 0.00 0.00 0.00 2.00 8.00 10.00 10.00 10.00<br />
(ii) Private sector credit 6.55 5.70 9.69 10.00 9.94 9.94<br />
(iii) Interest rate controls/negative real interest rates 4.00 8.00 9.00 10.00 10.00 10.00<br />
B. Labor market regulations 4.92 6.43 7.79 7.74<br />
(i) Hiring regulations and minimum wage 2.57 8.30 6.67 6.67<br />
(ii) Hiring and firing regulations 4.33 4.50 5.43 5.23<br />
(iii) Centralized collective bargaining 7.87 7.62 7.06 6.95<br />
(iv) Hours regulations 6.85 6.00 8.00 8.00<br />
(v) Mandated cost of worker dismissal 9.17 9.60 9.60<br />
(vi) Conscription 0.00 0.00 0.00 1.00 3.00 3.00 10.00 10.00<br />
C. Business regulations 5.29 5.57 5.71 5.57<br />
(i) Administrative requirements 6.10 2.75 3.61 3.42<br />
(ii) Bureaucracy costs 5.95 3.38 6.40 3.96<br />
(iii) Starting a business 2.53 8.68 9.41 9.41<br />
(iv) Extra payments/bribes/favoritism 6.57 7.42 3.90 3.87<br />
(v) Licensing restrictions 8.09 7.85 8.39<br />
(vi) Cost of tax compliance 3.10 3.10 4.40<br />
www.freetheworld.com • www.fraserinstitute.org • Fraser Institute ©2012
48 • <strong>Economic</strong> <strong>Freedom</strong> of the <strong>World</strong>: 2012 Annual Report<br />
Burkina Faso<br />
Fraser Institute ©2012 • www.fraserinstitute.org • www.freetheworld.com<br />
1980 1985 1990 1995 2000 2005 2009 2010<br />
Chain-Linked Rating (Rank) Rating (Rank) Rating (Rank) Rating (Rank) Rating (Rank) Rating (Rank) Rating (Rank) Rating (Rank)<br />
Summary Rating (Rank) <br />
Area 1. Size of Government<br />
Area 2. Legal System and Property Rights<br />
Area 3. Sound Money<br />
Area 4. <strong>Freedom</strong> to Trade Internationally<br />
Area 5. Regulation<br />
Unadjusted<br />
Summary Rating (Rank) 6.08 (104) 6.01 (115) 6.09 (118)<br />
Rating (Data) Rating (Data) Rating (Data) Rating (Data) Rating (Data) Rating (Data) Rating (Data) Rating (Data)<br />
Area 1. Size of Government 6.36 6.42 6.17<br />
A. Government consumption 5.10 (22.66) 5.30 (21.99) 4.54 (24.55)<br />
B. Transfers and subsidies 9.97 (0.60) 9.96 (0.63) 9.96 (0.66)<br />
C. Government enterprises and investment<br />
D. Top marginal tax rate<br />
(i) Top marginal income tax rate<br />
(ii) Top marginal income and payroll tax rate<br />
2.00 (41.40) 4.00 (37.90) 4.00 (38.70) 4.00 (38.70)<br />
Area 2. Legal System and Property Rights 4.17 4.42 4.33<br />
A. Judicial independence 3.37 2.43 2.58<br />
B. Impartial courts 3.67 4.02 3.58<br />
C. Protection of property rights 5.74 5.31 5.49<br />
D. Military interference in rule of law and politics 5.00 4.17 4.17<br />
E. Integrity of the legal system 5.83 5.83 5.83<br />
F. Legal enforcement of contracts 2.10 2.14 2.14<br />
G. Regulatory restrictions on sale of real property 1.56 4.58 4.68<br />
H. Reliability of police 5.00 4.67 6.12<br />
I. Business costs of crime 5.27 6.66 4.40<br />
Area 3. Sound Money 6.84 6.75 6.97<br />
A. Money growth 9.55 (2.23) 7.94 (10.29) 8.41 (7.96)<br />
B. Standard deviation of inflation 9.11 (2.23) 9.57 (1.07) 9.61 (0.98)<br />
C. Inflation: most recent year 8.72 (6.42) 9.48 (2.61) 9.85 (−0.76)<br />
D. <strong>Freedom</strong> to own foreign currency bank accounts 0.00 0.00 0.00<br />
Area 4. <strong>Freedom</strong> to Trade Internationally 6.20 5.95 6.41<br />
A. Tariffs 7.05 6.93 6.93<br />
(i) Revenue from trade taxes (% of trade sector) 6.52 (5.22) 5.89 (6.16) 5.89 (6.16)<br />
(ii) Mean tariff rate 7.38 (13.10) 7.62 (11.90) 7.62 (11.90)<br />
(iii) Standard deviation of tariff rates 7.26 (6.84) 7.29 (6.78) 7.29 (6.78)<br />
B. Regulatory trade barriers 5.03 5.06 6.44<br />
(i) Non-tariff trade barriers 7.04 6.45 5.93<br />
(ii) Compliance cost of importing and exporting 3.02 3.67 6.94<br />
C. Black-market exchange rates 10.00 10.00 10.00<br />
D. Controls of the movement of capital and people 2.72 1.81 2.28<br />
(i) Foreign ownership/investment restrictions 7.40 4.66 6.06<br />
(ii) Capital controls 0.77 0.77 0.77<br />
(iii) <strong>Freedom</strong> of foreigners to visit 0.00 0.00 0.00<br />
Area 5. Regulation 6.80 6.50 6.58<br />
A. Credit market regulations 9.21 6.24 6.24<br />
(i) Ownership of banks 10.00 10.00 10.00<br />
(ii) Private sector credit 9.64 0.73 0.73<br />
(iii) Interest rate controls/negative real interest rates 8.00 8.00 8.00<br />
B. Labor market regulations 5.89 7.22 7.66<br />
(i) Hiring regulations and minimum wage 1.70 6.67 7.77<br />
(ii) Hiring and firing regulations 4.82 5.23 5.94<br />
(iii) Centralized collective bargaining 5.99 6.15 6.94<br />
(iv) Hours regulations 6.00 8.00 8.00<br />
(v) Mandated cost of worker dismissal 6.85 7.29 7.29<br />
(vi) Conscription 10.00 10.00 10.00<br />
C. Business regulations 5.30 6.02 5.83<br />
(i) Administrative requirements 4.29 3.90 4.23<br />
(ii) Bureaucracy costs 4.09 6.26 3.73<br />
(iii) Starting a business 6.06 7.66 7.86<br />
(iv) Extra payments/bribes/favoritism 5.04 3.42 3.51<br />
(v) Licensing restrictions 5.35 7.89 8.70<br />
(vi) Cost of tax compliance 6.97 6.97 6.97
Burundi<br />
Country Data Tables • 49<br />
1980 1985 1990 1995 2000 2005 2009 2010<br />
Chain-Linked Rating (Rank) Rating (Rank) Rating (Rank) Rating (Rank) Rating (Rank) Rating (Rank) Rating (Rank) Rating (Rank)<br />
Summary Rating (Rank) 3.94 (85) 4.37 (87) 4.58 (90) 3.89 (116) 4.73 (116) 4.66 (119) 5.22 (117) 5.17 (117)<br />
Area 1. Size of Government 6.50 (18) 6.71 (11) 6.26 (39) 5.78 (70) 5.80 (76) 4.98 (99) 5.38 (93) 5.24 (96)<br />
Area 2. Legal System and Property Rights 2.93 (117) 2.61 (116) 2.71 (119) 2.60 (120)<br />
Area 3. Sound Money 5.56 (77) 6.27 (78) 6.50 (65) 5.83 (76) 6.19 (104) 6.71 (95) 6.78 (98) 6.98 (95)<br />
Area 4. <strong>Freedom</strong> to Trade Internationally 0.35 (90) 1.75 (84) 2.85 (89) 0.93 (112) 4.48 (116) 2.75 (120) 3.59 (120) 3.90 (120)<br />
Area 5. Regulation 4.84 (75) 5.23 (66) 4.96 (77) 4.51 (104) 4.27 (117) 6.02 (94) 7.18 (36) 6.56 (87)<br />
Unadjusted<br />
Summary Rating (Rank) 3.99 (86) 4.50 (85) 4.72 (89) 4.34 (110) 4.80 (116) 4.92 (134) 5.51 (130) 5.45 (134)<br />
Rating (Data) Rating (Data) Rating (Data) Rating (Data) Rating (Data) Rating (Data) Rating (Data) Rating (Data)<br />
Area 1. Size of Government 4.53 4.68 4.37 5.78 5.80 4.98 5.38 5.24<br />
A. Government consumption 9.07 (9.16) 9.36 (8.17) 8.75 (10.27) 8.08 (12.54) 7.96 (12.92) 5.52 (21.24) 6.71 (17.18) 6.30 (18.57)<br />
B. Transfers and subsidies 9.28 (3.16) 9.43 (2.60) 9.43 (2.60) 9.43 (2.60) 9.43 (2.60)<br />
C. Government enterprises and investment 0.00 (91.90) 0.00 (83.00) 0.00 (82.20) 0.00 (100.00) 0.00 (87.30) 0.00 (83.70) 0.00 (83.70) 0.00 (83.70)<br />
D. Top marginal tax rate<br />
(i) Top marginal income tax rate<br />
(ii) Top marginal income and payroll tax rate<br />
Area 2. Legal System and Property Rights 4.67 4.25 4.42 4.45 3.26 2.99 3.11 2.98<br />
A. Judicial independence 1.40 1.56 1.14<br />
B. Impartial courts 4.00 3.67 2.53 2.93 2.64<br />
C. Protection of property rights 3.31 3.27 2.84<br />
D. Military interference in rule of law and politics 2.20 1.90 2.50 2.20<br />
E. Integrity of the legal system 5.18<br />
F. Legal enforcement of contracts 3.91 2.65 2.65<br />
G. Regulatory restrictions on sale of real property 3.22 6.32 6.38<br />
H. Reliability of police 3.70 2.16 4.01<br />
I. Business costs of crime 3.92 3.51 1.99<br />
Area 3. Sound Money 5.56 6.27 6.50 5.83 6.19 6.71 6.78 6.98<br />
A. Money growth 7.91 (10.45) 9.05 (4.74) 9.97 (0.15) 8.29 (8.56) 7.67 (11.66) 6.83 (15.85) 7.56 (12.20) 7.48 (12.61)<br />
B. Standard deviation of inflation 7.60 (5.99) 7.05 (7.37) 7.22 (6.94) 8.06 (4.86) 6.95 (7.62) 7.72 (5.69) 6.75 (8.13) 6.72 (8.21)<br />
C. Inflation: most recent year 6.72 (16.38) 8.99 (5.07) 8.80 (5.99) 6.96 (15.18) 5.14 (24.31) 7.30 (13.52) 7.80 (10.98) 8.72 (6.40)<br />
D. <strong>Freedom</strong> to own foreign currency bank accounts 0.00 0.00 0.00 0.00 5.00 5.00 5.00 5.00<br />
Area 4. <strong>Freedom</strong> to Trade Internationally 0.33 2.07 3.37 1.10 4.48 3.73 4.87 5.29<br />
A. Tariffs 0.00 1.21 1.30 2.11 1.13 4.48 4.94 4.64<br />
(i) Revenue from trade taxes (% of trade sector) 0.00 (18.10) 0.00 (17.00) 0.00 (22.90) 1.60 (12.60) 1.13 (13.31) 1.13 (13.31) 1.13 (13.31) 1.13 (13.31)<br />
(ii) Mean tariff rate 2.42 (37.90) 2.60 (37.00) 2.62 (36.90) 6.08 (19.60) 7.46 (12.70) 7.50 (12.50)<br />
(iii) Standard deviation of tariff rates 6.24 (9.40) 6.24 (9.40) 5.30 (11.75)<br />
B. Regulatory trade barriers 2.96 3.04 5.35<br />
(i) Non-tariff trade barriers 4.12 4.29 4.08<br />
(ii) Compliance cost of importing and exporting 1.79 1.79 6.63<br />
C. Black-market exchange rates 1.00 5.00 8.80 1.20 10.00 4.88 10.00 10.00<br />
D. Controls of the movement of capital and people 0.00 0.00 0.00 0.00 2.31 2.62 1.50 1.16<br />
(i) Foreign ownership/investment restrictions 5.54 2.96 3.49<br />
(ii) Capital controls 0.00 0.00 0.00 0.00 2.31 2.31 1.54 0.00<br />
(iii) <strong>Freedom</strong> of foreigners to visit 0.00 0.00 0.00<br />
Area 5. Regulation 4.84 5.23 4.96 4.51 4.27 6.20 7.40 6.76<br />
A. Credit market regulations 2.94 3.96 3.26 2.07 1.42 6.08 8.69 7.60<br />
(i) Ownership of banks 2.00 2.00 0.00 0.00 0.00 8.00 8.00 5.00<br />
(ii) Private sector credit 4.81 3.87 5.78 2.21 0.25 0.25 8.08 7.80<br />
(iii) Interest rate controls/negative real interest rates 2.00 6.00 4.00 4.00 4.00 10.00 10.00 10.00<br />
B. Labor market regulations 7.69 8.21 7.97<br />
(i) Hiring regulations and minimum wage 10.00 10.00 10.00<br />
(ii) Hiring and firing regulations 5.75 4.54 4.77<br />
(iii) Centralized collective bargaining 8.07 7.91 8.24<br />
(iv) Hours regulations 4.70 8.00 6.00<br />
(v) Mandated cost of worker dismissal 7.59 8.79 8.79<br />
(vi) Conscription 10.00 10.00 10.00 10.00 10.00 10.00 10.00 10.00<br />
C. Business regulations 4.82 5.30 4.70<br />
(i) Administrative requirements 2.76 3.62 3.82<br />
(ii) Bureaucracy costs 4.67 7.86 2.83<br />
(iii) Starting a business 6.64 7.62 8.32<br />
(iv) Extra payments/bribes/favoritism 3.98 2.60 2.60<br />
(v) Licensing restrictions 2.46 2.46 3.72<br />
(vi) Cost of tax compliance 8.43 7.63 6.93<br />
www.freetheworld.com • www.fraserinstitute.org • Fraser Institute ©2012
50 • <strong>Economic</strong> <strong>Freedom</strong> of the <strong>World</strong>: 2012 Annual Report<br />
Cambodia 1980 1985 1990 1995 2000 2005 2009 2010<br />
Chain-Linked Rating (Rank) Rating (Rank) Rating (Rank) Rating (Rank) Rating (Rank) Rating (Rank) Rating (Rank) Rating (Rank)<br />
Summary Rating (Rank) <br />
Area 1. Size of Government<br />
Area 2. Legal System and Property Rights<br />
Area 3. Sound Money<br />
Area 4. <strong>Freedom</strong> to Trade Internationally<br />
Area 5. Regulation<br />
Unadjusted<br />
Summary Rating (Rank) 7.16 (58)<br />
Rating (Data) Rating (Data) Rating (Data) Rating (Data) Rating (Data) Rating (Data) Rating (Data) Rating (Data)<br />
Area 1. Size of Government 7.89<br />
A. Government consumption 9.65 (7.20)<br />
B. Transfers and subsidies 9.89 (0.89)<br />
C. Government enterprises and investment 2.00 (40.00)<br />
D. Top marginal tax rate 10.00<br />
(i) Top marginal income tax rate 10.00 (20)<br />
(ii) Top marginal income and payroll tax rate 10.00 (20)<br />
Area 2. Legal System and Property Rights 4.61<br />
A. Judicial independence 3.46<br />
B. Impartial courts 4.88<br />
C. Protection of property rights 4.63<br />
D. Military interference in rule of law and politics<br />
E. Integrity of the legal system<br />
4.70<br />
F. Legal enforcement of contracts 2.44<br />
G. Regulatory restrictions on sale of real property 7.53<br />
H. Reliability of police 5.31<br />
I. Business costs of crime 3.97<br />
Area 3. Sound Money 9.26<br />
A. Money growth 9.43 (−2.86)<br />
B. Standard deviation of inflation 8.43 (3.92)<br />
C. Inflation: most recent year 9.20 (4.00)<br />
D. <strong>Freedom</strong> to own foreign currency bank accounts 10.00<br />
Area 4. <strong>Freedom</strong> to Trade Internationally 7.50<br />
A. Tariffs 8.55<br />
(i) Revenue from trade taxes (% of trade sector)<br />
(ii) Mean tariff rate<br />
(iii) Standard deviation of tariff rates<br />
8.55 (2.17)<br />
B. Regulatory trade barriers 6.93<br />
(i) Non-tariff trade barriers 5.48<br />
(ii) Compliance cost of importing and exporting 8.38<br />
C. Black-market exchange rates 10.00<br />
D. Controls of the movement of capital and people 4.52<br />
(i) Foreign ownership/investment restrictions 6.21<br />
(ii) Capital controls 7.00<br />
(iii) <strong>Freedom</strong> of foreigners to visit 0.34<br />
Area 5. Regulation 6.54<br />
A. Credit market regulations<br />
(i) Ownership of banks<br />
7.03<br />
(ii) Private sector credit<br />
(iii) Interest rate controls/negative real interest rates<br />
8.50 7.03<br />
B. Labor market regulations 7.51<br />
(i) Hiring regulations and minimum wage 5.57<br />
(ii) Hiring and firing regulations 5.44<br />
(iii) Centralized collective bargaining 6.49<br />
(iv) Hours regulations 10.00<br />
(v) Mandated cost of worker dismissal 7.59<br />
(vi) Conscription 10.00<br />
C. Business regulations 5.09<br />
(i) Administrative requirements 4.42<br />
(ii) Bureaucracy costs 3.64<br />
(iii) Starting a business 6.02<br />
(iv) Extra payments/bribes/favoritism 3.45<br />
(v) Licensing restrictions 4.93<br />
(vi) Cost of tax compliance 8.06<br />
Fraser Institute ©2012 • www.fraserinstitute.org • www.freetheworld.com
Country Data Tables • 51<br />
Cameroon 1980 1985 1990 1995 2000 2005 2009 2010<br />
Chain-Linked Rating (Rank) Rating (Rank) Rating (Rank) Rating (Rank) Rating (Rank) Rating (Rank) Rating (Rank) Rating (Rank)<br />
Summary Rating (Rank) 5.62 (39) 5.73 (41) 5.81 (46) 5.68 (76) 5.92 (90) 6.19 (88) 6.28 (91) 6.62 (79)<br />
Area 1. Size of Government 6.74 (15) 5.40 (41) 5.24 (67) 6.58 (39) 6.89 (37) 7.04 (49) 6.79 (43) 7.98 (19)<br />
Area 2. Legal System and Property Rights 5.78 (35) 5.85 (38) 5.79 (46) 5.04 (83) 4.59 (87) 4.19 (97) 4.72 (84) 4.76 (85)<br />
Area 3. Sound Money 5.66 (74) 6.67 (54) 7.01 (46) 5.92 (75) 6.60 (97) 7.21 (84) 6.60 (107) 6.74 (100)<br />
Area 4. <strong>Freedom</strong> to Trade Internationally 4.28 (50) 5.49 (42) 5.45 (51) 5.12 (96) 5.28 (105) 5.58 (100) 5.87 (94) 6.20 (94)<br />
Area 5. Regulation 5.22 (61) 5.22 (67) 5.56 (64) 5.74 (66) 6.25 (63) 6.86 (55) 7.40 (25) 7.33 (32)<br />
Unadjusted<br />
Summary Rating (Rank) 5.81 (33) 5.69 (40) 5.76 (49) 5.50 (79) 5.89 (90) 5.95 (116) 6.03 (114) 6.36 (106)<br />
Rating (Data) Rating (Data) Rating (Data) Rating (Data) Rating (Data) Rating (Data) Rating (Data) Rating (Data)<br />
Area 1. Size of Government 8.37 5.53 5.24 6.58 6.89 7.04 6.79 7.98<br />
A. Government consumption 8.18 (12.19) 8.16 (12.27) 7.04 (16.06) 8.61 (10.73) 8.00 (12.80) 8.07 (12.55) 7.09 (15.88) 7.85 (13.31)<br />
B. Transfers and subsidies 9.92 (0.80) 9.97 (0.60) 9.40 (2.70) 9.70 (1.60) 9.57 (2.09) 9.57 (2.09) 9.57 (2.09) 9.57 (2.09)<br />
C. Government enterprises and investment 7.00 (22.20) 2.00 (44.80) 4.00 (31.50) 8.00 (18.10) 10.00 (13.10) 10.00 (14.00) 10.00 (13.95) 10.00 (13.95)<br />
D. Top marginal tax rate 2.00 0.50 0.00 0.00 0.50 0.50 4.50<br />
(i) Top marginal income tax rate 2.00 (60) 1.00 (60) 0.00 (66) 0.00 (65) 1.00 (60) 1.00 (60) 5.00 (39)<br />
(ii) Top marginal income and payroll tax rate 0.00 (63) 0.00 (69) 0.00 (68) 0.00 (68) 0.00 (68) 4.00 (41)<br />
Area 2. Legal System and Property Rights 5.78 5.85 5.79 4.77 4.45 3.53 3.97 4.00<br />
A. Judicial independence 2.06 2.75 2.86<br />
B. Impartial courts 3.76 3.76 2.81 3.71 3.83<br />
C. Protection of property rights 4.14 4.48 4.38<br />
D. Military interference in rule of law and politics 4.38 6.67 6.67 5.83 5.83<br />
E. Integrity of the legal system 6.96 3.33 3.33 3.33 3.33<br />
F. Legal enforcement of contracts 2.17 2.17 2.17<br />
G. Regulatory restrictions on sale of real property 3.24 3.24 3.24<br />
H. Reliability of police 3.83 4.19 5.85<br />
I. Business costs of crime 3.49 6.03 4.50<br />
Area 3. Sound Money 5.66 6.67 7.01 5.92 6.60 7.21 6.60 6.74<br />
A. Money growth 7.83 (10.86) 9.57 (2.14) 8.98 (−5.10) 9.74 (−1.29) 7.36 (13.21) 9.89 (−0.53) 8.27 (8.64) 8.32 (8.38)<br />
B. Standard deviation of inflation 7.65 (5.88) 9.34 (1.66) 9.38 (1.55) 7.34 (6.64) 9.30 (1.75) 9.34 (1.65) 8.75 (3.12) 8.88 (2.81)<br />
C. Inflation: most recent year 7.15 (14.25) 7.76 (11.19) 9.67 (1.64) 6.59 (17.03) 9.75 (1.23) 9.60 (2.01) 9.39 (3.04) 9.74 (1.28)<br />
D. <strong>Freedom</strong> to own foreign currency bank accounts 0.00 0.00 0.00 0.00 0.00 0.00 0.00 0.00<br />
Area 4. <strong>Freedom</strong> to Trade Internationally 4.09 5.24 5.20 4.50 5.28 5.86 6.16 6.51<br />
A. Tariffs 2.67 5.93 6.40 3.71 5.08 5.50 5.50 5.50<br />
(i) Revenue from trade taxes (% of trade sector) 2.67 (11.00) 5.93 (6.10) 6.40 (5.40) 4.87 (7.70) 3.84 (9.24) 3.84 (9.24) 3.84 (9.24) 3.84 (9.24)<br />
(ii) Mean tariff rate 6.26 (18.70) 6.32 (18.40) 6.32 (18.40) 6.44 (17.80) 6.44 (17.80)<br />
(iii) Standard deviation of tariff rates 0.00 (29.60) 6.33 (9.18) 6.23 (9.43) 6.23 (9.43)<br />
B. Regulatory trade barriers 5.52 6.68 7.95<br />
(i) Non-tariff trade barriers 5.20 6.75 6.46<br />
(ii) Compliance cost of importing and exporting 5.84 6.61 9.44<br />
C. Black-market exchange rates 9.60 9.80 9.20 9.80 10.00 10.00 10.00 10.00<br />
D. Controls of the movement of capital and people 0.00 0.00 0.00 0.00 0.77 2.41 2.47 2.58<br />
(i) Foreign ownership/investment restrictions 6.46 5.88 6.19<br />
(ii) Capital controls 0.00 0.00 0.00 0.00 0.77 0.77 1.54 1.54<br />
(iii) <strong>Freedom</strong> of foreigners to visit 0.00 0.00 0.00<br />
Area 5. Regulation 5.16 5.16 5.56 5.74 6.25 6.14 6.61 6.55<br />
A. Credit market regulations 3.00 3.00 4.85 5.33 6.67 8.00 7.47 7.50<br />
(i) Ownership of banks 0.00 0.00 0.00 2.00 2.00 5.00 5.00 5.00<br />
(ii) Private sector credit 6.54 10.00 10.00 10.00 8.40 8.50<br />
(iii) Interest rate controls/negative real interest rates 6.00 6.00 8.00 4.00 8.00 9.00 9.00 9.00<br />
B. Labor market regulations 7.30 7.57 7.53<br />
(i) Hiring regulations and minimum wage 7.20 7.23 7.23<br />
(ii) Hiring and firing regulations 5.71 6.22 6.32<br />
(iii) Centralized collective bargaining 5.95 6.75 6.43<br />
(iv) Hours regulations 8.00 8.00 8.00<br />
(v) Mandated cost of worker dismissal 6.94 7.19 7.19<br />
(vi) Conscription 10.00 10.00 10.00 10.00 10.00 10.00 10.00 10.00<br />
C. Business regulations 3.11 4.81 4.63<br />
(i) Administrative requirements 1.75 3.16 3.39<br />
(ii) Bureaucracy costs 3.66 6.41 3.45<br />
(iii) Starting a business 6.54 8.23 8.44<br />
(iv) Extra payments/bribes/favoritism 3.98 3.20 3.30<br />
(v) Licensing restrictions 2.70 5.21 6.54<br />
(vi) Cost of tax compliance 0.00 2.67 2.67<br />
www.freetheworld.com • www.fraserinstitute.org • Fraser Institute ©2012
52 • <strong>Economic</strong> <strong>Freedom</strong> of the <strong>World</strong>: 2012 Annual Report<br />
Canada<br />
Fraser Institute ©2012 • www.fraserinstitute.org • www.freetheworld.com<br />
1980 1985 1990 1995 2000 2005 2009 2010<br />
Chain-Linked Rating (Rank) Rating (Rank) Rating (Rank) Rating (Rank) Rating (Rank) Rating (Rank) Rating (Rank) Rating (Rank)<br />
Summary Rating (Rank) 7.68 (5) 7.78 (6) 8.09 (5) 8.11 (8) 8.36 (7) 8.34 (6) 8.14 (5) 8.09 (5)<br />
Area 1. Size of Government 5.37 (40) 5.24 (46) 5.81 (54) 5.80 (69) 5.97 (72) 6.88 (53) 6.12 (70) 6.12 (74)<br />
Area 2. Legal System and Property Rights 7.18 (16) 7.88 (9) 8.35 (7) 8.95 (12) 9.27 (8) 8.67 (16) 8.68 (14) 8.74 (12)<br />
Area 3. Sound Money 9.09 (6) 8.93 (16) 9.68 (6) 9.63 (13) 9.53 (19) 9.68 (4) 9.55 (20) 9.46 (25)<br />
Area 4. <strong>Freedom</strong> to Trade Internationally 8.60 (8) 8.70 (9) 8.79 (10) 8.12 (26) 8.97 (19) 7.90 (32) 8.00 (27) 7.65 (43)<br />
Area 5. Regulation 8.14 (3) 8.11 (4) 7.82 (6) 8.02 (6) 8.06 (4) 8.55 (2) 8.31 (4) 8.48 (6)<br />
Unadjusted<br />
Summary Rating (Rank) 7.77 (5) 7.87 (5) 8.11 (6) 8.07 (8) 8.36 (7) 8.22 (7) 8.02 (6) 7.97 (5)<br />
Rating (Data) Rating (Data) Rating (Data) Rating (Data) Rating (Data) Rating (Data) Rating (Data) Rating (Data)<br />
Area 1. Size of Government 5.37 5.24 5.81 5.80 5.97 6.88 6.12 6.12<br />
A. Government consumption 3.29 (28.83) 3.28 (28.84) 3.35 (28.63) 3.67 (27.53) 4.54 (24.56) 4.23 (25.61) 3.80 (27.09) 3.73 (27.32)<br />
B. Transfers and subsidies 6.19 (14.50) 5.69 (16.30) 5.89 (15.60) 5.53 (16.89) 6.34 (13.92) 7.31 (10.38) 6.70 (12.60) 6.75 (12.42)<br />
C. Government enterprises and investment 10.00 (12.60) 10.00 (14.80) 10.00 (13.70) 10.00 (14.80) 10.00 (14.80) 10.00 (12.67) 8.00 (17.99) 8.00 (17.99)<br />
D. Top marginal tax rate 2.00 2.00 4.00 4.00 3.00 6.00 6.00 6.00<br />
(i) Top marginal income tax rate 2.00 (60-68) 2.00 (50-63) 4.00 (44-54) 4.00 (44-54) 3.00 (44-51) 6.00 (39-49) 6.00 (39-48) 6.00 (39-50)<br />
(ii) Top marginal income and payroll tax rate 4.00 (44-54) 4.00 (44-54) 3.00 (44-51) 6.00 (39-49) 6.00 (39-48) 6.00 (39-50)<br />
Area 2. Legal System and Property Rights 7.18 7.88 8.35 8.95 9.27 8.08 8.10 8.16<br />
A. Judicial independence 9.52 9.19 7.91 8.74 8.88<br />
B. Impartial courts 8.85 9.19 7.42 6.81 7.08<br />
C. Protection of property rights 7.34 7.98 8.16 8.43 8.32<br />
D. Military interference in rule of law and politics 9.04 10.00 10.00 10.00 10.00<br />
E. Integrity of the legal system 10.00 10.00 10.00 9.17 9.17<br />
F. Legal enforcement of contracts 4.81 4.81 4.81<br />
G. Regulatory restrictions on sale of real property 9.14 9.09 9.09<br />
H. Reliability of police 7.95 8.74 7.19<br />
I. Business costs of crime 7.37 7.13 8.85<br />
Area 3. Sound Money 9.09 8.93 9.68 9.63 9.53 9.68 9.55 9.46<br />
A. Money growth 9.24 (3.78) 7.50 (12.48) 9.70 (1.50) 9.33 (3.35) 9.31 (3.46) 9.64 (1.81) 9.64 (1.79) 9.55 (2.27)<br />
B. Standard deviation of inflation 9.32 (1.70) 8.71 (3.22) 9.65 (0.88) 9.72 (0.69) 9.34 (1.65) 9.54 (1.15) 8.62 (3.45) 8.64 (3.40)<br />
C. Inflation: most recent year 7.80 (11.00) 9.52 (2.42) 9.38 (3.11) 9.46 (2.69) 9.45 (2.75) 9.56 (2.21) 9.94 (0.30) 9.64 (1.78)<br />
D. <strong>Freedom</strong> to own foreign currency bank accounts 10.00 10.00 10.00 10.00 10.00 10.00 10.00 10.00<br />
Area 4. <strong>Freedom</strong> to Trade Internationally 8.69 8.79 8.64 7.88 8.97 7.78 7.87 7.53<br />
A. Tariffs 8.08 8.38 7.93 5.94 8.78 6.65 7.19 7.25<br />
(i) Revenue from trade taxes (% of trade sector) 8.40 (2.40) 8.87 (1.70) 9.20 (1.20) 9.53 (0.70) 9.79 (0.31) 9.77 (0.35) 9.73 (0.40) 9.77 (0.35)<br />
(ii) Mean tariff rate 7.76 (11.20) 7.90 (10.50) 8.12 (9.40) 7.98 (10.10) 9.22 (3.90) 9.10 (4.50) 9.10 (4.50) 9.26 (3.70)<br />
(iii) Standard deviation of tariff rates 6.48 (8.80) 0.32 (24.20) 7.32 (6.70) 1.07 (22.33) 2.73 (18.18) 2.73 (18.17)<br />
B. Regulatory trade barriers 7.20 8.48 7.76 7.66 6.29<br />
(i) Non-tariff trade barriers 7.20 7.45 6.63 6.42 6.26<br />
(ii) Compliance cost of importing and exporting 9.50 8.89 8.89 6.31<br />
C. Black-market exchange rates 10.00 10.00 10.00 10.00 10.00 10.00 10.00 10.00<br />
D. Controls of the movement of capital and people 8.00 8.00 8.00 8.39 8.65 6.71 6.66 6.56<br />
(i) Foreign ownership/investment restrictions 8.78 8.83 7.50 7.35 7.07<br />
(ii) Capital controls 8.00 8.00 8.00 8.00 8.46 6.92 6.92 6.92<br />
(iii) <strong>Freedom</strong> of foreigners to visit 5.70 5.70 5.70<br />
Area 5. Regulation 8.53 8.50 8.09 8.08 8.06 8.66 8.42 8.59<br />
A. Credit market regulations 9.72 9.75 9.13 9.22 10.00 10.00 9.65 9.30<br />
(i) Ownership of banks 10.00 10.00 10.00 10.00 10.00 10.00 10.00 10.00<br />
(ii) Private sector credit 9.16 9.25 7.39 7.65 10.00 10.00 8.96 8.90<br />
(iii) Interest rate controls/negative real interest rates 10.00 10.00 10.00 10.00 10.00 10.00 10.00 9.00<br />
B. Labor market regulations 7.33 7.24 7.05 7.13 6.41 8.20 8.49 8.49<br />
(i) Hiring regulations and minimum wage 6.12 4.28 8.90 8.90 8.90<br />
(ii) Hiring and firing regulations 6.47 6.47 5.08 5.44 6.34 6.47<br />
(iii) Centralized collective bargaining 7.24 7.24 7.24 7.24 7.83 7.48 7.57 7.43<br />
(iv) Hours regulations 4.75 4.49 4.49 5.80 4.84 10.00 10.00 10.00<br />
(v) Mandated cost of worker dismissal 7.40 8.15 8.15<br />
(vi) Conscription 10.00 10.00 10.00 10.00 10.00 10.00 10.00 10.00<br />
C. Business regulations 7.90 7.77 7.79 7.13 7.99<br />
(i) Administrative requirements 7.20 3.87 4.37 4.22<br />
(ii) Bureaucracy costs 7.07 7.23 6.39 1.93 7.59<br />
(iii) Starting a business 7.82 7.55 9.89 9.84 9.84<br />
(iv) Extra payments/bribes/favoritism 8.82 9.08 8.39 8.59 8.13<br />
(v) Licensing restrictions 9.52 9.51 9.63<br />
(vi) Cost of tax compliance 8.67 8.53 8.53
Country Data Tables • 53<br />
Central African Republic<br />
1980 1985 1990 1995 2000 2005 2009 2010<br />
Chain-Linked Rating (Rank) Rating (Rank) Rating (Rank) Rating (Rank) Rating (Rank) Rating (Rank) Rating (Rank) Rating (Rank)<br />
Summary Rating (Rank) 4.35 (88) 4.80 (86) 4.39 (110) 5.27 (110) 5.48 (112) 5.80 (107) 6.28 (97)<br />
Area 1. Size of Government 3.84 (84) 5.58 (37) 4.70 (84) 3.83 (105) 5.28 (87) 4.95 (101) 6.99 (35) 6.82 (48)<br />
Area 2. Legal System and Property Rights 4.35 (96) 5.49 (70) 4.01 (101) 4.59 (89)<br />
Area 3. Sound Money 5.25 (86) 4.53 (96) 7.08 (42) 5.04 (91) 7.03 (78) 7.04 (88) 7.05 (89) 6.95 (96)<br />
Area 4. <strong>Freedom</strong> to Trade Internationally 4.27 (59) 4.08 (75) 5.12 (95) 5.19 (109) 5.40 (107) 5.78 (96) 8.21 (18)<br />
Area 5. Regulation 4.12 (90) 4.85 (85) 4.31 (108) 4.52 (115) 5.14 (116) 4.97 (118) 5.17 (114)<br />
Unadjusted<br />
Summary Rating (Rank) 4.48 (75) 4.53 (84) 5.02 (75) 4.68 (102) 5.26 (111) 4.97 (133) 5.29 (133) 5.73 (130)<br />
Rating (Data) Rating (Data) Rating (Data) Rating (Data) Rating (Data) Rating (Data) Rating (Data) Rating (Data)<br />
Area 1. Size of Government 3.84 5.58 4.70 3.83 5.28 4.95 7.18 7.00<br />
A. Government consumption 7.67 (13.91) 7.16 (15.66) 7.41 (14.81) 7.65 (13.98) 8.55 (10.92) 7.91 (13.12) 10.00 (4.54) 9.37 (8.15)<br />
B. Transfers and subsidies 9.72 (1.54) 9.65 (1.78)<br />
C. Government enterprises and investment 0.00 (53.50) 4.00 (35.70) 2.00 (41.30) 0.00 (74.20) 2.00 (49.16) 2.00 (45.30) 4.00 (34.84) 4.00 (34.84)<br />
D. Top marginal tax rate 5.00 5.00<br />
(i) Top marginal income tax rate 5.00 (39-48) 5.00 (39-48)<br />
(ii) Top marginal income and payroll tax rate<br />
Area 2. Legal System and Property Rights 4.67 4.25 4.42 4.88 4.28 2.81 2.05 2.34<br />
A. Judicial independence<br />
B. Impartial courts<br />
C. Protection of property rights<br />
3.30 3.20 3.30<br />
D. Military interference in rule of law and politics 4.70 3.30 0.90 0.60<br />
E. Integrity of the legal system 5.18 4.00<br />
F. Legal enforcement of contracts 0.51 0.51 0.51<br />
G. Regulatory restrictions on sale of real property<br />
H. Reliability of police<br />
I. Business costs of crime<br />
4.11 3.58 4.97<br />
Area 3. Sound Money 5.25 4.53 7.08 5.04 7.03 7.04 7.05 6.95<br />
A. Money growth 7.16 (14.22) 9.29 (3.54) 9.90 (−0.50) 6.81 (15.97) 9.12 (−4.39) 9.66 (1.70) 9.55 (2.25) 8.69 (6.56)<br />
B. Standard deviation of inflation 7.50 (6.24) 5.64 (10.90) 8.86 (2.85) 6.02 (9.94) 9.65 (0.88) 9.08 (2.30) 9.35 (1.63) 9.39 (1.52)<br />
C. Inflation: most recent year 6.35 (18.27) 3.17 (34.15) 9.55 (2.27) 7.32 (13.41) 9.36 (3.20) 9.42 (2.88) 9.30 (3.52) 9.70 (1.49)<br />
D. <strong>Freedom</strong> to own foreign currency bank accounts 0.00 0.00 0.00 0.00 0.00 0.00 0.00 0.00<br />
Area 4. <strong>Freedom</strong> to Trade Internationally 4.18 4.47 4.06 5.34 5.19 4.37 4.68 6.64<br />
A. Tariffs 2.93 3.60 2.97 6.22 5.58 6.21 6.18 6.18<br />
(i) Revenue from trade taxes (% of trade sector) 2.93 (10.60) 2.33 (11.50) 4.27 (8.60) 5.88 (6.18) 5.88 (6.18) 5.88 (6.18)<br />
(ii) Mean tariff rate 3.60 (32.00) 3.60 (32.00) 6.28 (18.60) 6.28 (18.60) 6.42 (17.90) 6.44 (17.80) 6.44 (17.80)<br />
(iii) Standard deviation of tariff rates 6.16 (9.60) 6.20 (9.50) 6.33 (9.18) 6.23 (9.43) 6.23 (9.43)<br />
B. Regulatory trade barriers<br />
(i) Non-tariff trade barriers<br />
1.26 1.77 9.63<br />
(ii) Compliance cost of importing and exporting 1.26 1.77 9.63<br />
C. Black-market exchange rates 9.60 9.80 9.20 9.80 10.00 10.00 10.00 10.00<br />
D. Controls of the movement of capital and people<br />
(i) Foreign ownership/investment restrictions<br />
0.00 0.00 0.00 0.00 0.00 0.00 0.77 0.77<br />
(ii) Capital controls 0.00 0.00 0.00 0.00 0.00 0.00 1.54 1.54<br />
(iii) <strong>Freedom</strong> of foreigners to visit 0.00 0.00 0.00<br />
Area 5. Regulation 3.82 4.85 4.31 4.52 5.68 5.49 5.71<br />
A. Credit market regulations 0.00 4.00 6.29 4.87 5.41 7.22 7.27 7.43<br />
(i) Ownership of banks 0.00 0.00 2.00 2.00 2.00 5.00 5.00 5.00<br />
(ii) Private sector credit 6.88 6.60 6.24 7.65 7.81 8.30<br />
(iii) Interest rate controls/negative real interest rates 8.00 10.00 6.00 8.00 9.00 9.00 9.00<br />
B. Labor market regulations 4.47 3.79 3.79<br />
(i) Hiring regulations and minimum wage<br />
(ii) Hiring and firing regulations<br />
(iii) Centralized collective bargaining<br />
3.90 2.77 2.77<br />
(iv) Hours regulations 6.00 4.00 4.00<br />
(v) Mandated cost of worker dismissal 7.96 8.39 8.39<br />
(vi) Conscription 0.00 0.00 0.00 0.00 0.00 0.00 0.00 0.00<br />
C. Business regulations<br />
(i) Administrative requirements<br />
(ii) Bureaucracy costs<br />
5.35 5.42 5.92<br />
(iii) Starting a business<br />
(iv) Extra payments/bribes/favoritism<br />
5.22 5.36 6.00<br />
(v) Licensing restrictions 6.48 6.55 7.41<br />
(vi) Cost of tax compliance 4.35 4.35 4.35<br />
www.freetheworld.com • www.fraserinstitute.org • Fraser Institute ©2012
54 • <strong>Economic</strong> <strong>Freedom</strong> of the <strong>World</strong>: 2012 Annual Report<br />
Chad<br />
Fraser Institute ©2012 • www.fraserinstitute.org • www.freetheworld.com<br />
1980 1985 1990 1995 2000 2005 2009 2010<br />
Chain-Linked Rating (Rank) Rating (Rank) Rating (Rank) Rating (Rank) Rating (Rank) Rating (Rank) Rating (Rank) Rating (Rank)<br />
Summary Rating (Rank) 5.00 (66) 5.00 (81) 4.96 (100) 5.40 (106) 5.30 (115) 5.52 (115) 5.64 (114)<br />
Area 1. Size of Government 6.14 (22) 6.19 (40) 6.33 (50) 6.45 (52) 7.21 (42) 7.60 (22) 7.57 (28)<br />
Area 2. Legal System and Property Rights 4.67 (47) 4.25 (69) 4.42 (70) 4.54 (98) 4.25 (98) 3.39 (108) 4.57 (86) 4.76 (84)<br />
Area 3. Sound Money 6.61 (36) 5.55 (88) 5.68 (82) 5.16 (88) 6.64 (94) 6.03 (111) 5.66 (119) 5.75 (117)<br />
Area 4. <strong>Freedom</strong> to Trade Internationally 5.41 (102) 4.99 (116) 5.02 (113) 5.76 (101)<br />
Area 5. Regulation 4.65 (79) 4.27 (98) 3.78 (116) 4.24 (118) 4.91 (118) 5.11 (116) 4.82 (118)<br />
Unadjusted<br />
Summary Rating (Rank) 4.56 (83) 5.22 (67) 5.16 (91) 5.39 (106) 5.08 (132) 5.29 (133) 5.41 (136)<br />
Rating (Data) Rating (Data) Rating (Data) Rating (Data) Rating (Data) Rating (Data) Rating (Data) Rating (Data)<br />
Area 1. Size of Government 4.30 6.19 6.33 6.45 7.21 7.60 7.57<br />
A. Government consumption 4.12 (26.00) 8.60 (10.75) 8.66 (10.54) 9.08 (9.14) 9.44 (7.90) 9.71 (7.00) 6.89 (16.58) 6.79 (16.93)<br />
B. Transfers and subsidies 9.89 (0.90) 9.92 (0.80) 9.92 (0.80) 9.92 (0.80) 9.92 (0.80) 9.92 (0.80)<br />
C. Government enterprises and investment 0.00 (86.30) 0.00 (94.00) 0.00 (63.30) 0.00 (50.00) 2.00 (36.80) 6.00 (33.33) 6.00 (28.49)<br />
D. Top marginal tax rate<br />
(i) Top marginal income tax rate<br />
(ii) Top marginal income and payroll tax rate<br />
Area 2. Legal System and Property Rights 4.67 4.25 4.42 4.42 4.20 2.19 2.96 3.08<br />
A. Judicial independence 1.28 2.79 2.67<br />
B. Impartial courts 4.10 4.04 1.97 3.22 3.18<br />
C. Protection of property rights 2.66 2.33 2.61<br />
D. Military interference in rule of law and politics 4.35 4.70 2.80 1.70 2.20<br />
E. Integrity of the legal system 5.18 4.00<br />
F. Legal enforcement of contracts 0.30 2.22 2.22<br />
G. Regulatory restrictions on sale of real property 4.17 4.17 4.17<br />
H. Reliability of police 2.22 2.60 4.83<br />
I. Business costs of crime 2.15 4.62 2.74<br />
Area 3. Sound Money 6.61 5.55 5.68 5.16 6.64 6.03 5.66 5.75<br />
A. Money growth 8.40 (7.98) 6.96 (15.22) 8.81 (−5.93) 9.56 (2.19) 9.67 (−1.66) 9.52 (2.40) 9.89 (0.56) 9.44 (2.82)<br />
B. Standard deviation of inflation 9.76 (0.59) 6.00 (10.00) 6.19 (9.53) 2.84 (17.90) 7.65 (5.87) 6.17 (9.56) 4.74 (13.15) 5.91 (10.23)<br />
C. Inflation: most recent year 8.25 (8.73) 9.25 (3.75) 7.72 (11.41) 8.22 (8.90) 9.24 (3.82) 8.42 (7.89) 8.01 (9.95) 7.68 (11.62)<br />
D. <strong>Freedom</strong> to own foreign currency bank accounts 0.00 0.00 0.00 0.00 0.00 0.00 0.00 0.00<br />
Area 4. <strong>Freedom</strong> to Trade Internationally 5.53 6.11 5.41 4.96 4.99 5.72<br />
A. Tariffs 7.40 8.53 6.24 6.44 6.31 6.31<br />
(i) Revenue from trade taxes (% of trade sector) 7.40 (3.90) 8.53 (2.20)<br />
(ii) Mean tariff rate 6.84 (15.80) 6.56 (17.20) 6.42 (17.90) 6.42 (17.90)<br />
(iii) Standard deviation of tariff rates 5.64 (10.90) 6.33 (9.18) 6.21 (9.49) 6.21 (9.49)<br />
B. Regulatory trade barriers 1.82 1.96 4.80<br />
(i) Non-tariff trade barriers 3.64 3.92 4.09<br />
(ii) Compliance cost of importing and exporting 0.00 0.00 5.50<br />
C. Black-market exchange rates 9.60 9.80 9.20 9.80 10.00 10.00 10.00 10.00<br />
D. Controls of the movement of capital and people 0.00 0.00 0.00 0.00 0.00 1.57 1.67 1.77<br />
(i) Foreign ownership/investment restrictions 4.70 3.47 3.76<br />
(ii) Capital controls 0.00 0.00 0.00 0.00 0.00 0.00 1.54 1.54<br />
(iii) <strong>Freedom</strong> of foreigners to visit 0.00 0.00 0.00<br />
Area 5. Regulation 4.15 4.27 3.78 4.24 5.03 5.24 4.94<br />
A. Credit market regulations 2.00 5.00 4.76 3.46 4.68 5.68 6.08 6.03<br />
(i) Ownership of banks 2.00 2.00 0.00 0.00 0.00 2.00 2.00 2.00<br />
(ii) Private sector credit 6.29 6.38 6.04 6.03 7.24 7.10<br />
(iii) Interest rate controls/negative real interest rates 8.00 8.00 4.00 8.00 9.00 9.00 9.00<br />
B. Labor market regulations 5.95 6.03 5.92<br />
(i) Hiring regulations and minimum wage 6.10 6.10 5.00<br />
(ii) Hiring and firing regulations 4.26 4.84 5.23<br />
(iii) Centralized collective bargaining 7.70 6.73 6.78<br />
(iv) Hours regulations 8.00 8.00 8.00<br />
(v) Mandated cost of worker dismissal 6.66 7.49 7.49<br />
(vi) Conscription 10.00 0.00 0.00 0.00 0.00 3.00 3.00 3.00<br />
C. Business regulations 3.47 3.61 2.87<br />
(i) Administrative requirements 2.35 3.16 2.70<br />
(ii) Bureaucracy costs 3.13 6.99 2.50<br />
(iii) Starting a business 3.87 3.95 4.57<br />
(iv) Extra payments/bribes/favoritism 3.69 2.52 2.24<br />
(v) Licensing restrictions 5.97 3.24 3.41<br />
(vi) Cost of tax compliance 1.79 1.79 1.79
Chile<br />
Country Data Tables • 55<br />
1980 1985 1990 1995 2000 2005 2009 2010<br />
Chain-Linked Rating (Rank) Rating (Rank) Rating (Rank) Rating (Rank) Rating (Rank) Rating (Rank) Rating (Rank) Rating (Rank)<br />
Summary Rating (Rank) 5.38 (48) 5.83 (39) 6.78 (27) 7.53 (18) 7.41 (33) 7.92 (14) 7.89 (9) 7.87 (13)<br />
Area 1. Size of Government 5.00 (54) 5.71 (34) 6.51 (28) 7.30 (20) 6.12 (64) 7.43 (37) 7.65 (18) 7.77 (24)<br />
Area 2. Legal System and Property Rights 6.43 (27) 5.02 (55) 6.19 (35) 6.75 (37) 6.53 (51) 6.61 (49) 7.12 (37) 7.03 (35)<br />
Area 3. Sound Money 2.31 (103) 7.06 (34) 7.65 (37) 8.65 (36) 9.30 (32) 9.34 (35) 9.10 (45) 8.94 (52)<br />
Area 4. <strong>Freedom</strong> to Trade Internationally 6.70 (24) 4.93 (50) 6.93 (33) 7.93 (34) 7.90 (43) 8.63 (10) 8.46 (12) 8.36 (14)<br />
Area 5. Regulation 6.69 (20) 6.53 (25) 6.61 (29) 7.04 (18) 7.19 (30) 7.53 (21) 7.04 (45) 7.12 (43)<br />
Unadjusted<br />
Summary Rating (Rank) 5.19 (55) 5.66 (41) 6.75 (28) 7.52 (19) 7.41 (30) 7.89 (13) 7.86 (8) 7.84 (10)<br />
Rating (Data) Rating (Data) Rating (Data) Rating (Data) Rating (Data) Rating (Data) Rating (Data) Rating (Data)<br />
Area 1. Size of Government 5.00 5.71 6.51 7.30 6.12 7.43 7.65 7.77<br />
A. Government consumption 7.36 (14.98) 6.86 (16.69) 7.76 (13.62) 7.77 (13.58) 7.02 (16.14) 7.13 (15.76) 6.40 (18.25) 6.64 (17.44)<br />
B. Transfers and subsidies 6.62 (12.90) 5.97 (15.30) 7.28 (10.50) 7.42 (9.97) 6.48 (13.42) 7.60 (9.32) 7.22 (10.70) 7.46 (9.81)<br />
C. Government enterprises and investment 4.00 (32.20) 8.00 (16.10) 7.00 (20.50) 8.00 (16.60) 6.00 (28.21) 10.00 (8.72) 10.00 (13.87) 10.00 (13.87)<br />
D. Top marginal tax rate 2.00 2.00 4.00 6.00 5.00 5.00 7.00 7.00<br />
(i) Top marginal income tax rate 2.00 (58) 2.00 (56) 4.00 (50) 6.00 (45) 5.00 (45) 5.00 (40) 7.00 (40) 7.00 (40)<br />
(ii) Top marginal income and payroll tax rate 4.00 (50) 6.00 (45) 5.00 (45) 5.00 (40) 7.00 (40) 7.00 (40)<br />
Area 2. Legal System and Property Rights 6.43 5.02 6.19 6.75 6.53 6.74 7.26 7.17<br />
A. Judicial independence 6.62 5.85 4.77 7.27 7.45<br />
B. Impartial courts 7.07 6.51 5.99 6.17 6.19<br />
C. Protection of property rights 5.60 5.27 7.47 7.02 6.73<br />
D. Military interference in rule of law and politics 7.51 6.67 6.88 7.50 7.50<br />
E. Integrity of the legal system 6.96 8.33 8.33 8.33 7.50<br />
F. Legal enforcement of contracts 5.11 5.11 5.11<br />
G. Regulatory restrictions on sale of real property 8.99 8.99 8.99<br />
H. Reliability of police 7.07 8.87 6.35<br />
I. Business costs of crime 6.04 6.07 8.71<br />
Area 3. Sound Money 2.31 7.06 7.65 8.65 9.30 9.34 9.10 8.94<br />
A. Money growth 0.00 (52.46) 8.21 (8.95) 6.52 (17.40) 8.07 (9.67) 9.58 (2.08) 8.72 (6.39) 8.44 (7.80) 8.37 (8.16)<br />
B. Standard deviation of inflation 0.00 (80.63) 6.17 (9.58) 8.34 (4.15) 8.40 (4.00) 8.40 (4.01) 9.23 (1.92) 8.29 (4.28) 7.68 (5.79)<br />
C. Inflation: most recent year 4.25 (28.76) 3.86 (30.71) 5.75 (21.24) 8.14 (9.32) 9.23 (3.84) 9.39 (3.05) 9.66 (1.68) 9.72 (1.41)<br />
D. <strong>Freedom</strong> to own foreign currency bank accounts 5.00 10.00 10.00 10.00 10.00 10.00 10.00 10.00<br />
Area 4. <strong>Freedom</strong> to Trade Internationally 6.50 4.78 6.73 7.91 7.90 8.46 8.30 8.20<br />
A. Tariffs 8.71 6.73 8.18 8.49 8.91 9.48 9.47 9.44<br />
(i) Revenue from trade taxes (% of trade sector) 8.13 (2.80) 6.20 (5.70) 7.53 (3.70) 7.67 (3.49) 8.53 (2.20) 9.61 (0.58) 9.79 (0.31) 9.69 (0.46)<br />
(ii) Mean tariff rate 8.00 (10.00) 4.00 (30.00) 7.00 (15.00) 7.80 (11.00) 8.20 (9.00) 9.02 (4.90) 8.80 (6.00) 8.80 (6.00)<br />
(iii) Standard deviation of tariff rates 10.00 (0.00) 10.00 (0.00) 10.00 (0.00) 10.00 (0.00) 10.00 (0.00) 9.81 (0.48) 9.81 (0.48) 9.83 (0.42)<br />
B. Regulatory trade barriers 7.05 8.39 7.39 7.94 7.57<br />
(i) Non-tariff trade barriers 7.05 8.28 7.68 8.80 8.40<br />
(ii) Compliance cost of importing and exporting 8.50 7.09 7.09 6.75<br />
C. Black-market exchange rates 8.80 5.60 10.00 9.60 10.00 10.00 10.00 10.00<br />
D. Controls of the movement of capital and people 2.00 2.00 2.00 6.49 4.30 6.99 5.77 5.80<br />
(i) Foreign ownership/investment restrictions 7.98 8.61 8.38 7.80 7.89<br />
(ii) Capital controls 2.00 2.00 2.00 5.00 0.00 6.92 3.85 3.85<br />
(iii) <strong>Freedom</strong> of foreigners to visit 5.67 5.67 5.67<br />
Area 5. Regulation 5.70 5.74 6.69 7.00 7.19 7.50 7.01 7.10<br />
A. Credit market regulations 7.54 8.19 8.43 9.29 9.23 9.33 8.64 8.28<br />
(i) Ownership of banks 5.00 8.00 8.00 8.00 8.00 8.00 8.00 8.00<br />
(ii) Private sector credit 9.63 8.56 9.28 9.86 9.68 10.00 7.93 9.83<br />
(iii) Interest rate controls/negative real interest rates 8.00 8.00 8.00 10.00 10.00 10.00 10.00 7.00<br />
B. Labor market regulations 4.95 5.27 4.86 6.04 5.79 5.79<br />
(i) Hiring regulations and minimum wage 5.68 3.36 6.70 6.67 6.67<br />
(ii) Hiring and firing regulations 6.91 6.91 5.57 4.92 3.77 3.92<br />
(iii) Centralized collective bargaining 7.93 7.93 7.93 8.85 8.47 7.71 7.57<br />
(iv) Hours regulations 5.85 6.51 10.00 10.00 10.00<br />
(v) Mandated cost of worker dismissal 5.18 5.58 5.58<br />
(vi) Conscription 3.00 0.00 0.00 0.00 0.00 1.00 1.00 1.00<br />
C. Business regulations 6.43 7.50 7.12 6.61 7.22<br />
(i) Administrative requirements 7.88 4.66 4.31 4.41<br />
(ii) Bureaucracy costs 6.18 7.93 6.03 3.77 6.88<br />
(iii) Starting a business 6.52 5.65 9.03 9.22 9.72<br />
(iv) Extra payments/bribes/favoritism 6.58 8.53 8.40 7.66 7.61<br />
(v) Licensing restrictions 8.15 8.22 8.25<br />
(vi) Cost of tax compliance 6.46 6.46 6.46<br />
www.freetheworld.com • www.fraserinstitute.org • Fraser Institute ©2012
56 • <strong>Economic</strong> <strong>Freedom</strong> of the <strong>World</strong>: 2012 Annual Report<br />
China<br />
Fraser Institute ©2012 • www.fraserinstitute.org • www.freetheworld.com<br />
1980 1985 1990 1995 2000 2005 2009 2010<br />
Chain-Linked Rating (Rank) Rating (Rank) Rating (Rank) Rating (Rank) Rating (Rank) Rating (Rank) Rating (Rank) Rating (Rank)<br />
Summary Rating (Rank) 3.74 (92) 4.74 (78) 4.43 (94) 5.17 (93) 5.75 (100) 5.88 (101) 6.12 (100) 6.16 (100)<br />
Area 1. Size of Government 3.58 (90) 3.91 (84) 3.65 (99) 4.02 (104) 3.43 (115) 3.31 (121) 3.23 (123) 3.63 (121)<br />
Area 2. Legal System and Property Rights 6.78 (24) 5.79 (45) 5.49 (70) 4.95 (79) 5.15 (77) 5.89 (64) 5.75 (67)<br />
Area 3. Sound Money 6.18 (56) 6.19 (80) 6.73 (56) 5.77 (78) 8.12 (56) 8.18 (64) 8.05 (71) 7.89 (82)<br />
Area 4. <strong>Freedom</strong> to Trade Internationally 2.30 (75) 3.53 (69) 2.74 (91) 5.89 (77) 6.46 (77) 6.93 (68) 6.85 (74) 6.86 (74)<br />
Area 5. Regulation 2.62 (99) 2.62 (104) 2.69 (111) 4.69 (101) 5.79 (92) 5.94 (97) 6.75 (68) 6.70 (77)<br />
Unadjusted<br />
Summary Rating (Rank) 3.64 (96) 4.82 (76) 4.09 (100) 5.07 (96) 5.75 (100) 6.06 (106) 6.31 (103) 6.35 (107)<br />
Rating (Data) Rating (Data) Rating (Data) Rating (Data) Rating (Data) Rating (Data) Rating (Data) Rating (Data)<br />
Area 1. Size of Government 2.63 3.91 3.65 4.02 3.43 4.54 4.43 4.98<br />
A. Government consumption 5.25 (22.14) 5.73 (20.51) 5.94 (19.81) 6.07 (19.38) 4.28 (25.46) 3.87 (26.84) 3.44 (28.31) 3.63 (27.66)<br />
B. Transfers and subsidies 8.29 (6.76) 8.29 (6.76) 8.29 (6.76)<br />
C. Government enterprises and investment 0.00 (56.40) 0.00 (62.90) 0.00 (61.90) 0.00 (77.07) 0.00 (77.97) 0.00 (69.77) 0.00 (50.91) 2.00 (47.92)<br />
D. Top marginal tax rate 6.00 5.00 6.00 6.00 6.00 6.00 6.00<br />
(i) Top marginal income tax rate 6.00 (45) 5.00 (45) 6.00 (45) 6.00 (45) 6.00 (45) 6.00 (45) 6.00 (45)<br />
(ii) Top marginal income and payroll tax rate 6.00 (45) 6.00 (45)<br />
Area 2. Legal System and Property Rights 6.78 5.79 5.49 4.95 5.60 6.41 6.25<br />
A. Judicial independence 3.80 3.34 3.92 4.95 4.89<br />
B. Impartial courts 4.92 4.18 4.03 5.16 5.21<br />
C. Protection of property rights 4.15 3.22 4.95 6.85 6.74<br />
D. Military interference in rule of law and politics 7.60 7.34 5.00 5.00 5.00<br />
E. Integrity of the legal system 6.96 6.67 7.50 7.50 6.67<br />
F. Legal enforcement of contracts 6.73 6.73 6.73<br />
G. Regulatory restrictions on sale of real property 8.27 8.27 8.27<br />
H. Reliability of police 5.08 5.99 6.77<br />
I. Business costs of crime 4.92 7.22 5.95<br />
Area 3. Sound Money 6.18 6.19 6.73 5.77 8.12 8.18 8.05 7.89<br />
A. Money growth 6.00 (20.00) 8.14 (9.31) 9.18 (4.09) 7.63 (11.83) 8.90 (5.48) 9.05 (4.76) 8.64 (6.81) 8.57 (7.14)<br />
B. Standard deviation of inflation 9.48 (1.31) 8.64 (3.40) 8.86 (2.84) 8.09 (4.77) 8.63 (3.43) 9.04 (2.41) 8.69 (3.28) 8.63 (3.42)<br />
C. Inflation: most recent year 9.24 (3.78) 7.97 (10.14) 8.86 (5.68) 7.36 (13.18) 9.95 (0.26) 9.64 (1.82) 9.86 (−0.70) 9.34 (3.31)<br />
D. <strong>Freedom</strong> to own foreign currency bank accounts 0.00 0.00 0.00 0.00 5.00 5.00 5.00 5.00<br />
Area 4. <strong>Freedom</strong> to Trade Internationally 2.72 4.17 2.72 5.51 6.46 6.64 6.57 6.57<br />
A. Tariffs 3.15 2.72 3.16 3.90 7.11 7.96 8.15 8.15<br />
(i) Revenue from trade taxes (% of trade sector) 6.20 (5.70) 3.33 (10.00) 7.53 (3.70) 9.20 (1.20) 8.86 (1.71) 8.81 (1.78) 9.41 (0.88) 9.41 (0.88)<br />
(ii) Mean tariff rate 0.10 (49.50) 2.10 (39.50) 1.94 (40.30) 2.50 (37.50) 6.74 (16.30) 8.16 (9.20) 8.08 (9.60) 8.08 (9.60)<br />
(iii) Standard deviation of tariff rates 0.00 (32.10) 0.00 (28.00) 5.72 (10.70) 6.91 (7.72) 6.97 (7.58) 6.97 (7.58)<br />
B. Regulatory trade barriers 4.63 6.01 6.02 6.46 5.93<br />
(i) Non-tariff trade barriers 4.63 4.35 5.14 6.01 5.86<br />
(ii) Compliance cost of importing and exporting 7.66 6.91 6.91 6.00<br />
C. Black-market exchange rates 5.00 7.80 0.00 8.60 10.00 10.00 10.00 10.00<br />
D. Controls of the movement of capital and people 0.00 2.00 5.00 4.91 2.71 2.57 1.65 2.19<br />
(i) Foreign ownership/investment restrictions 4.82 4.66 6.71 4.72 6.35<br />
(ii) Capital controls 0.00 2.00 5.00 5.00 0.77 0.77 0.00 0.00<br />
(iii) <strong>Freedom</strong> of foreigners to visit 0.23 0.23 0.23<br />
Area 5. Regulation 3.04 3.04 1.58 4.57 5.79 5.36 6.10 6.05<br />
A. Credit market regulations 0.00 0.00 0.00 4.60 6.46 7.23 7.24 6.91<br />
(i) Ownership of banks 0.00 0.00 0.00 0.00 0.00 2.00 2.00 2.00<br />
(ii) Private sector credit 9.81 9.39 9.68 9.73 9.73<br />
(iii) Interest rate controls/negative real interest rates 0.00 0.00 0.00 4.00 10.00 10.00 10.00 9.00<br />
B. Labor market regulations 3.16 4.54 4.66 4.98 5.51 5.57<br />
(i) Hiring regulations and minimum wage 5.80 4.37 8.90 8.90 8.90<br />
(ii) Hiring and firing regulations 4.30 4.30 5.10 5.27 5.11 5.45<br />
(iii) Centralized collective bargaining 4.49 4.49 5.18 6.21 7.67 7.44 7.10 7.10<br />
(iv) Hours regulations 6.42 6.18 6.70 10.00 10.00<br />
(v) Mandated cost of worker dismissal 1.56 1.97 1.97<br />
(vi) Conscription 0.00 0.00 0.00 0.00 0.00 0.00 0.00 0.00<br />
C. Business regulations 4.57 6.25 3.88 5.54 5.67<br />
(i) Administrative requirements 7.60 3.96 4.99 4.89<br />
(ii) Bureaucracy costs 4.78 5.40 2.00 4.65 5.02<br />
(iii) Starting a business 6.05 6.52 8.08 8.35 8.42<br />
(iv) Extra payments/bribes/favoritism 2.87 5.49 5.52 5.24 5.11<br />
(v) Licensing restrictions 3.52 4.49 5.04<br />
(vi) Cost of tax compliance 0.23 5.54 5.54
Country Data Tables • 57<br />
Colombia 1980 1985 1990 1995 2000 2005 2009 2010<br />
Chain-Linked Rating (Rank) Rating (Rank) Rating (Rank) Rating (Rank) Rating (Rank) Rating (Rank) Rating (Rank) Rating (Rank)<br />
Summary Rating (Rank) 4.74 (67) 5.22 (54) 5.07 (75) 5.59 (79) 5.51 (102) 5.84 (105) 6.27 (92) 6.31 (96)<br />
Area 1. Size of Government 5.35 (41) 5.94 (27) 7.23 (14) 6.83 (30) 4.64 (99) 4.45 (112) 6.02 (72) 6.13 (72)<br />
Area 2. Legal System and Property Rights 3.98 (55) 3.40 (85) 3.41 (87) 2.85 (114) 3.53 (110) 3.72 (102) 3.60 (107) 3.67 (106)<br />
Area 3. Sound Money 4.86 (94) 6.69 (51) 4.90 (92) 5.32 (85) 6.31 (101) 7.81 (73) 8.13 (68) 8.20 (72)<br />
Area 4. <strong>Freedom</strong> to Trade Internationally 3.83 (56) 4.36 (58) 4.08 (74) 7.21 (51) 6.98 (69) 6.14 (88) 6.52 (81) 6.45 (88)<br />
Area 5. Regulation 5.70 (43) 5.70 (49) 5.70 (57) 5.75 (65) 6.10 (75) 6.94 (49) 7.01 (47) 7.02 (50)<br />
Unadjusted<br />
Summary Rating (Rank) 4.59 (72) 5.06 (64) 5.02 (75) 5.48 (81) 5.51 (103) 6.02 (108) 6.46 (94) 6.50 (97)<br />
Rating (Data) Rating (Data) Rating (Data) Rating (Data) Rating (Data) Rating (Data) Rating (Data) Rating (Data)<br />
Area 1. Size of Government 5.35 5.94 7.23 6.83 4.64 4.45 6.02 6.13<br />
A. Government consumption 8.07 (12.57) 7.82 (13.43) 7.78 (13.56) 6.31 (18.54) 4.35 (25.20) 2.69 (30.87) 5.92 (19.86) 5.70 (20.63)<br />
B. Transfers and subsidies 9.35 (2.90) 8.94 (4.40) 9.13 (3.70) 9.02 (4.10) 8.71 (5.24) 7.60 (9.32) 7.17 (10.89) 7.82 (8.49)<br />
C. Government enterprises and investment 2.00 (41.50) 2.00 (49.90) 4.00 (38.50) 4.00 (34.10) 0.00 (51.89) 2.00 6.00 6.00<br />
D. Top marginal tax rate 2.00 5.00 8.00 8.00 5.50 5.50 5.00 5.00<br />
(i) Top marginal income tax rate 2.00 (56) 5.00 (49) 8.00 (30) 8.00 (30) 7.00 (35) 7.00 (35) 7.00 (35) 7.00 (35)<br />
(ii) Top marginal income and payroll tax rate 8.00 (30) 8.00 (30) 4.00 (43) 4.00 (45) 3.00 (47) 3.00 (47)<br />
Area 2. Legal System and Property Rights 3.98 3.40 3.41 2.85 3.53 4.42 4.28 4.36<br />
A. Judicial independence 3.72 3.51 4.42 4.14 4.17<br />
B. Impartial courts 3.52 5.85 4.64 4.00 3.93<br />
C. Protection of property rights 4.13 3.28 6.16 4.74 4.85<br />
D. Military interference in rule of law and politics 2.88 3.33 3.33 3.33 3.33<br />
E. Integrity of the legal system 0.00 1.67 1.67 3.33 3.33<br />
F. Legal enforcement of contracts 1.80 2.09 2.09<br />
G. Regulatory restrictions on sale of real property 8.74 8.96 9.06<br />
H. Reliability of police 5.72 5.48 2.93<br />
I. Business costs of crime 3.33 2.43 5.56<br />
Area 3. Sound Money 4.86 6.69 4.90 5.32 6.31 7.81 8.13 8.20<br />
A. Money growth 6.63 (16.85) 7.40 (12.98) 6.21 (18.97) 6.07 (19.64) 8.28 (8.61) 7.69 (11.53) 8.94 (5.31) 8.97 (5.17)<br />
B. Standard deviation of inflation 8.33 (4.17) 9.33 (1.68) 9.09 (2.27) 9.15 (2.12) 8.81 (2.97) 9.57 (1.09) 9.42 (1.45) 9.30 (1.75)<br />
C. Inflation: most recent year 4.48 (27.61) 5.02 (24.90) 4.29 (28.55) 6.04 (19.79) 8.16 (9.22) 8.99 (5.05) 9.16 (4.20) 9.54 (2.28)<br />
D. <strong>Freedom</strong> to own foreign currency bank accounts 0.00 5.00 0.00 0.00 0.00 5.00 5.00 5.00<br />
Area 4. <strong>Freedom</strong> to Trade Internationally 3.62 4.11 4.04 6.89 6.98 6.49 6.90 6.82<br />
A. Tariffs 4.05 4.14 5.53 7.81 7.85 7.72 7.47 7.24<br />
(i) Revenue from trade taxes (% of trade sector) 4.80 (7.80) 5.00 (7.50) 5.99 (6.01) 8.04 (2.94) 8.37 (2.44) 8.73 (1.90) 8.07 (2.90) 7.77 (3.34)<br />
(ii) Mean tariff rate 3.30 (33.50) 3.28 (33.60) 3.92 (30.40) 7.34 (13.30) 7.66 (11.70) 7.62 (11.90) 7.50 (12.50) 7.50 (12.50)<br />
(iii) Standard deviation of tariff rates 6.68 (8.30) 8.04 (4.90) 7.52 (6.20) 6.80 (8.00) 6.85 (7.88) 6.45 (8.88)<br />
B. Regulatory trade barriers 5.15 6.11 4.98 6.17 6.07<br />
(i) Non-tariff trade barriers 5.15 4.90 4.83 4.17 4.94<br />
(ii) Compliance cost of importing and exporting 7.33 5.13 8.18 7.19<br />
C. Black-market exchange rates 6.80 8.20 6.60 8.60 10.00 8.07 9.26 9.02<br />
D. Controls of the movement of capital and people 0.00 0.00 0.00 6.02 3.94 5.21 4.68 4.95<br />
(i) Foreign ownership/investment restrictions 7.04 7.87 6.81 5.23 6.03<br />
(ii) Capital controls 0.00 0.00 0.00 5.00 0.00 0.77 0.77 0.77<br />
(iii) <strong>Freedom</strong> of foreigners to visit 8.05 8.05 8.05<br />
Area 5. Regulation 5.16 5.16 5.50 5.52 6.10 6.91 6.97 6.99<br />
A. Credit market regulations 8.00 8.00 8.20 8.04 8.70 9.33 8.60 8.73<br />
(i) Ownership of banks 8.00 8.00 8.00 8.00 8.00 8.00 8.00 8.00<br />
(ii) Private sector credit 8.61 8.11 8.10 10.00 7.81 8.18<br />
(iii) Interest rate controls/negative real interest rates 8.00 8.00 8.00 8.00 10.00 10.00 10.00 10.00<br />
B. Labor market regulations 4.75 3.89 5.37 5.92 5.88<br />
(i) Hiring regulations and minimum wage 6.83 2.85 7.80 8.90 8.90<br />
(ii) Hiring and firing regulations 5.50 5.50 4.15 5.05 4.85 4.91<br />
(iii) Centralized collective bargaining 5.93 6.81 7.17 6.92<br />
(iv) Hours regulations 5.68 5.51 8.00 10.00 10.00<br />
(v) Mandated cost of worker dismissal 4.53 4.57 4.57<br />
(vi) Conscription 0.00 0.00 0.00 1.00 1.00 0.00 0.00 0.00<br />
C. Business regulations 3.76 5.71 6.03 6.40 6.35<br />
(i) Administrative requirements 6.43 2.61 2.68 3.17<br />
(ii) Bureaucracy costs 6.20 6.75 5.81 5.06 4.12<br />
(iii) Starting a business 2.63 3.75 8.38 9.40 9.47<br />
(iv) Extra payments/bribes/favoritism 2.44 5.89 6.38 4.33 4.12<br />
(v) Licensing restrictions 8.09 9.27 9.39<br />
(vi) Cost of tax compliance 4.89 7.67 7.84<br />
www.freetheworld.com • www.fraserinstitute.org • Fraser Institute ©2012
58 • <strong>Economic</strong> <strong>Freedom</strong> of the <strong>World</strong>: 2012 Annual Report<br />
Congo, Democratic Republic of<br />
1980 1985 1990 1995 2000 2005 2009 2010<br />
Chain-Linked Rating (Rank) Rating (Rank) Rating (Rank) Rating (Rank) Rating (Rank) Rating (Rank) Rating (Rank) Rating (Rank)<br />
Summary Rating (Rank) 2.60 (102) 3.61 (97) 3.03 (111) 3.28 (123) 3.85 (122) 4.46 (121) 4.70 (120) 4.96 (119)<br />
Area 1. Size of Government 4.42 (71) 6.22 (18) 5.74 (57) 5.63 (76) 7.45 (22) 6.91 (51) 5.41 (92) 5.19 (99)<br />
Area 2. Legal System and Property Rights 2.37 (76) 2.46 (98) 2.44 (102) 1.49 (118) 1.75 (121) 1.42 (123) 1.84 (122) 1.66 (122)<br />
Area 3. Sound Money 0.00 (107) 0.00 (111) 0.00 (118) 0.00 (121) 1.25 (123) 5.04 (117) 6.96 (96) 7.12 (89)<br />
Area 4. <strong>Freedom</strong> to Trade Internationally 1.91 (80) 4.86 (53) 3.98 (77) 6.32 (68) 4.15 (119) 5.75 (94) 5.30 (108) 6.38 (90)<br />
Area 5. Regulation 2.92 (97) 3.01 (100) 2.91 (108) 2.98 (120) 4.65 (110) 3.15 (123) 3.59 (122) 4.14 (123)<br />
Unadjusted<br />
Summary Rating (Rank) 2.99 (102) 3.70 (97) 3.28 (108) 3.64 (119) 3.98 (122) 4.66 (137) 4.91 (137) 5.18 (139)<br />
Fraser Institute ©2012 • www.fraserinstitute.org • www.freetheworld.com<br />
Rating (Data) Rating (Data) Rating (Data) Rating (Data) Rating (Data) Rating (Data) Rating (Data) Rating (Data)<br />
Area 1. Size of Government 5.00 4.71 5.74 5.63 7.45 6.91 5.41 5.19<br />
A. Government consumption 9.04 (9.28) 9.12 (8.98) 8.03 (12.70) 10.00 (5.72) 9.29 (8.41) 9.16 (8.87) 9.12 (8.98) 8.26 (11.90)<br />
B. Transfers and subsidies 9.97 (0.60) 9.92 (0.80) 10.00 (0.49) 10.00 (0.01) 10.00 (0.00) 10.00 (0.00) 10.00 (0.00)<br />
C. Government enterprises and investment 0.00 (58.20) 4.00 (30.50) 4.00 (31.10) 2.00 (45.30) 10.00 (13.10) 6.00 (26.05) 0.00 (79.69) 0.00 (79.69)<br />
D. Top marginal tax rate 1.00 1.00 1.00 0.50 0.50 2.50 2.50 2.50<br />
(i) Top marginal income tax rate 1.00 (60) 1.00 (60) 1.00 (60) 1.00 (60) 1.00 (60) 3.00 (50) 3.00 (50) 3.00 (50)<br />
(ii) Top marginal income and payroll tax rate 1.00 (60) 0.00 (63) 0.00 (63) 2.00 (54) 2.00 (54) 2.00 (54)<br />
Area 2. Legal System and Property Rights 2.37 2.46 2.44 2.22 2.41 2.05 2.65 2.40<br />
A. Judicial independence<br />
B. Impartial courts<br />
C. Protection of property rights<br />
3.02 3.59 2.50 2.50 2.70<br />
D. Military interference in rule of law and politics 1.45 0.00 0.00 0.00 0.00<br />
E. Integrity of the legal system 0.00 1.67 1.67 3.33 1.67<br />
F. Legal enforcement of contracts 0.30 0.75 0.87<br />
G. Regulatory restrictions on sale of real property<br />
H. Reliability of police<br />
I. Business costs of crime<br />
5.80 6.68 6.74<br />
Area 3. Sound Money 1.10 1.49 0.00 0.00 1.25 5.04 6.96 7.12<br />
A. Money growth 4.39 (28.06) 1.12 (44.40) 0.00 (62.92) 0.00 (1631.82) 0.00 (2290.00) 4.44 (27.79) 6.44 (17.79) 5.55 (22.27)<br />
B. Standard deviation of inflation 0.00 (25.49) 0.00 (25.25) 0.00 (30.17) 0.00 (9932.53) 0.00 (248.28) 0.00 (163.85) 7.44 (6.41) 7.41 (6.46)<br />
C. Inflation: most recent year 0.00 (51.40) 4.84 (25.82) 0.00 (108.95) 0.00 (466.40) 0.00 (550.01) 5.74 (21.32) 3.95 (30.25) 5.51 (22.43)<br />
D. <strong>Freedom</strong> to own foreign currency bank accounts 0.00 0.00 0.00 0.00 5.00 10.00 10.00 10.00<br />
Area 4. <strong>Freedom</strong> to Trade Internationally 2.07 5.25 4.30 6.32 4.15 4.88 4.49 5.41<br />
A. Tariffs 4.21 4.96 4.90 7.77 8.70 7.32 5.05 5.70<br />
(i) Revenue from trade taxes (% of trade sector) 3.13 (10.30) 4.40 (8.40) 3.93 (9.10) 7.77 (3.34) 8.70 (1.95) 6.81 (4.78) 0.00 (15.90) 1.67 (12.50)<br />
(ii) Mean tariff rate 5.28 (23.60) 5.52 (22.40) 5.86 (20.70) 7.60 (12.00) 7.60 (12.00) 7.80 (11.00)<br />
(iii) Standard deviation of tariff rates 7.55 (6.12) 7.55 (6.12) 7.62 (5.94)<br />
B. Regulatory trade barriers<br />
(i) Non-tariff trade barriers<br />
2.19 2.54 5.57<br />
(ii) Compliance cost of importing and exporting 2.19 2.54 5.57<br />
C. Black-market exchange rates 0.00 8.80 6.00 9.20 1.43 10.00 10.00 10.00<br />
D. Controls of the movement of capital and people<br />
(i) Foreign ownership/investment restrictions<br />
2.00 2.00 2.00 2.00 2.31 0.00 0.38 0.38<br />
(ii) Capital controls 2.00 2.00 2.00 2.00 2.31 0.00 0.77 0.77<br />
(iii) <strong>Freedom</strong> of foreigners to visit 0.00 0.00 0.00<br />
Area 5. Regulation 4.43 4.57 3.94 4.03 4.65 4.41 5.03 5.79<br />
A. Credit market regulations 4.34 4.75 2.88 3.12 5.00 4.32 4.71 6.11<br />
(i) Ownership of banks 0.00 0.00 0.00 0.00 0.00 0.00 0.00 0.00<br />
(ii) Private sector credit 8.69 9.50 8.65 9.35 7.96 9.12 9.34<br />
(iii) Interest rate controls/negative real interest rates 0.00 0.00 10.00 5.00 5.00 9.00<br />
B. Labor market regulations 5.11 5.67 5.67<br />
(i) Hiring regulations and minimum wage<br />
(ii) Hiring and firing regulations<br />
(iii) Centralized collective bargaining<br />
5.00 1.67 1.67<br />
(iv) Hours regulations 5.30 8.00 8.00<br />
(v) Mandated cost of worker dismissal 7.13 10.00 10.00<br />
(vi) Conscription 3.00 3.00 3.00 3.00 3.00 3.00 3.00 3.00<br />
C. Business regulations<br />
(i) Administrative requirements<br />
(ii) Bureaucracy costs<br />
3.81 4.72 5.60<br />
(iii) Starting a business<br />
(iv) Extra payments/bribes/favoritism<br />
3.33 3.98 4.59<br />
(v) Licensing restrictions 1.54 3.96 5.99<br />
(vi) Cost of tax compliance 6.55 6.23 6.23
Congo, Republic of<br />
Country Data Tables • 59<br />
1980 1985 1990 1995 2000 2005 2009 2010<br />
Chain-Linked Rating (Rank) Rating (Rank) Rating (Rank) Rating (Rank) Rating (Rank) Rating (Rank) Rating (Rank) Rating (Rank)<br />
Summary Rating (Rank) 4.50 (74) 4.31 (89) 4.97 (82) 5.02 (99) 4.28 (121) 4.71 (118) 5.19 (118) 5.02 (118)<br />
Area 1. Size of Government 3.17 (94) 2.63 (105) 5.77 (56) 6.20 (58) 4.54 (104) 4.66 (106) 5.20 (97) 5.21 (98)<br />
Area 2. Legal System and Property Rights 4.67 (49) 3.05 (92) 3.02 (92) 2.90 (113) 1.73 (122) 1.99 (120) 3.58 (109) 2.78 (118)<br />
Area 3. Sound Money 5.45 (82) 6.42 (68) 5.96 (73) 5.69 (80) 4.29 (114) 5.33 (115) 4.73 (122) 3.91 (122)<br />
Area 4. <strong>Freedom</strong> to Trade Internationally 4.34 (67) 5.50 (87) 5.81 (94) 5.73 (96) 6.01 (91) 7.20 (59)<br />
Area 5. Regulation 5.12 (66) 5.46 (58) 5.79 (52) 4.82 (98) 5.05 (105) 5.81 (98) 6.05 (99) 6.00 (100)<br />
Unadjusted<br />
Summary Rating (Rank) 4.76 (68) 4.36 (89) 4.83 (85) 5.09 (94) 4.42 (121) 4.59 (138) 5.02 (136) 4.86 (141)<br />
Rating (Data) Rating (Data) Rating (Data) Rating (Data) Rating (Data) Rating (Data) Rating (Data) Rating (Data)<br />
Area 1. Size of Government 2.86 2.37 4.81 6.20 4.54 4.66 5.07 5.08<br />
A. Government consumption 3.72 (27.34) 4.75 (23.86) 6.42 (18.16) 6.50 (17.89) 1.60 (34.55) 2.33 (32.09) 5.48 (21.36) 5.51 (21.28)<br />
B. Transfers and subsidies 9.30 (3.09) 9.55 (2.15) 9.31 (3.03) 9.31 (3.03) 9.31 (3.03)<br />
C. Government enterprises and investment 2.00 (44.20) 0.00 (61.00) 4.00 (32.60) 6.00 (27.00) 4.00 (33.20) 4.00 (33.25) 2.00 (44.16) 2.00 (49.64)<br />
D. Top marginal tax rate 4.00 3.00 3.00 3.00 3.50 3.50<br />
(i) Top marginal income tax rate 4.00 (50) 3.00 (50) 3.00 (50) 3.00 (50) 4.00 (45) 4.00 (45)<br />
(ii) Top marginal income and payroll tax rate 3.00 (49) 3.00 (49)<br />
Area 2. Legal System and Property Rights 4.67 3.05 3.02 3.24 2.39 2.35 4.22 3.28<br />
A. Judicial independence<br />
B. Impartial courts<br />
C. Protection of property rights<br />
1.75 1.86 3.00 3.50 3.60<br />
D. Military interference in rule of law and politics 0.00 0.00 0.00 2.50 2.50<br />
E. Integrity of the legal system 6.96 3.33 3.33 6.67 3.33<br />
F. Legal enforcement of contracts 3.01 3.01 3.01<br />
G. Regulatory restrictions on sale of real property<br />
H. Reliability of police<br />
I. Business costs of crime<br />
2.41 5.44 3.96<br />
Area 3. Sound Money 5.45 6.42 5.96 5.69 4.29 5.33 4.73 3.91<br />
A. Money growth 8.78 (6.12) 9.77 (1.16) 9.81 (0.93) 9.40 (2.99) 7.24 (13.81) 8.60 (7.01) 8.28 (8.61) 7.56 (12.19)<br />
B. Standard deviation of inflation 7.04 (7.41) 6.42 (8.96) 4.20 (14.51) 4.04 (14.90) 0.10 (24.75) 3.79 (15.52) 1.64 (20.91) 2.21 (19.48)<br />
C. Inflation: most recent year 5.97 (20.14) 9.50 (2.50) 9.85 (−0.77) 9.32 (3.38) 9.83 (−0.84) 8.94 (5.28) 8.99 (5.04) 5.86 (20.72)<br />
D. <strong>Freedom</strong> to own foreign currency bank accounts 0.00 0.00 0.00 0.00 0.00 0.00 0.00 0.00<br />
Area 4. <strong>Freedom</strong> to Trade Internationally 5.69 4.47 4.58 5.50 5.81 4.83 5.06 6.07<br />
A. Tariffs 7.47 3.60 4.53 6.70 7.43 7.21 7.36 7.36<br />
(i) Revenue from trade taxes (% of trade sector) 7.47 (3.80) 4.53 (8.20) 7.61 (3.58) 9.25 (1.13) 9.20 (1.20) 9.47 (0.80) 9.47 (0.80)<br />
(ii) Mean tariff rate 3.60 (32.00) 6.28 (18.60) 6.48 (17.60) 6.18 (19.10) 6.42 (17.90) 6.42 (17.90)<br />
(iii) Standard deviation of tariff rates 6.20 (9.50) 6.56 (8.60) 6.25 (9.38) 6.21 (9.49) 6.21 (9.49)<br />
B. Regulatory trade barriers<br />
(i) Non-tariff trade barriers<br />
2.10 2.10 6.13<br />
(ii) Compliance cost of importing and exporting 2.10 2.10 6.13<br />
C. Black-market exchange rates 9.60 9.80 9.20 9.80 10.00 10.00 10.00 10.00<br />
D. Controls of the movement of capital and people<br />
(i) Foreign ownership/investment restrictions<br />
0.00 0.00 0.00 0.00 0.00 0.00 0.77 0.77<br />
(ii) Capital controls 0.00 0.00 0.00 0.00 0.00 0.00 1.54 1.54<br />
(iii) <strong>Freedom</strong> of foreigners to visit 0.00 0.00 0.00<br />
Area 5. Regulation 5.16 5.49 5.79 4.82 5.05 5.77 6.01 5.96<br />
A. Credit market regulations 3.00 4.00 5.45 2.88 3.49 5.33 6.33 6.10<br />
(i) Ownership of banks 0.00 0.00 0.00 0.00 0.00 0.00 0.00 0.00<br />
(ii) Private sector credit 6.36 6.64 7.48 10.00 10.00 9.29<br />
(iii) Interest rate controls/negative real interest rates 6.00 8.00 10.00 2.00 3.00 6.00 9.00 9.00<br />
B. Labor market regulations 6.29 6.37 6.37<br />
(i) Hiring regulations and minimum wage<br />
(ii) Hiring and firing regulations<br />
(iii) Centralized collective bargaining<br />
2.20 2.23 2.23<br />
(iv) Hours regulations 6.00 6.00 6.00<br />
(v) Mandated cost of worker dismissal 6.94 7.23 7.23<br />
(vi) Conscription 10.00 10.00 10.00 10.00 10.00 10.00 10.00 10.00<br />
C. Business regulations<br />
(i) Administrative requirements<br />
(ii) Bureaucracy costs<br />
5.70 5.33 5.43<br />
(iii) Starting a business<br />
(iv) Extra payments/bribes/favoritism<br />
6.72 5.07 5.48<br />
(v) Licensing restrictions 7.17 7.73 7.60<br />
(vi) Cost of tax compliance 3.21 3.21 3.21<br />
www.freetheworld.com • www.fraserinstitute.org • Fraser Institute ©2012
60 • <strong>Economic</strong> <strong>Freedom</strong> of the <strong>World</strong>: 2012 Annual Report<br />
Costa Rica 1980 1985 1990 1995 2000 2005 2009 2010<br />
Chain-Linked Rating (Rank) Rating (Rank) Rating (Rank) Rating (Rank) Rating (Rank) Rating (Rank) Rating (Rank) Rating (Rank)<br />
Summary Rating (Rank) 5.07 (59) 5.03 (62) 6.64 (28) 6.97 (36) 7.51 (30) 7.66 (23) 7.48 (29) 7.44 (36)<br />
Area 1. Size of Government 5.53 (35) 5.03 (54) 7.20 (15) 6.81 (33) 7.13 (29) 8.57 (11) 7.94 (16) 7.85 (23)<br />
Area 2. Legal System and Property Rights 4.57 (50) 4.60 (61) 4.78 (61) 5.66 (62) 6.87 (44) 7.26 (35) 7.19 (33) 7.02 (36)<br />
Area 3. Sound Money 8.04 (20) 5.41 (91) 8.41 (27) 7.87 (42) 7.88 (62) 8.75 (52) 7.86 (77) 8.00 (77)<br />
Area 4. <strong>Freedom</strong> to Trade Internationally 1.48 (81) 3.66 (67) 6.29 (40) 7.70 (40) 8.65 (26) 7.81 (38) 8.04 (25) 7.96 (26)<br />
Area 5. Regulation 6.33 (28) 6.62 (21) 6.77 (24) 6.93 (22) 7.03 (36) 6.01 (95) 6.45 (85) 6.44 (89)<br />
Unadjusted<br />
Summary Rating (Rank) 5.52 (48) 5.33 (58) 6.98 (23) 7.20 (27) 7.51 (25) 7.56 (29) 7.38 (36) 7.34 (42)<br />
Fraser Institute ©2012 • www.fraserinstitute.org • www.freetheworld.com<br />
Rating (Data) Rating (Data) Rating (Data) Rating (Data) Rating (Data) Rating (Data) Rating (Data) Rating (Data)<br />
Area 1. Size of Government 5.72 5.21 7.20 6.81 7.13 8.57 7.94 7.85<br />
A. Government consumption 5.37 (21.75) 5.66 (20.76) 5.04 (22.85) 5.02 (22.93) 6.94 (16.40) 6.66 (17.36) 5.83 (20.18) 5.49 (21.35)<br />
B. Transfers and subsidies 8.50 (6.00) 8.17 (7.20) 8.77 (5.00) 8.23 (7.00) 8.59 (5.66) 8.64 (5.50) 9.44 (2.54) 9.42 (2.63)<br />
C. Government enterprises and investment 4.00 (36.20) 4.00 (34.10) 7.00 (21.00) 6.00 (27.10) 6.00 (27.10) 10.00 (5.66) 10.00 (9.47) 10.00 (9.47)<br />
D. Top marginal tax rate 5.00 3.00 8.00 8.00 7.00 9.00 6.50 6.50<br />
(i) Top marginal income tax rate 5.00 (50) 3.00 (50) 9.00 (25) 9.00 (25) 9.00 (25) 10.00 (15-25) 9.00 (25) 9.00 (25)<br />
(ii) Top marginal income and payroll tax rate 7.00 (33) 7.00 (33) 5.00 (39) 8.00 (24-33) 4.00 (44) 4.00 (44)<br />
Area 2. Legal System and Property Rights 5.21 5.25 5.46 5.80 6.87 6.32 6.26 6.11<br />
A. Judicial independence 6.35 6.87 7.13 6.46<br />
B. Impartial courts 6.54 6.85 6.51 5.16 4.73<br />
C. Protection of property rights 4.50 6.08 5.59 5.51<br />
D. Military interference in rule of law and politics 8.73 10.00 10.00 10.00 10.00<br />
E. Integrity of the legal system 4.11 6.67 6.67 5.83 5.83<br />
F. Legal enforcement of contracts 3.52 3.52 3.52<br />
G. Regulatory restrictions on sale of real property 8.45 8.49 8.50<br />
H. Reliability of police 5.02 6.06 4.28<br />
I. Business costs of crime 3.74 4.53 6.13<br />
Area 3. Sound Money 8.04 5.41 8.41 7.87 7.88 8.75 7.86 8.00<br />
A. Money growth 7.72 (11.41) 5.53 (22.35) 8.66 (6.72) 8.14 (9.28) 5.16 (24.22) 8.37 (8.14) 8.50 (7.51) 8.75 (6.23)<br />
B. Standard deviation of inflation 8.22 (4.46) 0.23 (24.42) 8.68 (3.29) 7.60 (5.99) 8.55 (3.63) 9.40 (1.49) 9.50 (1.26) 9.36 (1.61)<br />
C. Inflation: most recent year 6.23 (18.83) 5.89 (20.53) 6.29 (18.57) 5.73 (21.34) 7.80 (10.99) 7.24 (13.80) 8.43 (7.84) 8.87 (5.66)<br />
D. <strong>Freedom</strong> to own foreign currency bank accounts 10.00 10.00 10.00 10.00 10.00 10.00 5.00 5.00<br />
Area 4. <strong>Freedom</strong> to Trade Internationally 1.74 4.00 6.88 8.42 8.65 7.90 8.13 8.05<br />
A. Tariffs 3.23 1.80 5.63 7.27 8.40 8.08 7.95 7.97<br />
(i) Revenue from trade taxes (% of trade sector) 6.47 (5.30) 5.40 (6.90) 5.33 (7.00) 6.93 (4.60) 9.28 (1.08) 9.24 (1.14) 8.63 (2.05) 8.63 (2.05)<br />
(ii) Mean tariff rate 0.00 (55.00) 0.00 (53.00) 6.72 (16.40) 7.96 (10.20) 8.92 (5.40) 8.60 (7.00) 8.92 (5.40) 8.92 (5.40)<br />
(iii) Standard deviation of tariff rates 0.00 (61.80) 4.84 (12.90) 6.92 (7.70) 7.00 (7.50) 6.39 (9.03) 6.31 (9.23) 6.35 (9.13)<br />
B. Regulatory trade barriers 6.58 4.84 6.73 6.43<br />
(i) Non-tariff trade barriers 5.17 4.70 5.32 5.29<br />
(ii) Compliance cost of importing and exporting 8.00 4.98 8.14 7.56<br />
C. Black-market exchange rates 0.00 5.20 10.00 10.00 10.00 10.00 10.00 10.00<br />
D. Controls of the movement of capital and people 2.00 5.00 5.00 8.00 9.63 8.68 7.84 7.82<br />
(i) Foreign ownership/investment restrictions 9.26 7.54 6.41 7.12<br />
(ii) Capital controls 2.00 5.00 5.00 8.00 10.00 9.09 7.69 6.92<br />
(iii) <strong>Freedom</strong> of foreigners to visit 9.41 9.41 9.41<br />
Area 5. Regulation 6.90 6.79 6.94 7.10 7.03 6.26 6.73 6.71<br />
A. Credit market regulations 8.18 8.09 8.50 8.93 9.21 7.50 7.45 7.45<br />
(i) Ownership of banks 10.00 10.00 10.00 10.00 10.00 5.00 5.00 5.00<br />
(ii) Private sector credit 6.37 8.28 7.51 8.79 8.64 8.49 8.35 8.35<br />
(iii) Interest rate controls/negative real interest rates 6.00 8.00 8.00 9.00 9.00 9.00 9.00<br />
B. Labor market regulations 5.99 5.94 6.66 6.55<br />
(i) Hiring regulations and minimum wage 3.46 1.10 2.23 2.23<br />
(ii) Hiring and firing regulations 4.97 5.51 5.41 5.34<br />
(iii) Centralized collective bargaining 5.00 5.73 6.64 6.04<br />
(iv) Hours regulations 6.51 6.00 8.00 8.00<br />
(v) Mandated cost of worker dismissal 7.31 7.67 7.67<br />
(vi) Conscription 10.00 10.00 10.00 10.00 10.00 10.00 10.00 10.00<br />
C. Business regulations 5.90 5.35 6.08 6.13<br />
(i) Administrative requirements 6.83 2.58 3.83 3.45<br />
(ii) Bureaucracy costs 6.15 2.35 4.35 5.23<br />
(iii) Starting a business 4.70 7.29 7.97 7.96<br />
(iv) Extra payments/bribes/favoritism 5.92 6.91 5.89 5.36<br />
(v) Licensing restrictions 7.48 7.49 7.56<br />
(vi) Cost of tax compliance 5.49 6.95 7.24
Côte d’Ivoire<br />
Country Data Tables • 61<br />
1980 1985 1990 1995 2000 2005 2009 2010<br />
Chain-Linked Rating (Rank) Rating (Rank) Rating (Rank) Rating (Rank) Rating (Rank) Rating (Rank) Rating (Rank) Rating (Rank)<br />
Summary Rating (Rank) 5.39 (47) 6.08 (33) 5.57 (55) 5.20 (91) 5.99 (87) 6.11 (93) 6.10 (101) 5.94 (103)<br />
Area 1. Size of Government 5.99 (24) 7.20 (5) 5.83 (51) 4.95 (87) 8.41 (8) 8.54 (12) 7.53 (25) 6.95 (42)<br />
Area 2. Legal System and Property Rights 5.72 (45) 4.80 (60) 5.96 (53) 3.76 (104) 4.10 (99) 4.30 (96) 4.13 (99)<br />
Area 3. Sound Money 5.00 (91) 6.63 (56) 6.90 (52) 4.87 (96) 6.69 (92) 6.73 (94) 6.62 (106) 6.56 (107)<br />
Area 4. <strong>Freedom</strong> to Trade Internationally 5.13 (43) 5.52 (41) 5.00 (57) 4.69 (99) 5.26 (107) 5.66 (98) 5.52 (102) 5.66 (105)<br />
Area 5. Regulation 6.21 (31) 5.79 (43) 5.51 (67) 5.53 (77) 5.84 (87) 5.64 (102) 6.76 (66) 6.58 (84)<br />
Unadjusted<br />
Summary Rating (Rank) 5.20 (54) 5.53 (49) 5.07 (71) 5.09 (94) 6.01 (84) 5.95 (116) 5.91 (120) 5.76 (129)<br />
Rating (Data) Rating (Data) Rating (Data) Rating (Data) Rating (Data) Rating (Data) Rating (Data) Rating (Data)<br />
Area 1. Size of Government 5.39 5.02 4.07 4.95 8.41 8.54 6.99 6.45<br />
A. Government consumption 5.54 (21.17) 6.06 (19.38) 6.20 (18.93) 7.37 (14.95) 8.18 (12.20) 8.82 (10.02) 8.60 (10.76) 8.65 (10.59)<br />
B. Transfers and subsidies 9.01 (4.15) 9.44 (2.55) 9.48 (2.41) 9.35 (2.89) 9.85 (1.03) 9.66 (1.75)<br />
C. Government enterprises and investment 2.00 (46.80) 4.00 (31.80) 2.00 (42.20) 0.00 (62.70) 6.00 (25.30) 6.00 (28.00) 6.00 (26.50) 4.00 (33.51)<br />
D. Top marginal tax rate 5.00 5.00 4.00 3.00 10.00 10.00 3.50 3.50<br />
(i) Top marginal income tax rate 5.00 (45) 5.00 (45) 4.00 (45) 3.00 (49) 10.00 (10) 10.00 (10) 5.00 (39) 5.00 (39)<br />
(ii) Top marginal income and payroll tax rate 2.00 (54) 2.00 (54)<br />
Area 2. Legal System and Property Rights 5.72 4.80 5.44 3.85 3.11 3.08 2.95<br />
A. Judicial independence 1.55 1.33<br />
B. Impartial courts 4.97 4.60 3.00 3.15 2.87<br />
C. Protection of property rights 3.98 3.54<br />
D. Military interference in rule of law and politics 5.94 1.67 1.67 2.50 2.50<br />
E. Integrity of the legal system 6.96 5.00 4.17 4.17 4.17<br />
F. Legal enforcement of contracts 2.47 2.47 2.47<br />
G. Regulatory restrictions on sale of real property 4.23 4.26 4.26<br />
H. Reliability of police 2.09 3.09<br />
I. Business costs of crime 3.55 2.35<br />
Area 3. Sound Money 5.00 6.63 6.90 4.87 6.69 6.73 6.62 6.56<br />
A. Money growth 8.66 (6.69) 9.00 (5.00) 9.18 (−4.12) 7.60 (12.02) 9.79 (1.06) 8.49 (7.54) 7.73 (11.37) 7.81 (10.93)<br />
B. Standard deviation of inflation 6.18 (9.55) 7.58 (6.05) 9.34 (1.64) 3.57 (16.07) 7.48 (6.29) 9.21 (1.98) 8.95 (2.63) 8.75 (3.12)<br />
C. Inflation: most recent year 5.17 (24.14) 9.93 (0.34) 9.10 (−4.52) 8.30 (8.50) 9.51 (2.46) 9.22 (3.89) 9.79 (1.03) 9.66 (1.68)<br />
D. <strong>Freedom</strong> to own foreign currency bank accounts 0.00 0.00 0.00 0.00 0.00 0.00 0.00 0.00<br />
Area 4. <strong>Freedom</strong> to Trade Internationally 4.19 4.51 4.09 4.69 5.26 5.91 6.28 6.43<br />
A. Tariffs 2.98 3.74 3.07 4.27 5.77 6.51 6.16 6.16<br />
(i) Revenue from trade taxes (% of trade sector) 1.47 (12.80) 2.13 (11.80) 2.73 (10.90) 0.00 (17.32) 3.99 (9.02) 4.80 (7.80) 3.59 (9.62) 3.59 (9.62)<br />
(ii) Mean tariff rate 4.50 (27.50) 5.34 (23.30) 3.40 (33.00) 3.40 (33.00) 7.60 (12.00) 7.48 (12.60) 7.62 (11.90) 7.62 (11.90)<br />
(iii) Standard deviation of tariff rates 9.40 (1.50) 5.72 (10.70) 7.26 (6.84) 7.29 (6.78) 7.29 (6.78)<br />
B. Regulatory trade barriers 5.55 5.89 6.20<br />
(i) Non-tariff trade barriers 5.95 5.15<br />
(ii) Compliance cost of importing and exporting 5.55 5.82 7.25<br />
C. Black-market exchange rates 9.60 9.80 9.20 9.80 10.00 10.00 10.00 10.00<br />
D. Controls of the movement of capital and people 0.00 0.00 0.00 0.00 0.00 1.58 3.06 3.35<br />
(i) Foreign ownership/investment restrictions 6.02 6.91<br />
(ii) Capital controls 0.00 0.00 0.00 0.00 0.00 0.77 0.77 0.77<br />
(iii) <strong>Freedom</strong> of foreigners to visit 2.38 2.38 2.38<br />
Area 5. Regulation 6.21 5.79 5.51 5.53 5.84 5.45 6.59 6.41<br />
A. Credit market regulations 6.56 7.12 6.39 6.43 7.26 5.77 9.00 9.00<br />
(i) Ownership of banks 2.00 2.00 2.00 8.00 8.00 8.00 8.00 8.00<br />
(ii) Private sector credit 9.67 9.35 9.17 7.29 7.78 3.31 10.00 10.00<br />
(iii) Interest rate controls/negative real interest rates 8.00 10.00 8.00 4.00 6.00 6.00<br />
B. Labor market regulations 4.61 5.67 5.70<br />
(i) Hiring regulations and minimum wage 6.70 6.67 6.67<br />
(ii) Hiring and firing regulations 5.90 5.99<br />
(iii) Centralized collective bargaining 7.38 7.44<br />
(iv) Hours regulations 5.30 6.00 6.00<br />
(v) Mandated cost of worker dismissal 5.46 7.09 7.09<br />
(vi) Conscription 10.00 5.00 5.00 5.00 5.00 1.00 1.00 1.00<br />
C. Business regulations 5.97 5.09 4.54<br />
(i) Administrative requirements 3.08 3.53<br />
(ii) Bureaucracy costs 6.57 2.73<br />
(iii) Starting a business 6.41 6.66 6.93<br />
(iv) Extra payments/bribes/favoritism 2.66 2.45<br />
(v) Licensing restrictions 4.54 4.59 4.63<br />
(vi) Cost of tax compliance 6.97 6.97 6.97<br />
www.freetheworld.com • www.fraserinstitute.org • Fraser Institute ©2012
62 • <strong>Economic</strong> <strong>Freedom</strong> of the <strong>World</strong>: 2012 Annual Report<br />
Croatia<br />
Fraser Institute ©2012 • www.fraserinstitute.org • www.freetheworld.com<br />
1980 1985 1990 1995 2000 2005 2009 2010<br />
Chain-Linked Rating (Rank) Rating (Rank) Rating (Rank) Rating (Rank) Rating (Rank) Rating (Rank) Rating (Rank) Rating (Rank)<br />
Summary Rating (Rank) 5.06 (98) 6.35 (73) 6.75 (71) 7.05 (57) 7.03 (58)<br />
Area 1. Size of Government 4.52 (95) 4.03 (108) 4.55 (109) 4.96 (101) 4.96 (103)<br />
Area 2. Legal System and Property Rights 6.95 (35) 7.58 (31) 7.11 (39) 7.69 (27) 7.67 (27)<br />
Area 3. Sound Money 1.25 (112) 3.35 (104) 7.88 (61) 8.20 (63) 8.49 (60) 8.42 (68)<br />
Area 4. <strong>Freedom</strong> to Trade Internationally 5.85 (78) 6.16 (83) 6.54 (80) 6.62 (78) 6.71 (82)<br />
Area 5. Regulation 4.49 (105) 6.11 (74) 7.44 (24) 7.65 (14) 7.56 (24)<br />
Unadjusted<br />
Summary Rating (Rank) 4.96 (99) 6.16 (78) 6.49 (85) 6.78 (79) 6.76 (84)<br />
Rating (Data) Rating (Data) Rating (Data) Rating (Data) Rating (Data) Rating (Data) Rating (Data) Rating (Data)<br />
Area 1. Size of Government 5.28 4.03 4.55 4.96 4.96<br />
A. Government consumption 1.94 (33.42) 2.45 (31.66) 4.86 (23.49) 3.54 (27.96) 3.56 (27.88)<br />
B. Transfers and subsidies 5.91 (15.50) 4.65 (20.13) 4.35 (21.23) 4.80 (19.58) 4.79 (19.63)<br />
C. Government enterprises and investment 8.00 (17.70) 7.00 (22.99) 8.00 (18.43) 10.00 (12.60) 10.00 (9.82)<br />
D. Top marginal tax rate 2.00 1.00 1.50 1.50<br />
(i) Top marginal income tax rate 4.00 (35-53) 2.00 (45-63) 3.00 (45-53) 3.00 (44-51)<br />
(ii) Top marginal income and payroll tax rate 0.00 (55.9-68) 0.00 (62-75) 0.00 (62-68) 0.00 (62-67)<br />
Area 2. Legal System and Property Rights 5.90 6.60 5.34 5.78 5.76<br />
A. Judicial independence 3.69 3.53 3.42<br />
B. Impartial courts 5.82 6.07 4.04 2.79 2.81<br />
C. Protection of property rights 4.98 4.93 4.88<br />
D. Military interference in rule of law and politics 7.39 8.33 8.33 8.33 8.33<br />
E. Integrity of the legal system 8.33 8.33 7.50 7.50<br />
F. Legal enforcement of contracts 5.40 5.40 5.40<br />
G. Regulatory restrictions on sale of real property 3.36 6.39 6.39<br />
H. Reliability of police 4.53 5.73 6.97<br />
I. Business costs of crime 5.43 7.45 6.16<br />
Area 3. Sound Money 2.50 3.35 7.88 8.20 8.49 8.42<br />
A. Money growth 0.00 (62.40) 8.28 (8.60) 8.62 (6.89) 9.98 (−0.09) 9.64 (−1.78)<br />
B. Standard deviation of inflation 0.00 (573.30) 9.15 (2.11) 9.87 (0.34) 9.47 (1.34) 9.23 (1.92)<br />
C. Inflation: most recent year 0.00 (500.00) 8.40 (8.00) 9.07 (4.63) 9.33 (3.34) 9.52 (2.38) 9.79 (1.05)<br />
D. <strong>Freedom</strong> to own foreign currency bank accounts 5.00 5.00 5.00 5.00 5.00 5.00<br />
Area 4. <strong>Freedom</strong> to Trade Internationally 5.79 6.16 7.52 7.61 7.71<br />
A. Tariffs 6.97 8.47 8.82 8.67 8.73<br />
(i) Revenue from trade taxes (% of trade sector) 6.97 (4.55) 8.29 (2.57) 9.56 (0.66) 9.49 (0.77) 9.52 (0.72)<br />
(ii) Mean tariff rate 8.66 (6.70) 9.52 (2.40) 9.02 (4.90) 9.04 (4.80)<br />
(iii) Standard deviation of tariff rates 7.37 (6.57) 7.49 (6.27) 7.64 (5.90)<br />
B. Regulatory trade barriers 6.43 6.77 6.81<br />
(i) Non-tariff trade barriers 6.00 6.05 5.63<br />
(ii) Compliance cost of importing and exporting 6.86 7.49 8.00<br />
C. Black-market exchange rates 0.00 8.40 10.00 10.00 10.00 10.00<br />
D. Controls of the movement of capital and people 0.00 2.00 0.00 4.84 5.00 5.28<br />
(i) Foreign ownership/investment restrictions 6.17 5.12 4.44<br />
(ii) Capital controls 0.00 2.00 0.00 1.54 3.08 4.62<br />
(iii) <strong>Freedom</strong> of foreigners to visit 6.80 6.80 6.80<br />
Area 5. Regulation 4.49 6.11 6.84 7.04 6.95<br />
A. Credit market regulations 0.00 4.34 8.64 9.27 9.20 9.01<br />
(i) Ownership of banks 0.00 0.00 10.00 10.00 10.00 10.00<br />
(ii) Private sector credit 9.01 6.92 8.82 8.61 8.03<br />
(iii) Interest rate controls/negative real interest rates 4.00 9.00 9.00 9.00 9.00<br />
B. Labor market regulations 5.58 6.40 6.40<br />
(i) Hiring regulations and minimum wage 3.90 2.23 2.23<br />
(ii) Hiring and firing regulations 5.13 3.90 3.66<br />
(iii) Centralized collective bargaining 7.07 6.70 6.92<br />
(iv) Hours regulations 6.00 8.00 8.00<br />
(v) Mandated cost of worker dismissal 6.38 7.59 7.59<br />
(vi) Conscription 3.00 3.00 5.00 10.00 10.00<br />
C. Business regulations 5.66 5.50 5.45<br />
(i) Administrative requirements 3.22 1.87 2.05<br />
(ii) Bureaucracy costs 5.70 4.80 4.20<br />
(iii) Starting a business 9.01 9.64 9.64<br />
(iv) Extra payments/bribes/favoritism 5.73 4.64 4.33<br />
(v) Licensing restrictions 2.51 4.24 4.68<br />
(vi) Cost of tax compliance 7.80 7.80 7.80
Cyprus<br />
Country Data Tables • 63<br />
1980 1985 1990 1995 2000 2005 2009 2010<br />
Chain-Linked Rating (Rank) Rating (Rank) Rating (Rank) Rating (Rank) Rating (Rank) Rating (Rank) Rating (Rank) Rating (Rank)<br />
Summary Rating (Rank) 5.53 (42) 5.53 (46) 6.04 (43) 6.41 (55) 6.51 (68) 7.55 (32) 7.60 (21) 7.55 (28)<br />
Area 1. Size of Government 5.89 (27) 5.71 (33) 5.39 (64) 6.21 (57) 6.19 (59) 7.45 (36) 6.97 (36) 6.93 (43)<br />
Area 2. Legal System and Property Rights 3.99 (72) 6.67 (29) 7.16 (32) 7.98 (26) 8.35 (17) 8.49 (18) 8.41 (17)<br />
Area 3. Sound Money 5.69 (73) 6.84 (41) 7.03 (43) 7.25 (49) 6.88 (85) 9.35 (33) 9.42 (30) 9.44 (27)<br />
Area 4. <strong>Freedom</strong> to Trade Internationally 5.39 (41) 5.52 (40) 5.32 (52) 5.58 (84) 6.00 (86) 7.29 (55) 7.28 (54) 7.10 (63)<br />
Area 5. Regulation 5.15 (65) 5.61 (54) 5.81 (51) 5.84 (59) 5.52 (97) 5.22 (114) 5.68 (109) 5.71 (109)<br />
Unadjusted<br />
Summary Rating (Rank) 5.56 (46) 5.56 (48) 5.94 (44) 6.24 (57) 6.30 (74) 7.53 (30) 7.69 (14) 7.64 (20)<br />
Rating (Data) Rating (Data) Rating (Data) Rating (Data) Rating (Data) Rating (Data) Rating (Data) Rating (Data)<br />
Area 1. Size of Government 6.03 5.85 5.39 6.21 6.19 7.45 6.97 6.93<br />
A. Government consumption 6.77 (16.97) 6.45 (18.06) 5.17 (22.43) 5.53 (21.20) 6.02 (19.53) 5.32 (21.92) 5.13 (22.57) 5.18 (22.39)<br />
B. Transfers and subsidies 8.34 (6.60) 7.93 (8.10) 7.87 (8.30) 7.33 (10.30) 6.73 (12.51) 6.47 (13.47) 5.25 (17.93) 5.03 (18.75)<br />
C. Government enterprises and investment 8.00 (18.10) 8.00 (17.40) 8.00 (17.40) 8.00 (17.40) 8.00 (17.40) 10.00 (3.07) 10.00 (3.07) 10.00 (3.07)<br />
D. Top marginal tax rate 1.00 1.00 0.50 4.00 4.00 8.00 7.50 7.50<br />
(i) Top marginal income tax rate 1.00 (60) 1.00 (60) 1.00 (60) 5.00 (40) 5.00 (40) 8.00 (30) 8.00 (30) 8.00 (30)<br />
(ii) Top marginal income and payroll tax rate 0.00 (62) 3.00 (48) 3.00 (48) 8.00 (30) 7.00 (35) 7.00 (35)<br />
Area 2. Legal System and Property Rights 3.99 6.67 6.30 6.89 7.43 6.95 6.88<br />
A. Judicial independence 6.99 7.49 7.15<br />
B. Impartial courts 7.20 7.27 6.77 6.19 6.07<br />
C. Protection of property rights 7.53 7.39 7.36<br />
D. Military interference in rule of law and politics 7.32 8.33 8.33 8.33 8.33<br />
E. Integrity of the legal system 6.96 8.33 8.33 8.33 8.33<br />
F. Legal enforcement of contracts 4.00 4.00<br />
G. Regulatory restrictions on sale of real property 6.07 5.82<br />
H. Reliability of police 6.57 6.61 7.81<br />
I. Business costs of crime 7.47 8.13 7.08<br />
Area 3. Sound Money 5.69 6.84 7.03 7.25 6.88 9.35 9.42 9.44<br />
A. Money growth 6.40 (18.00) 9.60 (1.99) 9.45 (2.75) 9.91 (0.45) 8.65 (6.77) 8.48 (7.62) 8.55 (7.23) 9.03 (4.84)<br />
B. Standard deviation of inflation 9.06 (2.36) 8.89 (2.77) 9.71 (0.72) 9.62 (0.94) 9.70 (0.75) 9.42 (1.45) 9.19 (2.02) 9.19 (2.03)<br />
C. Inflation: most recent year 7.30 (13.50) 8.87 (5.67) 8.95 (5.27) 9.48 (2.62) 9.17 (4.14) 9.49 (2.56) 9.93 (0.37) 9.52 (2.38)<br />
D. <strong>Freedom</strong> to own foreign currency bank accounts 0.00 0.00 0.00 0.00 0.00 10.00 10.00 10.00<br />
Area 4. <strong>Freedom</strong> to Trade Internationally 5.39 5.52 4.82 5.58 6.00 8.05 8.25 8.04<br />
A. Tariffs 6.96 6.77 5.47 7.73 7.99 8.39 8.35 8.34<br />
(i) Revenue from trade taxes (% of trade sector) 7.33 (4.00) 7.07 (4.40) 7.20 (4.20) 8.27 (2.60) 9.27 (1.10) 9.59 (0.62) 9.81 (0.29) 9.63 (0.55)<br />
(ii) Mean tariff rate 6.58 (17.10) 6.48 (17.60) 6.70 (16.50) 7.20 (14.00) 6.72 (16.40) 9.46 (2.70) 8.94 (5.30) 8.98 (5.10)<br />
(iii) Standard deviation of tariff rates 2.52 (18.70) 6.13 (9.67) 6.29 (9.28) 6.41 (8.98)<br />
B. Regulatory trade barriers 7.10 8.21 7.46<br />
(i) Non-tariff trade barriers 7.10 7.15 6.73<br />
(ii) Compliance cost of importing and exporting 9.27 8.19<br />
C. Black-market exchange rates 9.20 9.80 9.00 9.00 10.00 10.00 10.00 10.00<br />
D. Controls of the movement of capital and people 0.00 0.00 0.00 0.00 0.00 6.73 6.44 6.37<br />
(i) Foreign ownership/investment restrictions 6.68 6.59 6.37<br />
(ii) Capital controls 0.00 0.00 0.00 0.00 0.00 6.92 6.15 6.15<br />
(iii) <strong>Freedom</strong> of foreigners to visit 6.58 6.58 6.58<br />
Area 5. Regulation 5.15 5.61 5.81 5.84 5.52 5.39 6.85 6.89<br />
A. Credit market regulations 7.09 8.30 8.83 8.92 8.08 7.81 7.82 7.82<br />
(i) Ownership of banks 8.00 8.00 8.00 8.00 8.00 10.00 10.00 10.00<br />
(ii) Private sector credit 9.28 8.90 8.50 8.75 6.23 3.43 3.47 3.47<br />
(iii) Interest rate controls/negative real interest rates 4.00 8.00 10.00 10.00 10.00 10.00 10.00 10.00<br />
B. Labor market regulations 2.87 6.30 6.17<br />
(i) Hiring regulations and minimum wage 6.67 6.67<br />
(ii) Hiring and firing regulations 3.59 5.15 4.78<br />
(iii) Centralized collective bargaining 5.02 6.00 5.59<br />
(iv) Hours regulations 10.00 10.00<br />
(v) Mandated cost of worker dismissal 10.00 10.00<br />
(vi) Conscription 0.00 0.00 0.00 0.00 0.00 0.00 0.00 0.00<br />
C. Business regulations 5.50 6.43 6.69<br />
(i) Administrative requirements 4.24 4.95 4.88<br />
(ii) Bureaucracy costs 5.12 3.50 6.11<br />
(iii) Starting a business 9.61 9.61<br />
(iv) Extra payments/bribes/favoritism 7.14 7.26 6.29<br />
(v) Licensing restrictions 4.92 4.91<br />
(vi) Cost of tax compliance 8.33 8.33<br />
www.freetheworld.com • www.fraserinstitute.org • Fraser Institute ©2012
64 • <strong>Economic</strong> <strong>Freedom</strong> of the <strong>World</strong>: 2012 Annual Report<br />
Czech Republic<br />
Fraser Institute ©2012 • www.fraserinstitute.org • www.freetheworld.com<br />
1980 1985 1990 1995 2000 2005 2009 2010<br />
Chain-Linked Rating (Rank) Rating (Rank) Rating (Rank) Rating (Rank) Rating (Rank) Rating (Rank) Rating (Rank) Rating (Rank)<br />
Summary Rating (Rank) 5.84 (72) 6.53 (67) 6.92 (61) 7.09 (55) 7.08 (54)<br />
Area 1. Size of Government 2.81 (116) 3.13 (118) 3.30 (122) 3.62 (119) 3.68 (118)<br />
Area 2. Legal System and Property Rights 6.78 (22) 7.25 (24) 6.55 (43) 6.89 (43) 6.61 (48) 6.93 (38) 6.74 (45)<br />
Area 3. Sound Money 5.95 (74) 8.13 (55) 9.05 (41) 9.48 (27) 9.45 (26)<br />
Area 4. <strong>Freedom</strong> to Trade Internationally 8.05 (28) 8.28 (35) 8.00 (27) 7.82 (39) 7.74 (36)<br />
Area 5. Regulation 4.20 (100) 5.85 (57) 6.22 (66) 7.69 (17) 7.57 (17) 7.76 (14)<br />
Unadjusted<br />
Summary Rating (Rank) 5.79 (73) 6.53 (63) 7.00 (62) 7.17 (51) 7.16 (58)<br />
Rating (Data) Rating (Data) Rating (Data) Rating (Data) Rating (Data) Rating (Data) Rating (Data) Rating (Data)<br />
Area 1. Size of Government 2.81 3.13 4.45 4.88 4.96<br />
A. Government consumption 3.04 (29.66) 3.02 (29.73) 2.64 (31.03) 2.85 (30.31) 2.93 (30.04)<br />
B. Transfers and subsidies 0.00 (37.20) 2.40 (28.40) 2.35 (28.56) 3.17 (25.58) 2.65 (27.47) 2.91 (26.52)<br />
C. Government enterprises and investment 8.00 (19.75) 7.00 (23.35) 7.00 (23.35)<br />
D. Top marginal tax rate 3.00 4.00 4.00 7.00 7.00<br />
(i) Top marginal income tax rate 5.00 (43) 7.00 (32) 7.00 (32) 10.00 (15) 10.00 (15)<br />
(ii) Top marginal income and payroll tax rate 1.00 (64) 1.00 (56) 1.00 (58) 4.00 (45) 4.00 (45)<br />
Area 2. Legal System and Property Rights 6.78 7.25 6.55 6.89 6.04 6.33 6.16<br />
A. Judicial independence 6.17 6.01 4.73 4.96 4.51<br />
B. Impartial courts 3.58 4.51 4.12 3.70 3.16<br />
C. Protection of property rights 4.54 5.58 6.00 5.65 5.14<br />
D. Military interference in rule of law and politics 8.45 10.00 10.00 10.00 10.00<br />
E. Integrity of the legal system 10.00 8.33 8.33 8.33 8.33<br />
F. Legal enforcement of contracts 3.54 3.85 3.85<br />
G. Regulatory restrictions on sale of real property 6.69 8.20 8.54<br />
H. Reliability of police 4.67 4.65 7.50<br />
I. Business costs of crime 6.30 7.62 4.38<br />
Area 3. Sound Money 5.95 8.13 9.05 9.48 9.45<br />
A. Money growth 6.00 (20.00) 9.87 (0.65) 7.45 (12.76) 8.70 (6.48) 8.80 (6.00)<br />
B. Standard deviation of inflation 4.88 (12.79) 8.43 (3.93) 9.11 (2.23) 9.41 (1.46) 9.28 (1.80)<br />
C. Inflation: most recent year 7.92 (10.41) 9.22 (3.90) 9.63 (1.85) 9.79 (1.04) 9.72 (1.41)<br />
D. <strong>Freedom</strong> to own foreign currency bank accounts 5.00 5.00 10.00 10.00 10.00<br />
Area 4. <strong>Freedom</strong> to Trade Internationally 7.90 8.28 8.04 7.86 7.77<br />
A. Tariffs 8.45 8.22 8.39 8.22 8.34<br />
(i) Revenue from trade taxes (% of trade sector) 9.25 (1.13) 9.68 (0.48) 9.59 (0.62) 9.44 (0.84) 9.63 (0.55)<br />
(ii) Mean tariff rate 8.66 (6.70) 8.70 (6.50) 9.46 (2.70) 8.94 (5.30) 8.98 (5.10)<br />
(iii) Standard deviation of tariff rates 7.44 (6.40) 6.28 (9.30) 6.13 (9.67) 6.29 (9.28) 6.41 (8.98)<br />
B. Regulatory trade barriers 7.42 7.88 7.48 7.67 7.27<br />
(i) Non-tariff trade barriers 7.42 7.27 7.27 7.84 7.29<br />
(ii) Compliance cost of importing and exporting 8.50 7.70 7.49 7.25<br />
C. Black-market exchange rates 10.00 10.00 10.00 10.00 10.00<br />
D. Controls of the movement of capital and people 0.00 0.00 0.00 5.72 7.03 6.28 5.55 5.49<br />
(i) Foreign ownership/investment restrictions 6.44 7.92 8.42 7.01 6.80<br />
(ii) Capital controls 0.00 0.00 0.00 5.00 6.15 3.85 3.08 3.08<br />
(iii) <strong>Freedom</strong> of foreigners to visit 6.58 6.58 6.58<br />
Area 5. Regulation 3.42 5.72 6.22 7.40 7.28 7.47<br />
A. Credit market regulations 0.00 0.00 0.00 6.89 6.85 9.52 9.00 9.22<br />
(i) Ownership of banks 0.00 0.00 0.00 5.00 2.00 10.00 10.00 10.00<br />
(ii) Private sector credit 9.68 8.56 8.57 6.99 7.67<br />
(iii) Interest rate controls/negative real interest rates 6.00 10.00 10.00 10.00 10.00<br />
B. Labor market regulations 5.03 5.22 7.61 7.60 7.67<br />
(i) Hiring regulations and minimum wage 6.58 5.09 6.70 6.67 6.67<br />
(ii) Hiring and firing regulations 5.62 5.62 5.30 3.26 3.36 3.59<br />
(iii) Centralized collective bargaining 5.18 7.70 7.75 6.81 6.97<br />
(iv) Hours regulations 4.75 5.01 10.00 10.00 10.00<br />
(v) Mandated cost of worker dismissal 7.96 8.79 8.79<br />
(vi) Conscription 0.00 0.00 0.00 3.00 3.00 10.00 10.00 10.00<br />
C. Business regulations 5.25 6.59 5.07 5.25 5.51<br />
(i) Administrative requirements 7.80 2.22 2.78 2.70<br />
(ii) Bureaucracy costs 5.89 8.10 5.51 2.47 4.32<br />
(iii) Starting a business 5.97 5.53 9.02 9.16 9.17<br />
(iv) Extra payments/bribes/favoritism 3.89 4.92 6.56 4.88 4.16<br />
(v) Licensing restrictions 7.13 8.44 8.94<br />
(vi) Cost of tax compliance 0.00 3.76 3.76
Country Data Tables • 65<br />
Denmark 1980 1985 1990 1995 2000 2005 2009 2010<br />
Chain-Linked Rating (Rank) Rating (Rank) Rating (Rank) Rating (Rank) Rating (Rank) Rating (Rank) Rating (Rank) Rating (Rank)<br />
Summary Rating (Rank) 6.39 (20) 6.53 (21) 7.26 (16) 7.73 (12) 7.92 (13) 7.94 (13) 7.64 (19) 7.76 (16)<br />
Area 1. Size of Government 3.06 (95) 3.14 (98) 3.17 (105) 3.07 (114) 3.48 (114) 3.81 (118) 3.41 (121) 3.78 (117)<br />
Area 2. Legal System and Property Rights 7.18 (15) 7.88 (7) 8.35 (3) 9.09 (9) 9.54 (2) 9.46 (1) 8.97 (7) 9.12 (3)<br />
Area 3. Sound Money 6.68 (34) 6.51 (64) 9.46 (13) 9.77 (2) 9.71 (4) 9.49 (24) 9.49 (25) 9.60 (16)<br />
Area 4. <strong>Freedom</strong> to Trade Internationally 7.91 (12) 8.10 (12) 8.12 (16) 9.23 (8) 9.40 (6) 8.67 (8) 8.45 (13) 8.10 (20)<br />
Area 5. Regulation 7.21 (8) 7.04 (15) 7.20 (15) 7.46 (11) 7.46 (17) 8.24 (10) 7.82 (11) 8.16 (10)<br />
Unadjusted<br />
Summary Rating (Rank) 6.24 (25) 6.37 (25) 7.16 (17) 7.72 (14) 7.92 (13) 7.89 (13) 7.59 (21) 7.71 (16)<br />
Rating (Data) Rating (Data) Rating (Data) Rating (Data) Rating (Data) Rating (Data) Rating (Data) Rating (Data)<br />
Area 1. Size of Government 3.06 3.14 3.17 3.07 3.48 3.81 3.41 3.78<br />
A. Government consumption 1.76 (34.01) 1.99 (33.23) 1.69 (34.25) 1.87 (33.63) 1.74 (34.08) 1.55 (34.74) 0.65 (37.80) 0.74 (37.48)<br />
B. Transfers and subsidies 4.47 (20.80) 4.58 (20.40) 3.98 (22.60) 2.92 (26.50) 3.67 (23.72) 3.18 (25.54) 3.51 (24.31) 3.39 (24.76)<br />
C. Government enterprises and investment 6.00 (25.00) 6.00 (26.00) 7.00 (20.30) 7.00 (24.90) 7.00 (24.90) 10.00 (9.07) 8.00 (17.07) 8.00 (17.62)<br />
D. Top marginal tax rate 0.00 0.00 0.00 0.50 1.50 0.50 1.50 3.00<br />
(i) Top marginal income tax rate 0.00 (66) 0.00 (73) 0.00 (68) 1.00 (64) 2.00 (59) 1.00 (59) 2.00 (59) 3.00 (52)<br />
(ii) Top marginal income and payroll tax rate 0.00 (69) 0.00 (67) 1.00 (63) 0.00 (63) 1.00 (62) 3.00 (55)<br />
Area 2. Legal System and Property Rights 7.18 7.88 8.35 9.09 9.54 8.99 8.52 8.67<br />
A. Judicial independence 8.82 9.35 8.78 9.00 9.26<br />
B. Impartial courts 9.52 9.52 9.25 7.15 7.24<br />
C. Protection of property rights 7.38 8.82 9.34 8.38 8.42<br />
D. Military interference in rule of law and politics 9.73 10.00 10.00 10.00 10.00<br />
E. Integrity of the legal system 10.00 10.00 10.00 10.00 10.00<br />
F. Legal enforcement of contracts 6.19 5.96 5.96<br />
G. Regulatory restrictions on sale of real property 9.01 9.01 9.50<br />
H. Reliability of police 9.17 8.66 8.73<br />
I. Business costs of crime 9.17 8.56 8.89<br />
Area 3. Sound Money 6.68 6.51 9.46 9.77 9.71 9.49 9.49 9.60<br />
A. Money growth 8.70 (6.51) 7.86 (10.71) 8.80 (6.01) 9.75 (1.27) 9.75 (1.27) 8.56 (7.20) 8.83 (5.83) 9.48 (2.58)<br />
B. Standard deviation of inflation 9.67 (0.82) 9.03 (2.42) 9.72 (0.71) 9.76 (0.60) 9.69 (0.76) 9.77 (0.58) 9.41 (1.48) 9.36 (1.60)<br />
C. Inflation: most recent year 8.35 (8.23) 9.13 (4.33) 9.32 (3.40) 9.57 (2.14) 9.42 (2.92) 9.64 (1.81) 9.73 (1.33) 9.54 (2.30)<br />
D. <strong>Freedom</strong> to own foreign currency bank accounts 0.00 0.00 10.00 10.00 10.00 10.00 10.00 10.00<br />
Area 4. <strong>Freedom</strong> to Trade Internationally 7.85 8.04 7.83 9.13 9.40 8.55 8.34 7.99<br />
A. Tariffs 8.95 9.12 8.48 8.70 9.18 8.39 8.22 8.34<br />
(i) Revenue from trade taxes (% of trade sector) 9.67 (0.50) 9.73 (0.40) 9.80 (0.30) 9.80 (0.30) 9.78 (0.33) 9.59 (0.62) 9.44 (0.84) 9.63 (0.55)<br />
(ii) Mean tariff rate 8.24 (8.80) 8.50 (7.50) 8.52 (7.40) 8.66 (6.70) 9.52 (2.40) 9.46 (2.70) 8.94 (5.30) 8.98 (5.10)<br />
(iii) Standard deviation of tariff rates 7.12 (7.20) 7.64 (5.90) 8.24 (4.40) 6.13 (9.67) 6.29 (9.28) 6.41 (8.98)<br />
B. Regulatory trade barriers 9.05 9.43 8.39 8.12 6.62<br />
(i) Non-tariff trade barriers 9.05 9.04 7.35 6.81 7.05<br />
(ii) Compliance cost of importing and exporting 9.83 9.43 9.43 6.19<br />
C. Black-market exchange rates 9.60 10.00 10.00 10.00 10.00 10.00 10.00 10.00<br />
D. Controls of the movement of capital and people 5.00 5.00 5.00 8.77 8.97 7.42 7.02 6.99<br />
(i) Foreign ownership/investment restrictions 9.54 9.48 8.08 6.87 6.79<br />
(ii) Capital controls 5.00 5.00 5.00 8.00 8.46 7.69 7.69 7.69<br />
(iii) <strong>Freedom</strong> of foreigners to visit 6.50 6.50 6.50<br />
Area 5. Regulation 6.44 6.28 7.00 7.53 7.46 8.60 8.17 8.52<br />
A. Credit market regulations 9.41 9.08 9.34 9.39 10.00 10.00 9.69 9.69<br />
(i) Ownership of banks 10.00 10.00 10.00 10.00 10.00 10.00 10.00 10.00<br />
(ii) Private sector credit 8.24 7.25 8.03 8.16 10.00 10.00 9.06 9.06<br />
(iii) Interest rate controls/negative real interest rates 10.00 10.00 10.00 10.00 10.00 10.00 10.00 10.00<br />
B. Labor market regulations 3.46 3.49 4.66 4.83 4.62 7.43 7.47 7.46<br />
(i) Hiring regulations and minimum wage 3.68 4.76 10.00 10.00 10.00<br />
(ii) Hiring and firing regulations 8.10 8.10 6.47 7.39 8.00 8.51<br />
(iii) Centralized collective bargaining 5.18 5.18 5.18 5.18 4.85 6.18 5.84 5.28<br />
(iv) Hours regulations 2.20 2.29 2.37 4.17 4.01 8.00 8.00 8.00<br />
(v) Mandated cost of worker dismissal 10.00 10.00 10.00<br />
(vi) Conscription 3.00 3.00 3.00 3.00 3.00 3.00 3.00 3.00<br />
C. Business regulations 8.39 7.76 8.38 7.36 8.41<br />
(i) Administrative requirements 7.05 4.56 4.72 5.03<br />
(ii) Bureaucracy costs 8.87 8.23 8.44 2.32 8.37<br />
(iii) Starting a business 6.32 6.45 9.66 9.72 9.73<br />
(iv) Extra payments/bribes/favoritism 9.99 9.29 9.49 9.21 9.15<br />
(v) Licensing restrictions 9.67 9.68 9.72<br />
(vi) Cost of tax compliance 8.49 8.49 8.49<br />
www.freetheworld.com • www.fraserinstitute.org • Fraser Institute ©2012
66 • <strong>Economic</strong> <strong>Freedom</strong> of the <strong>World</strong>: 2012 Annual Report<br />
Dominican Republic<br />
Fraser Institute ©2012 • www.fraserinstitute.org • www.freetheworld.com<br />
1980 1985 1990 1995 2000 2005 2009 2010<br />
Chain-Linked Rating (Rank) Rating (Rank) Rating (Rank) Rating (Rank) Rating (Rank) Rating (Rank) Rating (Rank) Rating (Rank)<br />
Summary Rating (Rank) 5.16 (57) 4.91 (70) 4.34 (98) 5.99 (69) 6.76 (55) 6.53 (76) 6.82 (64) 6.98 (61)<br />
Area 1. Size of Government 5.71 (30) 6.20 (19) 6.68 (25) 8.14 (12) 8.88 (3) 8.96 (4) 8.15 (9) 8.18 (14)<br />
Area 2. Legal System and Property Rights 5.14 (43) 4.78 (58) 4.72 (64) 5.03 (84) 4.62 (86) 4.42 (88) 4.42 (94) 4.28 (96)<br />
Area 3. Sound Money 7.34 (28) 3.82 (100) 2.05 (111) 4.48 (99) 6.82 (89) 5.87 (112) 8.12 (69) 9.24 (43)<br />
Area 4. <strong>Freedom</strong> to Trade Internationally 2.32 (72) 4.27 (60) 2.25 (95) 5.25 (92) 6.41 (78) 6.80 (74) 7.07 (66) 7.04 (67)<br />
Area 5. Regulation 5.51 (49) 5.38 (60) 5.83 (48) 6.93 (23) 7.08 (35) 6.59 (75) 6.29 (92) 6.20 (93)<br />
Unadjusted<br />
Summary Rating (Rank) 5.66 (39) 5.39 (55) 4.48 (95) 6.10 (61) 6.73 (55) 6.63 (81) 6.92 (70) 7.09 (63)<br />
Rating (Data) Rating (Data) Rating (Data) Rating (Data) Rating (Data) Rating (Data) Rating (Data) Rating (Data)<br />
Area 1. Size of Government 5.71 6.20 6.68 8.14 8.88 8.96 8.15 8.18<br />
A. Government consumption 9.12 (8.98) 9.35 (8.20) 10.00 (6.00) 9.87 (6.43) 9.03 (9.29) 11.67 (7.48) 9.29 (8.41) 9.40 (8.04)<br />
B. Transfers and subsidies 9.70 (1.60) 9.46 (2.50) 9.73 (1.50) 9.67 (1.70) 9.49 (2.36) 9.17 (3.54) 9.32 (2.99) 9.32 (2.99)<br />
C. Government enterprises and investment 4.00 (31.60) 6.00 (25.10) 7.00 (23.70) 4.00 (33.70) 8.00 (18.00) 7.00 (24.30) 6.00 (25.10) 6.00 (25.10)<br />
D. Top marginal tax rate 0.00 0.00 0.00 9.00 9.00 8.00 8.00 8.00<br />
(i) Top marginal income tax rate 0.00 (73) 0.00 (73) 0.00 (73) 9.00 (25) 9.00 (25) 9.00 (25) 9.00 (25) 9.00 (25)<br />
(ii) Top marginal income and payroll tax rate 0.00 (73) 9.00 (25) 9.00 (25) 7.00 (32) 7.00 (33) 7.00 (33)<br />
Area 2. Legal System and Property Rights 5.78 5.38 5.30 5.22 4.47 4.36 4.37 4.22<br />
A. Judicial independence 4.17 3.44 2.82<br />
B. Impartial courts 6.23 5.57 3.75 3.53 3.41<br />
C. Protection of property rights 2.90 5.27 4.97 4.79<br />
D. Military interference in rule of law and politics 6.63 5.00 5.00 5.00 5.00<br />
E. Integrity of the legal system 4.11 5.00 3.33 4.17 4.17<br />
F. Legal enforcement of contracts 4.51 4.51 4.51<br />
G. Regulatory restrictions on sale of real property 6.30 7.65 7.65<br />
H. Reliability of police 3.43 2.18 4.05<br />
I. Business costs of crime 3.50 3.84 1.62<br />
Area 3. Sound Money 7.34 3.82 2.05 4.48 6.82 5.87 8.12 9.24<br />
A. Money growth 8.96 (5.18) 7.26 (13.69) 4.70 (26.49) 8.44 (7.82) 9.39 (3.06) 7.40 (13.00) 8.85 (5.75) 9.26 (3.72)<br />
B. Standard deviation of inflation 8.14 (4.64) 3.00 (17.49) 3.48 (16.30) 1.99 (20.03) 9.42 (1.45) 1.91 (20.22) 8.91 (2.72) 8.97 (2.58)<br />
C. Inflation: most recent year 7.26 (13.70) 0.00 (50.50) 0.00 (51.05) 7.49 (12.56) 8.46 (7.72) 9.16 (4.19) 9.71 (1.44) 8.73 (6.33)<br />
D. <strong>Freedom</strong> to own foreign currency bank accounts 5.00 5.00 0.00 0.00 0.00 5.00 5.00 10.00<br />
Area 4. <strong>Freedom</strong> to Trade Internationally 2.69 4.96 2.37 5.53 6.41 7.27 7.55 7.52<br />
A. Tariffs 3.47 5.67 5.11 5.00 5.78 7.03 7.54 7.54<br />
(i) Revenue from trade taxes (% of trade sector) 3.47 (9.80) 5.67 (6.50) 5.83 (6.26) 4.01 (8.99) 5.23 (7.16) 6.03 (5.96) 7.60 (3.60) 7.60 (3.60)<br />
(ii) Mean tariff rate 4.40 (28.00) 6.00 (20.00) 6.10 (19.50) 8.20 (9.00) 8.58 (7.10) 8.58 (7.10)<br />
(iii) Standard deviation of tariff rates 6.00 (10.00) 6.87 (7.82) 6.45 (8.88) 6.45 (8.88)<br />
B. Regulatory trade barriers 3.33 6.04 6.75 6.33<br />
(i) Non-tariff trade barriers 3.33 4.40 4.71 4.79<br />
(ii) Compliance cost of importing and exporting 7.68 8.79 7.88<br />
C. Black-market exchange rates 2.60 7.20 0.00 9.60 10.00 10.00 10.00 10.00<br />
D. Controls of the movement of capital and people 2.00 2.00 2.00 2.00 6.52 6.00 5.92 6.22<br />
(i) Foreign ownership/investment restrictions 8.42 7.70 6.68 6.81<br />
(ii) Capital controls 2.00 2.00 2.00 2.00 4.62 3.85 4.62 5.38<br />
(iii) <strong>Freedom</strong> of foreigners to visit 6.46 6.46 6.46<br />
Area 5. Regulation 6.76 6.61 5.99 7.12 7.08 6.69 6.39 6.29<br />
A. Credit market regulations 7.79 7.34 5.99 8.97 9.39 7.88 6.82 7.15<br />
(i) Ownership of banks 8.00 8.00 10.00 10.00 10.00 5.00 5.00 5.00<br />
(ii) Private sector credit 7.58 6.68 7.97 8.90 9.17 9.63 6.45 6.45<br />
(iii) Interest rate controls/negative real interest rates 0.00 8.00 9.00 9.00 9.00 10.00<br />
B. Labor market regulations 5.92 6.47 6.25 6.31<br />
(i) Hiring regulations and minimum wage 2.93 4.40 5.57 5.57<br />
(ii) Hiring and firing regulations 5.17 7.10 4.52 4.77<br />
(iii) Centralized collective bargaining 5.58 7.50 7.16 7.26<br />
(iv) Hours regulations 8.00 8.00 8.00<br />
(v) Mandated cost of worker dismissal 1.84 2.25 2.25<br />
(vi) Conscription 10.00 10.00 10.00 10.00 10.00 10.00 10.00 10.00<br />
C. Business regulations 5.94 5.71 6.09 5.42<br />
(i) Administrative requirements 7.37 3.55 3.54 3.12<br />
(ii) Bureaucracy costs 5.18 4.44 6.54 3.46<br />
(iii) Starting a business 5.48 7.38 8.98 9.02<br />
(iv) Extra payments/bribes/favoritism 5.73 5.11 3.93 3.31<br />
(v) Licensing restrictions 7.02 7.20 7.25<br />
(vi) Cost of tax compliance 6.79 6.37 6.37
Ecuador<br />
Country Data Tables • 67<br />
1980 1985 1990 1995 2000 2005 2009 2010<br />
Chain-Linked Rating (Rank) Rating (Rank) Rating (Rank) Rating (Rank) Rating (Rank) Rating (Rank) Rating (Rank) Rating (Rank)<br />
Summary Rating (Rank) 5.29 (53) 4.38 (86) 5.35 (66) 6.15 (61) 5.82 (96) 5.85 (103) 5.79 (108) 5.70 (111)<br />
Area 1. Size of Government 5.29 (44) 4.94 (55) 8.25 (4) 8.22 (8) 8.93 (2) 8.03 (20) 6.20 (68) 5.63 (82)<br />
Area 2. Legal System and Property Rights 5.35 (42) 4.80 (57) 4.76 (62) 4.10 (103) 3.30 (113) 3.08 (112) 3.25 (111) 3.26 (109)<br />
Area 3. Sound Money 8.15 (17) 6.89 (40) 3.98 (101) 6.47 (65) 4.90 (113) 4.73 (121) 6.36 (111) 6.38 (112)<br />
Area 4. <strong>Freedom</strong> to Trade Internationally 3.32 (62) 1.88 (83) 4.86 (63) 6.43 (65) 7.39 (56) 7.15 (59) 6.65 (77) 6.78 (78)<br />
Area 5. Regulation 4.26 (85) 3.66 (94) 4.82 (87) 5.54 (76) 4.59 (114) 6.17 (90) 6.35 (90) 6.31 (92)<br />
Unadjusted<br />
Summary Rating (Rank) 5.77 (34) 4.66 (81) 5.53 (58) 6.34 (56) 5.82 (94) 5.96 (114) 5.89 (123) 5.80 (126)<br />
Rating (Data) Rating (Data) Rating (Data) Rating (Data) Rating (Data) Rating (Data) Rating (Data) Rating (Data)<br />
Area 1. Size of Government 5.45 5.09 8.25 8.22 8.93 8.03 6.20 5.63<br />
A. Government consumption 6.01 (19.57) 7.32 (15.10) 8.48 (11.16) 7.15 (15.68) 7.86 (13.27) 7.53 (14.41) 7.19 (15.54) 7.42 (14.77)<br />
B. Transfers and subsidies 8.80 (4.90) 9.05 (4.00) 9.51 (2.30) 9.73 (1.50) 9.86 (1.02) 9.59 (2.00) 9.59 (2.00) 9.59 (2.00)<br />
C. Government enterprises and investment 2.00 (40.20) 2.00 (41.30) 7.00 (21.70) 8.00 (18.30) 10.00 (3.15) 7.00 (22.42) 0.00 (51.99) 0.00 (51.80)<br />
D. Top marginal tax rate 5.00 2.00 8.00 8.00 8.00 8.00 8.00 5.50<br />
(i) Top marginal income tax rate 5.00 (50) 2.00 (58) 9.00 (25) 9.00 (25) 9.00 (25) 9.00 (25) 9.00 (25) 7.00 (35)<br />
(ii) Top marginal income and payroll tax rate 7.00 (32) 7.00 (32) 7.00 (32) 7.00 (35) 7.00 (32) 4.00 (47)<br />
Area 2. Legal System and Property Rights 5.86 5.25 5.21 4.38 3.30 3.75 3.95 3.97<br />
A. Judicial independence 2.67 1.90 1.66 2.17<br />
B. Impartial courts 4.28 2.51 2.20 2.37 2.41<br />
C. Protection of property rights 2.98 4.05 3.63 3.68<br />
D. Military interference in rule of law and politics 5.07 3.33 2.50 2.50 2.50<br />
E. Integrity of the legal system 4.11 5.00 4.38 4.17 4.17<br />
F. Legal enforcement of contracts 4.38 4.38 4.38<br />
G. Regulatory restrictions on sale of real property 8.49 8.97 9.01<br />
H. Reliability of police 3.07 3.38 3.84<br />
I. Business costs of crime 2.76 4.51 3.57<br />
Area 3. Sound Money 8.15 6.89 3.98 6.47 4.90 4.73 6.36 6.38<br />
A. Money growth 8.13 (9.33) 7.90 (10.48) 2.62 (36.92) 4.76 (26.19) 4.25 (28.73) 2.73 (36.33) 7.71 (11.43) 7.48 (12.61)<br />
B. Standard deviation of inflation 8.38 (4.06) 5.85 (10.37) 3.29 (16.77) 5.78 (10.54) 5.36 (11.61) 6.69 (8.29) 8.75 (3.12) 8.75 (3.13)<br />
C. Inflation: most recent year 6.10 (19.51) 3.82 (30.90) 0.00 (54.01) 5.35 (23.23) 0.00 (96.09) 9.52 (2.41) 8.97 (5.16) 9.29 (3.56)<br />
D. <strong>Freedom</strong> to own foreign currency bank accounts 10.00 10.00 10.00 10.00 10.00 0.00 0.00 0.00<br />
Area 4. <strong>Freedom</strong> to Trade Internationally 4.87 2.19 5.10 6.75 7.39 7.25 6.74 6.88<br />
A. Tariffs 5.20 4.16 3.30 7.66 7.14 7.14 6.37 6.37<br />
(i) Revenue from trade taxes (% of trade sector) 5.20 (7.20) 5.87 (6.20) 7.33 (4.00) 7.67 (3.50) 6.53 (5.20) 6.53 (5.20) 6.53 (5.20) 6.53 (5.20)<br />
(ii) Mean tariff rate 2.46 (37.70) 2.58 (37.10) 7.54 (12.30) 7.42 (12.90) 7.64 (11.80) 7.76 (11.20) 7.76 (11.20)<br />
(iii) Standard deviation of tariff rates 0.00 (27.00) 7.76 (5.60) 7.48 (6.30) 7.24 (6.90) 4.80 (12.99) 4.80 (12.99)<br />
B. Regulatory trade barriers 4.73 4.74 4.63 5.18<br />
(i) Non-tariff trade barriers 3.13 3.91 2.59 3.43<br />
(ii) Compliance cost of importing and exporting 6.33 5.57 6.68 6.94<br />
C. Black-market exchange rates 7.40 0.40 10.00 7.60 10.00 10.00 10.00 10.00<br />
D. Controls of the movement of capital and people 2.00 2.00 2.00 5.00 7.69 7.12 5.97 5.95<br />
(i) Foreign ownership/investment restrictions 9.23 4.95 4.05 4.01<br />
(ii) Capital controls 2.00 2.00 2.00 5.00 6.15 8.46 3.85 3.85<br />
(iii) <strong>Freedom</strong> of foreigners to visit 7.94 10.00 10.00<br />
Area 5. Regulation 4.52 3.88 5.12 5.87 4.59 6.02 6.20 6.16<br />
A. Credit market regulations 5.42 3.74 6.00 8.00 5.33 9.33 9.30 9.30<br />
(i) Ownership of banks 5.00 5.00 8.00 8.00 2.00 8.00 8.00 8.00<br />
(ii) Private sector credit 7.27 6.21 10.00 10.00 10.00 10.00 9.90 9.90<br />
(iii) Interest rate controls/negative real interest rates 4.00 0.00 0.00 6.00 4.00 10.00 10.00 10.00<br />
B. Labor market regulations 3.57 3.93 4.09 4.21<br />
(i) Hiring regulations and minimum wage 3.49 5.60 5.57 5.57<br />
(ii) Hiring and firing regulations 3.43 3.24 2.45 3.21<br />
(iii) Centralized collective bargaining 4.25 5.74 5.54 5.47<br />
(iv) Hours regulations 3.67 6.00 8.00 8.00<br />
(v) Mandated cost of worker dismissal 0.00 0.00 0.00<br />
(vi) Conscription 0.00 0.00 3.00 3.00 3.00 3.00 3.00 3.00<br />
C. Business regulations 4.86 4.81 5.21 4.97<br />
(i) Administrative requirements 5.33 2.41 3.22 3.23<br />
(ii) Bureaucracy costs 5.25 3.28 5.72 3.76<br />
(iii) Starting a business 3.97 7.53 7.85 7.89<br />
(iv) Extra payments/bribes/favoritism 4.87 4.54 3.80 3.78<br />
(v) Licensing restrictions 7.81 8.01 8.50<br />
(vi) Cost of tax compliance 3.27 2.67 2.67<br />
www.freetheworld.com • www.fraserinstitute.org • Fraser Institute ©2012
68 • <strong>Economic</strong> <strong>Freedom</strong> of the <strong>World</strong>: 2012 Annual Report<br />
Egypt<br />
Fraser Institute ©2012 • www.fraserinstitute.org • www.freetheworld.com<br />
1980 1985 1990 1995 2000 2005 2009 2010<br />
Chain-Linked Rating (Rank) Rating (Rank) Rating (Rank) Rating (Rank) Rating (Rank) Rating (Rank) Rating (Rank) Rating (Rank)<br />
Summary Rating (Rank) 4.40 (79) 4.86 (72) 4.60 (89) 5.99 (68) 6.81 (51) 6.59 (74) 6.69 (72) 6.78 (69)<br />
Area 1. Size of Government 3.95 (82) 4.54 (69) 4.37 (88) 4.73 (91) 6.13 (63) 6.34 (75) 6.54 (51) 7.27 (36)<br />
Area 2. Legal System and Property Rights 2.76 (70) 5.38 (49) 3.50 (81) 4.88 (87) 5.87 (63) 5.63 (67) 5.60 (73) 5.40 (76)<br />
Area 3. Sound Money 7.70 (23) 8.85 (18) 8.16 (30) 7.61 (45) 9.53 (18) 8.85 (46) 8.66 (56) 8.81 (58)<br />
Area 4. <strong>Freedom</strong> to Trade Internationally 2.18 (77) 0.40 (96) 1.12 (102) 6.27 (69) 6.66 (76) 6.67 (78) 6.74 (75) 6.77 (79)<br />
Area 5. Regulation 4.76 (79) 5.16 (69) 5.68 (58) 6.49 (40) 5.84 (88) 5.37 (111) 5.89 (104) 5.69 (110)<br />
Unadjusted<br />
Summary Rating (Rank) 4.38 (79) 4.83 (74) 4.49 (94) 5.90 (70) 6.81 (50) 6.42 (92) 6.40 (97) 6.49 (99)<br />
Rating (Data) Rating (Data) Rating (Data) Rating (Data) Rating (Data) Rating (Data) Rating (Data) Rating (Data)<br />
Area 1. Size of Government 3.95 4.54 4.37 4.73 6.13 6.34 5.92 6.58<br />
A. Government consumption 6.33 (18.47) 5.83 (20.18) 7.77 (13.60) 8.12 (12.40) 8.29 (11.80) 7.32 (15.11) 7.95 (12.98) 7.94 (13.00)<br />
B. Transfers and subsidies 5.45 (17.20) 6.35 (13.90) 7.71 (8.90) 7.81 (8.53) 9.22 (3.38) 8.06 (7.62) 6.21 (14.39) 6.87 (11.97)<br />
C. Government enterprises and investment 4.00 (39.70) 4.00 (30.70) 0.00 (54.50) 0.00 (76.40) 0.00 (52.10) 0.00 (51.90) 2.00 (42.41) 4.00 (34.52)<br />
D. Top marginal tax rate 0.00 2.00 2.00 3.00 7.00 10.00 7.50 7.50<br />
(i) Top marginal income tax rate 0.00 (80) 2.00 (65) 2.00 (65) 3.00 (50) 7.00 (34) 10.00 (20) 10.00 (20) 10.00 (20)<br />
(ii) Top marginal income and payroll tax rate 5.00 (40) 5.00 (40)<br />
Area 2. Legal System and Property Rights 2.76 5.38 3.50 4.88 5.87 5.47 5.43 5.24<br />
A. Judicial independence 5.93 6.85 6.37 4.85 6.28<br />
B. Impartial courts 3.33 5.68 5.09 4.90 4.24<br />
C. Protection of property rights 4.90 5.17 6.22 6.06 5.21<br />
D. Military interference in rule of law and politics 6.13 5.00 5.00 5.00 4.17<br />
E. Integrity of the legal system 4.11 6.67 6.67 5.83 5.83<br />
F. Legal enforcement of contracts 3.41 3.41 3.41<br />
G. Regulatory restrictions on sale of real property 4.25 8.38 8.38<br />
H. Reliability of police 5.88 4.93 4.84<br />
I. Business costs of crime 6.31 5.52 4.82<br />
Area 3. Sound Money 7.70 8.85 8.16 7.61 9.53 8.85 8.66 8.81<br />
A. Money growth 6.29 (18.55) 8.57 (7.17) 8.93 (5.33) 9.12 (4.42) 9.46 (2.69) 7.94 (10.31) 8.13 (9.33) 8.31 (8.47)<br />
B. Standard deviation of inflation 8.12 (4.71) 8.63 (3.42) 7.38 (6.56) 8.20 (4.51) 9.20 (2.01) 8.42 (3.94) 8.88 (2.81) 9.19 (2.02)<br />
C. Inflation: most recent year 6.39 (18.03) 8.19 (9.04) 6.31 (18.44) 8.12 (9.41) 9.46 (2.68) 9.03 (4.87) 7.65 (11.76) 7.75 (11.27)<br />
D. <strong>Freedom</strong> to own foreign currency bank accounts 10.00 10.00 10.00 5.00 10.00 10.00 10.00 10.00<br />
Area 4. <strong>Freedom</strong> to Trade Internationally 3.03 0.56 1.04 6.02 6.66 6.23 6.30 6.33<br />
A. Tariffs 0.89 1.69 3.12 3.06 3.74 4.90 4.88 4.83<br />
(i) Revenue from trade taxes (% of trade sector) 1.27 (13.10) 1.93 (12.10) 6.07 (5.90) 4.83 (7.75) 5.33 (7.00) 8.48 (2.28) 8.05 (2.93) 7.88 (3.18)<br />
(ii) Mean tariff rate 0.52 (47.40) 1.44 (42.80) 3.30 (33.50) 4.34 (28.30) 5.90 (20.50) 6.22 (18.90) 6.60 (17.00) 6.60 (17.00)<br />
(iii) Standard deviation of tariff rates 0.00 (425.80) 0.00 (28.90) 0.00 (39.50) 0.00 (141.08) 0.00 (149.47) 0.00 (149.47)<br />
B. Regulatory trade barriers 4.52 5.58 5.74 6.68 6.92<br />
(i) Non-tariff trade barriers 4.52 4.50 4.55 4.94 5.09<br />
(ii) Compliance cost of importing and exporting 6.66 6.93 8.41 8.75<br />
C. Black-market exchange rates 8.20 0.00 0.00 9.40 10.00 10.00 10.00 10.00<br />
D. Controls of the movement of capital and people 0.00 0.00 0.00 7.10 7.31 4.30 3.63 3.57<br />
(i) Foreign ownership/investment restrictions 9.21 9.23 5.94 5.48 5.29<br />
(ii) Capital controls 0.00 0.00 0.00 5.00 5.38 6.15 4.62 4.62<br />
(iii) <strong>Freedom</strong> of foreigners to visit 0.79 0.79 0.79<br />
Area 5. Regulation 4.46 4.84 5.39 6.24 5.84 5.19 5.69 5.49<br />
A. Credit market regulations 3.93 5.20 6.79 8.33 8.03 6.35 6.02 5.88<br />
(i) Ownership of banks 5.00 5.00 5.00 5.00 5.00 2.00 2.00 2.00<br />
(ii) Private sector credit 2.80 4.60 9.37 10.00 9.08 7.05 6.07 5.65<br />
(iii) Interest rate controls/negative real interest rates 4.00 6.00 6.00 10.00 10.00 10.00 10.00 10.00<br />
B. Labor market regulations 3.98 5.57 4.01 4.98 4.97 4.90<br />
(i) Hiring regulations and minimum wage 8.33 4.17 10.00 10.00 10.00<br />
(ii) Hiring and firing regulations 4.02 4.02 3.05 3.44 4.76 4.47<br />
(iii) Centralized collective bargaining 7.93 7.93 7.93 7.93 7.50 8.44 7.06 6.91<br />
(iv) Hours regulations 7.55 5.34 8.00 8.00 8.00<br />
(v) Mandated cost of worker dismissal 0.00 0.00 0.00<br />
(vi) Conscription 0.00 0.00 0.00 0.00 0.00 0.00 0.00 0.00<br />
C. Business regulations 4.81 5.47 4.23 6.07 5.68<br />
(i) Administrative requirements 7.50 3.10 3.53 3.32<br />
(ii) Bureaucracy costs 4.70 2.75 1.13 5.91 4.48<br />
(iii) Starting a business 6.02 5.83 6.39 9.71 9.72<br />
(iv) Extra payments/bribes/favoritism 3.72 5.80 6.39 5.28 4.36<br />
(v) Licensing restrictions 5.08 6.83 7.08<br />
(vi) Cost of tax compliance 3.32 5.15 5.15
Country Data Tables • 69<br />
El Salvador 1980 1985 1990 1995 2000 2005 2009 2010<br />
Chain-Linked Rating (Rank) Rating (Rank) Rating (Rank) Rating (Rank) Rating (Rank) Rating (Rank) Rating (Rank) Rating (Rank)<br />
Summary Rating (Rank) 4.47 (76) 4.19 (90) 4.69 (87) 7.47 (21) 7.69 (18) 7.66 (24) 7.52 (28) 7.41 (38)<br />
Area 1. Size of Government 6.59 (17) 6.41 (15) 6.89 (22) 8.59 (5) 8.67 (4) 8.58 (10) 8.59 (7) 8.58 (7)<br />
Area 2. Legal System and Property Rights 2.43 (75) 1.90 (106) 1.87 (109) 5.61 (66) 4.51 (90) 4.39 (90) 4.00 (102) 3.84 (104)<br />
Area 3. Sound Money 5.63 (75) 5.48 (89) 5.25 (89) 8.88 (34) 9.42 (26) 9.63 (10) 9.28 (35) 9.25 (42)<br />
Area 4. <strong>Freedom</strong> to Trade Internationally 2.30 (74) 2.13 (79) 4.24 (71) 6.97 (58) 8.51 (29) 7.99 (29) 7.96 (29) 7.79 (33)<br />
Area 5. Regulation 5.31 (61) 5.31 (71) 7.33 (13) 7.31 (23) 7.73 (15) 7.76 (12) 7.61 (20)<br />
Unadjusted<br />
Summary Rating (Rank) 4.12 (83) 4.34 (90) 4.81 (87) 7.20 (27) 7.59 (21) 7.47 (33) 7.30 (42) 7.20 (56)<br />
Rating (Data) Rating (Data) Rating (Data) Rating (Data) Rating (Data) Rating (Data) Rating (Data) Rating (Data)<br />
Area 1. Size of Government 6.59 6.41 6.89 8.59 8.67 8.58 8.47 8.46<br />
A. Government consumption 6.97 (16.30) 7.05 (16.02) 8.81 (10.03) 9.11 (9.02) 8.70 (10.42) 9.01 (9.38) 8.70 (10.42) 8.69 (10.46)<br />
B. Transfers and subsidies 9.40 (2.70) 9.59 (2.00) 9.75 (1.40) 9.24 (3.30) 10.00 (0.32) 9.32 (3.00) 9.20 (3.44) 9.16 (3.58)<br />
C. Government enterprises and investment 7.00 (20.20) 6.00 (28.40) 7.00 (20.00) 8.00 (19.00) 8.00 (19.89) 8.00 (15.40) 8.00 (16.66) 8.00 (16.00)<br />
D. Top marginal tax rate 3.00 3.00 2.00 8.00 8.00 8.00 8.00 8.00<br />
(i) Top marginal income tax rate 3.00 (60) 3.00 (48) 2.00 (60) 8.00 (30) 8.00 (30) 8.00 (30) 8.00 (30) 8.00 (30)<br />
(ii) Top marginal income and payroll tax rate 8.00 (30) 8.00 (30)<br />
Area 2. Legal System and Property Rights 2.54 1.99 1.95 5.37 4.51 4.40 4.01 3.84<br />
A. Judicial independence 4.34 3.07 3.31 3.14<br />
B. Impartial courts 4.40 4.18 3.37 3.47 3.14<br />
C. Protection of property rights 4.05 5.78 5.12 4.60<br />
D. Military interference in rule of law and politics 6.25 5.00 5.00 4.17 4.17<br />
E. Integrity of the legal system 6.96 5.00 4.58 2.50 2.50<br />
F. Legal enforcement of contracts 3.83 3.83 3.83<br />
G. Regulatory restrictions on sale of real property 8.19 8.17 8.20<br />
H. Reliability of police 4.26 4.25 1.42<br />
I. Business costs of crime 1.47 1.27 3.57<br />
Area 3. Sound Money 5.63 5.48 5.25 8.88 9.42 9.63 9.28 9.25<br />
A. Money growth 8.52 (7.40) 7.74 (11.29) 8.48 (7.60) 8.20 (8.98) 9.03 (−4.83) 9.98 (0.10) 8.41 (7.94) 8.39 (8.03)<br />
B. Standard deviation of inflation 7.39 (6.53) 8.23 (4.43) 7.02 (7.45) 9.39 (1.52) 9.09 (2.29) 9.48 (1.29) 8.90 (2.75) 8.85 (2.87)<br />
C. Inflation: most recent year 6.61 (16.95) 5.97 (20.17) 5.51 (22.47) 7.91 (10.44) 9.55 (2.27) 9.06 (4.69) 9.79 (1.06) 9.76 (1.18)<br />
D. <strong>Freedom</strong> to own foreign currency bank accounts 0.00 0.00 0.00 10.00 10.00 10.00 10.00 10.00<br />
Area 4. <strong>Freedom</strong> to Trade Internationally 1.71 2.42 4.57 7.44 8.51 7.64 7.62 7.46<br />
A. Tariffs 3.13 5.27 6.52 7.51 8.02 8.29 8.14 8.17<br />
(i) Revenue from trade taxes (% of trade sector) 5.87 (6.20) 5.27 (7.10) 7.27 (4.10) 7.60 (3.60) 8.99 (1.51) 9.01 (1.48) 8.92 (1.62) 9.00 (1.50)<br />
(ii) Mean tariff rate 0.40 (48.00) 5.78 (21.10) 7.96 (10.20) 8.52 (7.40) 8.72 (6.40) 8.82 (5.90) 8.82 (5.90)<br />
(iii) Standard deviation of tariff rates 6.96 (7.60) 6.56 (8.60) 7.14 (7.14) 6.67 (8.32) 6.70 (8.26)<br />
B. Regulatory trade barriers 7.11 6.12 7.34 6.94<br />
(i) Non-tariff trade barriers 5.72 5.80 6.31 5.51<br />
(ii) Compliance cost of importing and exporting 8.50 6.45 8.37 8.38<br />
C. Black-market exchange rates 0.00 0.00 5.20 9.80 10.00 10.00 10.00 10.00<br />
D. Controls of the movement of capital and people 2.00 2.00 2.00 5.00 8.93 6.16 4.99 4.71<br />
(i) Foreign ownership/investment restrictions 8.62 7.38 6.95 6.10<br />
(ii) Capital controls 2.00 2.00 2.00 5.00 9.23 7.69 4.62 4.62<br />
(iii) <strong>Freedom</strong> of foreigners to visit 3.40 3.40 3.40<br />
Area 5. Regulation 5.38 5.38 5.74 6.85 7.08 7.10 6.97<br />
A. Credit market regulations 9.85 8.66 8.65 9.74 9.70 8.73 8.54 8.52<br />
(i) Ownership of banks 10.00 10.00 8.00<br />
(ii) Private sector credit 9.85 9.32 9.30 9.48 9.39 6.18 5.62 7.56<br />
(iii) Interest rate controls/negative real interest rates 8.00 8.00 10.00 10.00 10.00 10.00 10.00<br />
B. Labor market regulations 6.24 6.52 6.49 6.38<br />
(i) Hiring regulations and minimum wage 3.12 6.70 6.67 6.67<br />
(ii) Hiring and firing regulations 4.85 6.31 6.51 5.81<br />
(iii) Centralized collective bargaining 7.73 8.08 7.70 7.75<br />
(iv) Hours regulations 5.51 6.00 6.00 6.00<br />
(v) Mandated cost of worker dismissal 2.03 2.05 2.05<br />
(vi) Conscription 3.00 0.00 0.00 10.00 10.00 10.00 10.00 10.00<br />
C. Business regulations 6.01 6.00 6.28 6.01<br />
(i) Administrative requirements 7.27 3.76 4.06 3.93<br />
(ii) Bureaucracy costs 5.40 2.98 5.30 4.38<br />
(iii) Starting a business 5.78 7.98 8.97 8.97<br />
(iv) Extra payments/bribes/favoritism 5.57 6.86 4.87 4.29<br />
(v) Licensing restrictions 8.01 8.08 8.05<br />
(vi) Cost of tax compliance 6.41 6.41 6.41<br />
www.freetheworld.com • www.fraserinstitute.org • Fraser Institute ©2012
70 • <strong>Economic</strong> <strong>Freedom</strong> of the <strong>World</strong>: 2012 Annual Report<br />
Estonia<br />
Fraser Institute ©2012 • www.fraserinstitute.org • www.freetheworld.com<br />
1980 1985 1990 1995 2000 2005 2009 2010<br />
Chain-Linked Rating (Rank) Rating (Rank) Rating (Rank) Rating (Rank) Rating (Rank) Rating (Rank) Rating (Rank) Rating (Rank)<br />
Summary Rating (Rank) 6.08 (65) 7.61 (21) 7.97 (12) 7.72 (16) 7.75 (17)<br />
Area 1. Size of Government 6.40 (46) 6.43 (54) 6.99 (50) 5.71 (81) 6.06 (75)<br />
Area 2. Legal System and Property Rights 6.56 (42) 6.73 (45) 7.34 (31) 7.36 (30) 7.39 (29)<br />
Area 3. Sound Money 6.98 (37) 3.36 (107) 2.30 (111) 8.67 (44) 9.43 (32) 9.51 (23) 9.43 (29)<br />
Area 4. <strong>Freedom</strong> to Trade Internationally 3.38 (85) 9.66 (2) 9.04 (15) 8.64 (9) 8.59 (11) 8.23 (17)<br />
Area 5. Regulation 5.65 (72) 7.17 (34) 7.51 (23) 7.49 (20) 7.66 (16)<br />
Unadjusted<br />
Summary Rating (Rank) 5.97 (65) 7.46 (28) 7.96 (11) 7.71 (12) 7.74 (14)<br />
Rating (Data) Rating (Data) Rating (Data) Rating (Data) Rating (Data) Rating (Data) Rating (Data) Rating (Data)<br />
Area 1. Size of Government 5.22 6.43 6.99 5.71 6.06<br />
A. Government consumption 5.74 (20.48) 3.22 (29.06) 3.73 (27.33) 4.38 (25.12) 3.16 (29.24) 3.50 (28.09)<br />
B. Transfers and subsidies 6.43 (13.60) 5.98 (15.25) 7.08 (11.23) 6.17 (14.54) 6.23 (14.35)<br />
C. Government enterprises and investment 10.00 (14.28) 10.00 (4.81) 7.00 (23.45) 8.00 (19.46)<br />
D. Top marginal tax rate 6.00 6.00 6.50 6.50 6.50<br />
(i) Top marginal income tax rate 8.00 (26) 8.00 (26) 9.00 (24) 9.00 (21) 9.00 (21)<br />
(ii) Top marginal income and payroll tax rate 4.00 (44) 4.00 (44) 4.00 (45) 4.00 (42) 4.00 (44)<br />
Area 2. Legal System and Property Rights 6.50 6.00 7.24 7.26 7.29<br />
A. Judicial independence 7.12 7.43 7.51<br />
B. Impartial courts 6.46 6.94 6.84 5.39 5.52<br />
C. Protection of property rights 5.00 7.68 7.22 7.17<br />
D. Military interference in rule of law and politics 8.42 8.33 8.33 8.33 8.33<br />
E. Integrity of the legal system 6.67 6.67 6.67 6.67<br />
F. Legal enforcement of contracts 6.11 5.66 5.91<br />
G. Regulatory restrictions on sale of real property 8.81 9.50 9.53<br />
H. Reliability of police 6.50 7.31 7.48<br />
I. Business costs of crime 7.09 7.84 7.52<br />
Area 3. Sound Money 8.77 4.48 2.30 8.67 9.43 9.51 9.43<br />
A. Money growth 0.00 (67.37) 8.32 (8.39) 9.34 (3.30) 9.56 (−2.19) 9.98 (−0.10)<br />
B. Standard deviation of inflation 8.65 (3.37) 5.18 (12.06) 0.00 (323.00) 7.15 (7.13) 9.20 (1.99) 8.49 (3.77) 8.35 (4.12)<br />
C. Inflation: most recent year 8.88 (−5.61) 3.27 (33.65) 4.20 (29.00) 9.19 (4.03) 9.18 (4.09) 9.98 (−0.08) 9.41 (2.97)<br />
D. <strong>Freedom</strong> to own foreign currency bank accounts 5.00 5.00 10.00 10.00 10.00 10.00<br />
Area 4. <strong>Freedom</strong> to Trade Internationally 3.26 9.27 9.04 8.48 8.43 8.08<br />
A. Tariffs 9.77 9.81 9.99 8.39 8.22 8.34<br />
(i) Revenue from trade taxes (% of trade sector) 9.77 (0.34) 9.94 (0.09) 9.99 (0.02) 9.59 (0.62) 9.44 (0.84) 9.63 (0.55)<br />
(ii) Mean tariff rate 9.98 (0.10) 9.46 (2.70) 8.94 (5.30) 8.98 (5.10)<br />
(iii) Standard deviation of tariff rates 9.52 (1.20) 6.13 (9.67) 6.29 (9.28) 6.41 (8.98)<br />
B. Regulatory trade barriers 8.34 8.34 8.57 7.13<br />
(i) Non-tariff trade barriers 8.34 7.24 7.71 7.56<br />
(ii) Compliance cost of importing and exporting 9.43 9.43 6.69<br />
C. Black-market exchange rates 0.00 10.00 10.00 10.00 10.00 10.00<br />
D. Controls of the movement of capital and people 0.00 8.00 7.82 7.18 6.93 6.85<br />
(i) Foreign ownership/investment restrictions 9.49 8.04 7.28 7.04<br />
(ii) Capital controls 0.00 8.00 6.15 6.92 6.92 6.92<br />
(iii) <strong>Freedom</strong> of foreigners to visit 6.58 6.58 6.58<br />
Area 5. Regulation 6.58 7.17 7.68 7.67 7.84<br />
A. Credit market regulations 0.00 4.30 9.33 9.67 9.81 9.81<br />
(i) Ownership of banks 0.00 5.00 8.00 10.00 10.00 10.00<br />
(ii) Private sector credit 7.90 10.00 10.00 9.44 9.44<br />
(iii) Interest rate controls/negative real interest rates 0.00 10.00 9.00 10.00 10.00<br />
B. Labor market regulations 4.74 5.76 5.94 5.96<br />
(i) Hiring regulations and minimum wage 2.94 6.70 6.67 5.00<br />
(ii) Hiring and firing regulations 4.57 5.33 5.22 5.87<br />
(iii) Centralized collective bargaining 8.45 8.75 8.37 8.32<br />
(iv) Hours regulations 4.00 4.00 4.00<br />
(v) Mandated cost of worker dismissal 6.76 8.39 9.60<br />
(vi) Conscription 0.00 3.00 3.00 3.00 3.00 3.00<br />
C. Business regulations 8.85 7.43 7.63 7.24 7.74<br />
(i) Administrative requirements 7.62 5.34 5.59 5.55<br />
(ii) Bureaucracy costs 8.47 7.15 6.18 3.15 6.69<br />
(iii) Starting a business 8.52 8.03 8.71 9.67 9.68<br />
(iv) Extra payments/bribes/favoritism 9.57 6.91 7.51 7.26 6.98<br />
(v) Licensing restrictions 8.95 8.68 8.47<br />
(vi) Cost of tax compliance 9.09 9.09 9.05
Country Data Tables • 71<br />
Ethiopia 1980 1985 1990 1995 2000 2005 2009 2010<br />
Chain-Linked Rating (Rank) Rating (Rank) Rating (Rank) Rating (Rank) Rating (Rank) Rating (Rank) Rating (Rank) Rating (Rank)<br />
Summary Rating (Rank) <br />
Area 1. Size of Government<br />
Area 2. Legal System and Property Rights<br />
Area 3. Sound Money<br />
Area 4. <strong>Freedom</strong> to Trade Internationally<br />
Area 5. Regulation<br />
Unadjusted<br />
Summary Rating (Rank) 5.49 (129) 5.76 (127) 5.72 (131)<br />
Rating (Data) Rating (Data) Rating (Data) Rating (Data) Rating (Data) Rating (Data) Rating (Data) Rating (Data)<br />
Area 1. Size of Government 6.09 6.22 6.10<br />
A. Government consumption 7.37 (14.95) 9.24 (8.58) 8.76 (10.23)<br />
B. Transfers and subsidies 10.00 (0.03) 8.66 (5.43) 8.63 (5.54)<br />
C. Government enterprises and investment 0.00 (64.00) 0.00 (73.76) 0.00 (76.65)<br />
D. Top marginal tax rate 7.00 7.00 7.00<br />
(i) Top marginal income tax rate<br />
(ii) Top marginal income and payroll tax rate<br />
7.00 (35) 7.00 (35) 7.00 (35)<br />
Area 2. Legal System and Property Rights 4.70 5.47 5.44<br />
A. Judicial independence 1.97 3.76 3.53<br />
B. Impartial courts 2.68 4.34 4.47<br />
C. Protection of property rights 4.34 5.90 5.73<br />
D. Military interference in rule of law and politics 1.67 1.67 1.67<br />
E. Integrity of the legal system 8.33 7.50 7.50<br />
F. Legal enforcement of contracts 4.34 4.87 4.87<br />
G. Regulatory restrictions on sale of real property 7.97 8.53 8.53<br />
H. Reliability of police 5.32 5.66 7.47<br />
I. Business costs of crime 5.66 6.99 5.21<br />
Area 3. Sound Money 5.67 5.71 5.58<br />
A. Money growth 8.20 (8.99) 8.15 (9.24) 8.15 (9.24)<br />
B. Standard deviation of inflation 6.79 (8.03) 6.37 (9.07) 5.80 (10.50)<br />
C. Inflation: most recent year 7.68 (11.61) 8.31 (8.47) 8.37 (8.14)<br />
D. <strong>Freedom</strong> to own foreign currency bank accounts 0.00 0.00 0.00<br />
Area 4. <strong>Freedom</strong> to Trade Internationally 4.88 5.06 5.41<br />
A. Tariffs 4.54 4.49 4.49<br />
(i) Revenue from trade taxes (% of trade sector) 1.56 (12.66) 1.56 (12.66) 1.56 (12.66)<br />
(ii) Mean tariff rate 6.64 (16.80) 6.54 (17.30) 6.54 (17.30)<br />
(iii) Standard deviation of tariff rates 5.43 (11.42) 5.36 (11.59) 5.36 (11.59)<br />
B. Regulatory trade barriers 4.54 4.37 5.52<br />
(i) Non-tariff trade barriers 5.39 5.08 4.28<br />
(ii) Compliance cost of importing and exporting 3.69 3.67 6.75<br />
C. Black-market exchange rates 8.00 10.00 10.00<br />
D. Controls of the movement of capital and people 2.42 1.40 1.65<br />
(i) Foreign ownership/investment restrictions 5.50 3.96 4.73<br />
(ii) Capital controls 1.54 0.00 0.00<br />
(iii) <strong>Freedom</strong> of foreigners to visit 0.23 0.23 0.23<br />
Area 5. Regulation 6.10 6.32 6.08<br />
A. Credit market regulations 5.76 4.85 4.45<br />
(i) Ownership of banks 2.00 2.00 2.00<br />
(ii) Private sector credit 6.29 7.55 6.34<br />
(iii) Interest rate controls/negative real interest rates 9.00 5.00 5.00<br />
B. Labor market regulations 7.16 7.60 7.59<br />
(i) Hiring regulations and minimum wage 6.70 6.67 6.67<br />
(ii) Hiring and firing regulations 4.56 4.57 4.81<br />
(iii) Centralized collective bargaining 7.43 7.27 6.97<br />
(iv) Hours regulations 8.00 10.00 10.00<br />
(v) Mandated cost of worker dismissal 6.29 7.09 7.09<br />
(vi) Conscription 10.00 10.00 10.00<br />
C. Business regulations 5.37 6.51 6.21<br />
(i) Administrative requirements 3.33 4.71 4.29<br />
(ii) Bureaucracy costs 3.66 5.85 4.29<br />
(iii) Starting a business 5.67 8.36 8.48<br />
(iv) Extra payments/bribes/favoritism 5.18 4.32 4.28<br />
(v) Licensing restrictions 6.60 8.07 8.16<br />
(vi) Cost of tax compliance 7.78 7.78 7.78<br />
www.freetheworld.com • www.fraserinstitute.org • Fraser Institute ©2012
72 • <strong>Economic</strong> <strong>Freedom</strong> of the <strong>World</strong>: 2012 Annual Report<br />
Fiji<br />
Fraser Institute ©2012 • www.fraserinstitute.org • www.freetheworld.com<br />
1980 1985 1990 1995 2000 2005 2009 2010<br />
Chain-Linked Rating (Rank) Rating (Rank) Rating (Rank) Rating (Rank) Rating (Rank) Rating (Rank) Rating (Rank) Rating (Rank)<br />
Summary Rating (Rank) 5.58 (40) 5.98 (36) 5.73 (50) 6.12 (64) 6.24 (76) 6.54 (75) 6.42 (83) 6.46 (85)<br />
Area 1. Size of Government 4.75 (61) 5.22 (50) 4.69 (85) 5.92 (66) 6.56 (50) 8.02 (21) 7.50 (27) 7.51 (31)<br />
Area 2. Legal System and Property Rights 5.51 (69) 5.99 (60) 6.05 (58) 5.50 (74) 5.50 (72)<br />
Area 3. Sound Money 6.02 (66) 6.67 (53) 6.53 (63) 6.94 (57) 6.90 (84) 6.56 (101) 6.76 (100) 6.67 (102)<br />
Area 4. <strong>Freedom</strong> to Trade Internationally 5.93 (34) 6.14 (31) 5.73 (49) 6.23 (73) 5.56 (98) 5.39 (109) 5.41 (105) 5.76 (102)<br />
Area 5. Regulation 5.65 (45) 5.96 (41) 6.00 (45) 6.07 (51) 6.21 (67) 6.67 (71) 6.82 (61) 6.72 (74)<br />
Unadjusted<br />
Summary Rating (Rank) 5.57 (44) 5.97 (34) 5.72 (51) 6.03 (64) 6.14 (80) 7.29 (49) 7.16 (54) 7.20 (56)<br />
Rating (Data) Rating (Data) Rating (Data) Rating (Data) Rating (Data) Rating (Data) Rating (Data) Rating (Data)<br />
Area 1. Size of Government 4.75 5.22 4.69 5.92 6.56 8.02 7.50 7.51<br />
A. Government consumption 5.56 (21.09) 4.96 (23.12) 5.90 (19.93) 5.48 (21.38) 5.88 (20.00) 6.47 (17.99) 6.32 (18.51) 6.34 (18.45)<br />
B. Transfers and subsidies 9.46 (2.50) 8.91 (4.50) 9.86 (1.00) 9.18 (3.50) 9.35 (2.90) 8.59 (5.68) 8.69 (5.32) 8.69 (5.32)<br />
C. Government enterprises and investment 2.00 (46.20) 4.00 (32.90) 0.00 (55.40) 2.00 (40.40) 4.00 (33.30) 10.00 (14.82) 8.00 (16.38) 8.00 (18.02)<br />
D. Top marginal tax rate 2.00 3.00 3.00 7.00 7.00 7.00 7.00 7.00<br />
(i) Top marginal income tax rate 2.00 (53) 3.00 (50) 3.00 (50) 7.00 (35) 7.00 (34) 7.00 (31) 7.00 (31) 7.00 (31)<br />
(ii) Top marginal income and payroll tax rate 3.00 (50) 7.00 (35) 7.00 (34) 7.00 (31) 7.00 (31) 7.00 (31)<br />
Area 2. Legal System and Property Rights 5.12 5.46 6.34 5.77 5.77<br />
A. Judicial independence<br />
B. Impartial courts<br />
C. Protection of property rights<br />
4.68 4.63 5.10 4.20 4.00<br />
D. Military interference in rule of law and politics<br />
E. Integrity of the legal system<br />
6.34 7.34 7.10 5.70 5.90<br />
F. Legal enforcement of contracts 5.11 5.11 5.11<br />
G. Regulatory restrictions on sale of real property<br />
H. Reliability of police<br />
I. Business costs of crime<br />
8.06 8.06 8.06<br />
Area 3. Sound Money 6.02 6.67 6.53 6.94 6.90 6.56 6.76 6.67<br />
A. Money growth 9.82 (−0.89) 9.73 (1.34) 8.40 (8.00) 9.02 (4.92) 9.41 (2.93) 7.62 (11.91) 9.03 (4.86) 9.15 (4.25)<br />
B. Standard deviation of inflation 7.72 (5.71) 8.44 (3.89) 9.16 (2.10) 9.06 (2.36) 8.42 (3.95) 9.11 (2.22) 8.74 (3.15) 8.63 (3.44)<br />
C. Inflation: most recent year 6.54 (17.31) 8.50 (7.49) 8.58 (7.10) 9.68 (1.59) 9.78 (1.09) 9.53 (2.37) 9.26 (3.69) 8.89 (5.54)<br />
D. <strong>Freedom</strong> to own foreign currency bank accounts 0.00 0.00 0.00 0.00 0.00 0.00 0.00 0.00<br />
Area 4. <strong>Freedom</strong> to Trade Internationally 5.84 6.04 5.64 6.13 5.56 6.62 6.65 7.07<br />
A. Tariffs 6.13 4.73 5.73 6.60 7.27 5.23 5.11 5.12<br />
(i) Revenue from trade taxes (% of trade sector) 6.13 (5.80) 4.73 (7.90) 5.73 (6.40) 6.60 (5.10) 7.03 (4.46) 7.73 (3.40) 7.73 (3.40) 7.73 (3.40)<br />
(ii) Mean tariff rate 7.52 (12.40) 7.96 (10.20) 7.60 (12.00) 7.62 (11.90)<br />
(iii) Standard deviation of tariff rates 0.00 (43.04) 0.00 (38.04) 0.00 (35.11)<br />
B. Regulatory trade barriers<br />
(i) Non-tariff trade barriers<br />
6.65 6.88 8.56<br />
(ii) Compliance cost of importing and exporting 6.65 6.88 8.56<br />
C. Black-market exchange rates 6.40 8.40 9.20 9.80 9.40 10.00 10.00 10.00<br />
D. Controls of the movement of capital and people<br />
(i) Foreign ownership/investment restrictions<br />
5.00 5.00 2.00 2.00 0.00 4.59 4.59 4.59<br />
(ii) Capital controls 5.00 5.00 2.00 2.00 0.00 0.00 0.00 0.00<br />
(iii) <strong>Freedom</strong> of foreigners to visit 9.18 9.18 9.18<br />
Area 5. Regulation 5.65 5.96 6.00 6.07 6.21 8.92 9.11 8.98<br />
A. Credit market regulations 5.09 5.91 6.00 6.19 6.56 8.92 10.00 9.67<br />
(i) Ownership of banks 2.00 2.00 2.00 2.00 2.00 10.00 10.00 10.00<br />
(ii) Private sector credit 7.27 7.73 10.00 8.56 7.67 6.77 10.00 10.00<br />
(iii) Interest rate controls/negative real interest rates 6.00 8.00 6.00 8.00 10.00 10.00 10.00 9.00<br />
B. Labor market regulations 9.40 8.98 8.98<br />
(i) Hiring regulations and minimum wage<br />
(ii) Hiring and firing regulations<br />
(iii) Centralized collective bargaining<br />
7.80 7.77 7.77<br />
(iv) Hours regulations 10.00 10.00 10.00<br />
(v) Mandated cost of worker dismissal 9.81 8.15 8.15<br />
(vi) Conscription 10.00 10.00 10.00 10.00 10.00 10.00 10.00 10.00<br />
C. Business regulations<br />
(i) Administrative requirements<br />
(ii) Bureaucracy costs<br />
8.42 8.36 8.30<br />
(iii) Starting a business<br />
(iv) Extra payments/bribes/favoritism<br />
8.26 8.28 8.30<br />
(v) Licensing restrictions 8.58 8.63 8.42<br />
(vi) Cost of tax compliance 8.43 8.17 8.17
Finland<br />
Country Data Tables • 73<br />
1980 1985 1990 1995 2000 2005 2009 2010<br />
Chain-Linked Rating (Rank) Rating (Rank) Rating (Rank) Rating (Rank) Rating (Rank) Rating (Rank) Rating (Rank) Rating (Rank)<br />
Summary Rating (Rank) 6.65 (15) 6.92 (14) 7.24 (17) 7.50 (19) 7.73 (17) 7.97 (11) 7.81 (11) 7.89 (11)<br />
Area 1. Size of Government 4.53 (69) 4.28 (76) 4.15 (93) 2.69 (117) 3.00 (119) 4.97 (100) 4.95 (102) 4.98 (102)<br />
Area 2. Legal System and Property Rights 6.83 (20) 7.88 (6) 8.35 (1) 9.28 (1) 9.49 (4) 9.32 (3) 9.00 (3) 9.09 (4)<br />
Area 3. Sound Money 7.78 (22) 7.94 (29) 9.27 (17) 9.55 (18) 9.55 (15) 9.58 (14) 9.55 (19) 9.62 (15)<br />
Area 4. <strong>Freedom</strong> to Trade Internationally 6.71 (23) 6.93 (23) 6.88 (34) 9.19 (10) 9.25 (10) 8.32 (15) 8.14 (24) 7.85 (30)<br />
Area 5. Regulation 7.53 (5) 7.72 (6) 7.66 (8) 6.77 (33) 7.35 (21) 7.65 (18) 7.39 (26) 7.85 (12)<br />
Unadjusted<br />
Summary Rating (Rank) 6.50 (17) 6.77 (17) 6.99 (21) 7.51 (20) 7.73 (16) 7.96 (11) 7.80 (10) 7.88 (9)<br />
Rating (Data) Rating (Data) Rating (Data) Rating (Data) Rating (Data) Rating (Data) Rating (Data) Rating (Data)<br />
Area 1. Size of Government 4.67 4.41 4.15 2.69 3.00 4.97 4.95 4.98<br />
A. Government consumption 4.43 (24.93) 3.82 (27.02) 3.33 (28.69) 3.34 (28.66) 3.08 (29.54) 2.94 (30.00) 2.54 (31.38) 2.71 (30.77)<br />
B. Transfers and subsidies 6.24 (14.30) 5.83 (15.80) 5.78 (16.00) 3.92 (22.80) 4.93 (19.11) 4.44 (20.92) 3.77 (23.38) 3.72 (23.54)<br />
C. Government enterprises and investment 7.00 (23.30) 7.00 (24.20) 6.00 (29.30) 2.00 (42.20) 2.00 (42.20) 10.00 (12.53) 10.00 (14.49) 10.00 (14.56)<br />
D. Top marginal tax rate 1.00 1.00 1.50 1.50 2.00 2.50 3.50 3.50<br />
(i) Top marginal income tax rate 1.00 (65-71) 1.00 (64-70) 2.00 (57-63) 2.00 (54-59) 3.00 (51-57) 3.00 (50-56) 4.00 (48-53) 4.00 (46-51)<br />
(ii) Top marginal income and payroll tax rate 1.00 (61-69) 1.00 (60-66) 1.00 (53.5-<br />
60.5)<br />
2.00 (54-60) 3.00 (52-57) 3.00 (52-57)<br />
Area 2. Legal System and Property Rights 6.83 7.88 8.35 9.28 9.49 9.07 8.75 8.85<br />
A. Judicial independence 9.82 9.69 8.59 8.88 9.02<br />
B. Impartial courts 9.35 8.85 8.57 7.51 7.92<br />
C. Protection of property rights 7.23 8.92 9.03 9.02 9.08<br />
D. Military interference in rule of law and politics 10.00 10.00 10.00 10.00 10.00<br />
E. Integrity of the legal system 10.00 10.00 10.00 10.00 10.00<br />
F. Legal enforcement of contracts 8.06 6.83 6.83<br />
G. Regulatory restrictions on sale of real property 8.42 8.42 8.42<br />
H. Reliability of police 9.38 9.40 8.87<br />
I. Business costs of crime 9.54 8.73 9.51<br />
Area 3. Sound Money 7.78 7.94 9.27 9.55 9.55 9.58 9.55 9.62<br />
A. Money growth 8.82 (5.92) 8.58 (7.12) 8.62 (6.91) 8.98 (5.08) 9.48 (2.58) 9.01 (4.96) 8.64 (6.82) 9.11 (4.45)<br />
B. Standard deviation of inflation 9.27 (1.82) 9.26 (1.86) 9.63 (0.92) 9.71 (0.72) 9.38 (1.54) 9.48 (1.31) 9.58 (1.05) 9.60 (1.00)<br />
C. Inflation: most recent year 8.05 (9.75) 8.93 (5.33) 8.84 (5.82) 9.52 (2.42) 9.33 (3.37) 9.83 (0.86) 10.00 (0.00) 9.76 (1.22)<br />
D. <strong>Freedom</strong> to own foreign currency bank accounts 5.00 5.00 10.00 10.00 10.00 10.00 10.00 10.00<br />
Area 4. <strong>Freedom</strong> to Trade Internationally 6.83 7.06 6.67 9.18 9.25 8.37 8.18 7.89<br />
A. Tariffs 8.69 9.17 8.01 8.72 9.18 8.39 8.22 8.34<br />
(i) Revenue from trade taxes (% of trade sector) 9.47 (0.80) 9.73 (0.40) 9.60 (0.60) 9.87 (0.20) 9.78 (0.33) 9.59 (0.62) 9.44 (0.84) 9.63 (0.55)<br />
(ii) Mean tariff rate 7.92 (10.40) 8.60 (7.00) 8.46 (7.70) 8.66 (6.70) 9.52 (2.40) 9.46 (2.70) 8.94 (5.30) 8.98 (5.10)<br />
(iii) Standard deviation of tariff rates 5.96 (10.10) 7.64 (5.90) 8.24 (4.40) 6.13 (9.67) 6.29 (9.28) 6.41 (8.98)<br />
B. Regulatory trade barriers 9.30 9.76 8.86 8.61 7.73<br />
(i) Non-tariff trade barriers 9.30 9.69 8.72 8.22 8.47<br />
(ii) Compliance cost of importing and exporting 9.83 8.99 8.99 7.00<br />
C. Black-market exchange rates 9.80 10.00 10.00 10.00 10.00 10.00 10.00 10.00<br />
D. Controls of the movement of capital and people 2.00 2.00 2.00 8.68 8.08 6.22 5.89 5.50<br />
(i) Foreign ownership/investment restrictions 9.36 10.00 8.23 8.01 6.83<br />
(ii) Capital controls 2.00 2.00 2.00 8.00 6.15 3.85 3.08 3.08<br />
(iii) <strong>Freedom</strong> of foreigners to visit 6.58 6.58 6.58<br />
Area 5. Regulation 6.38 6.54 6.52 6.84 7.35 7.83 7.56 8.04<br />
A. Credit market regulations 8.63 9.30 9.32 8.18 10.00 10.00 10.00 10.00<br />
(i) Ownership of banks 8.00 8.00 8.00 8.00 10.00 10.00 10.00 10.00<br />
(ii) Private sector credit 9.89 9.91 9.97 6.54 10.00 10.00 10.00 10.00<br />
(iii) Interest rate controls/negative real interest rates 8.00 10.00 10.00 10.00 10.00 10.00 10.00 10.00<br />
B. Labor market regulations 4.14 3.79 3.71 3.49 3.33 4.84 5.55 5.63<br />
(i) Hiring regulations and minimum wage 4.12 4.72 5.60 3.90 3.90<br />
(ii) Hiring and firing regulations 3.86 3.86 3.23 3.79 4.83 4.99<br />
(iii) Centralized collective bargaining 4.49 4.49 4.49 4.49 2.87 3.07 3.56 3.88<br />
(iv) Hours regulations 4.93 3.87 3.52 2.02 2.84 6.00 8.00 8.00<br />
(v) Mandated cost of worker dismissal 7.59 10.00 10.00<br />
(vi) Conscription 3.00 3.00 3.00 3.00 3.00 3.00 3.00 3.00<br />
C. Business regulations 8.85 8.71 8.66 7.14 8.49<br />
(i) Administrative requirements 7.97 6.42 5.54 5.62<br />
(ii) Bureaucracy costs 8.47 8.48 9.94 1.73 8.31<br />
(iii) Starting a business 8.52 8.80 9.45 9.51 9.52<br />
(iv) Extra payments/bribes/favoritism 9.57 9.59 9.41 9.19 8.82<br />
(v) Licensing restrictions 9.76 9.60 9.72<br />
(vi) Cost of tax compliance 6.98 7.28 8.96<br />
www.freetheworld.com • www.fraserinstitute.org • Fraser Institute ©2012
74 • <strong>Economic</strong> <strong>Freedom</strong> of the <strong>World</strong>: 2012 Annual Report<br />
France<br />
Fraser Institute ©2012 • www.fraserinstitute.org • www.freetheworld.com<br />
1980 1985 1990 1995 2000 2005 2009 2010<br />
Chain-Linked Rating (Rank) Rating (Rank) Rating (Rank) Rating (Rank) Rating (Rank) Rating (Rank) Rating (Rank) Rating (Rank)<br />
Summary Rating (Rank) 6.09 (25) 5.99 (35) 7.07 (22) 7.02 (34) 7.31 (37) 7.38 (39) 7.47 (32) 7.39 (40)<br />
Area 1. Size of Government 3.94 (83) 2.92 (102) 3.53 (101) 3.22 (111) 2.56 (123) 4.11 (116) 4.72 (109) 4.66 (108)<br />
Area 2. Legal System and Property Rights 6.83 (22) 7.25 (18) 7.73 (20) 7.49 (28) 8.09 (22) 7.70 (27) 8.01 (25) 7.96 (24)<br />
Area 3. Sound Money 6.40 (44) 6.69 (50) 9.69 (5) 9.83 (1) 9.59 (11) 9.58 (13) 9.66 (4) 9.67 (9)<br />
Area 4. <strong>Freedom</strong> to Trade Internationally 7.00 (22) 6.99 (21) 8.30 (15) 8.39 (23) 8.99 (17) 8.24 (18) 8.17 (22) 7.68 (37)<br />
Area 5. Regulation 6.13 (32) 6.03 (39) 6.08 (43) 6.16 (48) 7.30 (26) 7.19 (39) 6.73 (69) 6.92 (52)<br />
Unadjusted<br />
Summary Rating (Rank) 6.13 (27) 6.03 (32) 7.04 (20) 6.99 (37) 7.31 (35) 7.31 (47) 7.40 (33) 7.32 (47)<br />
Rating (Data) Rating (Data) Rating (Data) Rating (Data) Rating (Data) Rating (Data) Rating (Data) Rating (Data)<br />
Area 1. Size of Government 4.22 3.13 3.53 3.22 2.56 4.11 4.72 4.66<br />
A. Government consumption 4.84 (23.55) 4.68 (24.07) 4.85 (23.52) 2.85 (30.29) 1.86 (33.69) 3.13 (29.36) 3.03 (29.68) 2.96 (29.92)<br />
B. Transfers and subsidies 3.02 (26.10) 2.83 (26.80) 3.27 (25.20) 2.53 (27.90) 3.40 (24.71) 3.33 (24.98) 2.84 (26.78) 2.67 (27.41)<br />
C. Government enterprises and investment 6.00 (27.40) 4.00 (33.20) 4.00 (35.00) 4.00 (30.00) 4.00 (30.00) 8.00 (16.54) 8.00 (16.38) 8.00 (16.38)<br />
D. Top marginal tax rate 3.00 1.00 2.00 3.50 1.00 2.00 5.00 5.00<br />
(i) Top marginal income tax rate 3.00 (60) 1.00 (65) 3.00 (53) 4.00 (51) 2.00 (54) 3.00 (52) 6.00 (43) 6.00 (43)<br />
(ii) Top marginal income and payroll tax rate 1.00 (61) 3.00 (60) 0.00 (62-65) 1.00 (62-64) 4.00 (54-56) 4.00 (54-56)<br />
Area 2. Legal System and Property Rights 6.83 7.25 7.73 7.49 8.09 7.19 7.47 7.43<br />
A. Judicial independence 6.62 6.35 6.77 6.32 6.50<br />
B. Impartial courts 5.55 8.02 6.78 6.51 6.38<br />
C. Protection of property rights 7.28 9.40 8.47 8.06 8.25<br />
D. Military interference in rule of law and politics 8.03 8.33 8.82 9.17 9.17<br />
E. Integrity of the legal system 10.00 8.33 8.33 8.33 8.33<br />
F. Legal enforcement of contracts 6.91 6.91 6.91<br />
G. Regulatory restrictions on sale of real property 4.34 6.88 6.88<br />
H. Reliability of police 7.69 7.66 7.15<br />
I. Business costs of crime 6.59 7.43 7.33<br />
Area 3. Sound Money 6.40 6.69 9.69 9.83 9.59 9.58 9.66 9.67<br />
A. Money growth 8.19 (9.06) 8.83 (5.85) 9.72 (1.38) 9.89 (0.57) 8.84 (5.82) 8.79 (6.03) 8.99 (5.05) 9.35 (3.23)<br />
B. Standard deviation of inflation 9.69 (0.77) 9.08 (2.29) 9.64 (0.89) 9.74 (0.65) 9.85 (0.38) 9.88 (0.30) 9.67 (0.83) 9.61 (0.96)<br />
C. Inflation: most recent year 7.72 (11.38) 8.85 (5.76) 9.38 (3.09) 9.69 (1.57) 9.66 (1.69) 9.64 (1.81) 9.98 (0.08) 9.69 (1.53)<br />
D. <strong>Freedom</strong> to own foreign currency bank accounts 0.00 0.00 10.00 10.00 10.00 10.00 10.00 10.00<br />
Area 4. <strong>Freedom</strong> to Trade Internationally 6.78 6.77 7.82 8.30 8.99 8.23 8.16 7.67<br />
A. Tariffs 8.95 9.12 8.46 8.70 9.18 8.39 8.22 8.34<br />
(i) Revenue from trade taxes (% of trade sector) 9.67 (0.50) 9.73 (0.40) 9.73 (0.40) 9.80 (0.30) 9.78 (0.33) 9.59 (0.62) 9.44 (0.84) 9.63 (0.55)<br />
(ii) Mean tariff rate 8.24 (8.80) 8.50 (7.50) 8.52 (7.40) 8.66 (6.70) 9.52 (2.40) 9.46 (2.70) 8.94 (5.30) 8.98 (5.10)<br />
(iii) Standard deviation of tariff rates 7.12 (7.20) 7.64 (5.90) 8.24 (4.40) 6.13 (9.67) 6.29 (9.28) 6.41 (8.98)<br />
B. Regulatory trade barriers 7.70 8.79 7.95 7.83 5.98<br />
(i) Non-tariff trade barriers 7.70 8.42 7.40 6.94 6.64<br />
(ii) Compliance cost of importing and exporting 9.17 8.49 8.72 5.31<br />
C. Black-market exchange rates 9.40 9.20 10.00 10.00 10.00 10.00 10.00 10.00<br />
D. Controls of the movement of capital and people 2.00 2.00 5.00 6.81 8.01 6.59 6.60 6.38<br />
(i) Foreign ownership/investment restrictions 8.62 9.09 7.05 7.07 7.18<br />
(ii) Capital controls 2.00 2.00 5.00 5.00 6.92 6.15 6.15 5.38<br />
(iii) <strong>Freedom</strong> of foreigners to visit 6.58 6.58 6.58<br />
Area 5. Regulation 6.42 6.32 6.42 6.10 7.30 7.44 6.97 7.16<br />
A. Credit market regulations 8.91 8.82 9.01 9.46 9.74 9.51 8.52 8.52<br />
(i) Ownership of banks 10.00 10.00 10.00 10.00 10.00 10.00 10.00 10.00<br />
(ii) Private sector credit 8.73 8.46 9.03 8.37 9.23 8.53 5.57 5.57<br />
(iii) Interest rate controls/negative real interest rates 8.00 8.00 8.00 10.00 10.00 10.00 10.00 10.00<br />
B. Labor market regulations 3.93 3.81 3.83 3.35 4.98 5.51 5.92 5.83<br />
(i) Hiring regulations and minimum wage 2.55 4.55 3.30 3.33 3.33<br />
(ii) Hiring and firing regulations 4.16 4.16 1.67 2.35 3.18 2.76<br />
(iii) Centralized collective bargaining 4.49 4.49 4.49 4.49 5.53 6.41 7.15 7.03<br />
(iv) Hours regulations 4.31 3.96 3.69 2.58 3.17 4.00 4.00 4.00<br />
(v) Mandated cost of worker dismissal 7.03 7.86 7.86<br />
(vi) Conscription 3.00 3.00 3.00 3.00 10.00 10.00 10.00 10.00<br />
C. Business regulations 5.50 7.17 7.31 6.48 7.14<br />
(i) Administrative requirements 7.73 2.75 2.69 2.74<br />
(ii) Bureaucracy costs 6.30 8.08 5.87 1.76 6.78<br />
(iii) Starting a business 3.43 5.15 9.76 9.77 9.77<br />
(iv) Extra payments/bribes/favoritism 6.76 7.71 8.29 7.51 7.16<br />
(v) Licensing restrictions 8.64 8.64 7.89<br />
(vi) Cost of tax compliance 8.52 8.52 8.52
Gabon<br />
Country Data Tables • 75<br />
1980 1985 1990 1995 2000 2005 2009 2010<br />
Chain-Linked Rating (Rank) Rating (Rank) Rating (Rank) Rating (Rank) Rating (Rank) Rating (Rank) Rating (Rank) Rating (Rank)<br />
Summary Rating (Rank) 4.50 (73) 5.08 (59) 5.47 (60) 5.38 (86) 5.81 (97) 5.60 (110) 5.69 (110) 5.66 (112)<br />
Area 1. Size of Government 5.47 (37) 4.63 (64) 6.08 (43) 5.54 (79) 7.61 (19) 6.01 (86) 6.11 (71) 5.97 (76)<br />
Area 2. Legal System and Property Rights 3.94 (56) 4.46 (64) 4.96 (59) 5.47 (71) 4.37 (95) 4.34 (91) 4.34 (95) 4.34 (94)<br />
Area 3. Sound Money 4.09 (99) 6.20 (79) 5.43 (88) 5.44 (83) 5.81 (109) 5.85 (113) 5.68 (118) 5.65 (119)<br />
Area 4. <strong>Freedom</strong> to Trade Internationally 5.33 (103) 5.39 (108) 5.58 (101) 5.70 (104)<br />
Area 5. Regulation 5.12 (67) 5.45 (59) 5.78 (53) 5.52 (78) 5.94 (84) 6.44 (80) 6.72 (70) 6.62 (80)<br />
Unadjusted<br />
Summary Rating (Rank) 4.48 (75) 5.40 (53) 5.52 (59) 5.35 (84) 5.80 (98) 5.82 (123) 5.91 (120) 5.88 (123)<br />
Rating (Data) Rating (Data) Rating (Data) Rating (Data) Rating (Data) Rating (Data) Rating (Data) Rating (Data)<br />
Area 1. Size of Government 4.94 5.93 6.08 5.54 7.61 5.77 5.86 5.73<br />
A. Government consumption 1.88 (33.60) 0.38 (38.72) 5.52 (21.23) 4.33 (25.26) 7.65 (14.00) 4.28 (25.45) 5.64 (20.82) 5.62 (20.88)<br />
B. Transfers and subsidies 9.40 (2.70) 9.81 (1.20) 9.81 (1.20) 9.81 (1.20) 9.81 (1.20) 9.81 (1.20) 9.81 (1.20)<br />
C. Government enterprises and investment 8.00 (19.90) 8.00 (17.30) 8.00 (18.00) 7.00 (24.20) 10.00 (13.30) 8.00 (19.90) 7.00 (22.15) 4.00 (34.62)<br />
D. Top marginal tax rate 1.00 1.00 3.00 1.00 1.00 3.50<br />
(i) Top marginal income tax rate 1.00 (60) 1.00 (60) 3.00 (50) 1.00 (56) 1.00 (56) 5.00 (40)<br />
(ii) Top marginal income and payroll tax rate 1.00 (56) 1.00 (56) 2.00 (52-57)<br />
Area 2. Legal System and Property Rights 3.94 4.46 4.96 5.09 4.29 4.35 4.35 4.35<br />
A. Judicial independence<br />
B. Impartial courts<br />
C. Protection of property rights<br />
4.63 4.78 4.70 4.70 4.70<br />
D. Military interference in rule of law and politics 4.82 3.33 3.33 3.33 3.33<br />
E. Integrity of the legal system 6.96 5.00 5.00 5.00 5.00<br />
F. Legal enforcement of contracts 2.92 2.92 2.92<br />
G. Regulatory restrictions on sale of real property<br />
H. Reliability of police<br />
I. Business costs of crime<br />
5.81 5.81 5.81<br />
Area 3. Sound Money 4.09 6.20 5.43 5.44 5.81 5.85 5.68 5.65<br />
A. Money growth 8.28 (−8.59) 7.68 (11.59) 9.61 (1.96) 9.97 (0.13) 9.75 (1.27) 6.92 (15.39) 8.85 (5.76) 8.81 (5.93)<br />
B. Standard deviation of inflation 5.43 (11.42) 7.39 (6.53) 5.17 (12.08) 1.88 (20.31) 3.60 (16.00) 6.47 (8.83) 4.27 (14.33) 4.09 (14.78)<br />
C. Inflation: most recent year 2.64 (36.78) 9.74 (−1.28) 6.93 (15.36) 9.89 (−0.54) 9.90 (0.50) 10.00 (−0.01) 9.62 (1.89) 9.71 (1.46)<br />
D. <strong>Freedom</strong> to own foreign currency bank accounts 0.00 0.00 0.00 0.00 0.00 0.00 0.00 0.00<br />
Area 4. <strong>Freedom</strong> to Trade Internationally 4.28 4.90 5.33 5.20 5.33 5.84 6.05 6.17<br />
A. Tariffs 3.24 4.91 6.80 5.80 6.00 6.17 6.30 6.30<br />
(i) Revenue from trade taxes (% of trade sector) 5.13 (7.30) 5.73 (6.40) 6.80 (4.80) 5.80 (6.30)<br />
(ii) Mean tariff rate 1.34 (43.30) 4.08 (29.60) 5.92 (20.40) 6.02 (19.90) 6.44 (17.80) 6.44 (17.80)<br />
(iii) Standard deviation of tariff rates 6.08 (9.80) 6.33 (9.18) 6.16 (9.61) 6.16 (9.61)<br />
B. Regulatory trade barriers<br />
(i) Non-tariff trade barriers<br />
7.20 7.11 7.63<br />
(ii) Compliance cost of importing and exporting 7.20 7.11 7.63<br />
C. Black-market exchange rates 9.60 9.80 9.20 9.80 10.00 10.00 10.00 10.00<br />
D. Controls of the movement of capital and people<br />
(i) Foreign ownership/investment restrictions<br />
0.00 0.00 0.00 0.00 0.00 0.00 0.77 0.77<br />
(ii) Capital controls 0.00 0.00 0.00 0.00 0.00 0.00 1.54 1.54<br />
(iii) <strong>Freedom</strong> of foreigners to visit 0.00 0.00 0.00<br />
Area 5. Regulation 5.16 5.49 5.78 5.52 5.94 7.27 7.60 7.48<br />
A. Credit market regulations 3.00 4.00 5.43 4.73 5.85 7.35 7.52 7.10<br />
(i) Ownership of banks 0.00 0.00 2.00 5.00 5.00 5.00 5.00 5.00<br />
(ii) Private sector credit 6.30 5.20 7.56 8.06 8.57 7.29<br />
(iii) Interest rate controls/negative real interest rates 6.00 8.00 8.00 4.00 5.00 9.00 9.00 9.00<br />
B. Labor market regulations 7.08 8.68 8.68<br />
(i) Hiring regulations and minimum wage<br />
(ii) Hiring and firing regulations<br />
(iii) Centralized collective bargaining<br />
8.30 8.33 8.33<br />
(iv) Hours regulations 4.00 8.00 8.00<br />
(v) Mandated cost of worker dismissal 6.01 8.39 8.39<br />
(vi) Conscription 10.00 10.00 10.00 10.00 10.00 10.00 10.00 10.00<br />
C. Business regulations<br />
(i) Administrative requirements<br />
(ii) Bureaucracy costs<br />
7.39 6.58 6.67<br />
(iii) Starting a business<br />
(iv) Extra payments/bribes/favoritism<br />
7.77 7.81 7.87<br />
(v) Licensing restrictions 7.44 7.42 7.60<br />
(vi) Cost of tax compliance 6.95 4.53 4.53<br />
www.freetheworld.com • www.fraserinstitute.org • Fraser Institute ©2012
76 • <strong>Economic</strong> <strong>Freedom</strong> of the <strong>World</strong>: 2012 Annual Report<br />
Georgia<br />
Fraser Institute ©2012 • www.fraserinstitute.org • www.freetheworld.com<br />
1980 1985 1990 1995 2000 2005 2009 2010<br />
Chain-Linked Rating (Rank) Rating (Rank) Rating (Rank) Rating (Rank) Rating (Rank) Rating (Rank) Rating (Rank) Rating (Rank)<br />
Summary Rating (Rank) <br />
Area 1. Size of Government<br />
Area 2. Legal System and Property Rights<br />
Area 3. Sound Money<br />
Area 4. <strong>Freedom</strong> to Trade Internationally<br />
Area 5. Regulation<br />
Unadjusted<br />
Summary Rating (Rank) 7.42 (37) 7.20 (49) 7.34 (42)<br />
Rating (Data) Rating (Data) Rating (Data) Rating (Data) Rating (Data) Rating (Data) Rating (Data) Rating (Data)<br />
Area 1. Size of Government 4.70 7.38 5.48 6.24<br />
A. Government consumption 9.40 (8.03) 5.72 (20.56) 4.99 (23.04) 5.45 (21.46)<br />
B. Transfers and subsidies 7.79 (8.60) 6.91 (11.83) 7.49 (9.71)<br />
C. Government enterprises and investment 0.00 7.00 (21.00) 0.00 (53.55) 2.00 (47.49)<br />
D. Top marginal tax rate 9.00 10.00 10.00<br />
(i) Top marginal income tax rate 10.00 (12) 10.00 (20) 10.00 (20)<br />
(ii) Top marginal income and payroll tax rate 8.00 (27) 10.00 (20) 10.00 (20)<br />
Area 2. Legal System and Property Rights 5.08 5.55 5.71<br />
A. Judicial independence 1.88 3.22 3.63<br />
B. Impartial courts 2.38 3.68 3.78<br />
C. Protection of property rights 4.23 3.74 3.71<br />
D. Military interference in rule of law and politics<br />
E. Integrity of the legal system<br />
4.20 3.70 4.50<br />
F. Legal enforcement of contracts 6.50 6.50 6.50<br />
G. Regulatory restrictions on sale of real property 9.67 9.93 9.93<br />
H. Reliability of police 5.73 6.22 7.02<br />
I. Business costs of crime 6.04 7.44 6.63<br />
Area 3. Sound Money 8.64 9.24 8.80<br />
A. Money growth 6.24 (18.80) 7.01 (14.97) 9.30 (3.51) 8.66 (6.68)<br />
B. Standard deviation of inflation 9.19 (2.02) 7.99 (5.01) 7.97 (5.07)<br />
C. Inflation: most recent year 8.35 (8.23) 9.65 (1.74) 8.58 (7.10)<br />
D. <strong>Freedom</strong> to own foreign currency bank accounts 10.00 10.00 10.00<br />
Area 4. <strong>Freedom</strong> to Trade Internationally 8.20 8.54 8.20<br />
A. Tariffs 8.51 9.07 9.10<br />
(i) Revenue from trade taxes (% of trade sector) 9.23 (1.16) 9.17 (1.25) 9.73 (0.41) 9.57 (0.65)<br />
(ii) Mean tariff rate 8.60 (7.00) 9.74 (1.30) 9.74 (1.30)<br />
(iii) Standard deviation of tariff rates 7.76 (5.60) 7.74 (5.66) 7.99 (5.03)<br />
B. Regulatory trade barriers 6.75 7.62 6.34<br />
(i) Non-tariff trade barriers 5.22 6.73 6.50<br />
(ii) Compliance cost of importing and exporting 8.28 8.51 6.19<br />
C. Black-market exchange rates 10.00 10.00 10.00<br />
D. Controls of the movement of capital and people 7.54 7.48 7.34<br />
(i) Foreign ownership/investment restrictions 5.81 6.25 5.84<br />
(ii) Capital controls 8.33 7.69 7.69<br />
(iii) <strong>Freedom</strong> of foreigners to visit 8.49 8.49 8.49<br />
Area 5. Regulation 7.81 7.17 7.75<br />
A. Credit market regulations 9.67 6.33 8.18<br />
(i) Ownership of banks 10.00 10.00 10.00<br />
(ii) Private sector credit 9.11 10.00 0.00 5.53<br />
(iii) Interest rate controls/negative real interest rates 10.00 9.00 9.00 9.00<br />
B. Labor market regulations 7.62 7.87 7.80<br />
(i) Hiring regulations and minimum wage 10.00 10.00 10.00<br />
(ii) Hiring and firing regulations 6.78 6.95 6.74<br />
(iii) Centralized collective bargaining 8.31 7.70 7.46<br />
(iv) Hours regulations 8.00 10.00 10.00<br />
(v) Mandated cost of worker dismissal 9.63 9.60 9.60<br />
(vi) Conscription 3.00 3.00 3.00<br />
C. Business regulations 6.13 7.30 7.28<br />
(i) Administrative requirements 4.74 6.08 5.89<br />
(ii) Bureaucracy costs 3.22 6.65 6.13<br />
(iii) Starting a business 9.36 9.85 9.89<br />
(iv) Extra payments/bribes/favoritism 5.00 6.28 6.44<br />
(v) Licensing restrictions 8.79 9.28 9.68<br />
(vi) Cost of tax compliance 5.66 5.66 5.66
Country Data Tables • 77<br />
Germany 1980 1985 1990 1995 2000 2005 2009 2010<br />
Chain-Linked Rating (Rank) Rating (Rank) Rating (Rank) Rating (Rank) Rating (Rank) Rating (Rank) Rating (Rank) Rating (Rank)<br />
Summary Rating (Rank) 7.16 (9) 7.25 (9) 7.65 (9) 7.63 (14) 7.67 (19) 7.76 (18) 7.57 (25) 7.53 (29)<br />
Area 1. Size of Government 4.34 (73) 4.26 (78) 5.15 (70) 4.36 (98) 3.96 (109) 5.74 (90) 5.41 (91) 5.46 (92)<br />
Area 2. Legal System and Property Rights 7.70 (12) 7.48 (14) 8.35 (5) 9.13 (5) 9.14 (10) 9.14 (5) 8.54 (17) 8.28 (18)<br />
Area 3. Sound Money 9.43 (3) 9.47 (6) 9.67 (8) 9.76 (4) 9.55 (16) 9.53 (20) 9.53 (22) 9.59 (18)<br />
Area 4. <strong>Freedom</strong> to Trade Internationally 8.50 (11) 9.17 (4) 9.18 (6) 9.25 (7) 9.39 (7) 8.20 (20) 7.97 (28) 7.60 (45)<br />
Area 5. Regulation 5.93 (38) 5.93 (42) 5.97 (46) 5.67 (69) 6.33 (60) 6.24 (89) 6.40 (88) 6.72 (72)<br />
Unadjusted<br />
Summary Rating (Rank) 7.18 (11) 7.27 (11) 7.64 (11) 7.60 (16) 7.67 (17) 7.75 (17) 7.56 (23) 7.52 (31)<br />
Rating (Data) Rating (Data) Rating (Data) Rating (Data) Rating (Data) Rating (Data) Rating (Data) Rating (Data)<br />
Area 1. Size of Government 4.34 4.26 5.15 4.36 3.96 5.74 5.41 5.46<br />
A. Government consumption 4.03 (26.30) 4.09 (26.10) 4.35 (25.20) 4.19 (25.75) 4.55 (24.52) 4.67 (24.11) 4.39 (25.07) 4.24 (25.57)<br />
B. Transfers and subsidies 5.34 (17.60) 4.96 (19.00) 5.26 (17.90) 4.25 (21.60) 2.29 (28.81) 2.29 (28.78) 2.26 (28.89) 2.59 (27.71)<br />
C. Government enterprises and investment 6.00 (25.70) 7.00 (24.40) 7.00 (24.00) 6.00 (25.50) 6.00 (25.50) 10.00 (7.75) 10.00 (9.30) 10.00 (8.69)<br />
D. Top marginal tax rate 2.00 1.00 4.00 3.00 3.00 6.00 5.00 5.00<br />
(i) Top marginal income tax rate 2.00 (65) 1.00 (65) 4.00 (53) 3.00 (57) 3.00 (56) 6.00 (44) 5.00 (47) 5.00 (47)<br />
(ii) Top marginal income and payroll tax rate 4.00 (53) 3.00 (57) 3.00 (56) 6.00 (44) 5.00 (47) 5.00 (47)<br />
Area 2. Legal System and Property Rights 7.70 7.48 8.35 9.13 9.14 8.80 8.21 7.97<br />
A. Judicial independence 9.27 9.35 9.18 8.94 8.89<br />
B. Impartial courts 8.60 9.19 8.95 7.12 6.61<br />
C. Protection of property rights 7.99 8.84 9.61 8.54 7.88<br />
D. Military interference in rule of law and politics 9.81 10.00 10.00 10.00 10.00<br />
E. Integrity of the legal system 10.00 8.33 8.33 8.33 8.33<br />
F. Legal enforcement of contracts 6.62 6.62 6.62<br />
G. Regulatory restrictions on sale of real property 7.86 7.57 7.53<br />
H. Reliability of police 9.22 8.65 7.72<br />
I. Business costs of crime 9.38 8.16 8.15<br />
Area 3. Sound Money 9.43 9.47 9.67 9.76 9.55 9.53 9.53 9.59<br />
A. Money growth 9.18 (4.10) 8.80 (6.01) 9.68 (1.60) 9.90 (0.48) 8.77 (6.13) 8.64 (6.81) 8.46 (7.71) 8.86 (5.69)<br />
B. Standard deviation of inflation 9.64 (0.89) 9.52 (1.20) 9.52 (1.20) 9.54 (1.16) 9.71 (0.72) 9.88 (0.31) 9.73 (0.66) 9.73 (0.67)<br />
C. Inflation: most recent year 8.90 (5.50) 9.56 (2.18) 9.46 (2.70) 9.58 (2.10) 9.71 (1.47) 9.61 (1.95) 9.94 (0.31) 9.77 (1.14)<br />
D. <strong>Freedom</strong> to own foreign currency bank accounts 10.00 10.00 10.00 10.00 10.00 10.00 10.00 10.00<br />
Area 4. <strong>Freedom</strong> to Trade Internationally 8.98 9.69 9.48 9.14 9.39 8.25 8.02 7.65<br />
A. Tariffs 8.95 9.08 8.44 8.66 9.18 8.39 8.22 8.34<br />
(i) Revenue from trade taxes (% of trade sector) 9.67 (0.50) 9.67 (0.50) 9.67 (0.50) 9.67 (0.50) 9.78 (0.33) 9.59 (0.62) 9.44 (0.84) 9.63 (0.55)<br />
(ii) Mean tariff rate 8.24 (8.80) 8.50 (7.50) 8.52 (7.40) 8.66 (6.70) 9.52 (2.40) 9.46 (2.70) 8.94 (5.30) 8.98 (5.10)<br />
(iii) Standard deviation of tariff rates 7.12 (7.20) 7.64 (5.90) 8.24 (4.40) 6.13 (9.67) 6.29 (9.28) 6.41 (8.98)<br />
B. Regulatory trade barriers 8.28 8.89 8.39 7.91 6.64<br />
(i) Non-tariff trade barriers 8.28 8.45 7.65 6.68 6.21<br />
(ii) Compliance cost of importing and exporting 9.33 9.14 9.14 7.06<br />
C. Black-market exchange rates 10.00 10.00 10.00 10.00 10.00 10.00 10.00 10.00<br />
D. Controls of the movement of capital and people 8.00 10.00 10.00 9.61 9.48 6.21 5.94 5.60<br />
(i) Foreign ownership/investment restrictions 9.23 9.72 8.22 7.39 6.39<br />
(ii) Capital controls 8.00 10.00 10.00 10.00 9.23 3.85 3.85 3.85<br />
(iii) <strong>Freedom</strong> of foreigners to visit 6.58 6.58 6.58<br />
Area 5. Regulation 5.45 5.45 5.56 5.63 6.33 6.44 6.60 6.93<br />
A. Credit market regulations 7.61 7.58 7.65 6.98 8.33 7.99 7.99 7.99<br />
(i) Ownership of banks 5.00 5.00 5.00 5.00 5.00 5.00 5.00 5.00<br />
(ii) Private sector credit 7.83 7.74 7.94 5.93 10.00 8.96 8.98 8.98<br />
(iii) Interest rate controls/negative real interest rates 10.00 10.00 10.00 10.00 10.00 10.00 10.00 10.00<br />
B. Labor market regulations 3.29 3.32 3.48 3.56 2.85 3.94 5.28 5.35<br />
(i) Hiring regulations and minimum wage 3.38 4.63 6.70 6.67 6.67<br />
(ii) Hiring and firing regulations 3.94 3.94 1.82 2.42 2.86 3.01<br />
(iii) Centralized collective bargaining 4.49 4.49 4.49 4.49 2.32 3.20 3.20 3.45<br />
(iv) Hours regulations 4.40 4.49 4.49 2.97 2.51 4.70 8.00 8.00<br />
(v) Mandated cost of worker dismissal 3.60 5.98 5.98<br />
(vi) Conscription 1.00 1.00 1.00 3.00 3.00 3.00 5.00 5.00<br />
C. Business regulations 6.37 7.79 7.39 6.51 7.46<br />
(i) Administrative requirements 8.18 3.43 3.38 3.42<br />
(ii) Bureaucracy costs 6.47 8.53 5.80 1.18 7.31<br />
(iii) Starting a business 4.97 6.40 9.03 9.47 9.47<br />
(iv) Extra payments/bribes/favoritism 7.68 8.04 9.10 8.26 7.78<br />
(v) Licensing restrictions 9.17 9.18 9.25<br />
(vi) Cost of tax compliance 7.80 7.59 7.52<br />
www.freetheworld.com • www.fraserinstitute.org • Fraser Institute ©2012
78 • <strong>Economic</strong> <strong>Freedom</strong> of the <strong>World</strong>: 2012 Annual Report<br />
Ghana<br />
Fraser Institute ©2012 • www.fraserinstitute.org • www.freetheworld.com<br />
1980 1985 1990 1995 2000 2005 2009 2010<br />
Chain-Linked Rating (Rank) Rating (Rank) Rating (Rank) Rating (Rank) Rating (Rank) Rating (Rank) Rating (Rank) Rating (Rank)<br />
Summary Rating (Rank) 3.05 (101) 3.20 (105) 5.06 (77) 5.53 (81) 5.66 (101) 6.49 (77) 7.13 (52) 7.09 (53)<br />
Area 1. Size of Government 5.42 (39) 5.13 (52) 4.82 (80) 5.61 (77) 6.09 (66) 6.49 (68) 7.65 (19) 8.28 (10)<br />
Area 2. Legal System and Property Rights 2.76 (71) 2.69 (96) 5.79 (44) 6.18 (50) 4.59 (88) 4.85 (80) 5.61 (72) 5.74 (68)<br />
Area 3. Sound Money 1.60 (105) 2.38 (107) 4.58 (95) 4.13 (100) 5.82 (108) 7.38 (82) 8.16 (67) 7.13 (88)<br />
Area 4. <strong>Freedom</strong> to Trade Internationally 0.00 (91) 0.68 (95) 4.41 (66) 5.23 (93) 6.03 (85) 6.70 (75) 7.40 (51) 7.43 (48)<br />
Area 5. Regulation 4.77 (78) 5.06 (71) 5.65 (59) 6.50 (38) 5.80 (90) 7.09 (44) 6.98 (50) 7.03 (48)<br />
Unadjusted<br />
Summary Rating (Rank) 2.89 (103) 3.16 (106) 4.95 (81) 5.31 (88) 5.64 (101) 6.42 (92) 7.00 (66) 6.96 (71)<br />
Rating (Data) Rating (Data) Rating (Data) Rating (Data) Rating (Data) Rating (Data) Rating (Data) Rating (Data)<br />
Area 1. Size of Government 5.70 5.40 4.82 5.61 6.09 6.49 7.65 8.28<br />
A. Government consumption 8.31 (11.74) 8.80 (10.07) 8.87 (9.85) 7.72 (13.77) 7.12 (15.80) 7.09 (15.90) 7.94 (13.02) 8.48 (11.16)<br />
B. Transfers and subsidies 9.48 (2.40) 9.78 (1.30) 9.43 (2.60) 9.24 (3.30) 9.24 (3.30) 9.87 (0.98) 9.68 (1.67) 9.65 (1.78)<br />
C. Government enterprises and investment 4.00 (35.40) 2.00 (43.60) 0.00 (51.90) 0.00 (66.50) 2.00 (45.00) 2.00 (40.10) 6.00 (26.13) 8.00 (18.04)<br />
D. Top marginal tax rate 1.00 1.00 1.00 5.50 6.00 7.00 7.00 7.00<br />
(i) Top marginal income tax rate 1.00 (60) 1.00 (60) 2.00 (55) 7.00 (35) 8.00 (30) 9.00 (25) 9.00 (25) 9.00 (25)<br />
(ii) Top marginal income and payroll tax rate 0.00 (62) 4.00 (45) 4.00 (41) 5.00 (37) 5.00 (37) 5.00 (37)<br />
Area 2. Legal System and Property Rights 2.76 2.69 5.79 5.60 4.45 4.88 5.45 5.58<br />
A. Judicial independence 4.65 5.12<br />
B. Impartial courts 5.54 5.42 5.20 4.85 4.99<br />
C. Protection of property rights 5.34 5.03<br />
D. Military interference in rule of law and politics 6.04 5.00 4.44 5.00 5.00<br />
E. Integrity of the legal system 6.96 3.33 3.61 4.17 4.17<br />
F. Legal enforcement of contracts 4.91 5.40 5.40<br />
G. Regulatory restrictions on sale of real property 6.25 9.03 9.13<br />
H. Reliability of police 5.30 5.57<br />
I. Business costs of crime 5.28 5.83<br />
Area 3. Sound Money 1.60 2.38 4.58 4.13 5.82 7.38 8.16 7.13<br />
A. Money growth 3.23 (33.84) 3.64 (31.78) 4.46 (27.69) 4.51 (27.44) 7.46 (12.72) 6.06 (19.71) 6.92 (15.39) 6.15 (19.24)<br />
B. Standard deviation of inflation 3.17 (17.07) 0.00 (38.34) 8.00 (4.99) 5.65 (10.88) 5.85 (10.37) 6.47 (8.83) 9.56 (1.11) 9.50 (1.24)<br />
C. Inflation: most recent year 0.00 (51.13) 5.87 (20.65) 5.87 (20.66) 1.37 (43.17) 4.96 (25.19) 6.98 (15.12) 6.15 (19.25) 7.86 (10.71)<br />
D. <strong>Freedom</strong> to own foreign currency bank accounts 0.00 0.00 0.00 5.00 5.00 10.00 10.00 5.00<br />
Area 4. <strong>Freedom</strong> to Trade Internationally 0.00 0.67 4.33 5.23 6.03 5.80 6.91 6.94<br />
A. Tariffs 0.00 2.00 4.38 6.09 6.54 5.48 7.11 7.13<br />
(i) Revenue from trade taxes (% of trade sector) 0.00 (17.30) 0.00 (21.70) 2.27 (11.60) 4.60 (8.10) 6.93 (4.60) 6.86 (4.71) 6.79 (4.81) 6.79 (4.81)<br />
(ii) Mean tariff rate 4.00 (30.00) 6.50 (17.50) 7.00 (15.00) 6.96 (15.20) 7.36 (13.20) 7.40 (13.00) 7.40 (13.00)<br />
(iii) Standard deviation of tariff rates 6.68 (8.30) 5.72 (10.70) 2.23 (19.43) 7.14 (7.15) 7.19 (7.02)<br />
B. Regulatory trade barriers 5.78 6.67 6.61<br />
(i) Non-tariff trade barriers 6.58 6.52<br />
(ii) Compliance cost of importing and exporting 5.78 6.76 6.69<br />
C. Black-market exchange rates 0.00 0.00 8.60 9.60 10.00 10.00 10.00 10.00<br />
D. Controls of the movement of capital and people 0.00 0.00 0.00 0.00 1.54 1.95 3.86 4.02<br />
(i) Foreign ownership/investment restrictions 6.15 6.62<br />
(ii) Capital controls 0.00 0.00 0.00 0.00 1.54 2.31 3.85 3.85<br />
(iii) <strong>Freedom</strong> of foreigners to visit 1.59 1.59 1.59<br />
Area 5. Regulation 4.40 4.67 5.21 5.99 5.80 7.56 6.82 6.87<br />
A. Credit market regulations 1.76 2.48 3.93 6.00 4.93 9.09 8.13 8.13<br />
(i) Ownership of banks 2.00 2.00 2.00 5.00 5.00 8.00 8.00 8.00<br />
(ii) Private sector credit 3.29 5.45 7.79 8.99 4.85 9.27 6.39 6.39<br />
(iii) Interest rate controls/negative real interest rates 0.00 0.00 2.00 4.00 10.00 10.00 10.00<br />
B. Labor market regulations 7.00 6.23 6.52<br />
(i) Hiring regulations and minimum wage 10.00 8.90 10.00<br />
(ii) Hiring and firing regulations 5.19 5.28<br />
(iii) Centralized collective bargaining 5.28 5.83<br />
(iv) Hours regulations 8.00 8.00 8.00<br />
(v) Mandated cost of worker dismissal 0.00 0.00 0.00<br />
(vi) Conscription 10.00 10.00 10.00 10.00 10.00 10.00 10.00 10.00<br />
C. Business regulations 6.60 6.11 5.96<br />
(i) Administrative requirements 4.23 4.32<br />
(ii) Bureaucracy costs 5.89 4.21<br />
(iii) Starting a business 6.81 9.37 9.42<br />
(iv) Extra payments/bribes/favoritism 4.17 3.98<br />
(v) Licensing restrictions 6.41 5.49 6.35<br />
(vi) Cost of tax compliance 6.59 7.49 7.49
Greece<br />
Country Data Tables • 79<br />
1980 1985 1990 1995 2000 2005 2009 2010<br />
Chain-Linked Rating (Rank) Rating (Rank) Rating (Rank) Rating (Rank) Rating (Rank) Rating (Rank) Rating (Rank) Rating (Rank)<br />
Summary Rating (Rank) 5.76 (33) 5.14 (58) 5.99 (44) 6.44 (52) 6.91 (47) 7.31 (43) 6.60 (76) 6.73 (72)<br />
Area 1. Size of Government 5.76 (29) 3.74 (90) 4.81 (81) 5.23 (86) 4.95 (92) 6.77 (56) 4.86 (106) 5.80 (78)<br />
Area 2. Legal System and Property Rights 5.57 (38) 5.61 (46) 6.76 (27) 6.69 (39) 5.70 (65) 7.03 (40) 5.79 (69) 5.75 (66)<br />
Area 3. Sound Money 7.12 (29) 6.96 (38) 6.89 (53) 7.34 (48) 9.32 (29) 9.56 (16) 9.63 (9) 9.67 (10)<br />
Area 4. <strong>Freedom</strong> to Trade Internationally 6.13 (31) 5.26 (46) 6.72 (36) 8.03 (29) 9.05 (14) 7.64 (45) 7.56 (47) 7.40 (50)<br />
Area 5. Regulation 4.11 (88) 4.05 (91) 4.68 (90) 4.85 (96) 5.51 (98) 5.60 (104) 5.13 (115) 5.01 (117)<br />
Unadjusted<br />
Summary Rating (Rank) 5.72 (36) 5.10 (62) 5.95 (43) 6.37 (54) 6.91 (45) 7.37 (43) 6.65 (84) 6.78 (81)<br />
Rating (Data) Rating (Data) Rating (Data) Rating (Data) Rating (Data) Rating (Data) Rating (Data) Rating (Data)<br />
Area 1. Size of Government 5.76 3.74 4.81 5.23 4.95 6.77 4.86 5.80<br />
A. Government consumption 7.44 (14.69) 6.63 (17.46) 6.69 (17.25) 6.95 (16.38) 6.57 (17.67) 6.71 (17.17) 5.30 (21.97) 6.00 (19.61)<br />
B. Transfers and subsidies 8.59 (5.69) 5.31 (17.70) 4.55 (20.50) 4.96 (19.00) 5.23 (18.00) 5.35 (17.55) 4.12 (22.09) 4.22 (21.72)<br />
C. Government enterprises and investment 4.00 (32.00) 2.00 (41.00) 4.00 (37.50) 4.00 (35.80) 4.00 (35.80) 10.00 (13.64) 4.00 (30.33) 7.00 (23.85)<br />
D. Top marginal tax rate 3.00 1.00 4.00 5.00 4.00 5.00 6.00 6.00<br />
(i) Top marginal income tax rate 3.00 (60) 1.00 (63) 4.00 (50) 5.00 (45) 5.00 (42) 5.00 (40) 6.00 (40) 6.00 (40)<br />
(ii) Top marginal income and payroll tax rate 4.00 (50) 5.00 (45) 3.00 (50) 5.00 (40) 6.00 (40) 6.00 (40)<br />
Area 2. Legal System and Property Rights 5.57 5.61 6.76 6.69 5.70 6.74 5.55 5.51<br />
A. Judicial independence 5.45 6.35 5.63 4.24 3.89<br />
B. Impartial courts 5.70 5.68 5.45 3.57 2.98<br />
C. Protection of property rights 5.44 4.83 7.24 6.19 5.77<br />
D. Military interference in rule of law and politics 6.86 6.67 7.64 8.33 8.33<br />
E. Integrity of the legal system 10.00 5.00 7.50 7.50 7.50<br />
F. Legal enforcement of contracts 4.13 4.13 4.13<br />
G. Regulatory restrictions on sale of real property 8.27 5.41 5.72<br />
H. Reliability of police 6.69 4.52 6.26<br />
I. Business costs of crime 8.12 6.05 5.03<br />
Area 3. Sound Money 7.12 6.96 6.89 7.34 9.32 9.56 9.63 9.67<br />
A. Money growth 7.94 (10.30) 7.39 (13.06) 7.05 (14.74) 7.67 (11.66) 8.70 (6.52) 9.10 (4.49) 9.11 (4.46) 9.99 (−0.07)<br />
B. Standard deviation of inflation 9.06 (2.35) 9.00 (2.51) 9.05 (2.37) 8.47 (3.82) 9.21 (1.97) 9.85 (0.37) 9.64 (0.90) 9.62 (0.96)<br />
C. Inflation: most recent year 6.46 (17.69) 6.47 (17.67) 6.47 (17.67) 8.22 (8.88) 9.37 (3.17) 9.29 (3.56) 9.76 (1.21) 9.06 (4.71)<br />
D. <strong>Freedom</strong> to own foreign currency bank accounts 5.00 5.00 5.00 5.00 10.00 10.00 10.00 10.00<br />
Area 4. <strong>Freedom</strong> to Trade Internationally 6.22 5.34 6.60 7.86 9.05 7.76 7.68 7.52<br />
A. Tariffs 8.05 9.02 8.41 8.68 9.18 8.39 8.22 8.34<br />
(i) Revenue from trade taxes (% of trade sector) 7.87 (3.20) 9.53 (0.70) 9.60 (0.60) 9.73 (0.40) 9.78 (0.33) 9.59 (0.62) 9.44 (0.84) 9.63 (0.55)<br />
(ii) Mean tariff rate 8.24 (8.80) 8.50 (7.50) 8.52 (7.40) 8.66 (6.70) 9.52 (2.40) 9.46 (2.70) 8.94 (5.30) 8.98 (5.10)<br />
(iii) Standard deviation of tariff rates 7.12 (7.20) 7.64 (5.90) 8.24 (4.40) 6.13 (9.67) 6.29 (9.28) 6.41 (8.98)<br />
B. Regulatory trade barriers 6.25 8.73 7.01 6.99 6.63<br />
(i) Non-tariff trade barriers 6.25 7.95 7.10 7.06 6.82<br />
(ii) Compliance cost of importing and exporting 9.50 6.93 6.93 6.44<br />
C. Black-market exchange rates 8.60 5.00 9.40 10.00 10.00 10.00 10.00 10.00<br />
D. Controls of the movement of capital and people 2.00 2.00 2.00 6.52 8.30 5.64 5.51 5.10<br />
(i) Foreign ownership/investment restrictions 8.03 8.91 6.49 6.10 4.89<br />
(ii) Capital controls 2.00 2.00 2.00 5.00 7.69 3.85 3.85 3.85<br />
(iii) <strong>Freedom</strong> of foreigners to visit 6.58 6.58 6.58<br />
Area 5. Regulation 3.93 3.87 4.66 4.73 5.51 6.01 5.52 5.38<br />
A. Credit market regulations 4.24 4.13 5.63 5.97 7.36 7.89 6.00 6.00<br />
(i) Ownership of banks 2.00 2.00 5.00 5.00 5.00 8.00 8.00 8.00<br />
(ii) Private sector credit 4.73 4.38 3.90 4.90 7.08 5.68 0.00 0.00<br />
(iii) Interest rate controls/negative real interest rates 6.00 6.00 8.00 8.00 10.00 10.00 10.00 10.00<br />
B. Labor market regulations 3.61 3.61 3.69 3.99 3.38 4.01 4.50 4.36<br />
(i) Hiring regulations and minimum wage 5.23 4.07 5.60 5.57 5.57<br />
(ii) Hiring and firing regulations 4.81 4.81 2.33 2.93 3.17 3.27<br />
(iii) Centralized collective bargaining 4.49 4.49 4.49 4.49 4.17 3.48 3.48 3.51<br />
(iv) Hours regulations 6.33 6.33 5.45 5.45 6.35 3.30 4.00 4.00<br />
(v) Mandated cost of worker dismissal 7.78 7.78 6.79<br />
(vi) Conscription 0.00 0.00 0.00 0.00 0.00 1.00 3.00 3.00<br />
C. Business regulations 4.23 5.78 6.13 6.05 5.78<br />
(i) Administrative requirements 6.98 2.79 2.29 2.24<br />
(ii) Bureaucracy costs 4.79 6.40 4.51 5.13 3.65<br />
(iii) Starting a business 4.20 4.08 8.20 9.10 9.39<br />
(iv) Extra payments/bribes/favoritism 3.71 5.65 6.22 4.24 3.77<br />
(v) Licensing restrictions 8.04 8.07 8.16<br />
(vi) Cost of tax compliance 7.04 7.49 7.49<br />
www.freetheworld.com • www.fraserinstitute.org • Fraser Institute ©2012
80 • <strong>Economic</strong> <strong>Freedom</strong> of the <strong>World</strong>: 2012 Annual Report<br />
Guatemala 1980 1985 1990 1995 2000 2005 2009 2010<br />
Chain-Linked Rating (Rank) Rating (Rank) Rating (Rank) Rating (Rank) Rating (Rank) Rating (Rank) Rating (Rank) Rating (Rank)<br />
Summary Rating (Rank) 5.87 (30) 4.68 (79) 5.62 (52) 6.96 (37) 6.57 (64) 7.15 (48) 7.16 (47) 7.14 (50)<br />
Area 1. Size of Government 7.49 (9) 6.85 (8) 8.07 (6) 9.12 (3) 8.53 (5) 8.08 (18) 8.00 (15) 8.00 (17)<br />
Area 2. Legal System and Property Rights 2.30 (78) 1.81 (107) 2.21 (104) 4.50 (99) 3.16 (116) 4.61 (84) 3.92 (104) 3.87 (102)<br />
Area 3. Sound Money 8.95 (10) 8.02 (28) 6.83 (54) 8.08 (40) 7.64 (66) 9.17 (39) 9.40 (31) 9.37 (32)<br />
Area 4. <strong>Freedom</strong> to Trade Internationally 4.25 (51) 1.94 (81) 5.57 (50) 7.30 (49) 7.38 (57) 7.12 (62) 7.71 (43) 7.66 (40)<br />
Area 5. Regulation 7.05 (10) 5.75 (45) 5.60 (63) 5.77 (63) 6.15 (72) 6.57 (76) 6.52 (81) 6.56 (86)<br />
Unadjusted<br />
Summary Rating (Rank) 6.33 (22) 5.05 (65) 5.86 (48) 7.21 (26) 6.63 (60) 7.22 (50) 7.23 (46) 7.21 (55)<br />
Fraser Institute ©2012 • www.fraserinstitute.org • www.freetheworld.com<br />
Rating (Data) Rating (Data) Rating (Data) Rating (Data) Rating (Data) Rating (Data) Rating (Data) Rating (Data)<br />
Area 1. Size of Government 7.72 7.07 8.07 9.12 8.53 8.08 8.00 8.00<br />
A. Government consumption 9.07 (9.16) 9.48 (7.77) 9.62 (7.30) 9.99 (6.05) 9.66 (7.14) 9.17 (8.81) 8.65 (10.58) 8.61 (10.73)<br />
B. Transfers and subsidies 9.81 (1.20) 9.78 (1.30) 9.65 (1.80) 10.00 (0.50) 9.47 (2.46) 9.65 (1.79) 9.86 (1.00) 9.88 (0.93)<br />
C. Government enterprises and investment 4.00 (37.40) 4.00 (32.10) 7.00 (21.00) 8.00 (17.30) 8.00 (16.43) 8.00 (15.07) 8.00 (15.41) 8.00 (15.41)<br />
D. Top marginal tax rate 8.00 5.00 6.00 8.50 7.00 5.50 5.50 5.50<br />
(i) Top marginal income tax rate 8.00 (40) 5.00 (48) 7.00 (34) 9.00 (25) 7.00 (31) 7.00 (31) 7.00 (31) 7.00 (31)<br />
(ii) Top marginal income and payroll tax rate 5.00 (37) 8.00 (28) 7.00 (34) 4.00 (42) 4.00 (42) 4.00 (42)<br />
Area 2. Legal System and Property Rights 2.54 1.99 2.44 4.72 3.42 4.68 3.98 3.93<br />
A. Judicial independence 3.80 2.87 2.75<br />
B. Impartial courts 3.60 3.79 3.82 3.39 3.13<br />
C. Protection of property rights 2.18 5.30 4.43 4.31<br />
D. Military interference in rule of law and politics 4.31 3.33 8.33 6.67 6.67<br />
E. Integrity of the legal system 6.96 3.33 3.89 2.50 2.50<br />
F. Legal enforcement of contracts 3.39 3.39 3.39<br />
G. Regulatory restrictions on sale of real property 8.94 9.24 9.27<br />
H. Reliability of police 2.94 2.22 1.18<br />
I. Business costs of crime 1.67 1.16 2.14<br />
Area 3. Sound Money 8.95 8.02 6.83 8.08 7.64 9.17 9.40 9.37<br />
A. Money growth 9.26 (3.72) 7.97 (10.14) 7.15 (14.24) 7.69 (11.54) 7.47 (12.64) 8.64 (6.82) 8.93 (5.35) 9.14 (4.28)<br />
B. Standard deviation of inflation 8.56 (3.61) 7.88 (5.31) 3.94 (15.15) 6.37 (9.07) 9.28 (1.79) 9.73 (0.68) 9.05 (2.37) 9.11 (2.23)<br />
C. Inflation: most recent year 8.00 (10.00) 6.24 (18.78) 6.24 (18.78) 8.27 (8.67) 8.80 (5.98) 8.32 (8.42) 9.63 (1.86) 9.23 (3.86)<br />
D. <strong>Freedom</strong> to own foreign currency bank accounts 10.00 10.00 10.00 10.00 5.00 10.00 10.00 10.00<br />
Area 4. <strong>Freedom</strong> to Trade Internationally 5.47 2.50 6.44 8.45 7.38 7.67 8.30 8.25<br />
A. Tariffs 3.40 2.50 4.33 7.36 7.93 6.74 8.47 8.47<br />
(i) Revenue from trade taxes (% of trade sector) 6.80 (4.80) 5.00 (7.50) 7.60 (3.60) 7.07 (4.40) 8.36 (2.46) 8.19 (2.71) 8.96 (1.56) 8.96 (1.56)<br />
(ii) Mean tariff rate 0.00 (50.00) 0.00 (50.00) 5.40 (23.00) 7.96 (10.20) 8.56 (7.20) 9.46 (2.70) 8.88 (5.60) 8.88 (5.60)<br />
(iii) Standard deviation of tariff rates 0.00 (26.70) 7.04 (7.40) 6.88 (7.80) 2.57 (18.57) 7.56 (6.10) 7.58 (6.05)<br />
B. Regulatory trade barriers 4.13 6.11 6.85 7.03<br />
(i) Non-tariff trade barriers 4.13 5.56 6.03 5.62<br />
(ii) Compliance cost of importing and exporting 6.66 7.68 8.44<br />
C. Black-market exchange rates 8.00 0.00 10.00 10.00 10.00 10.00 10.00 10.00<br />
D. Controls of the movement of capital and people 5.00 5.00 5.00 8.00 7.46 7.82 7.87 7.49<br />
(i) Foreign ownership/investment restrictions 7.23 6.84 6.98 5.84<br />
(ii) Capital controls 5.00 5.00 5.00 8.00 7.69 8.46 8.46 8.46<br />
(iii) <strong>Freedom</strong> of foreigners to visit 8.16 8.16 8.16<br />
Area 5. Regulation 6.95 5.67 5.52 5.69 6.15 6.50 6.44 6.49<br />
A. Credit market regulations 8.53 8.46 8.07 8.53 8.52 9.30 8.82 9.15<br />
(i) Ownership of banks 8.00 8.00 8.00 8.00 8.00 10.00 10.00 10.00<br />
(ii) Private sector credit 9.58 9.38 8.22 9.58 8.56 8.91 7.45 7.45<br />
(iii) Interest rate controls/negative real interest rates 8.00 8.00 8.00 8.00 9.00 9.00 9.00 10.00<br />
B. Labor market regulations 4.77 4.66 4.55 4.57<br />
(i) Hiring regulations and minimum wage 4.62 5.60 5.57 5.57<br />
(ii) Hiring and firing regulations 5.25 5.91 5.00 5.18<br />
(iii) Centralized collective bargaining 6.22 6.84 7.10 7.06<br />
(iv) Hours regulations 6.00 6.00 6.00<br />
(v) Mandated cost of worker dismissal 0.64 0.63 0.63<br />
(vi) Conscription 10.00 0.00 0.00 0.00 3.00 3.00 3.00 3.00<br />
C. Business regulations 5.17 5.54 5.96 5.74<br />
(i) Administrative requirements 6.10 3.86 4.30 4.33<br />
(ii) Bureaucracy costs 4.53 4.64 5.68 4.37<br />
(iii) Starting a business 5.12 8.41 8.22 8.19<br />
(iv) Extra payments/bribes/favoritism 4.94 6.00 4.49 4.18<br />
(v) Licensing restrictions 4.16 6.93 7.25<br />
(vi) Cost of tax compliance 6.14 6.14 6.14
Guinea-Bissau<br />
Country Data Tables • 81<br />
1980 1985 1990 1995 2000 2005 2009 2010<br />
Chain-Linked Rating (Rank) Rating (Rank) Rating (Rank) Rating (Rank) Rating (Rank) Rating (Rank) Rating (Rank) Rating (Rank)<br />
Summary Rating (Rank) 3.24 (108) 3.45 (121) 4.43 (120) 5.20 (117) 5.66 (113) 5.66 (113)<br />
Area 1. Size of Government 4.32 (89) 4.95 (89) 4.56 (103) 2.87 (123) 4.25 (114) 4.46 (111)<br />
Area 2. Legal System and Property Rights 1.99 (105) 2.93 (95) 1.94 (117) 2.63 (119) 3.47 (106) 3.59 (108) 3.11 (114)<br />
Area 3. Sound Money 4.07 (100) 1.47 (108) 0.88 (114) 1.82 (115) 3.26 (117) 6.59 (100) 6.26 (112) 6.26 (115)<br />
Area 4. <strong>Freedom</strong> to Trade Internationally 5.87 (90) 6.41 (82) 6.23 (89) 6.17 (96)<br />
Area 5. Regulation 3.77 (102) 3.97 (115) 5.83 (89) 6.76 (64) 8.25 (6) 8.62 (4)<br />
Unadjusted<br />
Summary Rating (Rank) 2.98 (110) 3.32 (121) 4.51 (120) 4.86 (135) 5.23 (135) 5.23 (138)<br />
Rating (Data) Rating (Data) Rating (Data) Rating (Data) Rating (Data) Rating (Data) Rating (Data) Rating (Data)<br />
Area 1. Size of Government 4.32 4.95 4.56 2.87 4.25 4.46<br />
A. Government consumption 7.46 (14.64) 8.65 (10.59) 9.90 (6.33) 9.11 (9.02) 5.74 (20.48) 8.50 (11.10) 8.93 (9.64)<br />
B. Transfers and subsidies<br />
C. Government enterprises and investment<br />
D. Top marginal tax rate<br />
(i) Top marginal income tax rate<br />
(ii) Top marginal income and payroll tax rate<br />
0.00 (91.40) 0.00 (67.60) 0.00 (88.30) 0.00 (54.56) 0.00 (55.61) 0.00 (55.61)<br />
Area 2. Legal System and Property Rights<br />
A. Judicial independence<br />
1.99 2.93 2.54 3.04 3.17 3.28 2.85<br />
B. Impartial courts<br />
C. Protection of property rights<br />
2.70 2.90 3.20 3.10 3.20<br />
D. Military interference in rule of law and politics 3.11 3.33 2.50 1.67 0.83<br />
E. Integrity of the legal system 0.00 1.67 5.00 4.17 4.17<br />
F. Legal enforcement of contracts 3.48 3.48 3.48<br />
G. Regulatory restrictions on sale of real property<br />
H. Reliability of police<br />
I. Business costs of crime<br />
1.67 4.01 2.55<br />
Area 3. Sound Money 5.43 1.96 0.88 1.82 3.26 6.59 6.26 6.26<br />
A. Money growth 0.00 (105.63) 2.67 (36.64) 1.65 (41.76) 9.11 (−4.45) 7.44 (12.79) 7.40 (13.00)<br />
B. Standard deviation of inflation 8.61 (3.48) 2.33 (19.18) 0.00 (28.57) 3.58 (16.06) 3.10 (17.24) 7.93 (5.17) 7.95 (5.14) 8.16 (4.60)<br />
C. Inflation: most recent year 7.67 (11.63) 3.54 (32.31) 3.54 (32.31) 1.05 (44.74) 8.27 (8.64) 9.33 (3.33) 9.67 (−1.65) 9.50 (2.52)<br />
D. <strong>Freedom</strong> to own foreign currency bank accounts 0.00 0.00 0.00 0.00 0.00 0.00 0.00 0.00<br />
Area 4. <strong>Freedom</strong> to Trade Internationally 3.01 5.87 6.35 6.18 6.12<br />
A. Tariffs 4.84 7.60 8.44 7.45 7.45<br />
(i) Revenue from trade taxes (% of trade sector) 4.84 (7.74)<br />
(ii) Mean tariff rate 7.60 (12.00) 7.22 (13.90) 7.62 (11.90) 7.62 (11.90)<br />
(iii) Standard deviation of tariff rates 9.66 (0.84) 7.29 (6.78) 7.29 (6.78)<br />
B. Regulatory trade barriers<br />
(i) Non-tariff trade barriers<br />
6.57 6.86 6.63<br />
(ii) Compliance cost of importing and exporting 6.57 6.86 6.63<br />
C. Black-market exchange rates 4.20 8.20 9.60 10.00 10.00 10.00 10.00<br />
D. Controls of the movement of capital and people<br />
(i) Foreign ownership/investment restrictions<br />
0.00 0.00 5.00 5.00 0.00 0.38 0.38 0.38<br />
(ii) Capital controls 0.00 0.00 5.00 5.00 0.00 0.77 0.77 0.77<br />
(iii) <strong>Freedom</strong> of foreigners to visit 0.00 0.00 0.00<br />
Area 5. Regulation 3.77 3.97 5.83 5.32 6.17 6.45<br />
A. Credit market regulations 3.87 4.46 10.01 9.08 8.93 8.74<br />
(i) Ownership of banks 10.00 10.00 10.00<br />
(ii) Private sector credit 7.75 8.92 10.01 7.23 7.87 7.49<br />
(iii) Interest rate controls/negative real interest rates 0.00 0.00 10.00 10.00<br />
B. Labor market regulations 3.13 3.82 3.32<br />
(i) Hiring regulations and minimum wage<br />
(ii) Hiring and firing regulations<br />
(iii) Centralized collective bargaining<br />
3.30 3.33 3.33<br />
(iv) Hours regulations 7.30 10.00 8.00<br />
(v) Mandated cost of worker dismissal 1.93 1.97 1.97<br />
(vi) Conscription 0.00 0.00 0.00 0.00 0.00 0.00 0.00<br />
C. Business regulations<br />
(i) Administrative requirements<br />
(ii) Bureaucracy costs<br />
3.76 5.77 7.28<br />
(iii) Starting a business<br />
(iv) Extra payments/bribes/favoritism<br />
0.00 3.38 7.88<br />
(v) Licensing restrictions 3.62 6.25 6.28<br />
(vi) Cost of tax compliance 7.67 7.67 7.67<br />
www.freetheworld.com • www.fraserinstitute.org • Fraser Institute ©2012
82 • <strong>Economic</strong> <strong>Freedom</strong> of the <strong>World</strong>: 2012 Annual Report<br />
Guyana<br />
Fraser Institute ©2012 • www.fraserinstitute.org • www.freetheworld.com<br />
1980 1985 1990 1995 2000 2005 2009 2010<br />
Chain-Linked Rating (Rank) Rating (Rank) Rating (Rank) Rating (Rank) Rating (Rank) Rating (Rank) Rating (Rank) Rating (Rank)<br />
Summary Rating (Rank) 5.20 (92) 6.72 (57) 6.36 (85) 6.89 (63) 6.75 (70)<br />
Area 1. Size of Government 3.08 (99) 4.04 (94) 4.38 (97) 3.85 (112) 3.79 (119) 4.81 (108) 4.28 (112)<br />
Area 2. Legal System and Property Rights 2.23 (81) 2.11 (104) 3.41 (86) 5.07 (82) 7.48 (34) 5.36 (74) 6.21 (58) 6.09 (56)<br />
Area 3. Sound Money 5.82 (72) 5.24 (92) 2.19 (110) 4.94 (94) 7.87 (63) 7.72 (75) 7.94 (74) 7.96 (80)<br />
Area 4. <strong>Freedom</strong> to Trade Internationally 7.51 (54) 7.85 (36) 7.92 (34) 7.96 (25)<br />
Area 5. Regulation 5.79 (62) 6.91 (40) 7.16 (41) 7.66 (13) 7.62 (18)<br />
Unadjusted<br />
Summary Rating (Rank) 3.29 (104) 4.98 (97) 6.53 (63) 5.88 (119) 6.37 (100) 6.24 (114)<br />
Rating (Data) Rating (Data) Rating (Data) Rating (Data) Rating (Data) Rating (Data) Rating (Data) Rating (Data)<br />
Area 1. Size of Government 3.48 4.04 4.38 3.85 3.79 4.81 4.28<br />
A. Government consumption 2.82 (30.41) 4.96 (23.14) 7.11 (15.83) 5.64 (20.81) 5.54 (21.15) 3.87 (26.83) 6.94 (16.42) 7.34 (15.04)<br />
B. Transfers and subsidies<br />
C. Government enterprises and investment 2.00 (49.30) 2.00 (47.90) 2.00 (48.90) 0.00 (58.07) 2.00 (41.15) 2.00 (46.17) 0.00 (53.56)<br />
D. Top marginal tax rate 3.00 5.50 6.00 5.50 5.50 5.50<br />
(i) Top marginal income tax rate 3.00 (50) 7.00 (33) 7.00 (33) 7.00 (33) 7.00 (33) 7.00 (33)<br />
(ii) Top marginal income and payroll tax rate 3.00 (50) 4.00 (41) 5.00 (39) 4.00 (41) 4.00 (41) 4.00 (41)<br />
Area 2. Legal System and Property Rights 2.23 2.11 3.41 4.80 6.54 3.91 4.53 4.44<br />
A. Judicial independence 3.01 3.96 3.77<br />
B. Impartial courts 5.31 5.79 2.40 3.32 3.75<br />
C. Protection of property rights 3.95 4.55 4.42<br />
D. Military interference in rule of law and politics 5.79 10.00 6.67 6.67 6.67<br />
E. Integrity of the legal system 4.11 6.67 4.17 2.50 2.50<br />
F. Legal enforcement of contracts 4.55 4.55 4.55<br />
G. Regulatory restrictions on sale of real property 7.85 7.88 7.07<br />
H. Reliability of police 1.47 3.78 3.54<br />
I. Business costs of crime 1.11 3.57 3.69<br />
Area 3. Sound Money 5.82 5.24 2.19 4.94 7.87 7.72 7.94 7.96<br />
A. Money growth 8.55 (7.26) 6.21 (18.95) 1.87 (40.67) 6.98 (15.12) 9.25 (3.74) 8.47 (7.64) 8.59 (7.07) 8.44 (7.79)<br />
B. Standard deviation of inflation 7.07 (7.32) 7.66 (5.86) 0.00 (53.12) 0.00 (48.31) 8.47 (3.83) 8.80 (3.01) 8.77 (3.07) 8.81 (2.97)<br />
C. Inflation: most recent year 7.64 (11.78) 7.10 (14.51) 6.90 (15.51) 7.77 (11.17) 8.77 (6.15) 8.61 (6.93) 9.42 (2.91) 9.58 (2.09)<br />
D. <strong>Freedom</strong> to own foreign currency bank accounts 0.00 0.00 0.00 5.00 5.00 5.00 5.00 5.00<br />
Area 4. <strong>Freedom</strong> to Trade Internationally 2.93 2.34 7.51 6.97 7.04 7.07<br />
A. Tariffs 8.80 7.01 6.60 6.49 6.47 6.47<br />
(i) Revenue from trade taxes (% of trade sector) 8.80 (1.80) 7.41 (3.88)<br />
(ii) Mean tariff rate 6.60 (17.00) 6.60 (17.00) 7.78 (11.10) 7.82 (10.90) 7.82 (10.90)<br />
(iii) Standard deviation of tariff rates 5.20 (11.99) 5.12 (12.21) 5.12 (12.21)<br />
B. Regulatory trade barriers 6.38 6.47 6.56<br />
(i) Non-tariff trade barriers 5.99 5.73 5.49<br />
(ii) Compliance cost of importing and exporting 6.78 7.20 7.63<br />
C. Black-market exchange rates 0.00 0.00 8.20 9.20 9.00 9.49 10.00 10.00<br />
D. Controls of the movement of capital and people 0.00 0.00 5.00 5.00 6.92 5.50 5.21 5.26<br />
(i) Foreign ownership/investment restrictions 5.85 5.22 5.36<br />
(ii) Capital controls 0.00 0.00 5.00 5.00 6.92 6.92 6.67 6.67<br />
(iii) <strong>Freedom</strong> of foreigners to visit 3.74 3.74 3.74<br />
Area 5. Regulation 5.79 6.91 7.02 7.51 7.46<br />
A. Credit market regulations 3.02 2.38 4.61 4.90 8.21 8.21 8.42 8.43<br />
(i) Ownership of banks 10.00 10.00 10.00<br />
(ii) Private sector credit 3.02 2.38 4.61 5.80 7.42 5.62 6.27 6.29<br />
(iii) Interest rate controls/negative real interest rates 4.00 9.00 9.00 9.00 9.00<br />
B. Labor market regulations 7.12 7.82 8.05<br />
(i) Hiring regulations and minimum wage 6.70 8.90 10.00<br />
(ii) Hiring and firing regulations 6.00 6.08 6.31<br />
(iii) Centralized collective bargaining 6.50 6.76 6.79<br />
(iv) Hours regulations 8.70 10.00 10.00<br />
(v) Mandated cost of worker dismissal 4.81 5.18 5.18<br />
(vi) Conscription 10.00 10.00 10.00 10.00 10.00 10.00<br />
C. Business regulations 5.73 6.27 5.92<br />
(i) Administrative requirements 2.54 4.21 4.29<br />
(ii) Bureaucracy costs 5.21 5.62 3.89<br />
(iii) Starting a business 7.47 8.84 9.01<br />
(iv) Extra payments/bribes/favoritism 4.26 3.67 3.54<br />
(v) Licensing restrictions 8.11 8.51 7.71<br />
(vi) Cost of tax compliance 6.77 6.77 7.05
Haiti<br />
Country Data Tables • 83<br />
1980 1985 1990 1995 2000 2005 2009 2010<br />
Chain-Linked Rating (Rank) Rating (Rank) Rating (Rank) Rating (Rank) Rating (Rank) Rating (Rank) Rating (Rank) Rating (Rank)<br />
Summary Rating (Rank) 6.51 (18) 5.76 (40) 5.61 (53) 5.59 (78) 6.89 (49) 6.77 (70) 6.99 (60) 6.83 (68)<br />
Area 1. Size of Government 9.13 (4) 5.66 (35) 6.37 (34) 6.49 (43) 8.34 (9) 9.20 (2) 8.79 (4) 8.77 (5)<br />
Area 2. Legal System and Property Rights 2.23 (82) 2.93 (94) 1.95 (108) 3.88 (106) 3.78 (103) 2.46 (119) 2.34 (121) 2.04 (121)<br />
Area 3. Sound Money 7.70 (24) 8.92 (17) 8.46 (26) 6.34 (68) 8.37 (49) 7.99 (69) 8.65 (57) 8.03 (75)<br />
Area 4. <strong>Freedom</strong> to Trade Internationally 6.67 (75) 7.33 (53) 7.72 (42) 8.51 (8)<br />
Area 5. Regulation 5.82 (50) 5.83 (60) 7.32 (22) 6.74 (67) 7.27 (32) 6.79 (68)<br />
Unadjusted<br />
Summary Rating (Rank) 5.38 (50) 5.01 (67) 4.99 (79) 5.50 (79) 6.91 (45) 6.72 (76) 6.94 (68) 6.50 (97)<br />
Rating (Data) Rating (Data) Rating (Data) Rating (Data) Rating (Data) Rating (Data) Rating (Data) Rating (Data)<br />
Area 1. Size of Government 8.27 6.14 6.85 5.88 8.34 8.90 8.51 8.48<br />
A. Government consumption 8.54 (10.96) 8.26 (11.92) 9.54 (7.58) 9.76 (6.82) 5.10 (22.65) 9.69 (7.05) 9.10 (9.05) 9.01 (9.35)<br />
B. Transfers and subsidies 8.15 (7.30) 9.92 (0.81) 9.92 (0.81) 9.92 (0.81) 9.92 (0.81)<br />
C. Government enterprises and investment 8.00 (19.00) 2.00 (48.80) 2.00 (42.00) 2.00 (47.00) 10.00 (11.50) 8.00 (18.70) 7.00 (24.90) 7.00 (24.90)<br />
D. Top marginal tax rate 9.00 8.00 8.00 8.00<br />
(i) Top marginal income tax rate 9.00 (30) 8.00 (30) 8.00 (30) 8.00 (30)<br />
(ii) Top marginal income and payroll tax rate<br />
Area 2. Legal System and Property Rights 2.23 2.93 1.95 3.94 3.86 2.66 2.54 2.12<br />
A. Judicial independence 1.23<br />
B. Impartial courts 2.91 2.99 2.70 3.20 1.83<br />
C. Protection of property rights 1.96<br />
D. Military interference in rule of law and politics 1.76 5.00 0.00 0.00 0.00<br />
E. Integrity of the legal system 6.96 3.33 3.75 2.50 2.50<br />
F. Legal enforcement of contracts 4.05 4.05 3.88<br />
G. Regulatory restrictions on sale of real property 2.80 2.93 2.83<br />
H. Reliability of police 2.26<br />
I. Business costs of crime 2.64<br />
Area 3. Sound Money 7.70 8.92 8.46 6.34 8.37 7.99 8.65 8.03<br />
A. Money growth 8.40 (7.99) 9.02 (4.91) 8.94 (5.30) 5.26 (23.72) 7.87 (10.67) 7.07 (14.63) 7.42 (12.91) 6.46 (17.68)<br />
B. Standard deviation of inflation 6.67 (8.33) 8.75 (3.13) 7.00 (7.50) 6.32 (9.19) 8.38 (4.06) 8.05 (4.88) 7.18 (7.05) 6.78 (8.05)<br />
C. Inflation: most recent year 5.72 (21.39) 7.92 (10.41) 7.92 (10.41) 3.80 (31.00) 7.26 (13.71) 6.85 (15.73) 10.00 (−0.01) 8.86 (5.70)<br />
D. <strong>Freedom</strong> to own foreign currency bank accounts 10.00 10.00 10.00 10.00 10.00 10.00 10.00 10.00<br />
Area 4. <strong>Freedom</strong> to Trade Internationally 3.31 2.06 1.84 6.67 6.69 7.05 7.17<br />
A. Tariffs 3.93 6.17 5.53 8.00 8.81 8.79 8.40<br />
(i) Revenue from trade taxes (% of trade sector) 3.40 (9.90) 4.67 (8.00) 5.53 (6.70)<br />
(ii) Mean tariff rate 4.46 (27.70) 7.68 (11.60) 8.00 (10.00) 9.44 (2.80) 9.44 (2.80) 9.06 (4.70)<br />
(iii) Standard deviation of tariff rates 8.17 (4.56) 8.14 (4.65) 7.74 (5.64)<br />
B. Regulatory trade barriers 3.42 5.17 6.11<br />
(i) Non-tariff trade barriers 4.15<br />
(ii) Compliance cost of importing and exporting 3.42 5.17 8.06<br />
C. Black-market exchange rates 6.00 0.00 0.00 0.60 10.00 10.00 10.00 10.00<br />
D. Controls of the movement of capital and people 0.00 0.00 0.00 2.00 2.00 4.55 4.23 4.18<br />
(i) Foreign ownership/investment restrictions 3.32<br />
(ii) Capital controls 0.00 0.00 0.00 2.00 2.00 9.09 8.46 9.23<br />
(iii) <strong>Freedom</strong> of foreigners to visit 0.00 0.00 0.00<br />
Area 5. Regulation 5.82 5.83 7.32 7.36 7.94 6.72<br />
A. Credit market regulations 10.00 9.71 4.97 4.99 9.44 8.30 8.56 8.17<br />
(i) Ownership of banks<br />
(ii) Private sector credit 10.00 9.71 9.94 9.99 9.88 8.61 9.12 8.33<br />
(iii) Interest rate controls/negative real interest rates 0.00 0.00 9.00 8.00 8.00 8.00<br />
B. Labor market regulations 8.56 9.73 8.20<br />
(i) Hiring regulations and minimum wage 7.80 8.90 6.67<br />
(ii) Hiring and firing regulations 5.09<br />
(iii) Centralized collective bargaining 7.46<br />
(iv) Hours regulations 8.00 10.00 10.00<br />
(v) Mandated cost of worker dismissal 8.42 10.00 10.00<br />
(vi) Conscription 10.00 10.00 10.00 10.00 10.00 10.00 10.00 10.00<br />
C. Business regulations 5.23 5.54 3.78<br />
(i) Administrative requirements 2.70<br />
(ii) Bureaucracy costs 2.65<br />
(iii) Starting a business 3.91 4.37 3.29<br />
(iv) Extra payments/bribes/favoritism 2.49<br />
(v) Licensing restrictions 3.57 4.05 3.62<br />
(vi) Cost of tax compliance 8.21 8.21 7.94<br />
www.freetheworld.com • www.fraserinstitute.org • Fraser Institute ©2012
84 • <strong>Economic</strong> <strong>Freedom</strong> of the <strong>World</strong>: 2012 Annual Report<br />
Honduras 1980 1985 1990 1995 2000 2005 2009 2010<br />
Chain-Linked Rating (Rank) Rating (Rank) Rating (Rank) Rating (Rank) Rating (Rank) Rating (Rank) Rating (Rank) Rating (Rank)<br />
Summary Rating (Rank) 5.97 (29) 5.38 (50) 5.45 (62) 6.26 (59) 6.68 (62) 6.86 (66) 6.96 (61) 7.03 (57)<br />
Area 1. Size of Government 8.52 (5) 5.48 (40) 6.38 (33) 6.51 (42) 8.12 (10) 8.46 (13) 8.11 (13) 8.21 (12)<br />
Area 2. Legal System and Property Rights 2.46 (74) 2.73 (95) 3.13 (88) 4.87 (88) 3.58 (109) 3.70 (103) 4.12 (98) 4.30 (95)<br />
Area 3. Sound Money 8.76 (11) 9.51 (5) 8.38 (28) 7.17 (51) 8.22 (53) 8.85 (45) 9.24 (38) 9.35 (35)<br />
Area 4. <strong>Freedom</strong> to Trade Internationally 4.91 (61) 6.99 (56) 6.94 (70) 6.93 (69) 7.00 (68) 6.96 (70)<br />
Area 5. Regulation 5.55 (48) 4.53 (83) 4.55 (94) 5.61 (73) 6.55 (49) 6.41 (81) 6.36 (89) 6.38 (90)<br />
Unadjusted<br />
Summary Rating (Rank) 5.47 (49) 5.77 (38) 5.74 (50) 6.50 (47) 6.71 (57) 7.07 (57) 7.17 (51) 7.24 (52)<br />
Fraser Institute ©2012 • www.fraserinstitute.org • www.freetheworld.com<br />
Rating (Data) Rating (Data) Rating (Data) Rating (Data) Rating (Data) Rating (Data) Rating (Data) Rating (Data)<br />
Area 1. Size of Government 6.43 5.48 6.38 6.51 8.12 8.46 8.11 8.21<br />
A. Government consumption 7.28 (15.25) 7.40 (14.83) 7.00 (16.21) 8.00 (12.80) 7.43 (14.75) 7.32 (15.11) 5.95 (19.76) 6.34 (18.44)<br />
B. Transfers and subsidies 9.51 (2.30) 9.54 (2.20) 9.05 (4.00) 9.05 (4.00) 10.00 (0.47) 10.00 (0.35) 10.00 (0.30)<br />
C. Government enterprises and investment 4.00 (37.90) 0.00 (52.40) 4.00 (32.50) 2.00 (41.80) 7.00 (21.30) 8.00 (17.90) 8.00 (15.54) 8.00 (16.89)<br />
D. Top marginal tax rate 8.00 5.00 5.00 7.00 9.00 8.50 8.50 8.50<br />
(i) Top marginal income tax rate 8.00 (40) 5.00 (46) 5.00 (46) 7.00 (40) 9.00 (25) 9.00 (25) 9.00 (25) 9.00 (25)<br />
(ii) Top marginal income and payroll tax rate 5.00 (46) 7.00 (40) 9.00 (25) 8.00 (28) 8.00 (28) 8.00 (28)<br />
Area 2. Legal System and Property Rights 2.76 3.05 3.50 5.07 3.72 3.69 4.11 4.29<br />
A. Judicial independence 2.44 3.53 4.33<br />
B. Impartial courts 3.98 3.68 3.02 3.86 4.06<br />
C. Protection of property rights 2.30 4.15 4.70 4.55<br />
D. Military interference in rule of law and politics 5.42 5.00 5.56 5.00 5.83<br />
E. Integrity of the legal system 6.96 3.33 2.50 2.50 2.50<br />
F. Legal enforcement of contracts 2.86 2.86 2.86<br />
G. Regulatory restrictions on sale of real property 7.41 7.76 7.69<br />
H. Reliability of police 3.44 4.02 2.44<br />
I. Business costs of crime 1.87 2.79 4.34<br />
Area 3. Sound Money 8.76 9.51 8.38 7.17 8.22 8.85 9.24 9.35<br />
A. Money growth 8.89 (5.56) 9.67 (1.66) 7.23 (13.85) 7.09 (14.57) 7.66 (11.70) 7.74 (11.28) 9.12 (4.41) 9.20 (4.02)<br />
B. Standard deviation of inflation 8.81 (2.97) 9.42 (1.45) 7.34 (6.64) 6.88 (7.81) 7.42 (6.44) 9.41 (1.49) 8.93 (2.69) 9.15 (2.12)<br />
C. Inflation: most recent year 7.35 (13.27) 8.95 (5.25) 8.95 (5.25) 4.73 (26.34) 7.79 (11.06) 8.24 (8.81) 8.90 (5.49) 9.06 (4.70)<br />
D. <strong>Freedom</strong> to own foreign currency bank accounts 10.00 10.00 10.00 10.00 10.00 10.00 10.00 10.00<br />
Area 4. <strong>Freedom</strong> to Trade Internationally 3.22 5.33 7.50 6.94 7.56 7.64 7.60<br />
A. Tariffs 3.67 6.00 7.69 7.83 8.52 8.45 8.44<br />
(i) Revenue from trade taxes (% of trade sector) 5.53 (6.70) 8.07 (2.90) 9.42 (0.87) 9.42 (0.87) 9.39 (0.92)<br />
(ii) Mean tariff rate 1.80 (41.00) 6.00 (20.00) 7.98 (10.10) 8.42 (7.90) 8.66 (6.70) 8.90 (5.50) 8.90 (5.50)<br />
(iii) Standard deviation of tariff rates 7.40 (6.50) 7.00 (7.50) 7.49 (6.27) 7.04 (7.39) 7.04 (7.39)<br />
B. Regulatory trade barriers 3.35 5.76 6.43 6.51<br />
(i) Non-tariff trade barriers 3.35 4.47 5.72 5.39<br />
(ii) Compliance cost of importing and exporting 7.05 7.14 7.63<br />
C. Black-market exchange rates 6.00 0.00 10.00 9.80 10.00 10.00 10.00 10.00<br />
D. Controls of the movement of capital and people 0.00 0.00 0.00 5.00 6.57 5.97 5.68 5.44<br />
(i) Foreign ownership/investment restrictions 8.53 6.23 6.15 6.18<br />
(ii) Capital controls 0.00 0.00 0.00 5.00 4.61 3.85 3.08 2.31<br />
(iii) <strong>Freedom</strong> of foreigners to visit 7.82 7.82 7.82<br />
Area 5. Regulation 6.20 5.06 5.08 6.26 6.55 6.81 6.75 6.77<br />
A. Credit market regulations 6.10 7.70 7.77 6.30 9.43 9.89 8.72 9.04<br />
(i) Ownership of banks 10.00 10.00 10.00<br />
(ii) Private sector credit 8.20 7.41 7.54 8.60 9.86 9.68 7.17 8.11<br />
(iii) Interest rate controls/negative real interest rates 4.00 8.00 8.00 4.00 9.00 10.00 9.00 9.00<br />
B. Labor market regulations 5.72 5.42 5.00 4.98<br />
(i) Hiring regulations and minimum wage 2.72 0.00 0.00 0.00<br />
(ii) Hiring and firing regulations 4.50 5.10 4.24 4.14<br />
(iii) Centralized collective bargaining 5.67 6.27 5.80 5.77<br />
(iv) Hours regulations 8.00 8.00 8.00<br />
(v) Mandated cost of worker dismissal 3.14 1.97 1.97<br />
(vi) Conscription 10.00 0.00 0.00 10.00 10.00 10.00 10.00 10.00<br />
C. Business regulations 4.49 5.11 6.52 6.29<br />
(i) Administrative requirements 5.80 3.00 4.43 4.10<br />
(ii) Bureaucracy costs 4.88 3.25 5.91 4.24<br />
(iii) Starting a business 2.85 7.86 9.00 9.01<br />
(iv) Extra payments/bribes/favoritism 4.42 4.57 3.93 4.10<br />
(v) Licensing restrictions 6.72 8.34 8.83<br />
(vi) Cost of tax compliance 5.25 7.49 7.49
Country Data Tables • 85<br />
Hong Kong 1980 1985 1990 1995 2000 2005 2009 2010<br />
Chain-Linked Rating (Rank) Rating (Rank) Rating (Rank) Rating (Rank) Rating (Rank) Rating (Rank) Rating (Rank) Rating (Rank)<br />
Summary Rating (Rank) 9.02 (1) 8.63 (1) 8.59 (1) 9.14 (1) 8.86 (1) 8.93 (1) 8.95 (1) 8.80 (1)<br />
Area 1. Size of Government 9.75 (2) 8.89 (1) 9.31 (1) 9.47 (1) 9.35 (1) 9.08 (3) 9.35 (1) 8.89 (3)<br />
Area 2. Legal System and Property Rights 8.13 (4) 6.31 (29) 5.94 (40) 8.17 (19) 7.23 (37) 7.99 (20) 8.14 (20) 7.97 (23)<br />
Area 3. Sound Money 8.51 (12) 9.33 (13) 9.02 (19) 9.44 (26) 9.11 (36) 9.48 (26) 9.28 (34) 9.31 (37)<br />
Area 4. <strong>Freedom</strong> to Trade Internationally 9.69 (1) 9.68 (1) 9.70 (1) 9.71 (1) 9.72 (1) 9.41 (1) 9.27 (1) 8.92 (1)<br />
Area 5. Regulation 8.99 (1) 8.99 (1) 8.99 (1) 8.96 (1) 8.89 (1) 8.68 (1) 8.72 (1) 8.89 (1)<br />
Unadjusted<br />
Summary Rating (Rank) 8.72 (1) 8.34 (2) 8.73 (1) 9.11 (1) 8.86 (1) 9.03 (1) 9.05 (1) 8.90 (1)<br />
Rating (Data) Rating (Data) Rating (Data) Rating (Data) Rating (Data) Rating (Data) Rating (Data) Rating (Data)<br />
Area 1. Size of Government 9.75 8.89 9.31 9.47 9.35 9.08 9.35 8.89<br />
A. Government consumption 9.02 (9.34) 8.66 (10.57) 8.36 (11.58) 8.03 (12.70) 7.58 (14.22) 7.92 (13.07) 8.10 (12.45) 8.25 (11.94)<br />
B. Transfers and subsidies 9.97 (0.60) 9.89 (0.90) 9.89 (0.90) 9.84 (1.10) 9.84 (1.10) 8.41 (6.34) 9.31 (3.02) 9.31 (3.02)<br />
C. Government enterprises and investment 10.00 (14.80) 8.00 (15.20) 10.00 (12.70) 10.00 (14.00) 10.00 (14.00) 10.00 (1.38) 10.00 (12.70) 8.00 (15.40)<br />
D. Top marginal tax rate 10.00 9.00 9.00 10.00 10.00 10.00 10.00 10.00<br />
(i) Top marginal income tax rate 10.00 (15) 9.00 (25c) 9.00 (25) 10.00 (20) 10.00 (17) 10.00 (20) 10.00 (17) 10.00 (17)<br />
(ii) Top marginal income and payroll tax rate 9.00 (25) 10.00 (20) 10.00 (17) 10.00 (20) 10.00 (17) 10.00 (17)<br />
Area 2. Legal System and Property Rights 8.13 6.31 5.94 8.17 7.23 8.20 8.36 8.18<br />
A. Judicial independence 8.07 7.68 8.17 8.58 8.47<br />
B. Impartial courts 7.93 8.85 8.31 8.23 7.70<br />
C. Protection of property rights 6.07 6.30 8.73 8.82 8.54<br />
D. Military interference in rule of law and politics 8.76 5.00 8.33 8.33 8.33<br />
E. Integrity of the legal system 10.00 8.33 7.71 8.33 8.33<br />
F. Legal enforcement of contracts 7.69 7.17 7.07<br />
G. Regulatory restrictions on sale of real property 7.34 7.94 7.97<br />
H. Reliability of police 8.59 8.88 8.51<br />
I. Business costs of crime 8.94 8.94 8.71<br />
Area 3. Sound Money 8.51 9.33 9.02 9.44 9.11 9.48 9.28 9.31<br />
A. Money growth 9.04 (4.80) 9.48 (2.60) 8.36 (8.20) 9.33 (3.37) 9.46 (−2.71) 8.98 (5.08) 7.75 (11.25) 8.21 (8.97)<br />
B. Standard deviation of inflation 7.99 (5.03) 8.97 (2.57) 8.86 (2.85) 8.96 (2.59) 7.73 (5.68) 9.10 (2.25) 9.47 (1.32) 9.50 (1.24)<br />
C. Inflation: most recent year 7.01 (14.96) 8.86 (5.71) 8.86 (5.71) 9.49 (2.56) 9.25 (−3.76) 9.82 (0.91) 9.89 (0.55) 9.53 (2.34)<br />
D. <strong>Freedom</strong> to own foreign currency bank accounts 10.00 10.00 10.00 10.00 10.00 10.00 10.00 10.00<br />
Area 4. <strong>Freedom</strong> to Trade Internationally 9.94 9.93 9.97 9.60 9.72 9.52 9.37 9.02<br />
A. Tariffs 9.83 9.80 9.91 9.93 9.93 10.00 10.00 10.00<br />
(i) Revenue from trade taxes (% of trade sector) 9.67 (0.50) 9.60 (0.60) 9.73 (0.40) 9.80 (0.30) 9.80 (0.30) 10.00 (0.00) 9.99 (0.02) 9.99 (0.02)<br />
(ii) Mean tariff rate 10.00 (0.00) 10.00 (0.00) 10.00 (0.00) 10.00 (0.00) 10.00 (0.00) 10.00 (0.00) 10.00 (0.00) 10.00 (0.00)<br />
(iii) Standard deviation of tariff rates 10.00 (0.00) 10.00 (0.00) 10.00 (0.00) 10.00 (0.00) 10.00 (0.00) 10.00 (0.00)<br />
B. Regulatory trade barriers 8.75 9.38 8.94 9.12 7.47<br />
(i) Non-tariff trade barriers 8.75 8.94 8.60 8.89 8.25<br />
(ii) Compliance cost of importing and exporting 9.83 9.29 9.35 6.69<br />
C. Black-market exchange rates 10.00 10.00 10.00 10.00 10.00 10.00 10.00 10.00<br />
D. Controls of the movement of capital and people 10.00 10.00 10.00 9.70 9.57 9.14 8.37 8.63<br />
(i) Foreign ownership/investment restrictions 9.40 9.92 8.96 8.96 8.19<br />
(ii) Capital controls 10.00 10.00 10.00 10.00 9.23 8.46 6.15 7.69<br />
(iii) <strong>Freedom</strong> of foreigners to visit 10.00 10.00 10.00<br />
Area 5. Regulation 7.25 7.25 9.43 8.89 8.89 8.86 8.90 9.08<br />
A. Credit market regulations 10.00 10.00 9.94 9.89 9.70 9.63 9.31 9.37<br />
(i) Ownership of banks 10.00 10.00 10.00 10.00 10.00 10.00 10.00 10.00<br />
(ii) Private sector credit 9.82 9.68 9.10 8.89 7.93 8.11<br />
(iii) Interest rate controls/negative real interest rates 10.00 10.00 10.00 10.00 10.00 10.00 10.00 10.00<br />
B. Labor market regulations 8.92 8.14 8.55 9.15 9.46 9.28<br />
(i) Hiring regulations and minimum wage 7.40 10.00 10.00 10.00<br />
(ii) Hiring and firing regulations 8.83 8.83 7.55 6.90 8.28 7.78<br />
(iii) Centralized collective bargaining 7.93 7.93 7.93 7.94 8.99 8.90 9.00 8.46<br />
(iv) Hours regulations 6.53 7.68 10.00 10.00 10.00<br />
(v) Mandated cost of worker dismissal 9.07 9.46 9.46<br />
(vi) Conscription 10.00 10.00 10.00 10.00 10.00 10.00 10.00 10.00<br />
C. Business regulations 8.63 8.40 7.80 7.94 8.57<br />
(i) Administrative requirements 8.54 6.38 6.91 6.70<br />
(ii) Bureaucracy costs 9.55 7.25 4.57 3.21 7.84<br />
(iii) Starting a business 9.08 9.02 9.61 9.79 9.88<br />
(iv) Extra payments/bribes/favoritism 7.27 8.81 8.80 8.86 8.09<br />
(v) Licensing restrictions 8.35 9.79 9.79<br />
(vi) Cost of tax compliance 9.10 9.10 9.10<br />
www.freetheworld.com • www.fraserinstitute.org • Fraser Institute ©2012
86 • <strong>Economic</strong> <strong>Freedom</strong> of the <strong>World</strong>: 2012 Annual Report<br />
Hungary 1980 1985 1990 1995 2000 2005 2009 2010<br />
Chain-Linked Rating (Rank) Rating (Rank) Rating (Rank) Rating (Rank) Rating (Rank) Rating (Rank) Rating (Rank) Rating (Rank)<br />
Summary Rating (Rank) 3.94 (86) 4.67 (80) 5.04 (79) 6.19 (60) 6.56 (65) 7.23 (47) 7.19 (44) 7.10 (52)<br />
Area 1. Size of Government 2.58 (99) 2.64 (104) 2.94 (109) 3.73 (108) 3.85 (111) 4.64 (107) 4.51 (112) 3.94 (116)<br />
Area 2. Legal System and Property Rights 6.78 (20) 7.25 (23) 7.60 (26) 7.01 (39) 6.89 (41) 6.61 (48) 6.56 (47)<br />
Area 3. Sound Money 6.48 (41) 6.82 (43) 5.75 (81) 6.24 (70) 7.16 (74) 9.44 (30) 9.53 (21) 9.60 (17)<br />
Area 4. <strong>Freedom</strong> to Trade Internationally 2.31 (73) 2.61 (75) 4.22 (72) 7.62 (41) 7.59 (52) 7.92 (30) 7.90 (36) 7.86 (29)<br />
Area 5. Regulation 4.13 (87) 4.27 (88) 4.88 (83) 5.74 (67) 7.18 (32) 7.29 (31) 7.43 (23) 7.60 (21)<br />
Unadjusted<br />
Summary Rating (Rank) 4.07 (85) 4.48 (87) 4.89 (82) 6.16 (59) 6.56 (61) 7.21 (52) 7.17 (51) 7.08 (64)<br />
Fraser Institute ©2012 • www.fraserinstitute.org • www.freetheworld.com<br />
Rating (Data) Rating (Data) Rating (Data) Rating (Data) Rating (Data) Rating (Data) Rating (Data) Rating (Data)<br />
Area 1. Size of Government 3.77 2.92 2.94 3.73 3.85 4.64 4.51 3.94<br />
A. Government consumption 7.53 (14.40) 7.69 (13.87) 7.43 (14.75) 7.58 (14.23) 7.86 (13.27) 3.19 (29.15) 3.13 (29.36) 3.21 (29.07)<br />
B. Transfers and subsidies 1.06 (33.30) 2.32 (28.70) 3.32 (25.00) 5.04 (18.71) 4.86 (19.36) 4.40 (21.06) 4.55 (20.52)<br />
C. Government enterprises and investment 0.00 (92.60) 0.00 (83.50) 0.00 (68.50) 0.00 (68.50) 0.00 (68.50) 8.00 (17.23) 8.00 (15.54) 4.00 (35.11)<br />
D. Top marginal tax rate 2.00 4.00 2.50 2.50 2.50 4.00<br />
(i) Top marginal income tax rate 3.00 (50) 4.00 (44) 5.00 (40) 5.00 (38) 5.00 (40) 7.00 (32)<br />
(ii) Top marginal income and payroll tax rate 1.00 (60) 4.00 (44) 0.00 (62) 0.00 (64) 0.00 (63) 1.00 (56)<br />
Area 2. Legal System and Property Rights 6.78 7.25 7.60 7.01 6.66 6.39 6.34<br />
A. Judicial independence 6.68 6.51 5.38 5.06 4.87<br />
B. Impartial courts 6.77 6.35 5.36 3.45 3.42<br />
C. Protection of property rights 4.93 5.53 7.44 5.59 5.54<br />
D. Military interference in rule of law and politics 9.62 10.00 10.00 10.00 10.00<br />
E. Integrity of the legal system 10.00 6.67 6.67 6.67 6.67<br />
F. Legal enforcement of contracts 7.15 6.58 6.58<br />
G. Regulatory restrictions on sale of real property 4.91 8.04 8.04<br />
H. Reliability of police 5.94 5.38 6.52<br />
I. Business costs of crime 7.07 6.71 5.41<br />
Area 3. Sound Money 6.48 6.82 5.75 6.24 7.16 9.44 9.53 9.60<br />
A. Money growth 8.26 (8.70) 8.66 (6.70) 7.33 (13.34) 7.67 (11.67) 7.62 (11.91) 9.49 (2.55) 9.49 (2.54) 9.76 (1.19)<br />
B. Standard deviation of inflation 8.87 (2.82) 9.80 (0.50) 6.87 (7.83) 7.64 (5.90) 7.97 (5.08) 8.98 (2.54) 9.49 (1.28) 9.60 (1.01)<br />
C. Inflation: most recent year 8.79 (6.03) 8.82 (5.91) 8.82 (5.91) 4.65 (26.73) 8.04 (9.80) 9.29 (3.55) 9.16 (4.21) 9.02 (4.88)<br />
D. <strong>Freedom</strong> to own foreign currency bank accounts 0.00 0.00 0.00 5.00 5.00 10.00 10.00 10.00<br />
Area 4. <strong>Freedom</strong> to Trade Internationally 2.22 2.51 3.90 7.55 7.59 7.98 7.96 7.92<br />
A. Tariffs 6.67 7.53 6.09 6.67 7.31 8.39 8.22 8.34<br />
(i) Revenue from trade taxes (% of trade sector) 6.67 (5.00) 7.53 (3.70) 6.57 (5.14) 6.09 (5.86) 9.45 (0.83) 9.59 (0.62) 9.44 (0.84) 9.63 (0.55)<br />
(ii) Mean tariff rate 7.80 (11.00) 8.36 (8.20) 9.46 (2.70) 8.94 (5.30) 8.98 (5.10)<br />
(iii) Standard deviation of tariff rates 5.60 (11.00) 6.12 (9.70) 4.12 (14.70) 6.13 (9.67) 6.29 (9.28) 6.41 (8.98)<br />
B. Regulatory trade barriers 7.13 8.52 7.45 7.65 7.50<br />
(i) Non-tariff trade barriers 7.13 8.20 7.30 7.71 7.62<br />
(ii) Compliance cost of importing and exporting 8.83 7.59 7.59 7.38<br />
C. Black-market exchange rates 0.00 0.00 5.60 10.00 10.00 10.00 10.00 10.00<br />
D. Controls of the movement of capital and people 0.00 0.00 0.00 6.38 4.53 6.10 5.98 5.86<br />
(i) Foreign ownership/investment restrictions 7.76 8.29 7.86 7.53 7.16<br />
(ii) Capital controls 0.00 0.00 0.00 5.00 0.77 3.85 3.85 3.85<br />
(iii) <strong>Freedom</strong> of foreigners to visit 6.58 6.58 6.58<br />
Area 5. Regulation 3.82 3.37 4.61 5.71 7.18 7.31 7.46 7.62<br />
A. Credit market regulations 3.56 2.66 4.40 6.43 8.87 8.64 9.28 9.28<br />
(i) Ownership of banks 0.00 0.00 2.00 8.00 8.00 10.00 10.00 10.00<br />
(ii) Private sector credit 4.68 5.33 5.21 5.28 8.62 5.92 7.85 7.85<br />
(iii) Interest rate controls/negative real interest rates 6.00 6.00 6.00 10.00 10.00 10.00 10.00<br />
B. Labor market regulations 5.41 5.59 6.84 7.31 7.32<br />
(i) Hiring regulations and minimum wage 6.67 4.65 8.90 7.23 7.23<br />
(ii) Hiring and firing regulations 7.07 7.07 5.50 4.62 5.14 5.29<br />
(iii) Centralized collective bargaining 5.18 6.97 7.49 7.51 7.38<br />
(iv) Hours regulations 5.15 5.85 3.30 6.00 6.00<br />
(v) Mandated cost of worker dismissal 6.76 7.99 7.99<br />
(vi) Conscription 0.00 0.00 1.00 3.00 5.00 10.00 10.00 10.00<br />
C. Business regulations 5.29 7.08 6.46 5.78 6.27<br />
(i) Administrative requirements 7.42 3.03 2.00 2.23<br />
(ii) Bureaucracy costs 6.14 6.18 6.58 3.12 4.67<br />
(iii) Starting a business 6.40 7.37 8.32 9.75 9.76<br />
(iv) Extra payments/bribes/favoritism 3.32 7.35 7.27 5.07 4.84<br />
(v) Licensing restrictions 7.36 7.82 9.25<br />
(vi) Cost of tax compliance 6.19 6.90 6.90
Iceland<br />
Country Data Tables • 87<br />
1980 1985 1990 1995 2000 2005 2009 2010<br />
Chain-Linked Rating (Rank) Rating (Rank) Rating (Rank) Rating (Rank) Rating (Rank) Rating (Rank) Rating (Rank) Rating (Rank)<br />
Summary Rating (Rank) 5.25 (54) 5.53 (47) 6.95 (24) 7.69 (13) 8.04 (11) 8.09 (10) 7.02 (59) 7.02 (59)<br />
Area 1. Size of Government 5.02 (52) 5.24 (48) 5.91 (47) 5.60 (78) 6.07 (69) 6.90 (52) 5.01 (100) 4.83 (107)<br />
Area 2. Legal System and Property Rights 6.83 (21) 7.88 (12) 8.35 (13) 8.30 (18) 9.03 (12) 9.27 (4) 8.65 (15) 8.53 (15)<br />
Area 3. Sound Money 2.62 (101) 2.84 (104) 7.08 (40) 9.45 (25) 9.18 (34) 8.75 (53) 7.80 (78) 8.42 (66)<br />
Area 4. <strong>Freedom</strong> to Trade Internationally 5.65 (39) 5.49 (43) 6.72 (37) 8.00 (30) 8.24 (36) 7.00 (67) 6.43 (85) 6.19 (95)<br />
Area 5. Regulation 6.34 (27) 6.35 (33) 6.72 (26) 7.16 (17) 7.69 (10) 8.54 (4) 7.21 (34) 7.16 (41)<br />
Unadjusted<br />
Summary Rating (Rank) 5.15 (57) 5.42 (52) 6.92 (25) 7.73 (13) 8.04 (11) 8.13 (9) 7.06 (62) 7.06 (65)<br />
Rating (Data) Rating (Data) Rating (Data) Rating (Data) Rating (Data) Rating (Data) Rating (Data) Rating (Data)<br />
Area 1. Size of Government 5.12 5.35 6.03 5.72 6.07 6.90 5.01 4.83<br />
A. Government consumption 5.23 (22.21) 5.45 (21.48) 4.74 (23.87) 4.22 (25.65) 3.44 (28.31) 3.22 (29.04) 1.72 (34.15) 1.88 (33.60)<br />
B. Transfers and subsidies 7.25 (10.60) 6.95 (11.70) 7.38 (10.10) 7.65 (9.12) 8.34 (6.60) 7.86 (8.35) 7.32 (10.35) 7.42 (9.95)<br />
C. Government enterprises and investment 8.00 (15.30) 8.00 (16.10) 7.00 (22.20) 7.00 (24.80) 7.00 (24.80) 10.00 (10.92) 7.00 (24.96) 7.00 (20.00)<br />
D. Top marginal tax rate 0.00 1.00 5.00 4.00 5.50 6.50 4.00 3.00<br />
(i) Top marginal income tax rate 0.00 (63) 1.00 (56) 5.00 (40) 4.00 (47) 6.00 (45) 7.00 (39) 5.00 (40) 4.00 (46)<br />
(ii) Top marginal income and payroll tax rate 5.00 (48) 6.00 (42) 3.00 (50) 2.00 (56)<br />
Area 2. Legal System and Property Rights 6.83 7.88 8.35 8.30 9.03 9.05 8.45 8.33<br />
A. Judicial independence 7.78 8.52 8.39 8.18 8.05<br />
B. Impartial courts 8.28 9.02 8.94 6.73 6.30<br />
C. Protection of property rights 5.80 7.62 9.44 7.30 6.96<br />
D. Military interference in rule of law and politics 9.64 10.00 10.00 10.00 10.00<br />
E. Integrity of the legal system 10.00 10.00 10.00 10.00 10.00<br />
F. Legal enforcement of contracts 7.13 6.82 6.82<br />
G. Regulatory restrictions on sale of real property 9.14 9.14 9.14<br />
H. Reliability of police 8.83 8.92 8.94<br />
I. Business costs of crime 9.60 8.96 8.79<br />
Area 3. Sound Money 2.62 2.84 7.08 9.45 9.18 8.75 7.80 8.42<br />
A. Money growth 3.57 (32.16) 4.81 (25.96) 5.77 (21.13) 9.18 (4.12) 8.16 (9.21) 7.06 (14.68) 5.00 (24.98) 5.78 (21.09)<br />
B. Standard deviation of inflation 6.92 (7.70) 2.82 (17.95) 8.81 (2.97) 9.16 (2.09) 9.61 (0.97) 8.76 (3.11) 8.58 (3.54) 9.00 (2.51)<br />
C. Inflation: most recent year 0.00 (52.48) 3.74 (31.30) 3.74 (31.30) 9.45 (2.75) 8.97 (5.16) 9.17 (4.16) 7.60 (12.00) 8.92 (5.40)<br />
D. <strong>Freedom</strong> to own foreign currency bank accounts 0.00 0.00 10.00 10.00 10.00 10.00 10.00 10.00<br />
Area 4. <strong>Freedom</strong> to Trade Internationally 5.69 5.53 6.62 7.89 8.24 7.13 6.55 6.31<br />
A. Tariffs 6.87 7.80 7.86 8.65 8.02 6.05 6.34 6.48<br />
(i) Revenue from trade taxes (% of trade sector) 5.67 (6.50) 6.93 (4.60) 7.34 (3.99) 9.61 (0.58) 9.65 (0.53) 9.69 (0.46) 9.76 (0.36) 9.65 (0.53)<br />
(ii) Mean tariff rate 8.08 (9.60) 8.66 (6.70) 9.24 (3.80) 9.26 (3.70) 9.62 (1.90) 8.46 (7.70) 8.84 (5.80) 8.88 (5.60)<br />
(iii) Standard deviation of tariff rates 7.00 (7.50) 7.08 (7.30) 4.80 (13.00) 0.00 (38.65) 0.42 (23.95) 0.91 (22.74)<br />
B. Regulatory trade barriers 6.62 8.71 6.95 6.51 5.68<br />
(i) Non-tariff trade barriers 6.62 8.25 5.86 5.33 4.73<br />
(ii) Compliance cost of importing and exporting 9.17 8.03 7.70 6.63<br />
C. Black-market exchange rates 8.20 6.80 10.00 10.00 10.00 10.00 10.00 9.48<br />
D. Controls of the movement of capital and people 2.00 2.00 2.00 6.28 6.25 5.52 3.37 3.61<br />
(i) Foreign ownership/investment restrictions 7.56 8.65 6.15 2.75 3.47<br />
(ii) Capital controls 2.00 2.00 2.00 5.00 3.85 3.85 0.77 0.77<br />
(iii) <strong>Freedom</strong> of foreigners to visit 6.58 6.58 6.58<br />
Area 5. Regulation 5.50 5.51 6.54 7.31 7.69 8.84 7.47 7.41<br />
A. Credit market regulations 5.20 5.23 6.28 7.14 8.00 9.67 7.01 6.33<br />
(i) Ownership of banks 2.00 2.00 2.00 2.00 5.00 10.00 10.00 10.00<br />
(ii) Private sector credit 9.61 9.69 8.83 9.42 10.00 10.00 2.03 0.00<br />
(iii) Interest rate controls/negative real interest rates 4.00 4.00 8.00 10.00 9.00 9.00 9.00 9.00<br />
B. Labor market regulations 6.80 6.38 6.66 7.97 7.84 7.72<br />
(i) Hiring regulations and minimum wage 6.20 4.76 6.70 5.57 5.57<br />
(ii) Hiring and firing regulations 5.92 5.92 6.03 7.67 7.51 7.23<br />
(iii) Centralized collective bargaining 4.49 4.49 4.49 4.49 5.48 6.67 5.94 5.51<br />
(iv) Hours regulations 5.28 7.01 8.00 8.00 8.00<br />
(v) Mandated cost of worker dismissal 8.79 10.00 10.00<br />
(vi) Conscription 10.00 10.00 10.00 10.00 10.00 10.00 10.00 10.00<br />
C. Business regulations 8.41 8.41 8.89 7.56 8.19<br />
(i) Administrative requirements 6.98 7.24 5.49 5.24<br />
(ii) Bureaucracy costs 8.06 8.43 8.57 3.01 7.77<br />
(iii) Starting a business 7.67 8.25 9.76 9.78 9.76<br />
(iv) Extra payments/bribes/favoritism 9.50 9.99 9.69 8.97 8.28<br />
(v) Licensing restrictions 9.64 9.66 9.68<br />
(vi) Cost of tax compliance 8.43 8.43 8.43<br />
www.freetheworld.com • www.fraserinstitute.org • Fraser Institute ©2012
88 • <strong>Economic</strong> <strong>Freedom</strong> of the <strong>World</strong>: 2012 Annual Report<br />
India<br />
Fraser Institute ©2012 • www.fraserinstitute.org • www.freetheworld.com<br />
1980 1985 1990 1995 2000 2005 2009 2010<br />
Chain-Linked Rating (Rank) Rating (Rank) Rating (Rank) Rating (Rank) Rating (Rank) Rating (Rank) Rating (Rank) Rating (Rank)<br />
Summary Rating (Rank) 5.35 (50) 5.02 (63) 5.05 (78) 5.80 (73) 6.32 (75) 6.89 (64) 6.47 (82) 6.42 (90)<br />
Area 1. Size of Government 5.00 (53) 4.50 (70) 4.88 (76) 6.26 (55) 6.83 (41) 7.42 (38) 6.33 (63) 6.37 (63)<br />
Area 2. Legal System and Property Rights 5.78 (36) 4.92 (56) 4.39 (72) 5.87 (58) 5.99 (59) 7.29 (32) 6.48 (50) 6.22 (53)<br />
Area 3. Sound Money 6.29 (51) 6.61 (57) 6.63 (60) 6.50 (64) 6.88 (86) 6.84 (91) 6.55 (108) 6.42 (111)<br />
Area 4. <strong>Freedom</strong> to Trade Internationally 4.41 (48) 3.53 (68) 3.92 (78) 4.56 (102) 5.51 (99) 6.35 (84) 6.48 (83) 6.57 (86)<br />
Area 5. Regulation 5.28 (57) 5.29 (63) 5.35 (70) 5.76 (64) 6.40 (56) 6.65 (72) 6.59 (76) 6.60 (81)<br />
Unadjusted<br />
Summary Rating (Rank) 5.15 (57) 4.83 (74) 4.89 (82) 5.76 (75) 6.32 (73) 6.72 (76) 6.31 (103) 6.26 (111)<br />
Rating (Data) Rating (Data) Rating (Data) Rating (Data) Rating (Data) Rating (Data) Rating (Data) Rating (Data)<br />
Area 1. Size of Government 5.00 4.50 4.88 6.26 6.83 7.42 6.33 6.37<br />
A. Government consumption 8.34 (11.65) 7.62 (14.11) 7.15 (15.68) 7.31 (15.16) 6.74 (17.10) 6.95 (16.38) 6.64 (17.44) 6.82 (16.81)<br />
B. Transfers and subsidies 8.66 (5.40) 8.37 (6.50) 8.37 (6.50) 8.72 (5.20) 8.59 (5.66) 8.74 (5.14) 7.68 (9.02) 7.68 (9.02)<br />
C. Government enterprises and investment 2.00 (46.70) 2.00 (49.50) 2.00 (42.30) 4.00 (31.40) 4.00 (31.40) 7.00 (24.22) 4.00 (27.40) 4.00 (29.51)<br />
D. Top marginal tax rate 1.00 0.00 2.00 5.00 8.00 7.00 7.00 7.00<br />
(i) Top marginal income tax rate 1.00 (60) 0.00 (62) 2.00 (53) 5.00 (40) 8.00 (30) 7.00 (34) 7.00 (34) 7.00 (31)<br />
(ii) Top marginal income and payroll tax rate 2.00 (53) 5.00 (40) 8.00 (30) 7.00 (34) 7.00 (34) 7.00 (31)<br />
Area 2. Legal System and Property Rights 5.78 4.92 4.39 5.87 5.99 6.51 5.78 5.55<br />
A. Judicial independence 7.33 7.01 8.16 6.28 5.57<br />
B. Impartial courts 7.60 8.02 6.87 5.24 4.69<br />
C. Protection of property rights 4.10 3.27 7.88 5.90 5.49<br />
D. Military interference in rule of law and politics 6.21 5.00 6.67 6.67 6.67<br />
E. Integrity of the legal system 4.11 6.67 6.67 6.67 6.67<br />
F. Legal enforcement of contracts 2.59 2.59 2.59<br />
G. Regulatory restrictions on sale of real property 6.28 6.74 6.77<br />
H. Reliability of police 5.83 5.37 6.36<br />
I. Business costs of crime 7.60 6.59 5.15<br />
Area 3. Sound Money 6.29 6.61 6.63 6.50 6.88 6.84 6.55 6.42<br />
A. Money growth 9.36 (3.22) 8.38 (8.10) 8.58 (7.08) 8.56 (7.22) 9.03 (4.86) 8.41 (7.97) 8.87 (5.65) 8.93 (5.35)<br />
B. Standard deviation of inflation 8.10 (4.76) 9.56 (1.11) 9.42 (1.45) 9.06 (2.34) 9.29 (1.77) 9.79 (0.53) 9.52 (1.21) 9.13 (2.17)<br />
C. Inflation: most recent year 7.69 (11.54) 8.50 (7.52) 8.50 (7.52) 8.37 (8.16) 9.20 (4.01) 9.15 (4.25) 7.82 (10.88) 7.60 (11.99)<br />
D. <strong>Freedom</strong> to own foreign currency bank accounts 0.00 0.00 0.00 0.00 0.00 0.00 0.00 0.00<br />
Area 4. <strong>Freedom</strong> to Trade Internationally 3.00 2.40 2.67 4.50 5.51 6.07 6.20 6.28<br />
A. Tariffs 0.00 0.00 0.00 0.91 4.34 5.59 6.31 6.16<br />
(i) Revenue from trade taxes (% of trade sector) 0.00 (15.50) 0.00 (24.20) 0.00 (21.10) 2.16 (11.76) 4.49 (8.26) 7.15 (4.27) 7.85 (3.22) 7.53 (3.70)<br />
(ii) Mean tariff rate 0.00 (74.30) 0.00 (98.80) 0.00 (79.20) 0.00 (55.20) 3.50 (32.50) 6.60 (17.00) 7.42 (12.90) 7.40 (13.00)<br />
(iii) Standard deviation of tariff rates 0.00 (45.20) 0.56 (23.60) 5.04 (12.40) 3.01 (17.47) 3.65 (15.87) 3.55 (16.12)<br />
B. Regulatory trade barriers 6.35 5.67 6.13 6.43 6.79<br />
(i) Non-tariff trade barriers 6.35 5.35 6.91 5.37 5.33<br />
(ii) Compliance cost of importing and exporting 5.99 5.34 7.49 8.25<br />
C. Black-market exchange rates 9.00 7.20 8.00 8.40 10.00 10.00 10.00 10.00<br />
D. Controls of the movement of capital and people 0.00 0.00 0.00 2.33 2.02 2.58 2.05 2.16<br />
(i) Foreign ownership/investment restrictions 4.67 4.05 7.40 5.81 6.13<br />
(ii) Capital controls 0.00 0.00 0.00 0.00 0.00 0.00 0.00 0.00<br />
(iii) <strong>Freedom</strong> of foreigners to visit 0.34 0.34 0.34<br />
Area 5. Regulation 5.68 5.70 5.87 5.66 6.40 6.74 6.68 6.70<br />
A. Credit market regulations 5.22 5.28 5.49 6.39 6.82 7.01 6.87 6.97<br />
(i) Ownership of banks 0.00 0.00 0.00 2.00 2.00 2.00 2.00 2.00<br />
(ii) Private sector credit 7.67 7.84 8.46 9.17 8.45 9.04 8.60 8.91<br />
(iii) Interest rate controls/negative real interest rates 8.00 8.00 8.00 8.00 10.00 10.00 10.00 10.00<br />
B. Labor market regulations 6.26 6.11 6.05 7.27 7.93 8.00<br />
(i) Hiring regulations and minimum wage 6.23 4.35 10.00 10.00 10.00<br />
(ii) Hiring and firing regulations 2.56 2.56 1.70 3.31 4.49 4.98<br />
(iii) Centralized collective bargaining 6.21 6.21 6.21 6.21 7.72 7.47 7.05 7.02<br />
(iv) Hours regulations 5.55 6.50 8.00 10.00 10.00<br />
(v) Mandated cost of worker dismissal 4.81 6.03 6.03<br />
(vi) Conscription 10.00 10.00 10.00 10.00 10.00 10.00 10.00 10.00<br />
C. Business regulations 4.48 6.32 5.94 5.26 5.13<br />
(i) Administrative requirements 7.37 3.23 3.31 3.29<br />
(ii) Bureaucracy costs 6.06 7.40 5.17 4.92 4.04<br />
(iii) Starting a business 4.95 5.93 7.03 7.86 8.09<br />
(iv) Extra payments/bribes/favoritism 2.42 4.57 6.62 4.47 3.92<br />
(v) Licensing restrictions 6.58 3.86 4.26<br />
(vi) Cost of tax compliance 7.04 7.11 7.15
Country Data Tables • 89<br />
Indonesia 1980 1985 1990 1995 2000 2005 2009 2010<br />
Chain-Linked Rating (Rank) Rating (Rank) Rating (Rank) Rating (Rank) Rating (Rank) Rating (Rank) Rating (Rank) Rating (Rank)<br />
Summary Rating (Rank) 5.06 (60) 6.14 (28) 6.52 (31) 6.62 (45) 6.07 (84) 6.63 (73) 6.78 (66) 7.04 (56)<br />
Area 1. Size of Government 5.27 (45) 6.35 (17) 7.13 (16) 7.96 (14) 7.57 (21) 7.59 (30) 7.58 (24) 7.90 (21)<br />
Area 2. Legal System and Property Rights 3.41 (61) 4.46 (66) 4.72 (63) 3.55 (109) 3.36 (112) 4.19 (98) 4.56 (87) 4.38 (93)<br />
Area 3. Sound Money 6.54 (38) 9.27 (14) 8.76 (23) 9.09 (32) 6.20 (103) 7.39 (81) 7.71 (79) 8.99 (50)<br />
Area 4. <strong>Freedom</strong> to Trade Internationally 5.62 (40) 5.81 (35) 6.13 (41) 6.34 (67) 7.15 (65) 7.30 (54) 7.17 (62) 7.04 (65)<br />
Area 5. Regulation 4.42 (83) 4.57 (82) 5.73 (55) 6.06 (53) 6.04 (80) 6.70 (69) 6.91 (55) 6.89 (57)<br />
Unadjusted<br />
Summary Rating (Rank) 4.90 (62) 5.94 (35) 6.23 (37) 6.45 (51) 6.07 (82) 6.48 (86) 6.63 (86) 6.88 (76)<br />
Rating (Data) Rating (Data) Rating (Data) Rating (Data) Rating (Data) Rating (Data) Rating (Data) Rating (Data)<br />
Area 1. Size of Government 5.27 6.35 7.13 7.96 7.57 7.59 7.58 7.90<br />
A. Government consumption 6.84 (16.75) 6.95 (16.36) 7.93 (13.04) 8.45 (11.28) 8.98 (9.47) 8.47 (11.19) 7.50 (14.52) 7.72 (13.75)<br />
B. Transfers and subsidies 9.24 (3.30) 9.46 (2.50) 9.59 (2.00) 9.89 (0.90) 8.30 (6.73) 8.90 (4.55) 9.34 (2.92) 9.36 (2.84)<br />
C. Government enterprises and investment 2.00 (49.50) 2.00 (43.00) 4.00 (32.50) 7.00 (20.70) 7.00 (20.70) 7.00 (20.70) 7.00 7.00<br />
D. Top marginal tax rate 3.00 7.00 7.00 6.50 6.00 6.00 6.50 7.50<br />
(i) Top marginal income tax rate 3.00 (50) 7.00 (35) 7.00 (35) 8.00 (30) 7.00 (35) 7.00 (35) 8.00 (30) 8.00 (30)<br />
(ii) Top marginal income and payroll tax rate 7.00 (35) 5.00 (40) 5.00 (40) 5.00 (40) 5.00 (37) 7.00 (35)<br />
Area 2. Legal System and Property Rights 3.41 4.46 4.72 3.55 3.36 4.29 4.66 4.48<br />
A. Judicial independence 2.33 3.01 3.01 4.66 4.33<br />
B. Impartial courts 4.22 4.01 3.92 4.72 4.53<br />
C. Protection of property rights 4.20 3.13 4.59 5.07 4.94<br />
D. Military interference in rule of law and politics 2.88 3.33 4.17 4.17 4.17<br />
E. Integrity of the legal system 4.11 3.33 5.00 5.00 5.00<br />
F. Legal enforcement of contracts 1.17 1.17 1.17<br />
G. Regulatory restrictions on sale of real property 5.81 6.00 6.03<br />
H. Reliability of police 3.51 4.93 5.57<br />
I. Business costs of crime 7.40 6.20 4.56<br />
Area 3. Sound Money 6.54 9.27 8.76 9.09 6.20 7.39 7.71 8.99<br />
A. Money growth 6.30 (18.49) 9.36 (3.20) 8.03 (9.87) 8.97 (5.17) 5.56 (22.19) 8.45 (7.76) 8.57 (7.14) 8.66 (6.70)<br />
B. Standard deviation of inflation 6.07 (9.82) 8.59 (3.52) 7.86 (5.35) 9.38 (1.54) 0.00 (27.72) 8.21 (4.48) 8.53 (3.67) 8.32 (4.21)<br />
C. Inflation: most recent year 3.80 (30.99) 9.14 (4.28) 9.14 (4.28) 8.02 (9.89) 9.26 (3.72) 7.91 (10.45) 8.72 (6.38) 8.97 (5.13)<br />
D. <strong>Freedom</strong> to own foreign currency bank accounts 10.00 10.00 10.00 10.00 10.00 5.00 5.00 10.00<br />
Area 4. <strong>Freedom</strong> to Trade Internationally 5.24 5.42 5.29 5.88 7.15 6.99 6.87 6.74<br />
A. Tariffs 6.13 7.66 5.88 6.43 7.88 7.93 7.90 7.89<br />
(i) Revenue from trade taxes (% of trade sector) 8.07 (2.90) 8.93 (1.60) 8.39 (2.41) 9.13 (1.31) 9.65 (0.53) 9.38 (0.93) 9.53 (0.71) 9.48 (0.78)<br />
(ii) Mean tariff rate 4.20 (29.00) 6.38 (18.10) 5.94 (20.30) 6.60 (17.00) 8.32 (8.40) 8.70 (6.50) 8.64 (6.80) 8.64 (6.80)<br />
(iii) Standard deviation of tariff rates 3.32 (16.70) 3.56 (16.10) 5.68 (10.80) 5.72 (10.70) 5.54 (11.15) 5.54 (11.15)<br />
B. Regulatory trade barriers 3.33 5.91 6.30 6.48 6.17<br />
(i) Non-tariff trade barriers 3.33 3.82 6.41 6.16 5.53<br />
(ii) Compliance cost of importing and exporting 8.00 6.20 6.80 6.81<br />
C. Black-market exchange rates 9.60 8.60 10.00 10.00 10.00 10.00 10.00 10.00<br />
D. Controls of the movement of capital and people 0.00 0.00 0.00 3.76 4.83 3.72 3.08 2.92<br />
(i) Foreign ownership/investment restrictions 7.53 8.12 8.36 6.45 5.98<br />
(ii) Capital controls 0.00 0.00 0.00 0.00 1.54 1.54 1.54 1.54<br />
(iii) <strong>Freedom</strong> of foreigners to visit 1.25 1.25 1.25<br />
Area 5. Regulation 4.05 4.18 5.25 5.79 6.04 6.12 6.32 6.29<br />
A. Credit market regulations 3.18 4.53 7.33 8.33 7.71 8.11 8.09 8.27<br />
(i) Ownership of banks 0.00 2.00 2.00 5.00 5.00 5.00 5.00 5.00<br />
(ii) Private sector credit 7.53 7.58 10.00 10.00 8.13 9.34 9.28 9.82<br />
(iii) Interest rate controls/negative real interest rates 2.00 4.00 10.00 10.00 10.00 10.00 10.00 10.00<br />
B. Labor market regulations 4.22 4.97 4.93 4.81 4.66<br />
(i) Hiring regulations and minimum wage 5.12 4.62 2.80 2.23 2.23<br />
(ii) Hiring and firing regulations 5.56 5.56 3.20 4.49 5.64 5.28<br />
(iii) Centralized collective bargaining 6.18 7.30 5.98 5.47<br />
(iv) Hours regulations 6.22 5.85 10.00 10.00 10.00<br />
(v) Mandated cost of worker dismissal 0.00 0.00 0.00<br />
(vi) Conscription 3.00 0.00 0.00 0.00 5.00 5.00 5.00 5.00<br />
C. Business regulations 4.81 5.45 5.31 6.04 5.93<br />
(i) Administrative requirements 6.95 6.26 4.42 4.28<br />
(ii) Bureaucracy costs 6.30 5.30 5.85 4.68 3.97<br />
(iii) Starting a business 5.22 5.63 5.85 8.09 8.22<br />
(iv) Extra payments/bribes/favoritism 2.91 3.91 3.13 4.07 3.95<br />
(v) Licensing restrictions 7.24 8.00 8.15<br />
(vi) Cost of tax compliance 3.54 7.02 7.02<br />
www.freetheworld.com • www.fraserinstitute.org • Fraser Institute ©2012
90 • <strong>Economic</strong> <strong>Freedom</strong> of the <strong>World</strong>: 2012 Annual Report<br />
Iran<br />
Fraser Institute ©2012 • www.fraserinstitute.org • www.freetheworld.com<br />
1980 1985 1990 1995 2000 2005 2009 2010<br />
Chain-Linked Rating (Rank) Rating (Rank) Rating (Rank) Rating (Rank) Rating (Rank) Rating (Rank) Rating (Rank) Rating (Rank)<br />
Summary Rating (Rank) 3.36 (97) 3.83 (93) 4.39 (96) 4.31 (113) 5.90 (91) 6.47 (78) 6.41 (84) 6.49 (83)<br />
Area 1. Size of Government 3.42 (91) 4.33 (75) 5.06 (72) 5.35 (82) 4.92 (93) 6.32 (77) 6.45 (54) 6.42 (62)<br />
Area 2. Legal System and Property Rights 1.76 (88) 2.26 (99) 2.20 (105) 6.18 (49) 6.62 (48) 6.44 (55) 6.34 (52) 6.40 (51)<br />
Area 3. Sound Money 6.90 (30) 8.10 (27) 8.99 (21) 3.87 (102) 8.00 (59) 8.06 (68) 8.18 (66) 8.53 (63)<br />
Area 4. <strong>Freedom</strong> to Trade Internationally 0.98 (86) 1.07 (91) 2.05 (97) 2.43 (107) 5.73 (95) 5.80 (91) 5.13 (112) 5.27 (112)<br />
Area 5. Regulation 3.86 (90) 3.38 (97) 3.65 (104) 3.73 (117) 4.23 (119) 5.71 (100) 5.90 (103) 5.79 (106)<br />
Unadjusted<br />
Summary Rating (Rank) 3.61 (97) 3.83 (94) 4.39 (97) 4.20 (115) 5.76 (99) 6.37 (96) 6.18 (109) 6.26 (111)<br />
Rating (Data) Rating (Data) Rating (Data) Rating (Data) Rating (Data) Rating (Data) Rating (Data) Rating (Data)<br />
Area 1. Size of Government 4.56 4.33 5.06 5.35 4.92 6.32 6.45 6.42<br />
A. Government consumption 3.44 (28.29) 6.00 (19.59) 7.30 (15.17) 6.12 (19.19) 4.68 (24.10) 5.51 (21.28) 6.83 (16.78) 6.68 (17.28)<br />
B. Transfers and subsidies 8.23 (7.00) 9.32 (3.00) 8.94 (4.40) 9.29 (3.10) 9.52 (2.26) 8.27 (6.85) 7.99 (7.88) 7.99 (7.88)<br />
C. Government enterprises and investment 2.00 (44.50) 2.00 (40.40) 4.00 (32.50) 2.00 (49.70) 4.00 (33.60) 4.00 (33.70) 4.00 (35.30) 4.00 (35.30)<br />
D. Top marginal tax rate 0.00 0.00 4.00 1.50 7.50 7.00 7.00<br />
(i) Top marginal income tax rate 0.00 (90) 0.00 (75) 4.00 (54) 2.00 (54) 8.00 (35) 7.00 (35) 7.00 (35)<br />
(ii) Top marginal income and payroll tax rate 0.00 (75) 4.00 (54) 1.00 (57) 7.00 (37) 7.00 (37) 7.00 (37)<br />
Area 2. Legal System and Property Rights 1.76 2.26 2.20 5.60 5.91 6.11 5.73 5.78<br />
A. Judicial independence 4.73 4.69<br />
B. Impartial courts 4.92 4.86 4.20 3.57 3.76<br />
C. Protection of property rights 5.48 5.63<br />
D. Military interference in rule of law and politics 6.67 8.33 8.33 8.33 8.33<br />
E. Integrity of the legal system 6.96 6.67 6.67 6.67 6.67<br />
F. Legal enforcement of contracts 5.51 5.63 5.63<br />
G. Regulatory restrictions on sale of real property 5.84 5.87 5.87<br />
H. Reliability of police 5.94 5.70<br />
I. Business costs of crime 5.32 5.77<br />
Area 3. Sound Money 6.90 8.10 8.99 3.87 8.00 8.06 8.18 8.53<br />
A. Money growth 4.64 (26.80) 5.94 (20.30) 8.19 (9.07) 6.09 (19.57) 7.15 (14.27) 7.69 (11.57) 8.58 (7.08) 8.58 (7.08)<br />
B. Standard deviation of inflation 7.66 (5.85) 7.40 (6.51) 8.73 (3.17) 7.31 (6.72) 7.73 (5.67) 7.23 (6.93) 6.83 (7.92) 7.56 (6.11)<br />
C. Inflation: most recent year 5.32 (23.41) 9.05 (4.73) 9.05 (4.73) 2.10 (39.50) 7.10 (14.48) 7.31 (13.43) 7.30 (13.50) 7.97 (10.14)<br />
D. <strong>Freedom</strong> to own foreign currency bank accounts 10.00 10.00 10.00 0.00 10.00 10.00 10.00 10.00<br />
Area 4. <strong>Freedom</strong> to Trade Internationally 0.98 1.07 2.05 2.43 5.73 5.62 5.05 5.18<br />
A. Tariffs 2.93 3.20 6.15 7.30 8.34 6.92 4.17 4.17<br />
(i) Revenue from trade taxes (% of trade sector) 0.00 (17.00) 0.53 (14.20) 6.43 (5.35) 8.74 (1.89) 7.67 (3.49) 7.59 (3.62) 7.72 (3.42) 7.72 (3.42)<br />
(ii) Mean tariff rate 5.86 (20.70) 5.86 (20.70) 5.86 (20.70) 5.86 (20.70) 9.02 (4.90) 6.26 (18.70) 4.80 (26.00) 4.80 (26.00)<br />
(iii) Standard deviation of tariff rates 8.32 (4.20) 0.00 (28.08) 0.00 (28.08)<br />
B. Regulatory trade barriers 5.55 5.02 5.53<br />
(i) Non-tariff trade barriers 3.97 4.05<br />
(ii) Compliance cost of importing and exporting 5.55 6.07 7.00<br />
C. Black-market exchange rates 0.00 0.00 0.00 0.00 8.86 10.00 10.00 10.00<br />
D. Controls of the movement of capital and people 0.00 0.00 0.00 0.00 0.00 0.00 1.01 1.04<br />
(i) Foreign ownership/investment restrictions 3.03 3.11<br />
(ii) Capital controls 0.00 0.00 0.00 0.00 0.00 0.00 0.00 0.00<br />
(iii) <strong>Freedom</strong> of foreigners to visit 0.00 0.00 0.00<br />
Area 5. Regulation 3.86 3.38 3.65 3.73 4.23 5.73 5.50 5.40<br />
A. Credit market regulations 2.68 2.40 3.13 3.33 4.67 6.33 6.39 6.31<br />
(i) Ownership of banks 0.00 0.00 0.00 0.00 0.00 0.00 0.00 0.00<br />
(ii) Private sector credit 8.03 7.19 9.38 10.00 10.00 10.00 9.18 8.92<br />
(iii) Interest rate controls/negative real interest rates 0.00 0.00 0.00 0.00 4.00 9.00 10.00 10.00<br />
B. Labor market regulations 4.53 4.38 4.37<br />
(i) Hiring regulations and minimum wage 8.90 7.77 7.77<br />
(ii) Hiring and firing regulations 4.36 4.39<br />
(iii) Centralized collective bargaining 4.22 4.11<br />
(iv) Hours regulations 7.30 8.00 8.00<br />
(v) Mandated cost of worker dismissal 1.93 1.97 1.97<br />
(vi) Conscription 3.00 0.00 0.00 0.00 0.00 0.00 0.00 0.00<br />
C. Business regulations 6.32 5.73 5.52<br />
(i) Administrative requirements 3.18 3.04<br />
(ii) Bureaucracy costs 5.60 4.47<br />
(iii) Starting a business 9.04 9.70 9.70<br />
(iv) Extra payments/bribes/favoritism 4.81 4.71<br />
(v) Licensing restrictions 3.76 4.97 5.06<br />
(vi) Cost of tax compliance 6.14 6.14 6.14
Ireland<br />
Chain-Linked<br />
Country Data Tables • 91<br />
1980 1985 1990 1995 2000 2005 2009 2010<br />
Summary Rating (Rank) 6.47 (19) 6.54 (20) 7.13 (20) 8.29 (5) 8.20 (9) 8.41 (4) 7.82 (10) 7.92 (8)<br />
Area 1. Size of Government 4.67 (66) 4.26 (79) 5.56 (61) 5.76 (71) 6.13 (62) 6.64 (64) 5.72 (80) 5.72 (81)<br />
Area 2. Legal System and Property Rights 7.08 (17) 6.65 (26) 7.73 (17) 9.09 (8) 8.97 (14) 8.75 (14) 8.98 (6) 8.85 (8)<br />
Area 3. Sound Money 5.93 (69) 6.65 (55) 6.80 (55) 9.60 (15) 9.43 (25) 9.65 (7) 9.12 (43) 9.48 (24)<br />
Area 4. <strong>Freedom</strong> to Trade Internationally 7.80 (13) 7.70 (15) 7.84 (22) 9.11 (13) 9.18 (11) 8.92 (4) 8.71 (7) 8.49 (9)<br />
Area 5. Regulation 6.85 (17) 7.41 (7) 7.71 (7) 7.86 (7) 7.30 (25) 8.01 (13) 6.68 (73) 7.07 (45)<br />
Unadjusted<br />
Summary Rating (Rank) 6.46 (18) 6.53 (20) 7.06 (18) 8.26 (5) 8.20 (9) 8.23 (6) 7.66 (16) 7.75 (12)<br />
Rating (Data) Rating (Data) Rating (Data) Rating (Data) Rating (Data) Rating (Data) Rating (Data) Rating (Data)<br />
Area 1. Size of Government 4.67 4.26 5.56 5.76 6.13 6.64 5.72 5.72<br />
A. Government consumption 5.31 (21.96) 5.15 (22.49) 5.80 (20.27) 5.44 (21.52) 5.33 (21.88) 5.12 (22.58) 3.60 (27.75) 3.80 (27.08)<br />
B. Transfers and subsidies 5.37 (17.50) 4.88 (19.30) 5.42 (17.30) 5.10 (18.50) 4.20 (21.78) 6.94 (11.73) 5.26 (17.91) 5.09 (18.51)<br />
C. Government enterprises and investment 7.00 (24.60) 7.00 (24.70) 10.00 (11.10) 10.00 (14.30) 10.00 (14.30) 10.00 (13.33) 10.00 (7.85) 10.00 (6.14)<br />
D. Top marginal tax rate 1.00 0.00 1.00 2.50 5.00 4.50 4.00 4.00<br />
(i) Top marginal income tax rate 1.00 (60) 0.00 (65) 1.00 (56) 3.00 (48) 5.00 (42) 5.00 (42) 5.00 (41) 5.00 (41)<br />
(ii) Top marginal income and payroll tax rate 1.00 (57) 2.00 (51) 5.00 (42) 4.00 (49) 3.00 (55) 3.00 (55)<br />
Area 2. Legal System and Property Rights 7.08 6.65 7.73 9.09 8.97 7.71 7.91 7.79<br />
A. Judicial independence 9.30 8.68 8.57 8.75 8.78<br />
B. Impartial courts 8.88 9.19 7.10 5.88 5.81<br />
C. Protection of property rights 7.29 7.00 9.00 8.15 8.31<br />
D. Military interference in rule of law and politics 10.00 10.00 10.00 10.00 10.00<br />
E. Integrity of the legal system 10.00 10.00 10.00 10.00 10.00<br />
F. Legal enforcement of contracts 4.95 4.95 3.93<br />
G. Regulatory restrictions on sale of real property 5.90 7.21 7.15<br />
H. Reliability of police 7.19 8.30 7.79<br />
I. Business costs of crime 6.71 7.98 8.39<br />
Area 3. Sound Money 5.93 6.65 6.80 9.60 9.43 9.65 9.12 9.48<br />
A. Money growth 8.07 (9.64) 9.56 (2.19) 9.25 (3.75) 9.03 (4.87) 9.39 (−3.05) 9.73 (1.34) 8.55 (7.26) 9.23 (3.87)<br />
B. Standard deviation of inflation 8.61 (3.48) 8.09 (4.78) 8.97 (2.57) 9.47 (1.32) 9.42 (1.44) 9.37 (1.57) 8.84 (2.91) 8.89 (2.78)<br />
C. Inflation: most recent year 7.06 (14.71) 8.96 (5.18) 8.96 (5.18) 9.91 (0.43) 8.89 (5.56) 9.51 (2.43) 9.10 (−4.48) 9.81 (−0.95)<br />
D. <strong>Freedom</strong> to own foreign currency bank accounts 0.00 0.00 0.00 10.00 10.00 10.00 10.00 10.00<br />
Area 4. <strong>Freedom</strong> to Trade Internationally 7.65 7.55 7.56 8.93 9.18 8.93 8.72 8.50<br />
A. Tariffs 7.95 8.25 7.88 8.37 9.18 8.39 8.22 8.34<br />
(i) Revenue from trade taxes (% of trade sector) 7.67 (3.50) 8.00 (3.00) 8.00 (3.00) 8.80 (1.80) 9.78 (0.33) 9.59 (0.62) 9.44 (0.84) 9.63 (0.55)<br />
(ii) Mean tariff rate 8.24 (8.80) 8.50 (7.50) 8.52 (7.40) 8.66 (6.70) 9.52 (2.40) 9.46 (2.70) 8.94 (5.30) 8.98 (5.10)<br />
(iii) Standard deviation of tariff rates 7.12 (7.20) 7.64 (5.90) 8.24 (4.40) 6.13 (9.67) 6.29 (9.28) 6.41 (8.98)<br />
B. Regulatory trade barriers 8.88 8.93 8.51 8.25 7.06<br />
(i) Non-tariff trade barriers 8.88 8.18 8.19 7.67 7.88<br />
(ii) Compliance cost of importing and exporting 9.67 8.83 8.83 6.25<br />
C. Black-market exchange rates 10.00 9.40 9.80 10.00 10.00 10.00 10.00 10.00<br />
D. Controls of the movement of capital and people 5.00 5.00 5.00 8.46 8.61 8.84 8.41 8.60<br />
(i) Foreign ownership/investment restrictions 8.91 8.76 9.10 7.81 8.37<br />
(ii) Capital controls 5.00 5.00 5.00 8.00 8.46 8.46 8.46 8.46<br />
(iii) <strong>Freedom</strong> of foreigners to visit 8.96 8.96 8.96<br />
Area 5. Regulation 6.95 7.52 7.65 7.91 7.30 8.19 6.83 7.23<br />
A. Credit market regulations 7.35 8.46 8.77 9.00 9.00 9.33 6.00 6.00<br />
(i) Ownership of banks 8.00 8.00 8.00 8.00 8.00 8.00 8.00 8.00<br />
(ii) Private sector credit 8.04 7.37 8.32 9.01 10.00 10.00 0.00 0.00<br />
(iii) Interest rate controls/negative real interest rates 6.00 10.00 10.00 10.00 9.00 10.00 10.00 10.00<br />
B. Labor market regulations 6.55 6.58 6.53 6.68 5.35 7.48 7.77 7.93<br />
(i) Hiring regulations and minimum wage 6.95 4.69 8.90 8.90 8.90<br />
(ii) Hiring and firing regulations 5.52 5.52 3.77 3.95 4.55 4.56<br />
(iii) Centralized collective bargaining 5.18 5.18 6.21 6.21 2.93 4.24 4.06 5.06<br />
(iv) Hours regulations 4.49 4.57 4.40 4.72 5.34 10.00 10.00 10.00<br />
(v) Mandated cost of worker dismissal 7.78 9.09 9.09<br />
(vi) Conscription 10.00 10.00 10.00 10.00 10.00 10.00 10.00 10.00<br />
C. Business regulations 8.04 7.56 7.76 6.72 7.75<br />
(i) Administrative requirements 7.20 4.80 3.44 4.01<br />
(ii) Bureaucracy costs 7.61 7.93 6.72 2.23 7.31<br />
(iii) Starting a business 7.63 6.92 9.58 9.58 9.58<br />
(iv) Extra payments/bribes/favoritism 8.87 8.17 8.42 8.26 7.90<br />
(v) Licensing restrictions 7.86 7.68 8.56<br />
(vi) Cost of tax compliance 9.15 9.15 9.15<br />
www.freetheworld.com • www.fraserinstitute.org • Fraser Institute ©2012
92 • <strong>Economic</strong> <strong>Freedom</strong> of the <strong>World</strong>: 2012 Annual Report<br />
Israel<br />
Fraser Institute ©2012 • www.fraserinstitute.org • www.freetheworld.com<br />
1980 1985 1990 1995 2000 2005 2009 2010<br />
Chain-Linked Rating (Rank) Rating (Rank) Rating (Rank) Rating (Rank) Rating (Rank) Rating (Rank) Rating (Rank) Rating (Rank)<br />
Summary Rating (Rank) 3.48 (95) 4.03 (92) 4.66 (88) 6.04 (67) 6.77 (54) 7.37 (40) 7.13 (51) 7.25 (43)<br />
Area 1. Size of Government 1.61 (106) 2.41 (108) 3.72 (98) 3.10 (113) 2.87 (121) 4.45 (111) 4.62 (110) 4.64 (109)<br />
Area 2. Legal System and Property Rights 4.06 (54) 6.78 (23) 4.39 (71) 6.98 (34) 8.01 (25) 7.26 (34) 6.79 (40) 6.96 (38)<br />
Area 3. Sound Money 2.03 (104) 1.25 (109) 3.95 (102) 7.43 (47) 8.09 (58) 9.34 (34) 8.84 (51) 8.88 (54)<br />
Area 4. <strong>Freedom</strong> to Trade Internationally 6.26 (30) 6.35 (29) 7.01 (32) 7.43 (45) 8.70 (24) 8.97 (3) 8.79 (5) 8.41 (13)<br />
Area 5. Regulation 3.69 (93) 3.49 (96) 4.34 (97) 5.29 (85) 6.19 (69) 6.83 (57) 6.50 (82) 7.26 (34)<br />
Unadjusted<br />
Summary Rating (Rank) 3.51 (99) 4.07 (92) 4.50 (92) 5.93 (68) 6.77 (54) 7.08 (56) 7.12 (58) 7.24 (52)<br />
Rating (Data) Rating (Data) Rating (Data) Rating (Data) Rating (Data) Rating (Data) Rating (Data) Rating (Data)<br />
Area 1. Size of Government 1.82 2.74 3.72 3.10 2.87 4.45 6.06 6.10<br />
A. Government consumption 0.00 (43.15) 0.45 (38.48) 2.09 (32.90) 2.24 (32.38) 2.18 (32.58) 2.11 (32.82) 3.01 (29.76) 3.12 (29.39)<br />
B. Transfers and subsidies 4.47 (20.80) 4.77 (19.70) 5.59 (16.70) 5.07 (18.60) 3.92 (22.80) 7.25 (10.58) 7.24 (10.61) 7.26 (10.55)<br />
C. Government enterprises and investment 10.00 (10.57) 10.00 (10.57)<br />
D. Top marginal tax rate 1.00 3.00 3.50 2.00 2.50 4.00 4.00 4.00<br />
(i) Top marginal income tax rate 1.00 (66) 3.00 (60) 5.00 (48) 4.00 (50) 4.00 (50) 4.00 (49) 5.00 (46) 5.00 (46)<br />
(ii) Top marginal income and payroll tax rate 2.00 (64) 0.00 (66) 1.00 (62) 4.00 (49) 3.00 (60) 3.00 (60)<br />
Area 2. Legal System and Property Rights 4.06 6.78 4.39 6.98 8.01 6.42 6.00 6.16<br />
A. Judicial independence 8.68 9.19 8.87 8.68 8.63<br />
B. Impartial courts 7.02 9.35 7.14 5.28 5.19<br />
C. Protection of property rights 7.15 6.53 7.94 6.25 7.15<br />
D. Military interference in rule of law and politics 5.10 6.67 4.17 4.17 4.17<br />
E. Integrity of the legal system 6.96 8.33 8.33 8.33 8.33<br />
F. Legal enforcement of contracts 3.46 3.46 3.46<br />
G. Regulatory restrictions on sale of real property 4.81 5.63 5.63<br />
H. Reliability of police 6.06 4.98 6.83<br />
I. Business costs of crime 7.02 7.26 6.02<br />
Area 3. Sound Money 2.03 1.25 3.95 7.43 8.09 9.34 8.84 8.88<br />
A. Money growth 3.13 (34.36) 0.00 (136.22) 5.48 (22.59) 7.80 (10.98) 9.07 (4.64) 8.44 (7.80) 6.86 (15.71) 6.86 (15.71)<br />
B. Standard deviation of inflation 0.00 (37.42) 0.00 (103.70) 5.32 (11.71) 8.59 (3.53) 8.50 (3.74) 9.17 (2.08) 9.18 (2.04) 9.20 (2.00)<br />
C. Inflation: most recent year 0.00 (134.74) 0.00 (260.00) 0.00 (260.00) 8.33 (8.36) 9.77 (1.14) 9.73 (1.33) 9.34 (3.33) 9.46 (2.69)<br />
D. <strong>Freedom</strong> to own foreign currency bank accounts 5.00 5.00 5.00 5.00 5.00 10.00 10.00 10.00<br />
Area 4. <strong>Freedom</strong> to Trade Internationally 6.13 6.22 6.86 6.89 8.70 8.48 8.31 7.95<br />
A. Tariffs 6.60 8.07 9.39 7.95 9.68 7.86 7.40 7.40<br />
(i) Revenue from trade taxes (% of trade sector) 6.60 (5.10) 8.07 (2.90) 9.39 (0.92) 9.84 (0.24) 9.75 (0.37) 9.77 (0.34) 9.69 (0.47) 9.69 (0.46)<br />
(ii) Mean tariff rate 8.34 (8.30) 9.60 (2.00) 9.46 (2.70) 8.72 (6.40) 8.72 (6.40)<br />
(iii) Standard deviation of tariff rates 5.68 (10.80) 4.36 (14.11) 3.79 (15.54) 3.79 (15.54)<br />
B. Regulatory trade barriers 5.38 8.11 7.84 8.05 6.87<br />
(i) Non-tariff trade barriers 5.38 6.88 7.27 7.49 7.36<br />
(ii) Compliance cost of importing and exporting 9.33 8.41 8.62 6.38<br />
C. Black-market exchange rates 9.80 8.60 9.20 10.00 10.00 10.00 10.00 10.00<br />
D. Controls of the movement of capital and people 2.00 2.00 2.00 4.21 7.02 8.23 7.79 7.55<br />
(i) Foreign ownership/investment restrictions 6.42 9.42 7.70 6.38 7.14<br />
(ii) Capital controls 2.00 2.00 2.00 2.00 4.61 9.17 9.17 7.69<br />
(iii) <strong>Freedom</strong> of foreigners to visit 7.82 7.82 7.82<br />
Area 5. Regulation 3.52 3.34 3.58 5.27 6.19 6.70 6.37 7.11<br />
A. Credit market regulations 1.75 1.14 3.81 5.38 6.30 8.03 7.29 9.27<br />
(i) Ownership of banks 0.00 0.00 0.00 0.00 0.00 5.00 5.00 10.00<br />
(ii) Private sector credit 5.25 3.43 5.43 8.14 8.89 9.10 7.87 7.80<br />
(iii) Interest rate controls/negative real interest rates 0.00 0.00 6.00 8.00 10.00 10.00 9.00 10.00<br />
B. Labor market regulations 3.35 3.84 4.26 4.87 5.32 5.19<br />
(i) Hiring regulations and minimum wage 4.75 4.20 8.90 8.90 8.90<br />
(ii) Hiring and firing regulations 4.87 4.87 5.43 5.74 5.41 5.07<br />
(iii) Centralized collective bargaining 5.18 5.18 5.18 5.18 6.17 6.99 7.67 7.21<br />
(iv) Hours regulations 4.38 5.51 6.00 8.00 8.00<br />
(v) Mandated cost of worker dismissal 1.56 1.97 1.97<br />
(vi) Conscription 0.00 0.00 0.00 0.00 0.00 0.00 0.00 0.00<br />
C. Business regulations 6.60 8.01 7.20 6.49 6.88<br />
(i) Administrative requirements 8.18 4.36 3.45 3.81<br />
(ii) Bureaucracy costs 6.34 7.73 7.30 4.23 6.76<br />
(iii) Starting a business 5.77 7.68 8.86 8.87 8.87<br />
(iv) Extra payments/bribes/favoritism 7.69 8.44 8.40 8.15 7.21<br />
(v) Licensing restrictions 6.85 6.90 7.30<br />
(vi) Cost of tax compliance 7.42 7.37 7.37
Italy<br />
Country Data Tables • 93<br />
1980 1985 1990 1995 2000 2005 2009 2010<br />
Chain-Linked Rating (Rank) Rating (Rank) Rating (Rank) Rating (Rank) Rating (Rank) Rating (Rank) Rating (Rank) Rating (Rank)<br />
Summary Rating (Rank) 5.37 (49) 5.57 (43) 6.60 (29) 6.66 (43) 7.36 (36) 7.33 (42) 6.72 (70) 6.73 (71)<br />
Area 1. Size of Government 4.10 (76) 2.96 (101) 3.33 (103) 3.75 (107) 4.62 (100) 5.92 (88) 3.77 (118) 3.68 (119)<br />
Area 2. Legal System and Property Rights 5.70 (37) 6.78 (21) 7.73 (21) 6.47 (46) 7.66 (29) 6.23 (56) 5.82 (67) 5.95 (61)<br />
Area 3. Sound Money 5.55 (78) 6.29 (76) 9.28 (16) 9.58 (17) 9.47 (21) 9.52 (23) 9.58 (13) 9.66 (11)<br />
Area 4. <strong>Freedom</strong> to Trade Internationally 7.52 (15) 7.57 (16) 7.58 (26) 8.62 (20) 9.01 (16) 8.05 (25) 7.87 (37) 7.66 (39)<br />
Area 5. Regulation 4.00 (89) 4.24 (89) 5.10 (75) 4.91 (94) 6.03 (81) 6.81 (60) 6.46 (84) 6.60 (82)<br />
Unadjusted<br />
Summary Rating (Rank) 5.58 (43) 5.78 (37) 6.75 (28) 6.61 (43) 7.36 (34) 7.37 (43) 6.76 (81) 6.77 (83)<br />
Rating (Data) Rating (Data) Rating (Data) Rating (Data) Rating (Data) Rating (Data) Rating (Data) Rating (Data)<br />
Area 1. Size of Government 4.10 2.96 3.33 3.75 4.62 5.92 3.77 3.68<br />
A. Government consumption 5.96 (19.75) 5.48 (21.37) 5.22 (22.26) 5.67 (20.71) 4.84 (23.54) 4.20 (25.71) 3.99 (26.45) 4.17 (25.83)<br />
B. Transfers and subsidies 4.44 (20.90) 2.37 (28.50) 3.11 (25.80) 2.32 (28.70) 4.64 (20.17) 4.47 (20.79) 3.59 (24.02) 3.56 (24.15)<br />
C. Government enterprises and investment 6.00 (25.90) 4.00 (33.20) 4.00 (30.30) 6.00 (28.30) 6.00 (28.30) 10.00 (11.37) 4.00 (20.36) 4.00 (16.02)<br />
D. Top marginal tax rate 0.00 0.00 1.00 1.00 3.00 5.00 3.50 3.00<br />
(i) Top marginal income tax rate 0.00 (72) 0.00 (81) 1.00 (66) 1.00 (67) 3.00 (51) 6.00 (43-45) 5.00 (43-45) 5.00 (43-45)<br />
(ii) Top marginal income and payroll tax rate 1.00 (66) 1.00 (67) 3.00 (52) 4.00 (51) 2.00 (59-61) 1.00 (61-62)<br />
Area 2. Legal System and Property Rights 5.70 6.78 7.73 6.47 7.66 6.23 5.82 5.95<br />
A. Judicial independence 5.12 4.84 4.31 4.13 4.99<br />
B. Impartial courts 5.43 5.68 3.66 2.82 2.73<br />
C. Protection of property rights 5.43 7.80 6.79 5.50 5.42<br />
D. Military interference in rule of law and politics 9.39 10.00 10.00 10.00 10.00<br />
E. Integrity of the legal system 6.96 10.00 6.67 6.67 6.67<br />
F. Legal enforcement of contracts 3.18 3.18 3.18<br />
G. Regulatory restrictions on sale of real property 9.29 8.01 8.01<br />
H. Reliability of police 6.47 6.32 5.76<br />
I. Business costs of crime 5.67 5.76 6.77<br />
Area 3. Sound Money 5.55 6.29 9.28 9.58 9.47 9.52 9.58 9.66<br />
A. Money growth 7.33 (13.36) 8.40 (7.99) 9.20 (4.00) 9.89 (0.56) 8.94 (5.29) 8.65 (6.76) 8.64 (6.79) 9.33 (3.34)<br />
B. Standard deviation of inflation 9.04 (2.41) 8.54 (3.65) 9.72 (0.69) 9.43 (1.42) 9.43 (1.43) 9.83 (0.41) 9.85 (0.38) 9.63 (0.93)<br />
C. Inflation: most recent year 5.82 (20.91) 8.20 (9.01) 8.20 (9.01) 8.99 (5.06) 9.49 (2.54) 9.60 (1.99) 9.85 (0.77) 9.69 (1.54)<br />
D. <strong>Freedom</strong> to own foreign currency bank accounts 0.00 0.00 10.00 10.00 10.00 10.00 10.00 10.00<br />
Area 4. <strong>Freedom</strong> to Trade Internationally 8.00 8.05 7.83 8.42 9.01 8.05 7.86 7.66<br />
A. Tariffs 8.99 9.15 8.48 8.70 9.18 8.39 8.22 8.34<br />
(i) Revenue from trade taxes (% of trade sector) 9.73 (0.40) 9.80 (0.30) 9.80 (0.30) 9.80 (0.30) 9.78 (0.33) 9.59 (0.62) 9.44 (0.84) 9.63 (0.55)<br />
(ii) Mean tariff rate 8.24 (8.80) 8.50 (7.50) 8.52 (7.40) 8.66 (6.70) 9.52 (2.40) 9.46 (2.70) 8.94 (5.30) 8.98 (5.10)<br />
(iii) Standard deviation of tariff rates 7.12 (7.20) 7.64 (5.90) 8.24 (4.40) 6.13 (9.67) 6.29 (9.28) 6.41 (8.98)<br />
B. Regulatory trade barriers 6.98 8.51 7.18 6.94 6.14<br />
(i) Non-tariff trade barriers 6.98 7.68 7.00 6.53 6.41<br />
(ii) Compliance cost of importing and exporting 9.33 7.36 7.36 5.88<br />
C. Black-market exchange rates 10.00 10.00 10.00 10.00 10.00 10.00 10.00 10.00<br />
D. Controls of the movement of capital and people 5.00 5.00 5.00 8.00 8.36 6.62 6.27 6.16<br />
(i) Foreign ownership/investment restrictions 8.00 9.04 5.59 5.32 4.97<br />
(ii) Capital controls 5.00 5.00 5.00 8.00 7.69 7.69 6.92 6.92<br />
(iii) <strong>Freedom</strong> of foreigners to visit 6.58 6.58 6.58<br />
Area 5. Regulation 4.57 4.85 5.56 4.86 6.03 7.13 6.77 6.91<br />
A. Credit market regulations 5.02 5.58 6.93 7.18 8.22 8.74 7.98 8.65<br />
(i) Ownership of banks 5.00 5.00 5.00 5.00 5.00 8.00 8.00 10.00<br />
(ii) Private sector credit 6.06 5.73 5.80 6.55 9.65 8.21 6.95 6.95<br />
(iii) Interest rate controls/negative real interest rates 4.00 6.00 10.00 10.00 10.00 10.00 9.00 9.00<br />
B. Labor market regulations 4.12 4.12 4.20 3.49 3.53 6.49 6.76 6.48<br />
(i) Hiring regulations and minimum wage 3.40 4.01 6.70 5.57 3.90<br />
(ii) Hiring and firing regulations 2.62 2.62 2.10 2.80 3.09 3.26<br />
(iii) Centralized collective bargaining 4.49 4.49 4.49 4.49 3.68 3.59 3.88 3.70<br />
(iv) Hours regulations 6.86 6.86 6.69 3.95 4.84 6.00 8.00 8.00<br />
(v) Mandated cost of worker dismissal 9.81 10.00 10.00<br />
(vi) Conscription 1.00 1.00 3.00 3.00 3.00 10.00 10.00 10.00<br />
C. Business regulations 3.91 6.34 6.17 5.57 5.59<br />
(i) Administrative requirements 6.85 1.73 2.03 1.81<br />
(ii) Bureaucracy costs 4.71 6.05 6.08 3.76 4.40<br />
(iii) Starting a business 4.10 5.08 9.34 9.58 9.58<br />
(iv) Extra payments/bribes/favoritism 2.91 7.39 7.44 4.74 4.51<br />
(v) Licensing restrictions 6.46 6.47 6.46<br />
(vi) Cost of tax compliance 5.96 6.81 6.81<br />
www.freetheworld.com • www.fraserinstitute.org • Fraser Institute ©2012
94 • <strong>Economic</strong> <strong>Freedom</strong> of the <strong>World</strong>: 2012 Annual Report<br />
Jamaica<br />
Fraser Institute ©2012 • www.fraserinstitute.org • www.freetheworld.com<br />
1980 1985 1990 1995 2000 2005 2009 2010<br />
Chain-Linked Rating (Rank) Rating (Rank) Rating (Rank) Rating (Rank) Rating (Rank) Rating (Rank) Rating (Rank) Rating (Rank)<br />
Summary Rating (Rank) 3.92 (87) 4.85 (73) 5.48 (58) 6.65 (44) 7.57 (23) 7.62 (26) 7.25 (41) 6.95 (62)<br />
Area 1. Size of Government 2.53 (101) 6.69 (12) 7.49 (8) 7.86 (15) 8.52 (6) 8.66 (8) 8.74 (5) 7.62 (27)<br />
Area 2. Legal System and Property Rights 3.01 (66) 3.24 (86) 3.89 (78) 5.09 (81) 5.58 (68) 5.88 (61) 5.93 (63) 5.93 (62)<br />
Area 3. Sound Money 5.19 (88) 4.10 (99) 4.96 (90) 6.10 (71) 8.72 (43) 8.64 (57) 8.22 (65) 7.98 (78)<br />
Area 4. <strong>Freedom</strong> to Trade Internationally 2.88 (68) 4.57 (55) 4.07 (76) 7.34 (48) 7.80 (48) 7.22 (57) 6.74 (76) 6.67 (84)<br />
Area 5. Regulation 5.78 (41) 5.76 (44) 7.20 (16) 6.83 (29) 7.21 (28) 7.81 (14) 6.77 (64) 6.69 (79)<br />
Unadjusted<br />
Summary Rating (Rank) 3.98 (88) 5.09 (63) 5.62 (53) 6.72 (41) 7.48 (26) 7.50 (31) 7.14 (56) 6.84 (79)<br />
Rating (Data) Rating (Data) Rating (Data) Rating (Data) Rating (Data) Rating (Data) Rating (Data) Rating (Data)<br />
Area 1. Size of Government 2.23 6.91 7.49 7.86 8.52 8.66 8.74 7.62<br />
A. Government consumption 4.68 (24.08) 6.64 (17.41) 6.35 (18.40) 6.37 (18.33) 6.09 (19.30) 6.70 (17.23) 7.16 (15.64) 6.73 (17.11)<br />
B. Transfers and subsidies 10.00 (0.50) 9.59 (2.00) 9.07 (3.90) 10.00 (0.00) 9.92 (0.78) 9.79 (1.27) 9.76 (1.39)<br />
C. Government enterprises and investment 2.00 (46.50) 10.00 (13.40) 8.00 (16.50) 8.00 (17.00) 10.00 (10.30) 10.00 (6.10) 10.00 (6.10) 7.00 (21.92)<br />
D. Top marginal tax rate 0.00 1.00 6.00 8.00 8.00 8.00 8.00 7.00<br />
(i) Top marginal income tax rate 0.00 (80) 1.00 (58) 7.00 (33) 9.00 (25) 9.00 (25) 9.00 (25) 9.00 (25) 8.00 (35)<br />
(ii) Top marginal income and payroll tax rate 5.00 (37) 7.00 (31) 7.00 (31) 7.00 (33) 7.00 (33) 6.00 (44)<br />
Area 2. Legal System and Property Rights 3.28 3.52 4.23 5.14 5.17 4.84 4.88 4.88<br />
A. Judicial independence 5.40 5.76 5.72<br />
B. Impartial courts 4.27 4.90 4.67 3.91 3.97<br />
C. Protection of property rights 4.10 6.59 5.45 5.52<br />
D. Military interference in rule of law and politics 5.39 10.00 10.00 10.00 10.00<br />
E. Integrity of the legal system 6.96 3.33 4.17 3.33 3.33<br />
F. Legal enforcement of contracts 3.44 2.76 2.76<br />
G. Regulatory restrictions on sale of real property 4.52 6.84 6.84<br />
H. Reliability of police 2.97 3.99 1.53<br />
I. Business costs of crime 1.78 1.89 4.23<br />
Area 3. Sound Money 5.19 4.10 4.96 6.10 8.72 8.64 8.22 7.98<br />
A. Money growth 6.54 (17.28) 6.93 (15.34) 7.76 (11.21) 4.67 (26.67) 8.62 (6.89) 8.37 (8.13) 8.60 (7.00) 8.18 (9.09)<br />
B. Standard deviation of inflation 7.88 (5.29) 5.61 (10.97) 8.20 (4.49) 5.31 (11.73) 7.90 (5.26) 9.24 (1.89) 6.18 (9.55) 6.24 (9.40)<br />
C. Inflation: most recent year 6.33 (18.34) 3.86 (30.69) 3.86 (30.69) 4.41 (27.93) 8.37 (8.17) 6.94 (15.30) 8.09 (9.57) 7.48 (12.61)<br />
D. <strong>Freedom</strong> to own foreign currency bank accounts 0.00 0.00 0.00 10.00 10.00 10.00 10.00 10.00<br />
Area 4. <strong>Freedom</strong> to Trade Internationally 3.35 5.31 4.40 7.84 7.80 7.70 7.18 7.11<br />
A. Tariffs 8.05 7.73 6.60 6.92 7.28 7.33 7.27 7.27<br />
(i) Revenue from trade taxes (% of trade sector) 9.40 (0.90) 8.87 (1.70) 8.55 (2.18) 8.49 (2.27) 7.66 (3.51) 7.56 (3.66) 7.56 (3.66)<br />
(ii) Mean tariff rate 6.70 (16.50) 6.60 (17.00) 6.60 (17.00) 7.20 (14.00) 7.88 (10.60) 8.54 (7.30) 8.50 (7.50) 8.50 (7.50)<br />
(iii) Standard deviation of tariff rates 5.00 (12.50) 5.48 (11.30) 5.80 (10.51) 5.74 (10.65) 5.74 (10.65)<br />
B. Regulatory trade barriers 5.73 6.45 6.58 6.31<br />
(i) Non-tariff trade barriers 5.73 5.86 6.13 6.00<br />
(ii) Compliance cost of importing and exporting 7.03 7.03 6.63<br />
C. Black-market exchange rates 0.00 6.20 4.60 8.60 10.00 10.00 10.00 10.00<br />
D. Controls of the movement of capital and people 2.00 2.00 2.00 8.00 8.18 7.02 4.88 4.87<br />
(i) Foreign ownership/investment restrictions 8.67 7.63 6.59 6.55<br />
(ii) Capital controls 2.00 2.00 2.00 8.00 7.69 5.38 0.00 0.00<br />
(iii) <strong>Freedom</strong> of foreigners to visit 8.05 8.05 8.05<br />
Area 5. Regulation 5.85 5.62 7.02 6.66 7.21 7.68 6.67 6.59<br />
A. Credit market regulations 5.06 5.00 8.72 7.76 8.76 9.49 6.33 6.33<br />
(i) Ownership of banks 5.00 10.00 10.00 10.00 10.00 10.00 10.00<br />
(ii) Private sector credit 6.13 5.99 8.17 7.29 7.27 9.48 0.00 0.00<br />
(iii) Interest rate controls/negative real interest rates 4.00 4.00 8.00 6.00 9.00 9.00 9.00 9.00<br />
B. Labor market regulations 6.45 7.63 7.74 7.61<br />
(i) Hiring regulations and minimum wage 3.98 8.90 8.90 8.90<br />
(ii) Hiring and firing regulations 4.77 5.27 5.15 4.86<br />
(iii) Centralized collective bargaining 7.07 7.35 7.00 6.52<br />
(iv) Hours regulations 10.00 10.00 10.00<br />
(v) Mandated cost of worker dismissal 4.25 5.36 5.36<br />
(vi) Conscription 10.00 10.00 10.00 10.00 10.00 10.00 10.00 10.00<br />
C. Business regulations 6.42 5.93 5.94 5.83<br />
(i) Administrative requirements 6.83 2.85 2.84 2.68<br />
(ii) Bureaucracy costs 6.88 5.41 5.11 4.61<br />
(iii) Starting a business 5.70 9.65 9.69 9.70<br />
(iv) Extra payments/bribes/favoritism 6.28 6.10 4.72 4.49<br />
(v) Licensing restrictions 6.22 7.91 8.14<br />
(vi) Cost of tax compliance 5.36 5.36 5.36
Japan<br />
Country Data Tables • 95<br />
1980 1985 1990 1995 2000 2005 2009 2010<br />
Chain-Linked Rating (Rank) Rating (Rank) Rating (Rank) Rating (Rank) Rating (Rank) Rating (Rank) Rating (Rank) Rating (Rank)<br />
Summary Rating (Rank) 6.88 (12) 7.05 (11) 7.58 (11) 7.50 (20) 7.90 (14) 7.83 (17) 7.59 (22) 7.61 (23)<br />
Area 1. Size of Government 5.68 (31) 5.83 (29) 5.83 (50) 4.95 (88) 5.71 (79) 5.72 (92) 5.89 (74) 5.80 (79)<br />
Area 2. Legal System and Property Rights 7.91 (8) 7.25 (16) 7.73 (18) 8.13 (20) 8.18 (20) 7.85 (23) 7.45 (29) 7.49 (28)<br />
Area 3. Sound Money 8.28 (15) 8.54 (20) 9.80 (1) 9.72 (8) 9.65 (8) 9.66 (6) 9.77 (1) 9.89 (1)<br />
Area 4. <strong>Freedom</strong> to Trade Internationally 6.04 (32) 7.00 (20) 7.86 (20) 7.82 (37) 8.55 (28) 7.71 (42) 7.42 (50) 7.19 (60)<br />
Area 5. Regulation 6.56 (21) 6.60 (22) 6.71 (27) 6.81 (30) 7.40 (19) 8.24 (9) 7.45 (21) 7.72 (15)<br />
Unadjusted<br />
Summary Rating (Rank) 7.37 (8) 7.55 (8) 7.96 (8) 7.42 (21) 7.90 (14) 7.86 (15) 7.62 (19) 7.64 (20)<br />
Rating (Data) Rating (Data) Rating (Data) Rating (Data) Rating (Data) Rating (Data) Rating (Data) Rating (Data)<br />
Area 1. Size of Government 5.80 5.95 5.83 4.95 5.71 5.72 5.89 5.80<br />
A. Government consumption 7.56 (14.29) 7.65 (13.98) 7.80 (13.47) 5.50 (21.32) 5.04 (22.85) 4.76 (23.82) 4.45 (24.88) 4.26 (25.50)<br />
B. Transfers and subsidies 7.63 (9.20) 7.17 (10.90) 7.00 (11.50) 6.81 (12.20) 6.81 (12.20) 5.10 (18.47) 4.10 (22.16) 3.95 (22.72)<br />
C. Government enterprises and investment 8.00 (19.60) 8.00 (17.90) 7.00 (20.40) 6.00 (28.50) 6.00 (28.50) 8.00 (15.33) 10.00 (12.86) 10.00 (12.86)<br />
D. Top marginal tax rate 0.00 1.00 1.50 1.50 5.00 5.00 5.00 5.00<br />
(i) Top marginal income tax rate 0.00 (75) 1.00 (70) 2.00 (65) 2.00 (65) 5.00 (50) 5.00 (50) 5.00 (50) 5.00 (50)<br />
(ii) Top marginal income and payroll tax rate 1.00 (69) 1.00 (69) 5.00 (50) 5.00 (50) 5.00 (50) 5.00 (50)<br />
Area 2. Legal System and Property Rights 7.91 7.25 7.73 8.13 8.18 7.88 7.48 7.52<br />
A. Judicial independence 8.33 8.02 7.60 7.83 8.05<br />
B. Impartial courts 6.13 7.01 7.31 5.87 5.92<br />
C. Protection of property rights 6.83 7.55 8.73 7.64 7.81<br />
D. Military interference in rule of law and politics 9.38 10.00 8.33 8.33 8.33<br />
E. Integrity of the legal system 10.00 8.33 8.33 8.33 8.33<br />
F. Legal enforcement of contracts 6.37 6.37 5.80<br />
G. Regulatory restrictions on sale of real property 8.06 7.93 7.86<br />
H. Reliability of police 7.79 8.03 7.45<br />
I. Business costs of crime 8.43 7.02 8.10<br />
Area 3. Sound Money 8.28 8.54 9.80 9.72 9.65 9.66 9.77 9.89<br />
A. Money growth 9.92 (0.39) 9.93 (−0.37) 9.96 (0.22) 9.46 (2.70) 9.09 (4.56) 8.80 (6.00) 9.46 (2.72) 9.93 (−0.33)<br />
B. Standard deviation of inflation 9.28 (1.80) 9.65 (0.87) 9.66 (0.84) 9.53 (1.17) 9.65 (0.89) 9.91 (0.22) 9.91 (0.22) 9.76 (0.61)<br />
C. Inflation: most recent year 8.91 (5.44) 9.58 (2.12) 9.58 (2.12) 9.87 (−0.64) 9.86 (−0.71) 9.95 (−0.27) 9.73 (−1.35) 9.86 (−0.72)<br />
D. <strong>Freedom</strong> to own foreign currency bank accounts 5.00 5.00 10.00 10.00 10.00 10.00 10.00 10.00<br />
Area 4. <strong>Freedom</strong> to Trade Internationally 6.92 8.02 8.74 7.37 8.55 7.67 7.38 7.16<br />
A. Tariffs 8.75 9.06 8.23 8.10 8.43 6.11 6.80 7.13<br />
(i) Revenue from trade taxes (% of trade sector) 9.40 (0.90) 9.47 (0.80) 9.40 (0.90) 8.93 (1.60) 9.00 (1.50) 9.00 (1.50) 9.61 (0.59) 9.61 (0.59)<br />
(ii) Mean tariff rate 8.10 (9.50) 8.66 (6.70) 8.62 (6.90) 8.74 (6.30) 9.10 (4.50) 9.34 (3.30) 9.02 (4.90) 9.12 (4.40)<br />
(iii) Standard deviation of tariff rates 6.68 (8.30) 6.64 (8.40) 7.20 (7.00) 0.00 (25.59) 1.77 (20.58) 2.66 (18.35)<br />
B. Regulatory trade barriers 3.68 7.37 7.33 7.12 5.98<br />
(i) Non-tariff trade barriers 3.68 5.42 6.03 5.61 5.16<br />
(ii) Compliance cost of importing and exporting 9.33 8.64 8.64 6.81<br />
C. Black-market exchange rates 10.00 10.00 10.00 10.00 10.00 10.00 10.00 10.00<br />
D. Controls of the movement of capital and people 2.00 5.00 8.00 7.70 8.40 7.23 5.59 5.51<br />
(i) Foreign ownership/investment restrictions 7.40 9.11 6.31 6.01 5.78<br />
(ii) Capital controls 2.00 5.00 8.00 8.00 7.69 8.46 3.85 3.85<br />
(iii) <strong>Freedom</strong> of foreigners to visit 6.92 6.92 6.92<br />
Area 5. Regulation 7.92 7.97 7.71 6.91 7.40 8.36 7.56 7.83<br />
A. Credit market regulations 7.82 7.88 8.22 8.22 8.22 9.22 8.22 8.14<br />
(i) Ownership of banks 5.00 5.00 5.00 5.00 5.00 8.00 8.00 8.00<br />
(ii) Private sector credit 8.45 8.65 9.65 9.65 9.65 9.65 6.65 6.42<br />
(iii) Interest rate controls/negative real interest rates 10.00 10.00 10.00 10.00 10.00 10.00 10.00 10.00<br />
B. Labor market regulations 8.03 8.06 7.20 7.46 6.48 8.47 8.35 8.30<br />
(i) Hiring regulations and minimum wage 7.55 3.99 8.90 8.90 8.90<br />
(ii) Hiring and firing regulations 4.82 4.82 4.18 4.62 3.29 2.97<br />
(iii) Centralized collective bargaining 7.93 7.93 7.93 7.93 7.40 8.37 7.93 7.96<br />
(iv) Hours regulations 6.16 6.25 6.07 6.98 6.85 9.30 10.00 10.00<br />
(v) Mandated cost of worker dismissal 9.63 10.00 10.00<br />
(vi) Conscription 10.00 10.00 10.00 10.00 10.00 10.00 10.00 10.00<br />
C. Business regulations 5.06 7.50 7.39 6.11 7.04<br />
(i) Administrative requirements 6.50 4.29 3.80 3.66<br />
(ii) Bureaucracy costs 5.86 9.13 7.14 1.50 7.29<br />
(iii) Starting a business 4.72 5.85 9.18 9.18 9.18<br />
(iv) Extra payments/bribes/favoritism 4.60 8.50 8.94 8.33 8.06<br />
(v) Licensing restrictions 8.71 7.83 7.72<br />
(vi) Cost of tax compliance 6.08 6.02 6.30<br />
www.freetheworld.com • www.fraserinstitute.org • Fraser Institute ©2012
96 • <strong>Economic</strong> <strong>Freedom</strong> of the <strong>World</strong>: 2012 Annual Report<br />
Jordan<br />
Fraser Institute ©2012 • www.fraserinstitute.org • www.freetheworld.com<br />
1980 1985 1990 1995 2000 2005 2009 2010<br />
Chain-Linked Rating (Rank) Rating (Rank) Rating (Rank) Rating (Rank) Rating (Rank) Rating (Rank) Rating (Rank) Rating (Rank)<br />
Summary Rating (Rank) 5.32 (52) 5.71 (42) 5.81 (47) 6.45 (51) 7.40 (34) 7.61 (27) 7.14 (50) 7.61 (24)<br />
Area 1. Size of Government 5.33 (42) 5.14 (51) 7.27 (13) 6.38 (48) 6.08 (68) 6.85 (54) 4.90 (104) 7.56 (29)<br />
Area 2. Legal System and Property Rights 2.32 (77) 3.52 (81) 3.99 (74) 5.95 (54) 7.22 (38) 6.86 (42) 6.76 (41) 6.53 (49)<br />
Area 3. Sound Money 6.82 (32) 7.74 (30) 6.20 (69) 7.15 (53) 9.67 (7) 9.21 (37) 9.27 (36) 9.19 (44)<br />
Area 4. <strong>Freedom</strong> to Trade Internationally 6.02 (33) 6.04 (32) 5.74 (48) 6.27 (70) 7.22 (62) 7.76 (40) 7.66 (44) 7.61 (44)<br />
Area 5. Regulation 6.31 (29) 6.24 (35) 6.21 (41) 6.68 (34) 6.83 (44) 7.37 (26) 6.94 (54) 7.21 (37)<br />
Unadjusted<br />
Summary Rating (Rank) 5.23 (52) 5.65 (43) 5.60 (54) 6.39 (53) 7.40 (32) 7.63 (21) 7.16 (54) 7.63 (23)<br />
Rating (Data) Rating (Data) Rating (Data) Rating (Data) Rating (Data) Rating (Data) Rating (Data) Rating (Data)<br />
Area 1. Size of Government 4.77 4.60 6.12 5.71 6.08 6.27 4.48 6.92<br />
A. Government consumption 3.89 (26.78) 5.04 (22.85) 4.37 (25.14) 3.72 (27.36) 4.75 (23.84) 6.66 (17.34) 5.28 (22.04) 5.82 (20.21)<br />
B. Transfers and subsidies 8.42 (6.30) 8.75 (5.10) 9.13 (3.70) 9.40 (2.70) 9.56 (2.13) 6.42 (13.63) 7.65 (9.12) 8.35 (6.55)<br />
C. Government enterprises and investment 2.00 (48.70) 0.00 (56.20) 6.00 (27.60) 4.00 (30.50) 2.00 (43.60) 7.00 (23.90) 0.00 (56.80) 6.00 (25.59)<br />
D. Top marginal tax rate 5.00 8.00 5.00 5.00 7.50<br />
(i) Top marginal income tax rate 5.00 (45) 8.00 (30) 7.00 (35) 7.00 (35) 10.00 (14)<br />
(ii) Top marginal income and payroll tax rate 3.00 (46) 3.00 (46) 5.00 (40)<br />
Area 2. Legal System and Property Rights 2.32 3.52 3.99 5.95 7.22 6.79 6.69 6.47<br />
A. Judicial independence 6.45 8.18 6.53 6.02 5.59<br />
B. Impartial courts 5.85 6.85 6.32 5.28 4.74<br />
C. Protection of property rights 4.33 6.05 6.63 7.33 6.98<br />
D. Military interference in rule of law and politics 6.16 8.33 8.33 8.33 8.33<br />
E. Integrity of the legal system 6.96 6.67 6.67 6.67 6.67<br />
F. Legal enforcement of contracts 3.38 3.38 3.38<br />
G. Regulatory restrictions on sale of real property 6.32 7.14 7.14<br />
H. Reliability of police 8.27 7.83 7.73<br />
I. Business costs of crime 8.64 8.25 7.64<br />
Area 3. Sound Money 6.82 7.74 6.20 7.15 9.67 9.21 9.27 9.19<br />
A. Money growth 5.86 (20.70) 9.17 (−4.13) 8.36 (8.18) 9.77 (−1.14) 9.85 (0.75) 8.03 (9.87) 9.15 (4.23) 9.46 (2.72)<br />
B. Standard deviation of inflation 6.64 (8.40) 7.09 (7.27) 6.74 (8.14) 9.52 (1.21) 8.97 (2.57) 9.51 (1.23) 8.06 (4.85) 8.31 (4.22)<br />
C. Inflation: most recent year 9.78 (1.10) 9.71 (−1.45) 9.71 (−1.45) 9.32 (3.39) 9.87 (0.67) 9.30 (3.49) 9.86 (−0.68) 9.00 (5.01)<br />
D. <strong>Freedom</strong> to own foreign currency bank accounts 5.00 5.00 0.00 0.00 10.00 10.00 10.00 10.00<br />
Area 4. <strong>Freedom</strong> to Trade Internationally 5.76 6.00 4.81 6.63 7.22 7.94 7.85 7.79<br />
A. Tariffs 5.27 6.59 4.63 6.20 4.35 6.54 6.77 6.86<br />
(i) Revenue from trade taxes (% of trade sector) 5.27 (7.10) 5.93 (6.10) 6.67 (5.00) 6.20 (5.70) 6.98 (4.53) 8.21 (2.68) 8.72 (1.92) 8.85 (1.72)<br />
(ii) Mean tariff rate 7.24 (13.80) 5.20 (24.00) 7.52 (12.40) 7.96 (10.20) 8.00 (10.00)<br />
(iii) Standard deviation of tariff rates 2.60 (18.50) 0.88 (22.80) 3.88 (15.30) 3.64 (15.91) 3.72 (15.70)<br />
B. Regulatory trade barriers 5.08 6.34 6.73 6.77 6.59<br />
(i) Non-tariff trade barriers 5.08 5.35 6.26 5.68 5.61<br />
(ii) Compliance cost of importing and exporting 7.33 7.20 7.87 7.56<br />
C. Black-market exchange rates 10.00 9.40 7.80 9.80 10.00 10.00 10.00 10.00<br />
D. Controls of the movement of capital and people 2.00 2.00 2.00 5.43 8.20 8.51 7.84 7.74<br />
(i) Foreign ownership/investment restrictions 8.85 8.71 7.83 6.60 6.28<br />
(ii) Capital controls 2.00 2.00 2.00 2.00 7.69 7.69 6.92 6.92<br />
(iii) <strong>Freedom</strong> of foreigners to visit 10.00 10.00 10.00<br />
Area 5. Regulation 6.49 6.42 6.89 6.53 6.83 7.95 7.48 7.79<br />
A. Credit market regulations 7.01 6.70 5.72 6.77 7.79 9.37 7.12 8.05<br />
(i) Ownership of banks 5.00 5.00 5.00 5.00 5.00 10.00 10.00 10.00<br />
(ii) Private sector credit 9.02 8.40 8.16 9.31 8.38 8.10 1.35 4.14<br />
(iii) Interest rate controls/negative real interest rates 4.00 6.00 10.00 10.00 10.00 10.00<br />
B. Labor market regulations 8.07 7.34 6.50 8.39 8.44 8.41<br />
(i) Hiring regulations and minimum wage 6.62 3.75 8.90 8.90 8.90<br />
(ii) Hiring and firing regulations 6.27 6.27 4.45 3.91 4.21 4.11<br />
(iii) Centralized collective bargaining 7.93 7.93 7.93 7.93 7.80 7.93 7.51 7.44<br />
(iv) Hours regulations 5.88 6.51 10.00 10.00 10.00<br />
(v) Mandated cost of worker dismissal 9.63 10.00 10.00<br />
(vi) Conscription 10.00 10.00 10.00 10.00 10.00 10.00 10.00 10.00<br />
C. Business regulations 5.49 6.20 6.10 6.90 6.90<br />
(i) Administrative requirements 7.55 4.33 4.13 3.79<br />
(ii) Bureaucracy costs 5.40 4.60 3.07 4.77 5.20<br />
(iii) Starting a business 6.57 6.27 5.91 9.06 9.47<br />
(iv) Extra payments/bribes/favoritism 4.50 6.37 7.08 6.22 5.44<br />
(v) Licensing restrictions 7.34 8.35 8.81<br />
(vi) Cost of tax compliance 8.87 8.87 8.70
Country Data Tables • 97<br />
Kazakhstan 1980 1985 1990 1995 2000 2005 2009 2010<br />
Chain-Linked Rating (Rank) Rating (Rank) Rating (Rank) Rating (Rank) Rating (Rank) Rating (Rank) Rating (Rank) Rating (Rank)<br />
Summary Rating (Rank) <br />
Area 1. Size of Government<br />
Area 2. Legal System and Property Rights<br />
Area 3. Sound Money<br />
Area 4. <strong>Freedom</strong> to Trade Internationally<br />
Area 5. Regulation<br />
Unadjusted<br />
Summary Rating (Rank) 6.82 (73) 6.87 (73) 6.97 (70)<br />
Rating (Data) Rating (Data) Rating (Data) Rating (Data) Rating (Data) Rating (Data) Rating (Data) Rating (Data)<br />
Area 1. Size of Government 7.91 6.83 7.09<br />
A. Government consumption 6.39 (18.27) 5.56 (21.10) 6.48 (17.97)<br />
B. Transfers and subsidies 8.76 (5.06) 8.78 (4.98) 8.89 (4.59)<br />
C. Government enterprises and investment 7.00 (21.09) 4.00 (19.85) 4.00 (21.09)<br />
D. Top marginal tax rate 9.50 9.00 9.00<br />
(i) Top marginal income tax rate 10.00 (20) 10.00 (10) 10.00 (10)<br />
(ii) Top marginal income and payroll tax rate 9.00 (25) 8.00 (30) 8.00 (30)<br />
Area 2. Legal System and Property Rights 5.71 5.74 5.66<br />
A. Judicial independence 2.89 3.10 2.90<br />
B. Impartial courts 4.13 3.85 3.76<br />
C. Protection of property rights 4.89 4.11 4.29<br />
D. Military interference in rule of law and politics 8.33 8.33 8.33<br />
E. Integrity of the legal system 6.67 6.67 6.67<br />
F. Legal enforcement of contracts 6.19 6.19 6.19<br />
G. Regulatory restrictions on sale of real property 8.62 9.21 9.21<br />
H. Reliability of police 4.56 3.80 5.77<br />
I. Business costs of crime 5.11 6.39 3.84<br />
Area 3. Sound Money 6.85 8.29 8.24<br />
A. Money growth 5.86 (20.71) 7.37 (13.15) 7.20 (13.99)<br />
B. Standard deviation of inflation 8.07 (4.82) 7.26 (6.85) 7.20 (7.00)<br />
C. Inflation: most recent year 8.48 (7.58) 8.54 (7.31) 8.58 (7.12)<br />
D. <strong>Freedom</strong> to own foreign currency bank accounts 5.00 10.00 10.00<br />
Area 4. <strong>Freedom</strong> to Trade Internationally 6.12 5.78 6.37<br />
A. Tariffs 9.49 8.17 6.90<br />
(i) Revenue from trade taxes (% of trade sector) 9.56 (0.66) 9.43 (0.85) 8.70 (1.95) 7.05 (4.42)<br />
(ii) Mean tariff rate 9.54 (2.30) 8.82 (5.90) 8.16 (9.20)<br />
(iii) Standard deviation of tariff rates 7.00 (7.49) 5.47 (11.32)<br />
B. Regulatory trade barriers 2.42 2.83 6.04<br />
(i) Non-tariff trade barriers 4.59 4.84 4.94<br />
(ii) Compliance cost of importing and exporting 0.25 0.82 7.13<br />
C. Black-market exchange rates 10.00 10.00 10.00<br />
D. Controls of the movement of capital and people 2.56 2.13 2.56<br />
(i) Foreign ownership/investment restrictions 6.14 4.85 5.38<br />
(ii) Capital controls 1.54 1.54 2.31<br />
(iii) <strong>Freedom</strong> of foreigners to visit 0.00 0.00 0.00<br />
Area 5. Regulation 7.52 7.69 7.48<br />
A. Credit market regulations 10.00 9.76 9.21<br />
(i) Ownership of banks 10.00 10.00 8.00<br />
(ii) Private sector credit 10.00 10.00 9.29 9.62<br />
(iii) Interest rate controls/negative real interest rates 10.00 10.00 10.00<br />
B. Labor market regulations 7.19 7.17 7.14<br />
(i) Hiring regulations and minimum wage 10.00 10.00 10.00<br />
(ii) Hiring and firing regulations 7.61 5.84 5.70<br />
(iii) Centralized collective bargaining 8.34 7.58 7.53<br />
(iv) Hours regulations 8.00 10.00 10.00<br />
(v) Mandated cost of worker dismissal 9.17 9.60 9.60<br />
(vi) Conscription 0.00 0.00 0.00<br />
C. Business regulations 5.37 6.13 6.08<br />
(i) Administrative requirements 3.40 3.70 3.85<br />
(ii) Bureaucracy costs 4.23 5.50 3.89<br />
(iii) Starting a business 9.18 9.38 9.38<br />
(iv) Extra payments/bribes/favoritism 5.54 4.09 3.81<br />
(v) Licensing restrictions 2.90 7.13 7.67<br />
(vi) Cost of tax compliance 6.96 6.96 7.89<br />
www.freetheworld.com • www.fraserinstitute.org • Fraser Institute ©2012
98 • <strong>Economic</strong> <strong>Freedom</strong> of the <strong>World</strong>: 2012 Annual Report<br />
Kenya<br />
Fraser Institute ©2012 • www.fraserinstitute.org • www.freetheworld.com<br />
1980 1985 1990 1995 2000 2005 2009 2010<br />
Chain-Linked Rating (Rank) Rating (Rank) Rating (Rank) Rating (Rank) Rating (Rank) Rating (Rank) Rating (Rank) Rating (Rank)<br />
Summary Rating (Rank) 4.80 (65) 5.29 (52) 5.43 (63) 5.89 (71) 6.72 (57) 7.09 (53) 6.91 (62) 6.91 (64)<br />
Area 1. Size of Government 3.79 (86) 3.94 (83) 4.83 (79) 5.70 (72) 7.09 (30) 7.82 (27) 7.16 (33) 7.04 (39)<br />
Area 2. Legal System and Property Rights 4.20 (53) 5.25 (52) 5.30 (53) 3.63 (108) 3.92 (102) 4.57 (86) 4.44 (93) 4.63 (86)<br />
Area 3. Sound Money 6.17 (59) 6.84 (42) 6.66 (58) 6.81 (58) 8.76 (41) 8.62 (58) 8.65 (58) 8.74 (59)<br />
Area 4. <strong>Freedom</strong> to Trade Internationally 3.75 (57) 4.15 (61) 3.87 (80) 7.44 (44) 7.06 (67) 7.04 (65) 7.26 (56) 7.28 (55)<br />
Area 5. Regulation 6.06 (33) 6.26 (34) 6.50 (31) 5.85 (58) 6.75 (47) 7.35 (28) 7.00 (48) 6.82 (64)<br />
Unadjusted<br />
Summary Rating (Rank) 4.84 (65) 5.34 (56) 5.43 (62) 5.91 (69) 6.73 (55) 7.05 (61) 6.87 (73) 6.87 (78)<br />
Rating (Data) Rating (Data) Rating (Data) Rating (Data) Rating (Data) Rating (Data) Rating (Data) Rating (Data)<br />
Area 1. Size of Government 3.79 3.94 4.83 5.70 7.09 7.82 7.16 7.04<br />
A. Government consumption 4.65 (24.20) 4.92 (23.26) 4.96 (23.14) 6.58 (17.63) 6.15 (19.10) 6.36 (18.37) 6.81 (16.85) 6.39 (18.28)<br />
B. Transfers and subsidies 9.51 (2.30) 8.86 (4.70) 9.37 (2.80) 9.22 (3.35) 9.21 (3.40) 9.91 (0.84) 9.81 (1.18) 9.79 (1.27)<br />
C. Government enterprises and investment 0.00 (55.10) 2.00 (49.50) 2.00 (47.10) 4.00 (36.80) 6.00 (27.30) 7.00 (20.50) 4.00 (27.67) 4.00 (29.43)<br />
D. Top marginal tax rate 1.00 0.00 3.00 3.00 7.00 8.00 8.00 8.00<br />
(i) Top marginal income tax rate 1.00 (65) 0.00 (65) 3.00 (50) 3.00 (50) 7.00 (32) 8.00 (30) 8.00 (30) 8.00 (30)<br />
(ii) Top marginal income and payroll tax rate 3.00 (50) 3.00 (50) 7.00 (32) 8.00 (30) 8.00 (30) 8.00 (30)<br />
Area 2. Legal System and Property Rights 4.20 5.25 5.30 3.76 3.97 4.51 4.38 4.56<br />
A. Judicial independence 3.32 2.63 3.24<br />
B. Impartial courts 3.40 3.43 3.33 3.42 4.10<br />
C. Protection of property rights 4.90 4.42 4.42<br />
D. Military interference in rule of law and politics 3.39 5.00 6.67 6.67 6.67<br />
E. Integrity of the legal system 4.11 3.33 3.89 3.33 3.33<br />
F. Legal enforcement of contracts 4.88 4.09 4.09<br />
G. Regulatory restrictions on sale of real property 7.27 7.41 7.38<br />
H. Reliability of police 3.85 3.56 4.12<br />
I. Business costs of crime 2.43 3.86 3.68<br />
Area 3. Sound Money 6.17 6.84 6.66 6.81 8.76 8.62 8.65 8.74<br />
A. Money growth 9.07 (4.63) 9.53 (2.37) 8.85 (5.77) 7.18 (14.09) 8.60 (6.99) 7.80 (10.98) 7.73 (11.37) 7.38 (13.11)<br />
B. Standard deviation of inflation 7.53 (6.18) 9.48 (1.31) 9.44 (1.39) 7.32 (6.71) 8.44 (3.89) 8.75 (3.12) 8.71 (3.23) 8.38 (4.05)<br />
C. Inflation: most recent year 8.09 (9.55) 8.35 (8.23) 8.35 (8.23) 7.74 (11.31) 8.00 (9.98) 7.94 (10.31) 8.15 (9.23) 9.21 (3.96)<br />
D. <strong>Freedom</strong> to own foreign currency bank accounts 0.00 0.00 0.00 5.00 10.00 10.00 10.00 10.00<br />
Area 4. <strong>Freedom</strong> to Trade Internationally 3.98 4.40 3.87 7.44 7.06 6.64 6.84 6.87<br />
A. Tariffs 3.94 3.61 2.81 4.72 5.79 6.88 6.68 6.67<br />
(i) Revenue from trade taxes (% of trade sector) 5.93 (6.10) 5.07 (7.40) 5.80 (6.30) 6.27 (5.59) 6.31 (5.54) 7.75 (3.38) 7.29 (4.07) 7.20 (4.20)<br />
(ii) Mean tariff rate 1.94 (40.30) 2.16 (39.20) 1.26 (43.70) 3.20 (34.00) 6.14 (19.30) 7.58 (12.10) 7.48 (12.60) 7.50 (12.50)<br />
(iii) Standard deviation of tariff rates 1.36 (21.60) 4.68 (13.30) 4.92 (12.70) 5.33 (11.68) 5.26 (11.84) 5.30 (11.75)<br />
B. Regulatory trade barriers 4.78 6.03 6.26<br />
(i) Non-tariff trade barriers 4.14 5.58 5.52<br />
(ii) Compliance cost of importing and exporting 5.42 6.49 7.00<br />
C. Black-market exchange rates 8.00 9.60 8.80 9.60 10.00 10.00 10.00 10.00<br />
D. Controls of the movement of capital and people 0.00 0.00 0.00 8.00 5.38 4.91 4.67 4.55<br />
(i) Foreign ownership/investment restrictions 6.49 5.75 6.17<br />
(ii) Capital controls 0.00 0.00 0.00 8.00 5.38 4.62 4.62 3.85<br />
(iii) <strong>Freedom</strong> of foreigners to visit 3.63 3.63 3.63<br />
Area 5. Regulation 6.06 6.26 6.50 5.85 6.75 7.67 7.30 7.11<br />
A. Credit market regulations 6.17 6.69 7.33 5.60 8.00 10.00 8.47 8.41<br />
(i) Ownership of banks 2.00 2.00 5.00 5.00 5.00 10.00 10.00 10.00<br />
(ii) Private sector credit 8.52 8.06 6.99 7.81 10.00 10.00 6.41 6.23<br />
(iii) Interest rate controls/negative real interest rates 8.00 10.00 10.00 4.00 9.00 10.00 9.00 9.00<br />
B. Labor market regulations 7.55 7.82 7.52<br />
(i) Hiring regulations and minimum wage 6.70 7.77 7.77<br />
(ii) Hiring and firing regulations 5.86 6.53 6.69<br />
(iii) Centralized collective bargaining 7.11 6.63 6.65<br />
(iv) Hours regulations 10.00 10.00 8.00<br />
(v) Mandated cost of worker dismissal 5.64 6.03 6.03<br />
(vi) Conscription 10.00 10.00 10.00 10.00 10.00 10.00 10.00 10.00<br />
C. Business regulations 5.47 5.61 5.41<br />
(i) Administrative requirements 2.91 3.06 3.37<br />
(ii) Bureaucracy costs 4.34 5.06 3.34<br />
(iii) Starting a business 7.78 8.54 8.55<br />
(iv) Extra payments/bribes/favoritism 4.41 2.75 3.01<br />
(v) Licensing restrictions 8.22 8.66 8.59<br />
(vi) Cost of tax compliance 5.16 5.59 5.59
Korea, South<br />
Country Data Tables • 99<br />
1980 1985 1990 1995 2000 2005 2009 2010<br />
Chain-Linked Rating (Rank) Rating (Rank) Rating (Rank) Rating (Rank) Rating (Rank) Rating (Rank) Rating (Rank) Rating (Rank)<br />
Summary Rating (Rank) 5.49 (45) 5.54 (45) 6.31 (36) 6.67 (42) 6.79 (52) 7.26 (46) 7.23 (43) 7.20 (49)<br />
Area 1. Size of Government 5.86 (28) 6.12 (23) 6.49 (29) 6.42 (45) 6.26 (57) 6.66 (63) 6.82 (40) 6.85 (47)<br />
Area 2. Legal System and Property Rights 6.52 (26) 4.16 (71) 5.45 (52) 5.62 (65) 5.97 (62) 6.52 (52) 6.14 (59) 6.14 (55)<br />
Area 3. Sound Money 5.29 (85) 6.41 (69) 6.59 (61) 8.05 (41) 8.27 (51) 9.53 (22) 9.49 (26) 9.58 (20)<br />
Area 4. <strong>Freedom</strong> to Trade Internationally 4.77 (45) 5.40 (44) 7.40 (27) 7.61 (43) 7.19 (64) 6.68 (77) 7.02 (67) 6.68 (83)<br />
Area 5. Regulation 4.99 (70) 5.58 (55) 5.65 (61) 5.65 (71) 6.26 (62) 7.00 (48) 6.76 (65) 6.84 (60)<br />
Unadjusted<br />
Summary Rating (Rank) 5.53 (47) 5.58 (45) 6.38 (35) 6.58 (45) 6.79 (51) 7.46 (35) 7.43 (31) 7.40 (37)<br />
Rating (Data) Rating (Data) Rating (Data) Rating (Data) Rating (Data) Rating (Data) Rating (Data) Rating (Data)<br />
Area 1. Size of Government 5.97 6.24 6.49 6.42 6.26 6.66 6.82 6.85<br />
A. Government consumption 7.29 (15.23) 7.43 (14.74) 7.10 (15.87) 6.99 (16.22) 6.37 (18.33) 5.55 (21.13) 5.07 (22.77) 5.13 (22.56)<br />
B. Transfers and subsidies 9.59 (2.00) 9.54 (2.20) 9.35 (2.90) 7.68 (9.01) 7.68 (9.01) 7.10 (11.13) 8.22 (7.02) 8.28 (6.83)<br />
C. Government enterprises and investment 7.00 (22.60) 6.00 (25.40) 8.00 (19.20) 6.00 (25.50) 6.00 (25.50) 8.00 (18.82) 8.00 (17.18) 8.00 (17.18)<br />
D. Top marginal tax rate 0.00 2.00 1.50 5.00 5.00 6.00 6.00 6.00<br />
(i) Top marginal income tax rate 0.00 (89) 2.00 (65) 2.00 (64) 5.00 (48) 5.00 (44) 6.00 (39) 6.00 (39) 6.00 (39)<br />
(ii) Top marginal income and payroll tax rate 1.00 (66) 5.00 (48) 5.00 (44) 6.00 (39) 6.00 (39) 6.00 (39)<br />
Area 2. Legal System and Property Rights 6.52 4.16 5.45 5.62 5.97 6.90 6.51 6.50<br />
A. Judicial independence 4.87 4.68 5.21 4.98 4.59<br />
B. Impartial courts 5.25 5.18 5.26 3.91 3.71<br />
C. Protection of property rights 4.26 5.00 7.40 6.18 5.92<br />
D. Military interference in rule of law and politics 6.75 8.33 6.67 5.00 6.67<br />
E. Integrity of the legal system 6.96 6.67 8.33 10.00 8.33<br />
F. Legal enforcement of contracts 8.11 8.11 8.11<br />
G. Regulatory restrictions on sale of real property 8.12 8.12 8.12<br />
H. Reliability of police 6.49 6.21 6.57<br />
I. Business costs of crime 6.56 6.05 6.49<br />
Area 3. Sound Money 5.29 6.41 6.59 8.05 8.27 9.53 9.49 9.58<br />
A. Money growth 7.32 (13.39) 8.53 (7.37) 9.11 (4.47) 9.06 (4.68) 9.68 (−1.62) 9.23 (3.86) 9.19 (4.03) 9.57 (2.14)<br />
B. Standard deviation of inflation 8.79 (3.02) 8.04 (4.89) 9.22 (1.94) 9.26 (1.85) 8.87 (2.83) 9.42 (1.45) 9.33 (1.68) 9.32 (1.69)<br />
C. Inflation: most recent year 5.03 (24.87) 9.07 (4.64) 8.02 (9.91) 8.88 (5.60) 9.55 (2.27) 9.45 (2.75) 9.43 (2.83) 9.41 (2.93)<br />
D. <strong>Freedom</strong> to own foreign currency bank accounts 0.00 0.00 0.00 5.00 5.00 10.00 10.00 10.00<br />
Area 4. <strong>Freedom</strong> to Trade Internationally 4.80 5.43 7.42 7.18 7.19 7.21 7.57 7.21<br />
A. Tariffs 6.59 6.50 7.46 7.91 8.35 5.86 5.64 5.64<br />
(i) Revenue from trade taxes (% of trade sector) 7.27 (4.10) 7.60 (3.60) 7.73 (3.40) 8.67 (2.00) 9.15 (1.28) 9.37 (0.95) 9.35 (0.98) 9.35 (0.97)<br />
(ii) Mean tariff rate 5.92 (20.40) 5.40 (23.00) 7.34 (13.30) 7.70 (11.50) 8.26 (8.70) 8.20 (9.00) 7.58 (12.10) 7.58 (12.10)<br />
(iii) Standard deviation of tariff rates 7.32 (6.70) 7.36 (6.60) 7.64 (5.90) 0.00 (49.37) 0.00 (49.25) 0.00 (49.25)<br />
B. Regulatory trade barriers 5.97 6.84 7.19 7.02 5.44<br />
(i) Non-tariff trade barriers 5.97 5.18 5.98 4.98 4.82<br />
(ii) Compliance cost of importing and exporting 8.50 8.41 9.06 6.06<br />
C. Black-market exchange rates 7.80 7.80 9.80 10.00 10.00 10.00 10.00 10.00<br />
D. Controls of the movement of capital and people 0.00 2.00 5.00 4.83 3.58 5.79 7.64 7.76<br />
(i) Foreign ownership/investment restrictions 4.66 7.16 5.82 5.23 5.60<br />
(ii) Capital controls 0.00 2.00 5.00 5.00 0.00 1.54 7.69 7.69<br />
(iii) <strong>Freedom</strong> of foreigners to visit 10.00 10.00 10.00<br />
Area 5. Regulation 5.05 5.65 5.96 5.62 6.26 7.01 6.77 6.86<br />
A. Credit market regulations 6.13 8.11 8.33 8.33 8.33 9.33 9.33 9.33<br />
(i) Ownership of banks 5.00 5.00 5.00 5.00 5.00 8.00 8.00 8.00<br />
(ii) Private sector credit 9.40 9.32 10.00 10.00 10.00 10.00 10.00 10.00<br />
(iii) Interest rate controls/negative real interest rates 4.00 10.00 10.00 10.00 10.00 10.00 10.00 10.00<br />
B. Labor market regulations 3.59 4.43 4.20 4.84 4.44 4.58<br />
(i) Hiring regulations and minimum wage 5.83 4.14 8.90 5.57 6.67<br />
(ii) Hiring and firing regulations 3.53 3.53 4.70 4.71 3.66 3.76<br />
(iii) Centralized collective bargaining 7.24 7.24 7.24 7.24 6.17 7.87 7.46 7.11<br />
(iv) Hours regulations 5.53 6.01 6.00 8.00 8.00<br />
(v) Mandated cost of worker dismissal 1.56 1.97 1.97<br />
(vi) Conscription 0.00 0.00 0.00 0.00 0.00 0.00 0.00 0.00<br />
C. Business regulations 4.10 6.24 6.86 6.54 6.66<br />
(i) Administrative requirements 6.52 3.54 3.01 2.73<br />
(ii) Bureaucracy costs 5.38 7.65 6.31 4.06 5.04<br />
(iii) Starting a business 3.65 5.38 8.28 9.40 9.62<br />
(iv) Extra payments/bribes/favoritism 3.28 5.40 6.51 5.84 5.22<br />
(v) Licensing restrictions 9.79 9.76 9.86<br />
(vi) Cost of tax compliance 6.75 7.20 7.48<br />
www.freetheworld.com • www.fraserinstitute.org • Fraser Institute ©2012
100 • <strong>Economic</strong> <strong>Freedom</strong> of the <strong>World</strong>: 2012 Annual Report<br />
Kuwait<br />
Fraser Institute ©2012 • www.fraserinstitute.org • www.freetheworld.com<br />
1980 1985 1990 1995 2000 2005 2009 2010<br />
Chain-Linked Rating (Rank) Rating (Rank) Rating (Rank) Rating (Rank) Rating (Rank) Rating (Rank) Rating (Rank) Rating (Rank)<br />
Summary Rating (Rank) 4.99 (61) 6.85 (16) 5.46 (61) 6.93 (39) 7.07 (43) 7.46 (35) 7.76 (13) 7.75 (18)<br />
Area 1. Size of Government 10.00 (1) 4.63 (65) 3.89 (96) 5.97 (63) 6.37 (55) 6.72 (60) 6.44 (55) 6.45 (58)<br />
Area 2. Legal System and Property Rights 1.84 (85) 5.85 (40) 2.73 (96) 7.42 (30) 8.06 (23) 8.27 (18) 8.14 (21) 8.04 (22)<br />
Area 3. Sound Money 5.19 (89) 8.93 (15) 7.84 (35) 8.89 (33) 8.09 (57) 7.84 (72) 9.26 (37) 9.26 (41)<br />
Area 4. <strong>Freedom</strong> to Trade Internationally 7.07 (31) 7.13 (53) 7.96 (39) 8.03 (26) 7.93 (32) 8.13 (19)<br />
Area 5. Regulation 6.04 (34) 5.68 (51) 5.88 (47) 5.17 (87) 4.86 (107) 6.60 (74) 7.05 (43) 6.90 (54)<br />
Unadjusted<br />
Summary Rating (Rank) 3.78 (92) 5.70 (39) 5.09 (70) 6.50 (47) 6.85 (48) 7.38 (42) 7.67 (15) 7.66 (19)<br />
Rating (Data) Rating (Data) Rating (Data) Rating (Data) Rating (Data) Rating (Data) Rating (Data) Rating (Data)<br />
Area 1. Size of Government 2.97 1.19 3.15 4.83 6.37 6.72 6.44 6.45<br />
A. Government consumption 3.95 (26.58) 2.38 (31.90) 0.00 (40.57) 0.00 (44.39) 1.41 (35.21) 2.07 (32.97) 1.31 (35.55) 1.35 (35.40)<br />
B. Transfers and subsidies 7.46 (9.83) 7.50 (9.66) 7.08 (11.22) 7.82 (8.49) 7.46 (9.81) 7.46 (9.81)<br />
C. Government enterprises and investment 2.00 (43.50) 0.00 (61.30) 2.00 (46.00) 7.00 (21.80) 7.00 (21.80) 7.00 (21.80) 7.00 7.00<br />
D. Top marginal tax rate 10.00 10.00 10.00 10.00<br />
(i) Top marginal income tax rate 10.00 (0) 10.00 (0) 10.00 (0) 10.00 (0)<br />
(ii) Top marginal income and payroll tax rate 10.00 (0) 10.00 (0) 10.00 (0) 10.00 (0)<br />
Area 2. Legal System and Property Rights 1.84 5.85 2.73 6.49 6.95 7.30 7.18 7.10<br />
A. Judicial independence 6.98 6.55 6.88<br />
B. Impartial courts 7.17 7.51 6.76 5.44 5.06<br />
C. Protection of property rights 6.32 6.53 6.63<br />
D. Military interference in rule of law and politics 8.13 8.33 8.33 8.33 8.33<br />
E. Integrity of the legal system 6.96 8.33 8.33 8.33 8.33<br />
F. Legal enforcement of contracts 5.06 5.06 5.06<br />
G. Regulatory restrictions on sale of real property 8.80 8.80 8.95<br />
H. Reliability of police 7.40 6.74 7.96<br />
I. Business costs of crime 7.70 8.86 6.66<br />
Area 3. Sound Money 5.18 8.92 7.51 8.89 8.09 7.84 9.26 9.26<br />
A. Money growth 7.16 (14.18) 9.63 (−1.85) 9.95 (−0.24) 9.29 (−3.57) 9.89 (−0.55) 7.13 (14.35) 9.04 (4.82) 9.04 (4.81)<br />
B. Standard deviation of inflation 2.07 (19.83) 7.03 (7.43) 4.55 (13.62) 7.54 (6.16) 2.98 (17.55) 5.06 (12.36) 8.80 (3.00) 8.80 (3.01)<br />
C. Inflation: most recent year 1.49 (42.57) 9.03 (4.86) 8.03 (9.83) 8.74 (6.29) 9.50 (2.51) 9.18 (4.12) 9.21 (3.97) 9.20 (4.02)<br />
D. <strong>Freedom</strong> to own foreign currency bank accounts 10.00 10.00 10.00 10.00 10.00 10.00 10.00<br />
Area 4. <strong>Freedom</strong> to Trade Internationally 7.07 7.07 7.13 7.96 7.57 7.47 7.66<br />
A. Tariffs 9.20 9.20 9.40 9.27 8.83 8.52 8.52<br />
(i) Revenue from trade taxes (% of trade sector) 9.20 (1.20) 9.40 (0.90) 9.27 (1.09) 9.49 (0.76) 8.56 (2.16) 8.56 (2.16)<br />
(ii) Mean tariff rate 9.20 (4.00) 9.06 (4.70) 9.06 (4.70) 9.06 (4.70)<br />
(iii) Standard deviation of tariff rates 7.94 (5.15) 7.93 (5.17) 7.93 (5.17)<br />
B. Regulatory trade barriers 7.25 7.09 7.86<br />
(i) Non-tariff trade barriers 7.27 6.63 6.90<br />
(ii) Compliance cost of importing and exporting 7.24 7.55 8.81<br />
C. Black-market exchange rates 10.00 10.00 10.00 10.00 10.00 10.00 10.00 10.00<br />
D. Controls of the movement of capital and people 2.00 2.00 2.00 2.00 4.61 4.18 4.28 4.27<br />
(i) Foreign ownership/investment restrictions 3.72 4.46 3.60<br />
(ii) Capital controls 2.00 2.00 2.00 2.00 4.61 4.61 4.17 5.00<br />
(iii) <strong>Freedom</strong> of foreigners to visit 4.20 4.20 4.20<br />
Area 5. Regulation 5.13 5.49 4.99 5.17 4.86 7.47 7.99 7.81<br />
A. Credit market regulations 7.41 7.66 7.50 7.13 6.33 8.33 10.00 10.00<br />
(i) Ownership of banks 5.00 5.00 5.00 5.00 5.00 10.00 10.00 10.00<br />
(ii) Private sector credit 9.83 7.98 10.00 6.40 6.99 10.00 10.00 10.00<br />
(iii) Interest rate controls/negative real interest rates 10.00 10.00 7.00 5.00 10.00 10.00<br />
B. Labor market regulations 7.78 7.30 6.93<br />
(i) Hiring regulations and minimum wage 10.00 10.00 10.00<br />
(ii) Hiring and firing regulations 5.53 4.95 4.83<br />
(iii) Centralized collective bargaining 8.40 7.91 7.76<br />
(iv) Hours regulations 10.00 8.00 6.00<br />
(v) Mandated cost of worker dismissal 2.77 2.97 2.97<br />
(vi) Conscription 1.00 1.00 0.00 0.00 0.00 10.00 10.00 10.00<br />
C. Business regulations 6.30 6.65 6.51<br />
(i) Administrative requirements 3.16 2.80 2.72<br />
(ii) Bureaucracy costs 1.65 5.25 4.97<br />
(iii) Starting a business 8.53 8.59 8.73<br />
(iv) Extra payments/bribes/favoritism 7.13 5.68 5.37<br />
(v) Licensing restrictions 8.68 8.91 8.58<br />
(vi) Cost of tax compliance 8.68 8.68 8.68
Kyrgyz Republic<br />
Country Data Tables • 101<br />
1980 1985 1990 1995 2000 2005 2009 2010<br />
Chain-Linked Rating (Rank) Rating (Rank) Rating (Rank) Rating (Rank) Rating (Rank) Rating (Rank) Rating (Rank) Rating (Rank)<br />
Summary Rating (Rank) <br />
Area 1. Size of Government<br />
Area 2. Legal System and Property Rights<br />
Area 3. Sound Money<br />
Area 4. <strong>Freedom</strong> to Trade Internationally<br />
Area 5. Regulation<br />
Unadjusted<br />
Summary Rating (Rank) 6.55 (83) 6.89 (72) 6.68 (88)<br />
Rating (Data) Rating (Data) Rating (Data) Rating (Data) Rating (Data) Rating (Data) Rating (Data) Rating (Data)<br />
Area 1. Size of Government 6.62 8.07 7.36<br />
A. Government consumption 6.43 (18.13) 6.05 (19.44) 6.34 (18.44)<br />
B. Transfers and subsidies 9.43 (2.60) 9.25 (3.25) 8.62 (5.57)<br />
C. Government enterprises and investment 4.00 (33.25) 8.00 (17.65) 6.00 (26.03)<br />
D. Top marginal tax rate 9.00 8.50<br />
(i) Top marginal income tax rate 10.00 (10) 10.00 (10)<br />
(ii) Top marginal income and payroll tax rate 8.00 (30) 7.00 (31)<br />
Area 2. Legal System and Property Rights 3.98 4.54 4.39<br />
A. Judicial independence 1.59 1.77 1.52<br />
B. Impartial courts 2.44 2.78 2.62<br />
C. Protection of property rights 3.33 2.96 2.37<br />
D. Military interference in rule of law and politics<br />
E. Integrity of the legal system<br />
3.10 4.90 3.80<br />
F. Legal enforcement of contracts 6.74 6.74 6.74<br />
G. Regulatory restrictions on sale of real property 9.22 9.15 9.18<br />
H. Reliability of police 2.11 2.70 5.99<br />
I. Business costs of crime 3.28 5.34 2.93<br />
Area 3. Sound Money 8.65 8.20 8.14<br />
A. Money growth 6.34 (18.28) 7.05 (14.75) 7.05 (14.75)<br />
B. Standard deviation of inflation 9.11 (2.22) 7.13 (7.18) 7.11 (7.21)<br />
C. Inflation: most recent year 9.13 (4.35) 8.63 (6.86) 8.41 (7.97)<br />
D. <strong>Freedom</strong> to own foreign currency bank accounts 10.00 10.00 10.00<br />
Area 4. <strong>Freedom</strong> to Trade Internationally 6.62 6.33 6.92<br />
A. Tariffs 8.80 8.48 8.53<br />
(i) Revenue from trade taxes (% of trade sector) 9.69 (0.47) 9.63 (0.55) 8.35 (2.47) 8.53 (2.20)<br />
(ii) Mean tariff rate 9.04 (4.80) 9.08 (4.60) 9.08 (4.60)<br />
(iii) Standard deviation of tariff rates 7.72 (5.71) 8.01 (4.97) 7.98 (5.06)<br />
B. Regulatory trade barriers 2.15 2.40 4.74<br />
(i) Non-tariff trade barriers 3.98 4.29 4.47<br />
(ii) Compliance cost of importing and exporting 0.32 0.50 5.00<br />
C. Black-market exchange rates 10.00 10.00 10.00<br />
D. Controls of the movement of capital and people 5.55 4.45 4.41<br />
(i) Foreign ownership/investment restrictions 4.91 3.92 3.80<br />
(ii) Capital controls 5.38 3.08 3.08<br />
(iii) <strong>Freedom</strong> of foreigners to visit 6.35 6.35 6.35<br />
Area 5. Regulation 6.86 7.30 6.61<br />
A. Credit market regulations 9.19 9.01 7.48<br />
(i) Ownership of banks 10.00 10.00 8.00<br />
(ii) Private sector credit 0.00 8.05 9.56 9.03 7.44<br />
(iii) Interest rate controls/negative real interest rates 8.00 8.00 7.00<br />
B. Labor market regulations 6.51 6.44 6.63<br />
(i) Hiring regulations and minimum wage 6.70 5.00 5.00<br />
(ii) Hiring and firing regulations 7.35 5.93 6.55<br />
(iii) Centralized collective bargaining 7.59 7.88 8.43<br />
(iv) Hours regulations 8.00 10.00 10.00<br />
(v) Mandated cost of worker dismissal 8.42 8.79 8.79<br />
(vi) Conscription 1.00 1.00 1.00<br />
C. Business regulations 4.88 6.46 5.71<br />
(i) Administrative requirements 1.83 3.46 3.45<br />
(ii) Bureaucracy costs 2.97 6.81 2.75<br />
(iii) Starting a business 9.21 9.64 9.64<br />
(iv) Extra payments/bribes/favoritism 3.53 2.83 2.45<br />
(v) Licensing restrictions 4.03 8.31 8.29<br />
(vi) Cost of tax compliance 7.74 7.74 7.65<br />
www.freetheworld.com • www.fraserinstitute.org • Fraser Institute ©2012
102 • <strong>Economic</strong> <strong>Freedom</strong> of the <strong>World</strong>: 2012 Annual Report<br />
Latvia<br />
Fraser Institute ©2012 • www.fraserinstitute.org • www.freetheworld.com<br />
1980 1985 1990 1995 2000 2005 2009 2010<br />
Chain-Linked Rating (Rank) Rating (Rank) Rating (Rank) Rating (Rank) Rating (Rank) Rating (Rank) Rating (Rank) Rating (Rank)<br />
Summary Rating (Rank) 5.28 (89) 6.96 (46) 7.30 (45) 7.11 (53) 7.00 (60)<br />
Area 1. Size of Government 4.27 (100) 5.18 (89) 6.35 (74) 5.33 (95) 5.22 (97)<br />
Area 2. Legal System and Property Rights 6.14 (51) 6.67 (46) 6.79 (44) 6.44 (51) 6.46 (50)<br />
Area 3. Sound Money 4.86 (93) 2.98 (109) 8.55 (46) 8.68 (55) 8.90 (50) 8.93 (53)<br />
Area 4. <strong>Freedom</strong> to Trade Internationally 7.91 (35) 7.81 (47) 7.84 (37) 7.82 (40) 7.59 (46)<br />
Area 5. Regulation 4.66 (102) 6.61 (48) 6.88 (54) 7.03 (46) 6.80 (65)<br />
Unadjusted<br />
Summary Rating (Rank) 5.54 (78) 6.82 (49) 7.42 (37) 7.23 (46) 7.12 (61)<br />
Rating (Data) Rating (Data) Rating (Data) Rating (Data) Rating (Data) Rating (Data) Rating (Data) Rating (Data)<br />
Area 1. Size of Government 5.41 5.18 6.35 5.33 5.22<br />
A. Government consumption 7.65 (13.99) 4.06 (26.19) 4.94 (23.22) 5.25 (22.15) 4.65 (24.19) 5.46 (21.42)<br />
B. Transfers and subsidies 5.18 (18.20) 5.80 (15.91) 7.63 (9.20) 4.19 (21.84) 3.91 (22.86)<br />
C. Government enterprises and investment 4.00 6.00 6.00 6.00<br />
D. Top marginal tax rate 7.00 6.00 6.50 6.50 5.50<br />
(i) Top marginal income tax rate 7.00 (35) 9.00 (25) 9.00 (25) 9.00 (23) 8.00 (26)<br />
(ii) Top marginal income and payroll tax rate 3.00 (48) 4.00 (45) 4.00 (44) 3.00 (47)<br />
Area 2. Legal System and Property Rights 5.96 5.95 6.72 6.37 6.40<br />
A. Judicial independence 4.65 4.44 4.68<br />
B. Impartial courts 5.83 6.20 4.58 3.07 3.44<br />
C. Protection of property rights 3.82 6.46 5.45 5.22<br />
D. Military interference in rule of law and politics 7.53 8.33 8.33 8.33 8.33<br />
E. Integrity of the legal system 8.33 8.33 8.33 8.33<br />
F. Legal enforcement of contracts 7.39 6.73 6.28<br />
G. Regulatory restrictions on sale of real property 8.32 8.55 9.00<br />
H. Reliability of police 5.53 5.10 6.98<br />
I. Business costs of crime 6.89 7.34 5.34<br />
Area 3. Sound Money 6.43 2.98 8.55 8.68 8.90 8.93<br />
A. Money growth 0.10 (49.50) 6.81 (15.97) 7.41 (12.93) 8.77 (−6.15) 9.23 (−3.86)<br />
B. Standard deviation of inflation 8.91 (2.73) 7.44 (6.39) 0.00 (365.31) 7.93 (5.17) 8.65 (3.37) 7.52 (6.20) 6.72 (8.20)<br />
C. Inflation: most recent year 6.85 (15.74) 6.80 (16.00) 9.47 (2.65) 8.65 (6.76) 9.29 (3.53) 9.78 (−1.09)<br />
D. <strong>Freedom</strong> to own foreign currency bank accounts 5.00 5.00 10.00 10.00 10.00 10.00<br />
Area 4. <strong>Freedom</strong> to Trade Internationally 9.02 7.81 8.16 8.14 7.90<br />
A. Tariffs 9.46 8.33 8.39 8.22 8.34<br />
(i) Revenue from trade taxes (% of trade sector) 9.46 (0.81) 9.78 (0.33) 9.59 (0.62) 9.44 (0.84) 9.63 (0.55)<br />
(ii) Mean tariff rate 8.88 (5.60) 9.46 (2.70) 8.94 (5.30) 8.98 (5.10)<br />
(iii) Standard deviation of tariff rates 6.32 (9.20) 6.13 (9.67) 6.29 (9.28) 6.41 (8.98)<br />
B. Regulatory trade barriers 5.30 7.46 7.78 6.82<br />
(i) Non-tariff trade barriers 5.30 6.42 6.92 6.33<br />
(ii) Compliance cost of importing and exporting 8.49 8.64 7.31<br />
C. Black-market exchange rates 0.00 9.60 10.00 10.00 10.00 10.00<br />
D. Controls of the movement of capital and people 0.00 8.00 7.60 6.79 6.57 6.42<br />
(i) Foreign ownership/investment restrictions 8.28 6.87 6.20 5.77<br />
(ii) Capital controls 0.00 8.00 6.92 6.92 6.92 6.92<br />
(iii) <strong>Freedom</strong> of foreigners to visit 6.58 6.58 6.58<br />
Area 5. Regulation 4.33 6.61 7.22 7.38 7.14<br />
A. Credit market regulations 5.03 9.61 9.53 8.92 8.37<br />
(i) Ownership of banks 10.00 10.00 10.00 8.00<br />
(ii) Private sector credit 8.05 8.82 9.60 7.77 7.11<br />
(iii) Interest rate controls/negative real interest rates 2.00 10.00 9.00 9.00 10.00<br />
B. Labor market regulations 4.53 5.71 7.16 6.82<br />
(i) Hiring regulations and minimum wage 3.33 3.30 3.33 2.23<br />
(ii) Hiring and firing regulations 3.93 5.26 5.39 5.28<br />
(iii) Centralized collective bargaining 7.85 8.30 7.82 7.00<br />
(iv) Hours regulations 6.00 8.00 8.00<br />
(v) Mandated cost of worker dismissal 8.42 8.39 8.39<br />
(vi) Conscription 0.00 1.00 3.00 3.00 10.00 10.00<br />
C. Business regulations 5.69 6.40 6.07 6.23<br />
(i) Administrative requirements 7.18 3.88 3.44 3.80<br />
(ii) Bureaucracy costs 4.73 4.53 4.27 4.90<br />
(iii) Starting a business 5.00 9.37 9.42 9.46<br />
(iv) Extra payments/bribes/favoritism 5.84 6.44 4.70 4.93<br />
(v) Licensing restrictions 7.79 7.85 7.54<br />
(vi) Cost of tax compliance 6.41 6.72 6.75
Country Data Tables • 103<br />
Lesotho 1980 1985 1990 1995 2000 2005 2009 2010<br />
Chain-Linked Rating (Rank) Rating (Rank) Rating (Rank) Rating (Rank) Rating (Rank) Rating (Rank) Rating (Rank) Rating (Rank)<br />
Summary Rating (Rank) <br />
Area 1. Size of Government<br />
Area 2. Legal System and Property Rights<br />
Area 3. Sound Money<br />
Area 4. <strong>Freedom</strong> to Trade Internationally<br />
Area 5. Regulation<br />
Unadjusted<br />
Summary Rating (Rank) 6.05 (107) 6.13 (111) 5.81 (125)<br />
Rating (Data) Rating (Data) Rating (Data) Rating (Data) Rating (Data) Rating (Data) Rating (Data) Rating (Data)<br />
Area 1. Size of Government 4.63 4.90 5.08<br />
A. Government consumption 2.74 (30.67) 3.50 (28.10) 4.06 (26.21)<br />
B. Transfers and subsidies 7.16 (10.92) 9.20 (3.45) 9.20 (3.45)<br />
C. Government enterprises and investment<br />
D. Top marginal tax rate<br />
(i) Top marginal income tax rate<br />
(ii) Top marginal income and payroll tax rate<br />
4.00 (31.66) 2.00 (41.10) 2.00 (44.64)<br />
Area 2. Legal System and Property Rights 4.65 4.60 4.48<br />
A. Judicial independence 5.00 3.73 3.13<br />
B. Impartial courts 4.68 3.07 3.36<br />
C. Protection of property rights 3.95 4.44 4.08<br />
D. Military interference in rule of law and politics<br />
E. Integrity of the legal system<br />
7.10 7.30 7.60<br />
F. Legal enforcement of contracts 4.04 3.82 3.82<br />
G. Regulatory restrictions on sale of real property 5.36 5.46 5.46<br />
H. Reliability of police 3.74 4.21 4.49<br />
I. Business costs of crime 3.29 4.78 3.93<br />
Area 3. Sound Money 8.08 7.65 5.82<br />
A. Money growth 8.92 (5.38) 8.10 (9.48) 0.00 (71.94)<br />
B. Standard deviation of inflation 9.10 (2.24) 8.95 (2.64) 9.00 (2.50)<br />
C. Inflation: most recent year 9.31 (3.44) 8.57 (7.16) 9.28 (3.58)<br />
D. <strong>Freedom</strong> to own foreign currency bank accounts 5.00 5.00 5.00<br />
Area 4. <strong>Freedom</strong> to Trade Internationally 6.00 6.14 6.37<br />
A. Tariffs 4.57 4.66 4.67<br />
(i) Revenue from trade taxes (% of trade sector) 0.00 (15.81) 0.00 (17.36) 0.00 (23.76) 0.00 (23.76)<br />
(ii) Mean tariff rate 8.02 (9.90) 8.46 (7.70) 8.48 (7.60)<br />
(iii) Standard deviation of tariff rates 5.70 (10.74) 5.53 (11.17) 5.53 (11.17)<br />
B. Regulatory trade barriers 4.28 5.14 5.81<br />
(i) Non-tariff trade barriers 5.15 4.90 4.81<br />
(ii) Compliance cost of importing and exporting 3.42 5.38 6.81<br />
C. Black-market exchange rates 10.00 10.00 10.00<br />
D. Controls of the movement of capital and people 5.16 4.74 5.00<br />
(i) Foreign ownership/investment restrictions 6.71 5.45 6.24<br />
(ii) Capital controls 2.31 2.31 2.31<br />
(iii) <strong>Freedom</strong> of foreigners to visit 6.46 6.46 6.46<br />
Area 5. Regulation 6.89 7.35 7.29<br />
A. Credit market regulations 10.00 9.67 10.00<br />
(i) Ownership of banks 10.00 10.00 10.00<br />
(ii) Private sector credit 9.92 10.00 10.00 10.00 10.00 10.00<br />
(iii) Interest rate controls/negative real interest rates 10.00 9.00 10.00<br />
B. Labor market regulations 6.77 7.12 7.09<br />
(i) Hiring regulations and minimum wage 7.80 7.77 7.77<br />
(ii) Hiring and firing regulations 4.49 4.87 4.34<br />
(iii) Centralized collective bargaining 4.38 5.78 6.12<br />
(iv) Hours regulations 8.00 8.00 8.00<br />
(v) Mandated cost of worker dismissal 5.92 6.29 6.29<br />
(vi) Conscription 10.00 10.00 10.00<br />
C. Business regulations 3.90 5.27 4.77<br />
(i) Administrative requirements 2.53 3.98 3.42<br />
(ii) Bureaucracy costs 1.30 6.41 3.73<br />
(iii) Starting a business 7.19 8.41 8.42<br />
(iv) Extra payments/bribes/favoritism 5.32 3.80 3.56<br />
(v) Licensing restrictions 3.40 2.66 3.12<br />
(vi) Cost of tax compliance 3.68 6.37 6.37<br />
www.freetheworld.com • www.fraserinstitute.org • Fraser Institute ©2012
104 • <strong>Economic</strong> <strong>Freedom</strong> of the <strong>World</strong>: 2012 Annual Report<br />
Lithuania 1980 1985 1990 1995 2000 2005 2009 2010<br />
Chain-Linked Rating (Rank) Rating (Rank) Rating (Rank) Rating (Rank) Rating (Rank) Rating (Rank) Rating (Rank) Rating (Rank)<br />
Summary Rating (Rank) 5.31 (88) 6.60 (63) 7.05 (55) 7.10 (54) 7.12 (51)<br />
Area 1. Size of Government 5.64 (75) 5.45 (82) 5.61 (94) 5.56 (86) 5.62 (83)<br />
Area 2. Legal System and Property Rights 5.90 (57) 6.48 (53) 6.16 (57) 6.23 (56) 6.24 (52)<br />
Area 3. Sound Money 3.74 (105) 1.85 (114) 7.09 (76) 8.83 (48) 9.16 (42) 9.37 (33)<br />
Area 4. <strong>Freedom</strong> to Trade Internationally 7.98 (31) 7.88 (45) 7.53 (47) 7.24 (57) 7.04 (66)<br />
Area 5. Regulation 4.94 (92) 6.11 (73) 7.07 (46) 7.28 (31) 7.31 (33)<br />
Unadjusted<br />
Summary Rating (Rank) 5.33 (86) 6.47 (67) 7.47 (33) 7.52 (25) 7.54 (28)<br />
Fraser Institute ©2012 • www.fraserinstitute.org • www.freetheworld.com<br />
Rating (Data) Rating (Data) Rating (Data) Rating (Data) Rating (Data) Rating (Data) Rating (Data) Rating (Data)<br />
Area 1. Size of Government 5.64 5.45 6.78 6.73 6.79<br />
A. Government consumption 4.34 (25.25) 5.11 (22.62) 4.44 (24.90) 5.78 (20.35) 4.66 (24.16) 4.83 (23.57)<br />
B. Transfers and subsidies 7.30 (10.40) 6.92 (11.82) 6.83 (12.13) 4.75 (19.77) 5.35 (17.58)<br />
C. Government enterprises and investment 10.00 (5.58) 10.00 (5.58) 10.00 (5.58)<br />
D. Top marginal tax rate 4.50 5.00 4.50 7.50 7.00<br />
(i) Top marginal income tax rate 7.00 (35) 7.00 (33) 7.00 (33) 10.00 (15) 10.00 (15)<br />
(ii) Top marginal income and payroll tax rate 2.00 (51) 3.00 (50) 2.00 (51) 5.00 (38) 4.00 (41)<br />
Area 2. Legal System and Property Rights 5.87 5.81 6.37 6.44 6.45<br />
A. Judicial independence 3.96 4.32 3.99<br />
B. Impartial courts 5.88 6.07 4.31 3.86 4.28<br />
C. Protection of property rights 3.20 6.51 5.56 5.58<br />
D. Military interference in rule of law and politics 7.23 8.33 8.33 8.33 8.33<br />
E. Integrity of the legal system 8.33 6.67 6.67 6.67<br />
F. Legal enforcement of contracts 7.45 6.96 6.96<br />
G. Regulatory restrictions on sale of real property 9.71 9.68 9.68<br />
H. Reliability of police 4.54 5.08 7.27<br />
I. Business costs of crime 5.82 7.50 5.27<br />
Area 3. Sound Money 7.49 1.85 7.09 8.83 9.16 9.37<br />
A. Money growth 0.00 (53.00) 7.47 (12.63) 6.96 (15.19) 9.42 (−2.88) 9.76 (−1.22)<br />
B. Standard deviation of inflation 0.00 (329.24) 6.09 (9.77) 8.91 (2.73) 8.09 (4.79) 7.97 (5.08)<br />
C. Inflation: most recent year 9.97 (−0.15) 2.39 (38.05) 9.80 (1.01) 9.47 (2.66) 9.11 (4.45) 9.74 (1.32)<br />
D. <strong>Freedom</strong> to own foreign currency bank accounts 5.00 5.00 5.00 10.00 10.00 10.00<br />
Area 4. <strong>Freedom</strong> to Trade Internationally 8.78 7.88 8.00 7.69 7.49<br />
A. Tariffs 8.35 8.50 8.39 8.22 8.34<br />
(i) Revenue from trade taxes (% of trade sector) 9.56 (0.66) 9.78 (0.33) 9.59 (0.62) 9.44 (0.84) 9.63 (0.55)<br />
(ii) Mean tariff rate 9.10 (4.50) 8.92 (5.40) 9.46 (2.70) 8.94 (5.30) 8.98 (5.10)<br />
(iii) Standard deviation of tariff rates 6.40 (9.00) 6.80 (8.00) 6.13 (9.67) 6.29 (9.28) 6.41 (8.98)<br />
B. Regulatory trade barriers 5.20 7.37 7.40 6.64<br />
(i) Non-tariff trade barriers 5.20 6.10 6.11 5.84<br />
(ii) Compliance cost of importing and exporting 8.64 8.70 7.44<br />
C. Black-market exchange rates 0.00 10.00 10.00 10.00 10.00 10.00<br />
D. Controls of the movement of capital and people 0.00 8.00 7.81 6.25 5.15 4.96<br />
(i) Foreign ownership/investment restrictions 8.12 6.03 5.81 5.24<br />
(ii) Capital controls 0.00 8.00 7.50 6.15 3.08 3.08<br />
(iii) <strong>Freedom</strong> of foreigners to visit 6.58 6.58 6.58<br />
Area 5. Regulation 4.53 6.11 7.35 7.57 7.60<br />
A. Credit market regulations 0.00 4.44 7.30 9.91 9.31 8.70<br />
(i) Ownership of banks 0.00 5.00 5.00 10.00 10.00 10.00<br />
(ii) Private sector credit 8.32 7.89 9.73 7.92 6.11<br />
(iii) Interest rate controls/negative real interest rates 0.00 9.00 10.00 10.00 10.00<br />
B. Labor market regulations 4.23 5.46 7.11 7.65<br />
(i) Hiring regulations and minimum wage 3.01 6.70 5.00 8.33<br />
(ii) Hiring and firing regulations 2.75 3.55 3.86 3.66<br />
(iii) Centralized collective bargaining 8.17 8.28 8.19 8.29<br />
(iv) Hours regulations 4.00 8.00 8.00<br />
(v) Mandated cost of worker dismissal 7.22 7.59 7.59<br />
(vi) Conscription 0.00 3.00 3.00 3.00 10.00 10.00<br />
C. Business regulations 6.81 6.70 6.31 6.45<br />
(i) Administrative requirements 7.28 3.34 2.81 2.94<br />
(ii) Bureaucracy costs 7.48 4.81 4.03 4.87<br />
(iii) Starting a business 4.18 8.98 9.15 9.15<br />
(iv) Extra payments/bribes/favoritism 8.29 6.86 5.67 5.17<br />
(v) Licensing restrictions 8.05 8.15 8.56<br />
(vi) Cost of tax compliance 8.14 8.04 8.04
Luxembourg<br />
Country Data Tables • 105<br />
1980 1985 1990 1995 2000 2005 2009 2010<br />
Chain-Linked Rating (Rank) Rating (Rank) Rating (Rank) Rating (Rank) Rating (Rank) Rating (Rank) Rating (Rank) Rating (Rank)<br />
Summary Rating (Rank) 7.51 (6) 7.83 (5) 7.80 (8) 7.94 (11) 8.02 (12) 7.72 (19) 7.68 (18) 7.59 (25)<br />
Area 1. Size of Government 4.41 (72) 4.81 (60) 4.73 (83) 4.40 (96) 4.78 (95) 4.35 (114) 4.37 (113) 4.13 (114)<br />
Area 2. Legal System and Property Rights 7.83 (9) 8.35 (4) 8.35 (12) 9.10 (7) 8.62 (16) 8.74 (15) 8.98 (5) 8.96 (7)<br />
Area 3. Sound Money 9.05 (8) 9.58 (4) 9.53 (11) 9.73 (7) 9.75 (3) 9.47 (27) 9.55 (18) 9.35 (34)<br />
Area 4. <strong>Freedom</strong> to Trade Internationally 9.32 (2) 9.36 (3) 9.37 (4) 9.44 (4) 9.46 (4) 8.51 (13) 8.35 (16) 8.09 (21)<br />
Area 5. Regulation 7.04 (11) 7.04 (16) 7.04 (19) 7.04 (19) 7.51 (13) 7.53 (22) 7.16 (39) 7.47 (27)<br />
Unadjusted<br />
Summary Rating (Rank) 8.05 (3) 8.39 (1) 8.07 (7) 7.90 (11) 8.02 (12) 7.60 (26) 7.56 (23) 7.47 (32)<br />
Rating (Data) Rating (Data) Rating (Data) Rating (Data) Rating (Data) Rating (Data) Rating (Data) Rating (Data)<br />
Area 1. Size of Government 6.77 7.39 4.73 4.40 4.78 4.35 4.37 4.13<br />
A. Government consumption 6.54 (17.75) 6.79 (16.92) 6.54 (17.77) 3.84 (26.95) 3.15 (29.30) 2.40 (31.84) 2.09 (32.89) 2.01 (33.16)<br />
B. Transfers and subsidies 2.89 (26.60) 3.27 (25.20) 4.47 (20.81) 4.01 (22.50) 3.39 (24.76) 3.49 (24.39)<br />
C. Government enterprises and investment 7.00 (22.00) 8.00 (18.20) 8.00 (19.20) 8.00 (19.20) 8.00 (19.20) 7.00 (21.91) 7.00 (21.25) 7.00 (24.67)<br />
D. Top marginal tax rate 1.50 2.50 3.50 4.00 5.00 4.00<br />
(i) Top marginal income tax rate 1.00 (56) 3.00 (50) 4.00 (48) 5.00 (39) 6.00 (39) 5.00 (39)<br />
(ii) Top marginal income and payroll tax rate 2.00 (58) 2.00 (60) 3.00 (54) 3.00 (46) 4.00 (46) 3.00 (46)<br />
Area 2. Legal System and Property Rights 7.83 8.35 8.35 9.10 8.62 8.09 8.31 8.29<br />
A. Judicial independence 9.45 7.30 7.43 8.11 8.49<br />
B. Impartial courts 8.62 8.20 7.44 7.50 7.22<br />
C. Protection of property rights 7.39 7.60 8.84 8.73 8.82<br />
D. Military interference in rule of law and politics 10.03 10.00 10.00 10.00 10.00<br />
E. Integrity of the legal system 10.00 10.00 10.00 10.00 10.00<br />
F. Legal enforcement of contracts 7.51 7.46 7.46<br />
G. Regulatory restrictions on sale of real property 6.10 6.10 6.13<br />
H. Reliability of police 7.85 8.30 8.38<br />
I. Business costs of crime 7.66 8.64 8.12<br />
Area 3. Sound Money 9.05 9.58 9.53 9.73 9.75 9.47 9.55 9.35<br />
A. Money growth 9.22 (3.88) 9.98 (0.10) 9.27 (3.64) 9.82 (0.92) 9.81 (0.95) 9.20 (4.00) 9.28 (3.62) 8.87 (5.65)<br />
B. Standard deviation of inflation 8.56 (3.60) 8.93 (2.68) 9.52 (1.20) 9.23 (1.93) 9.84 (0.41) 9.18 (2.05) 9.01 (2.47) 9.00 (2.49)<br />
C. Inflation: most recent year 8.42 (7.92) 9.40 (2.98) 9.32 (3.42) 9.86 (0.71) 9.37 (3.15) 9.50 (2.49) 9.93 (0.37) 9.54 (2.28)<br />
D. <strong>Freedom</strong> to own foreign currency bank accounts 10.00 10.00 10.00 10.00 10.00 10.00 10.00 10.00<br />
Area 4. <strong>Freedom</strong> to Trade Internationally 9.70 9.74 9.51 9.22 9.46 8.48 8.32 8.06<br />
A. Tariffs 9.09 9.22 8.52 8.74 9.18 8.39 8.22 8.34<br />
(i) Revenue from trade taxes (% of trade sector) 9.93 (0.10) 9.93 (0.10) 9.93 (0.10) 9.93 (0.10) 9.78 (0.33) 9.59 (0.62) 9.44 (0.84) 9.63 (0.55)<br />
(ii) Mean tariff rate 8.24 (8.80) 8.50 (7.50) 8.52 (7.40) 8.66 (6.70) 9.52 (2.40) 9.46 (2.70) 8.94 (5.30) 8.98 (5.10)<br />
(iii) Standard deviation of tariff rates 7.12 (7.20) 7.64 (5.90) 8.24 (4.40) 6.13 (9.67) 6.29 (9.28) 6.41 (8.98)<br />
B. Regulatory trade barriers 8.67 9.10 8.68 8.88 7.50<br />
(i) Non-tariff trade barriers 8.67 8.20 8.07 8.47 8.37<br />
(ii) Compliance cost of importing and exporting 10.00 9.29 9.29 6.63<br />
C. Black-market exchange rates 10.00 10.00 10.00 10.00 10.00 10.00 10.00 10.00<br />
D. Controls of the movement of capital and people 10.00 10.00 10.00 9.45 9.56 6.85 6.18 6.39<br />
(i) Foreign ownership/investment restrictions 8.90 9.90 8.59 8.11 8.75<br />
(ii) Capital controls 10.00 10.00 10.00 10.00 9.23 5.38 3.85 3.85<br />
(iii) <strong>Freedom</strong> of foreigners to visit 6.58 6.58 6.58<br />
Area 5. Regulation 6.90 6.90 8.24 7.08 7.51 7.61 7.24 7.55<br />
A. Credit market regulations 10.00 10.00 10.00 8.76 10.00 9.33 9.21 9.15<br />
(i) Ownership of banks 10.00 10.00 10.00 10.00 10.00 8.00 8.00 8.00<br />
(ii) Private sector credit 6.28 10.00 10.00 9.62 9.46<br />
(iii) Interest rate controls/negative real interest rates 10.00 10.00 10.00 10.00 10.00 10.00 10.00 10.00<br />
B. Labor market regulations 6.48 5.45 5.80 5.52 5.55<br />
(i) Hiring regulations and minimum wage 3.62 3.30 2.23 2.23<br />
(ii) Hiring and firing regulations 4.28 4.28 4.60 3.74 3.93<br />
(iii) Centralized collective bargaining 5.18 5.18 5.18 5.18 6.49 5.56 5.55<br />
(iv) Hours regulations 4.17 4.00 4.00 4.00<br />
(v) Mandated cost of worker dismissal 6.38 7.59 7.59<br />
(vi) Conscription 10.00 10.00 10.00 10.00 10.00 10.00 10.00 10.00<br />
C. Business regulations 7.02 7.69 6.99 7.93<br />
(i) Administrative requirements 4.94 4.97 4.32<br />
(ii) Bureaucracy costs 7.24 6.78 2.06 7.83<br />
(iii) Starting a business 6.95 8.97 9.29 9.30<br />
(iv) Extra payments/bribes/favoritism 6.87 8.77 8.92 8.47<br />
(v) Licensing restrictions 7.34 7.34 8.32<br />
(vi) Cost of tax compliance 9.35 9.34 9.34<br />
www.freetheworld.com • www.fraserinstitute.org • Fraser Institute ©2012
106 • <strong>Economic</strong> <strong>Freedom</strong> of the <strong>World</strong>: 2012 Annual Report<br />
Macedonia 1980 1985 1990 1995 2000 2005 2009 2010<br />
Chain-Linked Rating (Rank) Rating (Rank) Rating (Rank) Rating (Rank) Rating (Rank) Rating (Rank) Rating (Rank) Rating (Rank)<br />
Summary Rating (Rank) <br />
Area 1. Size of Government<br />
Area 2. Legal System and Property Rights<br />
Area 3. Sound Money<br />
Area 4. <strong>Freedom</strong> to Trade Internationally<br />
Area 5. Regulation<br />
Unadjusted<br />
Summary Rating (Rank) 6.44 (89) 6.91 (71) 6.94 (73)<br />
Rating (Data) Rating (Data) Rating (Data) Rating (Data) Rating (Data) Rating (Data) Rating (Data) Rating (Data)<br />
Area 1. Size of Government 5.71 5.83 6.11<br />
A. Government consumption 6.94 (16.42) 6.03 (19.51) 5.89 (19.99) 5.99 (19.65)<br />
B. Transfers and subsidies 6.81 (12.21) 5.95 (15.37) 5.95 (15.37)<br />
C. Government enterprises and investment 4.00 (35.72) 4.00 (31.15) 4.00 (33.50)<br />
D. Top marginal tax rate 6.00 7.50 8.50<br />
(i) Top marginal income tax rate 9.00 (24) 10.00 (10) 10.00 (10)<br />
(ii) Top marginal income and payroll tax rate 3.00 (47) 5.00 (36) 7.00 (34)<br />
Area 2. Legal System and Property Rights 4.27 5.28 5.23<br />
A. Judicial independence 2.37 3.24 3.15<br />
B. Impartial courts 3.19 3.42 3.44<br />
C. Protection of property rights 4.12 4.42 4.42<br />
D. Military interference in rule of law and politics<br />
E. Integrity of the legal system<br />
3.50 5.70 5.10<br />
F. Legal enforcement of contracts 5.55 5.66 5.79<br />
G. Regulatory restrictions on sale of real property 7.00 7.85 8.23<br />
H. Reliability of police 4.70 5.32 6.45<br />
I. Business costs of crime 3.69 6.61 5.26<br />
Area 3. Sound Money 7.59 7.96 7.97<br />
A. Money growth 7.20 (13.98) 6.01 (19.95) 7.62 (11.88) 8.05 (9.76)<br />
B. Standard deviation of inflation 9.36 (1.59) 9.25 (1.87) 9.16 (2.11)<br />
C. Inflation: most recent year 9.99 (0.04) 9.95 (−0.27) 9.68 (1.61)<br />
D. <strong>Freedom</strong> to own foreign currency bank accounts 5.00 5.00 5.00<br />
Area 4. <strong>Freedom</strong> to Trade Internationally 7.38 7.48 7.29<br />
A. Tariffs 9.01 7.92 7.92<br />
(i) Revenue from trade taxes (% of trade sector) 8.83 (1.75) 8.97 (1.54) 8.97 (1.54)<br />
(ii) Mean tariff rate 9.18 (4.10) 8.46 (7.70) 8.46 (7.70)<br />
(iii) Standard deviation of tariff rates 6.34 (9.16) 6.34 (9.16)<br />
B. Regulatory trade barriers 5.95 7.11 6.40<br />
(i) Non-tariff trade barriers 5.56 5.75 5.48<br />
(ii) Compliance cost of importing and exporting 6.34 8.47 7.31<br />
C. Black-market exchange rates 10.00 10.00 10.00<br />
D. Controls of the movement of capital and people 4.54 4.90 4.84<br />
(i) Foreign ownership/investment restrictions 5.04 4.57 4.39<br />
(ii) Capital controls 0.77 2.31 2.31<br />
(iii) <strong>Freedom</strong> of foreigners to visit 7.82 7.82 7.82<br />
Area 5. Regulation 7.24 8.02 8.11<br />
A. Credit market regulations 10.00 9.84 9.84<br />
(i) Ownership of banks 10.00 10.00 10.00<br />
(ii) Private sector credit 10.00 9.51 9.51<br />
(iii) Interest rate controls/negative real interest rates 10.00 10.00 10.00 10.00<br />
B. Labor market regulations 5.89 7.86 7.85<br />
(i) Hiring regulations and minimum wage 3.90 7.23 7.23<br />
(ii) Hiring and firing regulations 5.06 5.58 5.58<br />
(iii) Centralized collective bargaining 7.80 8.35 8.27<br />
(iv) Hours regulations 6.00 8.00 8.00<br />
(v) Mandated cost of worker dismissal 7.59 7.99 7.99<br />
(vi) Conscription 5.00 10.00 10.00<br />
C. Business regulations 5.82 6.37 6.65<br />
(i) Administrative requirements 3.20 3.42 3.59<br />
(ii) Bureaucracy costs 5.29 5.23 4.82<br />
(iii) Starting a business 8.98 9.88 9.88<br />
(iv) Extra payments/bribes/favoritism 4.88 5.36 4.93<br />
(v) Licensing restrictions 3.66 5.64 8.01<br />
(vi) Cost of tax compliance 8.92 8.67 8.67<br />
Fraser Institute ©2012 • www.fraserinstitute.org • www.freetheworld.com
Madagascar<br />
Country Data Tables • 107<br />
1980 1985 1990 1995 2000 2005 2009 2010<br />
Chain-Linked Rating (Rank) Rating (Rank) Rating (Rank) Rating (Rank) Rating (Rank) Rating (Rank) Rating (Rank) Rating (Rank)<br />
Summary Rating (Rank) 4.01 (83) 4.59 (83) 4.49 (92) 4.61 (104) 5.96 (88) 5.79 (106) 6.22 (96) 6.41 (91)<br />
Area 1. Size of Government 5.65 (32) 6.06 (25) 6.34 (35) 6.52 (41) 7.21 (25) 7.66 (29) 9.07 (3) 9.29 (1)<br />
Area 2. Legal System and Property Rights 4.32 (67) 3.09 (89) 5.09 (80) 4.78 (83) 3.26 (110) 3.40 (110) 3.21 (111)<br />
Area 3. Sound Money 5.82 (71) 5.99 (85) 5.79 (79) 2.82 (110) 7.17 (73) 7.02 (89) 7.55 (81) 7.85 (83)<br />
Area 4. <strong>Freedom</strong> to Trade Internationally 1.13 (85) 2.75 (73) 3.49 (84) 4.64 (100) 5.70 (97) 5.77 (93) 5.63 (100) 5.75 (103)<br />
Area 5. Regulation 3.77 (92) 3.84 (92) 3.76 (103) 3.98 (114) 4.95 (106) 5.22 (113) 5.48 (112) 5.95 (103)<br />
Unadjusted<br />
Summary Rating (Rank) 3.87 (90) 4.40 (88) 4.48 (95) 4.61 (106) 5.92 (87) 5.86 (120) 6.23 (107) 6.42 (101)<br />
Rating (Data) Rating (Data) Rating (Data) Rating (Data) Rating (Data) Rating (Data) Rating (Data) Rating (Data)<br />
Area 1. Size of Government 4.13 4.43 6.34 6.52 7.21 7.66 8.75 8.97<br />
A. Government consumption 8.25 (11.94) 8.86 (9.89) 9.25 (8.54) 9.73 (6.90) 9.75 (6.83) 9.22 (8.64) 8.01 (12.75) 8.88 (9.82)<br />
B. Transfers and subsidies 9.75 (1.40) 9.84 (1.10) 9.86 (1.00) 9.77 (1.35) 10.00 (0.00) 10.00 (0.00)<br />
C. Government enterprises and investment 0.00 (65.40) 0.00 (69.80) 0.00 (53.50) 0.00 (52.90) 2.00 (44.73) 4.00 (39.20) 10.00 (9.58) 10.00 (9.58)<br />
D. Top marginal tax rate 7.00 7.00<br />
(i) Top marginal income tax rate 9.00 (23) 9.00 (23)<br />
(ii) Top marginal income and payroll tax rate 5.00 (36) 5.00 (36)<br />
Area 2. Legal System and Property Rights 4.32 3.09 4.81 4.59 3.15 3.29 3.10<br />
A. Judicial independence 3.26 2.50 2.10<br />
B. Impartial courts 4.10 4.35 3.73 3.19 2.97<br />
C. Protection of property rights 4.32 3.34 2.97<br />
D. Military interference in rule of law and politics 4.22 5.00 1.67 1.67 1.67<br />
E. Integrity of the legal system 6.96 5.00 2.08 4.17 4.17<br />
F. Legal enforcement of contracts 2.42 2.42 2.42<br />
G. Regulatory restrictions on sale of real property 3.65 5.38 5.12<br />
H. Reliability of police 4.19 2.91 4.04<br />
I. Business costs of crime 3.03 3.99 2.43<br />
Area 3. Sound Money 5.82 5.99 5.79 2.82 7.17 7.02 7.55 7.85<br />
A. Money growth 7.38 (13.08) 9.18 (4.09) 7.37 (13.13) 6.26 (18.68) 7.85 (10.74) 9.32 (3.38) 8.57 (7.14) 8.80 (6.01)<br />
B. Standard deviation of inflation 8.89 (2.77) 6.87 (7.82) 8.08 (4.81) 4.05 (14.88) 8.22 (4.44) 7.44 (6.39) 8.42 (3.96) 9.47 (1.33)<br />
C. Inflation: most recent year 7.00 (14.99) 7.92 (10.42) 7.71 (11.46) 0.97 (45.17) 7.59 (12.03) 6.30 (18.51) 8.21 (8.96) 8.15 (9.25)<br />
D. <strong>Freedom</strong> to own foreign currency bank accounts 0.00 0.00 0.00 0.00 5.00 5.00 5.00 5.00<br />
Area 4. <strong>Freedom</strong> to Trade Internationally 1.34 3.00 3.44 4.89 5.70 6.04 5.90 6.02<br />
A. Tariffs 4.02 0.80 1.73 5.08 4.11 6.86 5.90 5.92<br />
(i) Revenue from trade taxes (% of trade sector) 4.33 (8.50) 0.67 (14.00) 4.33 (8.50) 4.11 (8.83) 5.23 (7.15) 2.75 (10.87) 2.75 (10.87)<br />
(ii) Mean tariff rate 3.70 (31.50) 0.80 (46.00) 2.80 (36.00) 4.00 (30.00) 7.68 (11.60) 7.64 (11.80) 7.66 (11.70)<br />
(iii) Standard deviation of tariff rates 6.92 (7.70) 7.66 (5.85) 7.31 (6.73) 7.33 (6.67)<br />
B. Regulatory trade barriers 4.32 6.31 6.66<br />
(i) Non-tariff trade barriers 5.49 5.72 5.31<br />
(ii) Compliance cost of importing and exporting 3.14 6.91 8.00<br />
C. Black-market exchange rates 0.00 8.20 8.60 9.60 10.00 10.00 10.00 10.00<br />
D. Controls of the movement of capital and people 0.00 0.00 0.00 0.00 3.00 3.00 1.39 1.52<br />
(i) Foreign ownership/investment restrictions 6.01 4.18 4.57<br />
(ii) Capital controls 0.00 0.00 0.00 0.00 3.00 3.00 0.00 0.00<br />
(iii) <strong>Freedom</strong> of foreigners to visit 0.00 0.00 0.00<br />
Area 5. Regulation 4.20 4.28 3.76 3.98 4.95 5.40 5.67 6.16<br />
A. Credit market regulations 4.63 4.87 3.09 3.67 6.23 6.61 5.61 7.72<br />
(i) Ownership of banks 0.00 0.00 0.00 2.00 2.00 5.00 5.00 10.00<br />
(ii) Private sector credit 9.27 9.75 9.26 9.00 7.68 5.84 5.84 8.15<br />
(iii) Interest rate controls/negative real interest rates 0.00 0.00 9.00 9.00 6.00 5.00<br />
B. Labor market regulations 4.59 5.25 5.07<br />
(i) Hiring regulations and minimum wage 1.10 2.23 1.10<br />
(ii) Hiring and firing regulations 5.35 5.82 5.87<br />
(iii) Centralized collective bargaining 6.90 6.86 6.89<br />
(iv) Hours regulations 6.00 8.00 8.00<br />
(v) Mandated cost of worker dismissal 7.22 7.59 7.59<br />
(vi) Conscription 1.00 1.00 1.00 1.00 1.00 1.00 1.00 1.00<br />
C. Business regulations 5.01 6.16 5.70<br />
(i) Administrative requirements 2.75 3.34 3.21<br />
(ii) Bureaucracy costs 4.14 6.84 3.23<br />
(iii) Starting a business 7.74 8.83 9.62<br />
(iv) Extra payments/bribes/favoritism 4.07 3.38 3.04<br />
(v) Licensing restrictions 4.77 6.83 7.35<br />
(vi) Cost of tax compliance 6.59 7.75 7.75<br />
www.freetheworld.com • www.fraserinstitute.org • Fraser Institute ©2012
108 • <strong>Economic</strong> <strong>Freedom</strong> of the <strong>World</strong>: 2012 Annual Report<br />
Malawi<br />
Fraser Institute ©2012 • www.fraserinstitute.org • www.freetheworld.com<br />
1980 1985 1990 1995 2000 2005 2009 2010<br />
Chain-Linked Rating (Rank) Rating (Rank) Rating (Rank) Rating (Rank) Rating (Rank) Rating (Rank) Rating (Rank) Rating (Rank)<br />
Summary Rating (Rank) 4.62 (70) 4.96 (68) 5.40 (65) 4.57 (106) 4.95 (114) 5.41 (114) 6.14 (98) 6.46 (84)<br />
Area 1. Size of Government 5.05 (50) 4.87 (58) 6.15 (42) 5.83 (68) 5.33 (83) 6.44 (72) 5.87 (75) 7.45 (33)<br />
Area 2. Legal System and Property Rights 3.62 (60) 3.99 (74) 4.48 (66) 5.36 (75) 5.53 (69) 5.42 (72) 6.10 (62) 5.92 (63)<br />
Area 3. Sound Money 6.05 (64) 6.55 (61) 5.59 (85) 1.21 (118) 2.88 (120) 4.44 (122) 6.97 (95) 6.98 (94)<br />
Area 4. <strong>Freedom</strong> to Trade Internationally 2.93 (67) 3.71 (66) 5.13 (54) 5.47 (88) 5.26 (106) 4.51 (119) 4.99 (114) 5.34 (110)<br />
Area 5. Regulation 5.49 (51) 5.74 (46) 5.75 (54) 5.17 (86) 5.73 (94) 6.37 (82) 6.96 (53) 6.78 (69)<br />
Unadjusted<br />
Summary Rating (Rank) 4.52 (74) 4.93 (70) 5.37 (64) 4.31 (112) 4.95 (114) 5.55 (128) 6.35 (102) 6.68 (88)<br />
Rating (Data) Rating (Data) Rating (Data) Rating (Data) Rating (Data) Rating (Data) Rating (Data) Rating (Data)<br />
Area 1. Size of Government 4.75 4.58 5.78 4.32 5.33 6.44 5.87 7.45<br />
A. Government consumption 5.41 (21.62) 5.79 (20.30) 6.65 (17.39) 5.95 (19.77) 6.82 (16.80) 7.29 (15.23) 5.01 (22.95) 5.31 (21.95)<br />
B. Transfers and subsidies 9.59 (2.00) 9.51 (2.30) 9.48 (2.40) 9.48 (2.40) 9.48 (2.40) 9.48 (2.40) 9.48 (2.40)<br />
C. Government enterprises and investment 0.00 (78.60) 0.00 (62.00) 4.00 (38.30) 0.00 (65.10) 0.00 (81.30) 4.00 (35.77) 4.00 (31.60) 7.00 (21.82)<br />
D. Top marginal tax rate 4.00 3.00 3.00 7.00 5.00 5.00 5.00 8.00<br />
(i) Top marginal income tax rate 4.00 (45) 3.00 (50) 3.00 (50) 7.00 (35) 5.00 (38) 5.00 (38) 5.00 (38) 8.00 (30)<br />
(ii) Top marginal income and payroll tax rate 3.00 (50) 7.00 (35) 5.00 (38) 5.00 (38) 5.00 (38) 8.00 (30)<br />
Area 2. Legal System and Property Rights 3.62 3.99 4.48 5.36 5.53 5.01 5.64 5.47<br />
A. Judicial independence 6.67 6.18 5.90 6.08 5.57<br />
B. Impartial courts 4.84 4.91 4.41 4.89 5.04<br />
C. Protection of property rights 4.77 3.23 5.28 5.31 5.03<br />
D. Military interference in rule of law and politics 6.41 6.67 6.67 6.67 6.67<br />
E. Integrity of the legal system 4.11 6.67 5.00 5.00 5.00<br />
F. Legal enforcement of contracts 2.21 3.11 3.11<br />
G. Regulatory restrictions on sale of real property 7.22 8.02 7.64<br />
H. Reliability of police 4.25 5.94 5.81<br />
I. Business costs of crime 4.14 5.76 5.36<br />
Area 3. Sound Money 6.05 6.55 5.59 1.21 2.88 4.44 6.97 6.98<br />
A. Money growth 9.73 (1.36) 9.04 (4.82) 7.17 (14.15) 4.85 (25.73) 5.05 (24.75) 5.86 (20.72) 6.50 (17.51) 6.37 (18.17)<br />
B. Standard deviation of inflation 7.64 (5.89) 8.94 (2.66) 7.35 (6.63) 0.00 (28.51) 2.37 (19.06) 0.00 (26.01) 8.05 (4.88) 8.04 (4.89)<br />
C. Inflation: most recent year 6.84 (15.79) 8.21 (8.93) 7.83 (10.85) 0.00 (90.42) 4.08 (29.58) 6.92 (15.41) 8.32 (8.42) 8.52 (7.41)<br />
D. <strong>Freedom</strong> to own foreign currency bank accounts 0.00 0.00 0.00 0.00 0.00 5.00 5.00 5.00<br />
Area 4. <strong>Freedom</strong> to Trade Internationally 2.67 3.80 5.26 5.47 5.26 5.59 6.18 6.62<br />
A. Tariffs 5.60 5.40 6.58 4.61 4.96 3.97 6.02 5.95<br />
(i) Revenue from trade taxes (% of trade sector) 5.60 (6.60) 4.13 (8.80) 6.20 (5.70) 6.20 (5.70) 4.60 (8.10) 4.60 (8.10) 4.60 (8.10) 4.60 (8.10)<br />
(ii) Mean tariff rate 6.66 (16.70) 6.96 (15.20) 3.84 (30.80) 6.08 (19.60) 7.30 (13.50) 7.40 (13.00) 7.46 (12.70)<br />
(iii) Standard deviation of tariff rates 3.80 (15.50) 4.20 (14.50) 0.00 (34.29) 6.05 (9.88) 5.78 (10.54)<br />
B. Regulatory trade barriers 3.92 4.13 5.72<br />
(i) Non-tariff trade barriers 4.82 4.72 5.13<br />
(ii) Compliance cost of importing and exporting 3.02 3.54 6.32<br />
C. Black-market exchange rates 0.40 4.00 7.20 9.80 10.00 10.00 10.00 10.00<br />
D. Controls of the movement of capital and people 2.00 2.00 2.00 2.00 0.83 4.46 4.58 4.80<br />
(i) Foreign ownership/investment restrictions 6.58 5.39 6.04<br />
(ii) Capital controls 2.00 2.00 2.00 2.00 0.83 0.00 1.54 1.54<br />
(iii) <strong>Freedom</strong> of foreigners to visit 6.80 6.80 6.80<br />
Area 5. Regulation 5.49 5.74 5.75 5.17 5.73 6.28 7.08 6.90<br />
A. Credit market regulations 4.65 5.32 5.35 3.82 5.30 7.94 8.45 8.03<br />
(i) Ownership of banks 2.00 2.00 2.00 2.00 2.00 10.00 10.00 8.00<br />
(ii) Private sector credit 7.95 5.96 8.05 5.47 5.91 5.81 7.36 8.09<br />
(iii) Interest rate controls/negative real interest rates 4.00 8.00 6.00 4.00 8.00 8.00 8.00 8.00<br />
B. Labor market regulations 6.57 6.99 6.95<br />
(i) Hiring regulations and minimum wage 5.60 5.57 4.43<br />
(ii) Hiring and firing regulations 4.56 5.79 5.68<br />
(iii) Centralized collective bargaining 7.06 8.00 7.61<br />
(iv) Hours regulations 10.00 10.00 10.00<br />
(v) Mandated cost of worker dismissal 2.21 2.58 3.97<br />
(vi) Conscription 10.00 10.00 10.00 10.00 10.00 10.00 10.00 10.00<br />
C. Business regulations 4.32 5.80 5.71<br />
(i) Administrative requirements 3.98 4.42 3.92<br />
(ii) Bureaucracy costs 1.09 5.15 4.36<br />
(iii) Starting a business 6.55 7.61 7.80<br />
(iv) Extra payments/bribes/favoritism 5.46 5.21 4.27<br />
(v) Licensing restrictions 2.97 4.16 5.71<br />
(vi) Cost of tax compliance 5.85 8.24 8.24
Country Data Tables • 109<br />
Malaysia 1980 1985 1990 1995 2000 2005 2009 2010<br />
Chain-Linked Rating (Rank) Rating (Rank) Rating (Rank) Rating (Rank) Rating (Rank) Rating (Rank) Rating (Rank) Rating (Rank)<br />
Summary Rating (Rank) 6.94 (11) 7.00 (13) 7.40 (13) 7.62 (15) 6.79 (52) 6.98 (59) 6.65 (74) 6.94 (63)<br />
Area 1. Size of Government 4.84 (60) 5.56 (38) 6.27 (38) 6.92 (26) 6.08 (67) 6.03 (84) 5.55 (87) 6.13 (73)<br />
Area 2. Legal System and Property Rights 6.59 (24) 6.31 (30) 6.52 (30) 6.63 (40) 5.62 (67) 7.27 (33) 6.65 (46) 7.14 (32)<br />
Area 3. Sound Money 9.05 (7) 8.38 (21) 9.00 (20) 9.11 (31) 8.15 (54) 6.60 (98) 6.50 (110) 6.52 (109)<br />
Area 4. <strong>Freedom</strong> to Trade Internationally 7.32 (17) 7.44 (18) 7.75 (23) 7.81 (38) 6.88 (71) 6.87 (71) 6.59 (80) 6.75 (81)<br />
Area 5. Regulation 6.88 (16) 7.34 (9) 7.46 (11) 7.60 (8) 7.22 (27) 8.18 (11) 8.04 (9) 8.24 (8)<br />
Unadjusted<br />
Summary Rating (Rank) 6.76 (13) 6.82 (16) 7.43 (15) 7.54 (18) 6.79 (51) 7.00 (62) 6.67 (83) 6.96 (71)<br />
Rating (Data) Rating (Data) Rating (Data) Rating (Data) Rating (Data) Rating (Data) Rating (Data) Rating (Data)<br />
Area 1. Size of Government 4.84 5.56 6.27 6.92 6.08 6.03 5.55 6.13<br />
A. Government consumption 4.52 (24.64) 5.08 (22.72) 5.58 (21.02) 5.62 (20.88) 5.87 (20.05) 5.03 (22.89) 5.29 (22.03) 5.60 (20.95)<br />
B. Transfers and subsidies 8.83 (4.80) 9.16 (3.60) 9.48 (2.40) 9.05 (4.00) 8.45 (6.20) 9.08 (3.87) 8.90 (4.52) 8.91 (4.50)<br />
C. Government enterprises and investment 4.00 (37.30) 2.00 (46.80) 4.00 (33.80) 6.00 (28.40) 2.00 (47.00) 2.00 (49.90) 0.00 (53.00) 2.00 (49.40)<br />
D. Top marginal tax rate 2.00 6.00 6.00 7.00 8.00 8.00 8.00 8.00<br />
(i) Top marginal income tax rate 2.00 (60) 6.00 (45) 6.00 (45) 7.00 (32) 8.00 (29) 8.00 (28) 8.00 (26) 8.00 (26)<br />
(ii) Top marginal income and payroll tax rate 6.00 (45) 7.00 (32) 8.00 (29) 8.00 (28) 8.00 (26) 8.00 (26)<br />
Area 2. Legal System and Property Rights 6.59 6.31 6.52 6.63 5.62 6.99 6.39 6.86<br />
A. Judicial independence 6.22 4.51 7.24 5.56 6.13<br />
B. Impartial courts 6.05 6.01 7.35 5.86 6.59<br />
C. Protection of property rights 6.14 4.23 7.93 6.82 7.19<br />
D. Military interference in rule of law and politics 7.78 8.33 8.33 8.33 8.33<br />
E. Integrity of the legal system 6.96 5.00 6.67 6.67 6.67<br />
F. Legal enforcement of contracts 4.27 4.38 5.59<br />
G. Regulatory restrictions on sale of real property 6.49 8.12 8.01<br />
H. Reliability of police 7.51 6.05 6.56<br />
I. Business costs of crime 7.11 5.74 6.72<br />
Area 3. Sound Money 9.05 8.38 9.00 9.11 8.15 6.60 6.50 6.52<br />
A. Money growth 8.81 (5.94) 9.89 (−0.53) 8.69 (6.57) 8.03 (9.86) 9.12 (−4.39) 9.16 (4.21) 8.60 (7.00) 8.93 (5.34)<br />
B. Standard deviation of inflation 8.78 (3.06) 8.95 (2.63) 7.92 (5.20) 9.41 (1.48) 8.79 (3.04) 7.84 (5.40) 7.52 (6.19) 7.51 (6.23)<br />
C. Inflation: most recent year 8.63 (6.87) 9.70 (−1.51) 9.41 (2.95) 9.00 (5.02) 9.69 (1.53) 9.41 (2.96) 9.88 (0.58) 9.66 (1.71)<br />
D. <strong>Freedom</strong> to own foreign currency bank accounts 10.00 5.00 10.00 10.00 5.00 0.00 0.00 0.00<br />
Area 4. <strong>Freedom</strong> to Trade Internationally 7.12 7.25 7.25 7.45 6.88 7.39 7.09 7.25<br />
A. Tariffs 6.37 6.74 6.76 6.92 5.92 6.63 6.07 6.06<br />
(i) Revenue from trade taxes (% of trade sector) 4.87 (7.70) 6.20 (5.70) 7.87 (3.20) 8.93 (1.60) 9.59 (0.62) 9.57 (0.64) 9.81 (0.28) 9.79 (0.31)<br />
(ii) Mean tariff rate 7.88 (10.60) 7.28 (13.60) 7.40 (13.00) 7.44 (12.80) 8.16 (9.20) 8.50 (7.50) 8.40 (8.00) 8.40 (8.00)<br />
(iii) Standard deviation of tariff rates 5.00 (12.50) 4.40 (14.00) 0.00 (33.30) 1.81 (20.49) 0.00 (27.22) 0.00 (27.22)<br />
B. Regulatory trade barriers 6.73 7.92 7.03 6.65 6.97<br />
(i) Non-tariff trade barriers 6.73 6.67 6.27 5.52 6.31<br />
(ii) Compliance cost of importing and exporting 9.17 7.78 7.78 7.63<br />
C. Black-market exchange rates 10.00 10.00 10.00 10.00 10.00 10.00 10.00 10.00<br />
D. Controls of the movement of capital and people 5.00 5.00 5.00 6.15 3.69 5.89 5.62 5.97<br />
(i) Foreign ownership/investment restrictions 7.31 6.61 7.67 6.10 7.13<br />
(ii) Capital controls 5.00 5.00 5.00 5.00 0.77 0.00 0.77 0.77<br />
(iii) <strong>Freedom</strong> of foreigners to visit 10.00 10.00 10.00<br />
Area 5. Regulation 6.18 6.60 8.11 7.58 7.22 7.97 7.83 8.03<br />
A. Credit market regulations 6.30 7.68 8.02 8.33 8.05 9.61 9.31 9.12<br />
(i) Ownership of banks 5.00 5.00 5.00 5.00 5.00 10.00 10.00 10.00<br />
(ii) Private sector credit 7.90 8.04 9.06 10.00 9.16 8.84 7.92 8.37<br />
(iii) Interest rate controls/negative real interest rates 6.00 10.00 10.00 10.00 10.00 10.00 10.00 9.00<br />
B. Labor market regulations 8.19 7.55 6.60 7.67 7.75 7.87<br />
(i) Hiring regulations and minimum wage 6.73 4.47 10.00 10.00 10.00<br />
(ii) Hiring and firing regulations 6.65 6.65 4.00 5.05 5.35 5.82<br />
(iii) Centralized collective bargaining 7.93 7.93 7.93 7.93 7.53 7.95 7.35 7.57<br />
(iv) Hours regulations 6.45 7.01 10.00 10.00 10.00<br />
(v) Mandated cost of worker dismissal 3.05 3.82 3.82<br />
(vi) Conscription 10.00 10.00 10.00 10.00 10.00 10.00 10.00 10.00<br />
C. Business regulations 6.87 7.00 6.63 6.43 7.10<br />
(i) Administrative requirements 7.13 5.96 5.07 5.71<br />
(ii) Bureaucracy costs 8.08 8.43 3.47 3.55 5.99<br />
(iii) Starting a business 7.17 6.33 8.83 9.27 9.64<br />
(iv) Extra payments/bribes/favoritism 5.36 6.11 7.39 5.66 6.06<br />
(v) Licensing restrictions 6.25 6.65 6.67<br />
(vi) Cost of tax compliance 7.87 8.37 8.51<br />
www.freetheworld.com • www.fraserinstitute.org • Fraser Institute ©2012
110 • <strong>Economic</strong> <strong>Freedom</strong> of the <strong>World</strong>: 2012 Annual Report<br />
Mali<br />
Fraser Institute ©2012 • www.fraserinstitute.org • www.freetheworld.com<br />
1980 1985 1990 1995 2000 2005 2009 2010<br />
Chain-Linked Rating (Rank) Rating (Rank) Rating (Rank) Rating (Rank) Rating (Rank) Rating (Rank) Rating (Rank) Rating (Rank)<br />
Summary Rating (Rank) 5.73 (34) 4.81 (76) 5.11 (72) 5.22 (90) 6.19 (80) 6.03 (98) 6.13 (99) 6.13 (101)<br />
Area 1. Size of Government 7.98 (7) 5.24 (47) 5.80 (55) 5.27 (84) 7.15 (27) 7.49 (34) 6.43 (56) 6.44 (59)<br />
Area 2. Legal System and Property Rights 4.23 (51) 3.05 (90) 3.02 (90) 5.75 (60) 5.35 (75) 5.65 (66) 5.72 (71) 5.62 (71)<br />
Area 3. Sound Money 6.04 (65) 6.39 (71) 6.98 (48) 5.14 (89) 8.40 (47) 6.12 (109) 6.76 (99) 6.86 (97)<br />
Area 4. <strong>Freedom</strong> to Trade Internationally 4.74 (46) 4.88 (52) 5.06 (55) 5.52 (86) 5.91 (88) 5.56 (102) 5.90 (93) 6.15 (97)<br />
Area 5. Regulation 5.35 (54) 4.39 (85) 4.61 (92) 4.27 (109) 4.13 (121) 5.27 (112) 5.74 (106) 5.45 (113)<br />
Unadjusted<br />
Summary Rating (Rank) 5.92 (30) 4.97 (68) 5.28 (66) 4.91 (100) 6.12 (81) 6.02 (108) 6.12 (112) 6.12 (117)<br />
Rating (Data) Rating (Data) Rating (Data) Rating (Data) Rating (Data) Rating (Data) Rating (Data) Rating (Data)<br />
Area 1. Size of Government 8.84 5.81 6.43 4.23 7.15 7.49 6.43 6.44<br />
A. Government consumption 10.00 (4.86) 7.92 (13.08) 7.31 (15.13) 6.46 (18.03) 7.47 (14.60) 8.46 (11.22) 5.30 (21.97) 5.32 (21.90)<br />
B. Transfers and subsidies 9.51 (2.30) 9.51 (2.30) 9.97 (0.60) 9.97 (0.60) 10.00 (0.01) 10.00 (0.00) 10.00 (0.29)<br />
C. Government enterprises and investment 7.00 (21.40) 0.00 (57.10) 2.00 (45.90) 2.00 (41.10) 4.00 (35.07) 4.00 (33.93) 4.00 (37.60) 4.00 (37.60)<br />
D. Top marginal tax rate<br />
(i) Top marginal income tax rate<br />
(ii) Top marginal income and payroll tax rate<br />
Area 2. Legal System and Property Rights 4.23 3.05 3.02 5.29 5.00 4.52 4.57 4.49<br />
A. Judicial independence 4.43 3.08 2.89<br />
B. Impartial courts 4.74 4.38 3.90 4.19 4.23<br />
C. Protection of property rights 5.12 4.22 4.11<br />
D. Military interference in rule of law and politics 5.55 6.67 5.83 5.83 5.83<br />
E. Integrity of the legal system 6.96 5.00 5.00 5.00 5.00<br />
F. Legal enforcement of contracts 1.95 2.63 2.63<br />
G. Regulatory restrictions on sale of real property 4.38 5.54 5.47<br />
H. Reliability of police 5.48 3.86 6.29<br />
I. Business costs of crime 4.59 6.79 3.98<br />
Area 3. Sound Money 6.04 6.39 6.98 5.14 8.40 6.12 6.76 6.86<br />
A. Money growth 8.58 (7.09) 7.51 (12.44) 9.10 (−4.52) 7.89 (10.55) 10.00 (−0.02) 8.55 (7.24) 9.25 (3.74) 9.38 (3.10)<br />
B. Standard deviation of inflation 8.83 (2.93) 8.30 (4.26) 9.36 (1.59) 5.18 (12.04) 8.72 (3.20) 7.21 (6.97) 8.22 (4.45) 8.29 (4.26)<br />
C. Inflation: most recent year 6.74 (16.31) 9.73 (1.33) 9.45 (2.73) 7.50 (12.49) 9.86 (−0.68) 8.72 (6.40) 9.56 (2.20) 9.78 (1.11)<br />
D. <strong>Freedom</strong> to own foreign currency bank accounts 0.00 0.00 0.00 0.00 5.00 0.00 0.00 0.00<br />
Area 4. <strong>Freedom</strong> to Trade Internationally 4.74 4.88 5.06 5.32 5.91 6.02 6.39 6.66<br />
A. Tariffs 5.23 4.83 5.97 6.17 7.73 7.30 7.65 7.65<br />
(i) Revenue from trade taxes (% of trade sector) 7.47 (3.80) 6.67 (5.00) 6.93 (4.60) 6.80 (4.80) 7.87 (3.20) 7.11 (4.33) 8.03 (2.95) 8.03 (2.95)<br />
(ii) Mean tariff rate 3.00 (35.00) 3.00 (35.00) 5.00 (25.00) 6.74 (16.30) 7.60 (12.00) 7.52 (12.40) 7.62 (11.90) 7.62 (11.90)<br />
(iii) Standard deviation of tariff rates 4.96 (12.60) 7.26 (6.84) 7.29 (6.78) 7.29 (6.78)<br />
B. Regulatory trade barriers 3.73 5.55 6.29<br />
(i) Non-tariff trade barriers 5.04 5.05 5.02<br />
(ii) Compliance cost of importing and exporting 2.42 6.05 7.56<br />
C. Black-market exchange rates 9.00 9.80 9.20 9.80 10.00 10.00 10.00 10.00<br />
D. Controls of the movement of capital and people 0.00 0.00 0.00 0.00 0.00 3.05 2.35 2.70<br />
(i) Foreign ownership/investment restrictions 6.77 3.90 4.96<br />
(ii) Capital controls 0.00 0.00 0.00 0.00 0.00 0.00 0.77 0.77<br />
(iii) <strong>Freedom</strong> of foreigners to visit 2.38 2.38 2.38<br />
Area 5. Regulation 5.73 4.70 4.94 4.58 4.13 5.94 6.47 6.14<br />
A. Credit market regulations 5.29 5.90 6.52 5.57 4.94 7.93 8.00 8.00<br />
(i) Ownership of banks 2.00 2.00 2.00 2.00 2.00 8.00 8.00 8.00<br />
(ii) Private sector credit 9.88 9.70 9.57 8.71 7.89 7.80 8.00 8.00<br />
(iii) Interest rate controls/negative real interest rates 4.00 6.00 8.00 6.00 8.00 8.00 8.00<br />
B. Labor market regulations 5.58 5.54 5.21<br />
(i) Hiring regulations and minimum wage 6.70 6.67 5.00<br />
(ii) Hiring and firing regulations 5.58 5.18 4.79<br />
(iii) Centralized collective bargaining 6.09 5.92 6.00<br />
(iv) Hours regulations 8.00 8.00 8.00<br />
(v) Mandated cost of worker dismissal 7.13 7.49 7.49<br />
(vi) Conscription 10.00 0.00 0.00 0.00 0.00 0.00 0.00 0.00<br />
C. Business regulations 4.30 5.87 5.22<br />
(i) Administrative requirements 3.33 4.07 4.04<br />
(ii) Bureaucracy costs 1.74 6.51 2.89<br />
(iii) Starting a business 4.86 7.90 7.65<br />
(iv) Extra payments/bribes/favoritism 4.15 2.50 2.56<br />
(v) Licensing restrictions 4.75 7.27 7.20<br />
(vi) Cost of tax compliance 6.97 6.97 6.97
Malta<br />
Country Data Tables • 111<br />
1980 1985 1990 1995 2000 2005 2009 2010<br />
Chain-Linked Rating (Rank) Rating (Rank) Rating (Rank) Rating (Rank) Rating (Rank) Rating (Rank) Rating (Rank) Rating (Rank)<br />
Summary Rating (Rank) 5.50 (44) 5.28 (53) 5.48 (59) 6.92 (40) 6.76 (55) 7.68 (22) 7.58 (24) 7.62 (21)<br />
Area 1. Size of Government 4.67 (65) 4.67 (62) 4.30 (90) 5.97 (64) 6.00 (70) 5.85 (89) 5.80 (79) 5.80 (80)<br />
Area 2. Legal System and Property Rights 3.52 (80) 4.48 (65) 8.97 (10) 8.37 (18) 8.79 (13) 8.71 (13) 8.60 (14)<br />
Area 3. Sound Money 6.50 (40) 7.01 (36) 7.27 (38) 7.07 (54) 7.00 (81) 8.99 (42) 9.46 (28) 9.54 (22)<br />
Area 4. <strong>Freedom</strong> to Trade Internationally 5.15 (42) 5.55 (38) 5.78 (46) 6.53 (63) 6.23 (82) 7.68 (43) 7.31 (53) 7.30 (54)<br />
Area 5. Regulation 5.68 (44) 5.64 (52) 5.55 (66) 6.08 (50) 6.23 (65) 7.01 (47) 6.57 (78) 6.80 (67)<br />
Unadjusted<br />
Summary Rating (Rank) 5.57 (44) 5.34 (56) 5.54 (57) 6.72 (41) 6.53 (63) 7.63 (21) 7.58 (22) 7.57 (25)<br />
Rating (Data) Rating (Data) Rating (Data) Rating (Data) Rating (Data) Rating (Data) Rating (Data) Rating (Data)<br />
Area 1. Size of Government 4.67 4.67 4.30 5.97 6.00 5.85 5.80 5.80<br />
A. Government consumption 5.88 (20.01) 5.83 (20.19) 5.33 (21.89) 4.38 (25.11) 5.10 (22.67) 4.58 (24.44) 4.39 (25.07) 4.28 (25.45)<br />
B. Transfers and subsidies 6.81 (12.20) 5.86 (15.70) 5.89 (15.60) 6.49 (13.38) 5.92 (15.49) 5.82 (15.85) 5.79 (15.95) 5.92 (15.47)<br />
C. Government enterprises and investment 6.00 (28.60) 7.00 (20.00) 6.00 (28.80) 6.00 (28.80) 6.00 (28.80) 6.00 6.00 6.00<br />
D. Top marginal tax rate 0.00 0.00 0.00 7.00 7.00 7.00 7.00 7.00<br />
(i) Top marginal income tax rate 0.00 (65) 0.00 (65) 0.00 (65) 7.00 (35) 7.00 (35) 7.00 (35) 7.00 (35) 7.00 (35)<br />
(ii) Top marginal income and payroll tax rate 0.00 (65) 7.00 (35) 7.00 (35) 7.00 (35) 7.00 (35) 7.00 (35)<br />
Area 2. Legal System and Property Rights 3.52 4.48 7.60 7.17 7.68 7.61 7.52<br />
A. Judicial independence 7.18 6.73 6.89<br />
B. Impartial courts 7.09 6.77 5.93 5.18 5.01<br />
C. Protection of property rights 6.92 7.19 7.09<br />
D. Military interference in rule of law and politics 9.82 10.00 10.00 10.00 10.00<br />
E. Integrity of the legal system 10.00 8.33 8.33 8.33 8.33<br />
F. Legal enforcement of contracts<br />
G. Regulatory restrictions on sale of real property<br />
H. Reliability of police 7.12 7.17 8.37<br />
I. Business costs of crime 8.31 8.68 6.92<br />
Area 3. Sound Money 6.50 7.01 7.27 7.07 7.00 8.99 9.46 9.54<br />
A. Money growth 9.68 (1.60) 9.39 (−3.03) 10.00 (−0.02) 9.75 (−1.24) 9.94 (−0.28) 6.82 (15.91) 8.41 (7.97) 8.59 (7.06)<br />
B. Standard deviation of inflation 8.80 (3.00) 8.77 (3.07) 9.74 (0.64) 9.63 (0.93) 8.51 (3.72) 9.75 (0.63) 9.86 (0.36) 9.87 (0.32)<br />
C. Inflation: most recent year 7.52 (12.40) 9.87 (0.63) 9.36 (3.21) 8.89 (5.56) 9.53 (2.37) 9.40 (3.01) 9.58 (2.09) 9.70 (1.52)<br />
D. <strong>Freedom</strong> to own foreign currency bank accounts 0.00 0.00 0.00 0.00 0.00 10.00 10.00 10.00<br />
Area 4. <strong>Freedom</strong> to Trade Internationally 5.44 5.87 6.11 6.90 6.23 8.57 8.16 8.15<br />
A. Tariffs 6.73 7.00 6.73 9.50 8.51 9.28 8.22 8.34<br />
(i) Revenue from trade taxes (% of trade sector) 6.73 (4.90) 7.00 (4.50) 6.73 (4.90) 9.50 (0.75) 9.58 (0.63) 9.59 (0.62) 9.44 (0.84) 9.63 (0.55)<br />
(ii) Mean tariff rate 8.24 (8.80) 9.46 (2.70) 8.94 (5.30) 8.98 (5.10)<br />
(iii) Standard deviation of tariff rates 7.72 (5.70) 8.80 (3.00) 6.29 (9.28) 6.41 (8.98)<br />
B. Regulatory trade barriers 7.47 7.45 7.45<br />
(i) Non-tariff trade barriers<br />
(ii) Compliance cost of importing and exporting<br />
7.47 7.45 7.45<br />
C. Black-market exchange rates 7.60 8.60 9.60 9.20 9.40 10.00 10.00 10.00<br />
D. Controls of the movement of capital and people 2.00 2.00 2.00 2.00 0.77 7.51 6.95 6.80<br />
(i) Foreign ownership/investment restrictions 7.48 6.58 6.90<br />
(ii) Capital controls 2.00 2.00 2.00 2.00 0.77 8.46 7.69 6.92<br />
(iii) <strong>Freedom</strong> of foreigners to visit 6.58 6.58 6.58<br />
Area 5. Regulation 5.68 5.64 5.55 6.08 6.23 7.07 6.89 6.86<br />
A. Credit market regulations 5.15 5.06 4.81 6.22 6.62 9.08 8.31 9.03<br />
(i) Ownership of banks 0.00 0.00 0.00 0.00 2.00 10.00 10.00 10.00<br />
(ii) Private sector credit 9.45 9.17 8.43 8.65 7.86 7.24 4.94 7.09<br />
(iii) Interest rate controls/negative real interest rates 6.00 6.00 6.00 10.00 10.00 10.00 10.00 10.00<br />
B. Labor market regulations<br />
(i) Hiring regulations and minimum wage<br />
7.09 7.69 6.76<br />
(ii) Hiring and firing regulations 4.14 4.20 4.17<br />
(iii) Centralized collective bargaining 7.14 6.55 6.12<br />
(iv) Hours regulations<br />
(v) Mandated cost of worker dismissal<br />
10.00<br />
(vi) Conscription 10.00 10.00 10.00 10.00 10.00 10.00 10.00 10.00<br />
C. Business regulations 5.03 4.66 4.77<br />
(i) Administrative requirements 2.99 3.26 3.05<br />
(ii) Bureaucracy costs<br />
(iii) Starting a business<br />
4.78 4.51 5.45<br />
(iv) Extra payments/bribes/favoritism<br />
(v) Licensing restrictions<br />
(vi) Cost of tax compliance<br />
7.32 6.20 5.82<br />
www.freetheworld.com • www.fraserinstitute.org • Fraser Institute ©2012
112 • <strong>Economic</strong> <strong>Freedom</strong> of the <strong>World</strong>: 2012 Annual Report<br />
Mauritania 1980 1985 1990 1995 2000 2005 2009 2010<br />
Chain-Linked Rating (Rank) Rating (Rank) Rating (Rank) Rating (Rank) Rating (Rank) Rating (Rank) Rating (Rank) Rating (Rank)<br />
Summary Rating (Rank) <br />
Area 1. Size of Government<br />
Area 2. Legal System and Property Rights<br />
Area 3. Sound Money<br />
Area 4. <strong>Freedom</strong> to Trade Internationally<br />
Area 5. Regulation<br />
Unadjusted<br />
Summary Rating (Rank) 6.29 (98) 5.86 (125) 5.67 (132)<br />
Rating (Data) Rating (Data) Rating (Data) Rating (Data) Rating (Data) Rating (Data) Rating (Data) Rating (Data)<br />
Area 1. Size of Government 7.00 6.12 5.59<br />
A. Government consumption<br />
B. Transfers and subsidies<br />
6.01 (19.57) 6.23 (18.81) 7.19 (15.57)<br />
C. Government enterprises and investment<br />
D. Top marginal tax rate<br />
(i) Top marginal income tax rate<br />
(ii) Top marginal income and payroll tax rate<br />
8.00 (18.17) 6.00 (28.76) 4.00 (32.17)<br />
Area 2. Legal System and Property Rights 5.56 4.58 4.60<br />
A. Judicial independence 4.71 2.31 2.69<br />
B. Impartial courts 5.12 3.88 4.18<br />
C. Protection of property rights 4.57 4.23 4.27<br />
D. Military interference in rule of law and politics<br />
E. Integrity of the legal system<br />
5.50 3.20 3.00<br />
F. Legal enforcement of contracts 6.04 6.27 6.27<br />
G. Regulatory restrictions on sale of real property 7.36 7.36 7.53<br />
H. Reliability of police 5.27 2.88 6.10<br />
I. Business costs of crime 5.91 6.50 2.74<br />
Area 3. Sound Money 6.11 5.46 5.24<br />
A. Money growth 9.17 (4.15) 8.21 (8.95) 8.21 (8.95)<br />
B. Standard deviation of inflation 7.71 (5.72) 4.07 (14.83) 3.99 (15.02)<br />
C. Inflation: most recent year 7.57 (12.13) 9.56 (2.22) 8.74 (6.28)<br />
D. <strong>Freedom</strong> to own foreign currency bank accounts 0.00 0.00 0.00<br />
Area 4. <strong>Freedom</strong> to Trade Internationally 5.98 5.94 6.22<br />
A. Tariffs<br />
(i) Revenue from trade taxes (% of trade sector)<br />
7.50 7.41 7.64<br />
(ii) Mean tariff rate 7.86 (10.70) 7.62 (11.90) 8.08 (9.60)<br />
(iii) Standard deviation of tariff rates 7.13 (7.17) 7.19 (7.02) 7.20 (7.01)<br />
B. Regulatory trade barriers 4.00 4.84 5.78<br />
(i) Non-tariff trade barriers 3.40 5.40 4.93<br />
(ii) Compliance cost of importing and exporting 4.61 4.27 6.63<br />
C. Black-market exchange rates 10.00 10.00 10.00<br />
D. Controls of the movement of capital and people 2.42 1.51 1.45<br />
(i) Foreign ownership/investment restrictions 6.43 3.54 3.36<br />
(ii) Capital controls 0.83 1.00 1.00<br />
(iii) <strong>Freedom</strong> of foreigners to visit 0.00 0.00 0.00<br />
Area 5. Regulation 6.80 7.23 6.69<br />
A. Credit market regulations<br />
(i) Ownership of banks<br />
9.22 9.22 8.00<br />
(ii) Private sector credit 9.44 9.44<br />
(iii) Interest rate controls/negative real interest rates 9.00 9.00 8.00<br />
B. Labor market regulations 7.02 7.06 7.14<br />
(i) Hiring regulations and minimum wage 3.30 4.43 5.57<br />
(ii) Hiring and firing regulations 7.79 5.40 4.99<br />
(iii) Centralized collective bargaining 5.88 7.03 6.81<br />
(iv) Hours regulations 8.00 8.00 8.00<br />
(v) Mandated cost of worker dismissal 7.13 7.49 7.49<br />
(vi) Conscription 10.00 10.00 10.00<br />
C. Business regulations 4.17 5.40 4.92<br />
(i) Administrative requirements 6.00 5.55 4.88<br />
(ii) Bureaucracy costs 2.68 7.49 3.09<br />
(iii) Starting a business 4.03 7.69 7.79<br />
(iv) Extra payments/bribes/favoritism 3.77 2.70 2.66<br />
(v) Licensing restrictions 6.36 6.80 8.89<br />
(vi) Cost of tax compliance 2.20 2.20 2.20<br />
Fraser Institute ©2012 • www.fraserinstitute.org • www.freetheworld.com
Country Data Tables • 113<br />
Mauritius 1980 1985 1990 1995 2000 2005 2009 2010<br />
Chain-Linked Rating (Rank) Rating (Rank) Rating (Rank) Rating (Rank) Rating (Rank) Rating (Rank) Rating (Rank) Rating (Rank)<br />
Summary Rating (Rank) 4.73 (68) 6.12 (29) 6.06 (41) 7.55 (17) 7.60 (22) 7.57 (31) 7.93 (8) 7.90 (9)<br />
Area 1. Size of Government 5.63 (34) 6.79 (9) 6.81 (23) 6.89 (27) 7.37 (24) 7.19 (43) 7.79 (17) 7.89 (22)<br />
Area 2. Legal System and Property Rights 5.54 (47) 5.51 (51) 7.06 (33) 6.94 (42) 7.19 (37) 7.89 (26) 7.86 (25)<br />
Area 3. Sound Money 4.92 (92) 6.81 (45) 6.20 (70) 9.51 (21) 9.58 (12) 9.49 (25) 9.20 (41) 9.28 (39)<br />
Area 4. <strong>Freedom</strong> to Trade Internationally 2.37 (70) 4.90 (51) 4.90 (62) 7.26 (50) 7.20 (63) 7.79 (39) 8.17 (21) 7.98 (23)<br />
Area 5. Regulation 6.37 (25) 6.51 (27) 6.81 (23) 6.99 (21) 6.88 (42) 6.31 (84) 6.79 (62) 6.70 (78)<br />
Unadjusted<br />
Summary Rating (Rank) 4.90 (62) 6.38 (24) 6.21 (38) 7.65 (15) 7.60 (19) 7.57 (28) 7.93 (7) 7.90 (8)<br />
Rating (Data) Rating (Data) Rating (Data) Rating (Data) Rating (Data) Rating (Data) Rating (Data) Rating (Data)<br />
Area 1. Size of Government 5.63 6.79 6.81 6.89 7.37 7.19 7.79 7.89<br />
A. Government consumption 7.14 (15.72) 7.44 (14.69) 7.24 (15.40) 7.13 (15.75) 7.00 (16.19) 6.62 (17.50) 7.06 (15.98) 7.09 (15.89)<br />
B. Transfers and subsidies 8.37 (6.50) 8.72 (5.20) 8.99 (4.20) 8.94 (4.40) 8.49 (6.06) 8.62 (5.55) 8.61 (5.62) 8.45 (6.19)<br />
C. Government enterprises and investment 4.00 (36.00) 4.00 (32.26) 4.00 (37.32) 4.00 (34.43) 6.00 (28.01) 6.00 (29.59) 6.00 (25.64) 7.00 (24.53)<br />
D. Top marginal tax rate 3.00 7.00 7.00 7.50 8.00 7.50 9.50 9.00<br />
(i) Top marginal income tax rate 3.00 (50) 7.00 (35) 7.00 (35) 8.00 (30) 9.00 (25) 8.00 (30) 10.00 (15) 10.00 (15)<br />
(ii) Top marginal income and payroll tax rate 7.00 (35) 7.00 (32) 7.00 (33) 7.00 (31) 9.00 (25) 8.00 (26)<br />
Area 2. Legal System and Property Rights 6.31 6.28 6.94 6.94 5.68 6.23 6.21<br />
A. Judicial independence 6.18 6.11 6.38 6.43<br />
B. Impartial courts 7.82 7.01 6.42 5.94 5.80<br />
C. Protection of property rights 4.80 7.63 7.16 7.06<br />
D. Military interference in rule of law and politics 9.35 10.00 8.70 7.90 7.70<br />
E. Integrity of the legal system 6.96 6.70<br />
F. Legal enforcement of contracts 3.94 4.55 4.55<br />
G. Regulatory restrictions on sale of real property 1.03 6.02 6.10<br />
H. Reliability of police 5.49 5.44 6.54<br />
I. Business costs of crime 6.11 6.49 5.47<br />
Area 3. Sound Money 4.92 6.81 6.20 9.51 9.58 9.49 9.20 9.28<br />
A. Money growth 9.21 (3.95) 9.35 (3.26) 7.47 (12.64) 9.54 (2.30) 9.64 (−1.81) 9.35 (3.25) 8.29 (8.57) 8.82 (5.88)<br />
B. Standard deviation of inflation 5.80 (10.50) 9.54 (1.14) 9.37 (1.58) 9.46 (1.36) 9.51 (1.21) 9.59 (1.03) 9.02 (2.46) 8.87 (2.83)<br />
C. Inflation: most recent year 4.69 (26.57) 8.36 (8.20) 7.98 (10.12) 9.06 (4.69) 9.16 (4.20) 9.02 (4.91) 9.49 (2.55) 9.42 (2.89)<br />
D. <strong>Freedom</strong> to own foreign currency bank accounts 0.00 0.00 0.00 10.00 10.00 10.00 10.00 10.00<br />
Area 4. <strong>Freedom</strong> to Trade Internationally 2.44 5.04 4.51 7.47 7.20 7.98 8.36 8.17<br />
A. Tariffs 3.31 3.31 3.14 4.41 3.54 7.44 9.15 9.15<br />
(i) Revenue from trade taxes (% of trade sector) 3.60 (9.60) 3.60 (9.60) 4.93 (7.60) 6.05 (5.92) 6.81 (4.78) 7.59 (3.62) 9.66 (0.51) 9.66 (0.51)<br />
(ii) Mean tariff rate 3.02 (34.90) 3.02 (34.90) 4.48 (27.60) 2.76 (36.20) 3.80 (31.00) 8.30 (8.50) 9.72 (1.40) 9.72 (1.40)<br />
(iii) Standard deviation of tariff rates 0.00 (91.50) 0.00 (27.80) 6.43 (8.93) 8.06 (4.86) 8.08 (4.80)<br />
B. Regulatory trade barriers 7.44 6.99 7.44 6.81<br />
(i) Non-tariff trade barriers 7.88 6.15 6.61 6.43<br />
(ii) Compliance cost of importing and exporting 6.99 7.82 8.26 7.19<br />
C. Black-market exchange rates 2.00 9.80 8.40 10.00 10.00 10.00 10.00 10.00<br />
D. Controls of the movement of capital and people 2.00 2.00 2.00 8.00 7.84 7.48 6.86 6.73<br />
(i) Foreign ownership/investment restrictions 8.75 6.57 7.01 6.63<br />
(ii) Capital controls 2.00 2.00 2.00 8.00 6.92 6.92 4.62 4.62<br />
(iii) <strong>Freedom</strong> of foreigners to visit 8.96 8.96 8.96<br />
Area 5. Regulation 6.59 6.93 7.25 7.45 6.88 7.51 8.08 7.97<br />
A. Credit market regulations 7.28 8.47 9.33 9.84 9.53 9.27 9.67 9.52<br />
(i) Ownership of banks 8.00 8.00 10.00 10.00 10.00 10.00 10.00 10.00<br />
(ii) Private sector credit 6.56 7.42 10.00 9.52 9.59 8.82 10.00 8.57<br />
(iii) Interest rate controls/negative real interest rates 10.00 8.00 10.00 9.00 9.00 9.00 10.00<br />
B. Labor market regulations 4.90 6.93 7.46 7.38<br />
(i) Hiring regulations and minimum wage 3.12 10.00 10.00 10.00<br />
(ii) Hiring and firing regulations 1.98 2.59 4.77 4.61<br />
(iii) Centralized collective bargaining 3.55 3.52 5.97 5.64<br />
(iv) Hours regulations 5.85 8.70 8.00 8.00<br />
(v) Mandated cost of worker dismissal 6.76 6.03 6.03<br />
(vi) Conscription 10.00 10.00 10.00 10.00 10.00 10.00 10.00 10.00<br />
C. Business regulations 6.22 6.33 7.12 7.02<br />
(i) Administrative requirements 5.93 2.16 4.61 4.28<br />
(ii) Bureaucracy costs 7.50 4.40 4.88 5.59<br />
(iii) Starting a business 5.42 8.44 9.77 9.77<br />
(iv) Extra payments/bribes/favoritism 6.01 6.56 6.17 5.62<br />
(v) Licensing restrictions 8.25 9.12 8.65<br />
(vi) Cost of tax compliance 8.20 8.20 8.20<br />
www.freetheworld.com • www.fraserinstitute.org • Fraser Institute ©2012
114 • <strong>Economic</strong> <strong>Freedom</strong> of the <strong>World</strong>: 2012 Annual Report<br />
Mexico<br />
Fraser Institute ©2012 • www.fraserinstitute.org • www.freetheworld.com<br />
1980 1985 1990 1995 2000 2005 2009 2010<br />
Chain-Linked Rating (Rank) Rating (Rank) Rating (Rank) Rating (Rank) Rating (Rank) Rating (Rank) Rating (Rank) Rating (Rank)<br />
Summary Rating (Rank) 5.13 (58) 4.61 (81) 6.13 (39) 6.43 (53) 6.44 (70) 6.87 (65) 6.60 (77) 6.65 (77)<br />
Area 1. Size of Government 5.32 (43) 5.78 (30) 7.44 (9) 6.98 (24) 7.14 (28) 7.11 (47) 6.79 (42) 7.18 (37)<br />
Area 2. Legal System and Property Rights 6.29 (29) 5.38 (48) 6.76 (28) 5.30 (76) 4.25 (97) 4.87 (79) 4.45 (92) 4.49 (91)<br />
Area 3. Sound Money 7.70 (25) 3.67 (102) 3.59 (106) 5.50 (82) 6.85 (88) 8.08 (67) 7.97 (73) 8.07 (74)<br />
Area 4. <strong>Freedom</strong> to Trade Internationally 1.32 (83) 4.44 (56) 7.85 (21) 7.96 (33) 7.47 (55) 7.28 (56) 7.09 (64) 6.77 (80)<br />
Area 5. Regulation 5.05 (68) 3.80 (93) 5.04 (76) 6.44 (41) 6.50 (51) 6.90 (52) 6.52 (80) 6.58 (85)<br />
Unadjusted<br />
Summary Rating (Rank) 5.19 (55) 4.67 (80) 6.26 (36) 6.46 (50) 6.44 (69) 6.89 (70) 6.61 (87) 6.66 (91)<br />
Rating (Data) Rating (Data) Rating (Data) Rating (Data) Rating (Data) Rating (Data) Rating (Data) Rating (Data)<br />
Area 1. Size of Government 5.69 6.19 7.96 7.47 7.14 7.11 6.79 7.18<br />
A. Government consumption 7.83 (13.36) 8.08 (12.52) 8.60 (10.75) 7.80 (13.48) 7.65 (13.98) 7.51 (14.46) 7.25 (15.34) 7.29 (15.23)<br />
B. Transfers and subsidies 8.94 (4.40) 8.66 (5.40) 9.25 (3.24) 8.09 (7.50) 7.92 (8.13) 7.92 (8.13) 7.92 (8.13) 7.92 (8.13)<br />
C. Government enterprises and investment 2.00 (43.00) 4.00 (34.80) 7.00 (23.90) 7.00 (23.20) 8.00 (16.80) 7.00 (22.40) 6.00 (26.62) 6.00 (29.26)<br />
D. Top marginal tax rate 4.00 4.00 7.00 7.00 5.00 6.00 6.00 7.50<br />
(i) Top marginal income tax rate 4.00 (55) 4.00 (55) 7.00 (40) 7.00 (35) 7.00 (40) 8.00 (30) 8.00 (28) 9.00 (30)<br />
(ii) Top marginal income and payroll tax rate 3.00 (47) 4.00 (42) 4.00 (41) 6.00 (43)<br />
Area 2. Legal System and Property Rights 6.29 5.38 6.76 5.30 4.25 4.96 4.53 4.57<br />
A. Judicial independence 3.88 3.34 4.41 3.69 3.74<br />
B. Impartial courts 5.05 5.18 3.85 3.74 3.72<br />
C. Protection of property rights 5.22 4.38 6.05 4.88 5.05<br />
D. Military interference in rule of law and politics 5.37 5.00 7.50 7.50 7.50<br />
E. Integrity of the legal system 6.96 3.33 5.00 3.33 3.33<br />
F. Legal enforcement of contracts 5.39 5.39 5.39<br />
G. Regulatory restrictions on sale of real property 6.89 6.89 6.86<br />
H. Reliability of police 3.29 2.56 2.91<br />
I. Business costs of crime 2.28 2.80 2.64<br />
Area 3. Sound Money 7.70 3.67 3.59 5.50 6.85 8.08 7.97 8.07<br />
A. Money growth 6.27 (18.66) 2.80 (36.00) 0.00 (51.34) 8.95 (5.23) 7.22 (13.89) 8.60 (7.02) 8.29 (8.55) 8.48 (7.59)<br />
B. Standard deviation of inflation 9.08 (2.29) 1.90 (20.26) 0.00 (43.89) 5.62 (10.95) 7.09 (7.27) 9.51 (1.22) 9.64 (0.90) 9.61 (0.97)<br />
C. Inflation: most recent year 5.44 (22.80) 0.00 (54.01) 4.37 (28.13) 2.43 (37.85) 8.10 (9.50) 9.20 (3.99) 8.94 (5.30) 9.17 (4.16)<br />
D. <strong>Freedom</strong> to own foreign currency bank accounts 10.00 10.00 10.00 5.00 5.00 5.00 5.00 5.00<br />
Area 4. <strong>Freedom</strong> to Trade Internationally 1.30 4.38 7.63 7.72 7.47 7.25 7.06 6.74<br />
A. Tariffs 1.91 6.13 7.88 8.21 7.48 7.55 6.66 6.58<br />
(i) Revenue from trade taxes (% of trade sector) 0.00 (17.60) 8.27 (2.60) 8.67 (2.00) 9.30 (1.05) 9.37 (0.94) 9.37 (0.94) 9.37 (0.94) 9.37 (0.94)<br />
(ii) Mean tariff rate 3.82 (30.90) 4.00 (30.00) 7.78 (11.10) 7.48 (12.60) 6.76 (16.20) 8.16 (9.20) 7.70 (11.50) 8.20 (9.00)<br />
(iii) Standard deviation of tariff rates 7.20 (7.00) 7.84 (5.40) 6.32 (9.20) 5.13 (12.18) 2.92 (17.71) 2.15 (19.62)<br />
B. Regulatory trade barriers 6.30 7.28 7.04 7.33 6.15<br />
(i) Non-tariff trade barriers 6.30 6.40 6.15 6.25 6.05<br />
(ii) Compliance cost of importing and exporting 8.16 7.93 8.41 6.25<br />
C. Black-market exchange rates 0.00 5.00 10.00 10.00 10.00 10.00 10.00 10.00<br />
D. Controls of the movement of capital and people 2.00 2.00 5.00 6.39 5.12 4.43 4.25 4.23<br />
(i) Foreign ownership/investment restrictions 7.77 8.70 7.54 7.02 6.97<br />
(ii) Capital controls 2.00 2.00 5.00 5.00 1.54 1.54 1.54 1.54<br />
(iii) <strong>Freedom</strong> of foreigners to visit 4.20 4.20 4.20<br />
Area 5. Regulation 4.97 3.74 5.33 6.32 6.50 7.07 6.68 6.74<br />
A. Credit market regulations 5.62 2.36 5.58 8.56 9.48 9.81 8.58 8.65<br />
(i) Ownership of banks 8.00 0.00 0.00 8.00 10.00 10.00 10.00 10.00<br />
(ii) Private sector credit 4.87 3.08 8.74 9.68 9.43 9.43 5.74 5.94<br />
(iii) Interest rate controls/negative real interest rates 4.00 4.00 8.00 8.00 9.00 10.00 10.00 10.00<br />
B. Labor market regulations 5.08 5.87 4.40 5.74 5.47 5.53<br />
(i) Hiring regulations and minimum wage 7.92 2.75 6.70 6.67 6.67<br />
(ii) Hiring and firing regulations 5.00 5.00 4.10 4.65 3.32 3.47<br />
(iii) Centralized collective bargaining 7.24 7.24 5.65 6.89 6.18 6.41<br />
(iv) Hours regulations 6.18 6.51 8.00 8.00 8.00<br />
(v) Mandated cost of worker dismissal 5.18 5.63 5.63<br />
(vi) Conscription 3.00 3.00 3.00 3.00 3.00 3.00 3.00 3.00<br />
C. Business regulations 4.53 5.62 5.65 5.99 6.03<br />
(i) Administrative requirements 6.73 2.70 2.80 3.15<br />
(ii) Bureaucracy costs 6.09 6.33 3.79 4.89 4.18<br />
(iii) Starting a business 4.15 3.70 8.95 9.55 9.57<br />
(iv) Extra payments/bribes/favoritism 3.36 5.73 6.19 4.26 4.16<br />
(v) Licensing restrictions 8.48 9.00 9.00<br />
(vi) Cost of tax compliance 3.81 5.47 6.11
Country Data Tables • 115<br />
Moldova 1980 1985 1990 1995 2000 2005 2009 2010<br />
Chain-Linked Rating (Rank) Rating (Rank) Rating (Rank) Rating (Rank) Rating (Rank) Rating (Rank) Rating (Rank) Rating (Rank)<br />
Summary Rating (Rank) <br />
Area 1. Size of Government<br />
Area 2. Legal System and Property Rights<br />
Area 3. Sound Money<br />
Area 4. <strong>Freedom</strong> to Trade Internationally<br />
Area 5. Regulation<br />
Unadjusted<br />
Summary Rating (Rank) 6.77 (75) 6.65 (84) 6.75 (85)<br />
Rating (Data) Rating (Data) Rating (Data) Rating (Data) Rating (Data) Rating (Data) Rating (Data) Rating (Data)<br />
Area 1. Size of Government 8.04 6.67 7.19<br />
A. Government consumption 7.55 (14.33) 6.03 (19.50) 5.70 (20.61)<br />
B. Transfers and subsidies 6.56 (13.13) 5.64 (16.51) 6.07 (14.91)<br />
C. Government enterprises and investment 10.00 (8.09) 8.00 (16.14) 10.00 (3.62)<br />
D. Top marginal tax rate 7.00 7.00<br />
(i) Top marginal income tax rate 10.00 (18) 10.00 (18)<br />
(ii) Top marginal income and payroll tax rate 4.00 (41) 4.00 (41)<br />
Area 2. Legal System and Property Rights 5.30 5.55 5.48<br />
A. Judicial independence 1.98 2.12 1.99<br />
B. Impartial courts 2.62 3.35 3.34<br />
C. Protection of property rights 4.20 3.86 3.86<br />
D. Military interference in rule of law and politics 6.67 6.67 6.67<br />
E. Integrity of the legal system 8.33 7.50 7.50<br />
F. Legal enforcement of contracts 6.71 6.44 6.07<br />
G. Regulatory restrictions on sale of real property 8.73 9.61 9.61<br />
H. Reliability of police 3.60 3.66 6.82<br />
I. Business costs of crime 4.88 6.78 3.41<br />
Area 3. Sound Money 6.65 7.74 7.38<br />
A. Money growth 5.30 (23.51) 8.01 (9.93) 8.06 (9.72)<br />
B. Standard deviation of inflation 8.92 (2.70) 7.97 (5.09) 7.96 (5.10)<br />
C. Inflation: most recent year 7.38 (13.11) 9.99 (−0.05) 8.52 (7.40)<br />
D. <strong>Freedom</strong> to own foreign currency bank accounts 5.00 5.00 5.00<br />
Area 4. <strong>Freedom</strong> to Trade Internationally 6.81 6.80 6.92<br />
A. Tariffs 8.50 8.56 8.55<br />
(i) Revenue from trade taxes (% of trade sector) 9.23 (1.15) 9.15 (1.27) 8.84 (1.74) 8.89 (1.66)<br />
(ii) Mean tariff rate 8.96 (5.20) 9.08 (4.60) 9.08 (4.60)<br />
(iii) Standard deviation of tariff rates 7.38 (6.55) 7.76 (5.61) 7.68 (5.80)<br />
B. Regulatory trade barriers 5.50 5.45 5.90<br />
(i) Non-tariff trade barriers 5.70 5.61 5.48<br />
(ii) Compliance cost of importing and exporting 5.30 5.30 6.31<br />
C. Black-market exchange rates 10.00 10.00 10.00<br />
D. Controls of the movement of capital and people 3.26 3.17 3.23<br />
(i) Foreign ownership/investment restrictions 5.02 4.76 4.94<br />
(ii) Capital controls 0.00 0.00 0.00<br />
(iii) <strong>Freedom</strong> of foreigners to visit 4.76 4.76 4.76<br />
Area 5. Regulation 7.06 6.52 6.77<br />
A. Credit market regulations 9.33 8.32 9.13<br />
(i) Ownership of banks 8.00 8.00 10.00<br />
(ii) Private sector credit 9.09 10.00 6.97 8.38<br />
(iii) Interest rate controls/negative real interest rates 10.00 10.00 9.00<br />
B. Labor market regulations 6.04 5.38 5.59<br />
(i) Hiring regulations and minimum wage 6.70 4.43 5.57<br />
(ii) Hiring and firing regulations 5.73 4.05 4.11<br />
(iii) Centralized collective bargaining 7.48 7.43 7.55<br />
(iv) Hours regulations 6.00 6.00 6.00<br />
(v) Mandated cost of worker dismissal 7.31 7.34 7.34<br />
(vi) Conscription 3.00 3.00 3.00<br />
C. Business regulations 5.81 5.85 5.60<br />
(i) Administrative requirements 2.55 3.08 3.22<br />
(ii) Bureaucracy costs 3.53 5.36 3.73<br />
(iii) Starting a business 8.84 9.53 9.58<br />
(iv) Extra payments/bribes/favoritism 6.78 3.72 3.56<br />
(v) Licensing restrictions 5.76 5.94 6.03<br />
(vi) Cost of tax compliance 7.40 7.44 7.44<br />
www.freetheworld.com • www.fraserinstitute.org • Fraser Institute ©2012
116 • <strong>Economic</strong> <strong>Freedom</strong> of the <strong>World</strong>: 2012 Annual Report<br />
Mongolia 1980 1985 1990 1995 2000 2005 2009 2010<br />
Chain-Linked Rating (Rank) Rating (Rank) Rating (Rank) Rating (Rank) Rating (Rank) Rating (Rank) Rating (Rank) Rating (Rank)<br />
Summary Rating (Rank) <br />
Area 1. Size of Government<br />
Area 2. Legal System and Property Rights<br />
Area 3. Sound Money<br />
Area 4. <strong>Freedom</strong> to Trade Internationally<br />
Area 5. Regulation<br />
Unadjusted<br />
Summary Rating (Rank) 7.06 (58) 7.04 (64) 7.01 (69)<br />
Rating (Data) Rating (Data) Rating (Data) Rating (Data) Rating (Data) Rating (Data) Rating (Data) Rating (Data)<br />
Area 1. Size of Government 7.58 7.11 7.45<br />
A. Government consumption 6.41 (18.22) 5.81 (20.23) 5.73 (20.53)<br />
B. Transfers and subsidies 7.90 (8.20) 6.62 (12.89) 7.08 (11.23)<br />
C. Government enterprises and investment 10.00 (7.63) 7.00 (22.79) 8.00 (18.83)<br />
D. Top marginal tax rate 6.00 9.00 9.00<br />
(i) Top marginal income tax rate 8.00 (30) 10.00 (10) 10.00 (10)<br />
(ii) Top marginal income and payroll tax rate 4.00 (49) 8.00 (29) 8.00 (29)<br />
Area 2. Legal System and Property Rights 5.28 5.63 5.67<br />
A. Judicial independence 2.62 2.64 2.67<br />
B. Impartial courts 2.52 3.04 3.21<br />
C. Protection of property rights 5.00 3.94 3.84<br />
D. Military interference in rule of law and politics 8.80 8.33 8.33<br />
E. Integrity of the legal system 6.67 6.67<br />
F. Legal enforcement of contracts 6.24 6.24 6.24<br />
G. Regulatory restrictions on sale of real property 9.07 9.07 9.10<br />
H. Reliability of police 3.23 4.40 6.52<br />
I. Business costs of crime 4.73 6.32 4.42<br />
Area 3. Sound Money 8.31 7.98 7.22<br />
A. Money growth 8.48 (7.61) 7.02 (14.91) 4.74 (26.30)<br />
B. Standard deviation of inflation 7.30 (6.74) 6.15 (9.62) 6.17 (9.57)<br />
C. Inflation: most recent year 7.46 (12.72) 8.74 (6.28) 7.97 (10.15)<br />
D. <strong>Freedom</strong> to own foreign currency bank accounts 10.00 10.00 10.00<br />
Area 4. <strong>Freedom</strong> to Trade Internationally 6.81 6.98 7.26<br />
A. Tariffs 9.18 9.17 9.04<br />
(i) Revenue from trade taxes (% of trade sector) 9.01 (1.48) 8.80 (1.80) 8.41 (2.39)<br />
(ii) Mean tariff rate 9.16 (4.20) 9.00 (5.00) 9.00 (5.00)<br />
(iii) Standard deviation of tariff rates 9.37 (1.58) 9.72 (0.70) 9.70 (0.75)<br />
B. Regulatory trade barriers 4.62 4.60 5.69<br />
(i) Non-tariff trade barriers 3.90 5.82 5.32<br />
(ii) Compliance cost of importing and exporting 5.34 3.37 6.07<br />
C. Black-market exchange rates 10.00 10.00 10.00<br />
D. Controls of the movement of capital and people 3.43 4.15 4.29<br />
(i) Foreign ownership/investment restrictions 6.75 5.62 6.06<br />
(ii) Capital controls 3.08 6.36 6.36<br />
(iii) <strong>Freedom</strong> of foreigners to visit 0.45 0.45 0.45<br />
Area 5. Regulation 7.33 7.48 7.47<br />
A. Credit market regulations<br />
(i) Ownership of banks<br />
9.13 8.97 9.50<br />
(ii) Private sector credit 10.00 10.00 9.25 8.95 10.00<br />
(iii) Interest rate controls/negative real interest rates 9.00 9.00 9.00<br />
B. Labor market regulations 7.05 7.24 7.23<br />
(i) Hiring regulations and minimum wage 8.90 8.90 8.90<br />
(ii) Hiring and firing regulations 7.00 5.96 5.95<br />
(iii) Centralized collective bargaining 8.25 7.97 7.96<br />
(iv) Hours regulations 6.00 8.00 8.00<br />
(v) Mandated cost of worker dismissal 9.17 9.60 9.60<br />
(vi) Conscription 3.00 3.00 3.00<br />
C. Business regulations 5.82 6.24 5.67<br />
(i) Administrative requirements 2.92 2.83 2.83<br />
(ii) Bureaucracy costs 3.36 6.88 3.28<br />
(iii) Starting a business 9.12 9.40 9.44<br />
(iv) Extra payments/bribes/favoritism 4.67 3.19 3.19<br />
(v) Licensing restrictions 7.12 7.29 7.44<br />
(vi) Cost of tax compliance 7.71 7.85 7.85<br />
Fraser Institute ©2012 • www.fraserinstitute.org • www.freetheworld.com
Montenegro<br />
Country Data Tables • 117<br />
1980 1985 1990 1995 2000 2005 2009 2010<br />
Chain-Linked Rating (Rank) Rating (Rank) Rating (Rank) Rating (Rank) Rating (Rank) Rating (Rank) Rating (Rank) Rating (Rank)<br />
Summary Rating (Rank) <br />
Area 1. Size of Government<br />
Area 2. Legal System and Property Rights<br />
Area 3. Sound Money<br />
Area 4. <strong>Freedom</strong> to Trade Internationally<br />
Area 5. Regulation<br />
Unadjusted<br />
Summary Rating (Rank) 6.71 (79) 7.52 (25) 7.54 (28)<br />
Rating (Data) Rating (Data) Rating (Data) Rating (Data) Rating (Data) Rating (Data) Rating (Data) Rating (Data)<br />
Area 1. Size of Government 5.60 5.81 6.00<br />
A. Government consumption<br />
B. Transfers and subsidies<br />
3.81 (27.03) 6.44 (18.09) 6.50 (17.91)<br />
C. Government enterprises and investment 6.00 (25.80) 4.00 (31.43) 4.00 (24.96)<br />
D. Top marginal tax rate 7.00 7.00 7.50<br />
(i) Top marginal income tax rate 9.00 (23) 10.00 (14) 10.00 (14)<br />
(ii) Top marginal income and payroll tax rate 4.00 (43) 5.00 (40)<br />
Area 2. Legal System and Property Rights 5.56 6.41 6.47<br />
A. Judicial independence 3.50 5.16 5.28<br />
B. Impartial courts 3.50 5.21 5.41<br />
C. Protection of property rights 4.50 6.25 6.20<br />
D. Military interference in rule of law and politics<br />
E. Integrity of the legal system<br />
10.00 7.80 7.70<br />
F. Legal enforcement of contracts 4.80 4.80 4.80<br />
G. Regulatory restrictions on sale of real property 7.72 7.57 7.64<br />
H. Reliability of police 4.49 6.19 8.20<br />
I. Business costs of crime 5.96 8.29 6.52<br />
Area 3. Sound Money 8.79 9.44 9.57<br />
A. Money growth 9.73 (1.35) 9.94 (−0.29)<br />
B. Standard deviation of inflation 7.24 (6.90) 8.74 (3.16) 8.48 (3.81)<br />
C. Inflation: most recent year 9.14 (4.32) 9.31 (3.47) 9.87 (0.65)<br />
D. <strong>Freedom</strong> to own foreign currency bank accounts 10.00 10.00 10.00<br />
Area 4. <strong>Freedom</strong> to Trade Internationally 7.23 7.94 7.77<br />
A. Tariffs 7.51 8.12 8.13<br />
(i) Revenue from trade taxes (% of trade sector) 7.80 (3.30) 7.80 (3.30) 7.80 (3.30)<br />
(ii) Mean tariff rate 8.68 (6.60) 9.02 (4.90) 9.02 (4.90)<br />
(iii) Standard deviation of tariff rates 6.05 (9.90) 7.55 (6.13) 7.57 (6.08)<br />
B. Regulatory trade barriers 6.31 7.38 6.74<br />
(i) Non-tariff trade barriers 4.50 6.65 6.35<br />
(ii) Compliance cost of importing and exporting 8.12 8.12 7.13<br />
C. Black-market exchange rates 10.00 10.00 10.00<br />
D. Controls of the movement of capital and people 5.10 6.26 6.19<br />
(i) Foreign ownership/investment restrictions 6.75 6.55<br />
(ii) Capital controls 6.92 6.92<br />
(iii) <strong>Freedom</strong> of foreigners to visit 5.10 5.10 5.10<br />
Area 5. Regulation 6.38 8.01 7.90<br />
A. Credit market regulations 9.45 9.80 9.78<br />
(i) Ownership of banks 10.00 10.00 10.00<br />
(ii) Private sector credit 8.34 9.39 9.34<br />
(iii) Interest rate controls/negative real interest rates 10.00 10.00 10.00<br />
B. Labor market regulations 4.76 8.29 8.01<br />
(i) Hiring regulations and minimum wage 6.70 10.00 8.90<br />
(ii) Hiring and firing regulations 2.00 5.46 5.21<br />
(iii) Centralized collective bargaining 2.50 6.68 6.35<br />
(iv) Hours regulations 8.00 10.00 10.00<br />
(v) Mandated cost of worker dismissal 6.38 7.59 7.59<br />
(vi) Conscription 3.00 10.00 10.00<br />
C. Business regulations 4.92 5.94 5.91<br />
(i) Administrative requirements 4.00 4.49 5.06<br />
(ii) Bureaucracy costs 3.00 5.05 5.40<br />
(iii) Starting a business 9.16 9.66 9.66<br />
(iv) Extra payments/bribes/favoritism 3.00 5.64 5.62<br />
(v) Licensing restrictions 4.55 4.97 3.90<br />
(vi) Cost of tax compliance 5.83 5.83 5.83<br />
www.freetheworld.com • www.fraserinstitute.org • Fraser Institute ©2012
118 • <strong>Economic</strong> <strong>Freedom</strong> of the <strong>World</strong>: 2012 Annual Report<br />
Morocco 1980 1985 1990 1995 2000 2005 2009 2010<br />
Chain-Linked Rating (Rank) Rating (Rank) Rating (Rank) Rating (Rank) Rating (Rank) Rating (Rank) Rating (Rank) Rating (Rank)<br />
Summary Rating (Rank) 4.45 (77) 5.20 (55) 5.18 (70) 6.28 (58) 6.14 (82) 6.37 (83) 6.35 (86) 6.36 (93)<br />
Area 1. Size of Government 4.63 (67) 5.23 (49) 5.91 (48) 6.27 (53) 6.32 (56) 6.71 (62) 6.33 (59) 6.25 (70)<br />
Area 2. Legal System and Property Rights 2.24 (80) 3.99 (73) 3.99 (73) 7.77 (24) 7.68 (28) 7.55 (28) 7.33 (31) 7.30 (30)<br />
Area 3. Sound Money 6.26 (52) 6.81 (44) 6.50 (64) 6.69 (59) 6.96 (83) 7.10 (86) 7.02 (93) 7.07 (90)<br />
Area 4. <strong>Freedom</strong> to Trade Internationally 4.35 (49) 5.30 (45) 4.66 (65) 5.67 (83) 4.40 (117) 4.92 (118) 5.13 (111) 5.30 (111)<br />
Area 5. Regulation 4.82 (77) 4.70 (77) 4.90 (81) 5.01 (88) 5.36 (102) 5.61 (103) 5.85 (105) 5.76 (107)<br />
Unadjusted<br />
Summary Rating (Rank) 4.42 (77) 5.22 (61) 5.20 (68) 6.08 (62) 5.94 (85) 6.42 (92) 6.40 (97) 6.41 (102)<br />
Fraser Institute ©2012 • www.fraserinstitute.org • www.freetheworld.com<br />
Rating (Data) Rating (Data) Rating (Data) Rating (Data) Rating (Data) Rating (Data) Rating (Data) Rating (Data)<br />
Area 1. Size of Government 4.63 5.23 5.91 6.27 6.32 6.71 6.33 6.25<br />
A. Government consumption 5.51 (21.26) 6.06 (19.41) 6.12 (19.18) 6.01 (19.57) 5.10 (22.65) 4.48 (24.75) 4.71 (23.98) 4.87 (23.43)<br />
B. Transfers and subsidies 9.02 (4.10) 8.88 (4.60) 9.51 (2.30) 9.07 (3.92) 8.16 (7.25) 8.37 (6.48) 8.63 (5.54) 8.13 (7.35)<br />
C. Government enterprises and investment 2.00 (46.80) 6.00 (27.90) 8.00 (19.80) 7.00 (21.90) 8.00 (18.10) 10.00 (13.60) 8.00 (19.33) 8.00 (18.67)<br />
D. Top marginal tax rate 2.00 0.00 0.00 3.00 4.00 4.00 4.00 4.00<br />
(i) Top marginal income tax rate 2.00 (64) 0.00 (87) 0.00 (87) 3.00 (46) 4.00 (44) 4.00 (44) 4.00 (44) 4.00 (44)<br />
(ii) Top marginal income and payroll tax rate<br />
Area 2. Legal System and Property Rights 2.24 3.99 3.99 6.74 6.67 6.17 5.99 5.97<br />
A. Judicial independence 4.07 4.14 4.28<br />
B. Impartial courts 6.76 6.37 5.06 4.84 4.83<br />
C. Protection of property rights 6.26 5.70 5.62<br />
D. Military interference in rule of law and politics 6.55 6.67 6.67 6.67 6.67<br />
E. Integrity of the legal system 10.00 10.00 8.33 8.33 8.33<br />
F. Legal enforcement of contracts 4.30 4.30 5.09<br />
G. Regulatory restrictions on sale of real property 7.65 7.50 6.97<br />
H. Reliability of police 6.65 5.54 6.60<br />
I. Business costs of crime 6.60 6.93 5.34<br />
Area 3. Sound Money 6.26 6.81 6.50 6.69 6.96 7.10 7.02 7.07<br />
A. Money growth 8.75 (6.25) 9.30 (3.48) 8.09 (9.57) 9.25 (3.73) 8.63 (6.84) 8.94 (5.29) 8.97 (5.16) 9.29 (3.56)<br />
B. Standard deviation of inflation 8.19 (4.52) 9.64 (0.91) 9.06 (2.36) 9.11 (2.22) 9.60 (0.99) 9.65 (0.86) 9.30 (1.75) 9.18 (2.05)<br />
C. Inflation: most recent year 8.11 (9.46) 8.32 (8.42) 8.87 (5.66) 8.41 (7.96) 9.62 (1.89) 9.80 (0.98) 9.80 (1.00) 9.80 (0.99)<br />
D. <strong>Freedom</strong> to own foreign currency bank accounts 0.00 0.00 0.00 0.00 0.00 0.00 0.00 0.00<br />
Area 4. <strong>Freedom</strong> to Trade Internationally 4.41 5.37 4.73 5.67 4.40 6.28 6.55 6.76<br />
A. Tariffs 1.43 5.52 4.78 5.20 3.19 4.74 5.36 5.50<br />
(i) Revenue from trade taxes (% of trade sector) 2.87 (10.70) 5.73 (6.40) 4.27 (8.60) 5.45 (6.82) 5.09 (7.36) 7.51 (3.73) 7.88 (3.18) 8.29 (2.57)<br />
(ii) Mean tariff rate 0.00 (54.00) 5.30 (23.50) 5.30 (23.50) 5.44 (22.80) 3.28 (33.60) 6.12 (19.40) 6.38 (18.10) 6.38 (18.10)<br />
(iii) Standard deviation of tariff rates 4.72 (13.20) 1.20 (22.00) 0.59 (23.52) 1.82 (20.45) 1.82 (20.45)<br />
B. Regulatory trade barriers 5.88 6.59 6.75<br />
(i) Non-tariff trade barriers 4.98 5.25 5.49<br />
(ii) Compliance cost of importing and exporting 6.78 7.93 8.00<br />
C. Black-market exchange rates 9.80 8.60 7.40 9.80 10.00 9.42 10.00 10.00<br />
D. Controls of the movement of capital and people 2.00 2.00 2.00 2.00 0.00 5.07 4.24 4.81<br />
(i) Foreign ownership/investment restrictions 7.07 5.35 6.30<br />
(ii) Capital controls 2.00 2.00 2.00 2.00 0.00 0.77 0.00 0.77<br />
(iii) <strong>Freedom</strong> of foreigners to visit 7.37 7.37 7.37<br />
Area 5. Regulation 4.55 4.70 4.90 5.01 5.36 5.84 6.09 5.99<br />
A. Credit market regulations 5.69 5.57 6.09 6.39 7.32 7.74 8.00 7.39<br />
(i) Ownership of banks 5.00 5.00 5.00 5.00 5.00 5.00 5.00 5.00<br />
(ii) Private sector credit 6.38 5.72 5.26 6.16 7.95 9.21 10.00 9.16<br />
(iii) Interest rate controls/negative real interest rates 6.00 8.00 8.00 9.00 9.00 9.00 8.00<br />
B. Labor market regulations 3.65 4.12 4.12<br />
(i) Hiring regulations and minimum wage 0.00 1.10 1.10<br />
(ii) Hiring and firing regulations 5.30 4.92 5.08<br />
(iii) Centralized collective bargaining 7.50 6.77 6.65<br />
(iv) Hours regulations 6.00 8.00 8.00<br />
(v) Mandated cost of worker dismissal 2.12 2.92 2.92<br />
(vi) Conscription 1.00 1.00 1.00 1.00 1.00 1.00 1.00 1.00<br />
C. Business regulations 6.12 6.16 6.47<br />
(i) Administrative requirements 3.56 3.99 3.86<br />
(ii) Bureaucracy costs 5.40 5.18 4.61<br />
(iii) Starting a business 9.26 9.41 9.42<br />
(iv) Extra payments/bribes/favoritism 5.08 4.60 4.70<br />
(v) Licensing restrictions 7.42 7.81 8.91<br />
(vi) Cost of tax compliance 5.99 5.99 7.33
Mozambique<br />
Country Data Tables • 119<br />
1980 1985 1990 1995 2000 2005 2009 2010<br />
Chain-Linked Rating (Rank) Rating (Rank) Rating (Rank) Rating (Rank) Rating (Rank) Rating (Rank) Rating (Rank) Rating (Rank)<br />
Summary Rating (Rank) <br />
Area 1. Size of Government<br />
Area 2. Legal System and Property Rights<br />
Area 3. Sound Money<br />
Area 4. <strong>Freedom</strong> to Trade Internationally<br />
Area 5. Regulation<br />
Unadjusted<br />
Summary Rating (Rank) 5.45 (130) 5.53 (129) 5.45 (134)<br />
Rating (Data) Rating (Data) Rating (Data) Rating (Data) Rating (Data) Rating (Data) Rating (Data) Rating (Data)<br />
Area 1. Size of Government 5.47 4.74 4.66<br />
A. Government consumption<br />
B. Transfers and subsidies<br />
8.08 (12.51) 8.41 (11.41) 7.73 (13.73) 7.97 (12.90)<br />
C. Government enterprises and investment 2.00 (45.74) 0.00 (62.38) 0.00 (55.27)<br />
D. Top marginal tax rate 6.00 6.50 6.00<br />
(i) Top marginal income tax rate 7.00 (32) 7.00 (32) 7.00 (32)<br />
(ii) Top marginal income and payroll tax rate 5.00 (37) 6.00 (38) 5.00 (38)<br />
Area 2. Legal System and Property Rights 3.23 4.26 4.23<br />
A. Judicial independence 2.46 3.22 2.83<br />
B. Impartial courts 2.68 4.02 3.69<br />
C. Protection of property rights 4.82 3.89 4.17<br />
D. Military interference in rule of law and politics 3.61 6.67 6.67<br />
E. Integrity of the legal system 5.00 5.00 5.00<br />
F. Legal enforcement of contracts 0.00 0.00 0.00<br />
G. Regulatory restrictions on sale of real property 4.54 5.95 6.35<br />
H. Reliability of police 3.07 4.53 5.06<br />
I. Business costs of crime 2.85 5.03 4.32<br />
Area 3. Sound Money 7.64 6.53 5.86<br />
A. Money growth 2.88 (35.58) 3.91 (30.43) 7.63 (11.85) 8.45 (7.77) 7.62 (11.88) 7.37 (13.16)<br />
B. Standard deviation of inflation 8.56 (3.59) 9.16 (2.09) 8.60 (3.51)<br />
C. Inflation: most recent year 8.57 (7.17) 9.35 (3.25) 7.46 (12.70)<br />
D. <strong>Freedom</strong> to own foreign currency bank accounts 5.00 0.00 0.00<br />
Area 4. <strong>Freedom</strong> to Trade Internationally 6.10 6.27 6.62<br />
A. Tariffs<br />
(i) Revenue from trade taxes (% of trade sector)<br />
6.75 7.51 7.52<br />
(ii) Mean tariff rate 7.38 (13.10) 7.94 (10.30) 7.98 (10.10)<br />
(iii) Standard deviation of tariff rates 6.13 (9.68) 7.07 (7.31) 7.05 (7.37)<br />
B. Regulatory trade barriers 5.10 5.58 6.54<br />
(i) Non-tariff trade barriers 4.68 4.80 4.82<br />
(ii) Compliance cost of importing and exporting 5.53 6.36 8.25<br />
C. Black-market exchange rates 10.00 10.00 10.00<br />
D. Controls of the movement of capital and people 2.54 2.00 2.43<br />
(i) Foreign ownership/investment restrictions 6.70 5.10 6.38<br />
(ii) Capital controls 0.00 0.00 0.00<br />
(iii) <strong>Freedom</strong> of foreigners to visit 0.91 0.91 0.91<br />
Area 5. Regulation 4.82 5.83 5.90<br />
A. Credit market regulations 7.16 8.45 9.20<br />
(i) Ownership of banks 10.00<br />
(ii) Private sector credit 5.31 6.90 7.59<br />
(iii) Interest rate controls/negative real interest rates 10.00 9.00 10.00 10.00<br />
B. Labor market regulations 2.96 3.06 2.76<br />
(i) Hiring regulations and minimum wage 2.80 3.33 1.67<br />
(ii) Hiring and firing regulations 3.01 3.84 3.90<br />
(iii) Centralized collective bargaining 5.25 5.20 4.97<br />
(iv) Hours regulations 6.70 6.00 6.00<br />
(v) Mandated cost of worker dismissal 0.00 0.00 0.00<br />
(vi) Conscription 0.00 0.00 0.00<br />
C. Business regulations 4.35 5.98 5.75<br />
(i) Administrative requirements 2.01 4.02 4.33<br />
(ii) Bureaucracy costs 2.31 6.61 4.24<br />
(iii) Starting a business 5.73 9.44 9.46<br />
(iv) Extra payments/bribes/favoritism 5.09 4.35 4.28<br />
(v) Licensing restrictions 3.50 4.04 4.78<br />
(vi) Cost of tax compliance 7.42 7.42 7.42<br />
www.freetheworld.com • www.fraserinstitute.org • Fraser Institute ©2012
120 • <strong>Economic</strong> <strong>Freedom</strong> of the <strong>World</strong>: 2012 Annual Report<br />
Myanmar 1980 1985 1990 1995 2000 2005 2009 2010<br />
Chain-Linked Rating (Rank) Rating (Rank) Rating (Rank) Rating (Rank) Rating (Rank) Rating (Rank) Rating (Rank) Rating (Rank)<br />
Summary Rating (Rank) 4.50 (75) 4.15 (91) 3.13 (109) 3.80 (118) 3.67 (123) 3.63 (122) 3.78 (123) 3.89 (122)<br />
Area 1. Size of Government 5.76 (78) 6.33 (76) 6.33 (61) 6.33 (65)<br />
Area 2. Legal System and Property Rights 5.35 (41) 3.99 (77) 3.50 (82) 4.93 (86) 2.92 (118) 2.60 (117) 3.19 (114) 3.19 (113)<br />
Area 3. Sound Money 6.90 (31) 7.31 (33) 4.23 (99) 4.84 (97) 5.53 (111) 4.96 (118) 6.25 (113) 5.73 (118)<br />
Area 4. <strong>Freedom</strong> to Trade Internationally 0.00 (91) 0.00 (97) 0.00 (104) 0.00 (113) 0.00 (122) 0.00 (122) 0.00 (122) 0.00 (122)<br />
Area 5. Regulation 3.03 (96) 2.93 (102) 3.04 (106) 3.26 (119) 4.14 (120) 4.36 (121) 3.31 (123) 4.39 (119)<br />
Unadjusted<br />
Summary Rating (Rank) 3.86 (91) 3.56 (101) 2.69 (113) 3.20 (122) 3.74 (123) 4.01 (139) 4.34 (141) 4.29 (143)<br />
Fraser Institute ©2012 • www.fraserinstitute.org • www.freetheworld.com<br />
Rating (Data) Rating (Data) Rating (Data) Rating (Data) Rating (Data) Rating (Data) Rating (Data) Rating (Data)<br />
Area 1. Size of Government 5.76 6.33 6.33 6.33<br />
A. Government consumption 8.28 (11.86) 10.00 (4.10) 10.00 (5.16) 10.00 (5.27)<br />
B. Transfers and subsidies<br />
C. Government enterprises and investment 2.00 (45.00) 2.00 (47.65) 4.00 (34.36) 4.00 (34.36) 4.00 4.00<br />
D. Top marginal tax rate 5.00 5.00 5.00 5.00<br />
(i) Top marginal income tax rate 5.00 (40) 5.00 (40) 5.00 (40) 5.00 (40)<br />
(ii) Top marginal income and payroll tax rate 5.00 (40) 5.00 (40) 5.00 (40) 5.00 (40)<br />
Area 2. Legal System and Property Rights<br />
A. Judicial independence<br />
5.35 3.99 3.50 4.69 3.25 2.60 3.19 3.19<br />
B. Impartial courts<br />
C. Protection of property rights<br />
4.08 3.76 2.80 2.90 2.90<br />
D. Military interference in rule of law and politics 3.74 0.00 0.00 1.67 1.67<br />
E. Integrity of the legal system<br />
F. Legal enforcement of contracts<br />
G. Regulatory restrictions on sale of real property<br />
H. Reliability of police<br />
I. Business costs of crime<br />
6.96 5.00 5.00 5.00 5.00<br />
Area 3. Sound Money 6.90 7.31 4.23 4.84 5.53 4.96 6.25 5.73<br />
A. Money growth 9.26 (3.69) 9.98 (−0.10) 7.46 (12.70) 5.64 (21.82) 6.93 (15.36) 7.10 (14.51) 8.26 (8.70) 7.71 (11.43)<br />
B. Standard deviation of inflation 8.59 (3.53) 9.59 (1.03) 3.16 (17.09) 7.62 (5.96) 5.22 (11.96) 4.60 (13.49) 7.05 (7.38) 6.76 (8.10)<br />
C. Inflation: most recent year 9.75 (1.24) 9.69 (1.57) 6.29 (18.54) 6.11 (19.44) 9.98 (−0.11) 8.13 (9.37) 9.71 (1.47) 8.46 (7.72)<br />
D. <strong>Freedom</strong> to own foreign currency bank accounts 0.00 0.00 0.00 0.00 0.00 0.00 0.00 0.00<br />
Area 4. <strong>Freedom</strong> to Trade Internationally 0.18 0.00 0.00 0.00 0.00 1.81 1.78 1.78<br />
A. Tariffs 0.53 0.00 0.00 0.00 0.00 5.42 5.35 5.35<br />
(i) Revenue from trade taxes (% of trade sector) 0.53 (14.20) 0.00 (17.60) 0.00 (19.35) 0.00 (24.66) 0.00 (19.80) 0.00 (57.21) 0.00 (57.21) 0.00 (57.21)<br />
(ii) Mean tariff rate 9.10 (4.50) 8.88 (5.60) 8.88 (5.60)<br />
(iii) Standard deviation of tariff rates<br />
B. Regulatory trade barriers<br />
(i) Non-tariff trade barriers<br />
(ii) Compliance cost of importing and exporting<br />
7.16 (7.11) 7.16 (7.11) 7.16 (7.11)<br />
C. Black-market exchange rates 0.00 0.00 0.00 0.00 0.00 0.00 0.00 0.00<br />
D. Controls of the movement of capital and people<br />
(i) Foreign ownership/investment restrictions<br />
0.00 0.00 0.00 0.00 0.00 0.00 0.00 0.00<br />
(ii) Capital controls 0.00 0.00 0.00 0.00 0.00 0.00 0.00 0.00<br />
(iii) <strong>Freedom</strong> of foreigners to visit 0.00 0.00 0.00<br />
Area 5. Regulation 3.03 2.93 3.04 3.26 4.14 4.36 4.15 4.39<br />
A. Credit market regulations 0.47 0.20 0.50 1.08 3.42 4.00 2.21 5.08<br />
(i) Ownership of banks 0.00 0.00 0.00 0.00 0.00 0.00 0.00 0.00<br />
(ii) Private sector credit 1.40 0.61 1.49 3.25 3.26 1.99 1.62 5.25<br />
(iii) Interest rate controls/negative real interest rates<br />
B. Labor market regulations<br />
(i) Hiring regulations and minimum wage<br />
(ii) Hiring and firing regulations<br />
(iii) Centralized collective bargaining<br />
0.00 0.00 0.00 0.00 7.00 10.00 5.00 10.00<br />
(iv) Hours regulations<br />
(v) Mandated cost of worker dismissal<br />
10.00<br />
(vi) Conscription<br />
C. Business regulations<br />
(i) Administrative requirements<br />
(ii) Bureaucracy costs<br />
(iii) Starting a business<br />
(iv) Extra payments/bribes/favoritism<br />
(v) Licensing restrictions<br />
(vi) Cost of tax compliance<br />
3.00 3.00 3.00 3.00 3.00 3.00 0.00 0.00
Country Data Tables • 121<br />
Namibia 1980 1985 1990 1995 2000 2005 2009 2010<br />
Chain-Linked Rating (Rank) Rating (Rank) Rating (Rank) Rating (Rank) Rating (Rank) Rating (Rank) Rating (Rank) Rating (Rank)<br />
Summary Rating (Rank) 5.11 (73) 6.14 (62) 6.38 (72) 6.46 (79) 6.41 (85) 6.40 (92)<br />
Area 1. Size of Government 3.02 (96) 1.16 (111) 4.88 (77) 4.72 (92) 5.14 (90) 6.21 (81) 5.68 (83) 5.60 (85)<br />
Area 2. Legal System and Property Rights 2.33 (103) 7.83 (23) 8.15 (21) 7.74 (25) 8.30 (19) 7.84 (26)<br />
Area 3. Sound Money 4.28 (98) 5.82 (77) 6.03 (72) 6.07 (107) 6.48 (103) 6.09 (116) 6.36 (113)<br />
Area 4. <strong>Freedom</strong> to Trade Internationally 5.85 (45) 5.29 (91) 5.13 (111) 5.03 (114) 4.98 (115) 5.08 (114)<br />
Area 5. Regulation 6.75 (25) 6.84 (27) 7.43 (18) 6.94 (50) 7.17 (37) 7.17 (39)<br />
Unadjusted<br />
Summary Rating (Rank) 5.05 (72) 6.15 (60) 6.38 (70) 6.65 (80) 6.60 (89) 6.59 (94)<br />
Rating (Data) Rating (Data) Rating (Data) Rating (Data) Rating (Data) Rating (Data) Rating (Data) Rating (Data)<br />
Area 1. Size of Government 1.70 0.65 4.92 4.77 5.14 6.21 5.68 5.60<br />
A. Government consumption 3.40 (28.44) 1.31 (35.55) 1.50 (34.91) 1.09 (36.28) 2.24 (32.40) 4.41 (24.99) 3.44 (28.30) 3.14 (29.33)<br />
B. Transfers and subsidies 9.26 (3.20) 9.21 (3.40) 9.33 (2.96) 9.41 (2.66) 9.26 (3.20) 9.26 (3.20)<br />
C. Government enterprises and investment 0.00 (57.90) 0.00 (64.30) 4.00 (38.60) 4.00 (31.90) 4.00 (32.26) 4.00 (34.27) 4.00 (36.84) 4.00 (36.32)<br />
D. Top marginal tax rate 5.00 7.00 6.00 6.00<br />
(i) Top marginal income tax rate 5.00 (36) 7.00 (35) 6.00 (37) 6.00 (37)<br />
(ii) Top marginal income and payroll tax rate 5.00 (36) 7.00 (35) 6.00 (37) 6.00 (37)<br />
Area 2. Legal System and Property Rights 2.33 7.83 8.15 6.59 7.06 6.68<br />
A. Judicial independence 7.17 7.18 7.07 7.43 6.44<br />
B. Impartial courts 7.25 7.75 5.94 6.50 6.10<br />
C. Protection of property rights 6.53 5.82 7.46 7.74 7.28<br />
D. Military interference in rule of law and politics 8.21 10.00 10.00 10.00 10.00<br />
E. Integrity of the legal system 10.00 10.00 8.33 8.33 8.33<br />
F. Legal enforcement of contracts 6.25 6.25 6.25<br />
G. Regulatory restrictions on sale of real property 6.28 6.41 4.76<br />
H. Reliability of police 3.63 5.90 4.94<br />
I. Business costs of crime 4.32 4.98 5.97<br />
Area 3. Sound Money 4.00 5.44 6.03 6.07 6.48 6.09 6.36<br />
A. Money growth 7.21 (13.96) 7.57 (12.15) 8.97 (5.17) 8.12 (9.42) 8.24 (8.82)<br />
B. Standard deviation of inflation 6.96 (7.61) 7.99 (5.03) 8.34 (4.16) 8.70 (3.25) 7.40 (6.49) 8.02 (4.95) 8.12 (4.71)<br />
C. Inflation: most recent year 5.04 (24.82) 8.33 (8.34) 8.56 (7.18) 8.00 (10.02) 9.55 (2.26) 8.24 (8.78) 9.11 (4.47)<br />
D. <strong>Freedom</strong> to own foreign currency bank accounts 0.00 0.00 0.00 0.00 0.00 0.00 0.00<br />
Area 4. <strong>Freedom</strong> to Trade Internationally 5.85 5.29 5.13 6.30 6.24 6.36<br />
A. Tariffs 8.12 8.80 6.14 3.86 5.40 5.70 5.10 5.03<br />
(i) Revenue from trade taxes (% of trade sector) 5.13 (7.30) 4.29 (8.56) 1.63 (12.55) 3.04 (10.44) 1.55 (12.67) 1.55 (12.67)<br />
(ii) Mean tariff rate 8.12 (9.40) 8.80 (6.00) 7.80 (11.00) 6.06 (19.70) 8.56 (7.20) 8.88 (5.60) 8.46 (7.70) 8.46 (7.70)<br />
(iii) Standard deviation of tariff rates 5.48 (11.30) 1.24 (21.90) 6.00 (10.00) 5.17 (12.08) 5.29 (11.78) 5.07 (12.32)<br />
B. Regulatory trade barriers 5.74 6.02 6.40<br />
(i) Non-tariff trade barriers 5.25 5.80 5.80<br />
(ii) Compliance cost of importing and exporting 6.23 6.23 7.00<br />
C. Black-market exchange rates 5.00 9.40 10.00 10.00 10.00 10.00 10.00<br />
D. Controls of the movement of capital and people 2.00 2.00 0.00 3.76 3.86 4.00<br />
(i) Foreign ownership/investment restrictions 6.64 6.15 6.58<br />
(ii) Capital controls 2.00 2.00 0.00 0.00 0.77 0.77<br />
(iii) <strong>Freedom</strong> of foreigners to visit 4.65 4.65 4.65<br />
Area 5. Regulation 6.73 6.82 7.43 7.69 7.94 7.94<br />
A. Credit market regulations 7.68 7.94 9.79 9.99 10.00 10.00<br />
(i) Ownership of banks 10.00 10.00 10.00 10.00<br />
(ii) Private sector credit 9.37 7.88 9.36 9.98 10.00 10.00<br />
(iii) Interest rate controls/negative real interest rates 6.00 8.00 10.00 10.00 10.00 10.00<br />
B. Labor market regulations 7.61 7.66 7.69<br />
(i) Hiring regulations and minimum wage 10.00 10.00 10.00<br />
(ii) Hiring and firing regulations 3.68 3.20 3.57<br />
(iii) Centralized collective bargaining 6.18 6.60 6.42<br />
(iv) Hours regulations 8.00 8.00 8.00<br />
(v) Mandated cost of worker dismissal 7.78 8.15 8.15<br />
(vi) Conscription 10.00 10.00 10.00 10.00 10.00 10.00<br />
C. Business regulations 5.47 6.16 6.13<br />
(i) Administrative requirements 2.87 4.40 3.98<br />
(ii) Bureaucracy costs 3.45 4.41 5.39<br />
(iii) Starting a business 6.77 7.69 7.71<br />
(iv) Extra payments/bribes/favoritism 5.80 6.23 5.45<br />
(v) Licensing restrictions 8.15 8.45 8.47<br />
(vi) Cost of tax compliance 5.80 5.80 5.80<br />
www.freetheworld.com • www.fraserinstitute.org • Fraser Institute ©2012
122 • <strong>Economic</strong> <strong>Freedom</strong> of the <strong>World</strong>: 2012 Annual Report<br />
Nepal<br />
Fraser Institute ©2012 • www.fraserinstitute.org • www.freetheworld.com<br />
1980 1985 1990 1995 2000 2005 2009 2010<br />
Chain-Linked Rating (Rank) Rating (Rank) Rating (Rank) Rating (Rank) Rating (Rank) Rating (Rank) Rating (Rank) Rating (Rank)<br />
Summary Rating (Rank) 5.49 (46) 5.01 (65) 5.11 (74) 5.15 (96) 5.87 (93) 6.18 (89) 5.68 (111) 5.90 (105)<br />
Area 1. Size of Government 6.77 (14) 5.29 (45) 5.50 (62) 5.33 (83) 5.30 (85) 9.23 (1) 7.60 (23) 7.70 (25)<br />
Area 2. Legal System and Property Rights 5.01 (78) 2.98 (113) 2.72 (118) 2.84 (117)<br />
Area 3. Sound Money 6.10 (60) 6.28 (77) 6.26 (68) 6.26 (69) 6.97 (82) 6.60 (99) 6.13 (115) 6.26 (114)<br />
Area 4. <strong>Freedom</strong> to Trade Internationally 4.59 (47) 3.99 (62) 3.57 (83) 3.93 (106) 5.97 (87) 6.15 (87) 5.99 (92) 6.26 (92)<br />
Area 5. Regulation 5.24 (60) 5.18 (68) 5.83 (49) 5.81 (61) 6.09 (76) 6.00 (96) 6.02 (100) 6.46 (88)<br />
Unadjusted<br />
Summary Rating (Rank) 5.77 (34) 5.27 (59) 5.37 (64) 5.15 (92) 5.82 (94) 6.50 (84) 5.98 (117) 6.33 (110)<br />
Rating (Data) Rating (Data) Rating (Data) Rating (Data) Rating (Data) Rating (Data) Rating (Data) Rating (Data)<br />
Area 1. Size of Government 6.77 5.29 5.50 5.33 5.30 9.23 7.60 8.34<br />
A. Government consumption 9.55 (7.54) 8.58 (10.83) 9.00 (9.40) 8.65 (10.57) 8.60 (10.77) 8.45 (11.27) 8.20 (12.12) 8.40 (11.45)<br />
B. Transfers and subsidies 9.62 (1.89)<br />
C. Government enterprises and investment 4.00 (37.30) 2.00 (45.80) 2.00 (43.20) 2.00 (43.20) 2.00 (43.20) 10.00 (14.64) 7.00 (20.98) 7.00 (22.38)<br />
D. Top marginal tax rate<br />
(i) Top marginal income tax rate<br />
(ii) Top marginal income and payroll tax rate<br />
Area 2. Legal System and Property Rights 4.44 4.76 4.05 3.70 3.85<br />
A. Judicial independence 5.16 3.68 3.63<br />
B. Impartial courts 4.57 4.42 3.57 2.84 3.27<br />
C. Protection of property rights 5.09 3.41 3.65<br />
D. Military interference in rule of law and politics<br />
E. Integrity of the legal system<br />
5.61 0.00 1.50 1.80<br />
F. Legal enforcement of contracts 3.37 3.37 3.37<br />
G. Regulatory restrictions on sale of real property 7.80 8.33 8.26<br />
H. Reliability of police 3.45 3.11 3.61<br />
I. Business costs of crime 3.97 3.35 3.21<br />
Area 3. Sound Money 6.10 6.28 6.26 6.26 6.97 6.60 6.13 6.26<br />
A. Money growth 8.07 (9.66) 8.26 (8.71) 7.71 (11.47) 8.13 (9.35) 9.19 (−4.05) 8.91 (−5.46) 7.77 (11.14) 8.34 (8.32)<br />
B. Standard deviation of inflation 7.86 (5.36) 9.13 (2.18) 9.48 (1.29) 8.16 (4.60) 9.19 (2.03) 8.86 (2.86) 9.05 (2.37) 8.72 (3.20)<br />
C. Inflation: most recent year 8.48 (7.61) 7.72 (11.42) 7.86 (10.71) 8.74 (6.30) 9.50 (2.48) 8.63 (6.84) 7.68 (11.61) 8.00 (9.98)<br />
D. <strong>Freedom</strong> to own foreign currency bank accounts 0.00 0.00 0.00 0.00 0.00 0.00 0.00 0.00<br />
Area 4. <strong>Freedom</strong> to Trade Internationally 4.97 4.32 3.87 3.93 5.97 6.62 6.45 6.74<br />
A. Tariffs 4.92 5.17 4.81 5.60 6.10 6.14 6.38 6.16<br />
(i) Revenue from trade taxes (% of trade sector) 4.27 (8.60) 4.87 (7.70) 4.13 (8.80) 6.37 (5.44) 6.59 (5.11) 5.97 (6.05) 5.78 (6.33) 5.33 (7.00)<br />
(ii) Mean tariff rate 5.58 (22.10) 5.48 (22.60) 5.48 (22.60) 6.78 (16.10) 7.06 (14.70) 7.06 (14.70) 7.52 (12.40) 7.54 (12.30)<br />
(iii) Standard deviation of tariff rates 3.64 (15.90) 4.64 (13.40) 5.39 (11.54) 5.83 (10.42) 5.62 (10.95)<br />
B. Regulatory trade barriers 4.58 4.81 6.11<br />
(i) Non-tariff trade barriers 4.79 5.08 4.90<br />
(ii) Compliance cost of importing and exporting 4.37 4.54 7.31<br />
C. Black-market exchange rates 10.00 7.80 6.80 6.20 10.00 10.00 10.00 10.00<br />
D. Controls of the movement of capital and people 0.00 0.00 0.00 0.00 1.82 5.77 4.62 4.69<br />
(i) Foreign ownership/investment restrictions 4.82 3.85 4.08<br />
(ii) Capital controls 0.00 0.00 0.00 0.00 1.82 2.50 0.00 0.00<br />
(iii) <strong>Freedom</strong> of foreigners to visit 10.00 10.00 10.00<br />
Area 5. Regulation 5.24 5.18 5.83 5.81 6.09 6.02 6.03 6.47<br />
A. Credit market regulations 4.00 3.84 5.56 5.52 6.25 7.23 6.89 8.52<br />
(i) Ownership of banks 0.00 0.00 0.00 0.00 0.00 2.00 2.00 8.00<br />
(ii) Private sector credit 6.00 5.53 6.68 8.55 8.76 9.68 9.68 8.55<br />
(iii) Interest rate controls/negative real interest rates 6.00 6.00 10.00 8.00 10.00 10.00 9.00 9.00<br />
B. Labor market regulations 5.91 5.85 5.81<br />
(i) Hiring regulations and minimum wage 4.40 3.33 3.33<br />
(ii) Hiring and firing regulations 3.56 4.09 4.13<br />
(iii) Centralized collective bargaining 5.86 5.65 5.35<br />
(iv) Hours regulations 10.00 10.00 10.00<br />
(v) Mandated cost of worker dismissal 1.66 2.05 2.05<br />
(vi) Conscription 10.00 10.00 10.00 10.00 10.00 10.00 10.00 10.00<br />
C. Business regulations 4.91 5.36 5.09<br />
(i) Administrative requirements 3.07 2.81 3.13<br />
(ii) Bureaucracy costs 4.18 7.06 3.25<br />
(iii) Starting a business 8.18 8.52 8.68<br />
(iv) Extra payments/bribes/favoritism 4.20 2.89 3.22<br />
(v) Licensing restrictions 4.41 4.65 5.93<br />
(vi) Cost of tax compliance 5.43 6.21 6.35
Netherlands<br />
Country Data Tables • 123<br />
1980 1985 1990 1995 2000 2005 2009 2010<br />
Chain-Linked Rating (Rank) Rating (Rank) Rating (Rank) Rating (Rank) Rating (Rank) Rating (Rank) Rating (Rank) Rating (Rank)<br />
Summary Rating (Rank) 7.23 (8) 7.28 (8) 7.60 (10) 7.95 (10) 8.21 (8) 7.92 (15) 7.58 (23) 7.58 (26)<br />
Area 1. Size of Government 4.03 (80) 3.98 (82) 4.94 (74) 4.78 (90) 4.46 (106) 4.40 (113) 3.45 (120) 3.36 (123)<br />
Area 2. Legal System and Property Rights 7.48 (13) 8.35 (1) 8.35 (2) 9.11 (6) 9.62 (1) 9.37 (2) 8.97 (8) 9.08 (5)<br />
Area 3. Sound Money 9.43 (4) 9.44 (8) 9.64 (9) 9.70 (9) 9.57 (14) 9.46 (28) 9.50 (24) 9.56 (21)<br />
Area 4. <strong>Freedom</strong> to Trade Internationally 8.59 (10) 8.63 (10) 8.62 (14) 9.34 (6) 9.57 (2) 8.69 (7) 8.69 (8) 8.44 (10)<br />
Area 5. Regulation 6.73 (19) 6.08 (37) 6.46 (32) 6.85 (26) 7.84 (7) 7.70 (16) 7.31 (28) 7.48 (26)<br />
Unadjusted<br />
Summary Rating (Rank) 7.29 (10) 7.34 (9) 7.56 (12) 7.95 (9) 8.21 (8) 7.73 (18) 7.40 (33) 7.40 (37)<br />
Rating (Data) Rating (Data) Rating (Data) Rating (Data) Rating (Data) Rating (Data) Rating (Data) Rating (Data)<br />
Area 1. Size of Government 4.34 4.28 4.94 4.78 4.46 4.40 3.45 3.36<br />
A. Government consumption 5.23 (22.22) 5.60 (20.96) 5.93 (19.85) 6.08 (19.34) 2.54 (31.37) 2.05 (33.02) 0.51 (38.25) 0.42 (38.56)<br />
B. Transfers and subsidies 2.13 (29.40) 1.53 (31.60) 2.32 (28.70) 2.04 (29.70) 2.79 (26.97) 4.55 (20.51) 3.27 (25.20) 3.02 (26.12)<br />
C. Government enterprises and investment 10.00 (14.80) 10.00 (14.70) 10.00 (12.70) 10.00 (13.80) 10.00 (13.80) 8.00 (17.37) 7.00 (20.29) 7.00 (20.73)<br />
D. Top marginal tax rate 0.00 0.00 1.50 1.00 2.50 3.00 3.00 3.00<br />
(i) Top marginal income tax rate 0.00 (72) 0.00 (72) 3.00 (60) 2.00 (60) 3.00 (52) 3.00 (52) 3.00 (52) 3.00 (52)<br />
(ii) Top marginal income and payroll tax rate 0.00 (63) 0.00 (63) 2.00 (54) 3.00 (52) 3.00 (52) 3.00 (52)<br />
Area 2. Legal System and Property Rights 7.48 8.35 8.35 9.11 9.62 8.36 8.00 8.10<br />
A. Judicial independence 9.37 9.52 9.05 8.71 8.91<br />
B. Impartial courts 8.73 9.52 8.90 7.16 7.32<br />
C. Protection of property rights 7.46 9.09 9.21 8.07 8.06<br />
D. Military interference in rule of law and politics 10.00 10.00 10.00 10.00 10.00<br />
E. Integrity of the legal system 10.00 10.00 10.00 10.00 10.00<br />
F. Legal enforcement of contracts 5.11 5.11 5.14<br />
G. Regulatory restrictions on sale of real property 7.90 7.86 7.86<br />
H. Reliability of police 7.99 8.31 7.08<br />
I. Business costs of crime 7.05 6.79 8.51<br />
Area 3. Sound Money 9.43 9.44 9.64 9.70 9.57 9.46 9.50 9.56<br />
A. Money growth 9.47 (2.64) 8.84 (5.79) 9.45 (2.74) 9.27 (3.65) 9.26 (3.70) 8.87 (5.64) 8.69 (6.57) 8.92 (5.40)<br />
B. Standard deviation of inflation 9.35 (1.63) 9.28 (1.79) 9.58 (1.04) 9.85 (0.37) 9.54 (1.15) 9.30 (1.75) 9.56 (1.09) 9.57 (1.08)<br />
C. Inflation: most recent year 8.90 (5.52) 9.65 (1.76) 9.54 (2.31) 9.67 (1.63) 9.50 (2.52) 9.66 (1.70) 9.76 (1.19) 9.75 (1.27)<br />
D. <strong>Freedom</strong> to own foreign currency bank accounts 10.00 10.00 10.00 10.00 10.00 10.00 10.00 10.00<br />
Area 4. <strong>Freedom</strong> to Trade Internationally 9.00 9.04 8.81 9.27 9.57 8.55 8.55 8.31<br />
A. Tariffs 8.99 9.12 8.44 8.66 9.18 8.39 8.22 8.34<br />
(i) Revenue from trade taxes (% of trade sector) 9.73 (0.40) 9.73 (0.40) 9.67 (0.50) 9.67 (0.50) 9.78 (0.33) 9.59 (0.62) 9.44 (0.84) 9.63 (0.55)<br />
(ii) Mean tariff rate 8.24 (8.80) 8.50 (7.50) 8.52 (7.40) 8.66 (6.70) 9.52 (2.40) 9.46 (2.70) 8.94 (5.30) 8.98 (5.10)<br />
(iii) Standard deviation of tariff rates 7.12 (7.20) 7.64 (5.90) 8.24 (4.40) 6.13 (9.67) 6.29 (9.28) 6.41 (8.98)<br />
B. Regulatory trade barriers 8.88 9.54 8.15 8.28 7.22<br />
(i) Non-tariff trade barriers 8.88 9.25 7.01 7.27 7.31<br />
(ii) Compliance cost of importing and exporting 9.83 9.29 9.29 7.13<br />
C. Black-market exchange rates 10.00 10.00 10.00 10.00 10.00 10.00 10.00 10.00<br />
D. Controls of the movement of capital and people 8.00 8.00 8.00 9.55 9.54 7.66 7.71 7.67<br />
(i) Foreign ownership/investment restrictions 9.10 9.85 7.95 7.38 7.26<br />
(ii) Capital controls 8.00 8.00 8.00 10.00 9.23 8.46 9.17 9.17<br />
(iii) <strong>Freedom</strong> of foreigners to visit 6.58 6.58 6.58<br />
Area 5. Regulation 6.21 5.60 6.05 6.91 7.84 7.89 7.49 7.67<br />
A. Credit market regulations 9.44 8.59 9.26 8.85 10.00 9.99 9.28 8.61<br />
(i) Ownership of banks 10.00 8.00 10.00 10.00 10.00 10.00 10.00 8.00<br />
(ii) Private sector credit 8.33 7.77 7.78 6.54 10.00 9.96 7.83 7.83<br />
(iii) Interest rate controls/negative real interest rates 10.00 10.00 10.00 10.00 10.00 10.00 10.00 10.00<br />
B. Labor market regulations 2.97 2.62 2.83 4.09 5.19 6.67 6.74 6.72<br />
(i) Hiring regulations and minimum wage 4.52 4.47 8.30 6.67 6.67<br />
(ii) Hiring and firing regulations 3.38 3.38 2.58 3.17 3.71 3.57<br />
(iii) Centralized collective bargaining 5.18 4.49 4.49 4.49 4.40 4.14 4.06 4.09<br />
(iv) Hours regulations 2.73 2.37 2.46 5.08 4.51 6.00 6.00 6.00<br />
(v) Mandated cost of worker dismissal 8.42 10.00 10.00<br />
(vi) Conscription 1.00 1.00 1.00 3.00 10.00 10.00 10.00 10.00<br />
C. Business regulations 7.79 8.32 7.02 6.45 7.68<br />
(i) Administrative requirements 7.73 3.64 3.55 4.15<br />
(ii) Bureaucracy costs 7.37 9.10 5.99 1.64 7.63<br />
(iii) Starting a business 7.53 7.58 9.40 9.51 9.52<br />
(iv) Extra payments/bribes/favoritism 8.46 8.88 8.91 8.55 8.34<br />
(v) Licensing restrictions 7.01 6.96 7.85<br />
(vi) Cost of tax compliance 7.20 8.50 8.58<br />
www.freetheworld.com • www.fraserinstitute.org • Fraser Institute ©2012
124 • <strong>Economic</strong> <strong>Freedom</strong> of the <strong>World</strong>: 2012 Annual Report<br />
New Zealand<br />
Fraser Institute ©2012 • www.fraserinstitute.org • www.freetheworld.com<br />
1980 1985 1990 1995 2000 2005 2009 2010<br />
Chain-Linked Rating (Rank) Rating (Rank) Rating (Rank) Rating (Rank) Rating (Rank) Rating (Rank) Rating (Rank) Rating (Rank)<br />
Summary Rating (Rank) 6.35 (21) 6.21 (26) 7.82 (7) 8.84 (3) 8.52 (5) 8.56 (3) 8.37 (3) 8.38 (3)<br />
Area 1. Size of Government 3.82 (85) 3.54 (94) 5.30 (66) 7.46 (18) 6.68 (47) 6.74 (58) 6.00 (73) 5.94 (77)<br />
Area 2. Legal System and Property Rights 8.04 (5) 7.88 (8) 8.35 (6) 9.17 (3) 9.10 (11) 9.04 (9) 8.99 (4) 9.03 (6)<br />
Area 3. Sound Money 6.31 (50) 6.17 (81) 8.64 (25) 9.75 (5) 9.54 (17) 9.65 (8) 9.70 (2) 9.73 (3)<br />
Area 4. <strong>Freedom</strong> to Trade Internationally 7.07 (20) 6.78 (24) 8.65 (12) 9.03 (14) 9.32 (8) 8.89 (5) 8.90 (3) 8.59 (7)<br />
Area 5. Regulation 6.49 (23) 6.68 (20) 8.18 (5) 8.78 (2) 7.94 (5) 8.55 (3) 8.32 (3) 8.65 (3)<br />
Unadjusted<br />
Summary Rating (Rank) 6.44 (20) 6.29 (27) 7.86 (9) 8.84 (3) 8.52 (5) 8.54 (3) 8.35 (3) 8.36 (3)<br />
Rating (Data) Rating (Data) Rating (Data) Rating (Data) Rating (Data) Rating (Data) Rating (Data) Rating (Data)<br />
Area 1. Size of Government 3.82 3.54 5.30 7.46 6.68 6.74 6.00 5.94<br />
A. Government consumption 5.12 (22.59) 5.63 (20.86) 5.54 (21.17) 6.21 (18.89) 4.84 (23.56) 4.87 (23.45) 4.17 (25.84) 4.00 (26.40)<br />
B. Transfers and subsidies 4.17 (21.90) 4.52 (20.60) 2.64 (27.50) 6.65 (12.80) 6.90 (11.87) 7.10 (11.16) 6.85 (12.06) 6.76 (12.40)<br />
C. Government enterprises and investment 4.00 (30.80) 4.00 (31.40) 6.00 (25.30) 10.00 (12.00) 10.00 (12.00) 10.00 (13.51) 8.00 (19.36) 8.00 (19.36)<br />
D. Top marginal tax rate 2.00 0.00 7.00 7.00 5.00 5.00 5.00 5.00<br />
(i) Top marginal income tax rate 2.00 (62) 0.00 (66) 7.00 (33) 7.00 (33) 5.00 (39) 5.00 (39) 5.00 (38) 5.00 (36)<br />
(ii) Top marginal income and payroll tax rate 7.00 (33) 7.00 (33) 5.00 (40) 5.00 (40) 5.00 (40) 5.00 (37)<br />
Area 2. Legal System and Property Rights 8.04 7.88 8.35 9.17 9.10 8.70 8.65 8.69<br />
A. Judicial independence 9.47 9.19 8.86 9.60 9.55<br />
B. Impartial courts 9.08 9.19 8.15 7.54 7.59<br />
C. Protection of property rights 7.29 7.15 8.66 7.88 8.07<br />
D. Military interference in rule of law and politics 10.00 10.00 10.00 10.00 10.00<br />
E. Integrity of the legal system 10.00 10.00 9.65 9.17 9.17<br />
F. Legal enforcement of contracts 7.50 7.48 7.48<br />
G. Regulatory restrictions on sale of real property 9.93 9.93 9.93<br />
H. Reliability of police 7.46 8.64 7.76<br />
I. Business costs of crime 8.08 7.65 8.67<br />
Area 3. Sound Money 6.31 6.17 8.64 9.75 9.54 9.65 9.70 9.73<br />
A. Money growth 9.11 (4.46) 8.84 (5.80) 7.25 (13.76) 9.58 (2.09) 9.19 (4.06) 9.73 (1.36) 9.76 (1.21) 9.79 (−1.03)<br />
B. Standard deviation of inflation 9.20 (2.00) 8.68 (3.29) 7.84 (5.39) 9.87 (0.33) 9.48 (1.29) 9.47 (1.33) 9.41 (1.48) 9.69 (0.78)<br />
C. Inflation: most recent year 6.93 (15.36) 7.16 (14.19) 9.46 (2.70) 9.55 (2.27) 9.48 (2.62) 9.39 (3.04) 9.62 (1.89) 9.42 (2.91)<br />
D. <strong>Freedom</strong> to own foreign currency bank accounts 0.00 0.00 10.00 10.00 10.00 10.00 10.00 10.00<br />
Area 4. <strong>Freedom</strong> to Trade Internationally 7.62 7.31 8.85 8.96 9.32 8.74 8.75 8.45<br />
A. Tariffs 7.87 7.73 6.56 7.74 9.01 8.88 9.09 9.09<br />
(i) Revenue from trade taxes (% of trade sector) 8.33 (2.50) 8.67 (2.00) 8.87 (1.70) 9.07 (1.40) 9.47 (0.79) 9.30 (1.04) 8.77 (1.85) 8.77 (1.85)<br />
(ii) Mean tariff rate 7.40 (13.00) 6.80 (16.00) 7.10 (14.50) 8.30 (8.50) 9.32 (3.40) 9.00 (5.00) 9.58 (2.10) 9.58 (2.10)<br />
(iii) Standard deviation of tariff rates 3.72 (15.70) 5.84 (10.40) 8.24 (4.40) 8.33 (4.17) 8.92 (2.69) 8.92 (2.69)<br />
B. Regulatory trade barriers 8.52 9.38 8.90 8.78 7.94<br />
(i) Non-tariff trade barriers 8.52 9.09 9.04 8.80 8.95<br />
(ii) Compliance cost of importing and exporting 9.67 8.76 8.76 6.94<br />
C. Black-market exchange rates 10.00 9.20 10.00 10.00 10.00 10.00 10.00 10.00<br />
D. Controls of the movement of capital and people 5.00 5.00 10.00 9.59 8.89 7.18 7.13 6.76<br />
(i) Foreign ownership/investment restrictions 9.18 9.32 7.84 7.87 7.36<br />
(ii) Capital controls 5.00 5.00 10.00 10.00 8.46 7.69 7.50 6.92<br />
(iii) <strong>Freedom</strong> of foreigners to visit 6.01 6.01 6.01<br />
Area 5. Regulation 6.38 6.57 8.18 8.86 7.94 8.86 8.63 8.98<br />
A. Credit market regulations 6.18 6.64 9.59 9.86 9.83 10.00 10.00 10.00<br />
(i) Ownership of banks 5.00 5.00 10.00 10.00 10.00 10.00 10.00 10.00<br />
(ii) Private sector credit 7.54 6.91 8.77 9.58 9.49 10.00 10.00 10.00<br />
(iii) Interest rate controls/negative real interest rates 6.00 8.00 10.00 10.00 10.00 10.00 10.00 10.00<br />
B. Labor market regulations 6.58 6.50 6.78 7.46 5.92 8.51 8.51 8.51<br />
(i) Hiring regulations and minimum wage 6.52 3.62 8.90 8.90 8.90<br />
(ii) Hiring and firing regulations 7.62 7.62 3.07 4.46 4.59 4.54<br />
(iii) Centralized collective bargaining 5.18 5.18 5.18 7.93 8.05 7.68 7.58 7.61<br />
(iv) Hours regulations 4.57 4.31 4.31 5.25 4.84 10.00 10.00 10.00<br />
(v) Mandated cost of worker dismissal 10.00 10.00 10.00<br />
(vi) Conscription 10.00 10.00 10.00 10.00 10.00 10.00 10.00 10.00<br />
C. Business regulations 9.25 8.09 8.08 7.37 8.42<br />
(i) Administrative requirements 7.47 4.13 4.75 5.01<br />
(ii) Bureaucracy costs 9.35 7.80 6.13 2.31 8.37<br />
(iii) Starting a business 8.47 7.85 9.61 9.96 9.96<br />
(iv) Extra payments/bribes/favoritism 9.94 9.23 9.60 9.58 9.27<br />
(v) Licensing restrictions 9.81 9.80 9.81<br />
(vi) Cost of tax compliance 9.22 7.85 8.07
Country Data Tables • 125<br />
Nicaragua 1980 1985 1990 1995 2000 2005 2009 2010<br />
Chain-Linked Rating (Rank) Rating (Rank) Rating (Rank) Rating (Rank) Rating (Rank) Rating (Rank) Rating (Rank) Rating (Rank)<br />
Summary Rating (Rank) 3.69 (93) 1.78 (109) 2.75 (113) 5.47 (83) 6.69 (60) 6.86 (67) 6.76 (68) 6.88 (66)<br />
Area 1. Size of Government 4.08 (78) 2.73 (103) 3.32 (104) 6.63 (38) 6.81 (42) 7.87 (23) 7.62 (21) 8.45 (8)<br />
Area 2. Legal System and Property Rights 2.22 (83) 2.23 (102) 3.43 (84) 3.97 (104) 4.06 (100) 3.95 (101) 3.97 (103) 4.07 (101)<br />
Area 3. Sound Money 0.00 (107) 0.00 (111) 0.00 (118) 5.20 (87) 8.66 (45) 8.85 (47) 8.71 (54) 8.29 (71)<br />
Area 4. <strong>Freedom</strong> to Trade Internationally 0.63 (88) 0.76 (93) 4.25 (69) 6.14 (74) 7.64 (50) 6.82 (73) 6.94 (71) 6.89 (72)<br />
Area 5. Regulation 3.06 (99) 2.35 (113) 5.29 (83) 6.28 (61) 6.85 (56) 6.61 (74) 6.75 (71)<br />
Unadjusted<br />
Summary Rating (Rank) 3.52 (98) 2.00 (110) 2.92 (111) 5.79 (73) 6.69 (58) 7.19 (54) 7.11 (59) 7.24 (52)<br />
Rating (Data) Rating (Data) Rating (Data) Rating (Data) Rating (Data) Rating (Data) Rating (Data) Rating (Data)<br />
Area 1. Size of Government 5.03 3.36 3.43 6.63 6.81 7.87 7.62 8.45<br />
A. Government consumption 6.09 (19.29) 0.00 (42.59) 0.00 (42.57) 8.03 (12.71) 6.72 (17.14) 8.47 (11.19) 8.65 (10.60) 8.97 (9.50)<br />
B. Transfers and subsidies 9.02 (4.10) 8.45 (6.20) 8.28 (6.80) 8.50 (6.00) 8.53 (5.88) 10.00 (0.40) 9.82 (1.17) 9.84 (1.08)<br />
C. Government enterprises and investment 0.00 (71.90) 0.00 (62.18) 2.00 (45.30) 4.00 (38.30) 6.00 (25.50) 7.00 (24.30) 6.00 (25.97) 7.00 (23.69)<br />
D. Top marginal tax rate 5.00 5.00 6.00 6.00 6.00 6.00 8.00<br />
(i) Top marginal income tax rate 5.00 (50) 5.00 (50) 8.00 (30) 8.00 (30) 8.00 (30) 8.00 (30) 8.00 (30)<br />
(ii) Top marginal income and payroll tax rate 4.00 (41) 4.00 (44) 4.00 (44) 4.00 (45) 8.00 (30)<br />
Area 2. Legal System and Property Rights 2.58 2.59 3.99 4.47 4.07 4.29 4.42 4.53<br />
A. Judicial independence 0.81 1.81 1.34<br />
B. Impartial courts 4.28 4.16 1.91 2.42 2.29<br />
C. Protection of property rights 2.08 4.06 3.47 3.69<br />
D. Military interference in rule of law and politics 5.45 3.33 3.89 5.00 5.00<br />
E. Integrity of the legal system 4.11 6.67 6.67 6.67 5.83<br />
F. Legal enforcement of contracts 4.77 4.77 5.75<br />
G. Regulatory restrictions on sale of real property 6.51 6.37 7.73<br />
H. Reliability of police 5.45 4.24 5.04<br />
I. Business costs of crime 4.60 5.03 4.13<br />
Area 3. Sound Money 5.78 0.00 0.00 5.20 8.66 8.85 8.71 8.29<br />
A. Money growth 5.91 (20.47) 0.00 (62.40) 0.00 (1589.23) 7.76 (11.22) 7.58 (12.11) 8.34 (8.30) 7.09 (14.55) 6.55 (17.27)<br />
B. Standard deviation of inflation 4.56 (13.61) 0.00 (60.08) 0.00 (4792.48) 0.00 (1852.08) 9.26 (1.85) 8.96 (2.59) 8.47 (3.82) 7.70 (5.74)<br />
C. Inflation: most recent year 2.68 (36.62) 0.00 (168.07) 0.00 (5012.69) 8.04 (9.79) 7.81 (10.94) 8.08 (9.60) 9.26 (3.69) 8.91 (5.45)<br />
D. <strong>Freedom</strong> to own foreign currency bank accounts 10.00 0.00 0.00 5.00 10.00 10.00 10.00 10.00<br />
Area 4. <strong>Freedom</strong> to Trade Internationally 0.70 0.84 4.70 7.09 7.64 7.64 7.78 7.72<br />
A. Tariffs 2.10 2.53 6.09 7.88 8.77 8.31 8.38 8.41<br />
(i) Revenue from trade taxes (% of trade sector) 4.20 (8.70) 5.07 (7.40) 7.13 (4.30) 6.07 (5.90) 8.84 (1.74) 9.16 (1.26) 9.28 (1.08) 9.29 (1.06)<br />
(ii) Mean tariff rate 0.00 (54.00) 0.00 (54.00) 5.04 (24.80) 7.86 (10.70) 9.36 (3.20) 8.64 (6.80) 8.88 (5.60) 8.88 (5.60)<br />
(iii) Standard deviation of tariff rates 9.72 (25.70) 8.12 (4.70) 7.13 (7.17) 6.98 (7.56) 7.07 (7.34)<br />
B. Regulatory trade barriers 3.78 4.24 5.65 5.50<br />
(i) Non-tariff trade barriers 3.78 3.70 4.95 4.94<br />
(ii) Compliance cost of importing and exporting 4.77 6.36 6.06<br />
C. Black-market exchange rates 0.00 0.00 8.00 8.40 10.00 10.00 10.00 10.00<br />
D. Controls of the movement of capital and people 0.00 0.00 0.00 5.00 7.99 8.02 7.08 6.98<br />
(i) Foreign ownership/investment restrictions 8.30 6.37 5.85 5.57<br />
(ii) Capital controls 0.00 0.00 0.00 5.00 7.69 7.69 5.38 5.38<br />
(iii) <strong>Freedom</strong> of foreigners to visit 10.00 10.00 10.00<br />
Area 5. Regulation 3.21 2.47 5.56 6.28 7.30 7.04 7.19<br />
A. Credit market regulations 0.00 2.20 0.00 4.21 7.30 9.26 8.58 9.42<br />
(i) Ownership of banks 10.00 10.00 10.00<br />
(ii) Private sector credit 4.40 0.00 2.42 5.60 8.77 7.75 9.25<br />
(iii) Interest rate controls/negative real interest rates 0.00 0.00 0.00 6.00 9.00 9.00 8.00 9.00<br />
B. Labor market regulations 6.60 7.17 6.77 6.73<br />
(i) Hiring regulations and minimum wage 3.63 7.80 6.67 6.67<br />
(ii) Hiring and firing regulations 6.12 5.70 5.40 5.39<br />
(iii) Centralized collective bargaining 6.65 7.58 6.55 6.34<br />
(iv) Hours regulations 4.00 4.00 4.00<br />
(v) Mandated cost of worker dismissal 7.96 7.99 7.99<br />
(vi) Conscription 5.00 0.00 0.00 10.00 10.00 10.00 10.00 10.00<br />
C. Business regulations 4.94 5.46 5.77 5.43<br />
(i) Administrative requirements 6.03 3.24 3.94 3.74<br />
(ii) Bureaucracy costs 5.18 4.62 6.01 3.62<br />
(iii) Starting a business 4.10 7.37 7.51 7.62<br />
(iv) Extra payments/bribes/favoritism 4.45 4.80 3.68 3.34<br />
(v) Licensing restrictions 5.44 5.96 6.59<br />
(vi) Cost of tax compliance 7.31 7.51 7.68<br />
www.freetheworld.com • www.fraserinstitute.org • Fraser Institute ©2012
126 • <strong>Economic</strong> <strong>Freedom</strong> of the <strong>World</strong>: 2012 Annual Report<br />
Niger<br />
Fraser Institute ©2012 • www.fraserinstitute.org • www.freetheworld.com<br />
1980 1985 1990 1995 2000 2005 2009 2010<br />
Chain-Linked Rating (Rank) Rating (Rank) Rating (Rank) Rating (Rank) Rating (Rank) Rating (Rank) Rating (Rank) Rating (Rank)<br />
Summary Rating (Rank) 4.63 (69) 5.07 (61) 5.16 (71) 4.33 (112) 5.44 (104) 5.62 (109) 5.67 (112) 5.90 (106)<br />
Area 1. Size of Government 4.10 (77) 4.28 (77) 3.81 (97) 3.81 (106) 3.96 (110) 6.02 (85) 5.49 (88) 5.56 (87)<br />
Area 2. Legal System and Property Rights 4.67 (48) 4.78 (60) 5.30 (54) 2.61 (115) 4.50 (91) 4.31 (92) 4.45 (91) 4.14 (98)<br />
Area 3. Sound Money 4.90 (93) 6.53 (62) 7.08 (41) 5.71 (79) 8.25 (52) 6.47 (104) 6.50 (109) 6.65 (103)<br />
Area 4. <strong>Freedom</strong> to Trade Internationally 5.87 (90) 5.75 (95) 6.11 (90) 7.79 (34)<br />
Area 5. Regulation 4.76 (75) 4.79 (88) 4.83 (97) 4.61 (113) 5.55 (106) 6.02 (101) 5.97 (101)<br />
Unadjusted<br />
Summary Rating (Rank) 4.95 (61) 4.85 (73) 5.04 (73) 4.31 (112) 5.41 (105) 5.39 (131) 5.56 (128) 5.78 (128)<br />
Rating (Data) Rating (Data) Rating (Data) Rating (Data) Rating (Data) Rating (Data) Rating (Data) Rating (Data)<br />
Area 1. Size of Government 5.88 4.28 3.81 3.81 3.96 7.35 6.69 6.79<br />
A. Government consumption 8.19 (12.15) 8.56 (10.90) 7.63 (14.06) 7.62 (14.10) 7.91 (13.10) 8.04 (12.65) 6.24 (18.77) 6.52 (17.83)<br />
B. Transfers and subsidies 9.46 (2.50) 10.00 (0.38) 9.84 (1.09) 9.84 (1.09)<br />
C. Government enterprises and investment 0.00 (79.90) 0.00 (79.90) 0.00 (64.80) 0.00 (74.30) 0.00 (58.50) 4.00 (33.80) 4.00 (33.80) 4.00 (33.80)<br />
D. Top marginal tax rate<br />
(i) Top marginal income tax rate<br />
(ii) Top marginal income and payroll tax rate<br />
Area 2. Legal System and Property Rights<br />
A. Judicial independence<br />
4.67 4.78 5.30 3.02 4.38 4.11 4.24 3.95<br />
B. Impartial courts<br />
C. Protection of property rights<br />
3.54 3.49 4.10 4.40 4.60<br />
D. Military interference in rule of law and politics 4.28 6.67 5.00 5.00 3.33<br />
E. Integrity of the legal system 0.00 3.33 3.33 3.33 3.33<br />
F. Legal enforcement of contracts 2.74 2.74 2.74<br />
G. Regulatory restrictions on sale of real property<br />
H. Reliability of police<br />
I. Business costs of crime<br />
5.36 5.72 5.72<br />
Area 3. Sound Money 4.90 6.53 7.08 5.71 8.25 6.47 6.50 6.65<br />
A. Money growth 5.92 (20.42) 9.92 (0.40) 9.78 (−1.10) 9.28 (3.62) 9.04 (−4.78) 8.98 (−5.11) 8.15 (9.26) 7.82 (10.88)<br />
B. Standard deviation of inflation 7.86 (5.35) 7.36 (6.60) 8.86 (2.85) 4.64 (13.40) 9.54 (1.14) 8.46 (3.85) 8.73 (3.19) 8.93 (2.68)<br />
C. Inflation: most recent year 5.84 (20.82) 8.82 (−5.90) 9.68 (−1.60) 8.92 (5.38) 9.42 (2.90) 8.44 (7.80) 9.14 (4.31) 9.84 (0.80)<br />
D. <strong>Freedom</strong> to own foreign currency bank accounts 0.00 0.00 0.00 0.00 5.00 0.00 0.00 0.00<br />
Area 4. <strong>Freedom</strong> to Trade Internationally 4.67 4.49 4.22 4.20 5.87 4.10 4.37 5.56<br />
A. Tariffs 4.40 3.67 3.47 2.80 7.60 5.19 6.24 6.24<br />
(i) Revenue from trade taxes (% of trade sector) 4.40 (8.40) 3.67 (9.50) 3.47 (9.80) 2.80 (10.80) 0.86 (13.71) 3.82 (9.27) 3.82 (9.27)<br />
(ii) Mean tariff rate 7.60 (12.00) 7.46 (12.70) 7.62 (11.90) 7.62 (11.90)<br />
(iii) Standard deviation of tariff rates 7.26 (6.84) 7.29 (6.78) 7.29 (6.78)<br />
B. Regulatory trade barriers<br />
(i) Non-tariff trade barriers<br />
1.22 1.22 6.00<br />
(ii) Compliance cost of importing and exporting 1.22 1.22 6.00<br />
C. Black-market exchange rates 9.60 9.80 9.20 9.80 10.00 10.00 10.00 10.00<br />
D. Controls of the movement of capital and people<br />
(i) Foreign ownership/investment restrictions<br />
0.00 0.00 0.00 0.00 0.00 0.00 0.00 0.00<br />
(ii) Capital controls 0.00 0.00 0.00 0.00 0.00 0.00 0.00 0.00<br />
(iii) <strong>Freedom</strong> of foreigners to visit 0.00 0.00 0.00<br />
Area 5. Regulation 4.64 4.19 4.79 4.83 4.61 4.94 6.00 5.96<br />
A. Credit market regulations 4.30 5.12 6.13 6.24 5.67 7.70 9.55 9.62<br />
(i) Ownership of banks 2.00 2.00 2.00 5.00 5.00 10.00 10.00 10.00<br />
(ii) Private sector credit 8.91 8.24 8.38 7.73 8.01 9.09 9.09 9.24<br />
(iii) Interest rate controls/negative real interest rates 2.00 8.00 6.00 4.00 4.00<br />
B. Labor market regulations 3.14 3.30 3.30<br />
(i) Hiring regulations and minimum wage<br />
(ii) Hiring and firing regulations<br />
(iii) Centralized collective bargaining<br />
1.10 0.00 0.00<br />
(iv) Hours regulations 4.70 6.00 6.00<br />
(v) Mandated cost of worker dismissal 6.76 7.19 7.19<br />
(vi) Conscription 0.00 0.00 0.00 0.00 0.00 0.00 0.00<br />
C. Business regulations<br />
(i) Administrative requirements<br />
(ii) Bureaucracy costs<br />
3.97 5.17 4.97<br />
(iii) Starting a business<br />
(iv) Extra payments/bribes/favoritism<br />
3.35 6.20 6.34<br />
(v) Licensing restrictions 1.60 2.34 1.59<br />
(vi) Cost of tax compliance 6.97 6.97 6.97
Nigeria<br />
Country Data Tables • 127<br />
1980 1985 1990 1995 2000 2005 2009 2010<br />
Chain-Linked Rating (Rank) Rating (Rank) Rating (Rank) Rating (Rank) Rating (Rank) Rating (Rank) Rating (Rank) Rating (Rank)<br />
Summary Rating (Rank) 3.25 (99) 3.68 (95) 3.31 (107) 3.76 (120) 5.30 (109) 6.03 (97) 5.84 (104) 6.01 (102)<br />
Area 1. Size of Government 2.19 (103) 4.07 (81) 2.49 (111) 6.26 (54) 6.19 (58) 6.72 (61) 5.80 (78) 5.47 (91)<br />
Area 2. Legal System and Property Rights 2.78 (69) 2.24 (100) 2.66 (98) 4.27 (102) 3.60 (107) 4.40 (89) 4.68 (85) 4.79 (81)<br />
Area 3. Sound Money 5.91 (70) 6.32 (72) 4.14 (100) 1.27 (116) 5.37 (112) 6.41 (105) 6.16 (114) 6.59 (105)<br />
Area 4. <strong>Freedom</strong> to Trade Internationally 0.68 (87) 0.80 (92) 1.84 (98) 1.23 (111) 4.92 (114) 5.63 (99) 5.39 (107) 6.20 (93)<br />
Area 5. Regulation 5.65 (46) 6.04 (38) 5.26 (73) 5.65 (70) 6.42 (55) 7.23 (36) 7.54 (18) 7.38 (31)<br />
Unadjusted<br />
Summary Rating (Rank) 3.46 (100) 4.19 (91) 3.52 (105) 3.81 (118) 5.33 (109) 5.93 (118) 5.90 (122) 6.07 (120)<br />
Rating (Data) Rating (Data) Rating (Data) Rating (Data) Rating (Data) Rating (Data) Rating (Data) Rating (Data)<br />
Area 1. Size of Government 2.19 5.50 2.49 6.26 6.19 6.72 6.53 6.16<br />
A. Government consumption 6.58 (17.64) 7.21 (15.49) 5.48 (21.37) 7.78 (13.56) 7.56 (14.28) 9.15 (8.91) 7.49 (14.55) 6.01 (19.56)<br />
B. Transfers and subsidies 9.78 (1.30) 9.62 (1.91) 9.62 (1.91)<br />
C. Government enterprises and investment 0.00 (50.90) 2.00 (49.80) 0.00 (88.10) 4.00 (32.14) 2.00 (47.28) 2.00 (45.28) 2.00 (46.82) 2.00 (46.82)<br />
D. Top marginal tax rate 0.00 3.00 2.00 7.00 9.00 9.00 7.00 7.00<br />
(i) Top marginal income tax rate 0.00 (70) 3.00 (55) 2.00 (55) 7.00 (35) 9.00 (25) 9.00 (25) 9.00 (25) 9.00 (25)<br />
(ii) Top marginal income and payroll tax rate 9.00 (25) 9.00 (25) 5.00 (37) 5.00 (37)<br />
Area 2. Legal System and Property Rights 3.06 2.46 2.93 4.53 3.74 3.63 3.86 3.95<br />
A. Judicial independence 3.59 4.14 4.52<br />
B. Impartial courts 3.62 3.56 3.74 4.20 4.78<br />
C. Protection of property rights 2.52 4.66 3.88 3.69<br />
D. Military interference in rule of law and politics 3.51 3.33 3.33 3.33 3.33<br />
E. Integrity of the legal system 6.96 5.00 2.78 3.33 3.33<br />
F. Legal enforcement of contracts 5.08 5.08 5.08<br />
G. Regulatory restrictions on sale of real property 3.45 3.45 3.45<br />
H. Reliability of police 2.91 3.07 4.04<br />
I. Business costs of crime 3.14 4.23 3.33<br />
Area 3. Sound Money 5.91 6.32 4.14 1.27 5.37 6.41 6.16 6.59<br />
A. Money growth 6.70 (16.51) 8.64 (6.79) 6.06 (19.72) 4.00 (29.98) 5.93 (20.35) 7.74 (11.30) 5.96 (20.19) 6.11 (19.46)<br />
B. Standard deviation of inflation 9.44 (1.39) 7.39 (6.52) 1.93 (20.18) 1.06 (22.35) 1.95 (20.12) 6.46 (8.86) 6.00 (10.01) 8.00 (4.99)<br />
C. Inflation: most recent year 7.52 (12.42) 9.26 (3.69) 8.57 (7.16) 0.00 (55.83) 8.61 (6.93) 6.43 (17.86) 7.69 (11.54) 7.26 (13.72)<br />
D. <strong>Freedom</strong> to own foreign currency bank accounts 0.00 0.00 0.00 0.00 5.00 5.00 5.00 5.00<br />
Area 4. <strong>Freedom</strong> to Trade Internationally 1.30 1.53 2.96 1.56 4.92 5.95 5.70 6.55<br />
A. Tariffs 3.91 4.60 3.49 4.68 3.76 7.04 7.22 7.26<br />
(i) Revenue from trade taxes (% of trade sector) 4.33 (8.50) 6.60 (5.10) 7.33 (4.00)<br />
(ii) Mean tariff rate 3.48 (32.60) 2.60 (37.00) 3.14 (34.30) 5.64 (21.80) 7.68 (11.60) 7.76 (11.20) 7.66 (11.70)<br />
(iii) Standard deviation of tariff rates 0.00 (30.80) 3.72 (15.70) 3.76 (15.60) 6.40 (9.00) 6.68 (8.29) 6.86 (7.84)<br />
B. Regulatory trade barriers 3.20 4.80 5.04 5.86<br />
(i) Non-tariff trade barriers 3.20 4.48 4.36 4.65<br />
(ii) Compliance cost of importing and exporting 5.11 5.72 7.06<br />
C. Black-market exchange rates 0.00 0.00 5.40 0.00 5.68 7.86 7.06 9.42<br />
D. Controls of the movement of capital and people 0.00 0.00 0.00 0.00 7.04 4.11 3.49 3.68<br />
(i) Foreign ownership/investment restrictions 8.69 6.93 5.48 6.05<br />
(ii) Capital controls 0.00 0.00 0.00 0.00 5.38 5.38 5.00 5.00<br />
(iii) <strong>Freedom</strong> of foreigners to visit 0.00 0.00 0.00<br />
Area 5. Regulation 4.82 5.16 5.08 5.46 6.42 6.97 7.27 7.11<br />
A. Credit market regulations 2.00 3.00 3.56 4.57 6.53 9.13 9.41 8.68<br />
(i) Ownership of banks 2.00 2.00 2.00 5.00 5.00 10.00 10.00 10.00<br />
(ii) Private sector credit 8.69 8.71 6.60 7.39 8.23 7.05<br />
(iii) Interest rate controls/negative real interest rates 2.00 4.00 0.00 0.00 8.00 10.00 10.00 9.00<br />
B. Labor market regulations 7.22 8.11 8.35 7.97<br />
(i) Hiring regulations and minimum wage 4.79 10.00 10.00 7.77<br />
(ii) Hiring and firing regulations 7.15 6.62 6.95 6.93<br />
(iii) Centralized collective bargaining 6.93 6.69 7.40 7.36<br />
(iv) Hours regulations 10.00 10.00 10.00<br />
(v) Mandated cost of worker dismissal 5.36 5.76 5.76<br />
(vi) Conscription 10.00 10.00 10.00 10.00 10.00 10.00 10.00 10.00<br />
C. Business regulations 5.50 3.66 4.05 4.67<br />
(i) Administrative requirements 7.83 3.72 3.44 4.38<br />
(ii) Bureaucracy costs 6.03 3.16 5.32 3.67<br />
(iii) Starting a business 5.12 8.05 8.18 8.17<br />
(iv) Extra payments/bribes/favoritism 3.03 3.89 3.24 3.20<br />
(v) Licensing restrictions 3.16 4.13 8.62<br />
(vi) Cost of tax compliance 0.00 0.00 0.00<br />
www.freetheworld.com • www.fraserinstitute.org • Fraser Institute ©2012
128 • <strong>Economic</strong> <strong>Freedom</strong> of the <strong>World</strong>: 2012 Annual Report<br />
Norway<br />
Fraser Institute ©2012 • www.fraserinstitute.org • www.freetheworld.com<br />
1980 1985 1990 1995 2000 2005 2009 2010<br />
Chain-Linked Rating (Rank) Rating (Rank) Rating (Rank) Rating (Rank) Rating (Rank) Rating (Rank) Rating (Rank) Rating (Rank)<br />
Summary Rating (Rank) 5.79 (32) 6.46 (23) 7.13 (19) 7.56 (16) 7.27 (40) 7.69 (21) 7.56 (26) 7.53 (30)<br />
Area 1. Size of Government 2.64 (98) 2.99 (100) 2.94 (108) 3.17 (112) 3.25 (116) 5.69 (93) 5.24 (96) 5.55 (88)<br />
Area 2. Legal System and Property Rights 7.05 (18) 8.11 (5) 8.35 (9) 9.19 (2) 8.85 (15) 9.14 (6) 8.92 (9) 8.81 (9)<br />
Area 3. Sound Money 6.43 (43) 6.45 (67) 8.73 (24) 9.47 (23) 9.03 (39) 9.20 (38) 9.24 (39) 9.32 (36)<br />
Area 4. <strong>Freedom</strong> to Trade Internationally 7.04 (21) 8.28 (11) 9.30 (5) 9.11 (11) 8.43 (32) 7.37 (50) 7.45 (49) 6.96 (69)<br />
Area 5. Regulation 5.86 (39) 6.58 (23) 6.43 (33) 6.88 (25) 6.79 (46) 7.12 (43) 6.97 (51) 7.02 (49)<br />
Unadjusted<br />
Summary Rating (Rank) 5.72 (36) 6.39 (23) 6.99 (21) 7.57 (17) 7.27 (38) 7.73 (18) 7.60 (20) 7.57 (25)<br />
Rating (Data) Rating (Data) Rating (Data) Rating (Data) Rating (Data) Rating (Data) Rating (Data) Rating (Data)<br />
Area 1. Size of Government 2.87 3.25 2.94 3.17 3.25 5.69 5.24 5.55<br />
A. Government consumption 3.36 (28.57) 3.69 (27.46) 3.06 (29.59) 3.00 (29.79) 2.76 (30.62) 2.13 (32.75) 1.64 (34.43) 1.81 (33.83)<br />
B. Transfers and subsidies 4.11 (22.10) 4.31 (21.40) 2.70 (27.30) 4.20 (21.80) 4.76 (19.72) 5.11 (18.44) 4.81 (19.54) 4.88 (19.30)<br />
C. Government enterprises and investment 4.00 (35.90) 4.00 (34.20) 4.00 (37.40) 2.00 (43.10) 2.00 (43.10) 10.00 (14.50) 10.00 (8.39) 10.00 (9.51)<br />
D. Top marginal tax rate 0.00 1.00 2.00 3.50 3.50 5.50 4.50 5.50<br />
(i) Top marginal income tax rate 0.00 (75) 1.00 (64) 3.00 (51) 5.00 (42) 5.00 (48) 7.00 (40) 6.00 (40) 7.00 (40)<br />
(ii) Top marginal income and payroll tax rate 1.00 (64) 2.00 (56) 2.00 (64) 4.00 (54) 3.00 (54) 4.00 (54)<br />
Area 2. Legal System and Property Rights 7.05 8.11 8.35 9.19 8.85 8.97 8.76 8.65<br />
A. Judicial independence 9.45 8.35 8.86 8.71 8.80<br />
B. Impartial courts 8.88 8.68 8.81 7.51 7.33<br />
C. Protection of property rights 7.61 7.20 8.83 8.44 8.22<br />
D. Military interference in rule of law and politics 10.00 10.00 10.00 10.00 10.00<br />
E. Integrity of the legal system 10.00 10.00 10.00 10.00 10.00<br />
F. Legal enforcement of contracts 7.53 7.75 7.75<br />
G. Regulatory restrictions on sale of real property 9.16 9.12 9.12<br />
H. Reliability of police 8.63 8.70 8.32<br />
I. Business costs of crime 8.93 8.62 8.34<br />
Area 3. Sound Money 6.43 6.45 8.73 9.47 9.03 9.20 9.24 9.32<br />
A. Money growth 9.41 (2.93) 7.97 (10.15) 6.77 (16.13) 9.06 (4.69) 9.17 (4.17) 8.64 (6.80) 9.67 (1.64) 9.93 (−0.33)<br />
B. Standard deviation of inflation 8.95 (2.63) 8.86 (2.84) 8.91 (2.72) 9.43 (1.43) 7.55 (6.11) 8.45 (3.87) 7.70 (5.74) 7.82 (5.44)<br />
C. Inflation: most recent year 7.38 (13.12) 8.96 (5.21) 9.23 (3.87) 9.38 (3.09) 9.38 (3.09) 9.70 (1.52) 9.57 (2.17) 9.52 (2.40)<br />
D. <strong>Freedom</strong> to own foreign currency bank accounts 0.00 0.00 10.00 10.00 10.00 10.00 10.00 10.00<br />
Area 4. <strong>Freedom</strong> to Trade Internationally 6.89 8.11 8.88 8.97 8.43 7.40 7.48 6.98<br />
A. Tariffs 9.28 9.33 8.63 8.09 7.55 6.07 6.23 6.16<br />
(i) Revenue from trade taxes (% of trade sector) 9.80 (0.30) 9.80 (0.30) 9.80 (0.30) 9.73 (0.40) 9.88 (0.17) 9.92 (0.12) 9.90 (0.15) 9.89 (0.16)<br />
(ii) Mean tariff rate 8.76 (6.20) 8.86 (5.70) 8.86 (5.70) 8.82 (5.90) 9.42 (2.90) 8.28 (8.60) 8.78 (6.10) 8.60 (7.00)<br />
(iii) Standard deviation of tariff rates 7.24 (6.90) 5.72 (10.70) 3.36 (16.60) 0.00 (37.41) 0.00 (27.51) 0.00 (29.75)<br />
B. Regulatory trade barriers 9.17 8.32 7.02 7.23 5.78<br />
(i) Non-tariff trade barriers 9.17 7.80 4.90 5.33 4.99<br />
(ii) Compliance cost of importing and exporting 8.83 9.14 9.14 6.56<br />
C. Black-market exchange rates 9.40 10.00 10.00 10.00 10.00 10.00 10.00 10.00<br />
D. Controls of the movement of capital and people 2.00 5.00 8.00 8.64 7.84 6.50 6.45 5.98<br />
(i) Foreign ownership/investment restrictions 9.28 8.76 7.42 7.28 6.64<br />
(ii) Capital controls 2.00 5.00 8.00 8.00 6.92 5.38 5.38 4.62<br />
(iii) <strong>Freedom</strong> of foreigners to visit 6.69 6.69 6.69<br />
Area 5. Regulation 5.35 6.01 6.08 7.05 6.79 7.42 7.26 7.32<br />
A. Credit market regulations 7.19 8.80 8.51 8.71 9.00 9.67 10.00 10.00<br />
(i) Ownership of banks 10.00 10.00 8.00 8.00 10.00 10.00 10.00 10.00<br />
(ii) Private sector credit 5.56 6.39 7.53 8.12 10.00 10.00 10.00 10.00<br />
(iii) Interest rate controls/negative real interest rates 6.00 10.00 10.00 10.00 7.00 9.00 10.00 10.00<br />
B. Labor market regulations 3.52 3.23 3.64 4.33 3.79 4.86 5.07 4.34<br />
(i) Hiring regulations and minimum wage 4.45 5.00 3.90 3.90 3.90<br />
(ii) Hiring and firing regulations 4.88 4.88 2.05 2.83 3.21 2.94<br />
(iii) Centralized collective bargaining 5.18 5.18 5.18 5.18 4.03 4.63 4.29 4.17<br />
(iv) Hours regulations 4.40 3.52 3.52 4.17 4.84 6.00 6.00 4.00<br />
(v) Mandated cost of worker dismissal 8.79 10.00 10.00<br />
(vi) Conscription 1.00 1.00 1.00 3.00 3.00 3.00 3.00 1.00<br />
C. Business regulations 8.11 7.59 7.74 6.72 7.63<br />
(i) Administrative requirements 6.08 4.70 4.01 3.78<br />
(ii) Bureaucracy costs 8.11 8.70 7.09 1.80 7.83<br />
(iii) Starting a business 7.22 6.83 9.67 9.69 9.69<br />
(iv) Extra payments/bribes/favoritism 9.01 8.73 9.26 9.06 8.67<br />
(v) Licensing restrictions 6.72 6.73 6.78<br />
(vi) Cost of tax compliance 9.02 9.02 9.02
Oman<br />
Country Data Tables • 129<br />
1980 1985 1990 1995 2000 2005 2009 2010<br />
Chain-Linked Rating (Rank) Rating (Rank) Rating (Rank) Rating (Rank) Rating (Rank) Rating (Rank) Rating (Rank) Rating (Rank)<br />
Summary Rating (Rank) 6.78 (19) 6.34 (35) 6.99 (35) 7.53 (29) 7.39 (37) 7.71 (17) 8.00 (7)<br />
Area 1. Size of Government 4.90 (58) 4.82 (59) 4.84 (78) 5.24 (85) 5.31 (84) 4.94 (102) 5.58 (85) 5.35 (95)<br />
Area 2. Legal System and Property Rights 5.85 (34) 5.21 (56) 7.72 (25) 8.03 (24) 7.89 (22) 9.19 (2) 9.12 (2)<br />
Area 3. Sound Money 5.40 (83) 9.45 (7) 7.67 (36) 9.15 (30) 8.31 (50) 8.68 (56) 7.34 (85) 8.86 (56)<br />
Area 4. <strong>Freedom</strong> to Trade Internationally 6.65 (28) 6.74 (35) 6.72 (60) 8.68 (25) 8.22 (19) 8.66 (9) 8.67 (4)<br />
Area 5. Regulation 7.26 (6) 7.14 (12) 7.24 (13) 6.13 (49) 7.31 (24) 7.23 (35) 7.90 (10) 8.06 (11)<br />
Unadjusted<br />
Summary Rating (Rank) 6.87 (14) 6.41 (34) 6.79 (40) 7.31 (35) 7.42 (37) 7.36 (38) 7.64 (20)<br />
Rating (Data) Rating (Data) Rating (Data) Rating (Data) Rating (Data) Rating (Data) Rating (Data) Rating (Data)<br />
Area 1. Size of Government 4.90 4.82 4.84 5.24 5.31 4.94 5.58 5.35<br />
A. Government consumption 0.00 (47.45) 0.00 (45.46) 0.00 (58.84) 1.18 (36.00) 1.65 (34.40) 0.34 (38.84) 2.91 (30.10) 1.98 (33.26)<br />
B. Transfers and subsidies 9.59 (2.00) 9.29 (3.10) 9.35 (2.90) 9.78 (1.30) 9.61 (1.92) 9.40 (2.69) 9.40 (2.69) 9.40 (2.69)<br />
C. Government enterprises and investment 0.00 (58.80) 0.00 (58.80) 0.00 (59.19) 0.00 (65.23) 0.00 (62.99) 0.00 (65.34) 0.00 0.00<br />
D. Top marginal tax rate 10.00 10.00 10.00 10.00 10.00 10.00 10.00 10.00<br />
(i) Top marginal income tax rate 10.00 (0) 10.00 (0) 10.00 (0) 10.00 (0) 10.00 (0) 10.00 (0) 10.00 (0) 10.00 (0)<br />
(ii) Top marginal income and payroll tax rate 10.00 (0) 10.00 (0) 10.00 (0) 10.00 (0) 10.00 (0) 10.00 (0)<br />
Area 2. Legal System and Property Rights 5.85 5.21 6.71 6.93 7.46 7.64 7.58<br />
A. Judicial independence 6.84 6.83<br />
B. Impartial courts 7.47 7.43 6.80 6.60 6.34<br />
C. Protection of property rights 7.52 7.54<br />
D. Military interference in rule of law and politics 8.74 8.33 8.33 8.33 8.33<br />
E. Integrity of the legal system 6.96 8.33 8.33 8.33 8.33<br />
F. Legal enforcement of contracts 5.14 5.14 5.14<br />
G. Regulatory restrictions on sale of real property 8.71 8.71 8.71<br />
H. Reliability of police 8.14 8.77<br />
I. Business costs of crime 9.12 8.22<br />
Area 3. Sound Money 5.40 9.45 7.67 9.15 8.31 8.68 7.34 8.86<br />
A. Money growth 9.35 (3.25) 9.80 (0.98) 9.47 (−2.67) 9.76 (−1.20) 9.62 (−1.92) 8.75 (6.23) 7.88 (10.60) 7.58 (12.10)<br />
B. Standard deviation of inflation 2.24 (19.39) 8.09 (4.78) 4.54 (13.65) 7.56 (6.11) 3.88 (15.31) 6.32 (9.19) 2.26 (19.34) 8.50 (3.76)<br />
C. Inflation: most recent year 0.00 (51.11) 9.90 (−0.51) 6.68 (16.62) 9.26 (3.68) 9.75 (−1.27) 9.63 (1.86) 9.21 (3.94) 9.36 (3.20)<br />
D. <strong>Freedom</strong> to own foreign currency bank accounts 10.00 10.00 10.00 10.00 10.00 10.00 10.00 10.00<br />
Area 4. <strong>Freedom</strong> to Trade Internationally 7.08 7.11 6.72 8.68 7.43 7.69 7.69<br />
A. Tariffs 9.23 9.33 8.15 9.38 7.70 7.93 7.93<br />
(i) Revenue from trade taxes (% of trade sector) 9.07 (1.40) 9.33 (1.00) 9.27 (1.10) 9.55 (0.67) 9.45 (0.82) 9.45 (0.82) 9.45 (0.82)<br />
(ii) Mean tariff rate 9.40 (3.00) 8.86 (5.70) 9.06 (4.70) 9.24 (3.80) 8.90 (5.50) 8.90 (5.50)<br />
(iii) Standard deviation of tariff rates 6.32 (9.20) 9.52 (1.20) 4.40 (13.99) 5.44 (11.40) 5.44 (11.40)<br />
B. Regulatory trade barriers 6.70 7.43 7.47<br />
(i) Non-tariff trade barriers 6.94 6.51<br />
(ii) Compliance cost of importing and exporting 6.70 7.93 8.44<br />
C. Black-market exchange rates 10.00 10.00 10.00 10.00 10.00 10.00 10.00 10.00<br />
D. Controls of the movement of capital and people 2.00 2.00 2.00 2.00 6.67 5.32 5.38 5.37<br />
(i) Foreign ownership/investment restrictions 6.35 6.32<br />
(ii) Capital controls 2.00 2.00 2.00 2.00 6.67 6.67 5.83 5.83<br />
(iii) <strong>Freedom</strong> of foreigners to visit 3.97 3.97 3.97<br />
Area 5. Regulation 7.14 7.14 7.24 6.13 7.31 8.58 8.56 8.72<br />
A. Credit market regulations 8.89 9.04 9.28 6.36 9.49 9.59 9.74 9.63<br />
(i) Ownership of banks 8.00 8.00 8.00 8.00 10.00 10.00 10.00 10.00<br />
(ii) Private sector credit 9.79 9.12 9.85 1.09 8.47 8.76 9.21 8.89<br />
(iii) Interest rate controls/negative real interest rates 10.00 10.00 10.00 10.00 10.00 10.00 10.00<br />
B. Labor market regulations 8.91 8.85 8.75<br />
(i) Hiring regulations and minimum wage 10.00 10.00 10.00<br />
(ii) Hiring and firing regulations 5.62 5.12<br />
(iii) Centralized collective bargaining 7.47 7.38<br />
(iv) Hours regulations 6.00 10.00 10.00<br />
(v) Mandated cost of worker dismissal 9.63 10.00 10.00<br />
(vi) Conscription 10.00 10.00 10.00 10.00 10.00 10.00 10.00 10.00<br />
C. Business regulations 7.26 7.08 7.79<br />
(i) Administrative requirements 5.57 5.42<br />
(ii) Bureaucracy costs 3.32 7.36<br />
(iii) Starting a business 6.98 8.64 8.82<br />
(iv) Extra payments/bribes/favoritism 7.96 7.85<br />
(v) Licensing restrictions 5.37 7.69 8.00<br />
(vi) Cost of tax compliance 9.42 9.31 9.31<br />
www.freetheworld.com • www.fraserinstitute.org • Fraser Institute ©2012
130 • <strong>Economic</strong> <strong>Freedom</strong> of the <strong>World</strong>: 2012 Annual Report<br />
Pakistan 1980 1985 1990 1995 2000 2005 2009 2010<br />
Chain-Linked Rating (Rank) Rating (Rank) Rating (Rank) Rating (Rank) Rating (Rank) Rating (Rank) Rating (Rank) Rating (Rank)<br />
Summary Rating (Rank) 4.30 (80) 4.91 (71) 4.87 (83) 5.67 (77) 5.41 (105) 5.86 (102) 5.93 (103) 5.94 (104)<br />
Area 1. Size of Government 5.03 (51) 4.73 (61) 5.14 (71) 5.84 (67) 7.19 (26) 8.26 (15) 8.65 (6) 8.68 (6)<br />
Area 2. Legal System and Property Rights 2.54 (73) 3.52 (83) 2.68 (97) 5.25 (77) 4.84 (80) 2.93 (114) 2.85 (117) 3.09 (115)<br />
Area 3. Sound Money 6.39 (45) 6.78 (46) 7.87 (34) 7.60 (46) 6.15 (105) 6.04 (110) 5.98 (117) 6.04 (116)<br />
Area 4. <strong>Freedom</strong> to Trade Internationally 2.20 (76) 3.77 (64) 3.07 (87) 4.22 (103) 2.85 (121) 5.02 (115) 5.16 (110) 4.83 (118)<br />
Area 5. Regulation 5.35 (53) 5.74 (47) 5.61 (62) 5.43 (81) 6.00 (83) 6.91 (51) 6.90 (56) 6.91 (53)<br />
Unadjusted<br />
Summary Rating (Rank) 4.30 (80) 4.91 (71) 4.87 (84) 5.60 (77) 5.36 (108) 6.18 (103) 6.25 (106) 6.26 (111)<br />
Fraser Institute ©2012 • www.fraserinstitute.org • www.freetheworld.com<br />
Rating (Data) Rating (Data) Rating (Data) Rating (Data) Rating (Data) Rating (Data) Rating (Data) Rating (Data)<br />
Area 1. Size of Government 5.03 4.73 5.14 5.84 7.19 8.26 8.65 8.68<br />
A. Government consumption 8.60 (10.77) 7.97 (12.91) 6.62 (17.49) 7.70 (13.81) 7.91 (13.12) 9.11 (9.04) 9.10 (9.06) 9.16 (8.84)<br />
B. Transfers and subsidies 9.54 (2.20) 9.95 (0.70) 8.94 (4.40) 9.66 (1.75) 9.85 (1.05) 9.92 (0.79) 9.51 (2.30) 9.55 (2.17)<br />
C. Government enterprises and investment 0.00 (65.30) 0.00 (53.90) 2.00 (49.40) 2.00 (46.80) 4.00 (35.29) 7.00 (24.89) 6.00 (26.14) 6.00 (26.01)<br />
D. Top marginal tax rate 2.00 1.00 3.00 4.00 7.00 7.00 10.00 10.00<br />
(i) Top marginal income tax rate 2.00 (55) 1.00 (60) 3.00 (50) 4.00 (45) 7.00 (35) 7.00 (35) 10.00 (20) 10.00 (20)<br />
(ii) Top marginal income and payroll tax rate 3.00 (50) 4.00 (45) 7.00 (35) 7.00 (35) 10.00 (20) 10.00 (20)<br />
Area 2. Legal System and Property Rights 2.54 3.52 2.68 4.93 4.63 4.04 3.94 4.27<br />
A. Judicial independence 3.79 4.26 4.89<br />
B. Impartial courts 4.21 4.26 3.39 3.51 3.72<br />
C. Protection of property rights 4.50 4.28 4.08<br />
D. Military interference in rule of law and politics 4.57 5.28 0.42 1.67 2.50<br />
E. Integrity of the legal system 6.96 5.00 5.00 5.00 5.83<br />
F. Legal enforcement of contracts 3.55 3.55 3.55<br />
G. Regulatory restrictions on sale of real property 6.95 6.03 6.52<br />
H. Reliability of police 4.13 3.43 3.69<br />
I. Business costs of crime 4.66 3.69 3.60<br />
Area 3. Sound Money 6.39 6.78 7.87 7.60 6.15 6.04 5.98 6.04<br />
A. Money growth 8.05 (9.75) 8.94 (5.28) 8.72 (6.40) 8.97 (5.17) 8.55 (7.27) 6.92 (15.40) 8.94 (5.29) 8.94 (5.29)<br />
B. Standard deviation of inflation 9.33 (1.67) 9.06 (2.34) 9.05 (2.38) 9.21 (1.97) 6.91 (7.73) 9.05 (2.38) 7.71 (5.72) 8.00 (5.01)<br />
C. Inflation: most recent year 8.19 (9.06) 9.09 (4.53) 8.71 (6.45) 7.24 (13.79) 9.13 (4.37) 8.19 (9.06) 7.27 (13.65) 7.22 (13.88)<br />
D. <strong>Freedom</strong> to own foreign currency bank accounts 0.00 0.00 5.00 5.00 0.00 0.00 0.00 0.00<br />
Area 4. <strong>Freedom</strong> to Trade Internationally 2.20 3.77 3.07 4.22 2.85 6.11 6.27 5.87<br />
A. Tariffs 0.00 0.10 0.00 1.27 2.79 6.42 6.62 4.78<br />
(i) Revenue from trade taxes (% of trade sector) 0.00 (15.30) 0.20 (14.70) 0.00 (15.21) 2.58 (11.13) 6.18 (5.73) 6.59 (5.12) 7.24 (4.14) 7.13 (4.30)<br />
(ii) Mean tariff rate 0.00 (77.60) 0.00 (78.00) 0.00 (58.80) 0.00 (61.10) 0.68 (46.60) 7.08 (14.60) 7.22 (13.90) 7.22 (13.90)<br />
(iii) Standard deviation of tariff rates 0.00 (34.00) 1.24 (21.90) 1.52 (21.20) 5.60 (11.01) 5.39 (11.54) 0.00 (27.11)<br />
B. Regulatory trade barriers 6.35 6.22 6.38<br />
(i) Non-tariff trade barriers 5.56 5.15 4.89<br />
(ii) Compliance cost of importing and exporting 7.13 7.28 7.88<br />
C. Black-market exchange rates 4.60 9.20 7.20 9.40 5.00 8.93 10.00 10.00<br />
D. Controls of the movement of capital and people 2.00 2.00 2.00 2.00 0.77 2.75 2.27 2.32<br />
(i) Foreign ownership/investment restrictions 6.70 5.24 5.40<br />
(ii) Capital controls 2.00 2.00 2.00 2.00 0.77 0.77 0.77 0.77<br />
(iii) <strong>Freedom</strong> of foreigners to visit 0.79 0.79 0.79<br />
Area 5. Regulation 5.35 5.74 5.61 5.43 6.00 6.43 6.43 6.44<br />
A. Credit market regulations 4.29 5.31 4.97 4.49 6.00 8.92 8.28 8.57<br />
(i) Ownership of banks 0.00 0.00 0.00 0.00 0.00 8.00 8.00 8.00<br />
(ii) Private sector credit 6.87 7.93 8.90 7.46 7.99 8.75 7.84 7.70<br />
(iii) Interest rate controls/negative real interest rates 6.00 8.00 6.00 6.00 10.00 10.00 9.00 10.00<br />
B. Labor market regulations 5.74 5.59 5.68<br />
(i) Hiring regulations and minimum wage 2.20 2.23 2.23<br />
(ii) Hiring and firing regulations 5.96 5.35 5.72<br />
(iii) Centralized collective bargaining 6.63 5.87 6.09<br />
(iv) Hours regulations 8.00 8.00 8.00<br />
(v) Mandated cost of worker dismissal 1.66 2.05 2.05<br />
(vi) Conscription 10.00 10.00 10.00 10.00 10.00 10.00 10.00 10.00<br />
C. Business regulations 4.64 5.43 5.06<br />
(i) Administrative requirements 3.45 3.73 3.62<br />
(ii) Bureaucracy costs 1.91 6.25 3.58<br />
(iii) Starting a business 9.01 9.22 9.21<br />
(iv) Extra payments/bribes/favoritism 4.52 3.40 3.41<br />
(v) Licensing restrictions 5.25 6.24 6.82<br />
(vi) Cost of tax compliance 3.72 3.72 3.72
Panama<br />
Country Data Tables • 131<br />
1980 1985 1990 1995 2000 2005 2009 2010<br />
Chain-Linked Rating (Rank) Rating (Rank) Rating (Rank) Rating (Rank) Rating (Rank) Rating (Rank) Rating (Rank) Rating (Rank)<br />
Summary Rating (Rank) 5.55 (41) 6.12 (30) 6.45 (32) 7.44 (23) 7.56 (24) 7.60 (29) 7.15 (49) 7.44 (37)<br />
Area 1. Size of Government 4.71 (63) 4.89 (57) 5.57 (60) 7.36 (19) 7.81 (15) 8.30 (14) 6.28 (65) 8.02 (16)<br />
Area 2. Legal System and Property Rights 2.91 (68) 3.22 (87) 3.42 (85) 5.64 (63) 5.69 (66) 5.49 (69) 5.43 (75) 5.46 (74)<br />
Area 3. Sound Money 6.78 (33) 9.68 (1) 9.79 (2) 9.50 (22) 9.58 (13) 9.55 (18) 9.09 (46) 9.04 (48)<br />
Area 4. <strong>Freedom</strong> to Trade Internationally 6.45 (28) 6.28 (30) 6.66 (38) 7.78 (39) 7.89 (44) 7.99 (28) 8.14 (23) 7.88 (28)<br />
Area 5. Regulation 6.73 (18) 6.69 (19) 6.90 (21) 6.90 (24) 6.86 (43) 6.69 (70) 6.82 (59) 6.78 (70)<br />
Unadjusted<br />
Summary Rating (Rank) 6.09 (28) 6.71 (18) 6.83 (27) 7.76 (12) 7.48 (26) 7.59 (27) 7.11 (59) 7.40 (37)<br />
Rating (Data) Rating (Data) Rating (Data) Rating (Data) Rating (Data) Rating (Data) Rating (Data) Rating (Data)<br />
Area 1. Size of Government 4.82 5.00 5.57 7.36 7.81 8.30 6.28 8.02<br />
A. Government consumption 3.48 (28.18) 4.16 (25.84) 4.66 (24.15) 5.14 (22.51) 5.26 (22.10) 6.65 (17.40) 6.56 (17.70) 9.54 (7.57)<br />
B. Transfers and subsidies 8.80 (4.90) 8.83 (4.80) 8.12 (7.40) 8.31 (6.70) 8.48 (6.06) 8.56 (5.80) 8.56 (5.80) 8.56 (5.80)<br />
C. Government enterprises and investment 4.00 (39.90) 4.00 (31.40) 7.00 (22.10) 8.00 (16.10) 10.00 (11.86) 10.00 (14.46) 4.00 (38.64) 8.00 (15.29)<br />
D. Top marginal tax rate 3.00 3.00 2.50 8.00 7.50 8.00 6.00 6.00<br />
(i) Top marginal income tax rate 3.00 (56) 3.00 (56) 3.00 (56) 9.00 (30) 8.00 (31) 9.00 (30) 8.00 (27) 8.00 (27)<br />
(ii) Top marginal income and payroll tax rate 2.00 (64) 7.00 (38) 7.00 (38) 7.00 (36) 4.00 (43) 4.00 (43)<br />
Area 2. Legal System and Property Rights 3.19 3.52 3.75 5.60 5.24 5.24 5.03 5.06<br />
A. Judicial independence 2.40 2.52 1.85<br />
B. Impartial courts 4.87 5.35 3.10 3.82 4.11<br />
C. Protection of property rights 4.07 6.71 6.24 6.25<br />
D. Military interference in rule of law and politics 6.71 8.33 8.33 8.33 8.33<br />
E. Integrity of the legal system 6.96 5.00 5.00 5.00 5.00<br />
F. Legal enforcement of contracts 2.26 2.26 2.26<br />
G. Regulatory restrictions on sale of real property 8.38 7.62 7.65<br />
H. Reliability of police 5.92 4.77 4.48<br />
I. Business costs of crime 5.10 4.72 5.64<br />
Area 3. Sound Money 6.78 9.68 9.79 9.50 9.58 9.55 9.09 9.04<br />
A. Money growth 8.23 (8.85) 9.86 (−0.71) 9.75 (−1.23) 8.82 (5.90) 9.32 (3.39) 9.05 (4.76) 7.95 (10.23) 7.95 (10.23)<br />
B. Standard deviation of inflation 5.62 (10.96) 9.04 (2.39) 9.54 (1.16) 9.26 (1.85) 9.28 (1.80) 9.80 (0.49) 8.88 (2.80) 8.92 (2.70)<br />
C. Inflation: most recent year 3.26 (33.69) 9.84 (0.81) 9.89 (0.57) 9.91 (0.47) 9.70 (1.50) 9.35 (3.26) 9.52 (2.41) 9.30 (3.49)<br />
D. <strong>Freedom</strong> to own foreign currency bank accounts 10.00 10.00 10.00 10.00 10.00 10.00 10.00 10.00<br />
Area 4. <strong>Freedom</strong> to Trade Internationally 8.64 8.42 7.80 9.11 7.89 8.11 8.26 8.00<br />
A. Tariffs 7.93 7.27 5.40 7.33 7.49 7.95 7.88 7.88<br />
(i) Revenue from trade taxes (% of trade sector) 7.93 (3.10) 7.27 (4.10) 8.80 (1.80) 9.07 (1.40) 7.33 (4.00) 8.94 (1.59) 8.94 (1.59) 8.94 (1.59)<br />
(ii) Mean tariff rate 2.00 (40.00) 5.60 (22.00) 8.10 (9.50) 8.52 (7.40) 8.56 (7.20) 8.56 (7.20)<br />
(iii) Standard deviation of tariff rates 7.04 (7.40) 6.38 (9.05) 6.14 (9.66) 6.14 (9.66)<br />
B. Regulatory trade barriers 4.95 6.97 7.56 6.37<br />
(i) Non-tariff trade barriers 4.95 5.09 6.27 6.31<br />
(ii) Compliance cost of importing and exporting 8.85 8.85 6.44<br />
C. Black-market exchange rates 10.00 10.00 10.00 10.00 10.00 10.00 10.00 10.00<br />
D. Controls of the movement of capital and people 8.00 8.00 8.00 10.00 9.12 7.53 7.59 7.74<br />
(i) Foreign ownership/investment restrictions 8.24 7.13 7.33 7.76<br />
(ii) Capital controls 8.00 8.00 8.00 10.00 10.00 10.00 10.00 10.00<br />
(iii) <strong>Freedom</strong> of foreigners to visit 5.44 5.44 5.44<br />
Area 5. Regulation 6.99 6.95 7.25 7.25 6.86 6.77 6.90 6.85<br />
A. Credit market regulations 8.47 8.33 9.33 9.33 9.21 9.33 9.19 9.18<br />
(i) Ownership of banks 8.00 8.00 8.00 8.00 8.00 8.00 8.00 8.00<br />
(ii) Private sector credit 8.95 8.67 10.00 10.00 9.64 10.00 9.56 9.54<br />
(iii) Interest rate controls/negative real interest rates 10.00 10.00 10.00 10.00 10.00 10.00<br />
B. Labor market regulations 5.94 5.16 5.32 5.40<br />
(i) Hiring regulations and minimum wage 3.76 1.10 2.23 2.23<br />
(ii) Hiring and firing regulations 4.15 3.37 3.42 3.56<br />
(iii) Centralized collective bargaining 5.85 6.59 6.35 6.67<br />
(iv) Hours regulations 4.00 4.00 4.00<br />
(v) Mandated cost of worker dismissal 5.92 5.92 5.92<br />
(vi) Conscription 10.00 10.00 10.00 10.00 10.00 10.00 10.00 10.00<br />
C. Business regulations 5.42 5.80 6.19 5.98<br />
(i) Administrative requirements 6.93 3.07 4.37 4.05<br />
(ii) Bureaucracy costs 3.90 4.69 4.91 4.49<br />
(iii) Starting a business 5.53 9.17 9.60 9.64<br />
(iv) Extra payments/bribes/favoritism 5.30 5.76 4.81 4.22<br />
(v) Licensing restrictions 8.39 8.85 8.90<br />
(vi) Cost of tax compliance 3.72 4.60 4.60<br />
www.freetheworld.com • www.fraserinstitute.org • Fraser Institute ©2012
132 • <strong>Economic</strong> <strong>Freedom</strong> of the <strong>World</strong>: 2012 Annual Report<br />
Papua New Guinea<br />
Fraser Institute ©2012 • www.fraserinstitute.org • www.freetheworld.com<br />
1980 1985 1990 1995 2000 2005 2009 2010<br />
Chain-Linked Rating (Rank) Rating (Rank) Rating (Rank) Rating (Rank) Rating (Rank) Rating (Rank) Rating (Rank) Rating (Rank)<br />
Summary Rating (Rank) 5.89 (38) 6.06 (42) 6.37 (57) 5.83 (94) 6.16 (91) 6.53 (79) 6.68 (74)<br />
Area 1. Size of Government 3.64 (88) 5.39 (42) 5.87 (49) 9.19 (2) 6.18 (60) 6.75 (57) 7.23 (31) 7.34 (35)<br />
Area 2. Legal System and Property Rights 5.72 (44) 6.28 (33) 5.74 (61) 4.46 (92) 4.26 (96) 4.75 (83) 4.77 (82)<br />
Area 3. Sound Money 6.06 (63) 6.57 (59) 6.65 (59) 5.56 (81) 6.27 (102) 7.08 (87) 7.04 (90) 7.27 (86)<br />
Area 4. <strong>Freedom</strong> to Trade Internationally 5.25 (47) 4.93 (60) 5.19 (94) 5.45 (100) 5.37 (110) 6.41 (87) 6.88 (73)<br />
Area 5. Regulation 6.25 (30) 6.42 (30) 6.42 (34) 6.61 (36) 6.80 (45) 7.27 (32) 7.19 (35) 7.11 (44)<br />
Unadjusted<br />
Summary Rating (Rank) 6.02 (33) 6.07 (40) 5.96 (67) 5.81 (96) 6.48 (86) 6.87 (73) 7.03 (67)<br />
Rating (Data) Rating (Data) Rating (Data) Rating (Data) Rating (Data) Rating (Data) Rating (Data) Rating (Data)<br />
Area 1. Size of Government 2.75 5.86 5.79 7.33 6.18 6.75 7.23 7.34<br />
A. Government consumption 3.50 (28.12) 4.13 (25.95) 3.06 (29.61) 6.00 (19.59) 3.80 (27.08) 6.88 (16.61) 7.80 (13.49) 8.26 (11.91)<br />
B. Transfers and subsidies 9.46 (2.50) 9.10 (3.80) 9.92 (0.79) 9.12 (3.74) 9.12 (3.74) 9.12 (3.74)<br />
C. Government enterprises and investment 2.00 (41.40) 4.00 (34.20) 7.00 (20.40) 8.00 (18.70) 8.00 (18.70) 8.00 (18.70) 8.00 8.00<br />
D. Top marginal tax rate 4.00 8.00 3.00 3.00 4.00 4.00<br />
(i) Top marginal income tax rate 4.00 (45) 8.00 (28) 3.00 (47) 3.00 (47) 5.00 (42) 5.00 (42)<br />
(ii) Top marginal income and payroll tax rate 4.00 (45) 8.00 (28) 3.00 (47) 3.00 (47) 3.00 (47) 3.00 (47)<br />
Area 2. Legal System and Property Rights 5.72 6.28 5.28 4.36 4.21 4.69 4.71<br />
A. Judicial independence<br />
B. Impartial courts<br />
C. Protection of property rights<br />
5.02 5.06 3.90 3.80 3.90<br />
D. Military interference in rule of law and politics 5.25 5.00 5.42 7.50 7.50<br />
E. Integrity of the legal system 6.96 3.33 3.75 4.17 4.17<br />
F. Legal enforcement of contracts 1.01 1.01 1.01<br />
G. Regulatory restrictions on sale of real property<br />
H. Reliability of police<br />
I. Business costs of crime<br />
6.96 6.96 6.96<br />
Area 3. Sound Money 6.06 6.57 6.65 5.56 6.27 7.08 7.04 7.27<br />
A. Money growth 8.71 (6.47) 9.38 (3.12) 9.05 (4.73) 8.68 (6.60) 9.73 (1.36) 6.58 (17.12) 7.80 (11.00) 7.83 (10.87)<br />
B. Standard deviation of inflation 6.95 (7.63) 7.23 (6.93) 8.39 (4.02) 7.52 (6.19) 8.49 (3.78) 7.08 (7.30) 6.73 (8.18) 7.47 (6.33)<br />
C. Inflation: most recent year 8.58 (7.09) 9.68 (1.62) 9.17 (4.13) 6.05 (19.73) 6.88 (15.60) 9.66 (1.70) 8.62 (6.92) 8.80 (6.02)<br />
D. <strong>Freedom</strong> to own foreign currency bank accounts 0.00 0.00 0.00 0.00 0.00 5.00 5.00 5.00<br />
Area 4. <strong>Freedom</strong> to Trade Internationally 5.51 5.18 5.03 5.45 5.82 6.95 7.46<br />
A. Tariffs 7.80 7.33 6.93 6.50 4.80 6.15 6.83 7.33<br />
(i) Revenue from trade taxes (% of trade sector) 7.80 (3.30) 6.07 (5.90) 5.27 (7.10) 5.99 (6.01) 6.03 (5.96) 6.61 (5.08) 6.61 (5.08) 6.61 (5.08)<br />
(ii) Mean tariff rate 8.60 (7.00) 8.60 (7.00) 5.78 (21.10) 8.78 (6.10) 9.00 (5.00) 8.98 (5.10)<br />
(iii) Standard deviation of tariff rates 7.00 (7.50) 2.60 (18.50) 3.05 (17.38) 4.88 (12.80) 6.41 (8.98)<br />
B. Regulatory trade barriers<br />
(i) Non-tariff trade barriers<br />
6.17 6.17 7.69<br />
(ii) Compliance cost of importing and exporting 6.17 6.17 7.69<br />
C. Black-market exchange rates 9.20 8.60 8.60 10.00 10.00 10.00 10.00<br />
D. Controls of the movement of capital and people<br />
(i) Foreign ownership/investment restrictions<br />
0.00 0.00 0.00 0.00 1.54 0.96 4.81 4.81<br />
(ii) Capital controls 0.00 0.00 0.00 0.00 1.54 0.00 7.69 7.69<br />
(iii) <strong>Freedom</strong> of foreigners to visit 1.93 1.93 1.93<br />
Area 5. Regulation 6.29 6.46 6.45 6.61 6.80 8.55 8.45 8.36<br />
A. Credit market regulations 6.37 6.88 6.87 7.62 8.14 9.23 8.95 8.70<br />
(i) Ownership of banks 5.00 5.00 5.00 5.00 5.00 10.00 10.00 10.00<br />
(ii) Private sector credit 7.75 8.76 8.73 9.87 9.42 8.70 6.86 7.10<br />
(iii) Interest rate controls/negative real interest rates 8.00 10.00 9.00 10.00 9.00<br />
B. Labor market regulations 8.82 8.64 8.64<br />
(i) Hiring regulations and minimum wage<br />
(ii) Hiring and firing regulations<br />
(iii) Centralized collective bargaining<br />
8.90 7.77 7.77<br />
(iv) Hours regulations 10.00 10.00 10.00<br />
(v) Mandated cost of worker dismissal 6.38 6.79 6.79<br />
(vi) Conscription 10.00 10.00 10.00 10.00 10.00 10.00 10.00 10.00<br />
C. Business regulations<br />
(i) Administrative requirements<br />
(ii) Bureaucracy costs<br />
7.59 7.75 7.75<br />
(iii) Starting a business<br />
(iv) Extra payments/bribes/favoritism<br />
7.91 8.18 8.20<br />
(v) Licensing restrictions 7.18 7.24 7.23<br />
(vi) Cost of tax compliance 7.69 7.83 7.83
Country Data Tables • 133<br />
Paraguay 1980 1985 1990 1995 2000 2005 2009 2010<br />
Chain-Linked Rating (Rank) Rating (Rank) Rating (Rank) Rating (Rank) Rating (Rank) Rating (Rank) Rating (Rank) Rating (Rank)<br />
Summary Rating (Rank) 5.68 (36) 4.82 (75) 5.60 (54) 6.53 (48) 6.44 (70) 6.36 (84) 6.49 (81) 6.65 (76)<br />
Area 1. Size of Government 9.16 (3) 7.75 (3) 9.31 (2) 8.69 (4) 7.58 (20) 7.87 (24) 7.65 (20) 8.27 (11)<br />
Area 2. Legal System and Property Rights 3.29 (64) 3.54 (79) 3.97 (77) 3.91 (105) 3.67 (106) 2.57 (118) 2.65 (120) 2.73 (119)<br />
Area 3. Sound Money 7.87 (21) 7.48 (32) 6.50 (66) 8.20 (38) 8.72 (42) 8.37 (60) 8.70 (55) 8.65 (62)<br />
Area 4. <strong>Freedom</strong> to Trade Internationally 4.12 (53) 2.30 (78) 4.24 (70) 6.60 (62) 6.78 (72) 7.22 (58) 6.96 (70) 7.24 (57)<br />
Area 5. Regulation 4.39 (96) 5.34 (82) 5.46 (101) 5.77 (99) 6.45 (86) 6.37 (91)<br />
Unadjusted<br />
Summary Rating (Rank) 6.55 (16) 5.58 (45) 6.04 (42) 7.03 (35) 6.47 (67) 6.48 (86) 6.61 (87) 6.78 (81)<br />
Rating (Data) Rating (Data) Rating (Data) Rating (Data) Rating (Data) Rating (Data) Rating (Data) Rating (Data)<br />
Area 1. Size of Government 9.06 7.75 9.31 8.69 7.58 7.62 7.41 8.01<br />
A. Government consumption 9.60 (7.36) 9.45 (7.87) 9.57 (7.45) 8.46 (11.23) 7.04 (16.07) 8.25 (11.95) 7.88 (13.20) 8.26 (11.91)<br />
B. Transfers and subsidies 9.59 (2.00) 9.56 (2.10) 9.65 (1.80) 9.32 (3.00) 9.26 (3.21) 9.21 (3.38) 9.25 (3.24) 9.26 (3.20)<br />
C. Government enterprises and investment 8.00 (17.80) 4.00 (31.40) 10.00 (13.30) 7.00 (23.20) 4.00 (35.71) 4.00 (35.71) 4.00 6.00 (27.68)<br />
D. Top marginal tax rate 8.00 8.00 10.00 10.00 9.00 8.50 8.50<br />
(i) Top marginal income tax rate 8.00 (30) 8.00 (30) 10.00 (0) 10.00 (0) 10.00 (0) 10.00 (8) 10.00 (8)<br />
(ii) Top marginal income and payroll tax rate 8.00 (27) 7.00 (33) 7.00 (33)<br />
Area 2. Legal System and Property Rights 3.71 3.99 4.48 4.32 3.79 3.41 3.51 3.63<br />
A. Judicial independence 1.08 1.17 1.30<br />
B. Impartial courts 4.33 4.08 1.76 2.57 2.86<br />
C. Protection of property rights 2.27 3.35 3.22 3.39<br />
D. Military interference in rule of law and politics 4.79 3.33 2.50 2.50 2.50<br />
E. Integrity of the legal system 4.11 5.00 3.33 3.33 3.33<br />
F. Legal enforcement of contracts 4.19 4.19 4.19<br />
G. Regulatory restrictions on sale of real property 8.47 8.51 8.51<br />
H. Reliability of police 3.03 2.14 4.09<br />
I. Business costs of crime 2.94 4.00 2.48<br />
Area 3. Sound Money 7.87 7.48 6.50 8.20 8.72 8.37 8.70 8.65<br />
A. Money growth 6.93 (15.33) 8.12 (9.39) 4.67 (26.66) 7.09 (14.57) 8.66 (6.72) 7.09 (14.53) 7.06 (14.68) 7.26 (13.72)<br />
B. Standard deviation of inflation 7.91 (5.23) 6.84 (7.91) 8.58 (3.55) 8.29 (4.27) 8.02 (4.94) 7.75 (5.62) 8.26 (4.36) 8.27 (4.34)<br />
C. Inflation: most recent year 6.66 (16.71) 4.95 (25.24) 2.74 (36.28) 7.40 (12.99) 8.20 (8.98) 8.64 (6.79) 9.48 (2.59) 9.07 (4.65)<br />
D. <strong>Freedom</strong> to own foreign currency bank accounts 10.00 10.00 10.00 10.00 10.00 10.00 10.00 10.00<br />
Area 4. <strong>Freedom</strong> to Trade Internationally 5.53 3.09 5.44 8.46 6.78 7.46 7.19 7.49<br />
A. Tariffs 3.00 4.27 6.51 7.99 7.63 7.94 7.73 7.65<br />
(i) Revenue from trade taxes (% of trade sector) 6.00 (6.00) 8.53 (2.20) 7.80 (3.30) 8.60 (2.10) 7.76 (3.37) 8.90 (1.65) 8.56 (2.16) 8.29 (2.57)<br />
(ii) Mean tariff rate 0.00 (71.00) 0.00 (71.70) 6.80 (16.00) 8.14 (9.30) 7.82 (10.90) 8.34 (8.30) 7.94 (10.30) 7.96 (10.20)<br />
(iii) Standard deviation of tariff rates 4.92 (12.70) 7.24 (6.90) 7.32 (6.70) 6.59 (8.51) 6.70 (8.24) 6.70 (8.26)<br />
B. Regulatory trade barriers 2.43 5.07 5.51 6.91<br />
(i) Non-tariff trade barriers 2.43 4.98 5.68 5.87<br />
(ii) Compliance cost of importing and exporting 5.17 5.34 7.94<br />
C. Black-market exchange rates 8.60 0.00 4.80 7.40 10.00 10.00 10.00 10.00<br />
D. Controls of the movement of capital and people 5.00 5.00 5.00 10.00 7.06 6.81 5.52 5.39<br />
(i) Foreign ownership/investment restrictions 5.67 5.07 5.82 5.44<br />
(ii) Capital controls 5.00 5.00 5.00 10.00 8.46 9.23 4.62 4.62<br />
(iii) <strong>Freedom</strong> of foreigners to visit 6.12 6.12 6.12<br />
Area 5. Regulation 4.48 5.45 5.46 5.57 6.23 6.15<br />
A. Credit market regulations 5.97 8.88 8.82 8.33 8.33 8.33<br />
(i) Ownership of banks 8.00 8.00 8.00 8.00<br />
(ii) Private sector credit 9.95 9.76 9.47 10.00 10.00 10.00<br />
(iii) Interest rate controls/negative real interest rates 2.00 8.00 9.00 7.00 7.00 7.00<br />
B. Labor market regulations 3.33 3.32 4.34 4.56<br />
(i) Hiring regulations and minimum wage 4.67 4.40 4.43 5.57<br />
(ii) Hiring and firing regulations 4.72 3.26 3.97 3.94<br />
(iii) Centralized collective bargaining 3.95 5.74 6.58 6.80<br />
(iv) Hours regulations 4.70 8.00 8.00<br />
(v) Mandated cost of worker dismissal 0.82 2.05 2.05<br />
(vi) Conscription 1.00 0.00 0.00 0.00 0.00 1.00 1.00 1.00<br />
C. Business regulations 4.22 5.05 6.00 5.54<br />
(i) Administrative requirements 4.87 2.94 4.02 4.17<br />
(ii) Bureaucracy costs 4.95 5.13 6.73 3.51<br />
(iii) Starting a business 3.98 6.19 8.30 8.38<br />
(iv) Extra payments/bribes/favoritism 3.07 4.30 2.99 3.26<br />
(v) Licensing restrictions 5.39 7.46 8.25<br />
(vi) Cost of tax compliance 6.32 6.51 5.66<br />
www.freetheworld.com • www.fraserinstitute.org • Fraser Institute ©2012
134 • <strong>Economic</strong> <strong>Freedom</strong> of the <strong>World</strong>: 2012 Annual Report<br />
Peru<br />
Fraser Institute ©2012 • www.fraserinstitute.org • www.freetheworld.com<br />
1980 1985 1990 1995 2000 2005 2009 2010<br />
Chain-Linked Rating (Rank) Rating (Rank) Rating (Rank) Rating (Rank) Rating (Rank) Rating (Rank) Rating (Rank) Rating (Rank)<br />
Summary Rating (Rank) 3.90 (88) 2.61 (108) 3.97 (100) 6.50 (49) 7.30 (38) 7.30 (44) 7.43 (33) 7.52 (31)<br />
Area 1. Size of Government 6.36 (20) 5.33 (44) 7.13 (17) 8.21 (9) 8.07 (12) 7.71 (28) 7.51 (26) 7.53 (30)<br />
Area 2. Legal System and Property Rights 3.77 (58) 2.23 (101) 2.93 (94) 4.76 (95) 3.94 (101) 4.27 (95) 4.76 (82) 4.77 (83)<br />
Area 3. Sound Money 0.00 (107) 0.00 (111) 1.25 (113) 5.13 (90) 8.79 (40) 9.68 (5) 9.23 (40) 9.27 (40)<br />
Area 4. <strong>Freedom</strong> to Trade Internationally 2.86 (69) 1.23 (89) 3.85 (81) 7.89 (36) 8.35 (33) 7.91 (31) 8.38 (15) 8.43 (11)<br />
Area 5. Regulation 5.15 (64) 5.04 (72) 4.95 (80) 6.53 (37) 7.39 (20) 6.88 (53) 7.17 (38) 7.49 (25)<br />
Unadjusted<br />
Summary Rating (Rank) 3.72 (94) 2.47 (109) 3.87 (102) 6.47 (49) 7.30 (37) 7.39 (41) 7.52 (25) 7.61 (24)<br />
Rating (Data) Rating (Data) Rating (Data) Rating (Data) Rating (Data) Rating (Data) Rating (Data) Rating (Data)<br />
Area 1. Size of Government 6.47 5.42 7.13 8.21 8.07 7.71 7.51 7.53<br />
A. Government consumption 7.26 (15.33) 8.04 (12.67) 8.69 (10.46) 8.77 (10.17) 7.73 (13.72) 7.86 (13.29) 7.75 (13.64) 7.73 (13.71)<br />
B. Transfers and subsidies 9.62 (1.90) 9.65 (1.80) 9.32 (3.00) 9.07 (3.90) 9.04 (4.02) 8.99 (4.20) 9.29 (3.10) 9.37 (2.82)<br />
C. Government enterprises and investment 7.00 (24.30) 4.00 (33.90) 7.00 (20.00) 8.00 (19.50) 8.00 (19.61) 8.00 (15.60) 7.00 (24.34) 7.00 (23.59)<br />
D. Top marginal tax rate 2.00 0.00 3.50 7.00 7.50 6.00 6.00 6.00<br />
(i) Top marginal income tax rate 2.00 (65) 0.00 (65) 4.00 (45) 8.00 (30) 10.00 (20) 8.00 (30) 8.00 (30) 8.00 (30)<br />
(ii) Top marginal income and payroll tax rate 3.00 (48) 6.00 (39) 5.00 (41) 4.00 (48) 4.00 (48) 4.00 (48)<br />
Area 2. Legal System and Property Rights 3.77 2.23 2.93 4.76 3.94 4.56 5.09 5.10<br />
A. Judicial independence 2.75 1.50 1.59 2.69 2.70<br />
B. Impartial courts 4.33 3.17 2.58 3.44 3.47<br />
C. Protection of property rights 4.83 3.33 4.13 4.71 4.78<br />
D. Military interference in rule of law and politics 4.90 6.67 8.33 7.50 7.50<br />
E. Integrity of the legal system 6.96 5.00 5.00 5.83 5.83<br />
F. Legal enforcement of contracts 4.77 5.07 5.07<br />
G. Regulatory restrictions on sale of real property 8.29 8.78 8.78<br />
H. Reliability of police 3.71 3.47 4.07<br />
I. Business costs of crime 2.67 4.30 3.69<br />
Area 3. Sound Money 1.62 0.00 1.25 5.13 8.79 9.68 9.23 9.27<br />
A. Money growth 3.38 (33.12) 0.00 (83.59) 0.00 (597.16) 2.94 (35.32) 7.03 (14.85) 9.77 (1.13) 8.38 (8.10) 8.42 (7.89)<br />
B. Standard deviation of inflation 3.10 (17.26) 0.00 (37.94) 0.00 (2341.35) 0.00 (127.50) 8.87 (2.83) 9.25 (1.87) 9.14 (2.15) 8.97 (2.57)<br />
C. Inflation: most recent year 0.00 (65.92) 0.00 (167.75) 0.00 (6134.79) 7.56 (12.18) 9.25 (3.76) 9.68 (1.62) 9.41 (2.94) 9.69 (1.53)<br />
D. <strong>Freedom</strong> to own foreign currency bank accounts 0.00 0.00 5.00 10.00 10.00 10.00 10.00 10.00<br />
Area 4. <strong>Freedom</strong> to Trade Internationally 3.29 1.30 4.07 7.90 8.35 8.08 8.56 8.60<br />
A. Tariffs 1.47 1.89 3.40 7.02 7.80 8.08 8.49 8.50<br />
(i) Revenue from trade taxes (% of trade sector) 2.93 (10.60) 4.47 (8.30) 7.40 (3.90) 6.33 (5.50) 7.23 (4.16) 8.48 (2.28) 9.13 (1.30) 9.12 (1.32)<br />
(ii) Mean tariff rate 0.00 (57.00) 0.00 (64.00) 2.80 (36.00) 6.48 (17.60) 7.32 (13.40) 8.16 (9.20) 8.90 (5.50) 8.92 (5.40)<br />
(iii) Standard deviation of tariff rates 1.20 (22.00) 0.00 (25.00) 8.24 (4.40) 8.84 (2.90) 7.59 (6.02) 7.45 (6.38) 7.47 (6.32)<br />
B. Regulatory trade barriers 5.98 6.71 5.70 7.41 7.37<br />
(i) Non-tariff trade barriers 5.98 6.75 5.19 6.71 6.80<br />
(ii) Compliance cost of importing and exporting 6.66 6.22 8.10 7.94<br />
C. Black-market exchange rates 6.40 0.00 6.80 10.00 10.00 10.00 10.00 10.00<br />
D. Controls of the movement of capital and people 2.00 2.00 2.00 8.61 8.88 8.53 8.33 8.54<br />
(i) Foreign ownership/investment restrictions 9.22 9.30 7.27 7.45 7.29<br />
(ii) Capital controls 2.00 2.00 2.00 8.00 8.46 8.46 7.69 8.46<br />
(iii) <strong>Freedom</strong> of foreigners to visit 9.87 9.87 9.87<br />
Area 5. Regulation 3.46 3.39 3.96 6.37 7.39 6.93 7.22 7.55<br />
A. Credit market regulations 2.95 2.72 2.54 7.59 9.27 8.86 8.45 9.33<br />
(i) Ownership of banks 10.00 8.00 8.00 10.00<br />
(ii) Private sector credit 5.90 5.44 5.08 9.18 8.81 9.58 9.35 10.00<br />
(iii) Interest rate controls/negative real interest rates 0.00 0.00 0.00 6.00 9.00 9.00 8.00 8.00<br />
B. Labor market regulations 5.36 6.75 6.51 7.31 7.36<br />
(i) Hiring regulations and minimum wage 6.45 3.08 5.60 3.90 3.90<br />
(ii) Hiring and firing regulations 6.75 6.75 7.20 3.74 3.98 4.21<br />
(iii) Centralized collective bargaining 7.93 7.93 7.82 7.58 7.62<br />
(iv) Hours regulations 5.68 5.51 6.70 10.00 10.00<br />
(v) Mandated cost of worker dismissal 5.18 8.41 8.41<br />
(vi) Conscription 0.00 0.00 0.00 0.00 10.00 10.00 10.00 10.00<br />
C. Business regulations 6.15 6.15 5.43 5.91 5.96<br />
(i) Administrative requirements 6.75 2.25 2.76 2.72<br />
(ii) Bureaucracy costs 7.00 7.50 4.19 5.23 4.68<br />
(iii) Starting a business 6.43 3.57 7.35 8.99 9.04<br />
(iv) Extra payments/bribes/favoritism 5.02 6.78 6.41 5.09 5.05<br />
(v) Licensing restrictions 7.16 7.62 7.71<br />
(vi) Cost of tax compliance 5.25 5.74 6.54
Country Data Tables • 135<br />
Philippines 1980 1985 1990 1995 2000 2005 2009 2010<br />
Chain-Linked Rating (Rank) Rating (Rank) Rating (Rank) Rating (Rank) Rating (Rank) Rating (Rank) Rating (Rank) Rating (Rank)<br />
Summary Rating (Rank) 5.33 (51) 5.07 (60) 5.79 (48) 7.30 (26) 6.97 (44) 7.00 (58) 6.78 (67) 7.06 (55)<br />
Area 1. Size of Government 6.49 (19) 6.75 (10) 8.00 (7) 8.20 (10) 6.87 (38) 8.79 (6) 8.08 (14) 8.31 (9)<br />
Area 2. Legal System and Property Rights 3.06 (65) 2.46 (97) 2.44 (100) 4.82 (91) 4.65 (85) 4.28 (94) 4.02 (100) 3.85 (103)<br />
Area 3. Sound Money 6.10 (61) 4.59 (95) 5.76 (80) 8.80 (35) 9.23 (33) 7.94 (71) 7.98 (72) 9.29 (38)<br />
Area 4. <strong>Freedom</strong> to Trade Internationally 5.65 (38) 5.82 (34) 5.89 (44) 7.62 (42) 7.09 (66) 7.11 (63) 6.94 (72) 6.95 (71)<br />
Area 5. Regulation 5.17 (62) 5.62 (53) 6.60 (30) 7.02 (20) 7.00 (37) 6.75 (65) 6.79 (63) 6.80 (66)<br />
Unadjusted<br />
Summary Rating (Rank) 5.22 (53) 4.97 (68) 5.91 (46) 7.16 (31) 6.97 (42) 7.06 (58) 6.84 (77) 7.12 (61)<br />
Rating (Data) Rating (Data) Rating (Data) Rating (Data) Rating (Data) Rating (Data) Rating (Data) Rating (Data)<br />
Area 1. Size of Government 6.49 6.75 8.00 8.20 6.87 8.79 8.08 8.31<br />
A. Government consumption 8.13 (12.35) 9.01 (9.37) 8.11 (12.43) 7.85 (13.32) 7.26 (15.31) 8.17 (12.23) 8.34 (11.66) 8.25 (11.96)<br />
B. Transfers and subsidies 9.84 (1.10) 10.00 (0.20) 9.89 (0.90) 9.95 (0.70) 9.21 (3.40) 10.00 (0.26) 10.00 (0.23) 10.00 (0.20)<br />
C. Government enterprises and investment 7.00 (20.10) 7.00 (23.70) 7.00 (23.30) 8.00 (17.50) 4.00 (31.10) 10.00 (10.32) 7.00 (20.44) 8.00 (18.20)<br />
D. Top marginal tax rate 1.00 1.00 7.00 7.00 7.00 7.00 7.00 7.00<br />
(i) Top marginal income tax rate 1.00 (70) 1.00 (60) 7.00 (35) 7.00 (35) 7.00 (32) 7.00 (32) 7.00 (32) 7.00 (32)<br />
(ii) Top marginal income and payroll tax rate 7.00 (35) 7.00 (35) 7.00 (32) 7.00 (32) 7.00 (32) 7.00 (32)<br />
Area 2. Legal System and Property Rights 3.06 2.46 2.44 4.82 4.65 4.86 4.56 4.37<br />
A. Judicial independence 3.72 4.51 3.93 3.07 3.25<br />
B. Impartial courts 5.27 5.51 3.62 3.06 3.04<br />
C. Protection of property rights 3.96 3.22 5.69 4.45 4.35<br />
D. Military interference in rule of law and politics 7.04 6.67 5.83 5.83 5.00<br />
E. Integrity of the legal system 4.11 3.33 3.75 4.17 4.17<br />
F. Legal enforcement of contracts 3.42 3.42 3.42<br />
G. Regulatory restrictions on sale of real property 8.00 7.96 7.69<br />
H. Reliability of police 4.13 4.04 4.58<br />
I. Business costs of crime 5.36 5.07 3.80<br />
Area 3. Sound Money 6.10 4.59 5.76 8.80 9.23 7.94 7.98 9.29<br />
A. Money growth 8.41 (7.94) 8.43 (7.87) 6.95 (15.23) 8.11 (9.47) 8.41 (7.96) 8.77 (6.14) 8.44 (7.81) 8.74 (6.30)<br />
B. Standard deviation of inflation 8.83 (2.92) 3.45 (16.37) 8.69 (3.27) 8.58 (3.54) 9.32 (1.71) 9.51 (1.22) 9.12 (2.20) 9.19 (2.03)<br />
C. Inflation: most recent year 7.15 (14.25) 6.47 (17.63) 7.41 (12.97) 8.49 (7.55) 9.21 (3.95) 8.47 (7.63) 9.35 (3.23) 9.24 (3.81)<br />
D. <strong>Freedom</strong> to own foreign currency bank accounts 0.00 0.00 0.00 10.00 10.00 5.00 5.00 10.00<br />
Area 4. <strong>Freedom</strong> to Trade Internationally 5.11 5.26 5.43 7.10 7.09 6.84 6.67 6.69<br />
A. Tariffs 3.93 5.17 5.69 6.08 7.86 8.14 7.68 7.72<br />
(i) Revenue from trade taxes (% of trade sector) 5.47 (6.80) 5.87 (6.20) 5.60 (6.60) 5.73 (6.40) 8.26 (2.61) 8.24 (2.64) 7.10 (4.35) 7.21 (4.19)<br />
(ii) Mean tariff rate 2.40 (38.00) 4.48 (27.60) 5.14 (24.30) 4.48 (27.60) 8.48 (7.60) 8.92 (5.40) 8.74 (6.30) 8.74 (6.30)<br />
(iii) Standard deviation of tariff rates 6.32 (9.20) 8.04 (4.90) 6.84 (7.90) 7.25 (6.87) 7.20 (6.99) 7.20 (6.99)<br />
B. Regulatory trade barriers 5.72 5.89 6.82 6.76 6.74<br />
(i) Non-tariff trade barriers 5.72 3.95 6.03 5.50 5.36<br />
(ii) Compliance cost of importing and exporting 7.83 7.62 8.03 8.13<br />
C. Black-market exchange rates 9.40 8.60 8.60 10.00 10.00 10.00 10.00 10.00<br />
D. Controls of the movement of capital and people 2.00 2.00 2.00 6.61 4.60 2.40 2.24 2.30<br />
(i) Foreign ownership/investment restrictions 8.21 8.44 6.21 5.73 5.89<br />
(ii) Capital controls 2.00 2.00 2.00 5.00 0.77 0.77 0.77 0.77<br />
(iii) <strong>Freedom</strong> of foreigners to visit 0.23 0.23 0.23<br />
Area 5. Regulation 5.34 5.81 7.92 6.88 7.00 6.87 6.90 6.92<br />
A. Credit market regulations 6.60 5.50 8.19 9.19 8.98 9.01 9.01 8.91<br />
(i) Ownership of banks 5.00 5.00 8.00 8.00 8.00 8.00 8.00 8.00<br />
(ii) Private sector credit 6.79 7.51 8.56 9.58 8.94 9.02 9.02 8.73<br />
(iii) Interest rate controls/negative real interest rates 8.00 4.00 8.00 10.00 10.00 10.00 10.00 10.00<br />
B. Labor market regulations 7.65 6.82 6.06 5.95 6.02 6.02<br />
(i) Hiring regulations and minimum wage 5.05 4.38 4.40 4.43 4.43<br />
(ii) Hiring and firing regulations 5.70 5.70 3.30 4.28 3.62 3.81<br />
(iii) Centralized collective bargaining 7.24 7.24 6.92 5.47 6.08 5.89<br />
(iv) Hours regulations 6.10 5.68 10.00 10.00 10.00<br />
(v) Mandated cost of worker dismissal 1.56 1.97 1.97<br />
(vi) Conscription 3.00 10.00 10.00 10.00 10.00 10.00 10.00 10.00<br />
C. Business regulations 4.63 5.97 5.65 5.68 5.83<br />
(i) Administrative requirements 7.20 2.39 2.56 2.62<br />
(ii) Bureaucracy costs 5.48 6.68 4.13 5.65 3.38<br />
(iii) Starting a business 6.08 5.63 7.88 8.45 8.66<br />
(iv) Extra payments/bribes/favoritism 2.32 4.35 4.24 2.88 3.15<br />
(v) Licensing restrictions 7.41 6.75 9.33<br />
(vi) Cost of tax compliance 7.81 7.81 7.81<br />
www.freetheworld.com • www.fraserinstitute.org • Fraser Institute ©2012
136 • <strong>Economic</strong> <strong>Freedom</strong> of the <strong>World</strong>: 2012 Annual Report<br />
Poland<br />
Fraser Institute ©2012 • www.fraserinstitute.org • www.freetheworld.com<br />
1980 1985 1990 1995 2000 2005 2009 2010<br />
Chain-Linked Rating (Rank) Rating (Rank) Rating (Rank) Rating (Rank) Rating (Rank) Rating (Rank) Rating (Rank) Rating (Rank)<br />
Summary Rating (Rank) 3.46 (101) 3.55 (104) 5.37 (87) 6.34 (74) 6.89 (63) 7.28 (40) 7.29 (41)<br />
Area 1. Size of Government 4.00 (81) 3.90 (85) 1.85 (113) 2.62 (119) 4.25 (107) 5.40 (95) 6.38 (58) 6.35 (64)<br />
Area 2. Legal System and Property Rights 4.78 (59) 6.19 (34) 6.84 (36) 6.50 (52) 5.93 (60) 6.61 (47) 6.67 (46)<br />
Area 3. Sound Money 8.34 (14) 4.43 (97) 2.50 (109) 6.03 (73) 7.49 (69) 9.27 (36) 9.32 (32) 9.39 (30)<br />
Area 4. <strong>Freedom</strong> to Trade Internationally 1.91 (82) 4.96 (58) 7.12 (54) 7.25 (61) 7.04 (66) 7.18 (60) 7.02 (68)<br />
Area 5. Regulation 2.06 (100) 2.09 (105) 2.19 (114) 4.27 (110) 6.20 (68) 6.83 (58) 6.96 (52) 7.05 (46)<br />
Unadjusted<br />
Summary Rating (Rank) 3.70 (97) 3.54 (104) 5.30 (89) 6.34 (72) 6.91 (68) 7.30 (42) 7.31 (48)<br />
Rating (Data) Rating (Data) Rating (Data) Rating (Data) Rating (Data) Rating (Data) Rating (Data) Rating (Data)<br />
Area 1. Size of Government 5.10 4.21 2.00 2.62 4.25 5.40 6.38 6.35<br />
A. Government consumption 8.21 (12.09) 7.95 (12.97) 3.33 (28.69) 4.99 (23.02) 5.00 (23.00) 5.15 (22.50) 4.95 (23.18) 4.84 (23.53)<br />
B. Transfers and subsidies 2.67 (27.40) 2.67 (27.40) 3.49 (24.40) 4.50 (20.69) 4.96 (19.01) 5.06 (18.65) 5.05 (18.67)<br />
C. Government enterprises and investment 2.00 (40.70) 2.00 (40.70) 0.00 (58.80) 0.00 (55.80) 4.00 (36.62) 8.00 (18.69) 10.00 (13.01) 10.00 (13.66)<br />
D. Top marginal tax rate 2.00 3.50 3.50 5.50 5.50<br />
(i) Top marginal income tax rate 4.00 (45) 5.00 (40) 5.00 (40) 7.00 (32) 7.00 (32)<br />
(ii) Top marginal income and payroll tax rate 0.00 (63) 2.00 (53) 2.00 (55) 4.00 (44) 4.00 (44)<br />
Area 2. Legal System and Property Rights 4.78 6.19 6.84 6.50 5.63 6.28 6.33<br />
A. Judicial independence 6.47 5.34 4.18 5.56 5.55<br />
B. Impartial courts 5.60 5.85 4.37 3.48 3.69<br />
C. Protection of property rights 3.58 4.63 4.58 5.98 5.90<br />
D. Military interference in rule of law and politics 8.54 10.00 10.00 10.00 10.00<br />
E. Integrity of the legal system 10.00 6.67 7.08 7.50 7.50<br />
F. Legal enforcement of contracts 4.27 4.27 4.27<br />
G. Regulatory restrictions on sale of real property 5.75 7.00 7.00<br />
H. Reliability of police 4.89 5.63 7.44<br />
I. Business costs of crime 5.57 7.09 5.61<br />
Area 3. Sound Money 7.42 4.43 2.50 6.03 7.49 9.27 9.32 9.39<br />
A. Money growth 5.90 (20.50) 0.00 (110.44) 3.83 (30.87) 8.97 (5.14) 8.05 (9.75) 8.48 (7.61) 8.59 (7.04)<br />
B. Standard deviation of inflation 9.21 (1.97) 0.00 (37.35) 0.00 (167.57) 5.91 (10.22) 8.00 (5.00) 9.44 (1.41) 9.58 (1.05) 9.51 (1.21)<br />
C. Inflation: most recent year 8.04 (9.80) 6.83 (15.83) 0.00 (435.66) 4.37 (28.17) 7.99 (10.06) 9.58 (2.11) 9.23 (3.83) 9.46 (2.71)<br />
D. <strong>Freedom</strong> to own foreign currency bank accounts 5.00 5.00 10.00 10.00 5.00 10.00 10.00 10.00<br />
Area 4. <strong>Freedom</strong> to Trade Internationally 1.92 4.97 6.82 7.25 7.29 7.44 7.27<br />
A. Tariffs 5.77 6.70 6.38 7.76 8.39 8.22 8.28<br />
(i) Revenue from trade taxes (% of trade sector) 4.27 (8.60) 6.00 (6.00) 5.95 (6.08) 9.20 (1.20) 9.59 (0.62) 9.44 (0.84) 9.44 (0.84)<br />
(ii) Mean tariff rate 7.28 (13.60) 7.66 (11.70) 6.32 (18.40) 8.00 (10.00) 9.46 (2.70) 8.94 (5.30) 8.98 (5.10)<br />
(iii) Standard deviation of tariff rates 6.44 (8.90) 6.88 (7.80) 6.08 (9.80) 6.13 (9.67) 6.29 (9.28) 6.41 (8.98)<br />
B. Regulatory trade barriers 5.70 7.45 6.19 6.79 6.23<br />
(i) Non-tariff trade barriers 5.70 6.23 5.19 6.40 5.96<br />
(ii) Compliance cost of importing and exporting 8.66 7.18 7.18 6.50<br />
C. Black-market exchange rates 0.00 0.00 8.20 10.00 10.00 10.00 10.00 10.00<br />
D. Controls of the movement of capital and people 0.00 0.00 0.00 5.21 3.78 4.59 4.73 4.56<br />
(i) Foreign ownership/investment restrictions 5.41 6.78 5.65 6.09 5.56<br />
(ii) Capital controls 0.00 0.00 0.00 5.00 0.77 1.54 1.54 1.54<br />
(iii) <strong>Freedom</strong> of foreigners to visit 6.58 6.58 6.58<br />
Area 5. Regulation 3.10 3.13 2.03 4.22 6.20 6.97 7.11 7.20<br />
A. Credit market regulations 0.24 0.38 0.44 3.94 7.61 8.59 8.24 8.24<br />
(i) Ownership of banks 0.00 0.00 0.00 2.00 5.00 8.00 8.00 8.00<br />
(ii) Private sector credit 0.48 0.76 1.31 3.82 7.84 7.76 6.71 6.71<br />
(iii) Interest rate controls/negative real interest rates 0.00 6.00 10.00 10.00 10.00 10.00<br />
B. Labor market regulations 3.62 4.45 4.20 6.56 7.45 7.42<br />
(i) Hiring regulations and minimum wage 5.38 3.39 10.00 5.57 5.57<br />
(ii) Hiring and firing regulations 5.67 5.67 2.72 4.78 3.86 3.78<br />
(iii) Centralized collective bargaining 4.49 4.49 5.18 5.18 7.03 6.11 7.30 7.19<br />
(iv) Hours regulations 5.00 4.84 6.70 8.00 8.00<br />
(v) Mandated cost of worker dismissal 8.79 10.00 10.00<br />
(vi) Conscription 0.00 0.00 0.00 1.00 3.00 3.00 10.00 10.00<br />
C. Business regulations 4.27 6.78 5.75 5.63 5.93<br />
(i) Administrative requirements 7.40 3.45 2.86 2.68<br />
(ii) Bureaucracy costs 5.14 7.13 6.50 3.84 5.58<br />
(iii) Starting a business 4.37 6.98 8.11 8.74 8.75<br />
(iv) Extra payments/bribes/favoritism 3.30 5.60 5.55 6.35 5.98<br />
(v) Licensing restrictions 5.59 5.63 5.91<br />
(vi) Cost of tax compliance 5.31 6.36 6.68
Portugal<br />
Country Data Tables • 137<br />
1980 1985 1990 1995 2000 2005 2009 2010<br />
Chain-Linked Rating (Rank) Rating (Rank) Rating (Rank) Rating (Rank) Rating (Rank) Rating (Rank) Rating (Rank) Rating (Rank)<br />
Summary Rating (Rank) 5.53 (43) 5.37 (51) 6.25 (37) 7.46 (22) 7.55 (25) 7.43 (36) 7.18 (46) 7.22 (48)<br />
Area 1. Size of Government 3.31 (93) 3.52 (95) 5.22 (68) 5.49 (80) 5.26 (88) 5.73 (91) 5.47 (89) 5.52 (90)<br />
Area 2. Legal System and Property Rights 8.00 (7) 6.08 (31) 7.73 (19) 8.04 (21) 7.64 (30) 7.72 (26) 7.18 (34) 7.05 (34)<br />
Area 3. Sound Money 5.61 (76) 5.61 (87) 6.05 (72) 9.18 (29) 9.51 (20) 9.54 (19) 9.61 (11) 9.75 (2)<br />
Area 4. <strong>Freedom</strong> to Trade Internationally 6.57 (27) 6.77 (25) 7.66 (24) 9.02 (15) 8.95 (20) 7.89 (33) 8.02 (26) 7.83 (31)<br />
Area 5. Regulation 4.26 (86) 5.00 (73) 4.58 (93) 5.55 (74) 6.39 (57) 6.33 (83) 5.72 (107) 6.01 (99)<br />
Unadjusted<br />
Summary Rating (Rank) 5.62 (41) 5.46 (51) 6.20 (39) 7.40 (22) 7.55 (22) 7.34 (45) 7.10 (61) 7.14 (60)<br />
Rating (Data) Rating (Data) Rating (Data) Rating (Data) Rating (Data) Rating (Data) Rating (Data) Rating (Data)<br />
Area 1. Size of Government 3.63 3.86 5.22 5.49 5.26 5.73 5.47 5.52<br />
A. Government consumption 6.83 (16.76) 6.60 (17.57) 5.95 (19.76) 5.47 (21.41) 4.18 (25.80) 4.61 (24.33) 4.33 (25.29) 4.52 (24.62)<br />
B. Transfers and subsidies 5.69 (16.30) 4.82 (19.50) 5.91 (15.50) 6.49 (13.40) 5.88 (15.64) 4.81 (19.54) 4.04 (22.37) 4.04 (22.37)<br />
C. Government enterprises and investment 2.00 (42.20) 4.00 (30.50) 6.00 (29.90) 7.00 (23.20) 7.00 (23.20) 10.00 (13.22) 10.00 (9.53) 10.00 (7.96)<br />
D. Top marginal tax rate 0.00 0.00 3.00 3.00 4.00 3.50 3.50 3.50<br />
(i) Top marginal income tax rate 0.00 (84) 0.00 (69) 5.00 (40) 5.00 (40) 6.00 (40) 5.00 (42) 5.00 (42) 5.00 (47)<br />
(ii) Top marginal income and payroll tax rate 1.00 (57) 1.00 (57) 2.00 (57) 2.00 (58) 2.00 (58) 2.00 (62)<br />
Area 2. Legal System and Property Rights 8.00 6.08 7.73 8.04 7.64 7.32 6.81 6.69<br />
A. Judicial independence 8.15 7.01 7.76 5.48 4.89<br />
B. Impartial courts 6.97 6.35 5.33 3.14 2.91<br />
C. Protection of property rights 5.10 6.48 7.43 6.73 6.31<br />
D. Military interference in rule of law and politics 9.99 10.00 10.00 10.00 10.00<br />
E. Integrity of the legal system 10.00 8.33 8.33 8.33 8.33<br />
F. Legal enforcement of contracts 5.25 5.55 5.55<br />
G. Regulatory restrictions on sale of real property 6.04 7.55 7.58<br />
H. Reliability of police 7.42 6.76 7.94<br />
I. Business costs of crime 8.29 7.72 6.70<br />
Area 3. Sound Money 5.61 5.61 6.05 9.18 9.51 9.54 9.61 9.75<br />
A. Money growth 7.96 (10.18) 7.84 (10.78) 8.23 (8.87) 8.80 (5.98) 8.77 (6.14) 8.83 (5.83) 9.08 (4.60) 9.78 (1.12)<br />
B. Standard deviation of inflation 8.66 (3.34) 8.94 (2.64) 8.54 (3.66) 8.95 (2.62) 9.85 (0.39) 9.78 (0.55) 9.51 (1.21) 9.51 (1.23)<br />
C. Inflation: most recent year 5.82 (20.90) 5.65 (21.73) 7.45 (12.77) 8.97 (5.16) 9.43 (2.85) 9.54 (2.29) 9.84 (−0.83) 9.72 (1.39)<br />
D. <strong>Freedom</strong> to own foreign currency bank accounts 0.00 0.00 0.00 10.00 10.00 10.00 10.00 10.00<br />
Area 4. <strong>Freedom</strong> to Trade Internationally 6.73 6.93 7.55 8.80 8.95 7.99 8.13 7.93<br />
A. Tariffs 8.60 9.20 8.26 8.70 9.18 8.39 8.22 8.34<br />
(i) Revenue from trade taxes (% of trade sector) 8.60 (2.10) 9.20 (1.20) 9.13 (1.30) 9.80 (0.30) 9.78 (0.33) 9.59 (0.62) 9.44 (0.84) 9.63 (0.55)<br />
(ii) Mean tariff rate 8.52 (7.40) 8.66 (6.70) 9.52 (2.40) 9.46 (2.70) 8.94 (5.30) 8.98 (5.10)<br />
(iii) Standard deviation of tariff rates 7.12 (7.20) 7.64 (5.90) 8.24 (4.40) 6.13 (9.67) 6.29 (9.28) 6.41 (8.98)<br />
B. Regulatory trade barriers 8.18 8.62 7.80 7.81 7.12<br />
(i) Non-tariff trade barriers 8.18 7.73 7.78 7.74 7.67<br />
(ii) Compliance cost of importing and exporting 9.50 7.82 7.89 6.56<br />
C. Black-market exchange rates 9.60 9.60 9.40 10.00 10.00 10.00 10.00 10.00<br />
D. Controls of the movement of capital and people 2.00 2.00 5.00 8.32 7.99 5.77 6.47 6.25<br />
(i) Foreign ownership/investment restrictions 8.64 9.05 7.67 6.67 6.03<br />
(ii) Capital controls 2.00 2.00 5.00 8.00 6.92 3.08 6.15 6.15<br />
(iii) <strong>Freedom</strong> of foreigners to visit 6.58 6.58 6.58<br />
Area 5. Regulation 4.10 4.81 4.45 5.48 6.39 6.10 5.51 5.80<br />
A. Credit market regulations 4.42 6.17 5.76 6.59 7.84 6.89 5.44 6.44<br />
(i) Ownership of banks 0.00 0.00 2.00 2.00 5.00 5.00 5.00 8.00<br />
(ii) Private sector credit 9.27 8.50 7.29 7.78 8.51 5.66 1.32 1.32<br />
(iii) Interest rate controls/negative real interest rates 4.00 10.00 8.00 10.00 10.00 10.00 10.00 10.00<br />
B. Labor market regulations 3.78 3.46 3.13 4.64 4.46 5.26 5.16 4.67<br />
(i) Hiring regulations and minimum wage 6.42 4.05 6.70 5.57 2.23<br />
(ii) Hiring and firing regulations 3.40 3.40 2.83 2.86 2.18 2.30<br />
(iii) Centralized collective bargaining 5.18 5.18 5.18 5.18 4.88 5.51 5.28 5.53<br />
(iv) Hours regulations 6.16 5.19 3.96 5.22 5.51 5.30 6.00 6.00<br />
(v) Mandated cost of worker dismissal 1.19 1.97 1.97<br />
(vi) Conscription 0.00 0.00 0.00 3.00 5.00 10.00 10.00 10.00<br />
C. Business regulations 5.21 6.87 6.15 5.93 6.28<br />
(i) Administrative requirements 7.58 3.68 2.54 2.48<br />
(ii) Bureaucracy costs 5.53 7.20 3.57 3.54 5.68<br />
(iii) Starting a business 4.32 5.65 9.53 9.63 9.82<br />
(iv) Extra payments/bribes/favoritism 5.79 7.04 8.33 6.83 6.09<br />
(v) Licensing restrictions 5.48 6.39 6.67<br />
(vi) Cost of tax compliance 6.32 6.66 6.92<br />
www.freetheworld.com • www.fraserinstitute.org • Fraser Institute ©2012
138 • <strong>Economic</strong> <strong>Freedom</strong> of the <strong>World</strong>: 2012 Annual Report<br />
Qatar<br />
Fraser Institute ©2012 • www.fraserinstitute.org • www.freetheworld.com<br />
1980 1985 1990 1995 2000 2005 2009 2010<br />
Chain-Linked Rating (Rank) Rating (Rank) Rating (Rank) Rating (Rank) Rating (Rank) Rating (Rank) Rating (Rank) Rating (Rank)<br />
Summary Rating (Rank) <br />
Area 1. Size of Government<br />
Area 2. Legal System and Property Rights<br />
Area 3. Sound Money<br />
Area 4. <strong>Freedom</strong> to Trade Internationally<br />
Area 5. Regulation<br />
Unadjusted<br />
Summary Rating (Rank) 7.70 (17)<br />
Rating (Data) Rating (Data) Rating (Data) Rating (Data) Rating (Data) Rating (Data) Rating (Data) Rating (Data)<br />
Area 1. Size of Government 6.59<br />
A. Government consumption 0.59 (38.01)<br />
B. Transfers and subsidies<br />
C. Government enterprises and investment<br />
9.19 (3.49)<br />
D. Top marginal tax rate 10.00<br />
(i) Top marginal income tax rate<br />
(ii) Top marginal income and payroll tax rate<br />
10.00 (0)<br />
Area 2. Legal System and Property Rights 7.53<br />
A. Judicial independence 8.37<br />
B. Impartial courts 6.32<br />
C. Protection of property rights 6.32<br />
D. Military interference in rule of law and politics 6.67<br />
E. Integrity of the legal system 8.33<br />
F. Legal enforcement of contracts 4.86<br />
G. Regulatory restrictions on sale of real property 9.66<br />
H. Reliability of police 8.48<br />
I. Business costs of crime 8.79<br />
Area 3. Sound Money 8.64<br />
A. Money growth 8.84 (−5.78)<br />
B. Standard deviation of inflation 6.19 (9.52)<br />
C. Inflation: most recent year 9.51 (−2.43)<br />
D. <strong>Freedom</strong> to own foreign currency bank accounts 10.00<br />
Area 4. <strong>Freedom</strong> to Trade Internationally 7.68<br />
A. Tariffs 7.94<br />
(i) Revenue from trade taxes (% of trade sector) 8.14 (2.79)<br />
(ii) Mean tariff rate 9.00 (5.00) 9.00 (5.00)<br />
(iii) Standard deviation of tariff rates 6.68 (8.30) 6.68 (8.30)<br />
B. Regulatory trade barriers 7.81<br />
(i) Non-tariff trade barriers 8.36<br />
(ii) Compliance cost of importing and exporting 7.25<br />
C. Black-market exchange rates 10.00<br />
D. Controls of the movement of capital and people 4.97<br />
(i) Foreign ownership/investment restrictions 6.79<br />
(ii) Capital controls 4.62<br />
(iii) <strong>Freedom</strong> of foreigners to visit 3.52<br />
Area 5. Regulation 8.04<br />
A. Credit market regulations<br />
(i) Ownership of banks<br />
7.95<br />
(ii) Private sector credit 5.90<br />
(iii) Interest rate controls/negative real interest rates 10.00<br />
B. Labor market regulations 7.69<br />
(i) Hiring regulations and minimum wage 10.00<br />
(ii) Hiring and firing regulations 5.44<br />
(iii) Centralized collective bargaining 8.27<br />
(iv) Hours regulations 8.00<br />
(v) Mandated cost of worker dismissal 4.44<br />
(vi) Conscription 10.00<br />
C. Business regulations 8.48<br />
(i) Administrative requirements 6.48<br />
(ii) Bureaucracy costs 7.62<br />
(iii) Starting a business 9.32<br />
(iv) Extra payments/bribes/favoritism 8.08<br />
(v) Licensing restrictions 9.78<br />
(vi) Cost of tax compliance 9.60
Country Data Tables • 139<br />
Romania 1980 1985 1990 1995 2000 2005 2009 2010<br />
Chain-Linked Rating (Rank) Rating (Rank) Rating (Rank) Rating (Rank) Rating (Rank) Rating (Rank) Rating (Rank) Rating (Rank)<br />
Summary Rating (Rank) 4.39 (85) 4.31 (99) 3.81 (117) 5.27 (110) 7.08 (54) 7.34 (37) 7.27 (42)<br />
Area 1. Size of Government 4.08 (79) 4.63 (66) 3.09 (107) 3.37 (110) 5.02 (91) 7.86 (25) 7.23 (30) 7.04 (40)<br />
Area 2. Legal System and Property Rights 3.59 (78) 5.65 (50) 5.62 (64) 6.16 (57) 5.70 (63) 6.28 (55) 5.97 (59)<br />
Area 3. Sound Money 6.61 (37) 6.95 (39) 7.18 (39) 0.74 (119) 2.71 (121) 8.30 (61) 9.03 (47) 9.02 (49)<br />
Area 4. <strong>Freedom</strong> to Trade Internationally 3.16 (86) 5.71 (82) 6.70 (73) 7.35 (51) 7.60 (45) 7.40 (51)<br />
Area 5. Regulation 3.14 (95) 2.94 (101) 2.94 (107) 3.39 (118) 5.78 (93) 6.24 (88) 6.58 (77) 6.90 (55)<br />
Unadjusted<br />
Summary Rating (Rank) 5.58 (45) 5.02 (75) 3.63 (120) 5.16 (112) 7.22 (50) 7.48 (28) 7.41 (36)<br />
Rating (Data) Rating (Data) Rating (Data) Rating (Data) Rating (Data) Rating (Data) Rating (Data) Rating (Data)<br />
Area 1. Size of Government 7.85 8.92 5.94 3.37 5.02 7.86 7.23 7.04<br />
A. Government consumption 9.41 (8.01) 9.85 (6.51) 6.82 (16.82) 6.81 (16.84) 7.50 (14.48) 8.44 (11.31) 5.92 (19.86) 5.71 (20.57)<br />
B. Transfers and subsidies 6.29 (14.10) 7.98 (7.90) 5.07 (18.60) 6.16 (14.59) 6.09 (14.84) 7.01 (11.49) 6.50 (13.33) 5.96 (15.33)<br />
C. Government enterprises and investment 0.00 (60.70) 4.00 (60.70) 10.00 (10.56) 10.00 (7.75) 10.00 (9.33)<br />
D. Top marginal tax rate 0.50 2.50 6.00 6.50 6.50<br />
(i) Top marginal income tax rate 1.00 (60) 5.00 (40) 10.00 (16) 10.00 (16) 10.00 (16)<br />
(ii) Top marginal income and payroll tax rate 0.00 (72) 0.00 (68) 2.00 (54) 3.00 (48) 3.00 (48)<br />
Area 2. Legal System and Property Rights 3.99 6.28 5.64 5.58 5.47 6.02 5.72<br />
A. Judicial independence 3.14 4.12 3.52<br />
B. Impartial courts 5.40 5.52 3.45 3.20 3.04<br />
C. Protection of property rights 4.10 5.12 5.29 4.89<br />
D. Military interference in rule of law and politics 6.37 8.33 8.33 8.33 8.33<br />
E. Integrity of the legal system 6.96 6.67 6.67 6.67 6.67<br />
F. Legal enforcement of contracts 5.21 4.85 4.85<br />
G. Regulatory restrictions on sale of real property 7.97 8.67 9.11<br />
H. Reliability of police 4.44 5.27 6.56<br />
I. Business costs of crime 4.87 7.78 4.54<br />
Area 3. Sound Money 6.61 6.95 7.18 0.74 2.71 8.30 9.03 9.02<br />
A. Money growth 7.76 (11.20) 9.75 (−1.25) 8.57 (7.13) 0.00 (58.13) 9.98 (−0.12) 8.92 (−5.39) 8.15 (9.25) 8.65 (6.77)<br />
B. Standard deviation of inflation 8.78 (3.05) 8.11 (4.73) 7.87 (5.32) 0.00 (68.32) 0.00 (44.43) 6.07 (9.82) 9.10 (2.24) 8.65 (3.38)<br />
C. Inflation: most recent year 9.88 (0.59) 9.93 (0.37) 7.26 (13.72) 2.94 (35.30) 0.87 (45.67) 8.20 (8.99) 8.88 (5.59) 8.78 (6.09)<br />
D. <strong>Freedom</strong> to own foreign currency bank accounts 0.00 0.00 5.00 0.00 0.00 10.00 10.00 10.00<br />
Area 4. <strong>Freedom</strong> to Trade Internationally 3.24 5.54 6.70 7.80 8.08 7.86<br />
A. Tariffs 9.73 7.22 6.76 7.75 8.22 8.34<br />
(i) Revenue from trade taxes (% of trade sector) 9.73 (0.40) 8.20 (2.70) 8.95 (1.58) 9.59 (0.62) 9.44 (0.84) 9.63 (0.55)<br />
(ii) Mean tariff rate 6.24 (18.80) 6.96 (15.20) 8.68 (6.60) 8.94 (5.30) 8.98 (5.10)<br />
(iii) Standard deviation of tariff rates 4.36 (14.10) 4.98 (12.56) 6.29 (9.28) 6.41 (8.98)<br />
B. Regulatory trade barriers 5.48 6.89 7.43 6.49<br />
(i) Non-tariff trade barriers 5.48 5.43 6.51 5.78<br />
(ii) Compliance cost of importing and exporting 8.35 8.35 7.19<br />
C. Black-market exchange rates 0.00 0.00 0.00 9.40 10.00 10.00 10.00 10.00<br />
D. Controls of the movement of capital and people 0.00 0.00 0.00 0.00 4.54 6.58 6.65 6.60<br />
(i) Foreign ownership/investment restrictions 7.55 6.23 5.70 5.54<br />
(ii) Capital controls 0.00 0.00 0.00 0.00 1.54 6.92 7.69 7.69<br />
(iii) <strong>Freedom</strong> of foreigners to visit 6.58 6.58 6.58<br />
Area 5. Regulation 2.64 2.47 2.47 2.85 5.78 6.69 7.05 7.39<br />
A. Credit market regulations 0.00 0.00 0.00 0.67 5.34 7.79 7.71 9.38<br />
(i) Ownership of banks 0.00 0.00 0.00 2.00 0.00 5.00 5.00 10.00<br />
(ii) Private sector credit 0.00 0.00 0.00 0.00 6.02 9.37 8.14 8.14<br />
(iii) Interest rate controls/negative real interest rates 0.00 0.00 10.00 9.00 10.00 10.00<br />
B. Labor market regulations 6.28 5.63 7.05 6.93<br />
(i) Hiring regulations and minimum wage 4.66 3.30 3.33 3.33<br />
(ii) Hiring and firing regulations 8.80 4.15 4.73 4.29<br />
(iii) Centralized collective bargaining 8.67 7.87 6.62 6.37<br />
(iv) Hours regulations 6.00 8.00 8.00<br />
(v) Mandated cost of worker dismissal 9.44 9.60 9.60<br />
(vi) Conscription 1.00 0.00 0.00 1.00 3.00 3.00 10.00 10.00<br />
C. Business regulations 5.73 6.64 6.40 5.85<br />
(i) Administrative requirements 6.63 3.50 3.20 3.08<br />
(ii) Bureaucracy costs 7.50 7.04 5.56 4.39<br />
(iii) Starting a business 3.60 9.60 9.65 9.52<br />
(iv) Extra payments/bribes/favoritism 5.18 5.18 5.40 4.49<br />
(v) Licensing restrictions 6.72 7.07 6.11<br />
(vi) Cost of tax compliance 7.84 7.51 7.51<br />
www.freetheworld.com • www.fraserinstitute.org • Fraser Institute ©2012
140 • <strong>Economic</strong> <strong>Freedom</strong> of the <strong>World</strong>: 2012 Annual Report<br />
Russia<br />
Fraser Institute ©2012 • www.fraserinstitute.org • www.freetheworld.com<br />
1980 1985 1990 1995 2000 2005 2009 2010<br />
Chain-Linked Rating (Rank) Rating (Rank) Rating (Rank) Rating (Rank) Rating (Rank) Rating (Rank) Rating (Rank) Rating (Rank)<br />
Summary Rating (Rank) 4.43 (108) 5.15 (113) 6.08 (95) 6.23 (94) 6.35 (95)<br />
Area 1. Size of Government 1.14 (108) 1.06 (112) 1.13 (114) 6.78 (35) 6.77 (44) 7.24 (41) 6.66 (45) 6.75 (50)<br />
Area 2. Legal System and Property Rights 3.54 (110) 4.45 (93) 4.51 (87) 4.55 (88) 4.43 (92)<br />
Area 3. Sound Money 6.38 (46) 6.52 (63) 5.95 (74) 1.25 (117) 3.66 (115) 6.69 (96) 8.30 (64) 8.47 (65)<br />
Area 4. <strong>Freedom</strong> to Trade Internationally 6.44 (64) 6.23 (81) 5.99 (90) 5.74 (97) 6.32 (91)<br />
Area 5. Regulation 1.08 (101) 1.08 (106) 1.08 (115) 4.19 (113) 4.64 (112) 6.13 (91) 6.13 (97) 6.07 (96)<br />
Unadjusted<br />
Summary Rating (Rank) 4.33 (111) 5.15 (113) 6.24 (99) 6.44 (95) 6.56 (95)<br />
Rating (Data) Rating (Data) Rating (Data) Rating (Data) Rating (Data) Rating (Data) Rating (Data) Rating (Data)<br />
Area 1. Size of Government 1.66 1.54 1.24 6.78 6.77 7.24 6.66 6.75<br />
A. Government consumption 3.03 (29.70) 2.65 (31.00) 2.99 (29.84) 3.74 (27.30) 5.01 (22.96) 4.40 (25.06) 3.35 (28.61) 3.45 (28.27)<br />
B. Transfers and subsidies 1.96 (30.00) 1.96 (30.00) 1.96 (30.00) 7.90 (8.20) 6.56 (13.11) 7.05 (11.33) 4.80 (19.58) 5.07 (18.61)<br />
C. Government enterprises and investment 0.00 (90.00) 10.00 (11.10) 10.00 (10.30) 10.00 (14.50) 10.00 (14.69) 10.00 (12.81)<br />
D. Top marginal tax rate 0.00 0.00 0.00 5.50 5.50 7.50 8.50 8.50<br />
(i) Top marginal income tax rate 0.00 (100) 0.00 (100) 0.00 (80) 8.00 (30) 8.00 (30) 10.00 (13) 10.00 (13) 10.00 (13)<br />
(ii) Top marginal income and payroll tax rate 3.00 (51) 3.00 (50) 5.00 (39) 7.00 (35) 7.00 (35)<br />
Area 2. Legal System and Property Rights 3.43 4.45 5.21 5.42 5.27<br />
A. Judicial independence 3.48 3.51 2.14 2.87 2.66<br />
B. Impartial courts 4.20 5.18 2.78 3.13 2.88<br />
C. Protection of property rights 1.56 1.88 3.63 3.23 3.02<br />
D. Military interference in rule of law and politics 4.49 6.67 7.50 7.50 7.50<br />
E. Integrity of the legal system 5.00 6.67 6.67 6.67<br />
F. Legal enforcement of contracts 7.53 7.53 7.53<br />
G. Regulatory restrictions on sale of real property 8.92 9.15 9.12<br />
H. Reliability of police 3.28 2.89 5.31<br />
I. Business costs of crime 4.49 5.76 2.72<br />
Area 3. Sound Money 5.72 6.52 5.95 1.25 3.66 6.69 8.30 8.47<br />
A. Money growth 7.88 (10.60) 8.08 (9.60) 8.06 (9.70) 0.00 (401.40) 2.19 (39.06) 5.31 (23.43) 8.28 (8.60) 7.77 (11.14)<br />
B. Standard deviation of inflation 9.28 (1.80) 9.44 (1.40) 8.92 (2.70) 0.00 (522.92) 1.61 (20.98) 8.97 (2.57) 7.23 (6.92) 7.47 (6.33)<br />
C. Inflation: most recent year 8.54 (7.30) 6.82 (15.90) 0.00 (170.74) 5.84 (20.78) 7.46 (12.68) 7.67 (11.65) 8.63 (6.86)<br />
D. <strong>Freedom</strong> to own foreign currency bank accounts 0.00 0.00 0.00 5.00 5.00 5.00 10.00 10.00<br />
Area 4. <strong>Freedom</strong> to Trade Internationally 6.11 6.23 5.76 5.53 6.08<br />
A. Tariffs 6.60 7.00 5.08 4.05 4.59<br />
(i) Revenue from trade taxes (% of trade sector) 7.07 (4.40) 6.92 (4.62) 1.17 (13.24) 0.00 (19.40) 0.00 (20.30)<br />
(ii) Mean tariff rate 7.70 (11.50) 7.48 (12.60) 8.08 (9.60) 7.90 (10.50) 8.10 (9.50)<br />
(iii) Standard deviation of tariff rates 5.04 (12.40) 6.60 (8.50) 5.99 (10.03) 4.25 (14.39) 5.67 (10.83)<br />
B. Regulatory trade barriers 4.32 5.06 4.83 4.54 5.94<br />
(i) Non-tariff trade barriers 4.32 3.78 4.76 4.17 4.12<br />
(ii) Compliance cost of importing and exporting 6.33 4.90 4.90 7.75<br />
C. Black-market exchange rates 0.00 0.00 0.00 10.00 10.00 10.00 10.00 10.00<br />
D. Controls of the movement of capital and people 0.00 0.00 0.00 3.54 2.86 3.14 3.53 3.81<br />
(i) Foreign ownership/investment restrictions 5.08 5.71 4.22 4.21 4.23<br />
(ii) Capital controls 0.00 0.00 0.00 2.00 0.00 3.85 5.00 5.83<br />
(iii) <strong>Freedom</strong> of foreigners to visit 1.36 1.36 1.36<br />
Area 5. Regulation 2.47 2.47 1.00 4.08 4.64 6.31 6.31 6.24<br />
A. Credit market regulations 0.00 0.00 0.17 5.02 4.29 8.00 8.33 7.77<br />
(i) Ownership of banks 0.00 0.00 0.00 2.00 2.00 5.00 5.00 5.00<br />
(ii) Private sector credit 0.50 5.05 5.88 10.00 10.00 9.30<br />
(iii) Interest rate controls/negative real interest rates 0.00 0.00 0.00 8.00 5.00 9.00 10.00 9.00<br />
B. Labor market regulations 1.84 4.00 4.50 5.98 6.10 6.05<br />
(i) Hiring regulations and minimum wage 6.00 2.58 6.70 5.00 5.00<br />
(ii) Hiring and firing regulations 1.03 1.03 6.08 6.75 4.76 4.55<br />
(iii) Centralized collective bargaining 4.49 7.24 8.30 8.02 6.67 6.57<br />
(iv) Hours regulations 5.72 5.51 6.00 8.00 8.00<br />
(v) Mandated cost of worker dismissal 8.42 9.20 9.20<br />
(vi) Conscription 0.00 0.00 0.00 0.00 0.00 0.00 3.00 3.00<br />
C. Business regulations 3.23 5.14 4.94 4.48 4.90<br />
(i) Administrative requirements 6.22 2.06 2.45 2.36<br />
(ii) Bureaucracy costs 4.79 5.00 3.60 5.50 3.36<br />
(iii) Starting a business 3.52 4.00 8.97 9.00 9.01<br />
(iv) Extra payments/bribes/favoritism 1.40 5.36 5.59 3.53 3.23<br />
(v) Licensing restrictions 4.43 0.00 4.67<br />
(vi) Cost of tax compliance 4.98 6.41 6.75
Rwanda<br />
Country Data Tables • 141<br />
1980 1985 1990 1995 2000 2005 2009 2010<br />
Chain-Linked Rating (Rank) Rating (Rank) Rating (Rank) Rating (Rank) Rating (Rank) Rating (Rank) Rating (Rank) Rating (Rank)<br />
Summary Rating (Rank) 5.02 (80) 3.78 (119) 5.40 (106) 5.85 (104) 6.73 (69) 7.25 (44)<br />
Area 1. Size of Government 4.94 (57) 5.08 (53) 6.59 (27) 6.32 (51) 7.39 (23) 6.50 (67) 5.62 (84) 5.57 (86)<br />
Area 2. Legal System and Property Rights 1.14 (119) 1.16 (123) 1.84 (121) 3.60 (106) 3.58 (108)<br />
Area 3. Sound Money 6.45 (42) 6.76 (48) 6.06 (71) 3.17 (107) 7.44 (70) 7.75 (74) 7.55 (82) 9.05 (46)<br />
Area 4. <strong>Freedom</strong> to Trade Internationally<br />
Area 5. Regulation 5.62 (47) 5.72 (48) 5.65 (60) 4.37 (107) 5.62 (95) 6.81 (61) 8.31 (5) 8.52 (5)<br />
Unadjusted<br />
Summary Rating (Rank) 4.60 (71) 4.99 (79) 3.95 (117) 5.61 (102) 5.84 (121) 6.81 (78) 7.33 (45)<br />
Rating (Data) Rating (Data) Rating (Data) Rating (Data) Rating (Data) Rating (Data) Rating (Data) Rating (Data)<br />
Area 1. Size of Government 5.95 4.08 6.59 6.32 7.39 6.50 5.62 5.57<br />
A. Government consumption 7.93 (13.04) 8.15 (12.28) 8.59 (10.81) 9.42 (7.98) 8.63 (10.66) 7.96 (12.94) 7.31 (15.15) 7.17 (15.63)<br />
B. Transfers and subsidies 9.92 (0.80) 9.18 (3.50) 9.54 (2.20) 9.54 (2.20) 9.54 (2.20) 9.54 (2.20) 9.54 (2.20)<br />
C. Government enterprises and investment<br />
D. Top marginal tax rate<br />
(i) Top marginal income tax rate<br />
(ii) Top marginal income and payroll tax rate<br />
0.00 (100.00) 0.00 (100.00) 2.00 (40.46) 0.00 (60.25) 4.00 (33.90) 2.00 (42.15) 0.00 (51.17) 0.00 (51.17)<br />
Area 2. Legal System and Property Rights 2.38 1.98 3.02 6.76 6.72<br />
A. Judicial independence 6.80 7.02<br />
B. Impartial courts 3.43 3.48 3.80 5.54 6.11<br />
C. Protection of property rights 6.59 6.82<br />
D. Military interference in rule of law and politics 0.00 3.10 5.40 6.00<br />
E. Integrity of the legal system 0.00 0.00<br />
F. Legal enforcement of contracts 3.35 3.95 3.95<br />
G. Regulatory restrictions on sale of real property 1.84 8.83 7.46<br />
H. Reliability of police 8.03 8.24<br />
I. Business costs of crime 8.97 8.15<br />
Area 3. Sound Money 6.45 6.76 6.06 3.17 7.44 7.75 7.55 9.05<br />
A. Money growth 8.44 (7.78) 10.00 (0.01) 9.59 (−2.07) 4.43 (27.87) 8.62 (6.88) 9.94 (0.31) 8.86 (5.71) 8.86 (5.71)<br />
B. Standard deviation of inflation 7.99 (5.03) 7.97 (5.07) 7.34 (6.65) 3.27 (16.82) 6.98 (7.56) 7.86 (5.35) 8.40 (3.99) 7.81 (5.48)<br />
C. Inflation: most recent year 9.39 (3.06) 9.09 (4.56) 7.31 (13.46) 0.00 (54.20) 9.14 (4.29) 8.20 (9.01) 7.93 (10.36) 9.54 (2.31)<br />
D. <strong>Freedom</strong> to own foreign currency bank accounts 0.00 0.00 0.00 5.00 5.00 5.00 5.00 10.00<br />
Area 4. <strong>Freedom</strong> to Trade Internationally 0.38 1.64 3.50 4.79 6.04 7.02<br />
A. Tariffs 1.13 0.53 1.10 6.30 6.15 6.40<br />
(i) Revenue from trade taxes (% of trade sector) 1.13 (13.30) 0.53 (14.20) 0.27 (14.60)<br />
(ii) Mean tariff rate 3.04 (34.80) 6.56 (17.20) 6.26 (18.70) 7.50 (12.50)<br />
(iii) Standard deviation of tariff rates 0.00 (33.10) 6.04 (9.91) 6.04 (9.91) 5.30 (11.75)<br />
B. Regulatory trade barriers 0.13 4.72 6.11<br />
(i) Non-tariff trade barriers 4.33 5.16<br />
(ii) Compliance cost of importing and exporting 0.13 5.11 7.06<br />
C. Black-market exchange rates 0.00 0.20 4.40 9.40 10.00 10.00 10.00 10.00<br />
D. Controls of the movement of capital and people 0.00 0.00 0.00 0.00 1.54 2.72 3.31 5.57<br />
(i) Foreign ownership/investment restrictions 6.03 6.67<br />
(ii) Capital controls 0.00 0.00 0.00 0.00 1.54 3.85 2.31 8.46<br />
(iii) <strong>Freedom</strong> of foreigners to visit 1.59 1.59 1.59<br />
Area 5. Regulation 5.62 5.72 5.65 4.37 5.62 7.16 8.09 8.30<br />
A. Credit market regulations 5.01 5.26 5.08 1.68 5.01 7.35 8.55 8.55<br />
(i) Ownership of banks 0.00 0.00 0.00 0.00 0.00 8.00 8.00 8.00<br />
(ii) Private sector credit 9.03 7.79 5.24 5.04 5.04 5.04 8.65 8.65<br />
(iii) Interest rate controls/negative real interest rates 6.00 8.00 10.00 0.00 10.00 9.00 9.00 9.00<br />
B. Labor market regulations 7.30 8.47 8.48<br />
(i) Hiring regulations and minimum wage 5.60 8.90 10.00<br />
(ii) Hiring and firing regulations 5.93 5.48<br />
(iii) Centralized collective bargaining 7.99 7.42<br />
(iv) Hours regulations 6.00 10.00 10.00<br />
(v) Mandated cost of worker dismissal 7.59 7.99 7.99<br />
(vi) Conscription 10.00 10.00 10.00 10.00 10.00 10.00 10.00 10.00<br />
C. Business regulations 6.83 7.25 7.88<br />
(i) Administrative requirements 6.72 6.97<br />
(ii) Bureaucracy costs 4.08 7.04<br />
(iii) Starting a business 7.51 9.81 9.85<br />
(iv) Extra payments/bribes/favoritism 7.46 7.39<br />
(v) Licensing restrictions 4.86 7.10 7.68<br />
(vi) Cost of tax compliance 8.12 8.34 8.34<br />
www.freetheworld.com • www.fraserinstitute.org • Fraser Institute ©2012
142 • <strong>Economic</strong> <strong>Freedom</strong> of the <strong>World</strong>: 2012 Annual Report<br />
Saudi Arabia<br />
Fraser Institute ©2012 • www.fraserinstitute.org • www.freetheworld.com<br />
1980 1985 1990 1995 2000 2005 2009 2010<br />
Chain-Linked Rating (Rank) Rating (Rank) Rating (Rank) Rating (Rank) Rating (Rank) Rating (Rank) Rating (Rank) Rating (Rank)<br />
Summary Rating (Rank) <br />
Area 1. Size of Government<br />
Area 2. Legal System and Property Rights<br />
Area 3. Sound Money<br />
Area 4. <strong>Freedom</strong> to Trade Internationally<br />
Area 5. Regulation<br />
Unadjusted<br />
Summary Rating (Rank) 7.06 (65)<br />
Rating (Data) Rating (Data) Rating (Data) Rating (Data) Rating (Data) Rating (Data) Rating (Data) Rating (Data)<br />
Area 1. Size of Government 5.04<br />
A. Government consumption<br />
B. Transfers and subsidies<br />
C. Government enterprises and investment<br />
0.07 (39.76)<br />
D. Top marginal tax rate 10.00<br />
(i) Top marginal income tax rate 10.00 (0)<br />
(ii) Top marginal income and payroll tax rate 10.00 (18)<br />
Area 2. Legal System and Property Rights 7.66<br />
A. Judicial independence 7.63<br />
B. Impartial courts 6.17<br />
C. Protection of property rights 7.65<br />
D. Military interference in rule of law and politics 8.33<br />
E. Integrity of the legal system 8.33<br />
F. Legal enforcement of contracts 4.01<br />
G. Regulatory restrictions on sale of real property 9.96<br />
H. Reliability of police 9.10<br />
I. Business costs of crime 7.78<br />
Area 3. Sound Money 7.51<br />
A. Money growth 8.83 (5.84)<br />
B. Standard deviation of inflation 3.71 (15.72)<br />
C. Inflation: most recent year (5.34)<br />
D. <strong>Freedom</strong> to own foreign currency bank accounts 10.00<br />
Area 4. <strong>Freedom</strong> to Trade Internationally 7.04<br />
A. Tariffs<br />
(i) Revenue from trade taxes (% of trade sector)<br />
8.20<br />
(ii) Mean tariff rate 9.04 (4.80) 9.04 (4.80)<br />
(iii) Standard deviation of tariff rates 7.35 (6.62) 7.35 (6.62)<br />
B. Regulatory trade barriers 6.93<br />
(i) Non-tariff trade barriers 7.41<br />
(ii) Compliance cost of importing and exporting 6.44<br />
C. Black-market exchange rates 10.00<br />
D. Controls of the movement of capital and people 3.04<br />
(i) Foreign ownership/investment restrictions 7.00<br />
(ii) Capital controls 1.54<br />
(iii) <strong>Freedom</strong> of foreigners to visit 0.57<br />
Area 5. Regulation 8.04<br />
A. Credit market regulations 7.92<br />
(i) Ownership of banks 8.00<br />
(ii) Private sector credit<br />
(iii) Interest rate controls/negative real interest rates<br />
7.84<br />
B. Labor market regulations 7.96<br />
(i) Hiring regulations and minimum wage 10.00<br />
(ii) Hiring and firing regulations 6.83<br />
(iii) Centralized collective bargaining 7.98<br />
(iv) Hours regulations 10.00<br />
(v) Mandated cost of worker dismissal 2.97<br />
(vi) Conscription 10.00<br />
C. Business regulations 8.24<br />
(i) Administrative requirements 5.64<br />
(ii) Bureaucracy costs 7.36<br />
(iii) Starting a business 9.78<br />
(iv) Extra payments/bribes/favoritism 7.87<br />
(v) Licensing restrictions 9.66<br />
(vi) Cost of tax compliance 9.11
Senegal<br />
Country Data Tables • 143<br />
1980 1985 1990 1995 2000 2005 2009 2010<br />
Chain-Linked Rating (Rank) Rating (Rank) Rating (Rank) Rating (Rank) Rating (Rank) Rating (Rank) Rating (Rank) Rating (Rank)<br />
Summary Rating (Rank) 4.43 (78) 5.17 (56) 5.31 (68) 4.56 (107) 5.88 (92) 5.72 (108) 5.73 (109) 5.63 (115)<br />
Area 1. Size of Government 4.15 (74) 6.17 (20) 6.96 (20) 5.67 (74) 7.08 (31) 6.05 (83) 5.42 (90) 5.40 (94)<br />
Area 2. Legal System and Property Rights 3.41 (62) 3.99 (76) 3.99 (76) 3.13 (112) 4.55 (89) 4.30 (93) 4.29 (97) 4.20 (97)<br />
Area 3. Sound Money 6.36 (47) 6.76 (47) 6.93 (51) 5.80 (77) 7.28 (72) 7.11 (85) 7.02 (92) 7.03 (92)<br />
Area 4. <strong>Freedom</strong> to Trade Internationally 3.68 (59) 4.38 (57) 3.92 (79) 4.02 (105) 6.11 (84) 5.49 (106) 5.69 (99) 5.49 (108)<br />
Area 5. Regulation 4.84 (76) 4.62 (80) 4.87 (84) 4.24 (111) 4.38 (116) 5.58 (105) 6.06 (98) 5.94 (104)<br />
Unadjusted<br />
Summary Rating (Rank) 5.01 (59) 5.03 (66) 5.16 (69) 4.48 (107) 5.86 (91) 5.82 (123) 5.98 (117) 5.88 (123)<br />
Rating (Data) Rating (Data) Rating (Data) Rating (Data) Rating (Data) Rating (Data) Rating (Data) Rating (Data)<br />
Area 1. Size of Government 6.36 5.32 6.01 4.89 7.08 6.05 5.42 5.40<br />
A. Government consumption 6.08 (19.34) 6.97 (16.31) 7.02 (16.13) 7.68 (13.90) 8.32 (11.70) 8.48 (11.18) 8.98 (9.45) 8.90 (9.75)<br />
B. Transfers and subsidies 8.99 (4.20) 10.00 (0.43) 8.71 (5.24) 8.71 (5.24) 8.71 (5.24)<br />
C. Government enterprises and investment 4.00 (32.20) 8.00 (18.20) 7.00 (22.60) 7.00 (21.50) 7.00 (20.10) 4.00 (33.56) 4.00 (36.20) 4.00 (37.24)<br />
D. Top marginal tax rate 1.00 4.00 0.00 3.00 3.00 0.00 0.00<br />
(i) Top marginal income tax rate 1.00 (65) 4.00 (48) 0.00 (64) 3.00 (50) 3.00 (50) 0.00 (61) 0.00 (61)<br />
(ii) Top marginal income and payroll tax rate 4.00 (48) 0.00 (64) 3.00 (50) 3.00 (50) 0.00 (61) 0.00 (61)<br />
Area 2. Legal System and Property Rights 3.41 3.99 3.99 3.40 4.43 3.82 4.49 4.39<br />
A. Judicial independence 3.49 2.92<br />
B. Impartial courts 5.39 5.33 5.10 4.08 3.76<br />
C. Protection of property rights 5.07 5.17<br />
D. Military interference in rule of law and politics 3.99 3.33 3.33 3.33 3.33<br />
E. Integrity of the legal system 0.00 5.00 5.00 5.00 5.00<br />
F. Legal enforcement of contracts 3.39 3.39 3.39<br />
G. Regulatory restrictions on sale of real property 2.26 2.69 2.69<br />
H. Reliability of police 5.39 8.10<br />
I. Business costs of crime 7.94 5.12<br />
Area 3. Sound Money 6.36 6.76 6.93 5.80 7.28 7.11 7.02 7.03<br />
A. Money growth 8.79 (6.05) 9.54 (2.30) 8.94 (−5.32) 8.73 (6.34) 9.45 (2.74) 9.42 (2.89) 9.32 (3.41) 9.43 (2.85)<br />
B. Standard deviation of inflation 8.95 (2.63) 9.38 (1.55) 9.01 (2.47) 5.65 (10.87) 9.82 (0.44) 9.34 (1.64) 8.98 (2.54) 8.93 (2.68)<br />
C. Inflation: most recent year 7.69 (11.53) 8.14 (9.30) 9.76 (1.19) 8.82 (5.92) 9.85 (0.73) 9.66 (1.70) 9.79 (−1.05) 9.75 (1.25)<br />
D. <strong>Freedom</strong> to own foreign currency bank accounts 0.00 0.00 0.00 0.00 0.00 0.00 0.00 0.00<br />
Area 4. <strong>Freedom</strong> to Trade Internationally 4.00 4.38 3.92 4.02 6.11 6.40 6.74 6.50<br />
A. Tariffs 2.40 3.33 2.57 2.25 6.02 6.10 6.25 6.25<br />
(i) Revenue from trade taxes (% of trade sector) 2.40 (11.40) 4.47 (8.30) 2.13 (11.80) 1.33 (13.00) 4.44 (8.34) 3.83 (9.25) 3.83 (9.25) 3.83 (9.25)<br />
(ii) Mean tariff rate 2.20 (39.00) 3.00 (35.00) 3.16 (34.20) 7.60 (12.00) 7.20 (14.00) 7.62 (11.90) 7.62 (11.90)<br />
(iii) Standard deviation of tariff rates 7.26 (6.84) 7.29 (6.78) 7.29 (6.78)<br />
B. Regulatory trade barriers 6.86 7.11 5.91<br />
(i) Non-tariff trade barriers 5.86 5.20<br />
(ii) Compliance cost of importing and exporting 6.86 8.37 6.63<br />
C. Black-market exchange rates 9.60 9.80 9.20 9.80 10.00 10.00 10.00 10.00<br />
D. Controls of the movement of capital and people 0.00 0.00 0.00 0.00 2.31 2.65 3.60 3.86<br />
(i) Foreign ownership/investment restrictions 5.50 6.26<br />
(ii) Capital controls 0.00 0.00 0.00 0.00 2.31 0.77 0.77 0.77<br />
(iii) <strong>Freedom</strong> of foreigners to visit 4.54 4.54 4.54<br />
Area 5. Regulation 4.91 4.68 4.94 4.30 4.38 5.72 6.23 6.10<br />
A. Credit market regulations 6.46 5.86 6.53 4.84 5.68 8.84 8.83 8.84<br />
(i) Ownership of banks 2.00 2.00 2.00 2.00 2.00 10.00 10.00 10.00<br />
(ii) Private sector credit 9.37 9.57 9.60 8.53 9.37 8.52 8.49 8.51<br />
(iii) Interest rate controls/negative real interest rates 8.00 6.00 8.00 4.00 8.00 8.00 8.00<br />
B. Labor market regulations 3.49 4.59 4.55<br />
(i) Hiring regulations and minimum wage 2.80 3.90 3.90<br />
(ii) Hiring and firing regulations 4.85 4.83<br />
(iii) Centralized collective bargaining 5.93 5.69<br />
(iv) Hours regulations 4.70 6.00 6.00<br />
(v) Mandated cost of worker dismissal 6.48 6.89 6.89<br />
(vi) Conscription 0.00 0.00 0.00 0.00 0.00 0.00 0.00 0.00<br />
C. Business regulations 4.84 5.26 4.92<br />
(i) Administrative requirements 4.03 3.71<br />
(ii) Bureaucracy costs 5.55 4.09<br />
(iii) Starting a business 6.08 8.41 8.46<br />
(iv) Extra payments/bribes/favoritism 4.36 4.04<br />
(v) Licensing restrictions 6.24 6.66 6.71<br />
(vi) Cost of tax compliance 2.20 2.53 2.53<br />
www.freetheworld.com • www.fraserinstitute.org • Fraser Institute ©2012
144 • <strong>Economic</strong> <strong>Freedom</strong> of the <strong>World</strong>: 2012 Annual Report<br />
Serbia<br />
Fraser Institute ©2012 • www.fraserinstitute.org • www.freetheworld.com<br />
1980 1985 1990 1995 2000 2005 2009 2010<br />
Chain-Linked Rating (Rank) Rating (Rank) Rating (Rank) Rating (Rank) Rating (Rank) Rating (Rank) Rating (Rank) Rating (Rank)<br />
Summary Rating (Rank) <br />
Area 1. Size of Government<br />
Area 2. Legal System and Property Rights<br />
Area 3. Sound Money<br />
Area 4. <strong>Freedom</strong> to Trade Internationally<br />
Area 5. Regulation<br />
Unadjusted<br />
Summary Rating (Rank) 5.96 (114) 6.48 (92) 6.41 (102)<br />
Rating (Data) Rating (Data) Rating (Data) Rating (Data) Rating (Data) Rating (Data) Rating (Data) Rating (Data)<br />
Area 1. Size of Government 6.47 5.85 5.78<br />
A. Government consumption 5.60 (20.95) 5.76 (20.42) 5.74 (20.50)<br />
B. Transfers and subsidies 4.26 (21.56) 4.14 (21.99) 3.88 (22.96)<br />
C. Government enterprises and investment 10.00 (14.06) 6.00 (15.01) 6.00 (15.46)<br />
D. Top marginal tax rate 6.00 7.50 7.50<br />
(i) Top marginal income tax rate 10.00 (15) 10.00 (15) 10.00 (15)<br />
(ii) Top marginal income and payroll tax rate 2.00 (53) 5.00 (37) 5.00 (37)<br />
Area 2. Legal System and Property Rights 4.78 4.76 4.92<br />
A. Judicial independence 2.45 2.55 2.38<br />
B. Impartial courts 2.94 2.71 2.59<br />
C. Protection of property rights 4.62 3.68 3.54<br />
D. Military interference in rule of law and politics 6.67 6.67 6.67<br />
E. Integrity of the legal system 5.83 5.83 5.83<br />
F. Legal enforcement of contracts 3.95 3.92 3.78<br />
G. Regulatory restrictions on sale of real property 6.13 7.39 8.87<br />
H. Reliability of police 4.49 4.38 5.85<br />
I. Business costs of crime 5.96 5.71 4.78<br />
Area 3. Sound Money 4.55 7.72 7.94<br />
A. Money growth 6.40 (17.99) 8.91 (5.44) 9.37 (3.17)<br />
B. Standard deviation of inflation 0.00 (32.54) 8.52 (3.69) 8.63 (3.42)<br />
C. Inflation: most recent year 6.78 (16.10) 8.44 (7.78) 8.77 (6.14)<br />
D. <strong>Freedom</strong> to own foreign currency bank accounts 5.00 5.00 5.00<br />
Area 4. <strong>Freedom</strong> to Trade Internationally 7.18 7.25 7.03<br />
A. Tariffs 7.75 7.91 8.05<br />
(i) Revenue from trade taxes (% of trade sector) 7.47 (3.80) 8.03 (2.96) 8.49 (2.27)<br />
(ii) Mean tariff rate 8.36 (8.20) 8.54 (7.30) 8.52 (7.40)<br />
(iii) Standard deviation of tariff rates 7.43 (6.42) 7.17 (7.08) 7.13 (7.18)<br />
B. Regulatory trade barriers 6.83 6.99 6.24<br />
(i) Non-tariff trade barriers 5.37 5.70 5.35<br />
(ii) Compliance cost of importing and exporting 8.28 8.28 7.13<br />
C. Black-market exchange rates 10.00 10.00 10.00<br />
D. Controls of the movement of capital and people 4.13 4.08 3.86<br />
(i) Foreign ownership/investment restrictions 5.37 5.24 4.57<br />
(ii) Capital controls 0.77 0.77 0.77<br />
(iii) <strong>Freedom</strong> of foreigners to visit 6.24 6.24 6.24<br />
Area 5. Regulation 6.83 6.83 6.38<br />
A. Credit market regulations 9.39 9.50 8.50<br />
(i) Ownership of banks 10.00 10.00 8.00<br />
(ii) Private sector credit 9.16 8.49 7.51<br />
(iii) Interest rate controls/negative real interest rates 9.00 10.00 10.00<br />
B. Labor market regulations 5.90 5.71 5.70<br />
(i) Hiring regulations and minimum wage 3.30 2.23 2.23<br />
(ii) Hiring and firing regulations 5.00 4.61 4.38<br />
(iii) Centralized collective bargaining 7.12 6.79 6.95<br />
(iv) Hours regulations 9.30 10.00 10.00<br />
(v) Mandated cost of worker dismissal 7.68 7.66 7.66<br />
(vi) Conscription 3.00 3.00 3.00<br />
C. Business regulations 5.19 5.27 4.95<br />
(i) Administrative requirements 1.72 2.22 2.23<br />
(ii) Bureaucracy costs 5.14 5.76 3.80<br />
(iii) Starting a business 9.13 9.48 9.48<br />
(iv) Extra payments/bribes/favoritism 5.68 4.20 3.83<br />
(v) Licensing restrictions 2.59 3.07 3.47<br />
(vi) Cost of tax compliance 6.87 6.87 6.87
Sierra Leone<br />
Country Data Tables • 145<br />
1980 1985 1990 1995 2000 2005 2009 2010<br />
Chain-Linked Rating (Rank) Rating (Rank) Rating (Rank) Rating (Rank) Rating (Rank) Rating (Rank) Rating (Rank) Rating (Rank)<br />
Summary Rating (Rank) 4.97 (62) 3.67 (96) 3.86 (103) 4.33 (111) 5.23 (112) 6.06 (96) 6.28 (90) 6.43 (88)<br />
Area 1. Size of Government 7.79 (8) 7.71 (4) 6.67 (26) 6.23 (56) 5.83 (75) 7.28 (39) 5.87 (76) 6.68 (52)<br />
Area 2. Legal System and Property Rights 5.25 (53) 5.30 (55) 2.08 (116) 3.30 (114) 4.57 (85) 5.74 (70) 5.81 (65)<br />
Area 3. Sound Money 6.02 (67) 0.42 (110) 0.06 (117) 3.81 (103) 6.47 (99) 6.32 (106) 7.54 (83) 7.02 (93)<br />
Area 4. <strong>Freedom</strong> to Trade Internationally 0.60 (89) 0.69 (94) 2.46 (94) 4.57 (101) 4.33 (118) 5.72 (97) 5.72 (98) 5.90 (100)<br />
Area 5. Regulation 5.49 (50) 4.29 (87) 4.84 (86) 4.96 (91) 6.25 (63) 6.29 (85) 6.72 (71) 6.89 (56)<br />
Unadjusted<br />
Summary Rating (Rank) 4.79 (67) 3.76 (95) 3.86 (103) 4.47 (108) 5.28 (110) 5.65 (127) 5.85 (126) 5.99 (121)<br />
Rating (Data) Rating (Data) Rating (Data) Rating (Data) Rating (Data) Rating (Data) Rating (Data) Rating (Data)<br />
Area 1. Size of Government 6.65 7.71 6.67 6.23 5.83 7.28 5.87 6.68<br />
A. Government consumption 9.29 (8.40) 9.15 (8.90) 8.30 (11.78) 7.72 (13.75) 7.79 (13.50) 7.83 (13.37) 7.62 (14.09) 8.04 (12.67)<br />
B. Transfers and subsidies 9.97 (0.60) 9.70 (1.60) 8.96 (4.30) 9.71 (1.57) 10.00 (0.00) 10.00 (0.00) 10.00 (0.00)<br />
C. Government enterprises and investment 4.00 (35.80) 4.00 (31.00) 2.00 (40.40) 2.00 (46.43) 0.00 (75.30) 4.00 (33.40) 0.00 (50.79) 2.00 (49.10)<br />
D. Top marginal tax rate<br />
(i) Top marginal income tax rate<br />
(ii) Top marginal income and payroll tax rate<br />
Area 2. Legal System and Property Rights<br />
A. Judicial independence<br />
5.25 5.30 2.64 3.52 3.15 3.95 4.00<br />
B. Impartial courts<br />
C. Protection of property rights<br />
3.96 4.89 3.60 3.80 3.90<br />
D. Military interference in rule of law and politics 2.27 0.00 4.17 4.17 4.17<br />
E. Integrity of the legal system 0.00 5.00 5.83 5.83 5.83<br />
F. Legal enforcement of contracts 1.58 1.58 1.58<br />
G. Regulatory restrictions on sale of real property<br />
H. Reliability of police<br />
I. Business costs of crime<br />
0.56 4.36 4.50<br />
Area 3. Sound Money 6.02 0.42 0.06 3.81 6.47 6.32 7.54 7.02<br />
A. Money growth 7.16 (14.22) 1.69 (41.56) 0.24 (48.82) 6.93 (15.37) 4.37 (28.16) 5.91 (20.44) 8.22 (8.92) 7.73 (11.34)<br />
B. Standard deviation of inflation 8.90 (2.76) 0.00 (26.10) 0.00 (29.16) 0.00 (26.09) 6.67 (8.33) 6.78 (8.04) 8.80 (3.01) 8.68 (3.30)<br />
C. Inflation: most recent year 8.02 (9.90) 0.00 (85.08) 0.00 (89.15) 3.30 (33.49) 9.83 (−0.84) 7.59 (12.05) 8.15 (9.25) 6.67 (16.64)<br />
D. <strong>Freedom</strong> to own foreign currency bank accounts 0.00 0.00 0.00 5.00 5.00 5.00 5.00 5.00<br />
Area 4. <strong>Freedom</strong> to Trade Internationally 1.00 1.15 2.46 4.69 4.33 5.93 5.93 6.12<br />
A. Tariffs 2.99 3.45 7.37 4.48 3.37 5.63 5.69 5.69<br />
(i) Revenue from trade taxes (% of trade sector) 1.13 (13.30) 2.07 (11.90) 7.37 (3.95) 4.11 (8.83) 3.37 (9.95) 3.32 (10.02) 3.49 (9.76) 3.49 (9.76)<br />
(ii) Mean tariff rate 4.84 (25.80) 4.84 (25.80) 4.84 (25.80) 7.28 (13.60) 7.28 (13.60) 7.28 (13.60)<br />
(iii) Standard deviation of tariff rates 6.30 (9.25) 6.30 (9.25) 6.30 (9.25)<br />
B. Regulatory trade barriers<br />
(i) Non-tariff trade barriers<br />
5.44 6.05 6.81<br />
(ii) Compliance cost of importing and exporting 5.44 6.05 6.81<br />
C. Black-market exchange rates 0.00 0.00 0.00 9.60 5.00 10.00 10.00 10.00<br />
D. Controls of the movement of capital and people<br />
(i) Foreign ownership/investment restrictions<br />
0.00 0.00 0.00 0.00 4.61 2.66 1.99 1.99<br />
(ii) Capital controls 0.00 0.00 0.00 0.00 4.61 3.85 2.50 2.50<br />
(iii) <strong>Freedom</strong> of foreigners to visit 1.47 1.47 1.47<br />
Area 5. Regulation 5.49 4.29 4.84 4.96 6.25 5.59 5.98 6.13<br />
A. Credit market regulations 4.67 1.47 2.94 3.25 6.67 5.31 5.66 5.66<br />
(i) Ownership of banks 2.00 2.00 2.00 2.00 2.00 2.00 2.00 2.00<br />
(ii) Private sector credit 6.02 2.40 6.82 5.76 10.00 4.94 5.98 5.98<br />
(iii) Interest rate controls/negative real interest rates 6.00 0.00 0.00 2.00 8.00 9.00 9.00 9.00<br />
B. Labor market regulations 5.68 5.39 5.67<br />
(i) Hiring regulations and minimum wage<br />
(ii) Hiring and firing regulations<br />
(iii) Centralized collective bargaining<br />
6.70 5.57 6.67<br />
(iv) Hours regulations 6.00 6.00 6.00<br />
(v) Mandated cost of worker dismissal 0.00 0.00 0.00<br />
(vi) Conscription 10.00 10.00 10.00 10.00 10.00 10.00 10.00 10.00<br />
C. Business regulations<br />
(i) Administrative requirements<br />
(ii) Bureaucracy costs<br />
5.79 6.88 7.06<br />
(iii) Starting a business<br />
(iv) Extra payments/bribes/favoritism<br />
5.83 8.45 8.64<br />
(v) Licensing restrictions 6.00 6.19 6.54<br />
(vi) Cost of tax compliance 5.53 6.00 6.00<br />
www.freetheworld.com • www.fraserinstitute.org • Fraser Institute ©2012
146 • <strong>Economic</strong> <strong>Freedom</strong> of the <strong>World</strong>: 2012 Annual Report<br />
Singapore 1980 1985 1990 1995 2000 2005 2009 2010<br />
Chain-Linked Rating (Rank) Rating (Rank) Rating (Rank) Rating (Rank) Rating (Rank) Rating (Rank) Rating (Rank) Rating (Rank)<br />
Summary Rating (Rank) 7.76 (4) 8.00 (4) 8.59 (2) 8.90 (2) 8.61 (4) 8.73 (2) 8.59 (2) 8.56 (2)<br />
Area 1. Size of Government 6.98 (12) 6.59 (13) 8.22 (5) 8.39 (6) 7.97 (14) 8.00 (22) 8.12 (12) 8.06 (15)<br />
Area 2. Legal System and Property Rights 8.13 (3) 7.25 (17) 7.25 (22) 8.31 (17) 8.53 (17) 8.21 (19) 8.12 (22) 8.11 (20)<br />
Area 3. Sound Money 6.51 (39) 8.29 (25) 9.34 (15) 9.69 (11) 9.46 (22) 9.71 (2) 9.12 (44) 9.05 (47)<br />
Area 4. <strong>Freedom</strong> to Trade Internationally 8.97 (6) 9.63 (2) 9.64 (2) 9.61 (3) 9.15 (12) 9.17 (2) 9.20 (2) 8.86 (2)<br />
Area 5. Regulation 8.34 (2) 8.36 (2) 8.49 (3) 8.49 (3) 7.92 (6) 8.51 (5) 8.38 (2) 8.69 (2)<br />
Unadjusted<br />
Summary Rating (Rank) 7.42 (6) 7.65 (7) 8.49 (2) 8.88 (2) 8.61 (4) 8.86 (2) 8.72 (2) 8.69 (2)<br />
Fraser Institute ©2012 • www.fraserinstitute.org • www.freetheworld.com<br />
Rating (Data) Rating (Data) Rating (Data) Rating (Data) Rating (Data) Rating (Data) Rating (Data) Rating (Data)<br />
Area 1. Size of Government 6.98 6.59 8.22 8.39 7.97 8.00 8.12 8.06<br />
A. Government consumption 7.08 (15.93) 4.70 (24.02) 6.45 (18.06) 6.92 (16.47) 5.65 (20.80) 5.81 (20.24) 5.46 (21.42) 5.24 (22.20)<br />
B. Transfers and subsidies 9.84 (1.10) 9.65 (1.80) 9.43 (2.60) 9.65 (1.80) 9.23 (3.32) 9.17 (3.54) 10.00 (0.05) 10.00 (0.04)<br />
C. Government enterprises and investment 7.00 (24.20) 4.00 (34.70) 8.00 (18.60) 8.00 (18.60) 8.00 (18.60) 7.00 (21.30) 7.00 7.00<br />
D. Top marginal tax rate 4.00 8.00 9.00 9.00 9.00 10.00 10.00 10.00<br />
(i) Top marginal income tax rate 4.00 (55) 8.00 (40) 9.00 (33) 9.00 (30) 9.00 (28) 10.00 (21) 10.00 (20) 10.00 (20)<br />
(ii) Top marginal income and payroll tax rate 9.00 (33) 9.00 (30) 9.00 (28) 10.00 (21) 10.00 (20) 10.00 (20)<br />
Area 2. Legal System and Property Rights 8.13 7.25 7.25 8.31 8.53 8.49 8.39 8.38<br />
A. Judicial independence 7.17 7.35 7.01 7.73 7.73<br />
B. Impartial courts 7.05 7.68 7.97 8.03 7.99<br />
C. Protection of property rights 7.33 7.62 8.90 8.90 8.97<br />
D. Military interference in rule of law and politics 10.00 10.00 8.33 8.33 8.33<br />
E. Integrity of the legal system 10.00 10.00 8.33 8.33 8.33<br />
F. Legal enforcement of contracts 8.48 7.77 7.77<br />
G. Regulatory restrictions on sale of real property 8.91 8.99 8.99<br />
H. Reliability of police 9.17 9.05 8.30<br />
I. Business costs of crime 9.29 8.42 9.03<br />
Area 3. Sound Money 6.51 8.29 9.34 9.69 9.46 9.71 9.12 9.05<br />
A. Money growth 9.76 (1.21) 9.47 (−2.66) 9.42 (2.90) 9.89 (0.55) 9.42 (−2.88) 9.83 (0.85) 7.45 (12.77) 7.65 (11.77)<br />
B. Standard deviation of inflation 8.57 (3.57) 8.90 (2.76) 8.91 (2.73) 9.39 (1.53) 8.70 (3.24) 9.11 (2.21) 9.15 (2.13) 9.12 (2.21)<br />
C. Inflation: most recent year 7.71 (11.47) 9.78 (−1.10) 9.02 (4.92) 9.47 (2.66) 9.73 (1.36) 9.91 (0.43) 9.88 (0.60) 9.44 (2.80)<br />
D. <strong>Freedom</strong> to own foreign currency bank accounts 0.00 5.00 10.00 10.00 10.00 10.00 10.00 10.00<br />
Area 4. <strong>Freedom</strong> to Trade Internationally 9.28 9.96 9.90 9.45 9.15 9.37 9.40 9.05<br />
A. Tariffs 9.84 9.87 9.70 9.59 9.95 9.99 10.00 10.00<br />
(i) Revenue from trade taxes (% of trade sector) 9.73 (0.40) 9.80 (0.30) 9.91 (0.14) 9.93 (0.10) 9.93 (0.11) 10.00 (0.00) 10.00 (0.00) 10.00 (0.00)<br />
(ii) Mean tariff rate 9.94 (0.30) 9.94 (0.30) 9.92 (0.40) 9.92 (0.40) 9.92 (0.40) 9.98 (0.10) 10.00 (0.00) 10.00 (0.00)<br />
(iii) Standard deviation of tariff rates 9.28 (1.80) 8.92 (2.70) 10.00 (0.00) 10.00 (0.00) 10.00 (0.00) 10.00 (0.00)<br />
B. Regulatory trade barriers 8.85 9.39 9.08 9.11 7.62<br />
(i) Non-tariff trade barriers 8.85 8.79 8.60 8.73 8.50<br />
(ii) Compliance cost of importing and exporting 10.00 9.56 9.50 6.75<br />
C. Black-market exchange rates 10.00 10.00 10.00 10.00 10.00 10.00 10.00 10.00<br />
D. Controls of the movement of capital and people 8.00 10.00 10.00 9.34 7.25 8.40 8.47 8.58<br />
(i) Foreign ownership/investment restrictions 8.68 9.12 9.06 8.49 8.82<br />
(ii) Capital controls 8.00 10.00 10.00 10.00 5.38 6.15 6.92 6.92<br />
(iii) <strong>Freedom</strong> of foreigners to visit 10.00 10.00 10.00<br />
Area 5. Regulation 6.18 6.19 7.74 8.56 7.92 8.73 8.60 8.92<br />
A. Credit market regulations 9.64 9.67 10.00 10.00 10.00 10.00 10.00 10.00<br />
(i) Ownership of banks 10.00 10.00 10.00 10.00 10.00 10.00 10.00 10.00<br />
(ii) Private sector credit 8.91 9.00 10.00 10.00 10.00 10.00 10.00 10.00<br />
(iii) Interest rate controls/negative real interest rates 10.00 10.00 10.00 10.00 10.00 10.00 10.00 10.00<br />
B. Labor market regulations 5.48 6.16 5.52 7.65 7.78 7.72<br />
(i) Hiring regulations and minimum wage 7.13 4.56 10.00 10.00 10.00<br />
(ii) Hiring and firing regulations 8.50 8.50 7.17 8.15 8.20 8.03<br />
(iii) Centralized collective bargaining 7.93 7.93 7.93 7.93 8.37 8.15 8.46 8.30<br />
(iv) Hours regulations 7.25 7.52 10.00 10.00 10.00<br />
(v) Mandated cost of worker dismissal 9.63 10.00 10.00<br />
(vi) Conscription 0.00 0.00 0.00 0.00 0.00 0.00 0.00 0.00<br />
C. Business regulations 9.50 8.22 8.54 8.02 9.04<br />
(i) Administrative requirements 7.68 6.79 7.56 7.60<br />
(ii) Bureaucracy costs 9.73 8.05 6.42 2.25 8.61<br />
(iii) Starting a business 9.07 8.02 9.80 9.90 9.90<br />
(iv) Extra payments/bribes/favoritism 9.72 9.15 9.58 9.37 9.09<br />
(v) Licensing restrictions 9.22 9.96 9.97<br />
(vi) Cost of tax compliance 9.45 9.06 9.06
Slovak Republic<br />
Country Data Tables • 147<br />
1980 1985 1990 1995 2000 2005 2009 2010<br />
Chain-Linked Rating (Rank) Rating (Rank) Rating (Rank) Rating (Rank) Rating (Rank) Rating (Rank) Rating (Rank) Rating (Rank)<br />
Summary Rating (Rank) 5.55 (80) 6.20 (78) 7.64 (25) 7.39 (36) 7.46 (35)<br />
Area 1. Size of Government 2.66 (118) 2.98 (120) 6.48 (70) 5.80 (77) 6.29 (68)<br />
Area 2. Legal System and Property Rights 6.50 (45) 6.30 (56) 6.51 (53) 5.84 (66) 5.67 (69)<br />
Area 3. Sound Money 8.16 (29) 6.69 (60) 7.90 (60) 9.15 (40) 9.69 (3) 9.71 (5)<br />
Area 4. <strong>Freedom</strong> to Trade Internationally 6.98 (57) 7.92 (41) 8.49 (14) 8.39 (14) 8.36 (15)<br />
Area 5. Regulation 4.91 (93) 5.91 (86) 7.58 (19) 7.24 (33) 7.24 (35)<br />
Unadjusted<br />
Summary Rating (Rank) 5.42 (82) 6.20 (75) 7.63 (21) 7.38 (36) 7.45 (33)<br />
Rating (Data) Rating (Data) Rating (Data) Rating (Data) Rating (Data) Rating (Data) Rating (Data) Rating (Data)<br />
Area 1. Size of Government 2.39 2.98 6.48 5.80 6.29<br />
A. Government consumption 3.27 (28.89) 3.18 (29.20) 4.04 (26.26) 4.59 (24.38) 4.49 (24.73) 4.38 (25.11)<br />
B. Transfers and subsidies 3.88 (22.95) 4.82 (19.50) 4.23 (21.68) 4.29 (21.46)<br />
C. Government enterprises and investment 0.00 (75.10) 0.00 (75.10) 10.00 (7.86) 8.00 (16.78) 10.00 (12.29)<br />
D. Top marginal tax rate 4.00 4.00 6.50 6.50 6.50<br />
(i) Top marginal income tax rate 4.00 (42) 4.00 (42) 10.00 (19) 10.00 (19) 10.00 (19)<br />
(ii) Top marginal income and payroll tax rate 4.00 (42) 4.00 (44) 3.00 (48) 3.00 (48) 3.00 (48)<br />
Area 2. Legal System and Property Rights 6.50 6.30 6.63 5.95 5.78<br />
A. Judicial independence 5.08 5.01 4.30 3.17 2.77<br />
B. Impartial courts 5.43 5.18 4.37 2.43 2.13<br />
C. Protection of property rights 3.97 4.67 6.67 5.41 5.09<br />
D. Military interference in rule of law and politics 8.04 10.00 10.00 10.00 10.00<br />
E. Integrity of the legal system 10.00 6.67 6.67 6.67 6.67<br />
F. Legal enforcement of contracts 4.64 4.38 4.38<br />
G. Regulatory restrictions on sale of real property 9.65 9.68 9.68<br />
H. Reliability of police 5.77 4.60 6.64<br />
I. Business costs of crime 7.62 7.21 4.67<br />
Area 3. Sound Money 8.81 6.69 7.90 9.15 9.69 9.71<br />
A. Money growth 7.32 (13.40) 9.81 (−0.94) 7.67 (11.66) 9.56 (2.20) 9.56 (2.20)<br />
B. Standard deviation of inflation 8.99 (2.52) 6.39 (9.03) 9.20 (2.01) 9.46 (1.34) 9.52 (1.21) 9.48 (1.29)<br />
C. Inflation: most recent year 8.63 (6.86) 8.05 (9.73) 7.59 (12.04) 9.46 (2.71) 9.68 (1.62) 9.81 (0.96)<br />
D. <strong>Freedom</strong> to own foreign currency bank accounts 5.00 5.00 10.00 10.00 10.00<br />
Area 4. <strong>Freedom</strong> to Trade Internationally 6.81 7.92 8.16 8.07 8.04<br />
A. Tariffs 8.78 9.07 8.39 8.22 8.34<br />
(i) Revenue from trade taxes (% of trade sector) 9.34 (0.99) 9.59 (0.62) 9.44 (0.84) 9.63 (0.55)<br />
(ii) Mean tariff rate 8.78 (6.10) 8.80 (6.00) 9.46 (2.70) 8.94 (5.30) 8.98 (5.10)<br />
(iii) Standard deviation of tariff rates 6.13 (9.67) 6.29 (9.28) 6.41 (8.98)<br />
B. Regulatory trade barriers 4.83 7.17 7.35 7.52 7.22<br />
(i) Non-tariff trade barriers 4.83 6.67 7.94 7.48 7.01<br />
(ii) Compliance cost of importing and exporting 7.66 6.76 7.55 7.44<br />
C. Black-market exchange rates 10.00 10.00 10.00 10.00 10.00<br />
D. Controls of the movement of capital and people 3.65 5.46 6.91 6.54 6.61<br />
(i) Foreign ownership/investment restrictions 5.29 7.83 8.77 7.66 7.86<br />
(ii) Capital controls 2.00 3.08 5.38 5.38 5.38<br />
(iii) <strong>Freedom</strong> of foreigners to visit 6.58 6.58 6.58<br />
Area 5. Regulation 4.68 5.91 7.75 7.39 7.40<br />
A. Credit market regulations 5.44 7.70 9.55 9.16 9.16<br />
(i) Ownership of banks 5.00 5.00 10.00 10.00 10.00<br />
(ii) Private sector credit 5.31 8.10 8.66 7.48 7.48<br />
(iii) Interest rate controls/negative real interest rates 6.00 10.00 10.00 10.00 10.00<br />
B. Labor market regulations 4.38 4.54 7.53 7.44 7.33<br />
(i) Hiring regulations and minimum wage 6.12 4.17 8.30 6.67 6.67<br />
(ii) Hiring and firing regulations 4.92 4.92 3.00 6.83 3.97 3.71<br />
(iii) Centralized collective bargaining 5.18 7.67 8.28 7.18 6.79<br />
(iv) Hours regulations 4.68 4.84 8.00 8.00 8.00<br />
(v) Mandated cost of worker dismissal 8.79 8.79 8.79<br />
(vi) Conscription 1.00 3.00 5.00 10.00 10.00<br />
C. Business regulations 4.23 5.49 6.15 5.59 5.72<br />
(i) Administrative requirements 8.00 3.49 3.07 2.76<br />
(ii) Bureaucracy costs 4.70 4.50 5.21 2.75 4.34<br />
(iii) Starting a business 4.28 3.00 9.02 9.39 9.34<br />
(iv) Extra payments/bribes/favoritism 3.70 6.47 6.61 4.96 4.22<br />
(v) Licensing restrictions 6.21 6.21 6.24<br />
(vi) Cost of tax compliance 6.36 7.12 7.41<br />
www.freetheworld.com • www.fraserinstitute.org • Fraser Institute ©2012
148 • <strong>Economic</strong> <strong>Freedom</strong> of the <strong>World</strong>: 2012 Annual Report<br />
Slovenia 1980 1985 1990 1995 2000 2005 2009 2010<br />
Chain-Linked Rating (Rank) Rating (Rank) Rating (Rank) Rating (Rank) Rating (Rank) Rating (Rank) Rating (Rank) Rating (Rank)<br />
Summary Rating (Rank) 5.15 (95) 6.72 (57) 6.95 (60) 7.04 (58) 6.62 (78)<br />
Area 1. Size of Government 1.46 (121) 4.92 (94) 4.91 (104) 4.57 (111) 4.54 (110)<br />
Area 2. Legal System and Property Rights 8.04 (22) 7.29 (36) 6.76 (45) 7.16 (36) 6.88 (40)<br />
Area 3. Sound Money 3.12 (108) 7.49 (68) 8.79 (51) 9.63 (8) 8.30 (70)<br />
Area 4. <strong>Freedom</strong> to Trade Internationally 7.42 (46) 7.69 (49) 7.62 (46) 7.34 (52) 7.35 (52)<br />
Area 5. Regulation 5.97 (55) 6.18 (70) 6.72 (68) 6.60 (75) 6.16 (94)<br />
Unadjusted<br />
Summary Rating (Rank) 5.11 (93) 6.54 (62) 6.96 (66) 7.05 (63) 6.63 (92)<br />
Fraser Institute ©2012 • www.fraserinstitute.org • www.freetheworld.com<br />
Rating (Data) Rating (Data) Rating (Data) Rating (Data) Rating (Data) Rating (Data) Rating (Data) Rating (Data)<br />
Area 1. Size of Government 1.75 4.92 4.91 4.57 4.54<br />
A. Government consumption 4.15 (25.90) 4.17 (25.83) 3.67 (27.51) 4.04 (26.27) 3.84 (26.95) 3.81 (27.06)<br />
B. Transfers and subsidies 1.09 (33.20) 4.02 (22.44) 4.08 (22.22) 3.95 (22.72) 3.85 (23.08)<br />
C. Government enterprises and investment 0.00 (75.10) 10.00 (4.60) 10.00 (8.70) 8.00 (19.04) 8.00 (19.38)<br />
D. Top marginal tax rate 2.00 1.50 2.50 2.50<br />
(i) Top marginal income tax rate 4.00 (50) 3.00 (50) 4.00 (41) 4.00 (41)<br />
(ii) Top marginal income and payroll tax rate 0.00 (70) 0.00 (70) 1.00 (60) 1.00 (60)<br />
Area 2. Legal System and Property Rights 7.44 6.40 6.09 6.45 6.20<br />
A. Judicial independence 5.87 5.41 4.63<br />
B. Impartial courts 7.02 7.14 5.27 3.96 3.30<br />
C. Protection of property rights 5.37 6.48 6.04 5.68<br />
D. Military interference in rule of law and politics 9.22 8.33 8.33 9.17 9.17<br />
E. Integrity of the legal system 10.00 8.33 7.50 7.50 7.50<br />
F. Legal enforcement of contracts 3.87 4.23 4.23<br />
G. Regulatory restrictions on sale of real property 4.34 7.17 7.26<br />
H. Reliability of police 5.74 6.18 8.43<br />
I. Business costs of crime 7.42 8.40 5.64<br />
Area 3. Sound Money 3.12 7.49 8.79 9.63 8.30<br />
A. Money growth 0.00 (57.50) 7.62 (11.91) 6.88 (15.58) 9.19 (4.03) 9.41 (2.96)<br />
B. Standard deviation of inflation 0.00 (79.63) 9.12 (2.19) 8.78 (3.04) 9.51 (1.23) 9.16 (2.11)<br />
C. Inflation: most recent year 7.48 (12.60) 8.22 (8.88) 9.50 (2.48) 9.83 (0.86) 9.63 (1.84)<br />
D. <strong>Freedom</strong> to own foreign currency bank accounts 5.00 5.00 5.00 10.00 10.00 5.00<br />
Area 4. <strong>Freedom</strong> to Trade Internationally 7.51 7.69 7.93 7.64 7.65<br />
A. Tariffs 7.53 8.05 8.48 8.22 8.34<br />
(i) Revenue from trade taxes (% of trade sector) 7.53 (3.70) 9.48 (0.78) 9.84 (0.24) 9.44 (0.84) 9.63 (0.55)<br />
(ii) Mean tariff rate 7.64 (11.80) 9.46 (2.70) 8.94 (5.30) 8.98 (5.10)<br />
(iii) Standard deviation of tariff rates 7.04 (7.40) 6.13 (9.67) 6.29 (9.28) 6.41 (8.98)<br />
B. Regulatory trade barriers 7.38 7.23 7.17 7.38<br />
(i) Non-tariff trade barriers 7.38 7.29 6.83 6.69<br />
(ii) Compliance cost of importing and exporting 7.18 7.51 8.06<br />
C. Black-market exchange rates 0.00 10.00 10.00 10.00 10.00 10.00<br />
D. Controls of the movement of capital and people 0.00 0.00 0.00 5.00 5.30 6.01 5.18 4.90<br />
(i) Foreign ownership/investment restrictions 6.76 5.30 5.12 4.27<br />
(ii) Capital controls 0.00 0.00 0.00 5.00 3.85 6.15 3.85 3.85<br />
(iii) <strong>Freedom</strong> of foreigners to visit 6.58 6.58 6.58<br />
Area 5. Regulation 5.74 6.18 7.06 6.93 6.47<br />
A. Credit market regulations 7.65 8.18 9.14 8.50 7.50<br />
(i) Ownership of banks 5.00 5.00 8.00 8.00 5.00<br />
(ii) Private sector credit 9.94 9.55 9.42 7.51 7.50<br />
(iii) Interest rate controls/negative real interest rates 8.00 10.00 10.00 10.00 10.00<br />
B. Labor market regulations 3.60 5.56 5.97 5.42<br />
(i) Hiring regulations and minimum wage 4.02 3.90 2.23 2.23<br />
(ii) Hiring and firing regulations 2.32 2.92 2.91 2.21<br />
(iii) Centralized collective bargaining 5.05 5.55 5.38 4.74<br />
(iv) Hours regulations 4.70 8.00 6.00<br />
(v) Mandated cost of worker dismissal 6.29 7.32 7.32<br />
(vi) Conscription 3.00 3.00 10.00 10.00 10.00<br />
C. Business regulations 6.77 6.47 6.33 6.49<br />
(i) Administrative requirements 6.95 3.18 4.11 3.33<br />
(ii) Bureaucracy costs 7.80 5.38 2.83 5.59<br />
(iii) Starting a business 5.73 7.80 9.66 9.66<br />
(iv) Extra payments/bribes/favoritism 6.58 8.27 6.77 5.72<br />
(v) Licensing restrictions 7.12 7.52 7.56<br />
(vi) Cost of tax compliance 7.09 7.09 7.09
South Africa<br />
Country Data Tables • 149<br />
1980 1985 1990 1995 2000 2005 2009 2010<br />
Chain-Linked Rating (Rank) Rating (Rank) Rating (Rank) Rating (Rank) Rating (Rank) Rating (Rank) Rating (Rank) Rating (Rank)<br />
Summary Rating (Rank) 5.85 (31) 5.49 (48) 5.50 (57) 6.57 (47) 7.08 (41) 7.00 (57) 6.61 (75) 6.88 (67)<br />
Area 1. Size of Government 5.97 (26) 6.10 (24) 6.32 (36) 6.30 (52) 6.45 (53) 5.99 (87) 5.02 (98) 5.52 (89)<br />
Area 2. Legal System and Property Rights 6.18 (31) 4.46 (65) 2.93 (93) 6.11 (52) 6.54 (50) 7.19 (36) 6.66 (45) 6.98 (37)<br />
Area 3. Sound Money 5.29 (84) 5.63 (86) 5.81 (78) 6.44 (66) 7.85 (64) 7.98 (70) 7.92 (76) 8.18 (73)<br />
Area 4. <strong>Freedom</strong> to Trade Internationally 7.09 (19) 5.80 (36) 7.13 (29) 6.70 (61) 7.35 (58) 6.69 (76) 6.60 (79) 6.80 (77)<br />
Area 5. Regulation 4.98 (71) 5.55 (56) 5.55 (65) 7.27 (15) 7.19 (29) 7.21 (38) 6.86 (57) 6.96 (51)<br />
Unadjusted<br />
Summary Rating (Rank) 5.84 (32) 5.48 (50) 5.56 (55) 6.51 (46) 7.08 (41) 6.87 (71) 6.49 (91) 6.75 (85)<br />
Rating (Data) Rating (Data) Rating (Data) Rating (Data) Rating (Data) Rating (Data) Rating (Data) Rating (Data)<br />
Area 1. Size of Government 5.97 6.10 6.32 6.30 6.45 5.99 5.02 5.52<br />
A. Government consumption 5.61 (20.94) 4.58 (24.43) 4.46 (24.83) 4.50 (24.69) 5.17 (22.42) 4.76 (23.83) 4.26 (25.53) 3.96 (26.53)<br />
B. Transfers and subsidies 9.26 (3.20) 8.83 (4.80) 8.83 (4.80) 8.69 (5.30) 8.62 (5.55) 8.69 (5.31) 8.34 (6.59) 8.62 (5.57)<br />
C. Government enterprises and investment 7.00 (24.60) 7.00 (24.60) 7.00 (20.30) 8.00 (15.10) 8.00 (17.80) 6.00 (25.60) 2.00 (40.63) 4.00 (39.20)<br />
D. Top marginal tax rate 2.00 4.00 5.00 4.00 4.00 4.50 5.50 5.50<br />
(i) Top marginal income tax rate 2.00 (60) 4.00 (50) 5.00 (45) 4.00 (43) 4.00 (45) 5.00 (40) 6.00 (40) 6.00 (40)<br />
(ii) Top marginal income and payroll tax rate 5.00 (45) 4.00 (43) 4.00 (45) 4.00 (41) 5.00 (41) 5.00 (41)<br />
Area 2. Legal System and Property Rights 6.18 4.46 2.93 6.11 6.54 5.87 5.44 5.70<br />
A. Judicial independence 7.17 7.18 7.63 6.16 6.62<br />
B. Impartial courts 7.85 8.02 7.62 6.54 6.46<br />
C. Protection of property rights 6.53 5.82 7.97 7.34 7.15<br />
D. Military interference in rule of law and politics 4.91 8.33 8.33 8.33 8.33<br />
E. Integrity of the legal system 4.11 3.33 4.17 4.17 4.17<br />
F. Legal enforcement of contracts 3.93 3.93 3.93<br />
G. Regulatory restrictions on sale of real property 6.64 6.65 7.72<br />
H. Reliability of police 3.88 4.05 2.52<br />
I. Business costs of crime 2.70 1.79 4.38<br />
Area 3. Sound Money 5.29 5.63 5.81 6.44 7.85 7.98 7.92 8.18<br />
A. Money growth 7.86 (10.69) 7.60 (12.01) 6.75 (16.24) 8.22 (8.89) 7.87 (10.66) 8.60 (6.98) 9.01 (4.94) 9.22 (3.90)<br />
B. Standard deviation of inflation 8.12 (4.71) 8.54 (3.66) 9.49 (1.27) 9.29 (1.78) 9.60 (0.99) 9.01 (2.48) 9.08 (2.29) 9.37 (1.57)<br />
C. Inflation: most recent year 5.18 (24.12) 6.39 (18.06) 6.98 (15.09) 8.25 (8.76) 8.93 (5.34) 9.32 (3.40) 8.58 (7.13) 9.15 (4.27)<br />
D. <strong>Freedom</strong> to own foreign currency bank accounts 0.00 0.00 0.00 0.00 5.00 5.00 5.00 5.00<br />
Area 4. <strong>Freedom</strong> to Trade Internationally 6.49 5.31 6.22 6.48 7.35 7.05 6.95 7.16<br />
A. Tariffs 8.66 8.93 7.27 5.54 7.74 6.84 7.08 6.86<br />
(i) Revenue from trade taxes (% of trade sector) 9.20 (1.20) 9.07 (1.40) 8.53 (2.20) 9.33 (1.00) 9.01 (1.48) 8.59 (2.11) 8.84 (1.74) 8.84 (1.74)<br />
(ii) Mean tariff rate 8.12 (9.40) 8.80 (6.00) 7.80 (11.00) 6.06 (19.70) 8.30 (8.50) 8.30 (8.50) 8.46 (7.70) 8.46 (7.70)<br />
(iii) Standard deviation of tariff rates 5.48 (11.30) 1.24 (21.90) 5.92 (10.20) 3.63 (15.92) 3.93 (15.17) 3.29 (16.79)<br />
B. Regulatory trade barriers 6.40 7.56 6.07 5.80 6.57<br />
(i) Non-tariff trade barriers 6.40 6.62 6.67 6.13 6.13<br />
(ii) Compliance cost of importing and exporting 8.50 5.46 5.46 7.00<br />
C. Black-market exchange rates 8.80 5.00 9.40 10.00 10.00 10.00 10.00 10.00<br />
D. Controls of the movement of capital and people 2.00 2.00 2.00 3.98 4.12 5.30 4.94 5.22<br />
(i) Foreign ownership/investment restrictions 5.97 7.46 6.97 5.88 6.73<br />
(ii) Capital controls 2.00 2.00 2.00 2.00 0.77 0.77 0.77 0.77<br />
(iii) <strong>Freedom</strong> of foreigners to visit 8.16 8.16 8.16<br />
Area 5. Regulation 5.30 5.90 6.50 7.23 7.19 7.47 7.10 7.21<br />
A. Credit market regulations 7.48 9.08 9.07 9.77 9.59 9.96 8.94 8.94<br />
(i) Ownership of banks 10.00 10.00 10.00 10.00 10.00 10.00 10.00 10.00<br />
(ii) Private sector credit 8.43 9.25 9.22 9.30 8.76 9.87 6.81 6.81<br />
(iii) Interest rate controls/negative real interest rates 4.00 8.00 8.00 10.00 10.00 10.00 10.00 10.00<br />
B. Labor market regulations 3.92 6.11 5.47 6.06 6.11 6.07<br />
(i) Hiring regulations and minimum wage 2.87 4.61 4.40 4.43 4.43<br />
(ii) Hiring and firing regulations 5.55 5.55 2.05 2.36 2.49 2.46<br />
(iii) Centralized collective bargaining 6.21 6.21 4.52 3.84 3.58 3.39<br />
(iv) Hours regulations 5.90 6.18 8.00 8.00 8.00<br />
(v) Mandated cost of worker dismissal 7.78 8.15 8.15<br />
(vi) Conscription 0.00 0.00 0.00 10.00 10.00 10.00 10.00 10.00<br />
C. Business regulations 5.81 6.53 6.38 6.24 6.62<br />
(i) Administrative requirements 6.92 3.29 3.33 2.88<br />
(ii) Bureaucracy costs 6.38 6.53 4.55 3.10 5.42<br />
(iii) Starting a business 6.43 5.88 8.81 9.23 9.39<br />
(iv) Extra payments/bribes/favoritism 4.60 6.77 7.54 6.00 5.46<br />
(v) Licensing restrictions 8.02 8.04 8.81<br />
(vi) Cost of tax compliance 6.08 7.76 7.76<br />
www.freetheworld.com • www.fraserinstitute.org • Fraser Institute ©2012
150 • <strong>Economic</strong> <strong>Freedom</strong> of the <strong>World</strong>: 2012 Annual Report<br />
Spain<br />
Fraser Institute ©2012 • www.fraserinstitute.org • www.freetheworld.com<br />
1980 1985 1990 1995 2000 2005 2009 2010<br />
Chain-Linked Rating (Rank) Rating (Rank) Rating (Rank) Rating (Rank) Rating (Rank) Rating (Rank) Rating (Rank) Rating (Rank)<br />
Summary Rating (Rank) 6.10 (24) 6.08 (32) 6.57 (30) 7.25 (29) 7.54 (28) 7.60 (28) 7.32 (38) 7.40 (39)<br />
Area 1. Size of Government 5.18 (47) 4.20 (80) 4.67 (86) 4.16 (101) 4.75 (97) 6.57 (66) 6.14 (69) 6.15 (71)<br />
Area 2. Legal System and Property Rights 6.35 (28) 6.42 (27) 7.16 (26) 7.46 (29) 7.54 (32) 6.75 (46) 6.70 (44) 6.79 (44)<br />
Area 3. Sound Money 6.07 (62) 6.61 (58) 6.36 (67) 9.61 (14) 9.44 (24) 9.58 (15) 9.57 (16) 9.67 (8)<br />
Area 4. <strong>Freedom</strong> to Trade Internationally 7.60 (14) 7.48 (17) 8.63 (13) 8.94 (16) 8.98 (18) 7.85 (35) 7.76 (41) 7.66 (41)<br />
Area 5. Regulation 5.31 (56) 5.69 (50) 6.00 (44) 6.06 (52) 7.00 (38) 7.32 (29) 6.54 (79) 6.82 (63)<br />
Unadjusted<br />
Summary Rating (Rank) 6.16 (26) 6.14 (29) 6.56 (32) 7.19 (29) 7.54 (24) 7.63 (21) 7.35 (39) 7.43 (34)<br />
Rating (Data) Rating (Data) Rating (Data) Rating (Data) Rating (Data) Rating (Data) Rating (Data) Rating (Data)<br />
Area 1. Size of Government 5.18 4.20 4.67 4.16 4.75 6.57 6.14 6.15<br />
A. Government consumption 6.93 (16.45) 6.27 (18.67) 5.89 (19.98) 5.53 (21.18) 5.22 (22.25) 4.79 (23.73) 3.77 (27.19) 4.05 (26.24)<br />
B. Transfers and subsidies 6.78 (12.30) 5.53 (16.90) 5.78 (16.00) 5.10 (18.47) 5.76 (16.05) 6.00 (15.18) 4.78 (19.65) 4.56 (20.46)<br />
C. Government enterprises and investment 6.00 (27.10) 4.00 (30.20) 4.00 (33.50) 4.00 (33.50) 4.00 (33.50) 10.00 (12.08) 10.00 (9.77) 10.00 (9.07)<br />
D. Top marginal tax rate 1.00 1.00 3.00 2.00 4.00 5.50 6.00 6.00<br />
(i) Top marginal income tax rate 1.00 (66) 1.00 (66) 3.00 (56) 2.00 (56) 4.00 (48) 6.00 (35-45) 6.00 (35-43) 6.00 (35-43)<br />
(ii) Top marginal income and payroll tax rate 3.00 (56) 2.00 (56) 4.00 (48) 5.00 (45) 6.00 (35-43) 6.00 (35-43)<br />
Area 2. Legal System and Property Rights 6.35 6.42 7.16 7.46 7.54 6.73 6.67 6.76<br />
A. Judicial independence 6.75 7.52 4.49 4.70 4.86<br />
B. Impartial courts 6.63 8.02 5.26 4.39 4.43<br />
C. Protection of property rights 6.09 7.15 7.69 6.54 6.49<br />
D. Military interference in rule of law and politics 7.85 8.33 8.33 8.33 8.33<br />
E. Integrity of the legal system 10.00 6.67 8.33 8.33 8.33<br />
F. Legal enforcement of contracts 5.54 5.54 5.54<br />
G. Regulatory restrictions on sale of real property 7.31 7.33 7.42<br />
H. Reliability of police 7.47 7.81 7.41<br />
I. Business costs of crime 6.11 7.07 8.06<br />
Area 3. Sound Money 6.07 6.61 6.36 9.61 9.44 9.58 9.57 9.67<br />
A. Money growth 8.36 (8.21) 8.80 (5.98) 7.70 (11.50) 9.93 (−0.35) 8.66 (6.70) 9.02 (4.88) 8.98 (5.08) 9.65 (1.73)<br />
B. Standard deviation of inflation 8.60 (3.49) 9.16 (2.09) 9.22 (1.95) 9.48 (1.31) 9.77 (0.57) 9.95 (0.12) 9.38 (1.54) 9.38 (1.54)<br />
C. Inflation: most recent year 7.33 (13.35) 8.46 (7.69) 8.54 (7.31) 9.04 (4.81) 9.31 (3.43) 9.33 (3.37) 9.92 (−0.40) 9.64 (1.80)<br />
D. <strong>Freedom</strong> to own foreign currency bank accounts 0.00 0.00 0.00 10.00 10.00 10.00 10.00 10.00<br />
Area 4. <strong>Freedom</strong> to Trade Internationally 7.74 7.62 8.60 8.66 8.98 7.96 7.87 7.77<br />
A. Tariffs 8.22 8.25 8.21 8.72 9.18 8.39 8.22 8.34<br />
(i) Revenue from trade taxes (% of trade sector) 8.20 (2.70) 8.00 (3.00) 9.00 (1.50) 9.87 (0.20) 9.78 (0.33) 9.59 (0.62) 9.44 (0.84) 9.63 (0.55)<br />
(ii) Mean tariff rate 8.24 (8.80) 8.50 (7.50) 8.52 (7.40) 8.66 (6.70) 9.52 (2.40) 9.46 (2.70) 8.94 (5.30) 8.98 (5.10)<br />
(iii) Standard deviation of tariff rates 7.12 (7.20) 7.64 (5.90) 8.24 (4.40) 6.13 (9.67) 6.29 (9.28) 6.41 (8.98)<br />
B. Regulatory trade barriers 7.63 8.73 7.76 7.75 7.35<br />
(i) Non-tariff trade barriers 7.63 7.62 6.73 6.71 6.83<br />
(ii) Compliance cost of importing and exporting 9.83 8.79 8.79 7.88<br />
C. Black-market exchange rates 10.00 9.60 9.60 10.00 10.00 10.00 10.00 10.00<br />
D. Controls of the movement of capital and people 5.00 5.00 8.00 8.28 8.02 5.68 5.51 5.37<br />
(i) Foreign ownership/investment restrictions 8.57 9.11 7.39 6.89 6.47<br />
(ii) Capital controls 5.00 5.00 8.00 8.00 6.92 3.08 3.08 3.08<br />
(iii) <strong>Freedom</strong> of foreigners to visit 6.58 6.58 6.58<br />
Area 5. Regulation 5.46 5.85 5.99 6.03 7.00 7.30 6.52 6.80<br />
A. Credit market regulations 7.37 8.27 8.27 8.45 9.93 10.00 8.53 9.08<br />
(i) Ownership of banks 8.00 8.00 8.00 8.00 10.00 10.00 10.00 10.00<br />
(ii) Private sector credit 8.11 6.80 6.82 7.36 9.79 10.00 5.60 7.25<br />
(iii) Interest rate controls/negative real interest rates 6.00 10.00 10.00 10.00 10.00 10.00 10.00 10.00<br />
B. Labor market regulations 3.55 3.44 3.71 4.07 3.92 5.33 5.05 4.72<br />
(i) Hiring regulations and minimum wage 5.78 3.06 2.20 2.23 2.23<br />
(ii) Hiring and firing regulations 2.62 2.62 3.67 2.82 2.40 2.61<br />
(iii) Centralized collective bargaining 5.18 5.18 5.18 5.18 4.85 6.13 4.48 4.29<br />
(iv) Hours regulations 4.49 4.13 4.05 3.75 5.01 6.00 6.00 4.00<br />
(v) Mandated cost of worker dismissal 4.81 5.18 5.18<br />
(vi) Conscription 1.00 1.00 3.00 3.00 3.00 10.00 10.00 10.00<br />
C. Business regulations 5.58 7.15 6.58 5.97 6.61<br />
(i) Administrative requirements 7.40 3.23 2.93 2.95<br />
(ii) Bureaucracy costs 6.37 7.90 6.30 3.24 5.79<br />
(iii) Starting a business 5.32 5.67 8.28 8.29 9.01<br />
(iv) Extra payments/bribes/favoritism 5.06 7.63 8.02 6.56 6.14<br />
(v) Licensing restrictions 6.99 7.03 7.86<br />
(vi) Cost of tax compliance 6.66 7.79 7.90
Country Data Tables • 151<br />
Sri Lanka 1980 1985 1990 1995 2000 2005 2009 2010<br />
Chain-Linked Rating (Rank) Rating (Rank) Rating (Rank) Rating (Rank) Rating (Rank) Rating (Rank) Rating (Rank) Rating (Rank)<br />
Summary Rating (Rank) 4.77 (66) 4.95 (69) 4.81 (85) 6.07 (66) 6.16 (81) 6.21 (87) 6.15 (97) 6.25 (98)<br />
Area 1. Size of Government 5.64 (33) 5.77 (31) 7.03 (18) 6.83 (31) 7.02 (35) 8.09 (17) 6.66 (46) 7.08 (38)<br />
Area 2. Legal System and Property Rights 3.77 (57) 3.22 (88) 2.19 (106) 4.38 (101) 4.21 (99) 4.08 (100) 4.49 (90) 4.60 (88)<br />
Area 3. Sound Money 5.47 (81) 6.29 (75) 5.50 (87) 6.69 (61) 6.74 (90) 6.13 (108) 6.69 (103) 6.55 (108)<br />
Area 4. <strong>Freedom</strong> to Trade Internationally 3.11 (64) 2.92 (71) 2.92 (88) 5.93 (76) 6.35 (79) 6.46 (81) 6.44 (84) 6.39 (89)<br />
Area 5. Regulation 5.75 (42) 6.46 (28) 6.38 (36) 6.50 (39) 6.49 (53) 6.27 (87) 6.40 (87) 6.58 (83)<br />
Unadjusted<br />
Summary Rating (Rank) 4.54 (73) 4.71 (79) 4.75 (88) 5.97 (65) 6.15 (79) 6.44 (89) 6.38 (99) 6.48 (100)<br />
Rating (Data) Rating (Data) Rating (Data) Rating (Data) Rating (Data) Rating (Data) Rating (Data) Rating (Data)<br />
Area 1. Size of Government 4.20 4.29 6.97 6.83 7.02 8.09 6.66 7.08<br />
A. Government consumption 8.93 (9.62) 8.42 (11.39) 8.41 (11.39) 7.78 (13.54) 8.04 (12.68) 8.84 (9.96) 5.43 (21.53) 6.13 (19.15)<br />
B. Transfers and subsidies 7.85 (8.40) 8.75 (5.10) 8.50 (6.00) 8.53 (5.90) 9.03 (4.05) 8.53 (5.90) 9.19 (3.47) 9.19 (3.47)<br />
C. Government enterprises and investment 0.00 (53.50) 0.00 (54.30) 4.00 (39.20) 4.00 (39.20) 4.00 (39.20) 8.00 (16.46) 6.00 (26.91) 7.00 (22.30)<br />
D. Top marginal tax rate 0.00 0.00 7.00 7.00 7.00 6.00 6.00<br />
(i) Top marginal income tax rate 0.00 (60) 0.00 (60) 7.00 (35) 7.00 (35) 7.00 (35) 7.00 (35) 7.00 (35)<br />
(ii) Top marginal income and payroll tax rate 7.00 (35) 7.00 (35) 7.00 (35) 5.00 (38) 5.00 (38)<br />
Area 2. Legal System and Property Rights 3.98 3.40 2.31 4.47 4.18 4.66 5.13 5.25<br />
A. Judicial independence 4.16 6.09 5.51<br />
B. Impartial courts 4.92 5.01 4.38 5.26 5.68<br />
C. Protection of property rights 3.50 6.02 5.70 5.77<br />
D. Military interference in rule of law and politics 1.98 3.33 3.33 3.33 3.33<br />
E. Integrity of the legal system 6.96 5.00 5.00 5.00 4.17<br />
F. Legal enforcement of contracts 3.61 3.61 3.61<br />
G. Regulatory restrictions on sale of real property 6.75 6.75 6.75<br />
H. Reliability of police 3.82 4.53 7.33<br />
I. Business costs of crime 4.83 5.86 5.10<br />
Area 3. Sound Money 5.47 6.29 5.50 6.69 6.74 6.13 6.69 6.55<br />
A. Money growth 7.31 (13.43) 8.27 (8.64) 8.03 (9.85) 8.78 (6.08) 9.22 (3.92) 8.12 (9.42) 9.12 (4.41) 9.17 (4.16)<br />
B. Standard deviation of inflation 8.57 (3.57) 7.01 (7.47) 8.01 (4.97) 9.82 (0.45) 8.99 (2.52) 8.75 (3.13) 8.36 (4.10) 8.21 (4.47)<br />
C. Inflation: most recent year 6.00 (19.98) 9.88 (0.58) 5.94 (20.29) 8.14 (9.30) 8.76 (6.18) 7.67 (11.64) 9.30 (3.51) 8.81 (5.94)<br />
D. <strong>Freedom</strong> to own foreign currency bank accounts 0.00 0.00 0.00 0.00 0.00 0.00 0.00 0.00<br />
Area 4. <strong>Freedom</strong> to Trade Internationally 3.39 3.19 2.71 5.48 6.35 6.98 6.96 6.90<br />
A. Tariffs 1.97 3.57 2.92 4.85 7.62 6.85 6.71 6.57<br />
(i) Revenue from trade taxes (% of trade sector) 2.20 (11.70) 2.93 (10.60) 4.13 (8.80) 7.00 (4.50) 8.57 (2.15) 7.92 (3.12) 7.33 (4.00) 7.33 (4.00)<br />
(ii) Mean tariff rate 1.74 (41.30) 4.20 (29.00) 4.62 (26.90) 4.78 (26.10) 8.02 (9.90) 7.74 (11.30) 7.76 (11.20) 7.88 (10.60)<br />
(iii) Standard deviation of tariff rates 0.00 (25.50) 2.76 (18.10) 6.28 (9.30) 4.89 (12.77) 5.03 (12.43) 4.49 (13.78)<br />
B. Regulatory trade barriers 4.75 5.84 6.24 5.95<br />
(i) Non-tariff trade barriers 4.75 5.23 5.25 5.08<br />
(ii) Compliance cost of importing and exporting 6.44 7.22 6.81<br />
C. Black-market exchange rates 8.20 6.00 5.20 9.60 10.00 10.00 10.00 10.00<br />
D. Controls of the movement of capital and people 0.00 0.00 0.00 2.00 3.02 5.24 4.89 5.09<br />
(i) Foreign ownership/investment restrictions 6.04 7.00 5.94 6.54<br />
(ii) Capital controls 0.00 0.00 0.00 2.00 0.00 0.00 0.00 0.00<br />
(iii) <strong>Freedom</strong> of foreigners to visit 8.73 8.73 8.73<br />
Area 5. Regulation 5.67 6.36 6.28 6.40 6.49 6.32 6.45 6.64<br />
A. Credit market regulations 5.13 6.97 6.76 7.06 7.04 7.34 7.12 7.12<br />
(i) Ownership of banks 5.00 5.00 5.00 5.00 5.00 5.00 5.00 5.00<br />
(ii) Private sector credit 6.39 7.92 7.27 6.19 6.12 7.03 6.35 6.35<br />
(iii) Interest rate controls/negative real interest rates 4.00 8.00 8.00 10.00 10.00 10.00 10.00 10.00<br />
B. Labor market regulations 5.87 6.60 6.49 6.44<br />
(i) Hiring regulations and minimum wage 4.06 10.00 10.00 10.00<br />
(ii) Hiring and firing regulations 2.88 3.40 4.17 3.87<br />
(iii) Centralized collective bargaining 6.53 6.22 6.77 6.78<br />
(iv) Hours regulations 10.00 8.00 8.00<br />
(v) Mandated cost of worker dismissal 0.00 0.00 0.00<br />
(vi) Conscription 10.00 10.00 10.00 10.00 10.00 10.00 10.00 10.00<br />
C. Business regulations 6.55 5.02 5.75 6.35<br />
(i) Administrative requirements 7.27 2.84 3.88 4.53<br />
(ii) Bureaucracy costs 7.15 3.66 4.48 5.26<br />
(iii) Starting a business 6.48 8.30 8.82 8.83<br />
(iv) Extra payments/bribes/favoritism 5.30 4.74 5.19 5.02<br />
(v) Licensing restrictions 3.46 5.01 7.31<br />
(vi) Cost of tax compliance 7.13 7.13 7.13<br />
www.freetheworld.com • www.fraserinstitute.org • Fraser Institute ©2012
152 • <strong>Economic</strong> <strong>Freedom</strong> of the <strong>World</strong>: 2012 Annual Report<br />
Sweden<br />
Fraser Institute ©2012 • www.fraserinstitute.org • www.freetheworld.com<br />
1980 1985 1990 1995 2000 2005 2009 2010<br />
Chain-Linked Rating (Rank) Rating (Rank) Rating (Rank) Rating (Rank) Rating (Rank) Rating (Rank) Rating (Rank) Rating (Rank)<br />
Summary Rating (Rank) 5.68 (37) 6.47 (22) 7.11 (21) 7.28 (28) 7.62 (20) 7.59 (30) 7.48 (30) 7.62 (20)<br />
Area 1. Size of Government 1.63 (105) 2.61 (107) 2.62 (110) 2.60 (120) 3.17 (117) 3.67 (120) 3.25 (122) 3.60 (122)<br />
Area 2. Legal System and Property Rights 6.61 (23) 7.41 (15) 8.35 (11) 8.85 (13) 9.02 (13) 8.98 (11) 9.24 (1) 9.20 (1)<br />
Area 3. Sound Money 7.56 (26) 8.10 (26) 8.03 (31) 9.54 (20) 9.84 (1) 9.71 (3) 9.57 (17) 9.64 (12)<br />
Area 4. <strong>Freedom</strong> to Trade Internationally 6.44 (29) 7.82 (14) 9.46 (3) 9.37 (5) 8.89 (21) 8.19 (21) 8.20 (20) 7.81 (32)<br />
Area 5. Regulation 6.35 (26) 6.55 (24) 7.22 (14) 6.05 (54) 7.17 (33) 7.42 (25) 7.16 (40) 7.84 (13)<br />
Unadjusted<br />
Summary Rating (Rank) 5.66 (39) 6.45 (22) 7.06 (18) 7.28 (25) 7.62 (18) 7.50 (31) 7.39 (35) 7.53 (30)<br />
Rating (Data) Rating (Data) Rating (Data) Rating (Data) Rating (Data) Rating (Data) Rating (Data) Rating (Data)<br />
Area 1. Size of Government 1.63 2.61 2.62 2.60 3.17 3.67 3.25 3.60<br />
A. Government consumption 1.10 (36.25) 1.39 (35.27) 1.49 (34.95) 2.05 (33.02) 1.68 (34.28) 1.17 (36.03) 1.09 (36.30) 1.27 (35.69)<br />
B. Transfers and subsidies 3.41 (24.70) 3.05 (26.00) 1.99 (29.90) 0.84 (34.10) 3.98 (22.59) 4.00 (22.51) 3.91 (22.86) 4.13 (22.04)<br />
C. Government enterprises and investment 2.00 (41.20) 6.00 (28.00) 7.00 (22.80) 6.00 (28.30) 6.00 (28.30) 8.00 (17.13) 7.00 (20.05) 8.00 (19.51)<br />
D. Top marginal tax rate 0.00 0.00 0.00 1.50 1.00 1.50 1.00 1.00<br />
(i) Top marginal income tax rate 0.00 (87) 0.00 (80) 0.00 (61-68) 3.00 (46-53) 2.00 (51-58) 3.00 (52-59) 2.00 (52-59) 2.00 (52-59)<br />
(ii) Top marginal income and payroll tax rate 0.00 (79-86) 0.00 (66-73) 0.00 (68.4-<br />
75.4)<br />
0.00 (66) 0.00 (63-69) 0.00 (63-69)<br />
Area 2. Legal System and Property Rights 6.61 7.41 8.35 8.85 9.02 8.17 8.41 8.38<br />
A. Judicial independence 8.82 8.68 8.11 9.26 9.12<br />
B. Impartial courts 8.88 8.35 8.72 8.27 8.01<br />
C. Protection of property rights 6.57 8.08 8.71 8.80 8.70<br />
D. Military interference in rule of law and politics 10.00 10.00 9.17 9.17 9.17<br />
E. Integrity of the legal system 10.00 10.00 10.00 10.00 10.00<br />
F. Legal enforcement of contracts 4.73 4.74 4.74<br />
G. Regulatory restrictions on sale of real property 8.73 8.88 8.45<br />
H. Reliability of police 7.37 8.54 8.34<br />
I. Business costs of crime 8.03 8.00 8.86<br />
Area 3. Sound Money 7.56 8.10 8.03 9.54 9.84 9.71 9.57 9.64<br />
A. Money growth 8.18 (9.11) 9.23 (3.86) 9.44 (2.78) 9.81 (0.97) 9.71 (1.47) 9.25 (3.77) 8.69 (6.56) 9.16 (4.19)<br />
B. Standard deviation of inflation 9.41 (1.47) 9.50 (1.26) 9.44 (1.40) 9.10 (2.24) 9.83 (0.44) 9.69 (0.79) 9.65 (0.87) 9.65 (0.88)<br />
C. Inflation: most recent year 7.66 (11.72) 8.67 (6.63) 8.23 (8.84) 9.27 (3.67) 9.82 (0.90) 9.91 (0.45) 9.94 (−0.28) 9.77 (1.16)<br />
D. <strong>Freedom</strong> to own foreign currency bank accounts 5.00 5.00 5.00 10.00 10.00 10.00 10.00 10.00<br />
Area 4. <strong>Freedom</strong> to Trade Internationally 6.67 8.10 9.65 9.28 8.89 8.27 8.27 7.88<br />
A. Tariffs 9.02 9.49 8.96 8.68 9.18 8.39 8.22 8.34<br />
(i) Revenue from trade taxes (% of trade sector) 9.53 (0.70) 9.80 (0.30) 9.73 (0.40) 9.73 (0.40) 9.78 (0.33) 9.59 (0.62) 9.44 (0.84) 9.63 (0.55)<br />
(ii) Mean tariff rate 8.50 (7.50) 9.18 (4.10) 9.06 (4.70) 8.66 (6.70) 9.52 (2.40) 9.46 (2.70) 8.94 (5.30) 8.98 (5.10)<br />
(iii) Standard deviation of tariff rates 8.08 (4.80) 7.64 (5.90) 8.24 (4.40) 6.13 (9.67) 6.29 (9.28) 6.41 (8.98)<br />
B. Regulatory trade barriers 9.13 9.15 8.71 8.87 7.34<br />
(i) Non-tariff trade barriers 9.13 8.80 8.30 8.61 8.56<br />
(ii) Compliance cost of importing and exporting 9.50 9.12 9.12 6.13<br />
C. Black-market exchange rates 9.00 9.80 10.00 10.00 10.00 10.00 10.00 10.00<br />
D. Controls of the movement of capital and people 2.00 5.00 10.00 9.30 7.22 5.97 6.01 5.85<br />
(i) Foreign ownership/investment restrictions 8.59 9.05 8.24 8.36 7.90<br />
(ii) Capital controls 2.00 5.00 10.00 10.00 5.38 3.08 3.08 3.08<br />
(iii) <strong>Freedom</strong> of foreigners to visit 6.58 6.58 6.58<br />
Area 5. Regulation 5.85 6.03 6.64 6.13 7.17 7.69 7.42 8.13<br />
A. Credit market regulations 7.59 8.07 9.33 7.81 10.00 10.00 9.82 9.78<br />
(i) Ownership of banks 8.00 8.00 8.00 8.00 10.00 10.00 10.00 10.00<br />
(ii) Private sector credit 6.76 6.22 10.00 5.43 10.00 10.00 9.46 9.34<br />
(iii) Interest rate controls/negative real interest rates 8.00 10.00 10.00 10.00 10.00 10.00 10.00 10.00<br />
B. Labor market regulations 4.11 3.99 3.95 3.03 3.38 5.06 5.37 6.43<br />
(i) Hiring regulations and minimum wage 1.83 4.41 8.30 6.67 6.67<br />
(ii) Hiring and firing regulations 3.93 3.93 2.18 1.92 3.11 2.52<br />
(iii) Centralized collective bargaining 4.49 4.49 4.49 4.49 3.78 3.56 3.43 3.41<br />
(iv) Hours regulations 4.84 4.49 4.40 1.90 3.51 6.00 6.00 6.00<br />
(v) Mandated cost of worker dismissal 7.59 10.00 10.00<br />
(vi) Conscription 3.00 3.00 3.00 3.00 3.00 3.00 3.00 10.00<br />
C. Business regulations 7.55 8.14 8.02 7.09 8.19<br />
(i) Administrative requirements 7.27 3.73 5.07 4.76<br />
(ii) Bureaucracy costs 8.28 8.30 8.26 1.11 8.26<br />
(iii) Starting a business 5.08 7.87 9.40 9.47 9.47<br />
(iv) Extra payments/bribes/favoritism 9.29 9.12 9.30 9.41 9.12<br />
(v) Licensing restrictions 8.82 8.83 8.88<br />
(vi) Cost of tax compliance 8.63 8.63 8.63
Country Data Tables • 153<br />
Switzerland 1980 1985 1990 1995 2000 2005 2009 2010<br />
Chain-Linked Rating (Rank) Rating (Rank) Rating (Rank) Rating (Rank) Rating (Rank) Rating (Rank) Rating (Rank) Rating (Rank)<br />
Summary Rating (Rank) 7.99 (2) 8.15 (2) 8.15 (4) 8.19 (7) 8.63 (3) 8.19 (9) 8.04 (6) 8.07 (6)<br />
Area 1. Size of Government 6.61 (16) 6.52 (14) 6.43 (31) 6.37 (49) 7.00 (36) 7.04 (48) 6.80 (41) 6.79 (49)<br />
Area 2. Legal System and Property Rights 8.13 (2) 8.35 (2) 8.35 (4) 9.14 (4) 9.27 (7) 8.94 (12) 8.72 (12) 8.76 (10)<br />
Area 3. Sound Money 9.59 (1) 9.66 (2) 9.72 (4) 9.63 (12) 9.70 (6) 9.61 (11) 9.29 (33) 9.39 (31)<br />
Area 4. <strong>Freedom</strong> to Trade Internationally 9.03 (4) 9.08 (6) 9.09 (8) 8.60 (22) 9.49 (3) 7.33 (52) 7.27 (55) 7.06 (64)<br />
Area 5. Regulation 6.50 (22) 7.14 (13) 7.16 (17) 7.22 (16) 7.70 (9) 8.02 (12) 8.08 (7) 8.31 (7)<br />
Unadjusted<br />
Summary Rating (Rank) 7.99 (4) 8.15 (4) 8.21 (4) 8.17 (7) 8.63 (3) 8.37 (4) 8.21 (4) 8.24 (4)<br />
Rating (Data) Rating (Data) Rating (Data) Rating (Data) Rating (Data) Rating (Data) Rating (Data) Rating (Data)<br />
Area 1. Size of Government 6.78 6.69 6.43 6.37 7.00 7.88 7.61 7.60<br />
A. Government consumption 6.86 (16.68) 6.54 (17.77) 6.01 (19.55) 6.12 (19.19) 7.16 (15.64) 7.08 (15.91) 6.96 (16.34) 6.91 (16.52)<br />
B. Transfers and subsidies 6.49 (13.40) 6.54 (13.20) 5.78 (16.00) 4.99 (18.90) 5.85 (15.75) 6.42 (13.65) 5.50 (17.03) 5.50 (17.03)<br />
C. Government enterprises and investment 10.00 (10.32) 10.00 (9.57) 10.00 (9.15)<br />
D. Top marginal tax rate 7.00 7.00 7.50 8.00 8.00 8.00 8.00 8.00<br />
(i) Top marginal income tax rate 7.00 (31-44) 7.00 (33-46) 8.00 (33-43) 8.00 (35-39) 9.00 (31-40) 9.00 (26-42) 9.00 (26-42) 9.00 (26-42)<br />
(ii) Top marginal income and payroll tax rate 7.00 (36-46) 8.00 (38-42) 7.00 (39-48) 7.00 (34-50) 7.00 (35-49) 7.00 (35-49)<br />
Area 2. Legal System and Property Rights 8.13 8.35 8.35 9.14 9.27 8.72 8.51 8.55<br />
A. Judicial independence 9.35 8.68 8.63 8.98 9.01<br />
B. Impartial courts 7.92 8.52 8.61 7.35 7.50<br />
C. Protection of property rights 8.44 9.17 9.28 9.02 9.07<br />
D. Military interference in rule of law and politics 10.00 10.00 10.00 10.00 10.00<br />
E. Integrity of the legal system 10.00 10.00 8.33 8.33 8.33<br />
F. Legal enforcement of contracts 6.03 5.86 6.07<br />
G. Regulatory restrictions on sale of real property 9.57 9.57 9.57<br />
H. Reliability of police 9.06 8.77 8.50<br />
I. Business costs of crime 9.00 8.67 8.86<br />
Area 3. Sound Money 9.59 9.66 9.72 9.63 9.70 9.61 9.29 9.39<br />
A. Money growth 9.35 (3.25) 9.81 (0.94) 9.93 (0.33) 9.44 (2.82) 9.28 (3.60) 8.94 (5.28) 7.63 (11.84) 8.06 (9.71)<br />
B. Standard deviation of inflation 9.55 (1.13) 9.30 (1.75) 9.78 (0.55) 9.32 (1.70) 9.83 (0.42) 9.75 (0.63) 9.63 (0.93) 9.64 (0.89)<br />
C. Inflation: most recent year 9.46 (2.71) 9.53 (2.37) 9.15 (4.27) 9.77 (1.13) 9.69 (1.54) 9.77 (1.17) 9.90 (−0.48) 9.86 (0.70)<br />
D. <strong>Freedom</strong> to own foreign currency bank accounts 10.00 10.00 10.00 10.00 10.00 10.00 10.00 10.00<br />
Area 4. <strong>Freedom</strong> to Trade Internationally 9.58 9.63 9.76 8.43 9.49 7.42 7.35 7.14<br />
A. Tariffs 8.74 8.89 9.28 7.70 9.92 6.43 5.98 6.30<br />
(i) Revenue from trade taxes (% of trade sector) 8.40 (2.40) 8.67 (2.00) 8.73 (1.90) 8.47 (2.30) 9.79 (0.31) 9.84 (0.24) 9.25 (1.13) 9.25 (1.13)<br />
(ii) Mean tariff rate 9.08 (4.60) 9.12 (4.40) 9.12 (4.40) 9.28 (3.60) 10.00 (0.00) 9.46 (2.70) 8.70 (6.50) 8.96 (5.20)<br />
(iii) Standard deviation of tariff rates 10.00 (0.00) 5.36 (11.60) 9.96 (0.10) 0.00 (30.48) 0.00 (29.45) 0.68 (23.30)<br />
B. Regulatory trade barriers 6.40 8.94 7.00 7.17 6.17<br />
(i) Non-tariff trade barriers 6.40 8.22 5.07 5.41 5.40<br />
(ii) Compliance cost of importing and exporting 9.67 8.93 8.93 6.94<br />
C. Black-market exchange rates 10.00 10.00 10.00 10.00 10.00 10.00 10.00 10.00<br />
D. Controls of the movement of capital and people 10.00 10.00 10.00 9.62 9.08 6.24 6.26 6.09<br />
(i) Foreign ownership/investment restrictions 9.25 9.70 7.96 8.03 7.51<br />
(ii) Capital controls 10.00 10.00 10.00 10.00 8.46 3.85 3.85 3.85<br />
(iii) <strong>Freedom</strong> of foreigners to visit 6.92 6.92 6.92<br />
Area 5. Regulation 5.85 6.43 6.82 7.30 7.70 8.24 8.30 8.54<br />
A. Credit market regulations 6.69 8.08 8.15 8.27 9.33 9.29 9.33 9.33<br />
(i) Ownership of banks 5.00 5.00 5.00 5.00 8.00 8.00 8.00 8.00<br />
(ii) Private sector credit 9.07 9.25 9.46 9.81 10.00 9.88 10.00 10.00<br />
(iii) Interest rate controls/negative real interest rates 6.00 10.00 10.00 10.00 10.00 10.00 10.00 10.00<br />
B. Labor market regulations 5.01 4.77 5.48 5.79 5.70 7.61 8.45 8.19<br />
(i) Hiring regulations and minimum wage 7.05 4.56 10.00 10.00 8.33<br />
(ii) Hiring and firing regulations 7.71 7.71 5.62 7.79 7.91 7.95<br />
(iii) Centralized collective bargaining 6.21 6.21 6.21 6.21 7.80 8.06 7.80 7.86<br />
(iv) Hours regulations 5.81 5.10 5.01 5.00 5.51 6.00 10.00 10.00<br />
(v) Mandated cost of worker dismissal 8.79 10.00 10.00<br />
(vi) Conscription 3.00 3.00 3.00 3.00 5.00 5.00 5.00 5.00<br />
C. Business regulations 7.84 8.06 7.82 7.11 8.10<br />
(i) Administrative requirements 7.30 5.11 5.35 5.23<br />
(ii) Bureaucracy costs 8.31 9.08 5.99 1.67 7.99<br />
(iii) Starting a business 6.58 7.67 9.29 9.25 9.31<br />
(iv) Extra payments/bribes/favoritism 8.62 8.18 8.92 8.80 8.44<br />
(v) Licensing restrictions 8.30 8.31 8.34<br />
(vi) Cost of tax compliance 9.29 9.29 9.29<br />
www.freetheworld.com • www.fraserinstitute.org • Fraser Institute ©2012
154 • <strong>Economic</strong> <strong>Freedom</strong> of the <strong>World</strong>: 2012 Annual Report<br />
Syria<br />
Fraser Institute ©2012 • www.fraserinstitute.org • www.freetheworld.com<br />
1980 1985 1990 1995 2000 2005 2009 2010<br />
Chain-Linked Rating (Rank) Rating (Rank) Rating (Rank) Rating (Rank) Rating (Rank) Rating (Rank) Rating (Rank) Rating (Rank)<br />
Summary Rating (Rank) 3.31 (98) 3.07 (106) 3.53 (105) 4.23 (114) 4.92 (115) 5.46 (113) 5.46 (116) 5.53 (116)<br />
Area 1. Size of Government 2.09 (104) 1.95 (110) 4.38 (87) 4.57 (93) 3.75 (113) 3.90 (117) 4.01 (115) 4.21 (113)<br />
Area 2. Legal System and Property Rights 1.76 (87) 3.05 (91) 3.02 (91) 5.23 (78) 5.44 (70) 5.48 (71) 4.86 (79) 4.90 (79)<br />
Area 3. Sound Money 8.18 (16) 6.10 (83) 5.58 (86) 6.59 (62) 6.46 (100) 7.39 (80) 7.30 (86) 7.28 (85)<br />
Area 4. <strong>Freedom</strong> to Trade Internationally 2.08 (78) 1.63 (85) 2.10 (96) 2.13 (109) 5.06 (112) 6.87 (72) 7.15 (63) 7.24 (58)<br />
Area 5. Regulation 2.65 (98) 2.80 (103) 2.77 (110) 2.82 (122) 3.90 (122) 3.90 (122) 4.14 (121) 4.16 (122)<br />
Unadjusted<br />
Summary Rating (Rank) 3.77 (93) 3.14 (107) 3.46 (106) 4.25 (114) 4.85 (115) 5.84 (121) 6.00 (116) 6.08 (119)<br />
Rating (Data) Rating (Data) Rating (Data) Rating (Data) Rating (Data) Rating (Data) Rating (Data) Rating (Data)<br />
Area 1. Size of Government 3.84 1.95 4.38 4.57 3.75 5.72 6.20 6.52<br />
A. Government consumption 4.17 (25.82) 3.89 (26.76) 6.76 (17.03) 7.14 (15.72) 7.50 (14.51) 7.16 (15.65) 6.85 (16.71) 8.11 (12.41)<br />
B. Transfers and subsidies 7.36 (10.20) 8.97 (4.29) 8.97 (4.29)<br />
C. Government enterprises and investment 0.00 (59.50) 0.00 (62.50) 2.00 (45.00) 2.00 (43.75) 0.00 (63.64) 2.00 (46.40) 2.00 (46.55) 2.00 (48.37)<br />
D. Top marginal tax rate 8.00 7.00 7.00<br />
(i) Top marginal income tax rate 8.00 (28) 9.00 (22) 9.00 (22)<br />
(ii) Top marginal income and payroll tax rate 5.00 (39) 5.00 (39)<br />
Area 2. Legal System and Property Rights 1.76 3.05 3.02 4.91 5.06 4.84 5.03 5.06<br />
A. Judicial independence 3.13 2.93<br />
B. Impartial courts 5.05 4.64 4.80 3.03 3.26<br />
C. Protection of property rights 5.72 6.13<br />
D. Military interference in rule of law and politics 6.53 3.33 3.33 3.33 3.33<br />
E. Integrity of the legal system 4.11 8.33 8.33 8.33 8.33<br />
F. Legal enforcement of contracts 3.22 3.22 3.22<br />
G. Regulatory restrictions on sale of real property 4.49 4.64 4.64<br />
H. Reliability of police 4.47 9.37<br />
I. Business costs of crime 9.36 4.36<br />
Area 3. Sound Money 8.18 6.10 5.58 6.59 6.46 7.39 7.30 7.28<br />
A. Money growth 7.66 (11.72) 7.29 (13.53) 7.42 (12.90) 8.83 (5.83) 9.16 (4.20) 8.01 (9.93) 9.00 (5.02) 9.03 (4.84)<br />
B. Standard deviation of inflation 8.56 (3.60) 7.91 (5.22) 8.75 (3.13) 8.62 (3.46) 7.47 (6.33) 8.00 (4.99) 5.79 (10.54) 5.95 (10.12)<br />
C. Inflation: most recent year 6.51 (17.47) 9.18 (4.10) 6.13 (19.33) 8.92 (5.38) 9.23 (−3.85) 8.55 (7.24) 9.42 (2.92) 9.12 (4.40)<br />
D. <strong>Freedom</strong> to own foreign currency bank accounts 10.00 0.00 0.00 0.00 0.00 5.00 5.00 5.00<br />
Area 4. <strong>Freedom</strong> to Trade Internationally 2.30 1.81 1.55 2.36 5.06 5.70 5.91 5.99<br />
A. Tariffs 3.90 5.43 4.66 7.09 5.17 5.17 5.97 5.97<br />
(i) Revenue from trade taxes (% of trade sector) 5.27 (7.10) 6.27 (5.60) 8.07 (2.90) 7.15 (4.28) 7.55 (3.67) 7.55 (3.67) 7.55 (3.67) 7.55 (3.67)<br />
(ii) Mean tariff rate 2.54 (37.30) 4.60 (27.00) 5.92 (20.40) 7.04 (14.80) 6.08 (19.60) 6.08 (19.60) 7.16 (14.20) 7.16 (14.20)<br />
(iii) Standard deviation of tariff rates 0.00 (27.70) 1.89 (20.28) 1.89 (20.28) 3.18 (17.04) 3.18 (17.04)<br />
B. Regulatory trade barriers 7.14 6.19 6.41<br />
(i) Non-tariff trade barriers 4.78 4.64<br />
(ii) Compliance cost of importing and exporting 7.14 7.60 8.19<br />
C. Black-market exchange rates 3.00 0.00 0.00 0.00 10.00 10.00 10.00 10.00<br />
D. Controls of the movement of capital and people 0.00 0.00 0.00 0.00 0.00 0.50 1.50 1.58<br />
(i) Foreign ownership/investment restrictions 3.68 3.90<br />
(ii) Capital controls 0.00 0.00 0.00 0.00 0.00 1.00 0.83 0.83<br />
(iii) <strong>Freedom</strong> of foreigners to visit 0.00 0.00 0.00<br />
Area 5. Regulation 2.75 2.80 2.77 2.82 3.90 5.54 5.55 5.57<br />
A. Credit market regulations 0.82 0.85 0.78 0.92 3.79 4.39 4.84 5.59<br />
(i) Ownership of banks 0.00 0.00 0.00 0.00 0.00 0.00 0.00 2.00<br />
(ii) Private sector credit 1.63 2.56 2.33 2.75 2.38 4.18 4.51 4.76<br />
(iii) Interest rate controls/negative real interest rates 0.00 0.00 0.00 9.00 9.00 10.00 10.00<br />
B. Labor market regulations 5.65 6.08 5.58<br />
(i) Hiring regulations and minimum wage 10.00 7.23 6.10<br />
(ii) Hiring and firing regulations 4.08 4.27<br />
(iii) Centralized collective bargaining 7.15 7.13<br />
(iv) Hours regulations 10.00 8.00 6.00<br />
(v) Mandated cost of worker dismissal 2.58 10.00 10.00<br />
(vi) Conscription 0.00 0.00 0.00 0.00 0.00 0.00 0.00 0.00<br />
C. Business regulations 6.57 5.72 5.54<br />
(i) Administrative requirements 2.22 2.46<br />
(ii) Bureaucracy costs 6.56 3.64<br />
(iii) Starting a business 5.07 8.02 8.99<br />
(iv) Extra payments/bribes/favoritism 3.51 3.61<br />
(v) Licensing restrictions 8.40 7.80 8.31<br />
(vi) Cost of tax compliance 6.23 6.23 6.23
Taiwan<br />
Country Data Tables • 155<br />
1980 1985 1990 1995 2000 2005 2009 2010<br />
Chain-Linked Rating (Rank) Rating (Rank) Rating (Rank) Rating (Rank) Rating (Rank) Rating (Rank) Rating (Rank) Rating (Rank)<br />
Summary Rating (Rank) 6.58 (16) 6.84 (17) 7.30 (15) 7.41 (25) 7.45 (31) 7.70 (20) 7.54 (27) 7.81 (15)<br />
Area 1. Size of Government 4.96 (55) 4.91 (56) 5.40 (63) 6.10 (62) 6.73 (46) 7.15 (44) 6.42 (57) 7.45 (32)<br />
Area 2. Legal System and Property Rights 7.83 (11) 7.25 (19) 7.25 (25) 6.74 (38) 6.08 (58) 6.54 (50) 6.74 (42) 6.86 (41)<br />
Area 3. Sound Money 8.05 (19) 9.33 (12) 9.42 (14) 9.69 (10) 9.46 (23) 9.58 (12) 9.65 (5) 9.63 (14)<br />
Area 4. <strong>Freedom</strong> to Trade Internationally 6.66 (25) 6.70 (26) 8.10 (18) 8.20 (25) 8.46 (31) 8.13 (22) 7.85 (38) 7.93 (27)<br />
Area 5. Regulation 5.34 (55) 6.01 (40) 6.28 (38) 6.28 (47) 6.50 (50) 7.09 (45) 6.99 (49) 7.13 (42)<br />
Unadjusted<br />
Summary Rating (Rank) 6.35 (21) 6.60 (19) 7.18 (16) 7.34 (24) 7.45 (29) 7.61 (25) 7.45 (30) 7.72 (15)<br />
Rating (Data) Rating (Data) Rating (Data) Rating (Data) Rating (Data) Rating (Data) Rating (Data) Rating (Data)<br />
Area 1. Size of Government 4.96 4.91 5.40 6.10 6.73 7.15 6.42 7.45<br />
A. Government consumption 4.82 (23.60) 4.71 (24.00) 4.74 (23.90) 6.03 (19.50) 6.69 (17.25) 6.53 (17.78) 6.59 (17.59) 6.73 (17.13)<br />
B. Transfers and subsidies 10.00 (0.35) 9.95 (0.67) 9.87 (0.99) 9.37 (2.80) 9.21 (3.40) 9.08 (3.89) 9.08 (3.89) 9.08 (3.89)<br />
C. Government enterprises and investment 2.00 (44.30) 2.00 (43.00) 2.00 (44.30) 2.00 (47.20) 4.00 (30.23) 6.00 (25.48) 4.00 (30.35) 7.00 (24.61)<br />
D. Top marginal tax rate 3.00 3.00 5.00 7.00 7.00 7.00 6.00 7.00<br />
(i) Top marginal income tax rate 3.00 (60) 3.00 (60) 5.00 (50) 7.00 (40) 7.00 (40) 7.00 (40) 7.00 (40) 7.00 (40)<br />
(ii) Top marginal income and payroll tax rate 5.00 (50) 7.00 (40) 7.00 (40) 7.00 (40) 5.00 (40) 7.00 (40)<br />
Area 2. Legal System and Property Rights 7.83 7.25 7.25 6.74 6.08 6.69 6.89 7.02<br />
A. Judicial independence 5.53 5.34 5.05 6.00 6.09<br />
B. Impartial courts 6.47 5.68 5.69 5.08 5.42<br />
C. Protection of property rights 5.92 6.07 7.15 7.75 8.08<br />
D. Military interference in rule of law and politics 8.81 6.67 6.67 6.67 6.67<br />
E. Integrity of the legal system 6.96 6.67 8.33 8.33 8.33<br />
F. Legal enforcement of contracts 5.55 5.55 5.55<br />
G. Regulatory restrictions on sale of real property 7.87 7.87 7.87<br />
H. Reliability of police 6.59 7.30 7.78<br />
I. Business costs of crime 7.32 7.46 7.35<br />
Area 3. Sound Money 8.05 9.33 9.42 9.69 9.46 9.58 9.65 9.63<br />
A. Money growth 8.24 (8.79) 9.84 (−0.81) 9.18 (4.09) 9.56 (−2.21) 9.50 (−2.52) 8.95 (5.27) 9.27 (3.66) 9.27 (3.65)<br />
B. Standard deviation of inflation 7.76 (5.60) 7.52 (6.21) 9.32 (1.71) 9.80 (0.51) 9.09 (2.28) 9.64 (0.90) 9.50 (1.24) 9.46 (1.35)<br />
C. Inflation: most recent year 6.20 (19.00) 9.96 (−0.20) 9.18 (4.10) 9.40 (3.00) 9.27 (3.67) 9.75 (1.26) 9.83 (−0.87) 9.81 (0.97)<br />
D. <strong>Freedom</strong> to own foreign currency bank accounts 10.00 10.00 10.00 10.00 10.00 10.00 10.00 10.00<br />
Area 4. <strong>Freedom</strong> to Trade Internationally 6.47 6.51 7.78 7.91 8.46 7.74 7.47 7.55<br />
A. Tariffs 7.60 8.13 8.33 8.63 7.98 7.41 7.50 7.73<br />
(i) Revenue from trade taxes (% of trade sector) 7.60 (3.60) 8.13 (2.80) 8.60 (2.10) 8.87 (1.70) 8.98 (1.52) 9.61 (0.58) 9.68 (0.47) 9.68 (0.47)<br />
(ii) Mean tariff rate 8.06 (9.70) 8.40 (8.00) 8.24 (8.80) 8.72 (6.40) 8.78 (6.10) 8.78 (6.10)<br />
(iii) Standard deviation of tariff rates 6.72 (8.20) 3.88 (15.30) 4.05 (14.88) 4.73 (13.18)<br />
B. Regulatory trade barriers 7.30 8.23 7.67 7.28 6.66<br />
(i) Non-tariff trade barriers 7.30 7.13 7.02 6.14 6.07<br />
(ii) Compliance cost of importing and exporting 9.33 8.33 8.41 7.25<br />
C. Black-market exchange rates 9.80 9.40 10.00 10.00 10.00 10.00 10.00 10.00<br />
D. Controls of the movement of capital and people 2.00 2.00 5.00 5.71 7.63 5.87 5.11 5.81<br />
(i) Foreign ownership/investment restrictions 6.43 7.63 7.44 5.92 7.31<br />
(ii) Capital controls 2.00 2.00 5.00 5.00<br />
(iii) <strong>Freedom</strong> of foreigners to visit 4.31 4.31 4.31<br />
Area 5. Regulation 4.46 5.02 6.03 6.28 6.50 6.89 6.80 6.94<br />
A. Credit market regulations 5.26 6.74 7.33 7.33 7.33 9.33 8.66 8.67<br />
(i) Ownership of banks 0.00 2.00 2.00 2.00 2.00 8.00 8.00 8.00<br />
(ii) Private sector credit 7.79 8.23 10.00 10.00 10.00 10.00 7.97 8.01<br />
(iii) Interest rate controls/negative real interest rates 8.00 10.00 10.00 10.00 10.00 10.00 10.00 10.00<br />
B. Labor market regulations 4.73 5.22 4.51 4.34 5.17 4.93<br />
(i) Hiring regulations and minimum wage 6.50 3.78 2.20 2.23 2.23<br />
(ii) Hiring and firing regulations 6.26 6.26 4.60 5.92 5.92 4.68<br />
(iii) Centralized collective bargaining 7.93 7.93 7.98 8.36 7.88 7.71<br />
(iv) Hours regulations 5.43 6.18 8.00 10.00 10.00<br />
(v) Mandated cost of worker dismissal 1.56 1.97 1.97<br />
(vi) Conscription 0.00 0.00 0.00 0.00 0.00 0.00 3.00 3.00<br />
C. Business regulations 6.28 7.67 7.00 6.59 7.22<br />
(i) Administrative requirements 7.63 5.21 4.53 4.63<br />
(ii) Bureaucracy costs 6.88 7.35 6.52 3.38 6.30<br />
(iii) Starting a business 7.50 7.58 7.76 9.48 9.65<br />
(iv) Extra payments/bribes/favoritism 4.46 8.09 7.95 6.73 6.67<br />
(v) Licensing restrictions 8.41 8.42 8.80<br />
(vi) Cost of tax compliance 6.19 6.98 7.25<br />
www.freetheworld.com • www.fraserinstitute.org • Fraser Institute ©2012
156 • <strong>Economic</strong> <strong>Freedom</strong> of the <strong>World</strong>: 2012 Annual Report<br />
Tanzania 1980 1985 1990 1995 2000 2005 2009 2010<br />
Chain-Linked Rating (Rank) Rating (Rank) Rating (Rank) Rating (Rank) Rating (Rank) Rating (Rank) Rating (Rank) Rating (Rank)<br />
Summary Rating (Rank) 3.65 (94) 3.47 (100) 3.87 (102) 5.43 (85) 6.07 (84) 6.44 (80) 6.22 (95) 6.44 (86)<br />
Area 1. Size of Government 2.27 (102) 1.96 (109) 3.58 (100) 7.01 (22) 5.77 (77) 6.27 (80) 5.02 (99) 5.60 (84)<br />
Area 2. Legal System and Property Rights 6.13 (32) 5.85 (36) 5.21 (57) 5.92 (55) 6.95 (41) 6.73 (47) 6.88 (39) 6.83 (42)<br />
Area 3. Sound Money 4.11 (98) 4.92 (93) 4.58 (96) 5.02 (93) 7.59 (67) 7.57 (78) 7.53 (84) 7.71 (84)<br />
Area 4. <strong>Freedom</strong> to Trade Internationally 1.31 (84) 1.56 (86) 1.50 (100) 5.02 (97) 5.24 (108) 5.09 (113) 4.98 (116) 5.02 (116)<br />
Area 5. Regulation 4.35 (84) 3.21 (98) 4.51 (95) 4.20 (112) 4.80 (109) 6.48 (78) 6.72 (72) 7.03 (47)<br />
Unadjusted<br />
Summary Rating (Rank) 4.41 (78) 3.87 (93) 3.88 (101) 5.33 (86) 5.91 (88) 6.35 (97) 6.14 (110) 6.35 (107)<br />
Fraser Institute ©2012 • www.fraserinstitute.org • www.freetheworld.com<br />
Rating (Data) Rating (Data) Rating (Data) Rating (Data) Rating (Data) Rating (Data) Rating (Data) Rating (Data)<br />
Area 1. Size of Government 5.83 3.79 3.58 7.01 5.77 6.27 5.02 5.60<br />
A. Government consumption 7.50 (14.50) 6.44 (18.10) 6.75 (17.06) 7.03 (16.08) 8.31 (11.76) 6.30 (18.58) 5.57 (21.05) 5.31 (21.95)<br />
B. Transfers and subsidies 10.00 (0.00) 8.72 (5.20)<br />
C. Government enterprises and investment 0.00 (53.80) 0.00 (53.50) 2.00 (40.03) 8.00 (17.20) 4.00 (34.60) 7.00 (24.15) 4.00 (30.01) 6.00 (29.20)<br />
D. Top marginal tax rate 0.00 2.00 6.00 5.00 5.50 5.50 5.50<br />
(i) Top marginal income tax rate 0.00 (95) 3.00 (50) 8.00 (30) 7.00 (31) 8.00 (30) 8.00 (30) 8.00 (30)<br />
(ii) Top marginal income and payroll tax rate 1.00 (57) 4.00 (45) 3.00 (46) 3.00 (46) 3.00 (48) 3.00 (48)<br />
Area 2. Legal System and Property Rights 6.13 5.85 5.21 5.41 6.15 5.65 5.78 5.73<br />
A. Judicial independence 4.91 4.18 4.36<br />
B. Impartial courts 5.84 5.84 4.46 4.33 4.65<br />
C. Protection of property rights 4.90 4.42 4.23<br />
D. Military interference in rule of law and politics 7.81 6.67 6.67 6.67 6.67<br />
E. Integrity of the legal system 4.11 8.33 8.33 8.33 8.33<br />
F. Legal enforcement of contracts 6.11 6.11 6.11<br />
G. Regulatory restrictions on sale of real property 7.10 7.17 7.17<br />
H. Reliability of police 4.19 4.68 5.48<br />
I. Business costs of crime 4.18 6.12 4.62<br />
Area 3. Sound Money 4.11 4.92 4.58 5.02 7.59 7.57 7.53 7.71<br />
A. Money growth 5.94 (20.30) 7.92 (10.40) 4.00 (30.00) 4.48 (27.60) 8.72 (6.40) 7.32 (13.41) 7.99 (10.04) 7.54 (12.29)<br />
B. Standard deviation of inflation 6.54 (8.66) 8.43 (3.93) 8.70 (3.26) 6.38 (9.06) 7.83 (5.43) 9.68 (0.80) 9.54 (1.16) 9.54 (1.14)<br />
C. Inflation: most recent year 3.96 (30.20) 3.34 (33.28) 5.64 (21.82) 4.23 (28.86) 8.82 (5.92) 8.27 (8.63) 7.57 (12.14) 8.76 (6.20)<br />
D. <strong>Freedom</strong> to own foreign currency bank accounts 0.00 0.00 0.00 5.00 5.00 5.00 5.00 5.00<br />
Area 4. <strong>Freedom</strong> to Trade Internationally 1.62 1.57 1.51 5.02 5.24 6.13 6.00 6.05<br />
A. Tariffs 4.87 4.70 4.53 5.26 4.96 4.94 4.92 4.96<br />
(i) Revenue from trade taxes (% of trade sector) 4.87 (7.70) 5.80 (6.30) 5.00 (7.50) 4.60 (8.10) 2.07 (11.90) 2.07 (11.90) 2.07 (11.90) 2.07 (11.90)<br />
(ii) Mean tariff rate 3.60 (32.00) 4.06 (29.70) 6.10 (19.50) 6.18 (19.10) 7.42 (12.90) 7.48 (12.60) 7.50 (12.50)<br />
(iii) Standard deviation of tariff rates 5.08 (12.30) 6.64 (8.40) 5.33 (11.68) 5.21 (11.97) 5.30 (11.75)<br />
B. Regulatory trade barriers 5.60 5.78 5.81<br />
(i) Non-tariff trade barriers 4.93 5.35 5.12<br />
(ii) Compliance cost of importing and exporting 6.28 6.22 6.50<br />
C. Black-market exchange rates 0.00 0.00 0.00 9.80 10.00 10.00 10.00 10.00<br />
D. Controls of the movement of capital and people 0.00 0.00 0.00 0.00 0.77 3.97 3.29 3.42<br />
(i) Foreign ownership/investment restrictions 7.38 5.34 5.72<br />
(ii) Capital controls 0.00 0.00 0.00 0.00 0.77 0.00 0.00 0.00<br />
(iii) <strong>Freedom</strong> of foreigners to visit 4.54 4.54 4.54<br />
Area 5. Regulation 4.35 3.21 4.51 4.20 4.80 6.15 6.38 6.68<br />
A. Credit market regulations 1.64 0.30 3.74 2.90 4.50 7.89 8.25 8.83<br />
(i) Ownership of banks 0.00 0.00 0.00 0.00 0.00 8.00 8.00 10.00<br />
(ii) Private sector credit 0.93 0.89 7.21 4.69 4.51 6.67 6.74 6.49<br />
(iii) Interest rate controls/negative real interest rates 4.00 0.00 4.00 4.00 9.00 9.00 10.00 10.00<br />
B. Labor market regulations 5.76 5.80 5.84<br />
(i) Hiring regulations and minimum wage 0.00 1.10 1.10<br />
(ii) Hiring and firing regulations 5.09 4.51 4.66<br />
(iii) Centralized collective bargaining 7.43 5.13 5.21<br />
(iv) Hours regulations 8.70 10.00 10.00<br />
(v) Mandated cost of worker dismissal 8.33 9.07 9.07<br />
(vi) Conscription 10.00 5.00 5.00 5.00 5.00 5.00 5.00 5.00<br />
C. Business regulations 4.80 5.08 5.36<br />
(i) Administrative requirements 4.19 3.90 3.95<br />
(ii) Bureaucracy costs 2.98 5.55 3.80<br />
(iii) Starting a business 8.08 8.75 8.77<br />
(iv) Extra payments/bribes/favoritism 4.60 3.64 3.71<br />
(v) Licensing restrictions 0.90 0.58 3.86<br />
(vi) Cost of tax compliance 8.07 8.07 8.07
Country Data Tables • 157<br />
Thailand 1980 1985 1990 1995 2000 2005 2009 2010<br />
Chain-Linked Rating (Rank) Rating (Rank) Rating (Rank) Rating (Rank) Rating (Rank) Rating (Rank) Rating (Rank) Rating (Rank)<br />
Summary Rating (Rank) 6.09 (26) 6.17 (27) 6.83 (26) 7.18 (31) 6.51 (68) 6.68 (72) 6.69 (71) 6.66 (75)<br />
Area 1. Size of Government 6.01 (23) 5.58 (36) 7.36 (12) 7.76 (16) 6.84 (40) 7.12 (46) 7.08 (34) 7.43 (34)<br />
Area 2. Legal System and Property Rights 6.52 (25) 5.85 (37) 6.43 (31) 5.41 (74) 5.99 (61) 5.97 (59) 5.37 (76) 5.09 (78)<br />
Area 3. Sound Money 6.32 (49) 7.02 (35) 7.97 (32) 9.46 (24) 6.61 (96) 6.76 (93) 7.08 (87) 7.06 (91)<br />
Area 4. <strong>Freedom</strong> to Trade Internationally 5.66 (37) 5.89 (33) 5.90 (43) 6.42 (66) 7.03 (68) 6.66 (79) 7.08 (65) 6.86 (75)<br />
Area 5. Regulation 5.85 (40) 6.51 (26) 6.38 (35) 6.77 (32) 6.07 (77) 6.82 (59) 6.84 (58) 6.88 (58)<br />
Unadjusted<br />
Summary Rating (Rank) 5.86 (31) 5.94 (35) 6.69 (30) 7.07 (33) 6.51 (66) 6.72 (76) 6.73 (82) 6.70 (87)<br />
Rating (Data) Rating (Data) Rating (Data) Rating (Data) Rating (Data) Rating (Data) Rating (Data) Rating (Data)<br />
Area 1. Size of Government 6.01 5.58 7.36 7.76 6.84 7.12 7.08 7.43<br />
A. Government consumption 7.11 (15.81) 6.51 (17.86) 7.57 (14.26) 7.19 (15.57) 6.77 (17.00) 6.71 (17.18) 6.04 (19.47) 6.05 (19.44)<br />
B. Transfers and subsidies 9.95 (0.70) 9.81 (1.20) 9.86 (1.00) 9.84 (1.10) 9.60 (1.96) 8.79 (4.95) 9.29 (3.09) 9.67 (1.70)<br />
C. Government enterprises and investment 4.00 (31.90) 4.00 (32.00) 8.00 (15.20) 7.00 (21.60) 4.00 (37.20) 7.00 (24.70) 6.00 (27.13) 7.00 (23.81)<br />
D. Top marginal tax rate 3.00 2.00 4.00 7.00 7.00 6.00 7.00 7.00<br />
(i) Top marginal income tax rate 3.00 (60) 2.00 (65) 4.00 (55) 7.00 (37) 7.00 (37) 6.00 (37) 7.00 (37) 7.00 (37)<br />
(ii) Top marginal income and payroll tax rate 4.00 (55) 7.00 (37) 7.00 (37) 6.00 (37) 7.00 (37) 7.00 (37)<br />
Area 2. Legal System and Property Rights 6.52 5.85 6.43 5.41 5.99 6.28 5.64 5.35<br />
A. Judicial independence 5.77 5.85 5.67 5.53 5.34<br />
B. Impartial courts 3.75 4.68 5.87 5.12 4.86<br />
C. Protection of property rights 3.60 4.42 7.11 4.85 4.29<br />
D. Military interference in rule of law and politics 6.96 6.67 6.67 5.83 5.00<br />
E. Integrity of the legal system 6.96 8.33 4.17 4.17 4.17<br />
F. Legal enforcement of contracts 6.11 6.11 6.11<br />
G. Regulatory restrictions on sale of real property 7.89 8.55 7.89<br />
H. Reliability of police 6.27 4.65 5.98<br />
I. Business costs of crime 6.74 5.99 4.53<br />
Area 3. Sound Money 6.32 7.02 7.97 9.46 6.61 6.76 7.08 7.06<br />
A. Money growth 8.96 (5.20) 9.49 (−2.55) 8.69 (6.56) 9.42 (2.90) 8.71 (6.47) 8.53 (7.34) 8.97 (5.16) 9.32 (3.40)<br />
B. Standard deviation of inflation 8.85 (2.87) 9.02 (2.45) 9.34 (1.66) 9.62 (0.96) 8.06 (4.86) 9.40 (1.49) 9.53 (1.17) 9.57 (1.08)<br />
C. Inflation: most recent year 7.46 (12.70) 9.56 (2.18) 8.85 (5.77) 8.80 (6.01) 9.69 (1.57) 9.09 (4.54) 9.83 (−0.85) 9.34 (3.31)<br />
D. <strong>Freedom</strong> to own foreign currency bank accounts 0.00 0.00 5.00 10.00 0.00 0.00 0.00 0.00<br />
Area 4. <strong>Freedom</strong> to Trade Internationally 5.16 5.37 5.07 6.09 7.03 6.44 6.84 6.63<br />
A. Tariffs 4.47 4.71 3.21 4.57 6.65 6.84 7.37 7.37<br />
(i) Revenue from trade taxes (% of trade sector) 5.40 (6.90) 5.67 (6.50) 6.40 (5.40) 7.67 (3.50) 9.06 (1.41) 9.29 (1.06) 9.36 (0.96) 9.36 (0.96)<br />
(ii) Mean tariff rate 3.54 (32.30) 3.76 (31.20) 1.84 (40.80) 2.80 (36.00) 6.60 (17.00) 7.88 (10.60) 8.02 (9.90) 8.02 (9.90)<br />
(iii) Standard deviation of tariff rates 1.40 (21.50) 3.24 (16.90) 4.28 (14.30) 3.35 (16.64) 4.73 (13.17) 4.73 (13.17)<br />
B. Regulatory trade barriers 5.13 7.20 5.89 7.08 6.07<br />
(i) Non-tariff trade barriers 5.13 5.73 5.00 5.97 5.45<br />
(ii) Compliance cost of importing and exporting 8.66 6.78 8.18 6.69<br />
C. Black-market exchange rates 9.00 9.40 10.00 10.00 10.00 10.00 10.00 10.00<br />
D. Controls of the movement of capital and people 2.00 2.00 2.00 4.65 4.28 3.01 2.93 3.07<br />
(i) Foreign ownership/investment restrictions 7.30 7.02 6.25 5.99 6.43<br />
(ii) Capital controls 2.00 2.00 2.00 2.00 1.54 1.54 1.54 1.54<br />
(iii) <strong>Freedom</strong> of foreigners to visit 1.25 1.25 1.25<br />
Area 5. Regulation 5.29 5.88 6.62 6.65 6.07 6.99 7.01 7.05<br />
A. Credit market regulations 6.67 8.65 8.26 9.08 8.06 9.33 8.99 9.27<br />
(i) Ownership of banks 8.00 8.00 8.00 8.00 5.00 8.00 8.00 8.00<br />
(ii) Private sector credit 8.02 7.96 8.78 9.23 9.17 10.00 8.97 9.80<br />
(iii) Interest rate controls/negative real interest rates 4.00 10.00 8.00 10.00 10.00 10.00 10.00 10.00<br />
B. Labor market regulations 4.98 5.39 4.30 5.43 5.70 5.63<br />
(i) Hiring regulations and minimum wage 5.77 3.94 6.70 6.67 6.67<br />
(ii) Hiring and firing regulations 7.01 7.01 4.60 4.75 5.81 5.59<br />
(iii) Centralized collective bargaining 7.93 7.93 7.93 7.93 6.45 6.12 6.34 6.14<br />
(iv) Hours regulations 6.27 6.51 10.00 10.00 10.00<br />
(v) Mandated cost of worker dismissal 4.99 5.36 5.36<br />
(vi) Conscription 0.00 0.00 0.00 0.00 0.00 0.00 0.00 0.00<br />
C. Business regulations 5.47 5.86 6.20 6.34 6.26<br />
(i) Administrative requirements 6.88 4.89 4.34 4.28<br />
(ii) Bureaucracy costs 6.77 3.98 2.17 4.51 4.57<br />
(iii) Starting a business 6.53 7.28 8.88 8.92 9.01<br />
(iv) Extra payments/bribes/favoritism 3.11 5.31 5.85 4.85 4.31<br />
(v) Licensing restrictions 8.35 8.36 8.34<br />
(vi) Cost of tax compliance 7.04 7.04 7.04<br />
www.freetheworld.com • www.fraserinstitute.org • Fraser Institute ©2012
158 • <strong>Economic</strong> <strong>Freedom</strong> of the <strong>World</strong>: 2012 Annual Report<br />
Togo<br />
Fraser Institute ©2012 • www.fraserinstitute.org • www.freetheworld.com<br />
1980 1985 1990 1995 2000 2005 2009 2010<br />
Chain-Linked Rating (Rank) Rating (Rank) Rating (Rank) Rating (Rank) Rating (Rank) Rating (Rank) Rating (Rank) Rating (Rank)<br />
Summary Rating (Rank) 4.07 (82) 5.15 (57) 5.73 (49) 5.46 (84) 5.81 (97) 6.13 (92) 5.56 (114) 5.79 (109)<br />
Area 1. Size of Government 1.60 (107) 3.80 (86) 6.43 (30) 6.86 (29) 8.44 (7) 8.70 (7) 6.33 (62) 6.54 (56)<br />
Area 2. Legal System and Property Rights 3.33 (63) 4.22 (70) 4.48 (68) 5.00 (85) 3.59 (108) 3.11 (111) 3.22 (113) 3.19 (112)<br />
Area 3. Sound Money 5.53 (79) 6.75 (49) 6.95 (50) 5.03 (92) 6.48 (98) 6.88 (90) 6.63 (105) 6.69 (101)<br />
Area 4. <strong>Freedom</strong> to Trade Internationally 5.87 (90) 6.38 (83) 6.43 (86) 6.65 (85)<br />
Area 5. Regulation 4.89 (73) 4.97 (74) 4.96 (78) 4.88 (95) 4.65 (111) 5.38 (110) 5.30 (114) 6.03 (98)<br />
Unadjusted<br />
Summary Rating (Rank) 3.99 (86) 5.27 (59) 5.44 (61) 5.38 (83) 5.84 (92) 5.97 (112) 5.37 (131) 5.59 (133)<br />
Rating (Data) Rating (Data) Rating (Data) Rating (Data) Rating (Data) Rating (Data) Rating (Data) Rating (Data)<br />
Area 1. Size of Government 1.60 5.69 6.43 6.86 8.44 9.65 7.03 7.26<br />
A. Government consumption 3.20 (29.11) 7.60 (14.18) 6.87 (16.65) 7.72 (13.76) 8.88 (9.82) 8.96 (9.52) 7.69 (13.85) 8.13 (12.36)<br />
B. Transfers and subsidies 9.48 (2.40) 10.00 (0.28) 9.39 (2.74) 9.65 (1.79)<br />
C. Government enterprises and investment 0.00 (71.70) 0.00 (73.90) 6.00 (28.80) 6.00 (25.80) 8.00 (16.80) 10.00 (12.50) 4.00 (12.50) 4.00 (12.50)<br />
D. Top marginal tax rate<br />
(i) Top marginal income tax rate<br />
(ii) Top marginal income and payroll tax rate<br />
Area 2. Legal System and Property Rights<br />
A. Judicial independence<br />
3.33 4.22 4.48 4.75 3.73 2.48 2.57 2.55<br />
B. Impartial courts<br />
C. Protection of property rights<br />
4.15 4.11 3.70 4.00 3.90<br />
D. Military interference in rule of law and politics 3.90 1.67 0.14 0.00 0.00<br />
E. Integrity of the legal system 6.96 5.00 5.00 5.00 5.00<br />
F. Legal enforcement of contracts 3.15 3.15 3.15<br />
G. Regulatory restrictions on sale of real property<br />
H. Reliability of police<br />
I. Business costs of crime<br />
0.43 0.73 0.73<br />
Area 3. Sound Money 5.53 6.75 6.95 5.03 6.48 6.88 6.63 6.69<br />
A. Money growth 8.66 (6.68) 9.66 (−1.72) 9.03 (−4.84) 8.06 (9.71) 8.66 (6.69) 9.94 (−0.32) 8.10 (9.50) 8.29 (8.54)<br />
B. Standard deviation of inflation 5.56 (11.11) 8.04 (4.90) 9.37 (1.58) 4.50 (13.74) 7.65 (5.88) 8.94 (2.66) 8.82 (2.95) 8.84 (2.91)<br />
C. Inflation: most recent year 7.91 (10.47) 9.32 (3.40) 9.40 (2.98) 7.57 (12.17) 9.62 (1.89) 8.64 (6.80) 9.61 (1.95) 9.63 (1.83)<br />
D. <strong>Freedom</strong> to own foreign currency bank accounts 0.00 0.00 0.00 0.00 0.00 0.00 0.00 0.00<br />
Area 4. <strong>Freedom</strong> to Trade Internationally 3.78 4.69 4.36 5.87 6.06 6.11 6.32<br />
A. Tariffs 1.73 4.27 3.87 7.60 7.39 7.52 7.52<br />
(i) Revenue from trade taxes (% of trade sector) 1.73 (12.40) 4.27 (8.60) 3.87 (9.20) 7.82 (3.27) 7.66 (3.50) 7.66 (3.50)<br />
(ii) Mean tariff rate 7.60 (12.00) 7.08 (14.60) 7.62 (11.90) 7.62 (11.90)<br />
(iii) Standard deviation of tariff rates 7.26 (6.84) 7.29 (6.78) 7.29 (6.78)<br />
B. Regulatory trade barriers<br />
(i) Non-tariff trade barriers<br />
6.34 6.40 7.25<br />
(ii) Compliance cost of importing and exporting 6.34 6.40 7.25<br />
C. Black-market exchange rates 9.60 9.80 9.20 9.80 10.00 10.00 10.00 10.00<br />
D. Controls of the movement of capital and people<br />
(i) Foreign ownership/investment restrictions<br />
0.00 0.00 0.00 0.00 0.00 0.50 0.50 0.50<br />
(ii) Capital controls 0.00 0.00 0.00 0.00 0.00 0.77 0.77 0.77<br />
(iii) <strong>Freedom</strong> of foreigners to visit 0.23 0.23 0.23<br />
Area 5. Regulation 5.70 4.97 4.96 4.88 4.65 4.77 4.49 5.11<br />
A. Credit market regulations 6.42 6.61 6.59 6.38 5.78 4.80 4.20 6.17<br />
(i) Ownership of banks 2.00 2.00 2.00 2.00 2.00 5.00 5.00 5.00<br />
(ii) Private sector credit 9.26 9.82 9.77 9.15 9.33 3.40 3.40 7.34<br />
(iii) Interest rate controls/negative real interest rates 8.00 8.00 8.00 8.00 6.00 6.00<br />
B. Labor market regulations 4.57 4.19 4.19<br />
(i) Hiring regulations and minimum wage<br />
(ii) Hiring and firing regulations<br />
(iii) Centralized collective bargaining<br />
5.60 1.67 1.67<br />
(iv) Hours regulations 6.00 8.00 8.00<br />
(v) Mandated cost of worker dismissal 6.66 7.09 7.09<br />
(vi) Conscription 0.00 0.00 0.00 0.00 0.00 0.00 0.00<br />
C. Business regulations<br />
(i) Administrative requirements<br />
(ii) Bureaucracy costs<br />
4.94 5.09 4.97<br />
(iii) Starting a business<br />
(iv) Extra payments/bribes/favoritism<br />
3.88 4.13 3.86<br />
(v) Licensing restrictions 3.96 4.15 4.08<br />
(vi) Cost of tax compliance 6.97 6.97 6.97
Trinidad and Tobago<br />
Country Data Tables • 159<br />
1980 1985 1990 1995 2000 2005 2009 2010<br />
Chain-Linked Rating (Rank) Rating (Rank) Rating (Rank) Rating (Rank) Rating (Rank) Rating (Rank) Rating (Rank) Rating (Rank)<br />
Summary Rating (Rank) 4.83 (63) 4.80 (77) 5.52 (56) 7.29 (27) 7.55 (25) 7.14 (49) 7.06 (56) 6.90 (65)<br />
Area 1. Size of Government 5.48 (36) 3.79 (87) 6.31 (37) 7.04 (21) 7.05 (33) 7.45 (35) 7.16 (32) 6.91 (44)<br />
Area 2. Legal System and Property Rights 5.08 (44) 4.48 (63) 5.79 (42) 5.54 (67) 6.65 (47) 5.40 (73) 5.81 (68) 5.49 (73)<br />
Area 3. Sound Money 4.50 (96) 6.16 (82) 5.94 (75) 8.61 (37) 9.03 (38) 8.58 (59) 8.06 (70) 7.96 (79)<br />
Area 4. <strong>Freedom</strong> to Trade Internationally 2.37 (71) 2.47 (77) 2.65 (92) 7.96 (32) 7.28 (60) 7.73 (41) 7.57 (46) 7.41 (49)<br />
Area 5. Regulation 6.94 (14) 7.36 (8) 7.03 (20) 7.34 (12) 7.75 (8) 6.56 (77) 6.76 (67) 6.72 (73)<br />
Unadjusted<br />
Summary Rating (Rank) 4.89 (64) 4.87 (72) 5.52 (59) 7.19 (29) 7.41 (30) 7.12 (55) 7.04 (64) 6.88 (76)<br />
Rating (Data) Rating (Data) Rating (Data) Rating (Data) Rating (Data) Rating (Data) Rating (Data) Rating (Data)<br />
Area 1. Size of Government 5.38 3.79 6.31 7.04 7.05 7.45 7.16 6.91<br />
A. Government consumption 5.64 (20.81) 3.09 (29.49) 6.81 (16.84) 6.73 (17.11) 6.74 (17.10) 5.97 (19.70) 6.40 (18.23) 5.42 (21.58)<br />
B. Transfers and subsidies 8.50 (6.00) 6.08 (14.90) 7.41 (10.00) 8.45 (6.20) 8.45 (6.20) 8.83 (4.80) 8.24 (6.97) 8.24 (6.97)<br />
C. Government enterprises and investment 2.00 (47.60) 2.00 (40.60) 4.00 (34.60) 8.00 (16.70) 6.00 (28.67) 7.00 (23.59) 7.00 (23.59) 7.00<br />
D. Top marginal tax rate 4.00 7.00 5.00 7.00 8.00 7.00 7.00<br />
(i) Top marginal income tax rate 4.00 (50) 7.00 (35) 5.00 (38) 7.00 (35) 8.00 (30) 9.00 (25) 9.00 (25)<br />
(ii) Top marginal income and payroll tax rate 7.00 (35) 5.00 (38) 7.00 (35) 8.00 (30) 5.00 (39) 5.00 (39)<br />
Area 2. Legal System and Property Rights 5.42 4.78 6.19 5.40 5.93 4.48 4.83 4.56<br />
A. Judicial independence 5.32 6.11 5.73<br />
B. Impartial courts 6.47 6.28 5.16 4.72 4.24<br />
C. Protection of property rights 5.30 5.98 5.36 4.96<br />
D. Military interference in rule of law and politics 7.15 8.33 8.33 8.33 8.33<br />
E. Integrity of the legal system 4.11 6.67 3.82 4.17 4.17<br />
F. Legal enforcement of contracts 2.96 2.96 2.96<br />
G. Regulatory restrictions on sale of real property 4.64 4.64 4.64<br />
H. Reliability of police 1.93 4.02 2.54<br />
I. Business costs of crime 2.22 3.17 3.51<br />
Area 3. Sound Money 4.50 6.16 5.94 8.61 9.03 8.58 8.06 7.96<br />
A. Money growth 7.62 (11.88) 9.98 (−0.09) 9.06 (4.70) 8.76 (6.18) 8.83 (5.86) 8.23 (8.83) 7.85 (10.77) 7.85 (10.77)<br />
B. Standard deviation of inflation 5.89 (10.27) 6.66 (8.34) 7.81 (5.47) 6.41 (8.98) 8.02 (4.95) 7.47 (6.33) 5.81 (10.48) 6.12 (9.70)<br />
C. Inflation: most recent year 4.49 (27.53) 7.98 (10.10) 6.90 (15.49) 9.25 (3.75) 9.29 (3.56) 8.62 (6.89) 8.61 (6.97) 7.89 (10.55)<br />
D. <strong>Freedom</strong> to own foreign currency bank accounts 0.00 0.00 0.00 10.00 10.00 10.00 10.00 10.00<br />
Area 4. <strong>Freedom</strong> to Trade Internationally 2.69 2.87 2.71 8.13 7.28 7.75 7.59 7.43<br />
A. Tariffs 7.87 6.40 6.12 6.99 5.40 7.83 7.23 7.23<br />
(i) Revenue from trade taxes (% of trade sector) 7.87 (3.20) 6.20 (5.70) 8.20 (2.70) 8.87 (1.70) 3.20 (10.20) 9.07 (1.40) 7.73 (3.41) 7.73 (3.41)<br />
(ii) Mean tariff rate 6.60 (17.00) 6.28 (18.60) 7.18 (14.10) 6.32 (18.40) 8.44 (7.80) 8.50 (7.50) 8.50 (7.50)<br />
(iii) Standard deviation of tariff rates 3.88 (15.30) 4.92 (12.70) 6.68 (8.30) 5.98 (10.06) 5.47 (11.33) 5.47 (11.33)<br />
B. Regulatory trade barriers 6.20 6.53 7.15 6.44<br />
(i) Non-tariff trade barriers 6.20 5.70 6.49 6.06<br />
(ii) Compliance cost of importing and exporting 7.37 7.80 6.81<br />
C. Black-market exchange rates 0.20 2.20 2.00 9.40 10.00 10.00 10.00 10.00<br />
D. Controls of the movement of capital and people 0.00 0.00 0.00 8.00 7.53 6.65 5.99 6.03<br />
(i) Foreign ownership/investment restrictions 8.15 7.37 6.14 6.27<br />
(ii) Capital controls 0.00 0.00 0.00 8.00 6.92 6.92 6.15 6.15<br />
(iii) <strong>Freedom</strong> of foreigners to visit 5.67 5.67 5.67<br />
Area 5. Regulation 6.47 6.77 6.46 6.75 7.75 7.34 7.56 7.52<br />
A. Credit market regulations 6.90 8.04 7.24 7.99 8.99 8.33 9.00 9.33<br />
(i) Ownership of banks 5.00 8.00 8.00 8.00 8.00 8.00 8.00 8.00<br />
(ii) Private sector credit 8.81 8.12 7.71 9.98 9.98 10.00 10.00 10.00<br />
(iii) Interest rate controls/negative real interest rates 8.00 6.00 6.00 9.00 7.00 9.00 10.00<br />
B. Labor market regulations 7.15 7.54 7.51 7.38<br />
(i) Hiring regulations and minimum wage 5.34 10.00 10.00 10.00<br />
(ii) Hiring and firing regulations 5.80 5.35 4.86 4.59<br />
(iii) Centralized collective bargaining 7.47 6.13 5.84 5.30<br />
(iv) Hours regulations 10.00 10.00 10.00<br />
(v) Mandated cost of worker dismissal 3.79 4.38 4.38<br />
(vi) Conscription 10.00 10.00 10.00 10.00 10.00 10.00 10.00 10.00<br />
C. Business regulations 7.10 6.14 6.18 5.86<br />
(i) Administrative requirements 7.47 3.27 4.11 4.04<br />
(ii) Bureaucracy costs 7.70 4.75 4.97 4.52<br />
(iii) Starting a business 6.63 8.61 8.61 8.61<br />
(iv) Extra payments/bribes/favoritism 6.60 4.84 5.05 4.27<br />
(v) Licensing restrictions 6.65 6.65 6.06<br />
(vi) Cost of tax compliance 8.72 7.65 7.65<br />
www.freetheworld.com • www.fraserinstitute.org • Fraser Institute ©2012
160 • <strong>Economic</strong> <strong>Freedom</strong> of the <strong>World</strong>: 2012 Annual Report<br />
Tunisia<br />
Fraser Institute ©2012 • www.fraserinstitute.org • www.freetheworld.com<br />
1980 1985 1990 1995 2000 2005 2009 2010<br />
Chain-Linked Rating (Rank) Rating (Rank) Rating (Rank) Rating (Rank) Rating (Rank) Rating (Rank) Rating (Rank) Rating (Rank)<br />
Summary Rating (Rank) 4.82 (64) 4.60 (82) 5.32 (67) 5.73 (75) 6.08 (83) 6.02 (99) 6.26 (93) 6.21 (99)<br />
Area 1. Size of Government 4.87 (59) 4.48 (71) 5.81 (53) 4.56 (94) 5.28 (86) 5.17 (98) 6.97 (37) 6.97 (41)<br />
Area 2. Legal System and Property Rights 4.92 (45) 3.52 (82) 3.50 (80) 6.29 (48) 7.33 (35) 7.36 (30) 7.49 (28) 6.80 (43)<br />
Area 3. Sound Money 6.18 (58) 6.50 (65) 6.98 (47) 7.02 (56) 7.05 (77) 7.30 (83) 6.81 (97) 6.85 (98)<br />
Area 4. <strong>Freedom</strong> to Trade Internationally 3.74 (58) 3.74 (65) 5.04 (56) 5.47 (89) 5.43 (101) 4.93 (117) 4.71 (117) 4.85 (117)<br />
Area 5. Regulation 4.44 (82) 4.69 (78) 5.27 (72) 5.29 (84) 5.30 (104) 5.39 (109) 5.55 (111) 5.64 (111)<br />
Unadjusted<br />
Summary Rating (Rank) 4.71 (70) 4.49 (86) 5.38 (63) 5.66 (76) 5.90 (89) 6.60 (82) 6.87 (73) 6.81 (80)<br />
Rating (Data) Rating (Data) Rating (Data) Rating (Data) Rating (Data) Rating (Data) Rating (Data) Rating (Data)<br />
Area 1. Size of Government 4.19 3.86 5.81 4.56 5.28 5.23 7.05 7.05<br />
A. Government consumption 6.17 (19.03) 5.16 (22.46) 5.75 (20.45) 5.56 (21.11) 5.74 (20.50) 6.01 (19.58) 5.65 (20.78) 5.70 (20.61)<br />
B. Transfers and subsidies 8.61 (5.60) 8.28 (6.80) 7.68 (9.00) 8.14 (7.34) 8.10 (7.47) 7.41 (10.00) 7.05 (11.33) 7.00 (11.50)<br />
C. Government enterprises and investment 0.00 (53.10) 0.00 (52.80) 4.00 (35.90) 0.00 (50.70) 2.00 (47.40) 2.00 (44.40) 10.00 (14.34) 10.00 (14.34)<br />
D. Top marginal tax rate 2.00 2.00 5.50 5.50 5.50<br />
(i) Top marginal income tax rate 2.00 (62) 2.00 (62) 7.00 (35) 7.00 (35) 7.00 (35)<br />
(ii) Top marginal income and payroll tax rate 4.00 (51) 4.00 (51) 4.00 (51)<br />
Area 2. Legal System and Property Rights 4.92 3.52 3.50 5.68 6.43 6.98 7.10 6.45<br />
A. Judicial independence 6.78 6.31 5.12<br />
B. Impartial courts 6.71 6.99 6.59 6.69 6.01<br />
C. Protection of property rights 7.37 7.31 6.48<br />
D. Military interference in rule of law and politics 8.07 6.67 6.67 6.67 6.67<br />
E. Integrity of the legal system 4.11 8.33 8.33 8.33 8.33<br />
F. Legal enforcement of contracts 4.88 4.88 4.88<br />
G. Regulatory restrictions on sale of real property 7.11 7.26 7.26<br />
H. Reliability of police 7.43 7.51 7.36<br />
I. Business costs of crime 7.67 8.99 5.93<br />
Area 3. Sound Money 6.18 6.50 6.98 7.02 7.05 7.30 6.81 6.85<br />
A. Money growth 8.64 (6.80) 8.48 (7.61) 9.63 (1.86) 9.48 (2.60) 9.04 (4.82) 9.78 (1.09) 8.63 (6.86) 8.86 (5.71)<br />
B. Standard deviation of inflation 8.63 (3.43) 8.25 (4.37) 9.20 (2.00) 9.62 (0.94) 9.75 (0.62) 9.83 (0.41) 9.37 (1.58) 9.44 (1.41)<br />
C. Inflation: most recent year 7.44 (12.80) 9.28 (3.60) 9.10 (4.48) 8.96 (5.19) 9.41 (2.93) 9.60 (2.02) 9.23 (3.83) 9.12 (4.42)<br />
D. <strong>Freedom</strong> to own foreign currency bank accounts 0.00 0.00 0.00 0.00 0.00 0.00 0.00 0.00<br />
Area 4. <strong>Freedom</strong> to Trade Internationally 3.59 3.59 5.04 5.47 5.43 6.45 6.17 6.34<br />
A. Tariffs 4.36 3.17 4.71 4.61 5.53 5.34 5.79 6.73<br />
(i) Revenue from trade taxes (% of trade sector) 4.00 (9.00) 1.13 (13.30) 3.67 (9.50) 4.00 (9.00) 7.75 (3.37) 8.69 (1.96) 8.28 (2.58) 8.31 (2.54)<br />
(ii) Mean tariff rate 4.72 (26.40) 5.20 (24.00) 4.50 (27.50) 4.50 (27.50) 3.88 (30.60) 7.32 (13.40) 5.70 (21.50) 6.70 (16.50)<br />
(iii) Standard deviation of tariff rates 5.96 (10.10) 5.32 (11.70) 4.96 (12.60) 0.00 (26.00) 3.38 (16.56) 5.18 (12.05)<br />
B. Regulatory trade barriers 6.57 7.10 6.60<br />
(i) Non-tariff trade barriers 6.30 6.19 5.77<br />
(ii) Compliance cost of importing and exporting 6.84 8.01 7.44<br />
C. Black-market exchange rates 6.40 7.60 8.40 9.80 10.00 8.79 7.16 7.05<br />
D. Controls of the movement of capital and people 0.00 0.00 2.00 2.00 0.77 5.12 4.63 4.98<br />
(i) Foreign ownership/investment restrictions 7.45 5.98 7.03<br />
(ii) Capital controls 0.00 0.00 2.00 2.00 0.77 0.77 0.77 0.77<br />
(iii) <strong>Freedom</strong> of foreigners to visit 7.14 7.14 7.14<br />
Area 5. Regulation 4.70 4.96 5.57 5.59 5.30 7.02 7.24 7.35<br />
A. Credit market regulations 4.89 5.58 7.21 7.27 6.93 7.82 8.08 8.12<br />
(i) Ownership of banks 2.00 2.00 5.00 5.00 5.00 5.00 5.00 5.00<br />
(ii) Private sector credit 8.68 8.75 8.63 8.80 8.86 8.45 9.25 9.35<br />
(iii) Interest rate controls/negative real interest rates 4.00 6.00 8.00 8.00 10.00 10.00 10.00<br />
B. Labor market regulations 6.52 6.64 6.72<br />
(i) Hiring regulations and minimum wage 7.20 7.23 8.33<br />
(ii) Hiring and firing regulations 5.83 5.33 4.89<br />
(iii) Centralized collective bargaining 5.97 5.48 5.31<br />
(iv) Hours regulations 8.70 10.00 10.00<br />
(v) Mandated cost of worker dismissal 8.42 8.79 8.79<br />
(vi) Conscription 3.00 3.00 3.00 3.00 3.00 3.00 3.00 3.00<br />
C. Business regulations 6.74 6.98 7.22<br />
(i) Administrative requirements 5.28 5.28 4.68<br />
(ii) Bureaucracy costs 4.30 3.53 5.76<br />
(iii) Starting a business 9.46 9.60 9.60<br />
(iv) Extra payments/bribes/favoritism 6.84 7.34 5.88<br />
(v) Licensing restrictions 7.54 7.78 9.01<br />
(vi) Cost of tax compliance 7.00 8.39 8.39
Turkey<br />
Country Data Tables • 161<br />
1980 1985 1990 1995 2000 2005 2009 2010<br />
Chain-Linked Rating (Rank) Rating (Rank) Rating (Rank) Rating (Rank) Rating (Rank) Rating (Rank) Rating (Rank) Rating (Rank)<br />
Summary Rating (Rank) 3.77 (91) 4.85 (74) 5.06 (76) 5.89 (70) 5.81 (97) 6.09 (94) 6.57 (78) 6.56 (81)<br />
Area 1. Size of Government 4.13 (75) 4.63 (67) 5.82 (52) 6.93 (25) 7.08 (32) 7.84 (26) 6.90 (38) 6.91 (45)<br />
Area 2. Legal System and Property Rights 5.57 (39) 5.85 (39) 4.48 (67) 4.85 (90) 5.39 (73) 5.62 (68) 4.81 (81) 4.62 (87)<br />
Area 3. Sound Money 0.78 (106) 2.68 (105) 3.87 (103) 3.21 (106) 3.57 (116) 4.84 (120) 8.91 (49) 8.86 (57)<br />
Area 4. <strong>Freedom</strong> to Trade Internationally 3.62 (60) 5.53 (39) 5.76 (47) 8.11 (27) 7.55 (53) 6.88 (70) 6.93 (73) 6.84 (76)<br />
Area 5. Regulation 4.69 (81) 5.55 (57) 5.26 (74) 6.44 (42) 5.49 (99) 5.21 (115) 5.47 (113) 5.71 (108)<br />
Unadjusted<br />
Summary Rating (Rank) 3.72 (94) 4.78 (77) 4.83 (85) 5.80 (71) 5.81 (96) 6.43 (91) 6.94 (68) 6.92 (75)<br />
Rating (Data) Rating (Data) Rating (Data) Rating (Data) Rating (Data) Rating (Data) Rating (Data) Rating (Data)<br />
Area 1. Size of Government 4.40 4.93 5.82 6.93 7.08 7.84 6.90 6.91<br />
A. Government consumption 7.09 (15.89) 8.40 (11.44) 7.71 (13.78) 7.85 (13.30) 6.93 (16.43) 6.98 (16.26) 6.75 (17.06) 6.86 (16.67)<br />
B. Transfers and subsidies 8.50 (6.00) 7.30 (10.40) 9.07 (3.90) 7.86 (8.36) 9.37 (2.81) 9.38 (2.77) 6.86 (12.04) 6.77 (12.37)<br />
C. Government enterprises and investment 2.00 (40.00) 2.00 (45.50) 4.00 (31.70) 8.00 (16.50) 7.00 (22.80) 8.00 (15.70) 7.00 (21.65) 7.00 (20.57)<br />
D. Top marginal tax rate 0.00 2.00 2.50 4.00 5.00 7.00 7.00 7.00<br />
(i) Top marginal income tax rate 0.00 (75) 2.00 (63) 4.00 (50) 4.00 (55) 6.00 (45) 7.00 (40) 7.00 (35) 7.00 (35)<br />
(ii) Top marginal income and payroll tax rate 1.00 (57) 4.00 (55) 4.00 (46) 7.00 (40) 7.00 (35) 7.00 (35)<br />
Area 2. Legal System and Property Rights 5.57 5.85 4.48 4.85 5.39 6.39 5.47 5.25<br />
A. Judicial independence 5.47 5.34 5.30 4.01 3.77<br />
B. Impartial courts 6.62 6.51 4.68 4.17 4.43<br />
C. Protection of property rights 4.25 3.43 6.35 5.08 5.35<br />
D. Military interference in rule of law and politics 3.80 5.00 6.67 3.33 3.33<br />
E. Integrity of the legal system 4.11 6.67 7.50 7.50 5.83<br />
F. Legal enforcement of contracts 6.16 6.16 5.60<br />
G. Regulatory restrictions on sale of real property 8.87 8.90 8.80<br />
H. Reliability of police 5.87 4.29 5.95<br />
I. Business costs of crime 6.14 5.81 4.19<br />
Area 3. Sound Money 0.78 2.68 3.87 3.21 3.57 4.84 8.91 8.86<br />
A. Money growth 3.14 (34.30) 5.02 (24.88) 2.36 (38.20) 0.00 (50.41) 0.00 (81.91) 0.00 (59.29) 8.18 (9.10) 8.34 (8.30)<br />
B. Standard deviation of inflation 0.00 (27.75) 5.71 (10.72) 3.11 (17.23) 2.84 (17.89) 4.27 (14.33) 1.40 (21.49) 8.73 (3.18) 8.80 (3.00)<br />
C. Inflation: most recent year 0.00 (85.04) 0.00 (52.18) 0.00 (58.21) 0.00 (86.99) 0.00 (54.92) 7.97 (10.14) 8.75 (6.25) 8.29 (8.57)<br />
D. <strong>Freedom</strong> to own foreign currency bank accounts 0.00 0.00 10.00 10.00 10.00 10.00 10.00 10.00<br />
Area 4. <strong>Freedom</strong> to Trade Internationally 3.43 5.25 4.71 7.75 7.55 7.38 7.43 7.33<br />
A. Tariffs 3.50 6.34 4.53 8.31 7.42 6.87 6.20 6.16<br />
(i) Revenue from trade taxes (% of trade sector) 5.80 (6.30) 8.00 (3.00) 8.13 (2.80) 9.00 (1.50) 9.55 (0.67) 9.73 (0.41) 9.34 (0.99) 9.30 (1.05)<br />
(ii) Mean tariff rate 1.20 (44.00) 4.68 (26.60) 5.46 (22.70) 8.20 (9.00) 8.58 (7.10) 9.52 (2.40) 8.06 (9.70) 8.02 (9.90)<br />
(iii) Standard deviation of tariff rates 0.00 (35.70) 7.72 (5.70) 4.12 (14.70) 1.36 (21.60) 1.19 (22.02) 1.17 (22.08)<br />
B. Regulatory trade barriers 7.60 6.98 6.60 7.07 6.86<br />
(i) Non-tariff trade barriers 7.60 5.63 6.28 6.08 5.66<br />
(ii) Compliance cost of importing and exporting 8.33 6.93 8.05 8.06<br />
C. Black-market exchange rates 6.80 9.40 9.60 9.60 10.00 10.00 10.00 10.00<br />
D. Controls of the movement of capital and people 0.00 0.00 0.00 5.49 5.79 6.03 6.44 6.30<br />
(i) Foreign ownership/investment restrictions 8.98 9.27 6.55 6.25 5.82<br />
(ii) Capital controls 0.00 0.00 0.00 2.00 2.31 1.54 3.08 3.08<br />
(iii) <strong>Freedom</strong> of foreigners to visit 10.00 10.00 10.00<br />
Area 5. Regulation 4.41 5.21 5.28 6.27 5.49 5.69 5.98 6.25<br />
A. Credit market regulations 3.99 6.65 5.41 7.78 6.14 6.65 6.90 7.79<br />
(i) Ownership of banks 8.00 8.00 8.00 8.00 8.00 5.00 5.00 5.00<br />
(ii) Private sector credit 3.98 3.96 6.22 7.35 4.29 4.95 5.69 8.36<br />
(iii) Interest rate controls/negative real interest rates 0.00 8.00 2.00 8.00 10.00 10.00 10.00<br />
B. Labor market regulations 5.16 5.35 4.49 3.83 4.78 4.76<br />
(i) Hiring regulations and minimum wage 6.35 3.38 4.40 5.57 5.57<br />
(ii) Hiring and firing regulations 7.23 7.23 5.32 4.02 5.03 5.00<br />
(iii) Centralized collective bargaining 7.24 7.24 7.24 7.24 6.57 6.39 7.11 7.06<br />
(iv) Hours regulations 4.93 6.18 6.00 8.00 8.00<br />
(v) Mandated cost of worker dismissal 1.19 1.97 1.97<br />
(vi) Conscription 0.00 0.00 1.00 1.00 1.00 1.00 1.00 1.00<br />
C. Business regulations 5.67 5.82 6.60 6.27 6.19<br />
(i) Administrative requirements 7.40 3.28 3.47 3.34<br />
(ii) Bureaucracy costs 6.24 5.15 6.21 4.98 4.64<br />
(iii) Starting a business 7.55 5.22 9.47 9.59 9.66<br />
(iv) Extra payments/bribes/favoritism 3.23 5.52 6.33 4.68 4.51<br />
(v) Licensing restrictions 7.13 7.43 7.48<br />
(vi) Cost of tax compliance 7.15 7.50 7.50<br />
www.freetheworld.com • www.fraserinstitute.org • Fraser Institute ©2012
162 • <strong>Economic</strong> <strong>Freedom</strong> of the <strong>World</strong>: 2012 Annual Report<br />
Uganda<br />
Fraser Institute ©2012 • www.fraserinstitute.org • www.freetheworld.com<br />
1980 1985 1990 1995 2000 2005 2009 2010<br />
Chain-Linked Rating (Rank) Rating (Rank) Rating (Rank) Rating (Rank) Rating (Rank) Rating (Rank) Rating (Rank) Rating (Rank)<br />
Summary Rating (Rank) 3.14 (100) 2.82 (107) 2.86 (112) 5.15 (94) 6.83 (50) 7.13 (50) 7.31 (39) 7.47 (33)<br />
Area 1. Size of Government 3.77 (89) 4.90 (75) 7.47 (17) 6.73 (45) 7.54 (33) 7.45 (28) 7.66 (26)<br />
Area 2. Legal System and Property Rights 2.76 (72) 2.93 (93) 2.44 (101) 4.45 (100) 4.80 (82) 5.03 (78) 5.23 (77) 5.44 (75)<br />
Area 3. Sound Money 0.00 (107) 0.00 (111) 0.28 (116) 4.62 (98) 9.30 (31) 8.70 (54) 8.40 (62) 8.71 (60)<br />
Area 4. <strong>Freedom</strong> to Trade Internationally 2.96 (66) 2.71 (74) 1.80 (99) 4.76 (98) 7.96 (40) 7.41 (49) 8.27 (17) 8.61 (6)<br />
Area 5. Regulation 4.72 (80) 4.70 (76) 4.95 (79) 4.47 (106) 5.32 (103) 6.74 (66) 7.05 (44) 6.84 (62)<br />
Unadjusted<br />
Summary Rating (Rank) 2.79 (104) 2.82 (108) 2.80 (112) 5.17 (90) 6.79 (51) 6.97 (65) 7.14 (56) 7.30 (50)<br />
Rating (Data) Rating (Data) Rating (Data) Rating (Data) Rating (Data) Rating (Data) Rating (Data) Rating (Data)<br />
Area 1. Size of Government 3.73 4.52 7.47 6.73 7.54 7.45 7.66<br />
A. Government consumption 7.20 (15.51) 9.57 (7.48) 8.68 (10.49) 7.50 (14.51) 7.16 (15.65) 7.85 (13.32) 7.74 (13.69)<br />
B. Transfers and subsidies 9.20 (3.42) 8.94 (4.40) 9.99 (0.55) 9.97 (0.61) 9.89 (0.90)<br />
C. Government enterprises and investment 2.00 (42.80) 4.00 (39.00) 2.00 (49.10) 6.00 (27.80) 4.00 (31.50) 7.00 (22.40) 6.00 (25.84) 7.00 (24.09)<br />
D. Top marginal tax rate 0.00 2.00 6.00 6.50 6.00 6.00 6.00<br />
(i) Top marginal income tax rate 0.00 (70) 3.00 (50) 8.00 (30) 8.00 (30) 8.00 (30) 8.00 (30) 8.00 (30)<br />
(ii) Top marginal income and payroll tax rate 1.00 (59) 4.00 (41) 5.00 (40) 4.00 (41) 4.00 (41) 4.00 (41)<br />
Area 2. Legal System and Property Rights 2.76 2.93 2.44 4.35 4.60 4.67 4.86 5.05<br />
A. Judicial independence 4.63 3.99 4.56<br />
B. Impartial courts 5.54 4.41 4.12 4.58 4.82<br />
C. Protection of property rights 4.29 4.69 5.20<br />
D. Military interference in rule of law and politics 3.70 3.33 3.33 3.33 3.33<br />
E. Integrity of the legal system 4.11 6.67 6.67 5.83 5.83<br />
F. Legal enforcement of contracts 3.70 4.04 4.04<br />
G. Regulatory restrictions on sale of real property 7.03 7.49 8.14<br />
H. Reliability of police 3.97 5.04 4.57<br />
I. Business costs of crime 4.29 4.70 4.95<br />
Area 3. Sound Money 1.04 0.00 0.28 4.62 9.30 8.70 8.40 8.71<br />
A. Money growth 3.12 (34.40) 0.00 (76.20) 0.00 (410.00) 5.96 (20.21) 8.73 (6.34) 8.56 (7.20) 7.97 (10.14) 7.33 (13.35)<br />
B. Standard deviation of inflation 0.00 (33.80) 0.00 (40.83) 0.00 (52.40) 4.36 (14.10) 9.05 (2.39) 7.86 (5.36) 8.30 (4.25) 8.32 (4.21)<br />
C. Inflation: most recent year 0.00 (120.35) 1.12 (44.38) 8.15 (9.23) 9.43 (2.83) 8.37 (8.15) 7.31 (13.45) 9.20 (3.98)<br />
D. <strong>Freedom</strong> to own foreign currency bank accounts 0.00 0.00 0.00 0.00 10.00 10.00 10.00 10.00<br />
Area 4. <strong>Freedom</strong> to Trade Internationally 2.64 2.71 1.80 4.93 7.96 6.39 7.14 7.44<br />
A. Tariffs 7.93 3.13 3.39 5.38 5.43 5.72 6.95 6.95<br />
(i) Revenue from trade taxes (% of trade sector) 7.93 (3.10) 2.27 (11.60) 2.80 (10.80) 3.20 (10.20) 2.51 (11.23) 4.31 (8.54) 8.05 (2.92) 8.05 (2.92)<br />
(ii) Mean tariff rate 4.00 (30.00) 3.98 (30.10) 6.58 (17.10) 8.34 (8.30) 7.52 (12.40) 7.48 (12.60) 7.50 (12.50)<br />
(iii) Standard deviation of tariff rates 6.36 (9.10) 5.33 (11.68) 5.31 (11.72) 5.30 (11.75)<br />
B. Regulatory trade barriers 3.29 5.43 6.50<br />
(i) Non-tariff trade barriers 4.12 5.92 5.63<br />
(ii) Compliance cost of importing and exporting 2.46 4.94 7.38<br />
C. Black-market exchange rates 0.00 5.00 2.00 9.40 10.00 10.00 10.00 10.00<br />
D. Controls of the movement of capital and people 0.00 0.00 0.00 0.00 8.46 6.57 6.18 6.29<br />
(i) Foreign ownership/investment restrictions 7.97 6.80 7.13<br />
(ii) Capital controls 0.00 0.00 0.00 0.00 8.46 8.46 8.46 8.46<br />
(iii) <strong>Freedom</strong> of foreigners to visit 3.29 3.29 3.29<br />
Area 5. Regulation 4.72 4.70 4.95 4.47 5.32 7.53 7.87 7.64<br />
A. Credit market regulations 2.61 2.58 3.23 4.29 6.55 9.54 9.49 9.49<br />
(i) Ownership of banks 2.00 2.00 2.00 2.00 2.00 10.00 10.00 10.00<br />
(ii) Private sector credit 5.84 5.74 7.70 6.86 8.66 9.62 9.48 9.48<br />
(iii) Interest rate controls/negative real interest rates 0.00 0.00 0.00 4.00 9.00 9.00 9.00 9.00<br />
B. Labor market regulations 7.56 8.07 7.71<br />
(i) Hiring regulations and minimum wage 10.00 10.00 10.00<br />
(ii) Hiring and firing regulations 6.88 7.01 6.73<br />
(iii) Centralized collective bargaining 8.69 8.42 8.55<br />
(iv) Hours regulations 8.00 10.00 8.00<br />
(v) Mandated cost of worker dismissal 8.79 10.00 10.00<br />
(vi) Conscription 10.00 10.00 10.00 3.00 3.00 3.00 3.00 3.00<br />
C. Business regulations 5.49 6.05 5.70<br />
(i) Administrative requirements 3.82 4.86 4.89<br />
(ii) Bureaucracy costs 2.41 6.14 3.49<br />
(iii) Starting a business 8.10 8.21 8.02<br />
(iv) Extra payments/bribes/favoritism 4.20 3.08 3.03<br />
(v) Licensing restrictions 7.05 5.80 7.17<br />
(vi) Cost of tax compliance 7.34 8.20 7.61
Ukraine<br />
Country Data Tables • 163<br />
1980 1985 1990 1995 2000 2005 2009 2010<br />
Chain-Linked Rating (Rank) Rating (Rank) Rating (Rank) Rating (Rank) Rating (Rank) Rating (Rank) Rating (Rank) Rating (Rank)<br />
Summary Rating (Rank) 3.39 (122) 4.56 (119) 5.74 (107) 5.82 (105) 5.87 (107)<br />
Area 1. Size of Government 4.59 (101) 6.46 (71) 6.53 (52) 6.62 (55)<br />
Area 2. Legal System and Property Rights 4.78 (93) 4.81 (81) 4.79 (82) 4.51 (89) 4.50 (90)<br />
Area 3. Sound Money 0.00 (118) 0.00 (121) 2.24 (122) 4.88 (119) 5.32 (121) 5.60 (120)<br />
Area 4. <strong>Freedom</strong> to Trade Internationally 6.00 (75) 6.31 (80) 6.07 (89) 6.52 (82) 6.56 (87)<br />
Area 5. Regulation 2.82 (121) 4.84 (108) 6.61 (73) 6.32 (91) 6.14 (95)<br />
Unadjusted<br />
Summary Rating (Rank) 3.03 (123) 4.56 (119) 5.81 (125) 5.89 (123) 5.94 (122)<br />
Rating (Data) Rating (Data) Rating (Data) Rating (Data) Rating (Data) Rating (Data) Rating (Data) Rating (Data)<br />
Area 1. Size of Government 4.59 6.46 6.53 6.62<br />
A. Government consumption 4.65 (24.20) 4.41 (25.00) 5.16 (22.44) 3.58 (27.84) 3.59 (27.80) 4.38 (25.12) 4.76 (23.81) 4.68 (24.10)<br />
B. Transfers and subsidies 6.26 (14.24) 3.98 (22.59) 3.87 (23.00) 4.28 (21.48)<br />
C. Government enterprises and investment 4.00 10.00 (8.46) 10.00 (6.40) 10.00 (7.13)<br />
D. Top marginal tax rate 4.50 7.50 7.50 7.50<br />
(i) Top marginal income tax rate 5.00 (40) 10.00 (13) 10.00 (15) 10.00 (15)<br />
(ii) Top marginal income and payroll tax rate 4.00 (44) 5.00 (38) 5.00 (40) 5.00 (40)<br />
Area 2. Legal System and Property Rights 4.32 4.81 5.09 4.79 4.79<br />
A. Judicial independence 6.10 3.17 2.56 1.66 1.80<br />
B. Impartial courts 4.28 3.51 3.05 2.11 2.27<br />
C. Protection of property rights 1.22 2.38 3.95 2.66 2.78<br />
D. Military interference in rule of law and politics 5.67 8.33 8.33 8.33 8.33<br />
E. Integrity of the legal system 6.67 6.67 6.67 6.67<br />
F. Legal enforcement of contracts 5.28 5.34 5.36<br />
G. Regulatory restrictions on sale of real property 7.12 6.44 6.51<br />
H. Reliability of police 3.96 3.30 6.08<br />
I. Business costs of crime 4.93 6.63 3.28<br />
Area 3. Sound Money 3.37 0.00 2.24 4.88 5.32 5.60<br />
A. Money growth 3.17 (34.15) 5.27 (23.66) 7.20 (13.98) 6.98 (15.11)<br />
B. Standard deviation of inflation 0.00 (1158.31) 1.45 (21.38) 6.95 (7.64) 7.26 (6.86) 7.29 (6.78)<br />
C. Inflation: most recent year 6.73 (16.34) 0.00 (415.53) 4.36 (28.20) 7.30 (13.52) 6.82 (15.89) 8.12 (9.38)<br />
D. <strong>Freedom</strong> to own foreign currency bank accounts 0.00 0.00 0.00 0.00 0.00 0.00<br />
Area 4. <strong>Freedom</strong> to Trade Internationally 5.12 6.31 6.21 6.67 6.72<br />
A. Tariffs 7.62 6.75 8.69 8.53<br />
(i) Revenue from trade taxes (% of trade sector) 9.36 (0.96) 8.87 (1.70) 9.17 (1.25) 9.17 (1.25)<br />
(ii) Mean tariff rate 7.90 (10.50) 8.64 (6.80) 9.08 (4.60) 9.08 (4.60)<br />
(iii) Standard deviation of tariff rates 5.60 (11.00) 2.74 (18.16) 7.83 (5.43) 7.33 (6.67)<br />
B. Regulatory trade barriers 2.52 5.51 4.84 4.86 5.42<br />
(i) Non-tariff trade barriers 2.52 4.03 4.56 4.40 3.91<br />
(ii) Compliance cost of importing and exporting 6.99 5.13 5.32 6.94<br />
C. Black-market exchange rates 0.00 0.00 0.00 9.40 7.78 10.00 10.00 10.00<br />
D. Controls of the movement of capital and people 0.00 0.00 0.00 3.43 4.34 3.27 3.13 2.91<br />
(i) Foreign ownership/investment restrictions 4.86 7.13 4.61 4.21 4.31<br />
(ii) Capital controls 0.00 0.00 0.00 2.00 1.54 0.77 0.77 0.00<br />
(iii) <strong>Freedom</strong> of foreigners to visit 4.42 4.42 4.42<br />
Area 5. Regulation 2.70 4.84 6.42 6.14 5.97<br />
A. Credit market regulations 0.00 0.57 5.59 9.16 8.14 8.14<br />
(i) Ownership of banks 0.00 0.00 0.00 8.00 8.00 8.00<br />
(ii) Private sector credit 1.72 9.76 9.47 6.41 6.41<br />
(iii) Interest rate controls/negative real interest rates 0.00 7.00 10.00 10.00 10.00<br />
B. Labor market regulations 5.35 4.51 6.17 6.07 6.08<br />
(i) Hiring regulations and minimum wage 6.62 1.87 5.60 5.57 5.57<br />
(ii) Hiring and firing regulations 5.83 5.83 6.25 6.34 6.11 6.32<br />
(iii) Centralized collective bargaining 7.93 8.07 7.30 7.15 7.01<br />
(iv) Hours regulations 5.35 5.34 8.00 8.00 8.00<br />
(v) Mandated cost of worker dismissal 8.79 9.60 9.60<br />
(vi) Conscription 1.00 1.00 1.00 0.00 0.00<br />
C. Business regulations 2.18 4.43 3.95 4.22 3.69<br />
(i) Administrative requirements 6.27 2.58 2.65 2.45<br />
(ii) Bureaucracy costs 2.20 4.80 3.80 6.25 2.79<br />
(iii) Starting a business 3.73 2.87 8.20 9.06 9.18<br />
(iv) Extra payments/bribes/favoritism 0.62 3.79 5.59 2.88 2.70<br />
(v) Licensing restrictions 3.51 1.86 2.35<br />
(vi) Cost of tax compliance 0.00 2.64 2.64<br />
www.freetheworld.com • www.fraserinstitute.org • Fraser Institute ©2012
164 • <strong>Economic</strong> <strong>Freedom</strong> of the <strong>World</strong>: 2012 Annual Report<br />
United Arab Emirates<br />
Fraser Institute ©2012 • www.fraserinstitute.org • www.freetheworld.com<br />
1980 1985 1990 1995 2000 2005 2009 2010<br />
Chain-Linked Rating (Rank) Rating (Rank) Rating (Rank) Rating (Rank) Rating (Rank) Rating (Rank) Rating (Rank) Rating (Rank)<br />
Summary Rating (Rank) 6.03 (28) 6.83 (18) 7.20 (18) 6.95 (38) 7.28 (39) 7.50 (34) 7.42 (34) 7.61 (22)<br />
Area 1. Size of Government 5.97 (25) 5.75 (32) 7.43 (10) 5.94 (65) 6.11 (65) 8.09 (16) 7.43 (29) 7.94 (20)<br />
Area 2. Legal System and Property Rights 2.06 (84) 5.85 (35) 5.79 (43) 6.51 (44) 7.52 (33) 7.18 (38) 7.26 (32) 7.18 (31)<br />
Area 3. Sound Money 6.64 (35) 7.64 (31) 7.91 (33) 7.76 (44) 7.75 (65) 7.60 (77) 7.65 (80) 7.93 (81)<br />
Area 4. <strong>Freedom</strong> to Trade Internationally 8.58 (27) 8.55 (12) 8.65 (10) 8.27 (16)<br />
Area 5. Regulation 5.28 (58) 6.22 (36) 6.33 (37) 6.29 (45) 6.45 (54) 6.11 (92) 6.15 (96) 6.70 (76)<br />
Unadjusted<br />
Summary Rating (Rank) 6.09 (28) 6.88 (13) 7.46 (14) 6.88 (38) 7.09 (40) 7.71 (20) 7.63 (17) 7.83 (11)<br />
Rating (Data) Rating (Data) Rating (Data) Rating (Data) Rating (Data) Rating (Data) Rating (Data) Rating (Data)<br />
Area 1. Size of Government 5.19 5.00 7.43 5.94 6.11 8.09 7.43 7.94<br />
A. Government consumption 0.37 (38.73) 0.00 (41.76) 2.91 (30.10) 3.88 (26.80) 4.71 (23.97) 8.66 (10.54) 8.02 (12.73) 8.06 (12.58)<br />
B. Transfers and subsidies 9.81 (1.20) 9.86 (1.00) 9.71 (1.55) 9.71 (1.55) 9.71 (1.55) 9.71 (1.55)<br />
C. Government enterprises and investment 7.00 (21.40) 0.00 (55.70) 0.00 (56.90) 4.00 (38.18) 2.00 (40.61) 4.00 (36.28)<br />
D. Top marginal tax rate 10.00 10.00 10.00 10.00 10.00 10.00 10.00 10.00<br />
(i) Top marginal income tax rate 10.00 (0) 10.00 (0) 10.00 10.00 (0) 10.00 (0) 10.00 (0) 10.00 (0) 10.00 (0)<br />
(ii) Top marginal income and payroll tax rate 10.00 (16) 10.00 (16) 10.00 (16)<br />
Area 2. Legal System and Property Rights 2.06 5.85 5.79 5.83 6.56 7.27 7.35 7.27<br />
A. Judicial independence 6.30 6.49 6.80<br />
B. Impartial courts 6.92 7.55 6.35 6.21 5.66<br />
C. Protection of property rights 6.82 6.71 6.35<br />
D. Military interference in rule of law and politics 8.50 8.33 8.33 8.33 8.33<br />
E. Integrity of the legal system 4.11 6.67 6.67 6.67 6.67<br />
F. Legal enforcement of contracts 4.83 4.83 4.83<br />
G. Regulatory restrictions on sale of real property 9.30 9.30 9.30<br />
H. Reliability of police 8.23 8.66 8.98<br />
I. Business costs of crime 8.63 8.99 8.55<br />
Area 3. Sound Money 7.93 9.12 9.44 9.45 7.75 7.60 7.65 7.93<br />
A. Money growth 5.46 (22.70) 9.30 (−3.51) 9.27 (3.66) 8.90 (5.51) 8.87 (5.66) 6.65 (16.75) 7.71 (11.44) 8.21 (8.95)<br />
B. Standard deviation of inflation 8.08 (4.79) 8.09 (4.78) 9.32 (1.69) 6.49 (8.78) 6.62 (8.45) 5.13 (12.17) 5.23 (11.92)<br />
C. Inflation: most recent year 8.18 (9.10) 9.11 (4.46) 9.18 (4.10) 5.63 (21.83) 7.14 (14.29) 7.74 (−11.28) 8.29 (8.55)<br />
D. <strong>Freedom</strong> to own foreign currency bank accounts 10.00 10.00 10.00 10.00 10.00 10.00 10.00 10.00<br />
Area 4. <strong>Freedom</strong> to Trade Internationally 10.00 8.20 8.33 8.58 8.11 8.20 7.84<br />
A. Tariffs 10.00 9.60 10.00 9.60 8.87 8.67 8.67<br />
(i) Revenue from trade taxes (% of trade sector) 10.00 (0.00) 10.00 (0.00) 10.00 (0.00) 10.00 (0.00) 10.00 (0.00) 10.00 (0.00) 10.00 (0.00)<br />
(ii) Mean tariff rate 9.20 (4.00) 9.20 (4.00) 9.04 (4.80) 9.02 (4.90) 9.02 (4.90)<br />
(iii) Standard deviation of tariff rates 7.56 (6.10) 7.00 (7.50) 7.00 (7.50)<br />
B. Regulatory trade barriers 8.11 8.63 7.36<br />
(i) Non-tariff trade barriers 7.62 8.12 7.65<br />
(ii) Compliance cost of importing and exporting 8.60 9.14 7.06<br />
C. Black-market exchange rates 10.00 10.00 10.00 10.00 10.00 10.00 10.00 10.00<br />
D. Controls of the movement of capital and people 10.00 5.00 5.00 5.00 6.15 5.45 5.50 5.34<br />
(i) Foreign ownership/investment restrictions 6.69 7.15 6.68<br />
(ii) Capital controls 10.00 5.00 5.00 5.00 6.15 6.15 5.83 5.83<br />
(iii) <strong>Freedom</strong> of foreigners to visit 3.52 3.52 3.52<br />
Area 5. Regulation 5.28 6.22 6.33 6.29 6.45 7.46 7.51 8.18<br />
A. Credit market regulations 6.85 6.17 6.49 6.36 6.86 7.74 7.75 7.64<br />
(i) Ownership of banks 5.00 5.00 5.00 5.00 5.00 5.00 5.00 5.00<br />
(ii) Private sector credit 8.71 7.35 7.98 7.73 8.71 8.21 8.24 7.92<br />
(iii) Interest rate controls/negative real interest rates 10.00 10.00 10.00<br />
B. Labor market regulations 7.48 7.19 8.50<br />
(i) Hiring regulations and minimum wage 10.00 10.00 10.00<br />
(ii) Hiring and firing regulations 6.21 6.17 6.59<br />
(iii) Centralized collective bargaining 8.47 8.34 8.38<br />
(iv) Hours regulations 8.00 6.00 6.00<br />
(v) Mandated cost of worker dismissal 2.21 2.65 10.00<br />
(vi) Conscription 3.00 10.00 10.00 10.00 10.00 10.00 10.00 10.00<br />
C. Business regulations 7.15 7.59 8.40<br />
(i) Administrative requirements 5.56 5.51 5.60<br />
(ii) Bureaucracy costs 2.18 2.81 7.47<br />
(iii) Starting a business 8.03 9.45 9.52<br />
(iv) Extra payments/bribes/favoritism 8.07 8.10 7.97<br />
(v) Licensing restrictions 9.21 9.81 9.99<br />
(vi) Cost of tax compliance 9.87 9.87 9.87
United Kingdom<br />
Country Data Tables • 165<br />
1980 1985 1990 1995 2000 2005 2009 2010<br />
Chain-Linked Rating (Rank) Rating (Rank) Rating (Rank) Rating (Rank) Rating (Rank) Rating (Rank) Rating (Rank) Rating (Rank)<br />
Summary Rating (Rank) 6.57 (17) 7.53 (7) 8.08 (6) 8.20 (6) 8.50 (6) 8.38 (5) 7.97 (7) 7.87 (12)<br />
Area 1. Size of Government 3.77 (87) 4.41 (74) 5.65 (58) 5.42 (81) 6.13 (61) 6.29 (79) 5.68 (82) 5.18 (100)<br />
Area 2. Legal System and Property Rights 7.05 (19) 6.65 (25) 7.73 (16) 8.84 (15) 9.29 (6) 9.07 (8) 8.75 (10) 8.74 (11)<br />
Area 3. Sound Money 5.96 (68) 9.35 (11) 9.48 (12) 9.60 (16) 9.31 (30) 9.45 (29) 9.58 (14) 9.58 (19)<br />
Area 4. <strong>Freedom</strong> to Trade Internationally 8.99 (5) 9.04 (7) 9.04 (9) 9.11 (12) 9.40 (5) 8.75 (6) 8.71 (6) 8.43 (12)<br />
Area 5. Regulation 6.99 (12) 8.23 (3) 8.55 (2) 8.04 (5) 8.36 (3) 8.35 (7) 7.14 (41) 7.42 (28)<br />
Unadjusted<br />
Summary Rating (Rank) 6.72 (14) 7.71 (6) 8.18 (5) 8.19 (6) 8.50 (6) 8.25 (5) 7.85 (9) 7.75 (12)<br />
Rating (Data) Rating (Data) Rating (Data) Rating (Data) Rating (Data) Rating (Data) Rating (Data) Rating (Data)<br />
Area 1. Size of Government 3.94 4.61 5.65 5.42 6.13 6.29 5.68 5.18<br />
A. Government consumption 3.93 (26.62) 4.16 (25.85) 4.52 (24.63) 4.36 (25.18) 5.23 (22.22) 4.32 (25.31) 3.97 (26.49) 3.98 (26.46)<br />
B. Transfers and subsidies 5.83 (15.80) 5.26 (17.90) 6.08 (14.90) 5.31 (17.70) 6.31 (14.05) 6.33 (13.97) 5.74 (16.14) 5.75 (16.10)<br />
C. Government enterprises and investment 6.00 (29.10) 7.00 (23.50) 8.00 (15.30) 8.00 (16.40) 8.00 (16.40) 10.00 (4.24) 8.00 (18.26) 8.00 (17.45)<br />
D. Top marginal tax rate 0.00 2.00 4.00 4.00 5.00 4.50 5.00 3.00<br />
(i) Top marginal income tax rate 0.00 (83) 2.00 (60) 5.00 (40) 5.00 (40) 6.00 (40) 5.00 (41) 6.00 (40) 5.00 (50)<br />
(ii) Top marginal income and payroll tax rate 3.00 (48) 3.00 (48) 4.00 (48) 4.00 (48) 4.00 (48) 1.00 (66)<br />
Area 2. Legal System and Property Rights 7.05 6.65 7.73 8.84 9.29 8.27 7.98 7.97<br />
A. Judicial independence 9.50 9.02 8.74 8.81 8.66<br />
B. Impartial courts 8.88 9.02 8.38 6.98 6.79<br />
C. Protection of property rights 7.08 8.44 9.09 7.92 8.34<br />
D. Military interference in rule of law and politics 8.76 10.00 10.00 10.00 10.00<br />
E. Integrity of the legal system 10.00 10.00 9.17 9.17 9.17<br />
F. Legal enforcement of contracts 6.00 6.04 5.95<br />
G. Regulatory restrictions on sale of real property 8.26 8.50 7.91<br />
H. Reliability of police 7.51 7.44 7.15<br />
I. Business costs of crime 7.25 6.97 7.77<br />
Area 3. Sound Money 5.96 9.35 9.48 9.60 9.31 9.45 9.58 9.58<br />
A. Money growth 8.57 (7.17) 9.57 (2.17) 9.75 (1.27) 9.59 (2.06) 8.14 (9.31) 8.54 (7.30) 8.68 (6.61) 9.26 (3.70)<br />
B. Standard deviation of inflation 9.04 (2.40) 9.01 (2.48) 9.45 (1.38) 9.30 (1.74) 9.69 (0.77) 9.82 (0.44) 9.75 (0.61) 9.73 (0.67)<br />
C. Inflation: most recent year 6.23 (18.84) 8.82 (5.91) 8.72 (6.42) 9.51 (2.44) 9.41 (2.93) 9.43 (2.83) 9.89 (−0.55) 9.34 (3.29)<br />
D. <strong>Freedom</strong> to own foreign currency bank accounts 0.00 10.00 10.00 10.00 10.00 10.00 10.00 10.00<br />
Area 4. <strong>Freedom</strong> to Trade Internationally 9.63 9.68 9.47 9.03 9.40 8.80 8.76 8.48<br />
A. Tariffs 8.89 9.05 8.41 8.63 9.18 8.39 8.22 8.34<br />
(i) Revenue from trade taxes (% of trade sector) 9.53 (0.70) 9.60 (0.60) 9.60 (0.60) 9.60 (0.60) 9.78 (0.33) 9.59 (0.62) 9.44 (0.84) 9.63 (0.55)<br />
(ii) Mean tariff rate 8.24 (8.80) 8.50 (7.50) 8.52 (7.40) 8.66 (6.70) 9.52 (2.40) 9.46 (2.70) 8.94 (5.30) 8.98 (5.10)<br />
(iii) Standard deviation of tariff rates 7.12 (7.20) 7.64 (5.90) 8.24 (4.40) 6.13 (9.67) 6.29 (9.28) 6.41 (8.98)<br />
B. Regulatory trade barriers 8.03 9.32 8.07 8.27 7.07<br />
(i) Non-tariff trade barriers 8.03 8.97 7.23 7.34 7.51<br />
(ii) Compliance cost of importing and exporting 9.67 8.91 9.20 6.63<br />
C. Black-market exchange rates 10.00 10.00 10.00 10.00 10.00 10.00 10.00 10.00<br />
D. Controls of the movement of capital and people 10.00 10.00 10.00 9.45 9.10 8.74 8.56 8.50<br />
(i) Foreign ownership/investment restrictions 8.89 9.75 8.59 8.15 7.99<br />
(ii) Capital controls 10.00 10.00 10.00 10.00 8.46 8.46 8.33 8.33<br />
(iii) <strong>Freedom</strong> of foreigners to visit 9.18 9.18 9.18<br />
Area 5. Regulation 7.00 8.25 8.59 8.06 8.36 8.46 7.24 7.53<br />
A. Credit market regulations 7.33 9.71 9.93 8.79 10.00 9.33 6.69 6.69<br />
(i) Ownership of banks 10.00 10.00 10.00 10.00 10.00 10.00 10.00 10.00<br />
(ii) Private sector credit 8.00 9.12 9.79 6.36 10.00 7.98 1.07 1.07<br />
(iii) Interest rate controls/negative real interest rates 4.00 10.00 10.00 10.00 10.00 10.00 9.00 9.00<br />
B. Labor market regulations 6.67 6.79 7.24 7.22 6.92 8.47 8.19 8.24<br />
(i) Hiring regulations and minimum wage 6.67 4.61 8.90 8.90 8.90<br />
(ii) Hiring and firing regulations 7.39 7.39 4.90 5.83 5.36 5.67<br />
(iii) Centralized collective bargaining 5.18 5.18 6.21 6.21 8.60 8.10 7.87 7.87<br />
(iv) Hours regulations 4.84 5.19 5.37 5.85 6.51 10.00 8.00 8.00<br />
(v) Mandated cost of worker dismissal 7.96 9.03 9.01<br />
(vi) Conscription 10.00 10.00 10.00 10.00 10.00 10.00 10.00 10.00<br />
C. Business regulations 8.18 8.17 7.60 6.85 7.65<br />
(i) Administrative requirements 7.93 3.80 3.43 3.50<br />
(ii) Bureaucracy costs 7.78 8.03 5.90 1.98 7.16<br />
(iii) Starting a business 8.07 7.73 9.58 9.58 9.58<br />
(iv) Extra payments/bribes/favoritism 8.70 8.97 9.04 8.08 7.70<br />
(v) Licensing restrictions 8.45 9.24 9.19<br />
(vi) Cost of tax compliance 8.82 8.77 8.77<br />
www.freetheworld.com • www.fraserinstitute.org • Fraser Institute ©2012
166 • <strong>Economic</strong> <strong>Freedom</strong> of the <strong>World</strong>: 2012 Annual Report<br />
United States<br />
Fraser Institute ©2012 • www.fraserinstitute.org • www.freetheworld.com<br />
1980 1985 1990 1995 2000 2005 2009 2010<br />
Chain-Linked Rating (Rank) Rating (Rank) Rating (Rank) Rating (Rank) Rating (Rank) Rating (Rank) Rating (Rank) Rating (Rank)<br />
Summary Rating (Rank) 7.92 (3) 8.11 (3) 8.35 (3) 8.50 (4) 8.65 (2) 8.21 (8) 7.72 (15) 7.70 (19)<br />
Area 1. Size of Government 5.08 (49) 5.94 (28) 6.71 (24) 6.88 (28) 7.03 (34) 7.13 (45) 6.49 (53) 6.43 (61)<br />
Area 2. Legal System and Property Rights 8.35 (1) 8.35 (3) 8.35 (10) 8.76 (16) 9.23 (9) 7.51 (29) 7.16 (35) 7.12 (33)<br />
Area 3. Sound Money 9.22 (5) 9.36 (9) 9.68 (7) 9.76 (3) 9.78 (2) 9.76 (1) 9.60 (12) 9.68 (7)<br />
Area 4. <strong>Freedom</strong> to Trade Internationally 8.77 (7) 8.73 (8) 8.77 (11) 8.83 (18) 8.78 (22) 8.28 (17) 7.93 (31) 7.65 (42)<br />
Area 5. Regulation 8.11 (4) 8.09 (5) 8.23 (4) 8.29 (4) 8.43 (2) 8.37 (6) 7.41 (24) 7.64 (17)<br />
Unadjusted<br />
Summary Rating (Rank) 8.07 (2) 8.26 (3) 8.43 (3) 8.48 (4) 8.65 (2) 8.20 (8) 7.71 (12) 7.69 (18)<br />
Rating (Data) Rating (Data) Rating (Data) Rating (Data) Rating (Data) Rating (Data) Rating (Data) Rating (Data)<br />
Area 1. Size of Government 5.17 6.05 6.71 6.88 7.03 7.13 6.49 6.43<br />
A. Government consumption 5.53 (21.21) 5.45 (21.46) 5.66 (20.76) 6.18 (18.97) 6.59 (17.60) 6.34 (18.43) 6.02 (19.55) 6.02 (19.54)<br />
B. Transfers and subsidies 7.17 (10.90) 6.73 (12.50) 6.68 (12.70) 6.32 (14.00) 6.54 (13.19) 6.69 (12.66) 5.94 (15.40) 5.69 (16.31)<br />
C. Government enterprises and investment 8.00 (17.71) 8.00 (18.07) 8.00 (18.28) 8.00 (16.70) 8.00 (17.68) 8.00 (15.23) 7.00 (22.68) 7.00 (22.52)<br />
D. Top marginal tax rate 0.00 4.00 6.50 7.00 7.00 7.50 7.00 7.00<br />
(i) Top marginal income tax rate 0.00 (70-75) 4.00 (50-59) 7.00 (33-42) 7.00 (40-46) 7.00 (40-46) 8.00 (35-42) 7.00 (35-41) 7.00 (35-41)<br />
(ii) Top marginal income and payroll tax rate 6.00 (36-45) 7.00 (42-49) 7.00 (42-49) 7.00 (37-44) 7.00 (37-43) 7.00 (37-44)<br />
Area 2. Legal System and Property Rights 8.35 8.35 8.35 8.76 9.23 7.54 7.19 7.14<br />
A. Judicial independence 8.30 8.02 6.60 6.62 6.57<br />
B. Impartial courts 8.52 9.02 6.80 5.70 5.63<br />
C. Protection of property rights 7.76 9.10 8.05 6.83 6.76<br />
D. Military interference in rule of law and politics 9.23 10.00 6.67 6.67 6.67<br />
E. Integrity of the legal system 10.00 10.00 8.33 8.33 8.33<br />
F. Legal enforcement of contracts 7.33 7.33 7.33<br />
G. Regulatory restrictions on sale of real property 9.61 9.61 9.51<br />
H. Reliability of police 7.82 7.71 5.89<br />
I. Business costs of crime 6.66 5.89 7.60<br />
Area 3. Sound Money 9.22 9.36 9.68 9.76 9.78 9.76 9.60 9.68<br />
A. Money growth 9.25 (3.75) 9.11 (4.46) 9.86 (−0.72) 9.70 (1.51) 9.94 (−0.28) 9.92 (−0.41) 8.86 (5.72) 9.46 (2.69)<br />
B. Standard deviation of inflation 9.54 (1.15) 9.04 (2.41) 9.71 (0.72) 9.74 (0.64) 9.84 (0.40) 9.79 (0.52) 9.63 (0.91) 9.58 (1.05)<br />
C. Inflation: most recent year 8.10 (9.51) 9.30 (3.52) 9.13 (4.34) 9.60 (2.00) 9.32 (3.38) 9.32 (3.39) 9.93 (−0.36) 9.67 (1.64)<br />
D. <strong>Freedom</strong> to own foreign currency bank accounts 10.00 10.00 10.00 10.00 10.00 10.00 10.00 10.00<br />
Area 4. <strong>Freedom</strong> to Trade Internationally 8.97 8.92 8.74 8.65 8.78 8.07 7.73 7.46<br />
A. Tariffs 8.90 8.77 8.23 8.41 8.12 8.38 8.45 8.42<br />
(i) Revenue from trade taxes (% of trade sector) 9.27 (1.10) 8.87 (1.70) 9.00 (1.50) 9.20 (1.20) 9.44 (0.84) 9.49 (0.76) 9.56 (0.66) 9.53 (0.71)<br />
(ii) Mean tariff rate 8.54 (7.30) 8.68 (6.60) 8.76 (6.20) 8.82 (5.90) 9.20 (4.00) 9.36 (3.20) 9.30 (3.50) 9.30 (3.50)<br />
(iii) Standard deviation of tariff rates 6.92 (7.70) 7.20 (7.00) 5.72 (10.70) 6.28 (9.31) 6.50 (8.75) 6.43 (8.93)<br />
B. Regulatory trade barriers 7.82 8.81 8.03 7.69 6.58<br />
(i) Non-tariff trade barriers 7.82 8.12 6.72 6.03 5.97<br />
(ii) Compliance cost of importing and exporting 9.50 9.35 9.35 7.19<br />
C. Black-market exchange rates 10.00 10.00 10.00 10.00 10.00 10.00 10.00 10.00<br />
D. Controls of the movement of capital and people 8.00 8.00 8.00 8.39 8.21 5.88 4.79 4.83<br />
(i) Foreign ownership/investment restrictions 8.78 9.49 7.28 6.32 6.46<br />
(ii) Capital controls 8.00 8.00 8.00 8.00 6.92 6.15 3.85 3.85<br />
(iii) <strong>Freedom</strong> of foreigners to visit 4.20 4.20 4.20<br />
Area 5. Regulation 8.63 8.60 8.66 8.33 8.43 8.50 7.53 7.76<br />
A. Credit market regulations 9.52 9.47 9.64 9.60 9.81 9.10 6.67 6.95<br />
(i) Ownership of banks 10.00 10.00 10.00 10.00 10.00 10.00 10.00 10.00<br />
(ii) Private sector credit 8.55 8.40 8.93 8.79 9.43 7.29 0.00 0.84<br />
(iii) Interest rate controls/negative real interest rates 10.00 10.00 10.00 10.00 10.00 10.00 10.00 10.00<br />
B. Labor market regulations 7.74 7.74 7.68 7.46 7.17 9.14 9.10 9.06<br />
(i) Hiring regulations and minimum wage 5.90 3.82 10.00 10.00 10.00<br />
(ii) Hiring and firing regulations 7.15 7.15 6.65 7.01 7.05 6.84<br />
(iii) Centralized collective bargaining 7.59 7.59 7.59 7.59 8.35 7.83 7.55 7.49<br />
(iv) Hours regulations 5.63 5.63 5.98 6.67 7.01 10.00 10.00 10.00<br />
(v) Mandated cost of worker dismissal 10.00 10.00 10.00<br />
(vi) Conscription 10.00 10.00 10.00 10.00 10.00 10.00 10.00 10.00<br />
C. Business regulations 7.94 8.32 7.26 6.81 7.26<br />
(i) Administrative requirements 7.92 4.29 4.13 4.03<br />
(ii) Bureaucracy costs 7.48 8.15 5.93 2.58 5.88<br />
(iii) Starting a business 8.43 8.40 9.80 9.79 9.79<br />
(iv) Extra payments/bribes/favoritism 7.91 8.82 7.23 6.47 5.99<br />
(v) Licensing restrictions 9.98 9.98 9.98<br />
(vi) Cost of tax compliance 6.36 7.90 7.90
Country Data Tables • 167<br />
Uruguay 1980 1985 1990 1995 2000 2005 2009 2010<br />
Chain-Linked Rating (Rank) Rating (Rank) Rating (Rank) Rating (Rank) Rating (Rank) Rating (Rank) Rating (Rank) Rating (Rank)<br />
Summary Rating (Rank) 6.07 (27) 5.97 (37) 6.34 (34) 6.47 (50) 7.08 (41) 7.02 (56) 7.16 (48) 7.25 (45)<br />
Area 1. Size of Government 7.13 (11) 6.40 (16) 7.00 (19) 6.83 (32) 6.53 (51) 7.25 (40) 6.87 (39) 6.31 (67)<br />
Area 2. Legal System and Property Rights 5.37 (40) 5.15 (54) 6.01 (39) 6.46 (47) 6.39 (54) 5.69 (65) 5.89 (65) 6.01 (58)<br />
Area 3. Sound Money 4.18 (97) 3.71 (101) 3.76 (104) 3.92 (101) 8.39 (48) 8.18 (65) 8.83 (52) 8.98 (51)<br />
Area 4. <strong>Freedom</strong> to Trade Internationally 7.43 (16) 8.06 (13) 8.10 (17) 8.69 (19) 8.18 (37) 7.68 (44) 7.92 (33) 8.06 (22)<br />
Area 5. Regulation 6.03 (35) 6.37 (31) 6.63 (28) 6.28 (46) 5.91 (85) 6.28 (86) 6.28 (94) 6.84 (61)<br />
Unadjusted<br />
Summary Rating (Rank) 6.33 (22) 6.16 (28) 6.60 (31) 6.59 (44) 6.95 (44) 7.06 (58) 7.20 (49) 7.29 (51)<br />
Rating (Data) Rating (Data) Rating (Data) Rating (Data) Rating (Data) Rating (Data) Rating (Data) Rating (Data)<br />
Area 1. Size of Government 7.82 7.01 7.67 7.48 6.53 7.25 6.87 6.31<br />
A. Government consumption 7.61 (14.11) 6.64 (17.41) 6.83 (16.77) 7.49 (14.52) 7.40 (14.84) 7.88 (13.19) 7.10 (15.88) 6.94 (16.39)<br />
B. Transfers and subsidies 7.66 (9.10) 7.41 (10.00) 6.87 (12.00) 5.42 (17.30) 5.20 (18.10) 6.60 (13.00) 6.40 (13.80) 6.30 (14.10)<br />
C. Government enterprises and investment 6.00 (29.00) 4.00 (36.20) 7.00 (23.00) 7.00 (22.90) 6.00 (25.20) 7.00 (20.41) 6.00 (29.79) 4.00 (31.08)<br />
D. Top marginal tax rate 10.00 10.00 10.00 10.00 7.50 7.50 8.00 8.00<br />
(i) Top marginal income tax rate 10.00 (0) 10.00 (0) 10.00 (0) 10.00 (0) 10.00 (0) 10.00 (0) 9.00 (25) 9.00 (25)<br />
(ii) Top marginal income and payroll tax rate 5.00 (36) 5.00 (36) 7.00 (31) 7.00 (31)<br />
Area 2. Legal System and Property Rights 5.61 5.38 6.28 6.00 5.74 5.57 5.77 5.89<br />
A. Judicial independence 6.55 7.11 7.13<br />
B. Impartial courts 6.04 6.67 5.47 5.17 5.26<br />
C. Protection of property rights 5.53 6.26 6.24 6.75<br />
D. Military interference in rule of law and politics 7.24 8.33 8.19 6.67 6.67<br />
E. Integrity of the legal system 6.96 5.00 4.17 4.17 4.17<br />
F. Legal enforcement of contracts 3.88 3.88 3.88<br />
G. Regulatory restrictions on sale of real property 6.42 6.42 6.42<br />
H. Reliability of police 4.84 5.81 6.68<br />
I. Business costs of crime 4.35 6.45 6.02<br />
Area 3. Sound Money 4.18 3.71 3.76 3.92 8.39 8.18 8.83 8.98<br />
A. Money growth 1.45 (42.73) 2.98 (35.11) 0.00 (54.79) 2.99 (35.05) 8.49 (7.57) 6.89 (15.53) 8.09 (9.54) 7.90 (10.51)<br />
B. Standard deviation of inflation 5.28 (11.81) 1.85 (20.37) 5.03 (12.43) 1.08 (22.30) 6.04 (9.89) 6.76 (8.11) 8.67 (3.33) 9.36 (1.60)<br />
C. Inflation: most recent year 0.00 (54.76) 0.00 (74.02) 0.00 (100.39) 1.59 (42.03) 9.05 (4.76) 9.06 (4.70) 8.58 (7.10) 8.66 (6.68)<br />
D. <strong>Freedom</strong> to own foreign currency bank accounts 10.00 10.00 10.00 10.00 10.00 10.00 10.00 10.00<br />
Area 4. <strong>Freedom</strong> to Trade Internationally 8.02 8.32 8.65 9.28 8.18 7.85 8.10 8.24<br />
A. Tariffs 4.07 4.97 5.94 7.83 7.72 7.73 7.77 7.73<br />
(i) Revenue from trade taxes (% of trade sector) 4.07 (8.90) 6.13 (5.80) 6.27 (5.60) 8.20 (2.70) 8.71 (1.93) 8.43 (2.35) 8.65 (2.03) 8.51 (2.23)<br />
(ii) Mean tariff rate 3.80 (31.00) 3.90 (30.50) 8.14 (9.30) 7.78 (11.10) 8.02 (9.90) 7.90 (10.50) 7.90 (10.50)<br />
(iii) Standard deviation of tariff rates 7.64 (5.90) 7.16 (7.10) 6.68 (8.30) 6.74 (8.16) 6.77 (8.09) 6.77 (8.09)<br />
B. Regulatory trade barriers 6.25 6.22 6.67 7.34<br />
(i) Non-tariff trade barriers 6.25 5.73 6.14 6.56<br />
(ii) Compliance cost of importing and exporting 6.72 7.20 8.13<br />
C. Black-market exchange rates 10.00 10.00 10.00 10.00 10.00 10.00 10.00 10.00<br />
D. Controls of the movement of capital and people 10.00 10.00 10.00 10.00 8.74 7.45 7.97 7.87<br />
(i) Foreign ownership/investment restrictions 9.02 6.74 8.29 8.02<br />
(ii) Capital controls 10.00 10.00 10.00 10.00 8.46 8.46 8.46 8.46<br />
(iii) <strong>Freedom</strong> of foreigners to visit 7.14 7.14 7.14<br />
Area 5. Regulation 6.00 6.36 6.63 6.27 5.91 6.43 6.44 7.01<br />
A. Credit market regulations 5.50 6.97 7.67 6.72 5.75 6.71 6.71 8.15<br />
(i) Ownership of banks 5.00 5.00 5.00 5.00 5.00 2.00 2.00 5.00<br />
(ii) Private sector credit 7.91 10.00 9.15 7.25 9.13 9.13 9.44<br />
(iii) Interest rate controls/negative real interest rates 6.00 8.00 8.00 6.00 5.00 9.00 9.00 10.00<br />
B. Labor market regulations 5.89 6.43 6.59 6.20<br />
(i) Hiring regulations and minimum wage 2.56 6.70 6.67 6.67<br />
(ii) Hiring and firing regulations 4.12 3.29 3.37 3.28<br />
(iii) Centralized collective bargaining 6.90 3.47 2.37 2.14<br />
(iv) Hours regulations 8.00 10.00 8.00<br />
(v) Mandated cost of worker dismissal 7.13 7.11 7.11<br />
(vi) Conscription 10.00 10.00 10.00 10.00 10.00 10.00 10.00 10.00<br />
C. Business regulations 6.09 6.16 6.01 6.69<br />
(i) Administrative requirements 6.75 3.50 3.46 3.52<br />
(ii) Bureaucracy costs 6.48 4.96 4.53 6.71<br />
(iii) Starting a business 5.00 7.56 7.48 9.51<br />
(iv) Extra payments/bribes/favoritism 6.11 7.49 7.40 7.20<br />
(v) Licensing restrictions 6.85 6.95 6.97<br />
(vi) Cost of tax compliance 6.59 6.23 6.23<br />
www.freetheworld.com • www.fraserinstitute.org • Fraser Institute ©2012
168 • <strong>Economic</strong> <strong>Freedom</strong> of the <strong>World</strong>: 2012 Annual Report<br />
Venezuela 1980 1985 1990 1995 2000 2005 2009 2010<br />
Chain-Linked Rating (Rank) Rating (Rank) Rating (Rank) Rating (Rank) Rating (Rank) Rating (Rank) Rating (Rank) Rating (Rank)<br />
Summary Rating (Rank) 6.69 (14) 6.08 (34) 5.69 (51) 4.40 (109) 5.83 (94) 4.52 (120) 4.16 (122) 3.88 (123)<br />
Area 1. Size of Government 6.29 (21) 6.86 (7) 5.95 (45) 6.13 (61) 5.95 (73) 4.91 (103) 4.88 (105) 4.96 (104)<br />
Area 2. Legal System and Property Rights 6.22 (30) 5.25 (51) 5.70 (49) 3.84 (107) 3.75 (105) 1.64 (122) 1.47 (123) 1.46 (123)<br />
Area 3. Sound Money 7.40 (27) 8.34 (22) 4.74 (94) 1.93 (113) 5.56 (110) 5.10 (116) 5.51 (120) 4.72 (121)<br />
Area 4. <strong>Freedom</strong> to Trade Internationally 8.59 (9) 4.60 (54) 7.14 (28) 5.34 (90) 7.86 (46) 5.50 (105) 3.42 (121) 3.83 (121)<br />
Area 5. Regulation 4.92 (72) 5.26 (64) 4.89 (82) 4.71 (99) 6.05 (79) 5.41 (108) 5.62 (110) 4.38 (120)<br />
Unadjusted<br />
Summary Rating (Rank) 6.72 (14) 6.08 (31) 5.55 (56) 4.35 (109) 5.83 (93) 4.74 (136) 4.44 (139) 4.07 (144)<br />
Fraser Institute ©2012 • www.fraserinstitute.org • www.freetheworld.com<br />
Rating (Data) Rating (Data) Rating (Data) Rating (Data) Rating (Data) Rating (Data) Rating (Data) Rating (Data)<br />
Area 1. Size of Government 6.29 6.86 5.95 6.13 5.95 4.91 4.88 4.96<br />
A. Government consumption 6.56 (17.68) 7.52 (14.44) 8.25 (11.95) 9.02 (9.32) 6.06 (19.39) 6.36 (18.37) 6.73 (17.13) 7.06 (16.00)<br />
B. Transfers and subsidies 9.59 (2.00) 8.91 (4.50) 8.56 (5.80) 8.50 (6.01) 7.74 (8.79) 5.77 (16.01) 5.77 (16.01) 5.77 (16.01)<br />
C. Government enterprises and investment 2.00 (45.60) 4.00 (35.80) 0.00 (65.20) 0.00 (58.30) 2.00 (42.36) 2.00 (42.36) 0.00 (56.38) 0.00 (56.38)<br />
D. Top marginal tax rate 7.00 7.00 7.00 7.00 8.00 5.50 7.00 7.00<br />
(i) Top marginal income tax rate 7.00 (45) 7.00 (45) 7.00 (45) 7.00 (34) 8.00 (35) 7.00 (34) 8.00 (34) 8.00 (34)<br />
(ii) Top marginal income and payroll tax rate 7.00 (45) 7.00 (34) 8.00 (35) 4.00 (49) 6.00 (41) 6.00 (41)<br />
Area 2. Legal System and Property Rights 6.22 5.25 5.70 3.84 3.75 2.77 2.50 2.48<br />
A. Judicial independence 2.85 1.67 0.31 1.15 1.08<br />
B. Impartial courts 2.90 3.67 0.93 1.22 1.24<br />
C. Protection of property rights 3.72 3.40 2.27 1.26 1.25<br />
D. Military interference in rule of law and politics 5.65 3.33 0.83 0.83 0.83<br />
E. Integrity of the legal system 4.11 6.67 5.00 1.67 1.67<br />
F. Legal enforcement of contracts 3.97 3.97 3.97<br />
G. Regulatory restrictions on sale of real property 8.42 8.39 8.46<br />
H. Reliability of police 1.82 1.86 1.81<br />
I. Business costs of crime 1.36 2.12 1.99<br />
Area 3. Sound Money 7.40 8.34 4.74 1.93 5.56 5.10 5.51 4.72<br />
A. Money growth 7.79 (11.04) 7.49 (12.53) 7.28 (13.58) 3.94 (30.28) 5.48 (22.60) 3.12 (34.40) 6.69 (16.53) 5.90 (20.49)<br />
B. Standard deviation of inflation 7.02 (7.44) 7.94 (5.15) 0.00 (30.17) 3.77 (15.57) 0.00 (39.24) 5.49 (11.29) 6.06 (9.84) 3.81 (15.48)<br />
C. Inflation: most recent year 4.80 (26.02) 7.92 (10.41) 1.66 (41.71) 0.00 (51.93) 6.76 (16.21) 6.81 (15.95) 4.28 (28.59) 4.19 (29.06)<br />
D. <strong>Freedom</strong> to own foreign currency bank accounts 10.00 10.00 10.00 0.00 10.00 5.00 5.00 5.00<br />
Area 4. <strong>Freedom</strong> to Trade Internationally 8.67 4.56 6.41 5.20 7.86 5.63 3.49 3.91<br />
A. Tariffs 8.00 3.68 4.22 7.78 7.61 7.64 7.80 7.80<br />
(i) Revenue from trade taxes (% of trade sector) 8.00 (3.00) 3.93 (9.10) 8.53 (2.20) 7.93 (3.10) 7.89 (3.16) 8.45 (2.33) 8.45 (2.33) 8.45 (2.33)<br />
(ii) Mean tariff rate 3.42 (32.90) 3.88 (30.60) 7.32 (13.40) 7.30 (13.50) 7.44 (12.80) 7.50 (12.50) 7.50 (12.50)<br />
(iii) Standard deviation of tariff rates 0.24 (24.40) 8.08 (4.80) 7.64 (5.90) 7.04 (7.41) 7.45 (6.38) 7.45 (6.38)<br />
B. Regulatory trade barriers 4.57 5.68 4.04 2.67 4.31<br />
(i) Non-tariff trade barriers 4.57 4.87 4.78 3.71 3.56<br />
(ii) Compliance cost of importing and exporting 6.49 3.30 1.62 5.07<br />
C. Black-market exchange rates 10.00 5.00 10.00 1.60 10.00 5.13 0.00 0.00<br />
D. Controls of the movement of capital and people 8.00 5.00 5.00 6.87 8.15 5.70 3.51 3.55<br />
(i) Foreign ownership/investment restrictions 8.74 9.37 5.03 3.08 3.18<br />
(ii) Capital controls 8.00 5.00 5.00 5.00 6.92 5.38 0.77 0.77<br />
(iii) <strong>Freedom</strong> of foreigners to visit 6.69 6.69 6.69<br />
Area 5. Regulation 5.04 5.39 4.93 4.64 6.05 5.27 5.85 4.27<br />
A. Credit market regulations 6.09 6.92 6.00 5.64 8.55 9.33 9.33 5.93<br />
(i) Ownership of banks 5.00 8.00 8.00 8.00 8.00 8.00 8.00 5.00<br />
(ii) Private sector credit 9.26 8.77 10.00 8.92 9.64 10.00 10.00 7.79<br />
(iii) Interest rate controls/negative real interest rates 4.00 4.00 0.00 0.00 8.00 10.00 10.00 5.00<br />
B. Labor market regulations 3.87 4.30 4.03 3.06 4.52 3.61<br />
(i) Hiring regulations and minimum wage 4.85 4.07 3.30 2.23 3.33<br />
(ii) Hiring and firing regulations 4.36 4.36 4.55 1.69 2.05 2.16<br />
(iii) Centralized collective bargaining 7.24 7.24 7.24 7.24 5.83 4.29 4.81 4.55<br />
(iv) Hours regulations 5.03 5.68 6.00 8.00 8.00<br />
(v) Mandated cost of worker dismissal 10.00<br />
(vi) Conscription 0.00 1.00 0.00 0.00 0.00 0.00 0.00 0.00<br />
C. Business regulations 3.98 5.57 3.43 3.69 3.26<br />
(i) Administrative requirements 6.42 1.39 1.88 1.97<br />
(ii) Bureaucracy costs 5.31 6.15 3.73 5.94 3.22<br />
(iii) Starting a business 4.57 4.68 6.40 6.35 6.39<br />
(iv) Extra payments/bribes/favoritism 2.07 5.02 4.44 3.06 2.98<br />
(v) Licensing restrictions 4.30 4.59 4.71<br />
(vi) Cost of tax compliance 0.32 0.32 0.32
Country Data Tables • 169<br />
Vietnam 1980 1985 1990 1995 2000 2005 2009 2010<br />
Chain-Linked Rating (Rank) Rating (Rank) Rating (Rank) Rating (Rank) Rating (Rank) Rating (Rank) Rating (Rank) Rating (Rank)<br />
Summary Rating (Rank) <br />
Area 1. Size of Government<br />
Area 2. Legal System and Property Rights<br />
Area 3. Sound Money<br />
Area 4. <strong>Freedom</strong> to Trade Internationally<br />
Area 5. Regulation<br />
Unadjusted<br />
Summary Rating (Rank) 6.19 (102) 6.58 (90) 6.54 (96)<br />
Rating (Data) Rating (Data) Rating (Data) Rating (Data) Rating (Data) Rating (Data) Rating (Data) Rating (Data)<br />
Area 1. Size of Government 6.58 8.10 8.04<br />
A. Government consumption<br />
B. Transfers and subsidies<br />
C. Government enterprises and investment<br />
9.38 (8.09) 9.17 (8.83) 9.20 (8.73) 9.08 (9.14)<br />
D. Top marginal tax rate 4.00 7.00 7.00<br />
(i) Top marginal income tax rate 5.00 (40) 7.00 (35) 7.00 (35)<br />
(ii) Top marginal income and payroll tax rate 3.00 (52) 7.00 (35) 7.00 (35)<br />
Area 2. Legal System and Property Rights 5.86 5.98 5.88<br />
A. Judicial independence 4.13 4.78 4.33<br />
B. Impartial courts 4.60 4.65 4.39<br />
C. Protection of property rights 5.72 5.14 4.52<br />
D. Military interference in rule of law and politics 5.00 5.00 5.00<br />
E. Integrity of the legal system 6.67 6.67 6.67<br />
F. Legal enforcement of contracts 6.36 6.51 6.51<br />
G. Regulatory restrictions on sale of real property 8.34 8.73 8.73<br />
H. Reliability of police 5.88 6.54 5.85<br />
I. Business costs of crime 6.00 5.78 6.96<br />
Area 3. Sound Money 6.30 5.94 5.93<br />
A. Money growth 6.96 (15.21) 7.95 (10.27) 7.75 (11.23) 8.02 (9.92)<br />
B. Standard deviation of inflation 8.90 (2.76) 7.42 (6.44) 7.46 (6.35)<br />
C. Inflation: most recent year 8.35 (8.27) 8.59 (7.05) 8.23 (8.86)<br />
D. <strong>Freedom</strong> to own foreign currency bank accounts 0.00 0.00 0.00<br />
Area 4. <strong>Freedom</strong> to Trade Internationally 5.84 6.19 6.37<br />
A. Tariffs 5.80 6.90 7.14<br />
(i) Revenue from trade taxes (% of trade sector) 8.18 (2.73) 8.16 (2.76) 8.16 (2.76) 8.16 (2.76)<br />
(ii) Mean tariff rate 7.36 (13.20) 7.82 (10.90) 8.04 (9.80)<br />
(iii) Standard deviation of tariff rates 1.87 (20.33) 4.72 (13.19) 5.22 (11.96)<br />
B. Regulatory trade barriers 5.53 5.99 6.11<br />
(i) Non-tariff trade barriers 4.35 4.97 4.54<br />
(ii) Compliance cost of importing and exporting 6.72 7.01 7.69<br />
C. Black-market exchange rates 10.00 10.00 10.00<br />
D. Controls of the movement of capital and people 2.04 1.86 2.23<br />
(i) Foreign ownership/investment restrictions 5.54 5.00 5.35<br />
(ii) Capital controls 0.00 0.00 0.77<br />
(iii) <strong>Freedom</strong> of foreigners to visit 0.57 0.57 0.57<br />
Area 5. Regulation 6.39 6.70 6.46<br />
A. Credit market regulations<br />
(i) Ownership of banks<br />
9.54 9.61 9.63<br />
(ii) Private sector credit 9.09 9.23 9.26<br />
(iii) Interest rate controls/negative real interest rates 10.00 10.00 10.00 10.00<br />
B. Labor market regulations 5.38 5.71 5.40<br />
(i) Hiring regulations and minimum wage 10.00 8.90 7.23<br />
(ii) Hiring and firing regulations 5.41 5.78 5.44<br />
(iii) Centralized collective bargaining 6.24 7.62 7.79<br />
(iv) Hours regulations 8.70 10.00 10.00<br />
(v) Mandated cost of worker dismissal 1.93 1.97 1.97<br />
(vi) Conscription 0.00 0.00 0.00<br />
C. Business regulations 4.25 4.78 4.35<br />
(i) Administrative requirements 2.30 2.70 2.85<br />
(ii) Bureaucracy costs 3.98 6.19 3.66<br />
(iii) Starting a business 8.14 8.46 8.48<br />
(iv) Extra payments/bribes/favoritism 4.05 3.79 3.63<br />
(v) Licensing restrictions 7.00 7.52 7.46<br />
(vi) Cost of tax compliance 0.00 0.00 0.00<br />
www.freetheworld.com • www.fraserinstitute.org • Fraser Institute ©2012
170 • <strong>Economic</strong> <strong>Freedom</strong> of the <strong>World</strong>: 2012 Annual Report<br />
Zambia<br />
Fraser Institute ©2012 • www.fraserinstitute.org • www.freetheworld.com<br />
1980 1985 1990 1995 2000 2005 2009 2010<br />
Chain-Linked Rating (Rank) Rating (Rank) Rating (Rank) Rating (Rank) Rating (Rank) Rating (Rank) Rating (Rank) Rating (Rank)<br />
Summary Rating (Rank) 4.60 (71) 3.54 (99) 3.09 (110) 4.76 (102) 6.90 (48) 7.37 (41) 7.79 (12) 7.85 (14)<br />
Area 1. Size of Government 2.56 (100) 3.15 (97) 3.97 (95) 6.43 (44) 6.63 (49) 7.56 (32) 8.14 (10) 7.99 (18)<br />
Area 2. Legal System and Property Rights 6.09 (33) 3.99 (75) 3.70 (79) 5.91 (56) 5.85 (64) 5.69 (64) 6.30 (54) 6.18 (54)<br />
Area 3. Sound Money 6.26 (53) 3.33 (103) 0.59 (115) 0.65 (120) 7.15 (75) 8.11 (66) 8.55 (59) 8.87 (55)<br />
Area 4. <strong>Freedom</strong> to Trade Internationally 2.98 (65) 2.91 (72) 2.59 (93) 5.81 (80) 8.48 (30) 8.09 (23) 8.24 (19) 8.65 (5)<br />
Area 5. Regulation 5.26 (59) 4.37 (86) 4.63 (91) 4.99 (89) 6.36 (59) 7.26 (34) 7.51 (19) 7.39 (30)<br />
Unadjusted<br />
Summary Rating (Rank) 4.73 (69) 3.55 (102) 3.10 (109) 4.76 (101) 6.90 (47) 6.86 (72) 7.25 (45) 7.31 (48)<br />
Rating (Data) Rating (Data) Rating (Data) Rating (Data) Rating (Data) Rating (Data) Rating (Data) Rating (Data)<br />
Area 1. Size of Government 2.56 3.15 3.97 6.43 6.63 7.56 8.14 7.99<br />
A. Government consumption 2.47 (31.60) 3.60 (27.78) 4.96 (23.14) 7.28 (15.24) 8.53 (11.00) 8.24 (11.98) 6.59 (17.60) 6.06 (19.40)<br />
B. Transfers and subsidies 7.77 (8.70) 8.99 (4.20) 8.91 (4.50) 9.43 (2.60) 10.00 (0.00) 10.00 (0.40) 9.99 (0.55) 9.91 (0.83)<br />
C. Government enterprises and investment 0.00 (77.10) 0.00 (90.70) 2.00 (46.20) 2.00 (41.30) 0.00 (62.60) 4.00 (31.00) 8.00 (19.62) 8.00 (18.28)<br />
D. Top marginal tax rate 0.00 0.00 0.00 7.00 8.00 8.00 8.00 8.00<br />
(i) Top marginal income tax rate 0.00 (70) 0.00 (80) 0.00 (75) 7.00 (35) 8.00 (30) 8.00 (30) 8.00 (30) 8.00 (30)<br />
(ii) Top marginal income and payroll tax rate<br />
Area 2. Legal System and Property Rights 6.09 3.99 3.70 5.91 5.85 5.24 5.80 5.70<br />
A. Judicial independence 6.67 6.18 2.86 4.65 4.12<br />
B. Impartial courts 4.85 4.86 5.00 4.63 4.98<br />
C. Protection of property rights 4.77 3.23 6.05 5.24 5.23<br />
D. Military interference in rule of law and politics 6.31 8.33 8.33 8.33 8.33<br />
E. Integrity of the legal system 6.96 6.67 6.67 6.67 6.67<br />
F. Legal enforcement of contracts 4.56 4.56 4.56<br />
G. Regulatory restrictions on sale of real property 5.52 7.07 6.52<br />
H. Reliability of police 4.95 5.27 5.84<br />
I. Business costs of crime 3.26 5.79 5.03<br />
Area 3. Sound Money 6.26 3.33 0.59 0.65 7.15 8.11 8.55 8.87<br />
A. Money growth 9.21 (3.95) 6.58 (17.10) 1.92 (40.40) 0.00 (58.52) 5.45 (22.73) 6.97 (15.14) 8.29 (8.57) 7.69 (11.56)<br />
B. Standard deviation of inflation 8.18 (4.55) 4.96 (12.60) 0.43 (23.92) 0.00 (49.23) 8.35 (4.11) 9.13 (2.17) 8.58 (3.55) 9.47 (1.32)<br />
C. Inflation: most recent year 7.65 (11.76) 1.77 (41.14) 0.00 (106.39) 2.62 (36.92) 4.79 (26.03) 6.34 (18.32) 7.32 (13.40) 8.30 (8.50)<br />
D. <strong>Freedom</strong> to own foreign currency bank accounts 0.00 0.00 0.00 0.00 10.00 10.00 10.00 10.00<br />
Area 4. <strong>Freedom</strong> to Trade Internationally 3.47 2.93 2.61 5.81 8.48 6.86 6.99 7.34<br />
A. Tariffs 8.40 4.39 5.84 6.04 6.22 6.97 6.66 6.68<br />
(i) Revenue from trade taxes (% of trade sector) 8.40 (2.40) 5.73 (6.40) 6.80 (4.80) 7.47 (3.80) 5.11 (7.33) 7.82 (3.27) 6.72 (4.92) 6.91 (4.64)<br />
(ii) Mean tariff rate 3.04 (34.80) 4.88 (25.60) 4.88 (25.60) 7.06 (14.70) 7.08 (14.60) 7.28 (13.60) 7.32 (13.40)<br />
(iii) Standard deviation of tariff rates 5.76 (10.60) 6.48 (8.80) 6.00 (10.01) 5.97 (10.06) 5.82 (10.45)<br />
B. Regulatory trade barriers 3.40 4.68 5.86<br />
(i) Non-tariff trade barriers 5.07 6.38 6.22<br />
(ii) Compliance cost of importing and exporting 1.72 2.98 5.50<br />
C. Black-market exchange rates 0.00 2.40 0.00 9.40 10.00 10.00 10.00 10.00<br />
D. Controls of the movement of capital and people 2.00 2.00 2.00 2.00 9.23 7.07 6.61 6.80<br />
(i) Foreign ownership/investment restrictions 8.25 6.86 7.44<br />
(ii) Capital controls 2.00 2.00 2.00 2.00 9.23 9.23 9.23 9.23<br />
(iii) <strong>Freedom</strong> of foreigners to visit 3.74 3.74 3.74<br />
Area 5. Regulation 5.26 4.37 4.63 4.99 6.36 6.52 6.75 6.64<br />
A. Credit market regulations 4.04 1.70 2.39 3.34 6.95 6.79 8.00 7.78<br />
(i) Ownership of banks 2.00 2.00 2.00 5.00 5.00 5.00 5.00 5.00<br />
(ii) Private sector credit 6.13 3.10 5.18 5.03 7.86 7.37 10.00 9.33<br />
(iii) Interest rate controls/negative real interest rates 4.00 0.00 0.00 0.00 8.00 8.00 9.00 9.00<br />
B. Labor market regulations 6.92 6.47 6.34<br />
(i) Hiring regulations and minimum wage 10.00 8.90 7.77<br />
(ii) Hiring and firing regulations 8.16 5.71 5.75<br />
(iii) Centralized collective bargaining 8.68 6.22 6.52<br />
(iv) Hours regulations 4.70 8.00 8.00<br />
(v) Mandated cost of worker dismissal 0.00 0.00 0.00<br />
(vi) Conscription 10.00 10.00 10.00 10.00 10.00 10.00 10.00 10.00<br />
C. Business regulations 5.86 5.78 5.80<br />
(i) Administrative requirements 5.31 4.65 4.66<br />
(ii) Bureaucracy costs 5.53 5.52 4.32<br />
(iii) Starting a business 8.56 9.13 9.14<br />
(iv) Extra payments/bribes/favoritism 2.90 4.54 4.09<br />
(v) Licensing restrictions 4.35 2.33 4.08<br />
(vi) Cost of tax compliance 8.52 8.52 8.52
Country Data Tables • 171<br />
Zimbabwe 1980 1985 1990 1995 2000 2005 2009 2010<br />
Chain-Linked Rating (Rank) Rating (Rank) Rating (Rank) Rating (Rank) Rating (Rank) Rating (Rank) Rating (Rank) Rating (Rank)<br />
Summary Rating (Rank) 4.57 (72) 4.51 (84) 4.83 (84) 5.77 (74) 4.60 (118) 2.88 (123) 4.32 (121) 4.26 (121)<br />
Area 1. Size of Government 6.90 (13) 5.48 (39) 5.57 (59) 7.00 (23) 5.85 (74) 4.59 (108) 6.25 (66) 4.90 (106)<br />
Area 2. Legal System and Property Rights 2.97 (67) 3.05 (89) 3.99 (75) 5.53 (68) 5.02 (77) 2.87 (115) 3.11 (116) 3.21 (110)<br />
Area 3. Sound Money 6.35 (48) 6.31 (73) 5.67 (83) 4.92 (95) 2.89 (119) 0.00 (123) 0.00 (123) 0.00 (123)<br />
Area 4. <strong>Freedom</strong> to Trade Internationally 3.28 (63) 3.17 (70) 4.70 (64) 5.85 (79) 3.23 (120) 2.27 (121) 4.65 (118) 5.16 (113)<br />
Area 5. Regulation 3.53 (94) 4.52 (84) 4.27 (99) 5.54 (75) 6.02 (82) 4.55 (120) 5.05 (117) 5.06 (115)<br />
Unadjusted<br />
Summary Rating (Rank) 4.80 (66) 4.74 (78) 5.01 (78) 5.80 (71) 4.60 (118) 2.94 (141) 4.41 (140) 4.35 (142)<br />
Rating (Data) Rating (Data) Rating (Data) Rating (Data) Rating (Data) Rating (Data) Rating (Data) Rating (Data)<br />
Area 1. Size of Government 6.90 5.48 5.57 7.00 5.85 4.59 6.25 4.90<br />
A. Government consumption 5.56 (21.10) 4.52 (24.65) 4.84 (23.56) 5.42 (21.57) 3.65 (27.60) 7.60 (14.16) 8.74 (10.27) 7.34 (15.04)<br />
B. Transfers and subsidies 7.03 (11.40) 7.41 (10.00) 8.45 (6.20) 8.57 (5.73) 7.75 (8.77) 7.75 (8.77) 7.75 (8.77) 7.75 (8.77)<br />
C. Government enterprises and investment 10.00 (12.70) 10.00 (14.50) 8.00 (18.60) 10.00 (11.80) 10.00 (6.20) 0.00 (100.00) 4.00 (31.78) 0.00 (98.40)<br />
D. Top marginal tax rate 5.00 0.00 1.00 4.00 2.00 3.00 4.50 4.50<br />
(i) Top marginal income tax rate 5.00 (45) 0.00 (63) 1.00 (60) 4.00 (45) 2.00 (53) 3.00 (46) 5.00 (36) 5.00 (36)<br />
(ii) Top marginal income and payroll tax rate 1.00 (60) 4.00 (45) 2.00 (53) 3.00 (46) 4.00 (42) 4.00 (42)<br />
Area 2. Legal System and Property Rights 2.97 3.05 3.99 5.53 5.02 3.49 3.78 3.90<br />
A. Judicial independence 6.67 6.18 1.10 2.10 2.73<br />
B. Impartial courts 7.25 7.35 2.14 3.16 3.32<br />
C. Protection of property rights 4.77 3.23 1.44 1.95 2.24<br />
D. Military interference in rule of law and politics 4.87 5.00 5.00 3.33 3.33<br />
E. Integrity of the legal system 4.11 3.33 5.00 5.00 5.00<br />
F. Legal enforcement of contracts 5.43 2.37 2.37<br />
G. Regulatory restrictions on sale of real property 4.43 6.62 6.78<br />
H. Reliability of police 3.01 3.03 6.26<br />
I. Business costs of crime 3.84 6.44 3.04<br />
Area 3. Sound Money 6.35 6.31 5.67 4.92 2.89 0.00 2.48 2.87<br />
A. Money growth 7.96 (10.19) 8.86 (5.70) 7.24 (13.79) 4.53 (27.34) 3.92 (30.39) 0.00 (224.09) 0.00 (457.94) 0.00 (457.94)<br />
B. Standard deviation of inflation 8.75 (3.13) 7.68 (5.80) 8.38 (4.05) 7.28 (6.81) 2.64 (18.39) 0.00 (140.78) 0.00 (10773.88) 0.00 (10799.45)<br />
C. Inflation: most recent year 8.69 (6.57) 8.70 (6.49) 7.05 (14.75) 7.86 (10.70) 0.00 (55.86) 0.00 (302.12) 4.93 (25.33) 6.50 (17.51)<br />
D. <strong>Freedom</strong> to own foreign currency bank accounts 0.00 0.00 0.00 0.00 5.00 0.00 5.00 5.00<br />
Area 4. <strong>Freedom</strong> to Trade Internationally 3.48 3.35 4.90 5.95 3.23 2.38 4.87 5.40<br />
A. Tariffs 8.43 6.46 5.71 6.78 4.56 3.92 3.33 3.74<br />
(i) Revenue from trade taxes (% of trade sector) 8.87 (1.70) 4.67 (8.00) 3.87 (9.20) 5.40 (6.90) 5.11 (7.33) 5.11 (7.33) 5.11 (7.33) 5.11 (7.33)<br />
(ii) Mean tariff rate 8.00 (10.00) 8.26 (8.70) 7.98 (10.10) 8.16 (9.20) 5.72 (21.40) 6.66 (16.70) 4.88 (25.60) 6.10 (19.50)<br />
(iii) Standard deviation of tariff rates 5.28 (11.80) 2.84 (17.90) 0.00 (71.68) 0.00 (54.83) 0.00 (68.06)<br />
B. Regulatory trade barriers 3.68 5.86 3.15 3.45 5.39<br />
(i) Non-tariff trade barriers 3.68 5.22 4.68 5.73 5.84<br />
(ii) Compliance cost of importing and exporting 6.49 1.62 1.16 4.94<br />
C. Black-market exchange rates 0.00 1.60 7.00 9.80 0.00 0.00 10.00 10.00<br />
D. Controls of the movement of capital and people 2.00 2.00 2.00 3.53 2.50 2.43 2.71 2.49<br />
(i) Foreign ownership/investment restrictions 5.06 5.00 4.00 4.85 4.17<br />
(ii) Capital controls 2.00 2.00 2.00 2.00 0.00 0.00 0.00 0.00<br />
(iii) <strong>Freedom</strong> of foreigners to visit 3.29 3.29 3.29<br />
Area 5. Regulation 4.28 5.49 4.90 5.58 6.02 4.23 4.69 4.70<br />
A. Credit market regulations 4.45 4.65 6.16 6.76 7.71 4.11 4.46 4.79<br />
(i) Ownership of banks 2.00 2.00 2.00 5.00 8.00 8.00 8.00 8.00<br />
(ii) Private sector credit 5.36 3.95 8.49 7.27 7.12 4.33 5.38 6.37<br />
(iii) Interest rate controls/negative real interest rates 6.00 8.00 8.00 8.00 8.00 0.00 0.00 0.00<br />
B. Labor market regulations 3.63 6.02 4.88 5.05 5.17 5.05<br />
(i) Hiring regulations and minimum wage 5.85 3.52 8.90 6.67 6.67<br />
(ii) Hiring and firing regulations 3.42 3.42 1.57 2.59 3.28 3.17<br />
(iii) Centralized collective bargaining 4.49 4.49 2.45 2.82 3.05 2.48<br />
(iv) Hours regulations 6.35 6.85 6.00 8.00 8.00<br />
(v) Mandated cost of worker dismissal 0.00 0.00 0.00<br />
(vi) Conscription 1.00 10.00 3.00 10.00 10.00 10.00 10.00 10.00<br />
C. Business regulations 3.97 5.48 3.51 4.44 4.25<br />
(i) Administrative requirements 5.10 1.99 3.50 3.52<br />
(ii) Bureaucracy costs 4.30 7.05 3.37 5.87 4.60<br />
(iii) Starting a business 3.68 5.68 3.59 5.20 5.55<br />
(iv) Extra payments/bribes/favoritism 3.92 4.09 4.55 4.82 4.55<br />
(v) Licensing restrictions 0.00 0.00 0.00<br />
(vi) Cost of tax compliance 7.58 7.29 7.29<br />
www.freetheworld.com • www.fraserinstitute.org • Fraser Institute ©2012
Fraser Institute ©2012 • www.fraserinstitute.org • www.freetheworld.com
Chapter 3 Institutions and <strong>Economic</strong>, Political,<br />
and Civil Liberty in Latin America<br />
Alice M. Crisp and James Gwartney*<br />
Introduction<br />
The economic, political, and civil institutions of a country are interrelated and they<br />
work as a combination to influence the operation of an economy. To a large degree,<br />
we know the bundle of economic institutions and policies that lead to economic<br />
growth and prosperity. But economic institutions are an outgrowth of political institutions<br />
and the choices that emanate from the political process. Similarly, civil liberties<br />
influence the public discourse and thereby have an impact on both economic<br />
and political decision-making. Because of these interrelationships, it is important to<br />
consider institutional quality in all of these areas. This chapter takes a closer look at<br />
the economic, political, and civil institutions of 22 Latin American countries. This<br />
analysis will enhance our knowledge of the interaction among institutional factors,<br />
and the strengths and weaknesses of each of these economies.1<br />
In addition to the summary index of <strong>Economic</strong> <strong>Freedom</strong> of the <strong>World</strong> (EFW<br />
index), two other measures of the quality of economic institutions are considered.<br />
These two measures are the <strong>World</strong> Bank’s Doing Business report and the Global<br />
Competitiveness Report of the <strong>World</strong> <strong>Economic</strong> Forum. Doing Business compares<br />
the regulatory cost imposed on business activity across countries and over time.<br />
The index is based on the time and money cost of regulatory compliance accompanying<br />
ten generic business activities. The ten areas covered by the index are: starting<br />
a business, dealing with construction permits, getting electricity, registering<br />
property, getting credit, protecting investors, paying taxes, trading across borders,<br />
enforcing contracts, and resolving insolvency. Countries imposing regulations that<br />
increase the cost of engaging in normal business activities or substitute government<br />
mandates for agreements among parties are given lower ratings. The Global<br />
* Cite this chapter: Crisp, Alice M., and James Gwartney (2012). Institutions and <strong>Economic</strong>,<br />
Political, and Civil Liberty in Latin America. In James Gwartney, Robert Lawson, and Joshua<br />
Hall, <strong>Economic</strong> <strong>Freedom</strong> of the <strong>World</strong>: 2012 Annual Report (Fraser Institute): 173–200.<br />
1 Note that Caribbean countries are generally considered a subregion of Latin America. Thus,<br />
Latin America covers Mexico, the Caribbean countries, and all of Central and South America.<br />
Countries such as the Bahamas, Barbados, and Belize with populations less than half a million<br />
are not included in this analysis.<br />
www.freetheworld.com • www.fraserinstitute.org • Fraser Institute ©2012
174 • <strong>Economic</strong> <strong>Freedom</strong> of the <strong>World</strong>: 2012 Annual Report<br />
Fraser Institute ©2012 • www.fraserinstitute.org • www.freetheworld.com<br />
Competitiveness Report (GCR) uses a combination of objective and survey data to<br />
rate the “competitiveness” of various countries. While this measure considers some<br />
institutional variables, it also incorporates factors such as educational and skill levels<br />
of the labor force, size of the domestic market, the environment for innovation,<br />
access to advanced technology, and the development of the country’s physical infrastructure<br />
(roads, telecommunications, and transportation networks).<br />
These three reports measure different dimensions of a country’s economic environment.<br />
The index in <strong>Economic</strong> <strong>Freedom</strong> of the <strong>World</strong> uses several components from<br />
both the Doing Business report and the Global Competitiveness Report in some of its<br />
area components. To some extent, a country’s performance in one of these indexes<br />
will tend to be correlated with the others. The original ratings of the three indicators<br />
were converted to a zero-to-10 scale and averaged to derive a measure of the<br />
economic institutional quality of Latin American countries. These ratings are presented<br />
in Exhibit 3.1.<br />
Five measures were used to rate countries in the area of political institutions: (1)<br />
the rating for Legal System and Property Rights from the EFW index, (2) Political<br />
Rights rating from <strong>Freedom</strong> House’s <strong>Freedom</strong> in the <strong>World</strong>, (3) the Polity IV rating<br />
on the authoritarian-democratic scale, (4) the Polity IV rating for constraints on the<br />
executive, and (5) the Corruption Perceptions Index from Transparency International.<br />
These five measures were placed on a zero-to-10 scale and used to derive a combination<br />
measure of the political institutions of the Latin American countries<br />
(Exhibit 3.1). Clearly, this measure incorporates a broad range of political factors,<br />
including a legal system that protects property rights and enforces contracts in an<br />
even-handed manner, democratic decision-making, constraints on the executive,<br />
openness of the political process, and absence of corruption.<br />
Three measures were used to examine differences in civil liberties among the<br />
countries: (1) the Civil Liberties rating from <strong>Freedom</strong> House, (2) the press freedom<br />
measure from <strong>Freedom</strong> of the Press of <strong>Freedom</strong> House, and (3) the Press<br />
<strong>Freedom</strong> Index from Reporters Without Borders. The civil liberties component from<br />
<strong>Freedom</strong> House provides a measure of the degree to which freedom of speech, religion,<br />
association, and other civil liberties of individuals are protected both legally<br />
and in practice. <strong>Freedom</strong> House’s <strong>Freedom</strong> of the Press considers legal, political, and<br />
economic factors that might interfere with the free flow of news or exert an impact<br />
on its content. The Press <strong>Freedom</strong> Index from Reporters without Borders measures<br />
violations of press freedom and government efforts to ensure freedom of the press,<br />
and indicates the degree of freedom available to journalists and news organizations.<br />
The latter measure gives considerable attention to violence against journalists, censorship<br />
of the news media, searches and harassment, self-censorship, and financial<br />
pressures that affect the freedom of the press. As in the case of the economic and<br />
political institutional measures, the three indicators of civil liberty were placed on<br />
a zero-to-10 scale in order to derive a country average (Exhibit 3.1). Taken together,<br />
they provide a broad indicator of the extent to which a country protects civil liberties<br />
and provides a free and competitive environment for the news media.<br />
In order to provide some international perspective on the ratings of Latin<br />
American countries, the three measures of economic institutions, political institutions,<br />
and civil liberty were also derived for the top 20 countries in the index of<br />
<strong>Economic</strong> <strong>Freedom</strong> of the <strong>World</strong>. This benchmark will provide perspective on the<br />
strengths and weaknesses of Latin American countries by comparing them with<br />
the world’s best performers.
www.freetheworld.com • www.fraserinstitute.org • Fraser Institute ©2012<br />
Exhibit 3.1: <strong>Economic</strong>, Political, and Civil Liberties of Latin American Countries for 2010<br />
0 2 4 6 8 10<br />
Benchmark<br />
7.28<br />
Chile 1<br />
6.80<br />
Peru 2<br />
6.53<br />
Panama 3<br />
6.14<br />
Colombia 4<br />
6.13<br />
Mexico 5<br />
6.02<br />
Trinidad & Tobago 6<br />
5.72<br />
Uruguay 7<br />
5.54<br />
Guatemala 8<br />
Jamaica 9<br />
Costa Rica 10<br />
El Salvador 11<br />
Dominican Republic 12<br />
Paraguay 13<br />
Nicaragua 14<br />
Honduras 15<br />
Brazil 16<br />
Guyana 17<br />
Argentina 18<br />
Ecuador 19<br />
Bolivia 20<br />
Haiti 21<br />
Venezuela 22<br />
<strong>Economic</strong> Institutions<br />
5.30<br />
5.26<br />
5.00<br />
4.99<br />
4.97<br />
4.91<br />
4.80<br />
4.74<br />
4.60<br />
4.58<br />
4.54<br />
4.17<br />
3.95<br />
3.30<br />
2.64<br />
0 2 4 6 8 10<br />
Benchmark<br />
6.58<br />
Chile 1<br />
8.07<br />
Uruguay 2<br />
7.78<br />
Costa Rica 3<br />
7.38<br />
Trinidad & Tobago 4<br />
6.55<br />
Peru 5<br />
6.50<br />
Panama 6<br />
6.47<br />
Jamaica 7<br />
6.44<br />
Brazil 8<br />
6.19<br />
Argentina 9<br />
5.86<br />
El Salvador 10<br />
Dominican Republic 11<br />
Mexico 12<br />
Nicaragua 13<br />
Paraguay 14<br />
Colombia 15<br />
Guatemala 16<br />
Bolivia 17<br />
Guyana 18<br />
Honduras 19<br />
Ecuador 20<br />
Haiti 21<br />
Venezuela 22<br />
Political Institutions<br />
5.85<br />
5.76<br />
5.71<br />
5.61<br />
5.57<br />
5.55<br />
5.53<br />
5.38<br />
5.19<br />
4.98<br />
4.53<br />
4.18<br />
1.88<br />
Benchmark<br />
Costa Rica 1<br />
Uruguay 2<br />
Jamaica 3<br />
Trinidad & Tobago 4<br />
Chile 5<br />
Guyana 6<br />
El Salvador 7<br />
Argentina 8<br />
Dominican Republic 9<br />
Brazil 10<br />
Panama 11<br />
Nicaragua 12<br />
Haiti 13<br />
Bolivia 14<br />
Paraguay 15<br />
Ecuador 16<br />
Peru 17<br />
Guatemala 18<br />
Honduras 19<br />
Colombia 20<br />
Mexico 21<br />
Venezuela 22<br />
Civil LIberty<br />
0 2 4 6 8 10<br />
7.38<br />
9.07<br />
8.69<br />
8.40<br />
8.03<br />
7.73<br />
7.35<br />
7.29<br />
7.17<br />
6.89<br />
6.69<br />
6.34<br />
6.29<br />
6.18<br />
6.13<br />
6.03<br />
6.00<br />
5.86<br />
5.53<br />
4.60<br />
4.58<br />
4.51<br />
3.97
176 • <strong>Economic</strong> <strong>Freedom</strong> of the <strong>World</strong>: 2012 Annual Report<br />
Fraser Institute ©2012 • www.fraserinstitute.org • www.freetheworld.com<br />
The Institutional Ratings of Latin American Countries<br />
<strong>Economic</strong> institutions The top five Latin American countries are Chile, Peru,<br />
Panama, Colombia, and Mexico. However, all of these countries fall well below the<br />
top-20 benchmark . Chile has the highest rating, 6.80, compared to the benchmark,<br />
7.28. At the other end of the spectrum, the five countries with the lowest rating for<br />
economic institutions are Venezuela, Haiti, Bolivia, Ecuador, and Argentina. In all<br />
except Argentina, the rating of these countries is three points or more below the<br />
top-20 benchmark.<br />
Political institutions The ratings of three Latin American countries—Chile, Uruguay,<br />
and Costa Rica—exceed the top-20 benchmark. All other countries are<br />
below the benchmark. The bottom five Latin American countries in the politicalinstitutions<br />
category are Venezuela, Haiti, Ecuador, Honduras, and Guyana.<br />
Civil liberties The five highest-rated countries are Costa Rica, Uruguay, Jamaica,<br />
Trinidad & Tobago, and Chile. These top five countries in Latin America exceed<br />
the top-20 benchmark. The bottom five countries in this category are Venezuela,<br />
Mexico, Colombia, Honduras, and Guatemala.<br />
There is a close relationship between the quality of economic and political institutions.<br />
Countries that have institutions of high quality in one tend to rank highly in<br />
the other. For example, five countries—Chile, Peru, Panama, Trinidad & Tobago,<br />
and Uruguay—rank in the top eight in both economic and political institutional<br />
quality. Similarly, six countries—Venezuela, Ecuador, Haiti, Bolivia, Guyana, and<br />
Honduras—rank in the bottom eight in both the economic and political categories.<br />
The governments of Latin America might be placed into three broad categories.<br />
First, there is a group characterized by modest restrictions on economic freedom,<br />
a legal system that generally protects property rights and enforces contracts, and a<br />
political system based primarily on democratic principles, constraints on the executive,<br />
and rule of law. Countries in this group would include Chile, Peru, Panama,<br />
Uruguay, Costa Rica, and Trinidad & Tobago. These countries have flaws. With<br />
the exception of Chile, none rank in the top 20 worldwide in economic freedom.<br />
Nonetheless, the combination of their economic and political institutions is generally<br />
the best in Latin America.<br />
Second, at the other end of the spectrum, there is another group characterized<br />
by extensive restrictions on economic freedom, a politicized and arbitrary<br />
legal system, extensive regulation, and a political system that is authoritarian with<br />
few effective constraints on the power of the executive. Countries in this group<br />
include Venezuela, Haiti, Bolivia, Ecuador, Honduras, and Guyana. Both the economic<br />
and political institutions of these countries undermine personal freedom<br />
and economic progress.<br />
Finally, there is an intermediate group. These countries have substantial restrictions<br />
on economic freedom and their legal systems are often poor. But, they are<br />
more democratic and less authoritarian than the second group. Countries in this category<br />
would include Nicaragua, Paraguay, Mexico, Colombia, Jamaica, El Salvador,<br />
and the Dominican Republic.<br />
Argentina, Brazil, and Guatemala do not fit precisely into any of the three<br />
groups. Brazil and Argentina rank relatively high, 8 th and 9 th respectively, in political
Institutions and <strong>Economic</strong>, Political, and Civil Liberty in Latin America • 177<br />
measures, but low in the economic measures, Brazil (16 th ) and Argentina (17 th ). On<br />
the other hand, Guatemala’s economic rating is relatively high, 8 th , but its political<br />
ranking is low, 16 th , among Latin American countries.<br />
Compared to countries worldwide, most Latin American countries have governments<br />
of small size but politicized legal systems, often favoring some relative to<br />
others. In the EFW index, 13 of the 22 Latin American countries rank among the<br />
top 50 worldwide in Area 1, Size of Government but only Chile places among the<br />
top 50 in Area 2, Legal System and Property Rights.2 In contrast, 15 of the 22 Latin<br />
American countries place among the bottom 50 worldwide in Area 2. This indicates<br />
that, while the tax and spending levels of most Latin American governments are<br />
low, these countries generally perform the basic protective functions of government<br />
poorly. Moreover, they rely extensively on regulatory mandates. Only two—Peru<br />
and Trinidad & Tobago—rank among the top 50 worldwide in Area 5, Regulation,<br />
while nine countries in the region place among the bottom 50.<br />
The data from <strong>Economic</strong> <strong>Freedom</strong> of the <strong>World</strong> indicates that the region has become<br />
more economically free during the past two decades. The mean EFW chain-linked<br />
summary rating of the 22 Latin American countries included in this chapter rose<br />
from 5.32 in 1990 to 6.33 in 1995 and 6.83 in 2000. In 2010, the mean regional EFW<br />
rating was 6.73, an increase of 1.41 units compared to 1990. But the changes were<br />
highly uneven. The EFW rating of four countries—Nicaragua, Peru, El Salvador,<br />
and Dominican Republic—rose by more than two units between 1990 and 2010.<br />
In contrast, during the same period, the EFW rating of Venezuela declined by 1.5<br />
units and the ratings of Mexico and Ecuador increased by less than four tenths<br />
of a point. Since 1995, the EFW ratings of five countries—Argentina, Venezuela,<br />
Ecuador, Bolivia, and Trinidad & Tobago—have declined.<br />
We now turn to a more detailed analysis of the institutional environment of each<br />
of the countries in the region.<br />
2 The five Areas of the EFW Index are: [1] Size of Government; [2] Legal System and Property<br />
Rights; [3] Sound Money; [4] <strong>Freedom</strong> to Trade Internationally; [5] Regulation. For a complete<br />
list of the Areas, Components, and Sub-components, see Exhibit 1.1, page 5, in this volume.<br />
www.freetheworld.com • www.fraserinstitute.org • Fraser Institute ©2012
178 • <strong>Economic</strong> <strong>Freedom</strong> of the <strong>World</strong>: 2012 Annual Report<br />
Argentina<br />
Changes across Time: Chain-linked Summary Rating (Ranking)<br />
10<br />
8<br />
6<br />
4<br />
2<br />
0<br />
(18 th )<br />
4.42<br />
1990<br />
(5 th )<br />
7.04<br />
1995<br />
Income and growth<br />
In 2010, Argentina’s income per capita was $16,011, placing it<br />
2 nd among 22 Latin American countries. From 2000 to 2010, real<br />
GDP per capita grew at an annual rate of 4.08%, the 8 th most<br />
rapid in Latin America.<br />
<strong>Economic</strong> institutions and analysis<br />
During the 1990s, there were signs that Argentina was turn-<br />
ing away from its statist history and moving toward a freer<br />
economy, but this expectation proved to be premature. By<br />
2010, Argentina’s EFW rating had fallen to 5.77, down from<br />
7.40 in 2000. Among the 22 Latin American countries, only<br />
Venezuela had a lower summary rating in 2010. Argentina was<br />
rated marginally better in the Doing Business report and Global<br />
Competitiveness Report: its regional ranking was 13 th in the for-<br />
mer and 11 th in the latter.<br />
(7 th )<br />
7.40<br />
2000<br />
(19 th )<br />
5.97<br />
2005<br />
(20 th )<br />
5.77<br />
2010<br />
Argentina lags well behind most countries in the region in<br />
all five areas of the EFW index. Its regional ranking is 18 th in Area<br />
1: Size of Government. The top marginal personal income-tax<br />
rate is 35% (49% including payroll taxes). Furthermore, government<br />
consumption as a share of the total is high compared to<br />
Latin American standards, 20%.<br />
In Area 3, Sound Money, Argentina ranks 20th in the region.<br />
Its high inflation rate, 26.6%, is a major contributing factor to<br />
this low rating. The government claims that the inflation rate is<br />
lower but most independent sources place it in the 20% range.<br />
The Economist recently challenged the government’s data and<br />
announced that it would no longer publish Argentina’s official<br />
statistics because “[w]e are tired of being an unwilling party to<br />
what appears to be a deliberate attempt to deceive voters and<br />
swindle investors” (The Economist, 2012, February 25). Moreover,<br />
the monetary situation is likely to get worse. A 1991 monetary<br />
rule requiring that base money be backed with international<br />
reserves and placed beyond the control of the executive has<br />
recently been eliminated. So has the mandate that the central<br />
Fraser Institute ©2012 • www.fraserinstitute.org • www.freetheworld.com<br />
EFW Area Ratings (Rankings) in 2010<br />
10<br />
8<br />
6<br />
4<br />
2<br />
0<br />
(18 th )<br />
6.29<br />
Area 1<br />
(13 th )<br />
4.31<br />
Area 2<br />
(20 th )<br />
6.59<br />
Area 3<br />
(21 st )<br />
6.24 (20 th )<br />
5.52<br />
Area 4<br />
Area 5<br />
(21 st )<br />
5.79<br />
Summary<br />
bank pursue the singular goal of price stability. Instead, the<br />
central bank is now instructed to pursue wider goals, including<br />
growth with social fairness and financial stability. Given the<br />
country’s inflationary past, these are ominous signs.<br />
Argentina ranks 13th in the region in Area 2 and 20th in Area<br />
5. Several of its component ratings in these two areas placed in<br />
the bottom four in the region. These included Impartial courts<br />
(2B), Protection of property rights (2C), and Hiring and firing<br />
regulations (5Bii). Since 2003, the Argentine government has<br />
confiscated bank deposits and retirement savings, abrogated<br />
contracts, imposed export taxes, and expanded price controls.<br />
The controlling interest of the largest Argentinean oil producer,<br />
YPF, a subsidiary of the Spanish company Repsol, has been<br />
nationalized.<br />
Political institutions and civil liberty<br />
While Argentina is a political democracy with a diverse number<br />
of political parties, it has a history of arbitrary exercise of<br />
political power, crony capitalism, government favoritism, and<br />
corruption. Argentina ranked 5th among Latin American countries<br />
in the <strong>Freedom</strong> House political rights measure. In both<br />
the Polity IV measures of democracy and constraints on the<br />
executive, it ranked 9th . Argentina ranked 11th in the region<br />
in Transparency International’s Corruption Perceptions Index.<br />
However, it ranked 105th among the 178 countries worldwide.<br />
Though Argentina ranked 5th in the Reporters without<br />
Borders Press <strong>Freedom</strong> Index, this mainly demonstrates that<br />
journalists are free from violent attacks or threats. While<br />
freedom of the press is constitutionally protected, extensive<br />
government purchases of advertising provides political leaders<br />
with a powerful tool with which to exert control over the<br />
press. Of the 22 countries in the region, Argentina ranks 15th in<br />
<strong>Freedom</strong> House’s <strong>Freedom</strong> of the Press, indicating substantial<br />
government involvement in actions that undermine the independence<br />
of the press.
Bolivia<br />
Changes across Time: Chain-linked Summary Rating (Ranking)<br />
10<br />
8<br />
6<br />
4<br />
2<br />
0<br />
(13 th )<br />
5.42<br />
1990<br />
(9 th )<br />
6.60<br />
1995<br />
Income and growth<br />
(10 th )<br />
6.97<br />
2000<br />
(15 th )<br />
6.38<br />
2005<br />
(18 th )<br />
6.36<br />
2010<br />
Bolivia is one of the poorest countries in Latin America. Its<br />
income per capita in 2010 was $4,849, 17th among the 22 Latin<br />
American countries. From 2000 to 2010, real GDP per capita<br />
grew at an annual rate of 3.7%, 11th most rapid in Latin America.<br />
<strong>Economic</strong> institutions and analysis<br />
The economic institutions of Bolivia are among the weakest in<br />
Latin America. In 2010, Bolivia ranked 17th among the 22 Latin<br />
American countries in the EFW index. Its ranking was even<br />
lower (20th in the region) in the Doing Business report, indicating<br />
that Bolivia is a highly regulated and bureaucratic economy. Its<br />
ranking in the Global Competitiveness Report (GCR) was slightly<br />
higher, 14th . Bolivia’s summary EFW rating has fluctuated substantially<br />
in recent decades. It made modest moves toward economic<br />
freedom during the 1990s and its ranking climbed to 10th in the region by 2000. The situation has reversed dramatically<br />
during the last decade. By 2005 its ranking had plunged to 15th and, by 2010, it had fallen to 18th .<br />
Bolivia ranks in the bottom half among Latin American<br />
countries in Areas 1, 2, 4, and 5 in the EFW index. The Bolivian<br />
economy is characterized by widespread government enterprises,<br />
excessive regulation, and a politicized legal system.<br />
Government enterprises account for 57% of investment in<br />
Bolivia, resulting in a zero rating for this component of Area 1,<br />
Size of Government. Excessive regulation is an obvious weakness<br />
of the Bolivian economy. Its rating for Area 5, Regulation<br />
places it 19th in the region. In Bolivia, the cost of starting a<br />
Institutions and <strong>Economic</strong>, Political, and Civil Liberty in Latin America • 179<br />
EFW Area Ratings (Rankings) in 2010<br />
10<br />
8<br />
6<br />
4<br />
2<br />
0<br />
(16 th )<br />
6.31<br />
Area 1<br />
(16 th )<br />
4.09<br />
Area 2<br />
(9 th )<br />
8.70<br />
Area 3<br />
(17 th )<br />
7.00<br />
Area 4<br />
(19 th )<br />
5.85<br />
Area 5<br />
(17 th )<br />
6.39<br />
Summary<br />
business is 90.4% of GDP per capita compared to 5.1% in Chile,<br />
and 11.9% in Peru, two of its closest neighbors. Furthermore, it<br />
takes 1,080 hours to prepare and pay taxes in Bolivia, nearly<br />
3 times the 316 hours in Chile, and 309 hours in Peru. Given<br />
Bolivia’s regulatory environment, the weakness in the Area 2,<br />
Legal System and Property Rights is an expected result. Indeed,<br />
this is the case.<br />
Political institutions and civil liberty<br />
While Bolivia is an electoral democracy, its legal and political<br />
institutions are both weak and fragile. It ranks 16th among the<br />
22 Latin American countries in the Area 2, Legal System and<br />
Property Rights, of the EFW Index and the Polity IV measure of<br />
democracy. Its ranking was a little better for other political measures.<br />
It ranked 13th in <strong>Freedom</strong> House’s <strong>Freedom</strong> in the <strong>World</strong><br />
Political Rights component, and Transparency International’s<br />
Corruption Perceptions Index. In summary, Bolivia’s legal and<br />
political institutions are weak and this deficiency is a major<br />
deterrent to growth and achievement of high levels of income<br />
per capita.<br />
In the area of civil liberties, Bolivia’s overall 14th ranking<br />
places it in the lower half among Latin American countries. It<br />
ranked 9th in the <strong>Freedom</strong> House’s 2012 civil liberties measure,<br />
12th in <strong>Freedom</strong> of the Press, and 16th in the Reporters Without<br />
Borders’ Press <strong>Freedom</strong> Index. While freedom of expression, religion,<br />
and assembly are constitutionally guaranteed, enforcement<br />
is often questionable and protests have been known to<br />
turn violent and impede day-to-day life.<br />
www.freetheworld.com • www.fraserinstitute.org • Fraser Institute ©2012
180 • <strong>Economic</strong> <strong>Freedom</strong> of the <strong>World</strong>: 2012 Annual Report<br />
Brazil<br />
Changes across Time: Chain-linked Summary Rating (Ranking)<br />
10<br />
8<br />
6<br />
4<br />
2<br />
0<br />
Income and growth<br />
In 2010, Brazil’s per capita income was $11,210, placing it 9 th<br />
among 22 Latin American countries. From 2000 to 2010, real<br />
GDP grew at an annual rate of 3.67%, 12 th most rapid in Latin<br />
America.<br />
(17 th )<br />
4.46<br />
1990<br />
(21 st )<br />
4.72<br />
1995<br />
(19 th )<br />
5.93<br />
2000<br />
(18 th )<br />
6.27<br />
2005<br />
<strong>Economic</strong> institutions and analysis<br />
(17 th )<br />
6.42<br />
2010<br />
Brazil ranked 18 th in the region in the EFW index and 17 th in the<br />
Doing Business report. In contrast, Brazil’s Global Competitiveness<br />
ranking is strikingly high, 3 rd in the region. To a large degree, the<br />
GCR rating reflects the skill level of the workforce, development<br />
of financial markets, and availability of technology in Brazil.<br />
Brazil’s EFW summary rating rose from 4.46 in 1990 to 5.93 in<br />
2000 and to 6.42 in 2010. However, its ranking in the region has<br />
been relatively constant, remaining at 17 th in both 1990 and 2010.<br />
The only area in the EFW index where Brazil ranks in the<br />
top ten in the region is Area 2, Legal System and Property<br />
Rights, where it places 4th . However, judged by worldwide<br />
standards, Brazil’s legal structure is weak. Among the 144 countries<br />
in the EFW index, Brazil ranks 85th for Area 2. Its ranking<br />
among the Latin American countries is 15th in Areas 1 and 3,<br />
and 14th in Area 4.<br />
The Brazilian economy is plagued with excessive regulation.<br />
In Area 5, Regulation, it ranks next to last among Latin<br />
American economies and 140th among 144 countries worldwide.<br />
Consider the following. According to the Doing Business<br />
Fraser Institute ©2012 • www.fraserinstitute.org • www.freetheworld.com<br />
EFW Area Ratings (Rankings) in 2010<br />
10<br />
8<br />
6<br />
4<br />
2<br />
0<br />
(15 th )<br />
6.63<br />
Area 1<br />
(4 th )<br />
5.16<br />
Area 2<br />
(15 th )<br />
8.00 (14 th )<br />
7.13<br />
Area 3<br />
Area 4<br />
(21 st )<br />
4.91<br />
Area 5<br />
(18 th )<br />
6.37<br />
Summary<br />
indicators, it takes 2,600 hours for a Brazilian business to prepare<br />
and pay taxes, 1,500 hours more than the average for the<br />
other countries included in the EFW index. It takes 469 days<br />
to obtain a construction permit in Brazil, far greater than the<br />
46 days in Colombia, 155 days in Chile, and 188 days in Peru.<br />
Similarly, it takes 119 days to start a business in Brazil, compared<br />
to 7 days in Chile, Jamaica, and Uruguay and 8 days in Panama.<br />
Political institutions and civil liberty<br />
Brazil’s political system is relatively open and highly competitive.<br />
A diverse set of political parties is present and most<br />
observers believe that recent elections have been relatively<br />
fair. Various measures of the quality of political institutions<br />
rank Brazil in the upper middle among Latin American countries.<br />
Its ranking is 4th in Area 2 of the EFW index, 5th in <strong>Freedom</strong><br />
House’s Political Rights index, and 9th in the Polity IV measures<br />
of both democracy and constraints on the executive. It<br />
places 4th among the Latin American countries in Transparency<br />
International’s Corruption Perceptions Index.<br />
While civil liberties are generally protected, there are<br />
some problems in the freedom of the press area. Brazil ranks<br />
4th among Latin countries in <strong>Freedom</strong> House’s <strong>Freedom</strong> in the<br />
<strong>World</strong> Civil Liberties component, but only 12th in its <strong>Freedom</strong> of<br />
the Press ranking. This press freedom ranking is also consistent<br />
with Brazil’s 14th place ranking in the Reporters Without Borders’<br />
Press <strong>Freedom</strong> Index.
Chile<br />
Changes across Time: Chain-linked Summary Rating (Ranking)<br />
10<br />
8<br />
6<br />
4<br />
2<br />
0<br />
Income and growth<br />
In 2010, Chile’s per capita income was $15,779, 3 rd highest in<br />
Latin America. This high income level was coupled with a<br />
3.8% annual growth rate of per-capita real GDP from 2000<br />
to 2010.<br />
(1 st )<br />
6.78<br />
1990<br />
<strong>Economic</strong> institutions and analysis<br />
The economic institutions of Chile provide a standard for<br />
other Latin American countries to emulate. Among Latin<br />
American countries, Chile ranks 1 st in the EFW index, the<br />
Global Competitiveness Report, and the <strong>World</strong> Bank’s Doing<br />
Business report. This was not always the case. Chile ranked<br />
71 st among the 72 countries included in the EFW Index in<br />
1975, but has registered steady improvement through the<br />
years. By 1990, its ranking on the EFW index had risen to 27 th<br />
among the 113 countries rated worldwide. Since 2005, Chile<br />
has continually ranked 1 st in Latin America and 11 th or higher<br />
worldwide.<br />
(1 st )<br />
7.53<br />
1995<br />
(6 th )<br />
7.41<br />
2000<br />
(1 st )<br />
7.92<br />
2005<br />
(1 st )<br />
7.87<br />
2010<br />
Among Latin American countries, Chile ranks 1 st in Area 2,<br />
Legal System and Property Rights, and 4 th in Area 4, <strong>Freedom</strong><br />
to Trade Internationally, for which its worldwide ranking is<br />
also high, 10 th . Chile’s tariff rate is low, 6%, and uniform. The<br />
uniform tariff rate is particularly important because it sub-<br />
stantially reduces the incentive for businesses to engage in<br />
rent-seeking activities. Weak legal structures are a deficiency<br />
throughout Latin America. Thus, even though Chile ranks<br />
Institutions and <strong>Economic</strong>, Political, and Civil Liberty in Latin America • 181<br />
EFW Area Ratings (Rankings) in 2010<br />
10<br />
8<br />
6<br />
4<br />
2<br />
0<br />
(10 th )<br />
7.77<br />
Area 1<br />
(1 st )<br />
7.17<br />
Area 2<br />
(8 th )<br />
8.94 (4 th )<br />
8.20<br />
Area 3<br />
Area 4<br />
number one among Latin American countries in the Area 2,<br />
its 27 th place worldwide is less impressive.<br />
(5 th )<br />
7.10<br />
Area 5<br />
(1 st )<br />
7.84<br />
Summary<br />
While Chile’s rating in Area 5, Regulation places it 5 th in Latin<br />
America, its worldwide ranking is 64 th . A closer look at the busi-<br />
ness regulation components illustrates why. Though Chile’s 316<br />
hours required for a business to prepare and pay taxes is low<br />
by Latin American standards, it is less impressive when compared<br />
to higher-income countries such as Australia (109 hours),<br />
Sweden (122 hours), and Canada (131 hours).<br />
Political institutions and civil liberty<br />
The political institutions of Chile are now the strongest in Latin<br />
America. It ranks first in the region in each of the five political<br />
measures of this analysis. This is quite an achievement for a<br />
country that moved from an authoritarian political regime to<br />
democratic decision-making only two decades ago. The combination<br />
of economic freedom, democracy, constraint on the<br />
executive, and clean government has served Chile well. Since<br />
1990, Chile’s average annual growth rate of per-capita GDP,<br />
3.74%, has been one of the highest in the world.<br />
While Chile ranks first among Latin American countries in<br />
the <strong>Freedom</strong> House’s <strong>Freedom</strong> in the <strong>World</strong> Civil Liberties component,<br />
it ranks only 5th in <strong>Freedom</strong> House’s <strong>Freedom</strong> of the Press<br />
and 10th in the Reporters Without Borders’ Press <strong>Freedom</strong> Index.<br />
One political party heavily dominates the print media. Violence<br />
against journalists, though limited, still occurs.<br />
www.freetheworld.com • www.fraserinstitute.org • Fraser Institute ©2012
182 • <strong>Economic</strong> <strong>Freedom</strong> of the <strong>World</strong>: 2012 Annual Report<br />
Colombia<br />
Changes across Time: Chain-linked Summary Rating (Ranking)<br />
10<br />
8<br />
6<br />
4<br />
2<br />
0<br />
Income and growth<br />
In 2010, Colombia’s income per capita was $9,452, placing it<br />
11 th among the 22 Latin American countries. From 2000 to 2010,<br />
real GDP grew at an annual rate of 4.13%, 7 th most rapid in Latin<br />
America.<br />
(15 th )<br />
5.07<br />
1990<br />
(17 th )<br />
5.59<br />
1995<br />
(22 nd )<br />
5.51<br />
2000<br />
(21 st )<br />
5.84<br />
2005<br />
<strong>Economic</strong> institutions and analysis<br />
While the EFW summary rating, Doing Business report, and<br />
Global Competitiveness Report (GCR) measure different aspects<br />
of an economy, they are generally closely related. However, this<br />
is not the case for Colombia. The 2010 EFW summary rating<br />
places Colombia 15 th among the 22 Latin American countries,<br />
but it ranks 3 rd in the Doing Business index and 8 th in the GCR.<br />
Colombia has shown steady improvement over the past two<br />
decades. Colombia’s chain-linked summary rating rose from<br />
5.07 in 1990 to 5.59 in 1995 and to 6.31 in 2010.<br />
(19 th )<br />
6.31<br />
2010<br />
Colombia placed in the top ten in the region in only one<br />
area of the EFW index, Area 5, Regulation. Its weakest areas<br />
are in Area 1, Size of Government, and Area 4, <strong>Freedom</strong> to<br />
Trade Internationally: it ranks 19th in both. The top marginal<br />
income and payroll tax rate in Colombia is 47%, one of the<br />
highest in Latin America. The mean tariff rate in Colombia is<br />
12.5% and the capital market controls are among the most<br />
rigid in Latin America.<br />
Colombia’s performance in Area 3, Sound Money, and Area<br />
5, Regulation, is stronger, but still weak compared to other<br />
Latin American countries and the world. Ranking 12th in Area<br />
Fraser Institute ©2012 • www.fraserinstitute.org • www.freetheworld.com<br />
EFW Area Ratings (Rankings) in 2010<br />
10<br />
8<br />
6<br />
4<br />
2<br />
0<br />
(19 th )<br />
6.13<br />
Area 1<br />
(12 th )<br />
4.36<br />
Area 2<br />
(12 th )<br />
8.20<br />
Area 3<br />
(19 th )<br />
6.82<br />
Area 4<br />
(7 th )<br />
6.99<br />
Area 5<br />
(15 th )<br />
6.50<br />
Summary<br />
3, Colombia had single digit inflation in the most recent year,<br />
2.28%, and low variation in the inflation rate, 1.75. However,<br />
restrictions on owning foreign currency bank accounts<br />
decrease Colombia’s rating for Area 3. Colombia ranked 7th in<br />
the region in Area 5, its highest area ranking. It only takes 14<br />
days to start a business in Colombia, the fourth shortest time<br />
compared to Latin American countries. Yet, it takes 165 days to<br />
get electricity in Colombia, the longest time in Latin America.<br />
Political institutions and civil liberty<br />
The political institutions of Colombia place it in the middle<br />
group among Latin American countries. It ranks 12th in Area 2,<br />
Legal System and Property Rights of the EFW index, and 13th in <strong>Freedom</strong> House’s <strong>Freedom</strong> in the <strong>World</strong> political rights component.<br />
However, it ranks poorly in the Polity IV measure of<br />
democracy, 16th . Its rankings are higher in the Polity IV measure<br />
of constraints on the executive, 9th , and Transparency<br />
International’s measure of perceived corruption, 5th .<br />
Protection of civil liberties is a continuing problem.<br />
Colombia ranks 17th among the 22 countries in the region in<br />
<strong>Freedom</strong> House’s <strong>Freedom</strong> in the <strong>World</strong> civil liberties component<br />
and <strong>Freedom</strong> of the Press. Reporters Without Borders’ Press<br />
<strong>Freedom</strong> Index ranks Colombia’s press freedom 21st among 22<br />
Latin American countries. While the Colombian constitution<br />
guarantees freedom of expression, crime, drug trafficking, and<br />
political corruption often undermine civil liberties and make it<br />
difficult for journalists to operate effectively.
Costa Rica<br />
Changes across Time: Chain-linked Summary Rating (Ranking)<br />
10<br />
8<br />
6<br />
4<br />
2<br />
0<br />
Income and growth<br />
In 2010, Costa Rica’s income per capita was $11,568, 8 th highest<br />
in the region. During the period between 2000 and 2010, real<br />
GDP grew at an annual rate of 4.06%, 9 th most rapid in Latin<br />
America.<br />
(2 nd )<br />
6.64<br />
1990<br />
(6 th )<br />
6.97<br />
1995<br />
(5 th )<br />
7.51<br />
2000<br />
(2 nd )<br />
7.66<br />
2005<br />
<strong>Economic</strong> institutions and analysis<br />
(3 rd )<br />
7.44<br />
2010<br />
Among the 22 countries in the region, Costa Rica ranked 4 th<br />
in the EFW index and 5 th in the Global Competitiveness Report.<br />
However, its ranking is only 16 th in the <strong>World</strong> Bank’s Doing<br />
Business report. This suggests that excessive regulation is a<br />
problem in Costa Rica. During the past two decades, Costa Rica<br />
has consistently registered an EFW summary rating well above<br />
both the Latin American and worldwide averages.<br />
Costa Rica has a relatively sound legal system and only<br />
modest trade restrictions. Among Latin American countries, it<br />
ranks 2nd in Area 2 (54th worldwide) and 5th in Area 4 (16th worldwide).<br />
Rule of law is strong and military intervention in legal<br />
affairs absent. The mean tariff rate in Costa Rica is 5.4%.<br />
In Area 5, Regulation, Costa Rica ranked 13th in Latin America<br />
and 89th worldwide. It takes 60 days to start a business in Costa<br />
Rica, a lengthy time compared to some of its close neighbors.<br />
By way of comparison, it only takes 7 days in Chile, Jamaica,<br />
and Uruguay, and 8 days in Panama. Furthermore, it takes 246<br />
hours for a business to prepare and pay taxes in Costa Rica,<br />
twice the required time in Australia (109 hours) and Canada<br />
Institutions and <strong>Economic</strong>, Political, and Civil Liberty in Latin America • 183<br />
EFW Area Ratings (Rankings) in 2010<br />
10<br />
8<br />
6<br />
4<br />
2<br />
0<br />
(9 th )<br />
7.85<br />
Area 1<br />
(2 nd )<br />
6.11<br />
Area 2<br />
(16 th )<br />
8.00<br />
Area 3<br />
(5 th )<br />
8.05<br />
Area 4<br />
(13 th )<br />
6.71<br />
Area 5<br />
(4 th )<br />
7.34<br />
Summary<br />
(131 hours). Costa Rica’s ranking for Area 1, Size of Government,<br />
placed it 9th among Latin American countries. Judged by Latin<br />
American standards, government consumption was large and<br />
the top marginal tax rate relatively high.<br />
Costa Rica’s area of greatest weakness is Area 3, Sound<br />
Money, where it ranks 16th in the region and 85th worldwide. This<br />
low rating for Sound Money is primarily the result of restrictions<br />
on ownership of foreign currency bank accounts.<br />
Political institutions and civil liberty<br />
Costa Rica is an electoral democracy and its elections are<br />
generally considered to be free and fair. Its rating in Area 2,<br />
Legal System and Property Rights in the EFW index was the<br />
2nd highest among the 22 countries in the region. It was the<br />
highest ranked Latin American country in <strong>Freedom</strong> House’s<br />
<strong>Freedom</strong> in the <strong>World</strong> political rights component, and the Polity<br />
IV measures of both democracy and constraints on the executive.<br />
It ranked 3rd in the region in Transparency International’s<br />
Corruption Perceptions Index, even though all but one of the<br />
country’s presidents since 1990 have been accused of corruption<br />
after their departure from office. Costa Rica’s record<br />
for civil liberties protection and freedom of the press is outstanding.<br />
It ranks number one in Latin America in each of the<br />
three civil liberty measures included in this analysis. Clearly,<br />
the political and legal institutions of Costa Rica are among the<br />
strongest in Latin America.<br />
www.freetheworld.com • www.fraserinstitute.org • Fraser Institute ©2012
184 • <strong>Economic</strong> <strong>Freedom</strong> of the <strong>World</strong>: 2012 Annual Report<br />
Dominican Republic<br />
Changes across Time: Chain-linked Summary Rating (Ranking)<br />
10<br />
8<br />
6<br />
4<br />
2<br />
0<br />
(19 th )<br />
4.34<br />
1990<br />
(16 th )<br />
5.99<br />
1995<br />
Income and growth<br />
In 2010, the Dominican Republic’s income per capita was $9,350,<br />
placing it 12 th among the 22 Latin American countries. From<br />
2000 to 2010, real GDP grew at an annual rate of 5.38%, 4 th most<br />
rapid in Latin America.<br />
<strong>Economic</strong> institutions and analysis<br />
The economic institutions of the Dominican Republic are<br />
generally in the lower middle group among Latin coun-<br />
tries. Its 2010 summary EFW rating placed it 10 th among the<br />
22 countries in the region. Its 11 th place ranking in the Doing<br />
Business report was similar, but its 17 th rank in the Global<br />
Competitiveness Report was a little lower. The EFW summary<br />
rating of the Dominican Republic has improved during the<br />
past two decades, rising from 4.34 in 1990 to 6.98 in 2010. In<br />
turn, its ranking among Latin American countries rose from<br />
19 th in 1990 to 9 th in 2010.<br />
(12 th )<br />
6.76<br />
2000<br />
(14 th )<br />
6.53<br />
2005<br />
(9 th )<br />
6.98<br />
2010<br />
The Dominican Republic’s highest EFW ranking is 5 th , in<br />
both Area 1, Size of Government, and Area 3, Sound Money.<br />
Government consumption as a share of the total is low, 8%, and<br />
the top marginal income tax rate moderate, 25% without the<br />
payroll tax, and 33% when the payroll tax is included.<br />
The Dominican Republic’s rankings in the other three areas<br />
range from 9 th to 16 th . It ranks mid-range among Latin American<br />
countries for most components, including Impartial courts<br />
(13 th ), Protection of property rights (10 th ), Hiring regulations and<br />
minimum wage (11 th ), and Hiring and firing regulations (9 th ). On<br />
the positive side, it only takes 8 days to obtain the necessary<br />
Fraser Institute ©2012 • www.fraserinstitute.org • www.freetheworld.com<br />
EFW Area Ratings (Rankings) in 2010<br />
10<br />
8<br />
6<br />
4<br />
2<br />
0<br />
(5 th )<br />
8.18<br />
Area 1<br />
(15 th )<br />
4.22<br />
Area 2<br />
(5 th )<br />
9.24<br />
Area 3<br />
(9 th )<br />
7.52<br />
Area 4<br />
(16 th )<br />
6.29<br />
Area 5<br />
permission for exporting, the shortest in Latin America. The 19<br />
days required to start a business ranks 9 th in Latin America.<br />
Political institutions and civil liberty<br />
(10 th )<br />
7.09<br />
Summary<br />
The legal and political institutions of the Dominican Republic<br />
also place it in the middle group in the region. Its EFW rank-<br />
ing for Area 2, Legal System and Property Rights is 15 th among<br />
the 22 countries in the region. <strong>Freedom</strong> House ranks it 5 th in its<br />
political liberties index, while the Polity IV Project places it 9 th in<br />
its measures of both democracy and constraints on the executive.<br />
Corruption is a continuing problem in the Dominican<br />
Republic: it ranked 16th among Latin American countries<br />
and 129th among 182 countries worldwide in Transparency<br />
International’s Corruption Perceptions Index. Political leaders,<br />
judges, and the police have all been involved in various types<br />
of corrupt behavior. This reduces the confidence of the general<br />
populace in the legal and political institutions of the country.<br />
The Dominican Republic ranks in the upper middle group<br />
among Latin American countries in measures of civil liberties<br />
and freedom of the press. It places 4th in the region in <strong>Freedom</strong><br />
House’s <strong>Freedom</strong> in the <strong>World</strong> Civil Liberties component, but its<br />
press freedom rankings in the <strong>Freedom</strong> House and Reporters<br />
Without Borders publications were 7th and 12th , respectively. The<br />
constitution of the Dominican Republic guarantees freedom of<br />
speech, press, religion, and association. Moreover, the country<br />
has an abundance of newspaper publications, and there are<br />
no legal restrictions on access to the Internet, though it is not<br />
widely available except in large, urban areas.
Ecuador<br />
Changes across Time: Chain-linked Summary Rating (Ranking)<br />
10<br />
8<br />
6<br />
4<br />
2<br />
0<br />
(14 th )<br />
5.35<br />
1990<br />
(15 th )<br />
6.15<br />
1995<br />
Income and growth<br />
In 2010, Ecuador’s income per capita was $8,027, 13 th among Latin<br />
American countries. Its growth rate during the past decade has<br />
been more impressive. From 2000 to 2010, real GDP grew at an<br />
annual rate of 4.46%, the 5 th most rapid in Latin America.<br />
<strong>Economic</strong> institutions and analysis<br />
The economic institutions of Ecuador are poor, even by Latin<br />
American standards. It ranks 20 th among 22 Latin American coun-<br />
tries in the EFW index and 19 th in the <strong>World</strong> Bank’s Doing Business<br />
report. Its Global Competitiveness ranking is slightly higher, 15 th .<br />
Taken together, the measures of economic institutions indicate<br />
that the economy of Ecuador is highly regulated and politically<br />
directed. Ecuador’s EFW summary rating has fluctuated between<br />
5.35 and 6.15 during the past two decades. However, its ranking<br />
in Latin America has slipped from 14 th in 1990 to 21 st in 2010.<br />
Ecuador ranks in the bottom group in all five areas of<br />
the EFW index. It ranks 20 th in the region in Area 1, Size of<br />
Government. Government consumption spending makes<br />
up 15% of the total. Transfers and subsidies are small, only<br />
2% of GDP. However, Ecuador’s top marginal tax rate is high,<br />
35% without the payroll tax and 47% when the payroll tax is<br />
included. Its ranking in Area 3, Sound Money is 21 st . Restrictions<br />
on the ownership of foreign currency bank accounts contribute<br />
to its low rating in this area.<br />
(21 st )<br />
5.82<br />
2000<br />
(20 th )<br />
5.85<br />
2005<br />
(21 st )<br />
5.70<br />
2010<br />
Its rankings in Area 2, Legal System and Property Rights<br />
(17 th ), Area 4, <strong>Freedom</strong> to Trade Internationally (18 th ), and Area<br />
5, Regulation (17 th ) are also low. As is so often the case, coun-<br />
tries with low regulatory ratings also have weak legal sys-<br />
tems. Ecuador ranked 19 th in the region in the Impartial courts<br />
Institutions and <strong>Economic</strong>, Political, and Civil Liberty in Latin America • 185<br />
EFW Area Ratings (Rankings) in 2010<br />
10<br />
8<br />
6<br />
4<br />
2<br />
0<br />
(20 th )<br />
5.63<br />
Area 1<br />
(17 th )<br />
3.97<br />
Area 2<br />
(21 st )<br />
6.38<br />
Area 3<br />
(18 th )<br />
6.88<br />
Area 4<br />
(17 th )<br />
6.16<br />
Area 5<br />
(20 th )<br />
5.80<br />
Summary<br />
component (2B), 17 th in the Protection of property rights com-<br />
ponent (2C), and 19 th in the Hiring and firing regulation com-<br />
ponent (5Bii). In Ecuador, it takes 654 hours for a business to<br />
prepare and pay taxes, more than twice the figure for Chile<br />
(316 hours) and Peru (309 hours). Moreover, it takes 5.3 years to<br />
resolve insolvency in Ecuador, the longest time among Latin<br />
American countries except for Haiti.<br />
Political institutions and civil liberty<br />
While Ecuador is an electoral democracy, its political institutions<br />
are characterized by instability, arbitrary actions, and<br />
widespread corruption. The eight changes in executive power<br />
since 1996 are indicative of the country’s political instability.<br />
Ecuador’s ranking in Area 2, Legal System and Property Rights<br />
of the FEW index was 17th in the region. Ecuador ranked 13th in <strong>Freedom</strong> House’s political rights index, 20th in the Polity IV<br />
measure of democracy, and 21st for constraints on the executive.<br />
The president’s authority to dissolve the legislature and call for<br />
new assembly elections once during his term contributes to<br />
Ecuador’s low rating for constraints on the executive. Given<br />
the presence of extensive regulation and arbitrary power, it is<br />
not surprising that corruption is widespread. Ecuador ranked<br />
14th among the 22 Latin American countries in Transparency<br />
International’s Corruption Perceptions Index. While Ecuador<br />
ranks 9th in <strong>Freedom</strong> House’s Civil Liberties component, its ranking<br />
in <strong>Freedom</strong> of the Press is only 16th among Latin American<br />
countries. Even though freedom of expression is generally<br />
respected, there has been a recent increase in violent attacks<br />
against journalists, resulting in a ranking of 15th in the Reporters<br />
Without Borders’ Press <strong>Freedom</strong> Index.<br />
www.freetheworld.com • www.fraserinstitute.org • Fraser Institute ©2012
186 • <strong>Economic</strong> <strong>Freedom</strong> of the <strong>World</strong>: 2012 Annual Report<br />
El Salvador<br />
Changes across Time: Chain-linked Summary Rating (Ranking)<br />
10<br />
8<br />
6<br />
4<br />
2<br />
0<br />
(16 th )<br />
4.69<br />
1990<br />
(2 nd )<br />
7.47<br />
1995<br />
Income and growth<br />
(1 st )<br />
7.69<br />
2000<br />
(2 nd )<br />
7.66<br />
2005<br />
In 2010, El Salvador’s income per capita was $6,667, 15 th among<br />
the Latin American countries. During the period from 2000 to<br />
2010, real GDP per capita grew at an annual rate of 1.93%, plac-<br />
ing it 20 th among the countries in the region.<br />
<strong>Economic</strong> institutions and analysis<br />
(5 th )<br />
7.41<br />
2010<br />
El Salvador’s summary EFW rating is the 9 th highest among<br />
Latin American countries. However, its ranking is substantially<br />
lower for the other measures of economic institutions. It ranks<br />
12 th among Latin American countries in the Doing Business<br />
index and 13 th in the Global Competitiveness Report. El Salvador<br />
substantially increased its EFW summary rating from 4.69 in<br />
1990 to 7.66 in 2005, increasing its ranking in the region from<br />
16th in 1990 to 2nd in 2005. By 2010, however, its summary rating<br />
had fallen to 7.41.<br />
The government of El Salvador is small. El Salvador’s rating<br />
for Area 1, Size of Government was the 2nd highest in Latin<br />
America and the 6th highest worldwide. Government consumption<br />
was only 10.5% of total consumption and transfers and subsidies<br />
were only 3.6% of GDP. El Salvador also ranks high, 4th in<br />
the region, in Area 3, Sound Money of the EFW index. It has<br />
adopted the US dollar as its official currency and citizens are<br />
free to maintain foreign currency bank accounts if they prefer.<br />
In recent years, the inflation rate has been low and relatively<br />
constant.<br />
Fraser Institute ©2012 • www.fraserinstitute.org • www.freetheworld.com<br />
EFW Area Ratings (Rankings) in 2010<br />
10<br />
8<br />
6<br />
4<br />
2<br />
0<br />
(2 nd )<br />
8.46<br />
Area 1<br />
(19 th )<br />
3.84<br />
Area 2<br />
(4 th )<br />
9.25<br />
Area 3<br />
(11 th )<br />
7.46<br />
Area 4<br />
(8 th )<br />
6.97<br />
Area 5<br />
(9 th )<br />
7.20<br />
Summary<br />
El Salvador has major weaknesses in legal structure and regulation.<br />
In Area 2, Legal System and Property Rights, it ranked 19th in the region and 129th among 144 countries worldwide. Ratings<br />
were particularly low for the following components: Judicial<br />
independence (2A), Impartiality of the courts (2B), Integrity of<br />
the legal system (2E), and Legal enforcement of contracts (2F).<br />
In Area 5, Regulation, El Salvador ranked 8th in the region and<br />
69th worldwide. High costs of employee dismissal and military<br />
conscription contribute to the low rating in this area.<br />
Political institutions and civil liberty<br />
The political institutions of El Salvador rank in the upper middle<br />
among Latin American countries. It ranks 5th in the political<br />
liberties component of <strong>Freedom</strong> House’s <strong>Freedom</strong> in the <strong>World</strong><br />
and 9th in the Polity IV index of both democracy and constraints<br />
on the executive. Transparency International also places it 5th among Latin American countries in its Corruption Perceptions<br />
Index.<br />
In the civil liberties area, El Salvador also places in the upper<br />
middle group of Latin Countries. <strong>Freedom</strong> House ranks it 9th in civil liberties protection and 8th in <strong>Freedom</strong> of the Press. Its<br />
4th-place ranking in Reporters without Borders’ Press <strong>Freedom</strong><br />
Index is significantly higher. This indicates that, while reporters<br />
seldom face violence, there are still limitations on the media.<br />
While freedom of the press is constitutionally guaranteed,<br />
media ownership is highly concentrated.
Guatemala<br />
Changes across Time: Chain-linked Summary Rating (Ranking)<br />
10<br />
8<br />
6<br />
4<br />
2<br />
0<br />
(7 th )<br />
5.62<br />
1990<br />
Income and growth<br />
In 2010, Guatemala’s income per capita was $4,784, 18 th among<br />
Latin American countries. From 2000 to 2010, real GDP per cap-<br />
ita grew at an annual rate of 3.37%, placing it 16 th among Latin<br />
American countries.<br />
(7 th )<br />
6.96<br />
1995<br />
(16 th )<br />
6.57<br />
2000<br />
(7 th )<br />
7.15<br />
2005<br />
<strong>Economic</strong> institutions and analysis<br />
Guatemala’s EFW summary rating in 2010 was the 8 th high-<br />
est among Latin American countries. Moreover, its ranking<br />
was only slightly lower for the other economic institutional<br />
measures. Guatemala’s ranking was 9 th in Latin America in<br />
both the <strong>World</strong> Bank’s Doing Business report and the Global<br />
Competitiveness Report. During the last decade, Guatemala<br />
has made significant moves toward economic liberalization.<br />
Its summary EFW rating was 6.57 in 2000 but by 2010 the rat-<br />
ing had climbed to 7.14, increasing its ranking among Latin<br />
American countries from 16 th in 2000 to 7 th in 2010.<br />
(7 th )<br />
7.14<br />
2010<br />
As is often the case in Latin America, Guatemala’s weakest<br />
areas in the EFW index are Area 2, Legal System and Property<br />
Rights, and Area 5, Regulation, where it ranks 18 th (126 th world-<br />
wide) and 15 th (102 nd worldwide), respectively. A closer look<br />
at a few components shows areas in need of improvement.<br />
Guatemala ranks 16 th in Latin America in Impartial courts (2B),<br />
15 th in Protection of property rights (2C), and 11 th in Hiring regu-<br />
lations and minimum wage (5Bi). It takes 37 days to start a busi-<br />
ness in Guatemala, the 14 th longest in Latin America. Guatemala’s<br />
most striking barrier to conducting business is the difficulty in<br />
enforcing contracts. According to the <strong>World</strong> Bank, it takes 1,459<br />
days or four years to obtain a judicial judgment for the collec-<br />
tion of an undisputed debt, the longest in Latin America.<br />
Guatemala ranked 1 st in Latin American and 33 rd world-<br />
wide in Area 3, Sound Money, its best area ranking. In the most<br />
Institutions and <strong>Economic</strong>, Political, and Civil Liberty in Latin America • 187<br />
EFW Area Ratings (Rankings) in 2010<br />
10<br />
8<br />
6<br />
4<br />
2<br />
0<br />
(8 th )<br />
8.00<br />
Area 1<br />
recent year, Guatemala’s inflation rate was 3.86%. Guatemala<br />
also has strength in Area 4, <strong>Freedom</strong> to Trade Internationally,<br />
where it ranks 2 nd in the region and 8 th worldwide. The high<br />
ranking in this area is a result of a low mean tariff rate, 5.60%,<br />
and low international trade tax revenues as a share of the trade<br />
sector, 1.56%.<br />
(18 th )<br />
3.93<br />
Area 2<br />
(1 st )<br />
9.37 (2 nd )<br />
8.25<br />
Area 3<br />
Area 4<br />
(15 th )<br />
6.49<br />
Area 5<br />
Political institutions and civil liberty<br />
(8 th )<br />
7.21<br />
Summary<br />
The political institutions of Guatemala place it in the middle<br />
group among Latin American countries. Its rating for EFW Area<br />
2, Legal System and Property Rights, place it 18 th among the<br />
22 Latin countries. It ranks 13 th in <strong>Freedom</strong> House’s <strong>Freedom</strong> in<br />
the <strong>World</strong> political rights component, but 9 th in the region in<br />
the Polity IV index of democracy and constraints on the executive.<br />
Transparency International places it 14th in its Corruption<br />
Perceptions Index.<br />
Guatemala’s civil liberties and press freedom are among<br />
the lowest in Latin America. Guatemala ranks 17th in <strong>Freedom</strong><br />
House’s Civil Liberties measure and 18th in <strong>Freedom</strong> of the Press.<br />
It ranks 13th in the region in Reporters Without Borders’ Press<br />
<strong>Freedom</strong> Index. Even though the constitution guarantees freedom<br />
of expression and speech, those who criticize the government<br />
or condemn past human rights violations have been<br />
known to face persecution. Both journalists and scholars have<br />
received death threats and faced violent attacks for raising<br />
questions about government actions. Guatemala has recently<br />
enacted measures such as the 2009 Law for Free Access of<br />
Public Information to increase the transparency of government<br />
operations, which was also served by a decision in 2010<br />
of the Constitutional Court that made information on the beneficiaries<br />
of Guatemala’s conditional cash-transfer program, Mi<br />
Familia Progresa, publically available.<br />
www.freetheworld.com • www.fraserinstitute.org • Fraser Institute ©2012
188 • <strong>Economic</strong> <strong>Freedom</strong> of the <strong>World</strong>: 2012 Annual Report<br />
Guyana<br />
Changes across Time: Chain-linked Summary Rating (Ranking)<br />
10<br />
8<br />
6<br />
4<br />
2<br />
0<br />
N.A.<br />
1990<br />
Income and growth<br />
Guyana is one of the poorest countries in Latin America. In 2010,<br />
its per-capita GDP was $3,431, 20 th among the 22 Latin American<br />
countries. Only Nicaragua and Haiti had a lower income level.<br />
From 2000 to 2010, real per-capita GDP grew at an annual rate<br />
of 2.1%, 19 th in the region.<br />
<strong>Economic</strong> institutions and analysis<br />
The economic institutions of Guyana are among the weak-<br />
est in Latin America. Its summary economic freedom rating<br />
is 19 th among the 22 Latin American countries. Its rankings in<br />
Doing Business and the Global Competitiveness Report are only<br />
incrementally higher, 14 th in the former and 18 th in the latter.<br />
Moreover, its EFW summary rating has changed little during<br />
the past decade.<br />
(20 th )<br />
5.20<br />
1995<br />
(13 th )<br />
6.72<br />
2000<br />
(16 th )<br />
6.36<br />
2005<br />
Guyana is a “big government” economy. It ranks last in the<br />
region and 136 th among the 144 countries worldwide in Area 1,<br />
Size of Government in the EFW index. Government consump-<br />
tion makes up 15% of total consumption. Government enter-<br />
prises dominate the economy and government investment<br />
sums to more than half of total investment, 54%. By Latin<br />
American standards, the top marginal income tax rate, 41%<br />
when the payroll tax is included, is high.<br />
(14 th )<br />
6.75<br />
2010<br />
Among Latin countries, Guyana ranks 11 th in Area 2, Legal<br />
System and Property Rights, 16 th in Area 4, <strong>Freedom</strong> to Trade<br />
Internationally, and 19 th in Area 3, Sound Money. Weaknesses<br />
in the independence of the judiciary, impartiality of the courts,<br />
and integrity of the legal system contribute to Guyana’s low<br />
rating in Area 2. Guyana’s 11% mean tariff rate is high by Latin<br />
Fraser Institute ©2012 • www.fraserinstitute.org • www.freetheworld.com<br />
EFW Area Ratings (Rankings) in 2010<br />
10<br />
8<br />
6<br />
4<br />
2<br />
0<br />
(22 nd )<br />
4.28<br />
Area 1<br />
(11th)<br />
4.44<br />
Area 2<br />
(19 th )<br />
7.96 (16 th )<br />
7.07<br />
Area 3<br />
Area 4<br />
(3 rd )<br />
7.46<br />
Area 5<br />
(19 th )<br />
6.24<br />
Summary<br />
American standards. Considering the usual correlation in Latin<br />
America between Areas 2 and 5, Guyana’s high regulatory ranking<br />
(3rd in the region and 47th worldwide) is surprising. Military<br />
conscription is absent and other regulation of the labor market<br />
is low. However, business regulations are somewhat less<br />
impressive. It takes 26 days to start a business, placing it 10th in<br />
the region for this component.<br />
Political institutions and civil liberty<br />
Guyana’s legal and political institutions are characterized by<br />
judicial uncertainty and favoritism, weak protection of personal<br />
liberty, and political corruption. While Guyana places 11th in the<br />
region in the Area 2 of the EFW index and 5th in <strong>Freedom</strong> House’s<br />
political rights measure, its ranking is 19th in the Polity IV measures<br />
of democracy and constraint on the executive and 18th in<br />
the Corruption Perceptions Index of Transparency International.<br />
The civil liberties ratings of Guyana are marginally better.<br />
<strong>Freedom</strong> House places it 9th in the region in its civil liberties<br />
index and 6th in <strong>Freedom</strong> of the Press. Guyana‘s press freedom<br />
ranking by Reporters Without Borders is 8th . Even though freedom<br />
of expression is constitutionally guaranteed, opposition<br />
party leaders often complain about a lack of access to stateowned<br />
media, which operates the country’s only radio station.<br />
Furthermore, Guyana serves the drug trafficking community<br />
as a transshipment point for cocaine between South America<br />
and North America and Europe. According to <strong>Freedom</strong> House,<br />
drug revenues fuel the informal economy, and provide the<br />
raw material for corruption that reaches to the highest levels<br />
of government.
Haiti<br />
Changes across Time: Chain-linked Summary Rating (Ranking)<br />
10<br />
8<br />
6<br />
4<br />
2<br />
0<br />
(8 th )<br />
5.61<br />
1990<br />
Income and growth<br />
Haiti is the poorest country in Latin America and its growth<br />
rate is anemic. In 2010, Haiti’s income per capita was $1,110, sub-<br />
stantially lower than any other country in Latin America. From<br />
2000 to 2010, real GDP grew at an annual rate of 0.23%, last in<br />
the region.<br />
(18 th )<br />
5.59<br />
1995<br />
(11 th )<br />
6.89<br />
2000<br />
<strong>Economic</strong> institutions and analysis<br />
While Haiti’s summary rating in the EFW index places it 16 th in<br />
Latin America, its regional ranking is 21 st in the <strong>World</strong> Bank’s<br />
Doing Business report and 22 nd in the Global Competitiveness<br />
Report. Its EFW summary rating is based on incomplete data.<br />
The Doing Business and GCR data suggest that, if the EFW fig-<br />
ures for Haiti were more complete, it is highly likely that its rat-<br />
ing and ranking would decline.<br />
(13 th )<br />
6.77<br />
2005<br />
(13 th )<br />
6.83<br />
2010<br />
Haiti ranked 1 st among Latin American countries in the EFW<br />
index for Area 1, Size of Government. Government consump-<br />
tion as a share of the total, 10%, and other indicators of size of<br />
government push Haiti’s rating up in this area. But, this does<br />
not mean that the government is focusing on basic functions<br />
such as protection of people and their property. Clearly, failure<br />
in this vitally important area is a major deficiency of Haiti. In the<br />
EFW Area 2, Legal System and Property Rights, Haiti ranks last<br />
among the 22 Latin American countries and last among the 144<br />
countries worldwide.<br />
Haiti ranks 12th in the region in Area 5, Regulation. However,<br />
this ranking is misleading. It is based on incomplete data and<br />
relatively high ratings for labor-market regulation. Business<br />
regulations, however, are quite restrictive. It takes 105 days<br />
to start a business in Haiti, the third longest in Latin America.<br />
Furthermore, it takes 1,129 days to obtain a construction permit<br />
in Haiti, the longest in Latin America and more than four<br />
times the number of days of any other Latin American country.<br />
Institutions and <strong>Economic</strong>, Political, and Civil Liberty in Latin America • 189<br />
EFW Area Ratings (Rankings) in 2010<br />
10<br />
8<br />
6<br />
4<br />
2<br />
0<br />
(1 st )<br />
8.48<br />
Area 1<br />
(22 nd )<br />
2.12<br />
Area 2<br />
(14 th )<br />
8.03 (13 th )<br />
7.17<br />
Area 3<br />
Area 4<br />
(12 th )<br />
6.72<br />
Area 5<br />
(16 th )<br />
6.50<br />
Summary<br />
Regulations also restrict trade. It takes 31 days to clear customs<br />
for imports and 33 days for exports, the second longest time<br />
among Latin American countries.<br />
Political institutions and civil liberty<br />
While Haiti has had several elections in recent decades, they<br />
have been characterized by intimidation, violence, and corruption.<br />
The history of the country is one of authoritarian government<br />
and political corruption. In the political rights area,<br />
<strong>Freedom</strong> House places it in a tie with Honduras for 19th place<br />
among the 22 Latin countries. Only Nicaragua and Venezuela<br />
earned lower ratings. In the Polity IV measure of democracy,<br />
Haiti tied with Ecuador for 20th . Only Venezuela had a lower<br />
rating. Moreover, corruption is rampant. In 2011, Transparency<br />
International’s Corruption Perceptions Index ranked Haiti 175th among the 182 countries worldwide. Even Venezuela had a<br />
higher rating in the region.<br />
In the civil liberties area, Haiti ranks 21st in <strong>Freedom</strong> House’s<br />
<strong>Freedom</strong> in the <strong>World</strong> civil liberties component and 14th in<br />
<strong>Freedom</strong> of the Press among Latin countries. Its ranking in the<br />
Reporters Without Borders’ Press <strong>Freedom</strong> Index is 7th , reflecting<br />
that journalists seldom face violence or death in Haiti.<br />
However, corruption and unreliable police protection undermine<br />
security of the right to assemble and freedom of speech.<br />
Additionally, the high level of corruption persuades many press<br />
outlets to self-censor, and violence against women and children<br />
is extremely prevalent.<br />
Clearly, a corrupt government that tramples on political<br />
and civil rights and fails to protect property rights and provide<br />
for the personal safety of citizens is a huge problem. These<br />
weaknesses undermine economic progress. Until improvement<br />
is made in these areas, Haiti will remain one of the poorest<br />
countries in the world.<br />
www.freetheworld.com • www.fraserinstitute.org • Fraser Institute ©2012
190 • <strong>Economic</strong> <strong>Freedom</strong> of the <strong>World</strong>: 2012 Annual Report<br />
Honduras<br />
Changes across Time: Chain-linked Summary Rating (Ranking)<br />
10<br />
8<br />
6<br />
4<br />
2<br />
0<br />
(12 th )<br />
5.45<br />
1990<br />
(14 th )<br />
6.26<br />
1995<br />
Income and growth<br />
In 2010, Honduras’ income per capita was $3,922, 19 th among<br />
the 22 Latin American countries. Its growth rate during the past<br />
decade provides some justification for optimism: from 2000 to<br />
2010, the annual growth rate of real GDP per capita was 4.24%,<br />
the 6 th most rapid in Latin America.<br />
<strong>Economic</strong> institutions and analysis<br />
Honduras ranks 6 th among Latin American countries in the<br />
EFW index but its ranking is significantly lower for other eco-<br />
nomic indicators. Among Latin American countries, its rank-<br />
ing is 18 th in the Doing Business report and 12 th in the Global<br />
Competitiveness Report. Its summary rating in the EFW has<br />
shown some improvement, rising from 5.45 in 1990 to 6.68 in<br />
2000 and 7.03 in 2010.<br />
(15 th )<br />
6.68<br />
2000<br />
(11 th )<br />
6.86<br />
2005<br />
The ratings of Honduras are relatively robust in three areas<br />
of the EFW index: Area 1, Size of Government, Area 3, Sound<br />
Money, and Area 4, <strong>Freedom</strong> to Trade Internationally. Honduras<br />
ranks in the top five in the region in both Size of Government,<br />
4 th , and Sound Money, 2 nd . Transfers and subsidies account for<br />
only 0.30% of GDP, the lowest in Latin America. In recent years,<br />
the rate of inflation has been both modest and relatively stable.<br />
In Area 4, Honduras ranks 8 th in the region and 47 th worldwide.<br />
Its tariffs are low. The mean tariff rate is 5.50% and trade tax<br />
revenues are only 0.92% of the trade sector.<br />
(8 th )<br />
7.03<br />
2010<br />
The EFW area ratings highlight two major economic institu-<br />
tional weaknesses of Honduras: an unsound legal system and<br />
excessive regulation. Honduras’s rating for Area 2, Legal System<br />
and Property Rights gave it a rank of 14 th in the region and 116 th<br />
among 144 countries worldwide. Its rating in Area 5, Regulation<br />
places it 10 th in the region and 85 th worldwide. As an example,<br />
it takes 920 days to settle a contractual issue in Honduras, the<br />
4 th longest in Latin America, shorter only than in Guatemala,<br />
Colombia, and Trinidad & Tobago. Honduras ranked last among<br />
Latin American countries for sub-component 5Bi, Hiring regulations<br />
and minimum wage.<br />
Fraser Institute ©2012 • www.fraserinstitute.org • www.freetheworld.com<br />
EFW Area Ratings (Rankings) in 2010<br />
10<br />
8<br />
6<br />
4<br />
2<br />
0<br />
(4 th )<br />
8.21<br />
Area 1<br />
(14 th )<br />
4.29<br />
Area 2<br />
(2 nd )<br />
9.35<br />
Area 3<br />
(8 th )<br />
7.60 (10 th )<br />
6.66<br />
Area 4<br />
Area 5<br />
(6 th )<br />
7.24<br />
Summary<br />
Political institutions and civil liberty<br />
Honduras ranks near the bottom of the region in all measures<br />
of political and civil freedoms. Its 14th ranking in the EFW index<br />
for Area 2, Legal System and Property Rights, is reinforced by<br />
measures of its political institutions. <strong>Freedom</strong> House ranks<br />
Honduras 19th in its <strong>Freedom</strong> in the <strong>World</strong> political liberties component,<br />
while the Polity IV Project places it 16th in its measure of<br />
democracy and 19th in its constraints on the executive measure.<br />
Transparency International places Honduras 16th in the region<br />
and 129th among the 182 countries included in its Corruption<br />
Perceptions Index.<br />
Its civil liberties performance is equally poor. <strong>Freedom</strong><br />
House places Honduras 17th in its <strong>Freedom</strong> in the <strong>World</strong> civil liberties<br />
component and 20th in <strong>Freedom</strong> of the Press among the countries<br />
in the region. The Reporters Without Borders’ Press <strong>Freedom</strong><br />
Index also places Honduras 20th in the region. Honduras can be a<br />
very dangerous location for journalists, and media self-censorship<br />
is prevalent. According to <strong>Freedom</strong> House, “since the 2009<br />
coup, authorities have systematically violated the constitution’s<br />
press freedom guarantees.”<br />
Given its institutional deficiencies, Honduras is considering<br />
a unique method of improving institutional quality: contracting<br />
out special enterprise zones to developers pledging<br />
to establish a legal and regulatory infrastructure to promote<br />
economic freedom and entrepreneurial activity. The idea is to<br />
set aside special enterprise zones patterned after Hong Kong<br />
that will establish transparent and predictable rules administered<br />
impartially to encourage investment, employment,<br />
and economic growth. Economists Paul Romer and Brandon<br />
Fuller have been at the forefront of those advocating this path<br />
of institutional development. Several investment groups are<br />
engaged with the government of Honduras in an effort to<br />
work out such a development plan. Both judicial and political<br />
obstacles still stand in the way, but it will be interesting<br />
to observe if this form of institutional development is able to<br />
move forward.
Jamaica<br />
Changes across Time: Chain-linked Summary Rating (Ranking)<br />
10<br />
8<br />
6<br />
4<br />
2<br />
0<br />
(11 th )<br />
5.48<br />
1990<br />
Income and growth<br />
In 2010, Jamaica’s income per capita was $7,673, 14 th highest<br />
among the 22 Latin American countries. From 2000 to 2010, real<br />
GDP grew at an annual rate of 0.96%, one of the slowest in the<br />
region, outpacing only Haiti.<br />
<strong>Economic</strong> institutions and analysis<br />
While Jamaica ranks 12 th in the region in the EFW index and 7 th<br />
in the Doing Business report, its ranking is lower (16 th ) in the<br />
Global Competitiveness Report. Its small size and limited domes-<br />
tic market contribute to its lower ranking in the latter index.<br />
Jamaica’s summary EFW rating has fallen in recent years. Its<br />
2010 rating was 6.95, down from 7.62 in 2005. In the chain-linked<br />
index, this corresponds to a reduction in its regional ranking<br />
from 4 th in 2005 to 10 th in 2010.<br />
Jamaica’s ranking in Area 2, Legal System and Property<br />
Rights, is 7 th in the region and 92 nd worldwide, and perfor-<br />
mance for several components in this area is borderline. For<br />
example, in the Impartial courts component (2B) it ranks 8 th in<br />
the region, and in the Protection of property rights component<br />
(2C) it ranks 5 th .<br />
(8 th )<br />
6.65<br />
1995<br />
(2 nd )<br />
7.57<br />
2000<br />
(4 th )<br />
7.62<br />
2005<br />
(10 th )<br />
6.95<br />
2010<br />
Jamaica’s performance in other areas is strong compared<br />
to the rest of the region, but unimpressive in contrast with the<br />
rest of the world. In Area 1, Size of Government, Jamaica ranks<br />
11 th in the region. Transfers and subsidies as a share of GDP are<br />
small, 1.4%, there are few government enterprises, and the top<br />
marginal income-tax rate is relatively low, 25%. Jamaica ranked<br />
Institutions and <strong>Economic</strong>, Political, and Civil Liberty in Latin America • 191<br />
EFW Area Ratings (Rankings) in 2010<br />
10<br />
8<br />
6<br />
4<br />
2<br />
0<br />
(11 th )<br />
7.62<br />
Area 1<br />
(7 th )<br />
4.88<br />
Area 2<br />
(17 th )<br />
7.98<br />
Area 3<br />
(15 th )<br />
7.11<br />
Area 4<br />
(14 th )<br />
6.59<br />
Area 5<br />
(12 th )<br />
6.84<br />
Summary<br />
14 th in Latin America in Area 5, Regulation. In some components,<br />
Jamaica’s performance in the region is outstanding. It only<br />
takes 7 days to start a business in Jamaica, the shortest time in<br />
Latin America. Moreover, in the sub-component showing the<br />
regulatory cost of hiring, Hiring regulation and minimum wage<br />
(5Bi), it ranks in the top five in the region.<br />
Areas of weakness include sound money and trade barriers.<br />
Jamaica ranks 17th in the region in Area 3, where the inflation<br />
rate has been high—12.61% in the most recent year—and<br />
15th in Area 4, where the mean tariff rate is relatively high, 7.5%.<br />
Political institutions and civil liberty<br />
By Latin American standards, the legal and political institutions<br />
of Jamaica are strong. Jamaica ranks 7th in Area 2, Legal System<br />
and Property Rights, and 5th in <strong>Freedom</strong> House’s <strong>Freedom</strong> in<br />
the <strong>World</strong> political liberties measure. It places 5th in the Polity IV<br />
measure of democracy and 1st for its constraints on the executive.<br />
Transparency International places Jamaica 8th in the region<br />
in its Corruption Perceptions Index.<br />
In the area of civil liberties, <strong>Freedom</strong> House ranks Jamaica<br />
9th among Latin American countries in its <strong>Freedom</strong> in the <strong>World</strong><br />
civil liberties measure. Its ratings for press freedom were excellent.<br />
Jamaica ranked 1st in the region in both the Reporters<br />
Without Borders’ Press <strong>Freedom</strong> Index and <strong>Freedom</strong> House’s<br />
<strong>Freedom</strong> of the Press. Jamaica’s journalists operate with a high<br />
level of autonomy on story selection and rarely fall victim to<br />
intimidation or violence.<br />
www.freetheworld.com • www.fraserinstitute.org • Fraser Institute ©2012
192 • <strong>Economic</strong> <strong>Freedom</strong> of the <strong>World</strong>: 2012 Annual Report<br />
Mexico<br />
Changes across Time: Chain-linked Summary Rating (Ranking)<br />
10<br />
8<br />
6<br />
4<br />
2<br />
0<br />
(5 th )<br />
6.13<br />
1990<br />
Income and growth<br />
In 2010, Mexico’s income per capita was $14,563, 4 th highest in<br />
the region. From 2000 to 2010, real GDP per capita grew at an<br />
annual rate of 2.25%, placing Mexico 18 th in Latin America.<br />
<strong>Economic</strong> institutions and analysis<br />
Mexico placed 14 th in the region in the EFW index. This deviates<br />
substantially from Mexico’s ranking in the Doing Business report<br />
and the Global Competitiveness Report, 4 th . Its EFW summary rat-<br />
ing shows a modest upward trend over the past two decades<br />
from 6.13 in 1990 to 6.65 in 2010. However, the ratings of other<br />
Latin American countries have increased even more rapidly. As<br />
a result, Mexico’s regional chain-linked ranking fell from 5 th in<br />
1990 to 16 th in 2010.<br />
Mexico’s strongest regional rankings are in Area 2, Legal<br />
System and Property Rights, where it placed 8 th , and Area 5,<br />
Regulation, where it was 11 th . It only takes 9 days to start a<br />
business in Mexico, the second shortest time in Latin America<br />
and competitive even compared to Australia (2 days) and<br />
Canada (5 days).<br />
(13 th )<br />
6.43<br />
1995<br />
(17 th )<br />
6.44<br />
2000<br />
(10 th )<br />
6.87<br />
2005<br />
(16 th )<br />
6.65<br />
2010<br />
On the other hand, Mexico falls behind the region and the<br />
world for freedom of international trade (Area 4), ranking 20 th<br />
among Latin American countries and 95 th worldwide. Its low<br />
rating is a result of a high mean tariff rate, 9%, and substantial<br />
variance in tariff rates, 19.6. Mexico also has room for improve-<br />
ment in Area 1, Size of Government, and Area 3, Sound Money,<br />
where it ranked 13 th . Though general government consumption<br />
Fraser Institute ©2012 • www.fraserinstitute.org • www.freetheworld.com<br />
EFW Area Ratings (Rankings) in 2010<br />
10<br />
8<br />
6<br />
4<br />
2<br />
0<br />
(13 th )<br />
7.18<br />
Area 1<br />
(8 th )<br />
4.57<br />
Area 2<br />
(13 th )<br />
8.07<br />
Area 3<br />
(20 th )<br />
6.74<br />
Area 4<br />
spending as a share of the total is competitive worldwide, 15%,<br />
government enterprises account for 29% of investment in<br />
Mexico, and the top marginal income and payroll tax rate is<br />
43%, both high figures when compared to other Latin American<br />
countries. Mexico has a history of monetary instability. Its infla-<br />
tion rate was 4.16% in the most recent year.<br />
(11 th )<br />
6.74<br />
Area 5<br />
Political institutions and civil liberty<br />
(14 th )<br />
6.66<br />
Summary<br />
Mexico’s legal and political institutions place it in the middle<br />
among Latin American countries. Mexico ranks 8 th in Area 2 of<br />
the EFW index, Legal System and Property Rights, and 13 th in<br />
the <strong>Freedom</strong> House political rights measure. It places 9 th in the<br />
Polity IV measures of democracy and constraints on the executive.<br />
Transparency International places Mexico 11th in the region<br />
in its Corruption Perceptions Index.<br />
While Mexico places 9th in the <strong>Freedom</strong> House civil liberties<br />
measure, its ranking in the press freedom area is substantially<br />
lower. <strong>Freedom</strong> House ranks it 21st among 22 Latin American<br />
countries in <strong>Freedom</strong> of the Press and Reporters Without Borders<br />
places it dead last in the Press <strong>Freedom</strong> Index. Moreover, the<br />
environment has been deteriorating: “Eighty journalists have<br />
been murdered since 2000 and 14 others have disappeared<br />
since 2003” (Press <strong>Freedom</strong> Index). Self-censorship has become<br />
more prevalent because of the increase in violence towards<br />
reporters who investigate drug trafficking, police brutality, and<br />
corruption. Reporters Without Borders describes Mexico as “the<br />
western hemisphere’s most dangerous country for the media.”
Nicaragua<br />
Changes across Time: Chain-linked Summary Rating (Ranking)<br />
10<br />
8<br />
6<br />
4<br />
2<br />
0<br />
(21 st )<br />
2.75<br />
1990<br />
(19 th )<br />
5.47<br />
1995<br />
Income and growth<br />
In 2010, Nicaragua’s income per capita was $2,913, 21 st among<br />
the 22 Latin American countries. Only Haiti had a lower income<br />
per capita. From 2000 to 2010, real GDP grew at an annual rate<br />
of 3.48%, 13 th most rapid in Latin America.<br />
<strong>Economic</strong> institutions and analysis<br />
Nicaragua’s summary rating in the EFW index places it 7 th<br />
among countries in the region. However, its rankings in the<br />
Doing Business report and the Global Competitiveness Report<br />
are substantially lower, 15 th in the former and 19 th in the latter.<br />
Nicaragua’s EFW rating has increased significantly during the<br />
past two decades. Its summary rating rose from 2.75 in 1990 to<br />
6.88 in 2010, pushing its chain-linked regional ranking up from<br />
21 st in 1990 to 12 th in 2010.<br />
(14 th )<br />
6.69<br />
2000<br />
(12 th )<br />
6.86<br />
2005<br />
Nicaragua has made substantial improvements in the last<br />
year towards increasing economic freedom. It now ranks in the<br />
top ten in the region in four areas, Size of Government, Legal<br />
System and Property Rights, <strong>Freedom</strong> to Trade Internationally,<br />
and Regulation. Its strongest area ranking was 3 rd in the region,<br />
which it earned in Area 1, Size of Government. Compared to<br />
regional standards, government consumption as a share of the<br />
total is low, 9.5%. The top marginal income-tax rates are reason-<br />
able, 30% with or without the payroll tax.<br />
(12 th )<br />
6.88<br />
2010<br />
It achieved a high ranking in Area 4, <strong>Freedom</strong> to Trade<br />
Internationlly, 7 th , with relatively low tariff rates, 5.6%. Nicaragua<br />
ranked 4 th in Area 5, Regulation. In two regulation components,<br />
Hiring regulations and minimum wage (5Bi) and Hiring and<br />
Institutions and <strong>Economic</strong>, Political, and Civil Liberty in Latin America • 193<br />
EFW Area Ratings (Rankings) in 2010<br />
10<br />
8<br />
6<br />
4<br />
2<br />
0<br />
(3 rd )<br />
8.45<br />
Area 1<br />
(10 th )<br />
4.53<br />
Area 2<br />
(11 th )<br />
8.29<br />
Area 3<br />
(7 th )<br />
7.72<br />
Area 4<br />
(4 th )<br />
7.19<br />
Area 5<br />
firing regulations (5Bii), it ranks in the top five in the region.<br />
However, Nicaragua could still make improvements to its regu-<br />
latory structure. It costs 107.9% of income per capita to start a<br />
business in Nicaragua, the second highest cost in Latin America.<br />
There is also room for improvement in the legal structure.<br />
Nicaragua’s regional rankings—20 th for Impartial courts (2B) and<br />
16 th for Protection of property rights (2C)—are particularly weak.<br />
Political institutions and civil liberty<br />
(7 th )<br />
7.24<br />
Summary<br />
The rankings for political institutions of both <strong>Freedom</strong> House<br />
and Transparency International are similar to that of Area<br />
2, Legal System and Property Rights in <strong>Economic</strong> <strong>Freedom</strong> of<br />
the <strong>World</strong>. Nicaragua’s political liberties rating from <strong>Freedom</strong><br />
House was the lowest, tied with Venezuela, in Latin America.<br />
Transparency International placed it 18 th in its Corruption<br />
Perceptions Index among Latin countries. Surprisingly, its rat-<br />
ings by the Polity IV Project were substantially higher: 5 th in the<br />
democracy index and 1 st (tied with eight other regional coun-<br />
tries) in the constraints on the executive measure. In October<br />
of 2009, the Supreme Court in Nicaragua lifted the restriction<br />
on presidential term limits, effectively lifting constraints on<br />
the executive. This may affect its future ratings by the Polity<br />
IV Project.<br />
<strong>Freedom</strong> House ranked Nicaragua 17th in its <strong>Freedom</strong> in the<br />
<strong>World</strong> Civil Liberties component and 13th in <strong>Freedom</strong> of the Press.<br />
Reporters Without Borders placed it 9th in its Press <strong>Freedom</strong><br />
Index. According to <strong>Freedom</strong> House, “the press has faced<br />
increased political and judicial harassment since 2007.”<br />
www.freetheworld.com • www.fraserinstitute.org • Fraser Institute ©2012
194 • <strong>Economic</strong> <strong>Freedom</strong> of the <strong>World</strong>: 2012 Annual Report<br />
Panama<br />
Changes across Time: Chain-linked Summary Rating (Ranking)<br />
10<br />
8<br />
6<br />
4<br />
2<br />
0<br />
Income and growth<br />
In 2010, Panama’s income per capita was $13,607, the 6 th highest<br />
in the region. From 2000 to 2010, Panama’s real GDP per cap-<br />
ita grew at an annual rate of 5.73%, the 2 nd most rapid in Latin<br />
America.<br />
(3 rd )<br />
6.45<br />
1990<br />
(3 rd )<br />
7.44<br />
1995<br />
<strong>Economic</strong> institutions and analysis<br />
The economic institutions of Panama are among the most<br />
sound in the region. Panama’s EFW summary rating places<br />
it 3 rd in the region, behind only Chile and Peru. It ranks 5 th in<br />
the Doing Business index of regulation and 2 nd in the Global<br />
Competitiveness Report. Panama has continually placed among<br />
the freest economies in the region since 1990.<br />
International trade and sound money are strengths of<br />
the Panamanian economy. Panama ranked 6 th in the region<br />
and 19 th in the world in Area 4 of the EFW index, <strong>Freedom</strong><br />
to Trade Internationally. Tariffs are relatively low and goods<br />
move efficiently through the canal and into and out of the<br />
country. Its ranking for Area 3, Sound Money, is also 6 th in<br />
the region. Panama has used the US dollar for more than<br />
a century and its inflation rate is low and relatively stable.<br />
Moreover, the widespread use of the dollar throughout the<br />
world facilitates international exchange and enhances the<br />
size of the trade sector.<br />
(3 rd )<br />
7.56<br />
2000<br />
(5 th )<br />
7.60<br />
2005<br />
Panama ranked 6 th in the region in Area 1, Size of Government.<br />
Government consumption accounts for 8% of the total, the low-<br />
est in Latin America. Its top marginal personal income-tax rate<br />
is 27% (43% when the payroll tax is included).<br />
(4 th )<br />
7.44<br />
2010<br />
Fraser Institute ©2012 • www.fraserinstitute.org • www.freetheworld.com<br />
EFW Area Ratings (Rankings) in 2010<br />
10<br />
8<br />
6<br />
4<br />
2<br />
0<br />
(6 th )<br />
8.02<br />
Area 1<br />
(6 th )<br />
5.06<br />
Area 2<br />
Area 3<br />
As is the case with many countries in the region, Panama’s<br />
legal system needs improvement and regulation is excessive.<br />
Its regional rankings for Areas 2 and 5 are 6 th and 9 th , respec-<br />
tively. However, worldwide its ranking for Area 2 is 88 th and<br />
its rating for Area 5 places it 82 nd among the 144 countries.<br />
Absence of judicial independence and lengthy time for the<br />
legal enforcement of contracts contribute to Panama’s low rat-<br />
ing in Area 2. Labor market regulations are particularly restric-<br />
tive. For example, it ranked 16 th in the sub-component, Hiring<br />
and firing regulations (5Bii).<br />
Political institutions and civil liberty<br />
While Panama’s rating for Area 2 places it 6 th in the region,<br />
<strong>Freedom</strong> House ranks it number 1 in Latin America for its pro-<br />
tection of political rights. The Polity IV index places it 5 th in<br />
its democracy index and 9 th for constraints on the executive.<br />
Transparency International ranks it 8 th in Latin America in its<br />
Corruption Perceptions Index.<br />
(6 th )<br />
9.04 (6 th )<br />
8.00<br />
Area 4<br />
Panama also ranked highly, 4 th in Latin America, in <strong>Freedom</strong><br />
House’s index of protection of civil liberties. However, its free-<br />
dom of the press rankings were lower, 10 th in the <strong>Freedom</strong><br />
House measure and 17 th in the Reporters Without Borders’<br />
index. Journalists who condemn and reveal the presence of<br />
sex trafficking in Panama often face criminal prosecution. As<br />
<strong>Freedom</strong> House notes in <strong>Freedom</strong> in the <strong>World</strong> 2012, “the U.S.<br />
State Department’s 2010 Trafficking in Persons Report criticized<br />
Panama for its failure to comply with minimum international<br />
standards to combat human trafficking.”<br />
(9 th )<br />
6.85<br />
Area 5<br />
(3 rd )<br />
7.40<br />
Summary
Paraguay<br />
Changes across Time: Chain-linked Summary Rating (Ranking)<br />
10<br />
8<br />
6<br />
4<br />
2<br />
0<br />
(9 th )<br />
5.60<br />
1990<br />
Income and growth<br />
In 2010, Paraguay’s per–capita income was $5,181, 16 th among<br />
Latin American countries. From 2000 to 2010, real GDP per cap-<br />
ita grew at an annual rate of 3.42%, 15 th in Latin America.<br />
<strong>Economic</strong> institutions and analysis<br />
Paraguay ranked 13 th in the EFW index and 20 th in the Global<br />
Competitiveness Report among Latin American countries. Its<br />
ranking was higher, 10 th , in the <strong>World</strong> Bank’s Doing Business<br />
report. Its EFW summary rating has fluctuated substantially<br />
since 1990, but its regional chain-linked ranking fell from 9 th in<br />
1990 to 15 th in 2010.<br />
(10 th )<br />
6.53<br />
1995<br />
(18 th )<br />
6.44<br />
2000<br />
(17 th )<br />
6.36<br />
2005<br />
(15 th )<br />
6.65<br />
2010<br />
Paraguay places in the top ten in the region in three areas<br />
of the EFW index: Area 1, Size of Government, Area 3, Sound<br />
Money, and Area 4, <strong>Freedom</strong> to Trade Internationally, where<br />
it ranks 10 th . The mean tariff rate is high, 10.2%, and varies sub-<br />
stantially. There are high compliance costs with importing and<br />
exporting and debilitating capital controls. It takes 33 days to<br />
fulfill the necessary requirements to import or export goods,<br />
one of the longest waiting periods in Latin America.<br />
The legal system and regulation are major weakness of the<br />
Paraguayan economy. In Area 2, Legal System and Property<br />
Rights, Paraguay ranked 20th in the region and 131st among the<br />
144 countries worldwide. This low ranking is explained partly<br />
by its performance in two components, Impartial courts (2B)<br />
where it ranked 17th in the region, and Protection of property<br />
rights (2C) where it ranked 18th . In Area 5, Regulation,<br />
Institutions and <strong>Economic</strong>, Political, and Civil Liberty in Latin America • 195<br />
EFW Area Ratings (Rankings) in 2010<br />
10<br />
8<br />
6<br />
4<br />
2<br />
0<br />
(7 th )<br />
8.01<br />
Area 1<br />
(20 th )<br />
3.63<br />
Area 2<br />
(10 th )<br />
8.65<br />
Area 3<br />
(10 th )<br />
7.49<br />
Area 4<br />
(18 th )<br />
6.15<br />
Area 5<br />
(13 th )<br />
6.78<br />
Summary<br />
Paraguay ranked 18th in Latin America and 117th in the world.<br />
The presence of conscription pulls Paraguay’s rating down<br />
in this area.<br />
Political institutions and civil liberty<br />
Widespread corruption permeates the political institutions of<br />
Paraguay. Its rating for Area 2 of the EFW index, Legal System<br />
and Property RIghts, is 20th among the 22 countries in the region.<br />
Its <strong>Freedom</strong> House ranking of political liberty is slightly higher,<br />
13th , but Transparency International’s Corruption Perceptions<br />
Index places it 20th in the region. In 2011, Paraguay ranked 154th among the 182 countries included in the Corruption Perceptions<br />
Index. The Polity IV Project ranks Paraguay 9th in its democracy<br />
measure and 1st (tied with eight other countries) in its executive<br />
constraints index. Nonetheless, the indicators illustrate that<br />
rule of law is uncertain and corruption widespread. Until there<br />
is substantial improvement in these areas, Paraguay will continue<br />
to be one of the poorer countries in the region.<br />
Paraguay ranks 9th in <strong>Freedom</strong> House’s <strong>Freedom</strong> in the<br />
<strong>World</strong> civil liberties component and 19th in its <strong>Freedom</strong> of the<br />
Press measure. Reporters Without Borders places it 10th in its<br />
Press <strong>Freedom</strong> Index. The latter ranking indicates that violence<br />
against journalists is less of a problem than corruption. As<br />
<strong>Freedom</strong> House notes in <strong>Freedom</strong> in the <strong>World</strong> 2012, “corruption<br />
cases languish for years in the courts without resolution,<br />
and corruption often goes unpunished as judges favor the<br />
powerful and wealthy.”<br />
www.freetheworld.com • www.fraserinstitute.org • Fraser Institute ©2012
196 • <strong>Economic</strong> <strong>Freedom</strong> of the <strong>World</strong>: 2012 Annual Report<br />
Peru<br />
Changes across Time: Chain-linked Summary Rating (Ranking)<br />
10<br />
8<br />
6<br />
4<br />
2<br />
0<br />
(20 th )<br />
3.97<br />
1990<br />
(11 th )<br />
6.50<br />
1995<br />
Income and growth<br />
(8 th )<br />
7.30<br />
2000<br />
(6 th )<br />
7.30<br />
2005<br />
In 2010, Peru’s income per capita was $9,537, placing it 10 th in<br />
the region. From 2000 to 2010, real GDP per capita grew at an<br />
annual rate of 5.46%, the 3 rd most rapid in Latin America.<br />
<strong>Economic</strong> institutions and analysis<br />
(2 nd )<br />
7.52<br />
2010<br />
Peru’s summary rating on the EFW index is the 2 nd highest in<br />
Latin America, behind only Chile. Its rating in the Doing Business<br />
report is the 2 nd highest in the region. It places 7 th in the Global<br />
Competitiveness Report. During the past two decades, Peru has<br />
moved from one of the least free economies in Latin America<br />
to one of the most free. After implementing several liberal eco-<br />
nomic reforms in the early 1990s, Peru’s summary EFW rating<br />
rose steadily from 3.97 in 1990 to 7.52 in 2010. The reforms continued<br />
and some were expanded even though the country experienced<br />
several periods of political upheaval and uncertainty.<br />
Peru’s impressive average annual growth rate during the past<br />
two decades, 3.36%, provides strong evidence for the potency<br />
of economic freedom as a source of growth and prosperity.<br />
Peru ranks in the top five among the countries in the region<br />
in all areas of the EFW index except Area 1, Size of Government.<br />
Its high rating in Area 3, Sound Money, reflects its low 1.53%<br />
rate of inflation and the low variation in that rate. Peru allows<br />
its citizens to own foreign currency bank accounts and has<br />
now moved into the top 25 countries worldwide for <strong>Freedom</strong><br />
to Trade Internationally, ranking 1st . International trade tax revenues<br />
as a percentage of the trade sector are very low, 1.32%, and<br />
the mean tariff rate is competitive at 5.4%. In Area 5, Regulation,<br />
Fraser Institute ©2012 • www.fraserinstitute.org • www.freetheworld.com<br />
EFW Area Ratings (Rankings) in 2010<br />
10<br />
8<br />
6<br />
4<br />
2<br />
0<br />
(12 th )<br />
7.53<br />
Area 1<br />
(5 th )<br />
5.10<br />
Area 2<br />
(3 rd )<br />
9.27<br />
Area 3<br />
(1 st )<br />
8.60<br />
Area 4<br />
(1 st )<br />
7.55<br />
Area 5<br />
(2 nd )<br />
7.61<br />
Summary<br />
Peru ranks 1st in the region and 38th in the world. Despite its<br />
high regional ranking, restrictive regulations are present in<br />
some areas. In Peru, it takes 26 days to start a business, three<br />
times as long as some of its Latin American neighbors, including<br />
Jamaica, Chile, and Uruguay (7 days), and Panama (8 days).<br />
It takes 309 hours for a business to prepare and pay taxes in<br />
Peru, more than three times the number of hours required in<br />
Australia (109 hours), and Canada (131 hours).<br />
In Area 1, Size of Government, Peru ranks 12th in the region.<br />
The top marginal income and payroll tax rate in Peru is 48%,<br />
one of the highest in the region.<br />
Political institutions and civil liberty<br />
Peru is an electoral democracy and its political institutions<br />
rank in the top third among Latin American countries. Its rating<br />
in Area 2, Legal System and Property Rights, of the EFW<br />
index places it 5th in the region. <strong>Freedom</strong> House ranks it 5th for<br />
protection of political freedom. The Polity IV Project places it<br />
5th in its democracy index and 1st (tied with 8 other countries)<br />
for the constraints on the executive component. Transparency<br />
International ranked it 5th in Latin America in its Corruption<br />
Perceptions Index.<br />
Peru’s performance in the civil liberties area is less impressive.<br />
<strong>Freedom</strong> House placed it 9th in both the civil liberties component<br />
of <strong>Freedom</strong> in the <strong>World</strong> and <strong>Freedom</strong> of the Press. It<br />
placed even lower, 18th , in the Reporters Without Borders’ Press<br />
<strong>Freedom</strong> Index. Murder of journalists is rare in Peru, but they<br />
often face physical attacks and verbal threats.
Trinidad & Tobago<br />
Changes across Time: Chain-linked Summary Rating (Ranking)<br />
10<br />
8<br />
6<br />
4<br />
2<br />
0<br />
(10 th )<br />
5.52<br />
1990<br />
Income and growth<br />
In 2010, Trinidad & Tobago’s income per capita was $25,738, the<br />
highest in Latin America. Its growth rate was equally impressive.<br />
From 2000 to 2010, real GDP per capita grew at an annual rate<br />
of 5.76%, the highest in the region.<br />
<strong>Economic</strong> institutions and analysis<br />
The economic institutions of Trinidad & Tobago rank in the<br />
upper half among Latin American countries. Trinidad &<br />
Tobago’s summary rating on the EFW index places it 11 th in the<br />
region. The Global Competitiveness Report places it 10 th in the<br />
region, while the <strong>World</strong> Bank ranks it a little higher, 6 th , in its<br />
Doing Business Index. The EFW summary rating of Trinidad &<br />
Tobago rose during the 1990s and reached a peak of 7.35 in<br />
2000, but it has fallen during the past decade.<br />
Trinidad & Tobago’s highest ranking in the region is in Area<br />
5, Regulation, where it ranks 2 nd . Regulatory costs of hiring are<br />
the lowest in Latin America, and military conscription is absent.<br />
The monetary cost of starting a business is also low, 0.9% of<br />
income per capita.<br />
(4 th )<br />
7.29<br />
1995<br />
(4 th )<br />
7.55<br />
2000<br />
(8 th )<br />
7.14<br />
2005<br />
11 th )<br />
6.90<br />
2010<br />
Trinidad & Tobago ranks 14 th in the region in the Area 1, Size<br />
of Government and 9 th in the Area 2, Legal System and Property<br />
Rights. Its top marginal personal income-tax rate is 25% (39%<br />
when the payroll tax is included). Government investment<br />
sums to 24% of total investment. By Latin American standards,<br />
its ratings for judicial independence, integrity of the court system,<br />
and absence of military interference in rule of law are<br />
strengths of the judicial system.<br />
Institutions and <strong>Economic</strong>, Political, and Civil Liberty in Latin America • 197<br />
EFW Area Ratings (Rankings) in 2010<br />
10<br />
8<br />
6<br />
4<br />
2<br />
0<br />
(14 th )<br />
6.91<br />
Area 1<br />
(9 th )<br />
4.56<br />
Area 2<br />
(18 th )<br />
7.96<br />
Area 3<br />
(12 th )<br />
7.43<br />
Area 4<br />
(2 nd )<br />
7.52<br />
Area 5<br />
(11 th )<br />
6.88<br />
Summary<br />
Area 3, Sound Money, is a major weakness for Trinidad &<br />
Tobago. It ranks 18th among the 22 Latin American countries in<br />
this area. In 2010, the inflation rate was high, 10.6%. Citizens are<br />
permitted to maintain foreign currency bank accounts.<br />
Political institutions and civil liberty<br />
The political institutions of Trinidad & Tobago are democratic,<br />
personal liberties are protected, and the political process is<br />
open and relatively free of corruption. Trinidad & Tobago ranks<br />
5th among countries in the region in <strong>Freedom</strong> House’s political<br />
rights index, but Polity IV ranks it first in the region in its measures<br />
of democracy and first, tied with eight other countries,<br />
for effective constraints on the executive. It ranks 10th in Latin<br />
America in Transparency International’s Corruption Perceptions<br />
Index.<br />
Trinidad & Tobago’s civil liberties ratings are also high: it<br />
ranked 4th in <strong>Freedom</strong> House’s civil liberties measure and 3rd in <strong>Freedom</strong> of the Press. Reporters Without Borders ranks it 6th in the region in its Press <strong>Freedom</strong> Index. The constitution of<br />
Trinidad & Tobago guarantees citizens freedom of speech, religion,<br />
association, and assembly. To a large degree, these freedoms<br />
are both respected and upheld in practice.<br />
Taken as a whole, the economic, legal, and political institutions<br />
of Trinidad & Tobago are among the strongest in Latin<br />
America. Its growth rate during the past decade has been<br />
impressive. With some modest improvements in legal structure<br />
and economic policy, this country could become a major<br />
success story in the decade immediately ahead.<br />
www.freetheworld.com • www.fraserinstitute.org • Fraser Institute ©2012
198 • <strong>Economic</strong> <strong>Freedom</strong> of the <strong>World</strong>: 2012 Annual Report<br />
Uruguay<br />
Changes across Time: Chain-linked Summary Rating (Ranking)<br />
10<br />
8<br />
6<br />
4<br />
2<br />
0<br />
(4 th )<br />
6.34<br />
1990<br />
(12 th )<br />
6.47<br />
1995<br />
Income and growth<br />
(9 th )<br />
7.08<br />
2000<br />
(9 th )<br />
7.02<br />
2005<br />
In 2010, Uruguay’s income per capita was $14,108, the 5 th highest<br />
in Latin America. From 2000 to 2010, real GDP per capita grew<br />
at an annual rate of 2.82%, 17 th among Latin American countries.<br />
<strong>Economic</strong> institutions and analysis<br />
6 th )<br />
7.25<br />
2010<br />
The economic institutions of Uruguay fall in the upper middle<br />
group of the countries in the region. Uruguay’s summary rat-<br />
ing in the EFW index ranked 5 th and its Doing Business regu-<br />
latory rating placed 8 th among Latin American countries. Its<br />
ranking, 6 th in the region, in the Global Competitiveness Report<br />
was a little higher. Uruguay’s summary chain-linked rating in<br />
the EFW index has steadily increased over the past 15 years,<br />
jumping from 6.47 in 1995 to 7.25 in 2010. Among countries in<br />
the region, its chain-linked ranking has risen from 12th in 1995<br />
to 6th in 2010.<br />
Uruguay is a “big government” economy. It ranked 17th in<br />
the region in Area 1, Size of Government. A large number of<br />
government enterprises as a share of investment in Uruguay,<br />
31%, and a relatively high top marginal income and payroll tax<br />
rate, 31%, contribute to Uruguay’s low rating in this area.<br />
In contrast with its low rating for Area 1, Uruguay’s legal<br />
structure is relatively sound. In this respect, it is an anomaly<br />
in Latin America. Uruguay ranked 3rd in the region and 58th worldwide in Area 2, Legal System and Property Rights. This is<br />
a result of its strong protection of property rights and impartial<br />
courts. It ranks in the top two for both of these components of<br />
Area 2. It ranked 6th in the region and 67th worldwide in Area<br />
Fraser Institute ©2012 • www.fraserinstitute.org • www.freetheworld.com<br />
EFW Area Ratings (Rankings) in 2010<br />
10<br />
8<br />
6<br />
4<br />
2<br />
0<br />
(17 th )<br />
6.31<br />
Area 1<br />
(3 rd )<br />
5.89<br />
Area 2<br />
(7 th )<br />
8.98 (3 rd )<br />
8.24<br />
Area 3<br />
Area 4<br />
(6 th )<br />
7.01<br />
Area 5<br />
(5 th )<br />
7.29<br />
Summary<br />
5, Regulation. Military conscription is absent and the regulatory<br />
costs of hiring are low (5Bi). However, regulations on hiring<br />
and firing are restrictive. Uruguay’s ranking for this component<br />
(5Bii) is 18th in the region.<br />
Political institutions and civil liberty<br />
Uruguay is an electoral democracy with political parties that<br />
represent a diversity of views. Uruguay receives high marks<br />
from each of the political measures of our analysis. This provides<br />
confirmation of its high rating in Area 2 of the EFW<br />
index, Legal System and Property Rights. Uruguay ranks 1st in<br />
the region in <strong>Freedom</strong> House’s <strong>Freedom</strong> in the <strong>World</strong> political<br />
rights component and the Polity IV measures of democracy<br />
and constraints on the executive. It is also relatively free of corruption,<br />
placing 2nd in Transparency International’s Corruption<br />
Perceptions Index.<br />
Uruguay is the highest rated Latin American country in<br />
<strong>Freedom</strong> House’s civil liberty index, tied with Chile. It ranks<br />
4th in <strong>Freedom</strong> of the Press and 3rd in the Reporters Without<br />
Borders’ Press <strong>Freedom</strong> Index. Civil liberties such as the freedom<br />
of expression, religion, and assembly are constitutionally protected<br />
and widely respected in Uruguay.<br />
In summary, the legal and political institutions of Uruguay<br />
are among the best in the region. However, it would benefit<br />
substantially from more economic liberalization. Of course,<br />
Uruguay is a small country, but Hong Kong is also small. With<br />
a substantial move toward economic liberalization, Uruguay<br />
has the potential to become the Hong Kong of South America.
Venezuela<br />
Changes across Time: Chain-linked Summary Rating (Ranking)<br />
10<br />
8<br />
6<br />
4<br />
2<br />
0<br />
Income and growth<br />
In 2010, Venezuela’s income per capita was $12,232, the 7 th high-<br />
est in Latin America. From 2000 to 2010, real GDP per capita<br />
grew at an annual rate of 3.48%, 13 th among Latin American<br />
countries.<br />
(6 th )<br />
5.69<br />
1990<br />
(22 nd )<br />
4.40<br />
1995<br />
(20 th )<br />
5.83<br />
2000<br />
(22 nd )<br />
4.52<br />
2005<br />
<strong>Economic</strong> institutions and analysis<br />
(22 nd )<br />
3.88<br />
2010<br />
This resource-rich country has the worst economic institu-<br />
tions in Latin America. It ranks last among the countries in the<br />
region in both the summary index of <strong>Economic</strong> <strong>Freedom</strong> of the<br />
<strong>World</strong> and the <strong>World</strong> Bank’s Doing Business report. It is next to<br />
last—only Haiti is lower—in the Global Competitiveness Report.<br />
<strong>World</strong>wide, Venezuela’s summary ranking places it dead last<br />
among the 144 countries included in the EFW index.<br />
Venezuela’s record for economic freedom over the past two<br />
decades stands in stark contrast with the situation from 1970<br />
to 1980. <strong>World</strong>wide, among the countries for which EFW data<br />
were available, Venezuela’s economic freedom rating placed<br />
it 11th in 1970, 17th in 1975, and 16th among 104 countries in 1980.<br />
During the next three decades, Venezuela’s ranking worldwide<br />
declined precipitously, plunging to 56th in 1990, 101st in 2000,<br />
and 144th in 2010.<br />
Venezuela ranks in the bottom two in the region in each<br />
of the five areas of the EFW index. <strong>World</strong>wide, it ranks in the<br />
bottom five in each of the areas except the Area 1, Size of<br />
Government, where it ranks 126th out of 144 countries. The<br />
Venezuelan economy is characterized by numerous government<br />
enterprises, high rates of inflation, and restrictions on<br />
international trade. Specifically, government enterprises make<br />
up 56% of investment in Venezuela, crowding out the private<br />
sector. A 29% inflation rate in 2010, and restrictions on owning<br />
foreign-currency bank accounts contributed to Venezuela’s<br />
low rating in Area 3, Sound Money. Venezuela’s 12.5% mean tariff<br />
rate is the third highest in Latin America. The time cost to<br />
Institutions and <strong>Economic</strong>, Political, and Civil Liberty in Latin America • 199<br />
EFW Area Ratings (Rankings) in 2010<br />
10<br />
8<br />
6<br />
4<br />
2<br />
0<br />
(21 st )<br />
4.96<br />
Area 1<br />
(21 st )<br />
2.48<br />
Area 2<br />
(22 nd )<br />
4.72 (22 nd )<br />
3.91<br />
Area 3<br />
Area 4<br />
(22 nd )<br />
4.27<br />
Area 5<br />
(22 nd )<br />
4.07<br />
Summary<br />
export a standard 20-foot container of dry goods is 49 days<br />
and the money cost per container is $2,590, 50% more than any<br />
other Latin American country.<br />
Furthermore, regulation in Venezuela is a major deterrent<br />
to business activity. It takes 141 days to start a business<br />
in Venezuela, the longest time of any Latin American country.<br />
The time costs of complying with the tax code for a business<br />
amount to approximately 864 hours, more than twice the parallel<br />
figures for Chile and Peru. As if the regulatory environment<br />
was not bad enough, an authoritarian political regime, military<br />
interference, and a partial and politicized judiciary undermine<br />
the legal system of Venezuela.<br />
Political institutions and civil liberty<br />
Like the economic institutions, the political institutions of<br />
Venezuela are the worst in Latin America. It has the least democratic,<br />
most authoritarian, and most corrupt government in the<br />
region. Venezuela ranks either last or next to last in all five of<br />
the legal and political measures included here. Venezuela ranks<br />
21st , just above Haiti, in Area 2, Legal System and Property Rights,<br />
of the EFW index, <strong>Freedom</strong> House’s political liberties measure,<br />
and the Corruption Perceptions Index. Not only does Venezuela<br />
rank next to last in the region in the Corruption Perceptions<br />
Index, it places 172nd among 182 countries worldwide.<br />
Although the constitution guarantees several civil liberties,<br />
in practice the government suppresses their exercise.<br />
<strong>Freedom</strong> House ranks Venezuela 21st among the 22 Latin countries<br />
in its <strong>Freedom</strong> in the <strong>World</strong> civil liberties measure and 22nd in its <strong>Freedom</strong> of the Press. Reporters Without Borders ranks<br />
Venezuela 19th in its Press <strong>Freedom</strong> Index. In summary, a broad<br />
set of measures assembled by a diverse group of institutes and<br />
scholars reflect remarkable agreement that the economic, political,<br />
and civil institutions of Venezuela are the most disastrous<br />
in Latin America.<br />
www.freetheworld.com • www.fraserinstitute.org • Fraser Institute ©2012
200 • <strong>Economic</strong> <strong>Freedom</strong> of the <strong>World</strong>: 2012 Annual Report<br />
References<br />
Fraser Institute ©2012 • www.fraserinstitute.org • www.freetheworld.com<br />
<strong>Freedom</strong> House (2011). <strong>Freedom</strong> of the Press 2011. .<br />
<strong>Freedom</strong> House (2012). <strong>Freedom</strong> in the <strong>World</strong> 2012. .<br />
Gwartney, James, Robert Lawson, and Joshua Hall (2012). <strong>Economic</strong> <strong>Freedom</strong> of<br />
the <strong>World</strong>: 2012 Annual Report. This volume. Fraser Institute. ; data available from .<br />
Marshall, Monty G., Dir. (2010). Polity IV Project: Political Regime Characteristics<br />
and Transitions, 1800-2010. Integrated Network for Societal Conflict Research<br />
(INSCR), Center for Systemic Peace. .<br />
Reporters Without Borders (2012). Press <strong>Freedom</strong> Index2011-2012. .<br />
Schwab, Klaus (ed.) (2011). Global Competitiveness Report 2011-2012. Centre for<br />
Global Competitiveness and Performance, <strong>World</strong> <strong>Economic</strong> Forum. .<br />
The Economist (2012, February 25). Official Statistics: Don’t Lie to Me, Argentina.<br />
Why We Are Removing a Figure from Our Indicators Page. .<br />
Transparency International (2011). Corruption Perceptions Index. .<br />
<strong>World</strong> Bank (2012). Doing Business. <strong>World</strong> Bank Publications. .
Chapter 4 Banking Crises and <strong>Economic</strong> <strong>Freedom</strong><br />
Scott L. Baier, Matthew Clance, and Gerald P. Dwyer*<br />
Are financial crises more likely among countries that have more economic freedom?<br />
At one level, the answer to this is obvious. Consider an economy such as North<br />
Korea, which has a totally repressed financial system run by the government. The<br />
possibility of a financial crisis is not a problem for North Korea, even if a lack of<br />
economic growth is a problem for the citizens. Beyond that extreme though, the<br />
relationship between economic freedom and financial crises is not so obvious.<br />
Just as for economic freedom, a careful definition of financial crises is necessary<br />
before examining it empirically. Financial crises often are not well defined: many<br />
definitions are broad, such as sharp decreases in asset prices, and would include<br />
many relatively common decreases in stock prices; others are quite narrow, including<br />
only runs on banking systems. Reinhart and Rogoff (2009) define a financial<br />
crisis either by events (banking crises, domestic defaults, or external debt defaults)<br />
or by “quantitative thresholds” (inflation crisis, currency crashes, currency debasement,<br />
and the bursting of asset-price bubbles). We limit our empirical analysis in<br />
this chapter to banking crises, which can be defined by relatively objective criteria<br />
and are an important aspect of recent events.<br />
There is a large empirical literature that looks at financial crises and the role<br />
government regulation or the lack thereof played in the financial crises and subsequent<br />
events. For example, after the Asian financial crisis, several empirical papers<br />
examined the relationship between capital controls and currency crises and capitalaccount<br />
liberalization and the likelihood of a financial-market and exchange-rate<br />
crisis.1 As for North Korea, the answer is partly obvious. A closed economy cannot<br />
have a crisis due to inflows or outflows of foreign funds. On the other hand, permitting<br />
capital flows into and out of a country can improve the economy’s efficiency and<br />
can make the country’s citizens better off (Bekaert, Harvey, and Lundblad, 2005)<br />
* Scott L. Baier and Matthew Clance are from Clemson University; Gerald P. Dwyer, from the<br />
University of Carlos III, Madrid. We thank three referees and Koen Schoors for helpful comments<br />
on earlier drafts. Dwyer thanks the Spanish Ministry of Education and Culture for support<br />
of project ECO2010-17158. Any errors are our responsibility. Cite this chapter: Baier, Scott<br />
L., Matthew Clance, and Gerald P. Dwyer (2012). Banking Crises and <strong>Economic</strong> <strong>Freedom</strong>. In<br />
James Gwartney, Robert Lawson, and Joshua Hall, <strong>Economic</strong> <strong>Freedom</strong> of the <strong>World</strong>: 2012 Annual<br />
Report (Fraser Institute): 201–217.<br />
1 See for example Edwards, 2007; Glick and Hutchinson, 2005; and Mishkin, 1999.<br />
www.freetheworld.com • www.fraserinstitute.org • Fraser Institute ©2012
202 • <strong>Economic</strong> <strong>Freedom</strong> of the <strong>World</strong>: 2012 Annual Report<br />
Fraser Institute ©2012 • www.fraserinstitute.org • www.freetheworld.com<br />
even though it does make capital-account crises possible. Similarly, prohibiting stock<br />
exchanges prevents stock-market crashes. On the other hand, opening a stock market<br />
can improve a country’s prospects for economic growth (Baier, Dwyer, and Tamura,<br />
2004). While a financial crisis is possible after an economy liberalizes capital flows,<br />
this does not mean the citizens of the country are necessarily worse off, even if there<br />
is a financial crisis. Similarly, a stock-market crash is more likely if a country has an<br />
active stock exchange but that does not imply that a country would be better off<br />
without a stock market and the improved economic efficiency that goes along with<br />
it. Liberalization of capital and stock markets without a crisis clearly is better than<br />
having a crisis, but that does not imply that people in an economy are better off without<br />
the liberalization.<br />
Banking crises are similar to exchange-rate and stock-market crises. Everything else<br />
the same, the disruption, difficulties, and recessions usually associated with banking<br />
crises are best avoided. If everything else were the same though, a crisis would would<br />
not be avoided. Avoiding crises requires changing some things, possibly making the<br />
banking system less efficient or less supportive of economic growth. Even with a crisis,<br />
citizens can be better off in an economy that permits crises (Rancière, Tornell, and<br />
Westermann, 2008). The question is how to avoid or at least ameliorate these crises<br />
without stifling growth. How to do that? In order to answer this question, it is necessary<br />
to have some idea of how regulation and crises are related.<br />
In this chapter, we examine the relationship between economic freedom and<br />
banking crises. We focus on this subset of financial crises because banking crises<br />
can be defined in a moderately objective way, which is a substantial advantage. In<br />
addition, banking develops at relatively low income levels when not suppressed<br />
and therefore is common across most countries. Issues of financial-market development<br />
are not so pressing when examining banking crises. We examine the relationship<br />
between banking crises and measures of economic freedom from Gwartney,<br />
Lawson, and Hall (2011). <strong>Economic</strong> freedom can be defined as having “personal<br />
choice, voluntary exchange coordinated by markets, freedom to enter and compete<br />
in markets, and protection of persons and their property from aggression by others”<br />
as its central elements (Gwartney, Lawson, and Hall, 2011: 1). Government regulation,<br />
that is, lower economic freedom, typically involves more government restrictions<br />
on private economic activity. These restrictions can be explicit regulations or<br />
they can be implicit responses by the government to private activity that distort that<br />
activity. In addition to an overall measure of economic freedom, we examine subsets<br />
of the overall economic freedom index related to the financial sector. We investigate<br />
the relationships of credit-market restrictions and the soundness of the monetary<br />
system with the likelihood of a banking crisis. Monetary developments can help<br />
create a banking crisis and monetary developments are affected by banking crises.<br />
There is an informative literature on the relationship between financial crises and<br />
government regulation of banking.2 Demircüç-Kunt and Detragiache (1998) provide<br />
one of the first empirical studies of the determinants of banking crises across<br />
a large number of countries. Their results indicate that more deposit insurance is<br />
associated with a higher probability of banking crises. Later studies by Barth, Caprio<br />
2 These studies use a summary variable to indicate whether or not a banking crisis occurred with<br />
little indication of its severity. Reasonably accurate and comparable data on banks’ losses in<br />
banking crises, for example, would be extremely expensive to compile and would require a great<br />
deal of judgement.
Banking Crises and <strong>Economic</strong> <strong>Freedom</strong> • 203<br />
and Levine (2004) and others also find that deposit insurance raises the probability<br />
of banking crises. In a recent paper, Shehzad and De Haan (2008) find that<br />
financial liberalization leads to a lower probability of a banking crisis.3 Johnson<br />
(2011) and Beltratti and Stulz (2012) analyze the effect of the recent crisis on banks’<br />
stock returns, one measure of the severity of the crisis’s effects because smaller falls<br />
in stock returns can reflect fewer problems and more resilient banking systems.<br />
Johnson’s results (2011) suggest larger government, higher taxes, and more government<br />
regulation are associated with more difficulties during the crisis. Beltratti and<br />
Stulz (2012) find little evidence that more banking regulation resulted in banks<br />
performing better during the crisis.<br />
We also examine the effects of banking crises on regulation, the monetary system,<br />
and economic freedom more generally. While the answer to this seems obvious<br />
from casual empiricism since the most recent crisis—politicians’ increase regulation<br />
and restrict freedom after a crisis—we are aware of only one empirical paper<br />
on this issue. De Haan, Sturm, and Zandberg (2009) examine the effects of crises<br />
on economic freedom in a case study for Norway and Sweden and by cross-country<br />
regressions. They find that economic freedom is hardly affected in Norway and<br />
Sweden and goes up over time if it was affected. Their regressions suggest that economic<br />
freedom falls right after a crisis but then increases.<br />
Banking crises and economic freedom across countries<br />
Our data on banking crises span over 30 years from 1976 to 2008. The data are<br />
from Laeven and Valencia (2010), who define a banking crisis as occurring when<br />
there are “significant signs of financial distress in the banking system (as indicated<br />
by significant bank runs, losses in the banking system, and bank liquidations)” and<br />
“significant banking policy intervention measures in response to significant losses<br />
in the banking system” (Laeven and Valencia, 2010: 6).4 Sufficient conditions are<br />
either: [1] non-performing loans above 20% of loans or banks closing with at least<br />
20% of total banking assets; or [2] outlays by government for restructuring banking<br />
of at least 5% of Gross Domestic Product (GDP). These crises last for more than<br />
one year and are defined as ending when real GDP growth and real credit growth<br />
are positive for two consecutive years (Laeven and Valencia, 2010: 10).<br />
Figure 4.1 shows the fraction of countries in our dataset in which a banking crisis<br />
begins in each year. The year 2008 stands out as the year with the highest fraction of<br />
countries—21 out of 152 countries—in which a banking crisis starts. There is another<br />
peak, though, with 14 of the countries having a banking crisis starting in 1995. There<br />
were also eight years in which no banking crisis started in any country; in fact, no<br />
banking crisis started from 2004 to 2006 before the sharp increase in 2007 and 2008.<br />
Figure 4.2 shows a different view of these crises over time, which is the fraction<br />
of countries at the start of a crisis or not yet out of the aftermath. The year 1995<br />
stands out with nearly 20% of the countries in a banking crisis. In terms of the<br />
3 They distinguish systemic banking crises—those in which bank capital in the country is exhausted —<br />
and non-systemic banking crises—those of lesser significance in which large banks fail. We discuss<br />
only their results concerning systemic banking crises. All the crises in this paper and our source<br />
(Laeven and Valencia, 2010) are systemic banking crises as defined by Laeven and Valencia.<br />
4 The commonly used earlier definition of a banking crisis as occurring when all or almost all bank<br />
capital has been depleted seems more precise but it is not, because accounting rarely keeps up<br />
with reality and stock-market prices reflect both banks’ activities and government bailouts.<br />
www.freetheworld.com • www.fraserinstitute.org • Fraser Institute ©2012
204 • <strong>Economic</strong> <strong>Freedom</strong> of the <strong>World</strong>: 2012 Annual Report<br />
Fraction of countries with a banking crisis starting<br />
Fraction of countries in a banking crisis<br />
0.14<br />
0.00 0.02 0.04 0.06 0.08 0.10 0.12 0.14<br />
0.12<br />
0.10<br />
0.08<br />
0.06<br />
0.04<br />
0.02<br />
0.00<br />
0.20<br />
0.00 0.05 0.10 0.15 0.20<br />
0.15<br />
0.10<br />
0.05<br />
0.00<br />
Fraser Institute ©2012 • www.fraserinstitute.org • www.freetheworld.com<br />
Figure 4.1: Countries with a banking crisis starting, by year<br />
1976 1978 1980 1982 1984 1986 1988 1990 1992 1994 1996 1998 2000 2002 2004 2006 2008<br />
Figure 4.2: Countries in banking crises, by year<br />
1976 1978 1980 1982 1984 1986 1988 1990 1992 1994 1996 1998 2000 2002 2004 2006 2008
9<br />
Average<br />
economic 7<br />
freedom<br />
5<br />
Average<br />
economic<br />
freedom<br />
Banking Crises and <strong>Economic</strong> <strong>Freedom</strong> • 205<br />
fraction of countries dealing with a crisis or its aftermath, 2008 stands out but it is<br />
a secondary peak compared to 1995.5 Also, 2006 stands out as the only year in the<br />
data set in which no country is in a banking crisis.<br />
We use the economic freedom index published in Gwartney, Lawson, and<br />
Hall (2011) and two of the subcomponent indices: credit-market regulation,<br />
and the soundness of money. Because evidence indicates that deposit insurance<br />
is linked to banking crises, we also use data from Demircüç-Kunt, Karacaovali,<br />
and Laeven (2005) and Barth, Caprio, and Levine (2008) on deposit insurance.<br />
Figures 4.3a, 4.3b, and 4.3c show the evolution of overall economic freedom from<br />
1975 to 2009. The horizontal axes shows the years in which economic freedom is<br />
available from 1975 to 2009. The vertical axes are identical, making it easier to compare<br />
across the figures showing economic freedom and the components.<br />
The indicators for regulation of the credit market and access to sound money<br />
provide insight in addition to what can be learned from overall economic freedom<br />
(Gwartney, Lawson, and Hall, 2011: Appendix). Fewer restrictions on the credit<br />
market are given a higher score in these data. This is consistent with this aspect of<br />
economic freedom increasing as the index increases in magnitude. We will use the<br />
5 Laeven and Valencia limited the length of crises to five years but then introduced immediately<br />
succeeding crises in Brazil in 1990 and Zaire in 1991. We code the crises with durations of nine<br />
years and eight years, respectively.<br />
9<br />
7<br />
5<br />
9<br />
Average<br />
economic<br />
freedom<br />
7<br />
5<br />
Figure 4.3a: Average economic freedom by year, 1975–2009<br />
1975 1985 1995 2001 2003 2005 2007 2009<br />
Figure 4.3b: Average economic freedom by year—credit market, 1975–2009<br />
1975 1985 1995 2001 2003 2005 2007 2009<br />
Figure 4.3c: Average economic freedom by year—sound money, 1975–2009<br />
1975 1985 1995 2001 2003 2005 2007 2009<br />
www.freetheworld.com • www.fraserinstitute.org • Fraser Institute ©2012
206 • <strong>Economic</strong> <strong>Freedom</strong> of the <strong>World</strong>: 2012 Annual Report<br />
<strong>Economic</strong> freedom<br />
10<br />
8<br />
6<br />
4<br />
2<br />
0<br />
Fraser Institute ©2012 • www.fraserinstitute.org • www.freetheworld.com<br />
term “credit market freedom” although this strains the use of the word “freedom.”<br />
The indicators included in the index for credit market freedom are: 1. private versus<br />
government ownership of banks; 2. approval of applications for competition<br />
by foreign banks; 3. government borrowing compared to private borrowing; and<br />
4. interest rate controls and the magnitude of negative real interest rates if present.<br />
The indicators included in the index for access to sound money include: 1. money<br />
growth; 2. the standard deviation of inflation; 3. the level of inflation in the most<br />
recent year; and 4. citizens’ freedom to own foreign bank accounts.<br />
Overall economic freedom is highest in the late 2000s after a gradual rise from<br />
1975 to 2000. Overall economic freedom increases relatively less than the more<br />
specific measures: economic freedom in the credit market and economic freedom<br />
in terms of having access to sound money.<br />
Figures 4.4a, 4.4b, and 4.4c provide a more detailed view of changes in economic<br />
freedom over time. Again, the scales are the same on the vertical and horizontal<br />
axes for each of the graphs. The vertical scales are different from those in<br />
figures 4.3a, 4.3b and 4.3c because there the means do not range from almost zero<br />
to almost 10, whereas the values for individual countries do vary over almost that<br />
wide a range. <strong>Economic</strong> freedom has increased on average and higher economic<br />
freedom is more typical in 2009 than in 1975. Some countries reach levels of economic<br />
freedom in 2009 not seen in 1975, and countries less commonly have levels<br />
of economic freedom in 2009 as low as the lowest levels in 1975. The figures show<br />
much more dispersion of credit market freedom and sound money than of overall<br />
economic freedom. This is not surprising because overall economic freedom is an<br />
average of many components including credit market freedom and access to sound<br />
money. It is clear that the increases in economic freedom in credit markets and<br />
Figure 4.4a: <strong>Economic</strong> freedom by year, 1975–2009<br />
1975 1980 1985 1990 1995 2000 2005
<strong>Economic</strong> freedom<br />
<strong>Economic</strong> freedom<br />
10<br />
8<br />
6<br />
4<br />
2<br />
0<br />
10<br />
8<br />
6<br />
4<br />
2<br />
0<br />
Banking Crises and <strong>Economic</strong> <strong>Freedom</strong> • 207<br />
Figure 4.4b: <strong>Economic</strong> freedom by year—credit market, 1975–2009<br />
1975 1980 1985 1990 1995 2000 2005<br />
Figure 4.4c: <strong>Economic</strong> freedom by year—sound money, 1975–2009<br />
1975 1980 1985 1990 1995 2000 2005<br />
www.freetheworld.com • www.fraserinstitute.org • Fraser Institute ©2012
208 • <strong>Economic</strong> <strong>Freedom</strong> of the <strong>World</strong>: 2012 Annual Report<br />
Fraser Institute ©2012 • www.fraserinstitute.org • www.freetheworld.com<br />
access to sound money occurred in no small part because the countries with the<br />
lowest scores have increased their scores substantially. This is less obviously correct<br />
for overall economic freedom.<br />
The trend of increasing economic freedom in these figures does appear to be<br />
loosely correlated with more countries being in banking crises in 2008, which is<br />
consistent with the conventional wisdom. On the other hand, it is not obvious that<br />
higher economic freedom is contributing to the banking crises across countries. A<br />
simple way to examine the relationship between economic freedom and banking<br />
crises is to classify countries based on their economic freedom and examine the frequency<br />
of banking crises for the levels of economic freedom. We use four categories<br />
for the freedom indices. The categories are:<br />
• High economic freedom = 8 ≤ economic freedom<br />
• High-medium economic freedom = 6 ≤ economic freedom < 8<br />
• Low-medium economic freedom = 4 ≤ economic freedom < 6<br />
• Low economic freedom = economic freedom < 4.6<br />
An observation is the five-year interval between each release of the freedom data<br />
from 1975 to 2005. For each observation, we calculate the number of countries in<br />
each category and whether the country is in a banking crisis in the five years after<br />
the observed level of economic freedom.7 Table 4.1 provides a summary of the data.<br />
The table shows the proportion of countries in a crisis by level of economic freedom.<br />
It suggests that more economic freedom is associated with a lower proportion of<br />
countries experiencing a banking crisis.<br />
We also examine the relationship between banking crises and deposit insurance.<br />
As indicated above, prior studies have found a relationship between banking crises<br />
and explicit deposit insurance. This can be interpreted as reflecting the effects of<br />
deposit insurance on banks’ riskiness. With deposit insurance, depositors are not<br />
as concerned about the risk on banks’ balance sheets. As a result, banks’ interest<br />
rates on deposits become less sensitive to the riskiness of banks’ activities and possible<br />
fall. If deposit insurance is associated with a higher likelihood of guarantees<br />
being provided to others providing funds to banks, the rates on those funds can<br />
become less sensitive to risk and possibly lower as well. These effects lower the cost<br />
of engaging in riskier activities, which can lead to banking crises, and banking crises<br />
become more likely. An alternative explanation of the relationship inverts the<br />
causality. Countries that are not likely to have a banking crisis also are not likely to<br />
create a deposit insurance program.<br />
The data on deposit insurance are easily summarized. Demircüç-Kunt,<br />
Karacaovali, and Laeven (2005) and Barth, Caprio, and Levine (2008) collected<br />
data on explicit government-provided deposit insurance across countries in 2003<br />
and 2008.8 There are 142 countries, 75 of which (52%) had deposit insurance in<br />
6 These four ranges are narrower than the three ranges in Gwartney, Holcombe, and Lawson, 2006.<br />
7 The exception is 2005, for which we have four years of economic freedom from 2006 to 2009.<br />
8 There are a few inconsistencies between the data sets. In addition, the data for 2003 include<br />
the year deposit insurance was adopted; the 2008 data do not. As a result, we had to determine<br />
adoption dates between 2003 and 2008. We adjusted the inconsistencies, determining that three<br />
countries did not have explicit deposit insurance from 1975 to 2008: the Dominican Republic,<br />
Sri Lanka, and Thailand.
Banking Crises and <strong>Economic</strong> <strong>Freedom</strong> • 209<br />
Table 4.1: <strong>Economic</strong> freedom rankings and the relative frequency<br />
of countries in banking crises<br />
Overall <strong>Economic</strong> <strong>Freedom</strong><br />
Number<br />
of observations<br />
Number of countries<br />
in banking crisis<br />
Proportion<br />
High 93 11 0.12<br />
High-middle 435 34 0.08<br />
Low-middle 358 47 0.13<br />
Low 95 23 0.24<br />
Credit Market <strong>Freedom</strong><br />
High 487 40 0.08<br />
High-middle 225 20 0.09<br />
Low-middle 154 24 0.16<br />
Low 213 35 0.16<br />
Access to Sound Money<br />
High 446 41 0.09<br />
High-middle 350 26 0.07<br />
Low-middle 179 22 0.12<br />
Low 121 30 0.25<br />
Note: This table shows the proportion of countries in banking crises by level of economic freedom for<br />
the three measures of economic freedom: overall economic freedom, credit market freedom, and access<br />
to sound money. <strong>Economic</strong> freedom is measured once every five years, from 1975 to 2005. For each level<br />
of overall economic freedom and the two components, the table shows the proportion of countries in a<br />
banking crisis in the subsequent five years.<br />
1975. No country dropped explicit deposit insurance from 1975 to 2009 and a few<br />
countries adopted it. Morocco adopted deposit insurance in 1996; Bolivia, in 2001;<br />
Armenia and Moldova, in 2005; and Hong Kong and Singapore, in 2006. This is a<br />
fairly small change in the percentage of countries with deposit insurance, an increase<br />
from 52% to 56%.9<br />
<strong>Economic</strong> freedom and the probability of having a banking crisis<br />
We examine the relationship between banking crises and economic freedom in more<br />
detail using a linear probability model and a probit model.10 Table 4.2 presents estimates<br />
from a simple regression of the indicator for banking crises on economic freedom<br />
and other variables. Estimates of statistical reliability are of uncertain value in<br />
9 The stability of the countries’ deposit insurance schemes indicates that dummy variables by<br />
country “explain” almost all the variation in deposit insurance across countries. This does not<br />
mean that including deposit insurance and dummy variables by country are the same because<br />
the coefficient of deposit insurance is assumed to be the same across all countries. It does mean<br />
that estimating the effect of deposit insurance in equations that include dummy variables by<br />
country is likely to be problematic.<br />
10 Logit estimates are similar.<br />
www.freetheworld.com • www.fraserinstitute.org • Fraser Institute ©2012
210 • <strong>Economic</strong> <strong>Freedom</strong> of the <strong>World</strong>: 2012 Annual Report<br />
Table 4.2: Linear probability regression estimates of effect of economic freedom on banking crises<br />
Overall <strong>Economic</strong> <strong>Freedom</strong> Credit Market <strong>Freedom</strong> Sound Money<br />
<strong>Economic</strong> freedom −0.032 *** −0.031 ** −0.017 −0.032 −0.013 *** −0.016 *** −0.012 −0.025 ** −0.022 *** −0.021 *** −0.015 * −0.017 **<br />
GDP growth −0.179 ** −0.141 −0.119 −0.019 −0.229 *** −0.177 ** −0.137 −0.020 −0.183 ** −0.141 −0.141 −0.056<br />
Deposit insurance 0.047 0.049 −0.066 −0.090 ** 0.041 0.044 −0.064 −0.087 ** 0.055 * 0.053 * −0.045 −0.075<br />
Constant 0.347 *** 0.240 *** 1.152 *** 1.028 0.252 *** 0.159 *** 0.131 0.093 0.299 *** 0.311 *** 0.062 −0.023<br />
Fixed effects<br />
Time No Yes No Yes No Yes No Yes No Yes No Yes<br />
Country No No Yes Yes No No Yes Yes No No Yes Yes<br />
R-squared 0.018 0.049 0.151 0.179 0.020 0.057 0.149 0.192 0.028 0.062 0.144 0.181<br />
№ of observations 747 747 747 747 780 780 780 780 792 792 792 792<br />
Note: The dependent variable equals one if the country experiences a banking crisis in the five-year interval and zero otherwise. The measures of<br />
economic freedom are the levels of overall economic freedom, credit market freedom, and access to sound money in the year before the five-year<br />
period covered by the crisis variable. GDP growth is the growth rate of real Gross Domestic Product in the five-year period before the five-year<br />
period covered by the crisis variable. Deposit insurance equals one if the country has explicit deposit insurance in the year in which economic<br />
freedom is measured and zero otherwise.<br />
*** denotes statistical significance at the 1% level; ** denotes statistical significance at the 5% level; and * denotes statistical significance at the 10% level.<br />
Fraser Institute ©2012 • www.fraserinstitute.org • www.freetheworld.com<br />
these estimates but the estimates are nevertheless informative about overall results<br />
before examining estimates from more complicated procedures.11 We use data that<br />
span five-year intervals except for the final period. <strong>Economic</strong> freedom is based on<br />
the values at five-year intervals from 1975 to 2005.<br />
The dependent variable indicates whether a country is in a banking crisis at any<br />
time in the following five years.12 A value of one indicates that the country is in<br />
a banking crisis for one or more years in that period. In separate equations, we<br />
use the three measures of economic freedom discussed in the prior section, the<br />
overall freedom index, credit market freedom, and access to sound money. Because<br />
it is commonly thought that large increases in asset prices often precede a banking<br />
crisis, whether or not those increases are bubbles, we include an indicator of<br />
growth, which is likely to be associated with increases in asset prices, namely the<br />
growth rate of real GDP in the prior five-year period.13 The equations include an<br />
11 A benefit of a linear probability model is the ease of assessing the effect of a change in the righthand-side<br />
variables, the effect being provided by the coefficients. In the next section, we use a probit<br />
model, which is more appropriate given a dependent variable equal to only one or zero. The coefficients<br />
of the probit model, though, do not themselves provide the marginal effects of changes in<br />
the right-hand-side variables and the marginal effects are different for every observation.<br />
12 Our data on banking crises end in 2008, which means the final data include only three years with<br />
banking crises. This shortened time scale is not likely to make a great deal of difference given<br />
that the period includes the Financial Crisis of 2007/08.<br />
13 To be more specific, an observation for a banking crisis between 1976 and 1980 includes the<br />
growth rate of real GDP from 1971 to 1975 on the right-hand side of the equation. We also<br />
estimated equations that include the level of real GDP in addition to these variables because<br />
economic and financial development might be related to the level of real GDP and economic
Banking Crises and <strong>Economic</strong> <strong>Freedom</strong> • 211<br />
indicator for whether or not a country has explicit deposit insurance, with the indicator<br />
taking the value of one if a country has explicit deposit insurance. The values<br />
of variables on the right-hand sides of the equations occur before the dating of a<br />
banking crisis, which reduces concern that estimates are affected by reverse causality.<br />
Finally, because world-wide developments in any given year—such as 2008—may<br />
be important, some estimated equations include dummy variables to indicate the<br />
year. Similarly, countries may have different average incidences of crises and other<br />
variables for reasons unrelated to the factors considered in the estimated equations.<br />
Some equations include dummy variables by country to allow for these different<br />
average values. We included these estimates for completeness but put less weight<br />
on them because the deposit insurance variable is almost perfectly correlated with<br />
the dummy variables for countries.<br />
The linear probability model indicates that a one-unit increase in the overall<br />
index of economic freedom is associated with a reduction of about three percentage<br />
points in the probability of there being in a banking crisis. Banking crises are<br />
not common—on average there is a 9% probability that a country will be in a<br />
banking crisis in a five-year period—and a one-unit increase in economic freedom<br />
implies a decrease of three percentage points in the probability.14 When we include<br />
year- and country-fixed effects, an increase in the overall freedom index is also<br />
associated with a decrease of three percentage points in the probability of there<br />
being a banking crisis; the effect, however, is imprecisely measured.15 An increase<br />
in the index for credit market freedom is associated with a reduction of about two<br />
percentage points in the probability of there being a banking crisis. The estimated<br />
results are similar when indicators are included for country and time. The evidence<br />
in the table indicates that higher GDP growth is associated with a lower probability<br />
of a banking crisis, if there is any relationship. This is consistent with an explanation<br />
of banking crises being the result of low growth but not necessarily supportive of<br />
an explanation based on extraordinary and unsustainable prosperity—“bubbles”<br />
or “credit booms.” The countries with explicit deposit insurance in table 4.2 hardly<br />
changed, suggesting there is limited evidence about deposit insurance in these data<br />
when dummy variables for each country are included in the estimates. In regressions<br />
without dummy variables by country, the estimates of deposit insurance’s<br />
coefficients are consistent with increases in deposit insurance increasing the probability<br />
of a banking crisis. The coefficients, however, also are imprecisely measured.<br />
On net, we interpret table 4.2 as providing some evidence that deposit insurance<br />
makes banking crises more likely.<br />
Table 4.3 presents the estimates of the effects of economic freedom on the probability<br />
of there being in a banking crisis in the next five years based on a probit model.<br />
The results in table 4.3 provide substantial support for an inverse relationship<br />
freedom. The estimated coefficients for economic freedom and their statistical signficance hardly<br />
change. The data for real GDP are from the <strong>World</strong> Bank Development Indicators Database<br />
online in early 2012.<br />
14 Of course, the linear model makes extrapolation difficult because at some point the probabilities<br />
will become negative or greater than one. The following probit analysis allows us to examine the<br />
effect of economic freedom at different levels without this problem.<br />
15 The errors in this equation are heteroskedastic, which implies standard errors of estimated<br />
coefficients are not consistently estimated and statements of statistical significance are at best<br />
approximate.<br />
www.freetheworld.com • www.fraserinstitute.org • Fraser Institute ©2012
212 • <strong>Economic</strong> <strong>Freedom</strong> of the <strong>World</strong>: 2012 Annual Report<br />
Table 4.3: Probit Estimates of Effect of <strong>Economic</strong> <strong>Freedom</strong> on Banking Crises<br />
Overall <strong>Economic</strong> <strong>Freedom</strong> Credit Market <strong>Freedom</strong> Sound Money<br />
<strong>Economic</strong> freedom −0.138 *** −0.144 ** −0.070 −0.155 −0.058 *** −0.073 *** −0.047 −0.130 ** −0.084 *** −0.083 *** −0.056 −0.049<br />
GDP growth −0.681 ** −0.061 −0.591 −0.133 −0.898 *** −0.63 ** −0.6663 −0.081 −0.704 * −0.505 −0.659 −0.218<br />
Deposit insurance 0.225 ** 0.234 * −0.275 −0.558 ** 0.129 0.215 −0.261 −0.527 * 0.246 * 0.230 * −0.198 −0.486 *<br />
Constant −0.220 −0.078 −0.567 0.186 −0.632 *** −0.398 0.622 0.158 −0.505 *** −0.377 *** −0.611 0.445<br />
Fixed effects<br />
Time No Yes No Yes No Yes No Yes No Yes No Yes<br />
Country No No Yes Yes No No Yes Yes No No Yes Yes<br />
Psuedo R-squared 0.021 0.064 0.064 0.134 0.023 0.074 0.066 0.149 0.036 0.078 0.075 0.135<br />
№ of observations 747 747 525 525 917 780 554 554 792 792 565 565<br />
Note: The dependent variable equals one if the country experiences a banking crisis in the five-year interval and zero otherwise. The measures of<br />
economic freedom are the levels of overall economic freedom, credit market freedom, and access to sound money in the year before the five-year<br />
period covered by the crisis variable. GDP growth is the growth rate of real Gross Domestic Product in the five-year period before the five-year<br />
period covered by the crisis variable. Deposit insurance equals one if the country has explicit deposit insurance in the year in which economic<br />
freedom is measured and zero otherwise.<br />
*** denotes statistical significance at the 1% level; ** denotes statistical significance at the 5% level; and * denotes statistical significance at the 10% level.<br />
Fraser Institute ©2012 • www.fraserinstitute.org • www.freetheworld.com<br />
between banking crises and economic freedom. Whether measured by overall economic<br />
freedom, credit market freedom, or access to sound money, higher economic<br />
freedom is associated with a lower probability of a banking crisis. The estimated<br />
effect of GDP growth is consistently negative although only statistically significant<br />
when economic freedom is measured by credit market freedom. The estimated<br />
coefficients for deposit insurance are positive but not statistically significant at the<br />
5% significance level when dummy variables for each country are excluded from<br />
the regressions. The point estimates are consistent with the possibility that deposit<br />
insurance increases the probability of a banking crisis but they also are consistent<br />
with no effect. Because probit estimates are nonlinear, the coefficients in table 4.3<br />
do not provide estimates of the marginal change in the probability of a banking crisis<br />
with increases in economic freedom.<br />
Table 4.4 presents estimates of the probability of a country being in a banking crisis<br />
for the four different levels of economic freedom: high, high-middle, low-middle,<br />
and low. These estimated probabilities are calculated from the probit estimates (columns<br />
2, 6, and 10 in table 4.3) using the coefficient estimates and the mean values of<br />
the right-hand-side variables for each the countries in each of the groups. Because<br />
deposit insurance is measured by a dummy variable, countries are classified into<br />
countries with and without deposit insurance and the table shows the probability of<br />
a banking crisis separately for countries that have deposit insurance and those that<br />
do not.16 These estimated probabilities should be roughly similar to the proportions<br />
16 In columns 2, 6, and 10, the statistical relationship between deposit insurance and the likelihood<br />
of a banking crisis is positive. This implies that having deposit insurance means a country is more<br />
likely to be in a banking crisis.
Banking Crises and <strong>Economic</strong> <strong>Freedom</strong> • 213<br />
Table 4.4: The probability of being in a banking crisis for different levels of economic freedom<br />
Overall <strong>Economic</strong> <strong>Freedom</strong> Index Credit Market Regulations Sound Money<br />
No deposit<br />
insurance<br />
Deposit<br />
insurance<br />
No deposit<br />
insurance<br />
Deposit<br />
insurance<br />
No deposit<br />
insurance<br />
Deposit<br />
insurance<br />
High economic freedom 0.079 0.117 0.097 0.137 0.091 0.132<br />
High-middle economic freedom 0.105 0.152 0.124 0.170 0.123 0.174<br />
Low-middle economic freedom 0.205 0.147 0.150 0.202 0.146 0.202<br />
Low economic freedom 0.209 0.279 0.210 0.273 0.220 0.289<br />
Note: This table shows the predicted probability of a country being in a banking crisis in a five-year period given the level of economic freedom and<br />
whether or not the country has deposit insurance and the average level of GDP growth in the prior five years.<br />
All estimates are statistically significant at the 5% significance level and most at the 1% significance level.<br />
in table 4.1.17 Table 4.4 shows that the relationship between economic freedom and<br />
the likelihood of a country being in a banking crisis can be important. For example, a<br />
country with high economic freedom and no deposit insurance on average has an 8%<br />
probability of having at least one year in a banking crisis in the following five years. A<br />
country with low economic freedom and no deposit insurance has a 21% probability<br />
of having a banking crisis. Deposit insurance itself increases the probability of being<br />
in a banking crisis given the level of economic freedom, consistent with the positive<br />
coefficients in the underlying probit estimates.<br />
Marginal probabilities, the effects of changes in the right-hand-side variables<br />
on the left-hand-side variables, also are of interest. Table 4.5 provides estimates of<br />
marginal probabilities for the four levels of economic freedom and for countries<br />
that have deposit insurance and those that do not. The estimates are based on the<br />
same estimated equations as table 4.4. The marginal probabilities presented in the<br />
table show the effect a one-unit change in economic freedom on the probability of<br />
being in a banking crisis. To calculate the response probabilities, we use the coefficient<br />
estimates from the probit equations and evaluate changes in the probabilities<br />
using the mean values of the right-hand-side variables. Unlike the linear probability<br />
model, the response probabilities from the probit estimates are nonlinear and differ<br />
depending on the level of economic freedom. Table 4.5 indicates that countries<br />
with low economic freedom experience the biggest decrease in the probability of<br />
being in a banking crisis when economic freedom increases by one unit. This relationship<br />
holds for all three measures of economic freedom, and deposit insurance<br />
enhances this effect.<br />
Banking crises and subsequent economic freedom<br />
After a banking crisis, does economic freedom increase or decrease? Casual observation<br />
of experience since the Financial Crisis of 2007/08 suggests that economic<br />
freedom declines. Table 4.6 presents estimates for banking crises from 1976 to 2005.<br />
These estimates use the measures of economic freedom on the left-hand sides of<br />
regressions and an indicator of whether the country is in a banking crisis in prior<br />
years. We use an indicator for whether the country was in a banking crisis at any<br />
17 The growth of real GDP and dummy variables for years effects account for the largest part of the<br />
difference.<br />
www.freetheworld.com • www.fraserinstitute.org • Fraser Institute ©2012
214 • <strong>Economic</strong> <strong>Freedom</strong> of the <strong>World</strong>: 2012 Annual Report<br />
Table 4.5: The estimated change in the probability of a banking crisis for an increase<br />
in economic freedom by unity<br />
Overall <strong>Economic</strong> <strong>Freedom</strong> Index Credit Market Regulations Sound Money<br />
No deposit<br />
insurance<br />
Deposit<br />
insurance<br />
Table 4.6: Banking crises and subsequent economic freedom<br />
Dependent Variable Overall <strong>Economic</strong> <strong>Freedom</strong> Credit Market <strong>Freedom</strong> Sound Money<br />
Banking crisis −0.413 *** −0.400 *** −0.267 *** −0.232 *** −0.721 *** −0.595 *** −0.425 *** −0.291 ** −1.025 *** −0.975 *** −0.735 *** −0.667 ***<br />
Banking crisis lagged −0.230 * −0.365 * 0.148 0.009 −0.060 *** −0.232 0.525 ** 0.361 ** −0.666 *** −0.865 *** −0.028 −0.203<br />
Constant 6.196 *** 5.505 *** 7.454 6.146 *** 6.930 *** 5.451 *** 9.287 *** 6.612 *** 7.234 *** 6.864 *** 8.518 *** 7.033 ***<br />
Fixed effects<br />
Time No Yes No Yes No Yes No Yes No Yes No Yes<br />
Country No No Yes Yes No No Yes Yes No No Yes Yes<br />
R-squared 0.015 0.190 0.551 0.772 0.008 0.197 0.462 0.665 0.030 0.147 0.399 0.546<br />
№ of observations 855 855 855 855 872 872 872 872 877 877 877 877<br />
Note: The dependent variable is economic freedom measured at five-year intervals starting in 1980 and ending in 2005. The measures of economic<br />
freedom are the levels of overall economic freedom, credit market freedom, and access to sound money. The dummy variable for a banking crisis<br />
equals one if there is a banking crisis in the prior five years and equals zero otherwise. The lagged value is an indicator for a banking crisis six to ten<br />
years before the measured level of economic freedom.<br />
*** denotes statistical significance at the 1% level; ** denotes statistical significance at the 5% level; and * denotes statistical significance at the 10% level.<br />
Fraser Institute ©2012 • www.fraserinstitute.org • www.freetheworld.com<br />
No deposit<br />
insurance<br />
Deposit<br />
insurance<br />
No deposit<br />
insurance<br />
Deposit<br />
insurance<br />
High economic freedom −0.020 −0.027 −0.012 −0.015 −0.013 −0.017<br />
High-middle economic freedom −0.032 −0.025 −0.014 −0.018 −0.016 −0.020<br />
Low-middle economic freedom −0.032 −0.039 −0.016 −0.019 −0.018 −0.022<br />
Low economic freedom −0.039 −0.046 −0.020 −0.023 −0.023 −0.027<br />
Note: This table shows the marginal effect of a change in economic freedom on the probability of being in a banking crisis in the subsequent five years<br />
given the level of economic freedom, whether or not the country has deposit insurance and the average level of GDP growth in the prior five years.<br />
All estimates are statistically significant at the 5% significance level and most at the 1% significance level.<br />
time in the previous five years. The effect of a crisis may continue for more than<br />
five years, and we also include an indicator for whether the country was in a banking<br />
crisis six to 10 years ago. We present estimates with and without indicators for<br />
the years and countries.<br />
The evidence is unequivocal. <strong>Economic</strong> freedom decreases after a financial crisis.<br />
The effect is largest for access to sound money. The estimated change in access to<br />
sound money varies from a high of one index point to a low of two thirds of a point,<br />
which is a tight range given the variability evident in figures 4.3 and 4.4. The index for<br />
sound money reflects four equally weighted components: 1. money growth; 2. the<br />
standard deviation of inflation; 3. the level of inflation in the most recent year; and 4.<br />
citizens’ freedom to own foreign bank accounts. The change in one or more of these<br />
components is substantial. Credit market freedom also falls, indicating that our result<br />
for overall economic freedom is not solely due to effects on access to sound money.
Banking Crises and <strong>Economic</strong> <strong>Freedom</strong> • 215<br />
Our results are different from those in the last part of the paper by de Haan,<br />
Sturm, and Zandbergde (2009). They find that economic freedom falls in the year<br />
after banking crises but is higher five years later. Our results are for five-year periods<br />
only, and we find that economic freedom is lower. There are some differences in the<br />
specifications that may affect the results.18 Perhaps most importantly, they include<br />
the lagged value of economic freedom on the right-hand sides of the equations and<br />
include dummy variables for countries. There is a large literature on estimators of<br />
dynamic panel models such as these that indicates that such estimates are problematic.<br />
Rather than deal with these complicated problems directly, we do not include<br />
lagged values of economic freedom in the estimated equations. While not fully satisfactory<br />
either, our relatively simple estimates by ordinary least squares are likely<br />
to recover the sign if not the magnitude of the long-run effects of banking crises.<br />
Conclusion<br />
The financial crisis that began in many countries has yet to run its course completely<br />
in 2012. A financial crisis that began in banks and financial markets has become a<br />
sovereign-debt crisis, partly due to ensuing deficits associated with severe recessions,<br />
partly due to obligations associated with bailouts of financial institutions, and partly<br />
due to extravagant increases in government spending. While a final summary of this<br />
financial crisis cannot yet be written, past financial crises can be informative about<br />
what might be expected if this one follows a course similar to those in the past.<br />
Our results from that crisis and prior ones indicate that higher economic freedom<br />
is associated with a lower probability of a banking crisis. And the effect is<br />
substantial. This is the opposite of what may well be conventional wisdom: “deregulation”<br />
or economic freedom more generally made the financial crisis more likely.<br />
Our results indicate this conventional wisdom is incorrect. More economic freedom<br />
makes banking crises such as the recent one less likely.<br />
Given this result, it seems at best odd that lowering economic freedom is the<br />
common reaction to a crisis. If lower economic freedom makes a financial crisis<br />
more likely, responding to a crisis by lowering economic freedom makes a subsequent<br />
crisis more likely, not less. One reaction would be simply to assert that politicians<br />
and citizens are stupid or irrational and be satisfied with this explanation.<br />
We think such a reaction is not warranted and is less informative than examining<br />
developments in more detail. Our results indicate that access to sound money is<br />
most adversely affected by banking crises, and this may well reflect higher inflation<br />
or restricted access to foreign exchange. Our results also indicate that credit market<br />
regulation increases after a financial crisis. These changes and possibly changes in<br />
other components of economic freedom are associated with lower overall economic<br />
freedom. Further research on these issues will be quite informative about responses<br />
to financial crises.<br />
18 A superficial difference is de Haan et al.’s (2009) use of the change in economic freedom as the<br />
dependent variable and the lagged level of economic freedom on the right-hand side of their<br />
equations and our use of the level of economic freedom on the left-hand side and the lagged<br />
level on the right-hand side, but this only affects the estimated coefficient of lagged economic<br />
freedom by a linear transformation. Our estimated coefficients on lagged economic freedom are<br />
comparable to their coefficients plus unity.<br />
www.freetheworld.com • www.fraserinstitute.org • Fraser Institute ©2012
216 • <strong>Economic</strong> <strong>Freedom</strong> of the <strong>World</strong>: 2012 Annual Report<br />
References<br />
Fraser Institute ©2012 • www.fraserinstitute.org • www.freetheworld.com<br />
Baier, Scott L., Gerald P. Dwyer, and Robert Tamura (2004). Does Opening a<br />
Stock Exchange Increase <strong>Economic</strong> Growth? Journal of International Money and<br />
Finance 23 (April): 311–331.<br />
Barth, James R., Gerard Caprio, Jr., and Ross Levine (2004). Bank Regulation<br />
and Supervision: What Works Best? Journal of Financial Intermediation 13, 2<br />
(April): 205–248.<br />
Barth, James R., Gerard Caprio, Jr., and Ross Levine (2008). Bank Regulations<br />
Are Changing: For Better or Worse? Unpublished paper. <strong>World</strong> Bank.<br />
Beltratti, Andrea, and René Stulz (2012). The Credit Crisis around the Globe:<br />
Why Did Some Banks Perform Better? Journal of Financial <strong>Economic</strong>s (in press).<br />
Bekaert, Geert, Campbell R. Harvey, and Christian Lundblad (2005). Does<br />
Financial Liberalization Spur Growth? Journal of Financial <strong>Economic</strong>s 77 ( July):<br />
3–55.<br />
De Haan, Jakob, Jan-Egbert Sturm, and Eelco Zandberg (2009). The Impact of<br />
Financial and <strong>Economic</strong> Crises on <strong>Economic</strong> <strong>Freedom</strong>. In James D. Gwartney,<br />
Robert Lawson, with Joshua C. Hall, eds., <strong>Economic</strong> <strong>Freedom</strong> of the <strong>World</strong>: 2009<br />
Annual Report (Fraser Institute): 25–36.<br />
Demircüç-Kunt, Asli, and Enrica Detragiache (1998). The Determinants of<br />
Banking Crises in Developing and Developed Countries. IMF Staff Papers 45<br />
(March): 81–109.<br />
Demircüç-Kunt, Asli, Baybars Karacaovali, and Luc Laeven (2005). Deposit<br />
Insurance around the <strong>World</strong>: A Comprehensive Database. Unpublished paper.<br />
<strong>World</strong> Bank.<br />
Edwards, Sebastian (2007). Capital Controls, Sudden Stops, and Current Account<br />
Reversals. In Capital Controls and Capital Flows in Emerging Economies: Policies,<br />
Practices, and Consequences (National Bureau of <strong>Economic</strong> Research): 73–120.<br />
Glick, Reuven, and Michael Hutchinson (2005). Capital Controls and Exchange<br />
Rate Instability. Journal of International Money and Finance 24, 3: 357–412.<br />
Gwartney, James, Randall G. Holcombe, and Robert Lawson (2006). Institutions<br />
and the Impact of Investment on Growth. Kyklos 59, 2 (May): 255–273.<br />
Gwartney, James, Robert Lawson, and Joshua Hall (2011). <strong>Economic</strong> <strong>Freedom</strong> of<br />
the <strong>World</strong>: 2011 Annual Report. Fraser Institute.<br />
Johnson, William F. (2011). International <strong>Economic</strong> <strong>Freedom</strong>s, Banks and the<br />
Market Crisis of 2007–2009. Journal of Banking Regulation 12, 3: 195–209.
Banking Crises and <strong>Economic</strong> <strong>Freedom</strong> • 217<br />
Mishkin, Frederic S. (1999). Lessons from the Asian Crisis. Journal of<br />
International Money and Finance 18, 4: 709–723.<br />
Rancière, Romain, Aaron Tornell, and Frank Westermann (2008). Systemic<br />
Crises and Growth. Quarterly Journal of <strong>Economic</strong>s 108 (February): 359–406.<br />
Reinhart, Carmen M., and Kenneth Rogoff (2009). This Time It Is Different: Eight<br />
Centuries of Financial Folly. Princeton University Press.<br />
Shehzad, Choudhry Tanveer, and Jakob De Haan (2008). Financial<br />
Liberalization and Banking Crises. Unpublished paper. University of Groningen.<br />
www.freetheworld.com • www.fraserinstitute.org • Fraser Institute ©2012
Fraser Institute ©2012 • www.fraserinstitute.org • www.freetheworld.com
Chapter 5 Does Aid Buy (<strong>Economic</strong>) <strong>Freedom</strong>?<br />
Axel Dreher and Kai Gehring*<br />
1 Introduction<br />
Consider Tanzania. In the period from 1960 to 1980, donors supported Tanzania’s<br />
inward-oriented policy stance with substantial amounts of aid. According to<br />
Edwards, “aid agencies were heavily involved in supporting (and even helping<br />
design) [Tanzanian President] Nyerere’s ujamaa Socialism economic policies”<br />
(2012: 3). In the early 1980s, the donor community changed gears. As the<br />
Tanzanian government did not agree on more market-friendly policies, aid amounts<br />
were substantially reduced in the period from 1981 to 1985. In the following years,<br />
“the international community continued to use development assistance as a tool to<br />
induce change and guide policy. When the reforms stalled, the donors would withhold<br />
aid flows” (Edwards 2012: 4). In the mid-1980s, the government finally gave in<br />
and implemented more market-friendly economic policies that led to a substantial<br />
increase in development aid.<br />
Anecdotes like these on the role of foreign aid in restricting or promoting<br />
market-liberal reforms abound, often with contradictory conclusions.1 Does aid buy<br />
freedom? Alternatively, does it restrict freedom? While anecdotes can provide illustrative<br />
examples, evidence that is more systematic is needed to gauge the roles of<br />
aid in affecting economic freedom. Such evidence is scarcer, but exists. Boockmann<br />
and Dreher (2003) report that the number of <strong>World</strong> Bank projects increases economic<br />
freedom, while the effect of the amount of <strong>World</strong> Bank credits on economic<br />
freedom appears to be negative. They find no clear relationship between loans and<br />
programs of the IMF and economic freedom. Regarding bilateral aid, Heckelman<br />
and Knack (2008) find that aid reduces freedom, but only up until the 1990s.<br />
Building on these first empirical tests, a number of additional papers investigated<br />
the role of aid in changing (economic) freedom. The hypotheses tested stress the<br />
effect of money being disbursed, the conditionality of aid, moral hazard, and the<br />
* Axel Dreher is from Heidelberg University; Kai Gehring, from the University of Göttingen. Parts<br />
of this article are based on joint work with Bernhard Boockmann, Martin Gassebner, Roland<br />
Hodler, Sarah Rupprecht, and Roland Vaubel. We thank Jamie Parsons for proofreading. Cite<br />
this chapter: Dreher, Axel, and Kai Gehring (2012). Does Aid Buy (<strong>Economic</strong>) <strong>Freedom</strong>? In<br />
James Gwartney, Robert Lawson, and Joshua Hall, <strong>Economic</strong> <strong>Freedom</strong> of the <strong>World</strong>: 2012 Annual<br />
Report (Fraser Institute): 219–246.<br />
1 See Hodler and Dreher, 2012 for further examples.<br />
www.freetheworld.com • www.fraserinstitute.org • Fraser Institute ©2012
220 • <strong>Economic</strong> <strong>Freedom</strong> of the <strong>World</strong>: 2012 Annual Report<br />
Fraser Institute ©2012 • www.fraserinstitute.org • www.freetheworld.com<br />
potential for donors to be used as scapegoats.2 The literature, however, does not<br />
converge to a unique (or conclusive) answer as to whether aid does affect economic<br />
freedom, and to what extent. Authors come to opposing conclusions, sometimes<br />
using similar data and methods, sometimes deviating from the previous literature<br />
without setting their results in the perspective of previous work. This chapter evaluates<br />
the evolving empirical literature on foreign aid and economic freedom.<br />
Before turning to the evidence, we discuss the hypotheses proposed in the previous<br />
literature. Our evaluation of the empirical evidence tries to gauge whether the<br />
literature has, overall, established the role of foreign aid in promoting or preventing<br />
economic freedom. Arguably, this is an important question. First, economic<br />
freedom could be considered a value in itself. Second, economic freedom contributes<br />
directly to important aims that donors want to achieve when they give aid.<br />
<strong>Economic</strong> freedom increases economic growth (De Haan et al., 2006; Berggren,<br />
2003; Carlsson and Lundström, 2002; De Haan and Sturm, 2000), investment rates<br />
(Dawson, 2003), improves health and prevents disease (Stroup, 2007), leads to<br />
higher ranks on the Human Development Index (Norton, 1998; Goldsmith, 1997)<br />
and higher subjective well-being (Gehring, 2012). Even if aid does not directly<br />
increase economic growth, it could contribute to growth indirectly via the positive<br />
effect of increased economic freedom on growth.3<br />
The literature does not provide strong support for this hypothesis. It shows that<br />
aid promotes freedom only in certain areas. Moreover, the effect of aid is more positive<br />
since the end of the Cold War-period. The aim of this chapter is to highlight<br />
the main areas of difficulty in assessing this impact to guide future research in its<br />
attempts to answer this question. We argue that a well-defined framework for assessment<br />
needs to be constructed, tested, and consistently used in order to make comparisons<br />
between research in this area easier and more conclusive.<br />
2 The hypotheses<br />
Foreign aid may influence the recipient country’s economic freedom in a number<br />
of ways. First, there is the direct impact of the aid money. The availability of foreign<br />
aid for public investment projects ensures that the investment (or any other<br />
expenditure) can be carried out without the need to raise taxes (Vasquez, 1998), in<br />
effect increasing economic freedom directly if funding the investment would otherwise<br />
require an increase in tax revenue. Aid going to governments can however<br />
2 These aspects apply to donors to different degrees. Prior to 1990, aid was largely used for strategic<br />
purposes. US aid aimed to develop military relationships, the British and French governments<br />
tried to maintain their influence on former colonies, and German and Japanese aid aimed<br />
to promote economic interests (Lancaster, 2007). These strategic interests have not disappeared<br />
with the end of the Cold War, but their importance might be smaller (Bermeo, 2008). Some but<br />
not all countries tie their aid to formal conditions. Since the Maastricht Treaty, provision of aid<br />
by the European Union and its member states is conditional on the presence of human rights,<br />
democracy, and low military expenditures. Since 1990, the United States’ USAID has made its<br />
aid conditional on democratic and governance reforms (Crawford, 2001). Many bilateral donors<br />
also make their aid disbursements on the condition that <strong>World</strong> Bank or IMF conditions have<br />
been met (White and Dijkstra, 2003). Koeberle, 2004 gives an overview of conditions included<br />
in <strong>World</strong> Bank lending; see Dreher, 2009 on the IMF; and Oehler et al., 2012 on the United<br />
States’ Millennium Challenge Corporation.<br />
3 On the effect of aid on growth, see Doucouliagos and Paldam, 2009 and Nowak-Lehmann et al.,<br />
2012, among many others.
Does Aid Buy (<strong>Economic</strong>) <strong>Freedom</strong>? • 221<br />
strengthen their role relative to the private sector (Friedman, 1958). It might contribute<br />
to increased central planning, forced collectivization, and the public takeover<br />
of foreign enterprises instead of encouraging private entrepreneurship (Bauer,<br />
1991). The money available to governments can also deteriorate the quality of legal<br />
security and regulation by making rent-seeking more attractive and increasing corruption<br />
(Svensson, 2000). Foreign aid thus can also reduce economic freedom.<br />
A second channel is conditionality, where donors directly tie the disbursement<br />
of money to certain conditions. Aid might be “remarkably effective if it induces governments<br />
to adopt growth-inducing and poverty-reducing policies. This is indeed<br />
the core of what conditionality is supposedly about—aid buys reform” (Collier,<br />
1997). In this context, the effect of aid on freedom depends on whether donors<br />
condition their aid on changes in economic freedom and the extent to which recipients<br />
implement these conditions. Most of the literature concludes, however, that<br />
conditionality has failed.4 But, even if there is no immediate success and recipients<br />
do not implement all conditions as negotiated, aid programs may still affect policies<br />
over time. Recipients need to implement some conditions to get access to the<br />
aid money, and governments in need of continuous support might be reluctant to<br />
overturn such changes after they received the money. In the longer run, the introduction<br />
of reforms might create enough support for their maintenance. Interest<br />
groups representing the net beneficiaries might defend those reforms even in the<br />
absence of further conditionality.5<br />
Besides the direct “carrot-and-stick” effect of money and conditionality, there<br />
are also more informal channels through which a donor may influence policies in<br />
recipient countries (Boockmann and Dreher, 2003). The inclusion of conditionality<br />
may start a process of negotiations between the donor and national actors<br />
during the period of aid transfers, especially if some slippage from agreed targets<br />
occurs. On one hand, negotiations may turn the balance in favor of reformers in<br />
the domestic political game (Haggard and Webb, 1994). On the other hand, the<br />
donors’ programs may increase awareness of the relevance of economic imbalances<br />
and, therefore, help to bring about a different approach to policy. They may also<br />
make the necessity of reaching consensus over the measures demanded by conditionality<br />
obvious to otherwise opposing social groups (Drake, 1998; Ratnam, 1996).<br />
Consequently, the donor may reinforce a liberal consensus in the recipient countries.<br />
The impact of the donor on domestic policies may even come about without<br />
formal conditionality at all (Boockmann and Dreher, 2003). Policy advice may<br />
strengthen reformers within the recipient countries. If the interests of governments<br />
and interest groups are heterogeneous in the recipient country, a donor can provide<br />
leverage by changing the incentives of the government in a way that affects what<br />
interest groups offer in the bargaining process (Dreher, 2009). Moreover, because<br />
of a lack of expertise in economic policy areas, some countries lack the capacity to<br />
implement comprehensive market-liberal reforms. In this case, aid programs negotiated<br />
with the donor may not actually impose unwanted conditionality but rather<br />
provide welcome advice.<br />
4 See Oehler et al., 2012 for a short summary.<br />
5 This assumes an asymmetry in the lobbying capacity of interest groups in introducing reforms<br />
and in defending them: “For the initiator [of a new system] has the enmity of all who would<br />
profit by the preservation of the old institution and merely lukewarm defenders in those who<br />
would gain by the new ones,” Machiavelli, The Prince (1513); cited in Feinberg, 2006.<br />
www.freetheworld.com • www.fraserinstitute.org • Fraser Institute ©2012
222 • <strong>Economic</strong> <strong>Freedom</strong> of the <strong>World</strong>: 2012 Annual Report<br />
Fraser Institute ©2012 • www.fraserinstitute.org • www.freetheworld.com<br />
The transfer of knowledge may take very different routes that are only loosely<br />
connected with specific instruments of the donor (Boockmann and Dreher, 2003).<br />
One example of leverage of a donor on national policies is the influence of senior<br />
officials who were educated in the universities of donor countries or have been<br />
staff members of donor aid agencies. These officials may have the ability to contribute<br />
to changing attitudes and steering policy change. In almost all developing<br />
countries, several senior economic officials have spent time as staff members of the<br />
IMF, the <strong>World</strong> Bank, or a regional development bank. Conversely, there may also<br />
be a transfer of knowledge from recipient countries to the donor. Higher involvement<br />
could help the donor learn more about conditions in the particular country.<br />
Consequently, aid relationships improve. Therefore, money disbursed by the donors<br />
may, in the long run, be less important than training and socialization, which can<br />
change the attitudes of political actors and influence the domestic debate regarding<br />
adjustment policies.<br />
When conditions (and less formal channels of influence) fail to produce the<br />
desired results, subsidized credits may give rise to moral hazard. They may soften the<br />
need for reforms during economic crises and enable inefficient structures to survive.<br />
If donors are perceived as disbursing aid according to financing needs, potential<br />
recipients have an incentive to appear needy. They might reduce domestic investment<br />
or purposely delay reform in order to remain eligible for aid (Harms and Lutz,<br />
2004; Easterly, 2002; Vaubel, 1990). Even if governments are unlikely to provoke<br />
a crisis deliberately, they might reduce precautionary measures if they are eligible<br />
for donor support. Furthermore, if foreign aid can be interpreted as income insurance<br />
against adverse shocks, it might induce the potential recipients to lower their<br />
precautions against such damages (Dreher and Vaubel, 2004).<br />
In a wider sense, moral hazard might result in an incentive to abuse aid disbursements<br />
after a crisis occurs. This kind of behavior is not necessarily prevented by the<br />
donor’s (ex post) conditionality (Dreher and Vaubel, 2004).6 Governments may<br />
agree only formally to the attached conditions and circumvent the program’s spirit<br />
with countervailing measures not covered under the program (Heckelman and<br />
Knack, 2008). In addition, turning the argument concerning the checks and balances<br />
in domestic politics upside down, the government’s increased leeway may result in an<br />
inability to persuade pressure groups as to the necessity of fiscal stringency.<br />
In summary, there is a diversity of channels for the possible effects of aid on freedom<br />
and it seems difficult to find equivalents for them in terms of observable variables.<br />
According to the arguments above, the number of aid programs or projects<br />
in operation increases the pressure for reforms. This is due either to the direct effect<br />
of conditionality on policies, or to the transfer of knowledge and advice, which<br />
increases with the number of contacts between a recipient country and the donor<br />
(Boockmann and Dreher, 2003). Contacts should be measured directly in order<br />
to distinguish between conditionality, transfer of knowledge, and other informal<br />
effects, but as yet the data to do so do not exist.<br />
6 Note that the terms ex ante and ex post conditionality are used in the literature in different ways. In<br />
the Public Choice literature, ex ante refers to the time before a country turns to international institutions,<br />
notably the IMF, for financial assistance (e.g., Vaubel, 1991; Meltzer, 2006). Typical ex ante<br />
conditions suggested in the literature include responsible fiscal and monetary policies and sound<br />
financial systems. Ex post conditionality refers to conditions negotiated after a country has turned to<br />
the IMF. Examples are reductions in the government’s deficit or in the rate of monetary expansion.
Does Aid Buy (<strong>Economic</strong>) <strong>Freedom</strong>? • 223<br />
Capturing the softening of the budget constraint and other adverse effects requires<br />
the inclusion of financial variables. To ensure that the variable containing the financial<br />
flows from the donor to the country reflects the softening of the budget constraint and,<br />
hence, reduced pressure on the government for reform, net credit amounts should<br />
be used to test for the effect of this channel. In principle, the amount of aid a country<br />
receives may also be a proxy for the direct effect of conditionality on national policies<br />
(Boockmann and Dreher, 2003). However, conditions and credit volumes need not<br />
be proportional, and some conditions are included in almost all programs. Thus, the<br />
number of arrangements concluded may be a better measure for donor conditionality<br />
than the flow of finances. Controlling for the programs in operation, the amount of<br />
credit could increase economic freedom (if it finances required public goods and supports<br />
reform-oriented groups), have no measurable effect, or reduce reform efforts (if<br />
the effect of a softening of the budget constraint or increased rent-seeking prevails).<br />
3 Empirical evidence<br />
Figure 5.1 shows average yearly Official Development Aid (ODA) disbursements in<br />
constant 2009 US$ over the period from 1980 to 2008.7 Figure 5.2 shows changes<br />
in economic freedom over the same period derived from <strong>Economic</strong> <strong>Freedom</strong> of the<br />
<strong>World</strong>: 2010 Annual Report (Gwartney et al., 2010). Darker colors indicate higher levels<br />
of aid received and more positive changes in economic freedom. To ensure clarity<br />
we only display the changes in economic freedom for those countries receiving aid.<br />
It is not surprising that aid disbursements have been largest in Africa and Latin<br />
America, but they have also been sizable in Asia and Eastern Europe. Improvements<br />
in economic freedom roughly display the same pattern. There is, however, no obvious<br />
relation between the two. Take Bolivia as an example. Bolivia received large<br />
amounts of aid while its economic freedom has improved substantially. By contrast,<br />
Chile received little aid but also experienced a large increase in freedom. In Africa,<br />
some major aid recipients like Zimbabwe, Mali, or Niger experienced reduced freedom.<br />
In other examples, large inflows of aid were associated with large increases in<br />
economic freedom (for instance, Madagascar, Uganda, and Zambia).<br />
Figures 5.3 and 5.4 restrict the sample to the period after the Cold War. The<br />
end of the Cold War arguably had a large impact on economic freedom and<br />
the way foreign aid was allocated (Alesina and Dollar, 2000). In the 1980s, the<br />
import-substitution paradigm was replaced by the Washington consensus, which<br />
emphasized free trade and liberalization. Hodler and Dreher (2012) show that<br />
donors allocate more money to countries that follow the prevailing aid paradigms.<br />
Openness as measured by the Sachs-Warner Index reduces aid over the period from<br />
1960 to 1970 (significant at the 10% level), and has a negative but marginally insignificant<br />
effect from 1970 to 1980. From 1980 to 1990 the effect is not significant at<br />
conventional levels, while over the period from 1990 to 2000 openness increases<br />
aid receipts on average, significant at the 5% level. Hence, the change in donors’ aid<br />
allocation policies reflects the change in paradigms.<br />
7 The OECD’s Development Assistance Committee (DAC) collects these data from the donors.<br />
The DAC defines aid as net financial flows to countries on its list of ODA recipients and to<br />
certain multilateral institutions and NGOs, including technical cooperation. The DAC only<br />
includes aid that is concessional—that is, consists of grants or loans with a grant share of at least<br />
25%— and excludes military aid. ODA excludes most IMF lending and about two thirds of the<br />
<strong>World</strong> Bank’s loans (Heckelman and Knack, 2008).<br />
www.freetheworld.com • www.fraserinstitute.org • Fraser Institute ©2012
224 • <strong>Economic</strong> <strong>Freedom</strong> of the <strong>World</strong>: 2012 Annual Report<br />
Figure 5.1: Average yearly aid/GDP disbursements, 1980–2008<br />
0.0002, 0.0055<br />
0.0055, 0.0230<br />
0.0230, 0.0949<br />
0.0949, 0.4200<br />
Data omitted<br />
Source: OECD DAC statistics, 1960-2010, DAC2a ODA Disbursements, downloaded as ready-made le from<br />
, as of February 2012.<br />
Figure 5.2: Changes in economic freedom, 1980–2008<br />
-1.9937, 0.7235<br />
0.7235, 1.3285<br />
1.3285, 1.9480<br />
1.9480, 3.9858<br />
Data omitted<br />
Source: Gwartney et al., 2010 (<strong>Economic</strong> <strong>Freedom</strong> of the <strong>World</strong>: 2010 Annual Report).<br />
Fraser Institute ©2012 • www.fraserinstitute.org • www.freetheworld.com<br />
If donors used aid to promote economic freedom starting in the 1980s only,<br />
there is no reason to expect a positive correlation between the two in the Cold War<br />
period. The figures, however, show no clear pattern for the period after the Cold<br />
War either. For example, out of the major aid recipients in Africa in the post-Cold-<br />
War period, Niger, the Central African Republic, Togo, and Senegal, all exhibit large<br />
declines in economic freedom while others like Zambia, Tanzania, and Uganda<br />
showed strong improvements. Clearly, aid is only one factor among many that can<br />
influence changes in economic freedom. Correlations between aid and freedom<br />
could suggest a relationship between these two but do not imply causality. For<br />
example, donors can allocate aid specifically to reward economically free countries,<br />
or give it to countries with decreasing freedom because these are most in need of aid.<br />
In order to investigate the causal effect of aid on freedom (or changes in freedom)
Figure 5.3: Average yearly aid/GDP disbursements, 1990–2008<br />
0.0001, 0.0054<br />
0.0054, 0.0177<br />
0.0177, 0.0904<br />
0.0904, 0.3819<br />
Data omitted<br />
Source: OECD DAC statistics, 1960-2010, DAC2a ODA Disbursements, downloaded as ready-made le from<br />
, as of February 2012.<br />
Figure 5.4: Changes in economic freedom, 1990–2008<br />
-1.1558, 0.4670<br />
0.4670, 1.0849<br />
1.0849, 1.6085<br />
1.6085, 4.1208<br />
Data omitted<br />
Source: Gwartney et al., 2010 (<strong>Economic</strong> <strong>Freedom</strong> of the <strong>World</strong>: 2010 Annual Report).<br />
Does Aid Buy (<strong>Economic</strong>) <strong>Freedom</strong>? • 225<br />
we need to account for the endogeneity of aid and control for other potentially<br />
influential variables. The following section reviews the existing empirical literature,<br />
first focusing on the effect of aid on overall economic freedom and then looking at<br />
individual components of economic freedom. The Appendix (pg. 271 ff.) summarizes<br />
the results.8<br />
8 The Appendix covers studies that use economic freedom as a dependent variable. That includes<br />
the overall index, but also individual dimensions like the rule of law or size of government. While<br />
corruption and other dimensions of governance can also be considered measures of economic<br />
freedom, the relation is less direct. We discuss selected studies using such variables but the<br />
survey is not exhaustive and we do not cover these studies in the Appendix. We admit that this<br />
choice can sometimes appear arbitrary.<br />
www.freetheworld.com • www.fraserinstitute.org • Fraser Institute ©2012
226 • <strong>Economic</strong> <strong>Freedom</strong> of the <strong>World</strong>: 2012 Annual Report<br />
3.1 The effect of aid on overall economic freedom<br />
When investigating the impact of aid on economic freedom, researchers need to<br />
address a number of critical choices. Most obviously, economic freedom needs to<br />
be measured and quantified. To do so, researchers can choose between two aggregate<br />
indices and various indicators focusing on individual dimensions of economic<br />
freedom. The Heritage Foundation has published its Index of <strong>Economic</strong> <strong>Freedom</strong> on<br />
an annual basis since 1995 (Miller and Holmes, 2011). Given the comparably short<br />
time-frame covered and the interest of economists in longer-term analyses, this<br />
index is not widely used. The indicator of choice in the bulk of the literature is the<br />
Fraser Institute’s index published in <strong>Economic</strong> <strong>Freedom</strong> of the <strong>World</strong> by Gwartney et<br />
al. (1996–2011).9 For both indices, the time lag between the data collection and the<br />
year indicated in the published index differs across countries (Cummings, 2000)<br />
and, therefore, interpreting short-term changes from one year to the next is difficult.<br />
Overall, the index from the Fraser Institute’s <strong>Economic</strong> <strong>Freedom</strong> of the <strong>World</strong> (EFW<br />
index) has several advantages over the Heritage’s Index of <strong>Economic</strong> <strong>Freedom</strong> (IEF<br />
index), including the practical advantage of its wider availability; it has been available<br />
in five-year intervals since 1970 and on an annual basis since 2000. A second<br />
important advantage of the EFW index is the transparency regarding its calculation<br />
and the data sources used for calculating the index. Because the methodology is<br />
made public and can easily be replicated, manipulations (for example, for ideological<br />
reasons) are unlikely (Paldam, 2003). Third, the EFW index uses reliable and<br />
widely used data sources like the <strong>World</strong> Bank and the IMF, and relies on objective<br />
data instead of subjective judgments whenever possible. When objective judgments<br />
are impossible—on perceptions of judicial independence, for example—the EFW<br />
index is transparent about the origin of surveys and questions used therein. As has<br />
been pointed out in the literature, Heritage’s Index of <strong>Economic</strong> <strong>Freedom</strong> lacks transparency,<br />
theoretical foundation, and frequently changes the method underlying its<br />
index (Quinn et al., 2011; Cummings, 2000). Nevertheless, the two indices are<br />
highly correlated (e.g., rho ≈ 0.8 in Gehring, 2012).<br />
The Fraser Institute’s index of economic freedom can be decomposed into its<br />
components to get a more nuanced view of specific changes. Included are several<br />
indicators from other institutions that can be used to proxy the individual items.<br />
Important data sources include the <strong>World</strong> Bank, the International Monetary Fund,<br />
the <strong>World</strong> Trade Organization, the <strong>World</strong> <strong>Economic</strong> Forum, and the International<br />
Country Risk Guide (ICRG). Obviously, there are also other indicators, which<br />
are not part of the Fraser Institute’s EFW index, but may still provide important<br />
information. Morley et al. (2003), for instance, provide indicators about structural<br />
reform specifically for Latin America. Plenty of indicators are available to measure<br />
the freedom of flows of capital and trade (Rose, 2004; Quinn et al., 2011).<br />
Generally, using individual dimensions enables researchers to derive more specific<br />
policy implications rather than focusing on aggregate indices. While investigating<br />
the effect of aid on overall economic freedom is important, in order to identify individual<br />
transmission channels, more precise and specific indicators or components<br />
are preferable. Some of the individual indicators are available on a yearly basis for<br />
a longer time period than the overall index. For instance, regarding the freedom to<br />
invest, indicators based on the IMF’s Annual Report on Exchange Arrangements and<br />
9 See the Publishing History of <strong>Economic</strong> <strong>Freedom</strong> of the <strong>World</strong> on page 309 for a full list of preparatory<br />
studies and annual reports.<br />
Fraser Institute ©2012 • www.fraserinstitute.org • www.freetheworld.com
Does Aid Buy (<strong>Economic</strong>) <strong>Freedom</strong>? • 227<br />
Exchange Restrictions are available on a yearly basis since 1965 (de jure indicators)<br />
and 1970 (de facto indicators) (Quinn et al., 2011), providing researchers with the<br />
opportunity to look at long-term developments.<br />
While most of the earlier literature investigates the level of economic freedom,<br />
using first differences might be preferable. Investigating whether aid triggers economic<br />
reform is better captured by looking at how it affects changes in freedom<br />
in subsequent periods. As past levels determine subsequent levels of freedom<br />
(Coviello, 2006), regression-toward-the-mean effects are likely. Moreover, high<br />
freedom in one period could lead to large improvements in subsequent periods.<br />
Conversely, if economic reforms are politically costly, achieving further reforms<br />
might be less likely when countries have already achieved a high level of economic<br />
freedom (Bearce and Tirone, 2010; Heckelman and Knack, 2008). To capture these<br />
effects, regression equations that want to measure the effect of aid on freedom have<br />
to include the initial level of economic freedom also.<br />
Of similar importance in choosing how to measure economic freedom is the<br />
choice of the type of aid to be investigated. Aid can be classified by its source, that is,<br />
the type of donor, which could be either bilateral or multilateral; official or private;<br />
or all donors of one category rather than selected donors only. Different donors pursue<br />
different (aid) policies. Some donors grant aid mainly for political reasons (see<br />
Dreher et al., 2009a; Dreher et al., 2009b; Kilby, 2011), and the motive for granting<br />
aid can influence the effect of the aid given (Kilby and Dreher, 2010). Some donors<br />
put more emphasis on economic freedom than others. For example, the United<br />
States and the <strong>World</strong> Bank are strong supporters of market-liberal policies (Hodler<br />
and Dreher, 2012), and condition their aid on them. Other donors are arguably<br />
more reluctant to support economic freedom, in particular non-traditional donors<br />
granting aid outside the Development Assistance Committee (DAC), like China.10<br />
Researchers also face the decision whether to measure aid in terms of commitments<br />
or disbursements. Commitments are usually disbursed in the recipient country<br />
over several years. Hence, they measure when and how much aid is assigned,<br />
and might be more suitable in investigating the determinants of governments’ aid<br />
allocation decisions (given that disbursements depend on factors beyond the<br />
control of the governments and are determined by commitments made over an<br />
extended period before aid is actually given, so timing is more difficult to measure).<br />
Disbursements capture the flows that eventually reach the recipient country<br />
and are, therefore, the variable of choice to assess the effects of aid on them.<br />
Roodman (2007) suggests Effective Development Assistance (EDA) as an alternative<br />
to Official Development Aid (ODA). EDA contains the sum of grants and<br />
the grant element of the loans rather than all loans with a certain grant element,<br />
and excludes technical assistance (Coviello, 2006). This measure thus captures the<br />
net aid resources that actually flow into the recipient country more accurately.11<br />
Because of some limitations on the data, EDA has only been available since 1975.<br />
It is important to note that ODA excludes most IMF lending and about two-thirds<br />
of the <strong>World</strong> Bank’s loans (Heckelman and Knack, 2008). The aid measure typically<br />
used in the literature also excludes aid by non-DAC countries, which can be<br />
10 See Dreher and Fuchs, 2011 for an investigation of China’s aid policies and Fuchs and Vadlamannati,<br />
2012 on India. Dreher et al., 2011 covers a large sample of “new” donors.<br />
11 On the other hand, the non-grant element of a loan can also be consequential for economic<br />
freedom.<br />
www.freetheworld.com • www.fraserinstitute.org • Fraser Institute ©2012
228 • <strong>Economic</strong> <strong>Freedom</strong> of the <strong>World</strong>: 2012 Annual Report<br />
Fraser Institute ©2012 • www.fraserinstitute.org • www.freetheworld.com<br />
substantial for some countries. Given that aid by new donors, for example, could be<br />
given to counteract the effects of DAC aid in buying reforms, omitting them potentially<br />
biases the results.<br />
The specific type of aid delivery can also influence the effect of aid on economic<br />
freedom. Program aid is used more often than other forms of aid to encourage reforms<br />
(Heckelman and Knack, 2008) and thus, potentially, has a greater influence on economic<br />
freedom. Project aid is less likely to have such effects. The effects of short- and<br />
long-term aid might also differ (Clemens et al., 2012), and aid given for specific areas,<br />
or with different type of concessionality (i.e., the degree to which the terms are more<br />
favorable than commercial terms), might be more effective in targeting freedom than<br />
others. These possible differences in effects are largely ignored by the existing literature.<br />
Finally, the researcher has to decide on the period of study, the choice of control<br />
variables, and the strategy to deal with the obvious problem of endogeneity. Regarding<br />
the period of study, choices are mostly driven by the availability of data. However, the<br />
end of the Cold War marks an obvious turning point. Consequently, some studies<br />
analyze the post-Cold-War period separately. Given the variability of the prevailing<br />
aid paradigm, and the associated changes in donors’ aid policies over time (Hodler<br />
and Dreher, 2012), one can hardly expect a meaningful result when investigating the<br />
period from 1975 to 2005 in total, for example.12 Therefore, choosing a shorter period<br />
of time, defined by the prevailing aid paradigm, would arguably lead to clearer results.<br />
The choice of control variables when there is no underlying theoretical model<br />
poses particular difficulties. Ad-hoc choices can affect the results and raise doubts<br />
regarding the reliability of the results. The Appendix shows that, while GDP and<br />
GDP growth are included in all studies, there is considerable disagreement over the<br />
additional control variables. Only those results that turn out to be robust regarding<br />
reasonable changes in the set of control variables contribute to our level of knowledge.<br />
Finally, and obviously, simply regressing freedom on aid, even controlling for<br />
some confounding factors, is not likely to produce meaningful results. The potential<br />
endogeneity or simultaneity of aid needs to be taken into account.<br />
Bilateral aid<br />
While some papers investigating the effect of aid on economic freedom are careful<br />
in addressing the choices outlined above, the results of some others can be questioned.<br />
For instance, Powell and Ryan (2006) investigate the period from 1970 to<br />
2000, using overall aid (ODA) as their variable of interest. Their specification does<br />
not show robust results. Given the large variations in policies across donors and<br />
over time, this result is not surprising. The overall (insignificant) effect could be the<br />
result of a negative effect during the import-substitution development paradigm of<br />
the 1970s and a positive effect during the period of the Washington consensus thereafter.<br />
It could also be confounded by the opposing effects of donors with a greater<br />
focus on freedom compared to donors who do not condition aid at all, or even supported<br />
more inward-looking policies. Powell and Ryan do not use instruments for<br />
aid, so reversed causality and omitted variable bias could affect their correlations.<br />
Heckelman and Knack (2008) improve the analysis on several fronts. They use a<br />
larger set of control variables, instruments for aid to explain the change in economic<br />
freedom over the period from 1980 to 2000, investigate several types of aid, and<br />
12 The prevailing development paradigm of the 1970s was the import-substitution paradigm with<br />
its associated inward-looking policies.
Does Aid Buy (<strong>Economic</strong>) <strong>Freedom</strong>? • 229<br />
investigate the period after the Cold War separately. Their results show that economic<br />
freedom decreases with aid overall, and also when separately investigating project aid,<br />
program aid, and technical assistance. As instruments for aid, they use initial levels<br />
of life expectancy, sectorial composition of the economy, and population size. The<br />
first two components proxy recipient countries’ need. Aid per capita decreases with<br />
population if donors want to spread their aid across many recipients to increase their<br />
national prestige. Empirically, this motivation can be questioned, as there are quite a<br />
few countries that focus their aid on specific countries, for example, on former colonies<br />
(Lancaster, 2007), rather than spreading it across a large number of countries.<br />
While Heckelman and Knack (2008) report that all instruments are individually significant<br />
at conventional levels and together explain almost half of the variance in aid,<br />
they do not report more specific tests for the quality of their instruments. Theoretically,<br />
it is possible that these instruments in themselves cause changes in economic freedom<br />
directly. They use lower life expectancy to proxy need but low life expectancy could<br />
also affect the need for reforms. Sectorial composition is measured by the share of<br />
the economy made up by the agriculture and manufacturing sectors. This is argued to<br />
be relevant as both groups might lobby for protectionist measures, but one might be<br />
more successful in restricting economic freedom in its favor than the other group. In<br />
this case, the size of each sector’s respective share of GDP also has a direct influence<br />
on the probability of changes in economic freedom. Farmers, for instance, might form<br />
effective lobbying groups as they have rather homogenous interests with concentrated<br />
benefits (Olson, 1965). Regarding population, it could be argued that smaller countries<br />
have been exposed to comparatively larger competitive pressure in the third wave<br />
of globalization since 1980. Because of a lack of domestic economies of scale, smaller<br />
countries have had to liberalize more to grow (Alesina, 2003).<br />
Heckelman and Knack (2008) investigate the 1980s and 1990s separately. While<br />
freedom decreases with aid in the 1980s, aid does not significantly affect economic<br />
freedom in the 1990s. This is what one would expect given that the bulk of donors<br />
supported an inward-looking development paradigm until the early- to mid-1980s<br />
(Hodler and Dreher, 2012). Jointly investigating aid by donors in support of liberal<br />
policies with donors more in favor of inward-looking policies (or those who do not<br />
tie aid to policy reform) makes it difficult to identify significant results.<br />
Knedlik and Kronthaler (2007) and Bearce and Tirone (2010) investigate what<br />
affects changes in freedom. Bearce and Tirone’s panel data analysis uses lagged flows<br />
of aid to investigate subsequent changes in economic freedom. They find that aid<br />
had no effect in the period from 1975 to 1990, at conventional levels of significance.<br />
In the period after the Cold War, they find that freedom increased with aid. In an<br />
attempt to alleviate the potential endogeneity problem, Bearce and Tirone replicate<br />
the analysis exclusively focusing on countries that did not introduce reforms in the<br />
previous period, confirming their results. Knedlik and Kronthaler estimate similar<br />
models for the period from 1995 to 2004, but investigate the contemporaneous<br />
rather than the lagged effect of ODA. They measure economic freedom using the<br />
Heritage Foundation’s Index of <strong>Economic</strong> <strong>Freedom</strong> (IEF index) rather than the EFW<br />
index from the Fraser Institute’s <strong>Economic</strong> <strong>Freedom</strong> of the <strong>World</strong> and do not find an<br />
effect at conventional levels of significance.13<br />
13 Dreher and Rupprecht (2007) include an overall aid measure in their analysis of IMF programs<br />
on economic reforms and find that overall aid does not have an effect on changes in economic<br />
freedom, at conventional levels of significance.<br />
www.freetheworld.com • www.fraserinstitute.org • Fraser Institute ©2012
230 • <strong>Economic</strong> <strong>Freedom</strong> of the <strong>World</strong>: 2012 Annual Report<br />
Fraser Institute ©2012 • www.fraserinstitute.org • www.freetheworld.com<br />
Taken together, these studies provide some preliminary evidence that aid<br />
increases economic freedom in the post-Cold-War period when freedom is measured<br />
by the EFW index (but not when it is measured by the IEF index). Whether<br />
these differences in results are indeed due to the different measures of freedom,<br />
the different set of variables the studies control for, the assumed timing of how aid<br />
affects freedom, or the specific periods the studies investigate, is an interesting question<br />
that cannot conclusively be answered by the existing literature. Furthermore,<br />
the literature does not attempt to shed light on the different potential channels by<br />
which aid could affect freedom. Hence, its usefulness for deriving specific implications<br />
for policy is limited.<br />
Multilateral aid<br />
Turning to multilateral aid, Boockmann and Dreher (2003) provide a starting point.<br />
They try to separate the channels by which aid could affect freedom with respect to<br />
IMF and <strong>World</strong> Bank loans. They suggest including the flow of funds and the number<br />
of programs negotiated with the IMF and the <strong>World</strong> Bank at the same time. The<br />
flow of monetary resources is measured with the change in the stock of outstanding<br />
IMF and <strong>World</strong> Bank loans. They use net rather than gross flows because payments<br />
and repayments both affect the government’s budget constraint. If the variable containing<br />
the financial flows from international financial institutions to the country<br />
is to reflect the softening of the budget constraint and, hence, the reduced pressure<br />
on the government to implement reforms, net amounts are preferable. Boockmann<br />
and Dreher use the number of programs that were active over at least five months<br />
in a given calendar year.14<br />
The results in Boockmann and Dreher (2003) suggest that the activities of the<br />
<strong>World</strong> Bank affect the level of economic freedom, while those of the IMF do not.<br />
<strong>Economic</strong> freedom increases with the number of <strong>World</strong> Bank projects and decreases<br />
with the volume of credits. Controlled for the number of projects, the sum of <strong>World</strong><br />
Bank credits measures the average size of the projects in a particular country and<br />
year. Taken together, <strong>World</strong> Bank projects seem productive of “good” economic policies<br />
unless they become too large. As outlined above, a positive effect of aid could<br />
occur via information transmission, training, and supporting reformers. These positive<br />
effects can turn negative if the adverse incentives created by continuously providing<br />
large sums of money to recipient governments prevail.<br />
Overall, the analysis suggests a differentiated picture, where the total effect of<br />
aid depends on whether aid is given by the <strong>World</strong> Bank or the IMF, and the specific<br />
combination of the number of projects and amounts of aid. Rather than investigating<br />
the period after the end of the Cold War separately, Boockmann and Dreher<br />
include a dummy for it. It is, thus, not possible to see whether the effect of aid has<br />
changed with the end of the Cold War. They also investigate levels, rather than<br />
changes in economic freedom and do not use external instruments. Their instrumentation<br />
strategy is based on internal instruments in a difference GMM estimation<br />
setup (following Arellano and Bond, 1991). This estimator however frequently<br />
produces instable results. There is little theoretical guidance on how to choose the<br />
matrix of instruments, and the results frequently depend on this choice.<br />
14 For the <strong>World</strong> Bank, part of these data were lacking so they use the number of programs and<br />
projects negotiated instead.
Does Aid Buy (<strong>Economic</strong>) <strong>Freedom</strong>? • 231<br />
Dreher and Rupprecht (2007) and Knedlik and Kronthaler (2007) focus on<br />
changes in economic freedom as the dependent variable but do not try to separate<br />
different channels of influence by donors and only investigate the IMF. Both<br />
studies find that IMF involvement reduces economic freedom. While Dreher<br />
and Rupprecht show that IMF programs reduce economic freedom, Knedlik and<br />
Kronthaler report similar results for IMF disbursements using changes in the<br />
Heritage Foundation’s IEF index rather than the Fraser Institute’s EFW index. The<br />
estimated effect of the IMF in Dreher and Rupprecht is sizable: over a five-year<br />
period, one IMF program reduces the EFW index by 0.22 to 0.83 points, on average.<br />
Given the average yearly change of 0.2 points across the sample, this is a substantial<br />
impact, which could result from the softening of the budget constraint due<br />
to support from the IMF.<br />
Overall, there is some evidence in support of the claim that the IMF reduces economic<br />
freedom. According to Knedlik and Kronthaler (2007), however, the effect is<br />
not significant when a comprehensive set of control variables is included. Moreover,<br />
Knedlik and Kronthaler do not attempt to use instruments for aid to correct for the<br />
possibility of endogeneity. They use the Heritage Institute’s IEF index, which has<br />
the advantage of being available annually since 1995. Still, it is methodologically<br />
unwise to focus on yearly changes of freedom: the effect of aid on freedom can<br />
hardly be expected to be immediate and the underlying data used to construct the<br />
indices do not sharply refer to one particular year. Dreher and Rupprecht (2007)<br />
alleviate this problem by using 5-year instead of 1-year intervals. They do not, however,<br />
control for the size of programs. Therefore, a more detailed assessment of the<br />
channels through which aid reduces economic freedom is not possible with the<br />
existing studies.<br />
3.2 The effect of aid on individual dimensions of economic freedom<br />
A number of studies investigate the effect of aid on individual dimensions of economic<br />
freedom. The Fraser Institute’s EFW index covers the size of government and<br />
taxation, private property and the rule of law, soundness of money, trade regulation<br />
and tariffs, regulation of business, and labor and capital markets. The Heritage<br />
Foundation’s IEF index examines freedom in ten categories: business, trade, fiscal<br />
burden, government spending, monetary policy, investment, finance, labor, as well<br />
as secure property rights and absence of corruption. When investigating individual<br />
dimensions of freedom, some researchers use the sub-indices provided in the EFW<br />
and IEF indexes, while others investigate the effect of aid focusing on selected variables<br />
taken from their original sources.15<br />
The following section begins with a discussion of the evidence regarding the<br />
effects of bilateral aid on economic freedom, including its effects on governance, the<br />
size of specific sectors of the economy, corruption, the size of government, and the<br />
costs of trade. Thereafter, we turn to the effects of multilateral aid.<br />
Bilateral aid<br />
Bräutigam (2000) investigates the effect of aid on governance. She uses the qualityof-governance<br />
index from the International Country Risk Guide (ICRG) for the<br />
period from 1982 to 1995 and finds a negative relation to bilateral aid. This finding<br />
15 We do not cover studies investigating the effect of aid on democracy, which can be considered<br />
as one aspect of economic freedom, but predominantly belongs to the area of political freedom.<br />
www.freetheworld.com • www.fraserinstitute.org • Fraser Institute ©2012
232 • <strong>Economic</strong> <strong>Freedom</strong> of the <strong>World</strong>: 2012 Annual Report<br />
Fraser Institute ©2012 • www.fraserinstitute.org • www.freetheworld.com<br />
is supported by Knack (2001) and Bräutigam and Knack (2004), who also use the<br />
ICRG data and find that higher ODA is associated with larger declines in the quality<br />
of governance. Rajan and Subramanian (2007) show that governance-dependent<br />
industries grow more slowly in countries that receive large amounts of aid. Busse<br />
and Gröning (2009) use a composite governance indicator, computed with ICRG<br />
data. Using system GMM and a panel that consists of 106 countries for the period<br />
from 1984 to 2004, the effect of ODA on governance is robustly negative throughout<br />
their regressions.<br />
More directly related to economic freedom is Rajan and Subramanian (2011).<br />
They argue that manufacturing industries, particularly the traded-goods sector, are<br />
subject to high international competitive pressure. Hence, this sector is a strong<br />
political force pushing governments to pursue liberal economic policies. If aid is<br />
supposed to increase economic freedom, it should come with an increase in the<br />
share that these industries have in the economy. Their results show, however, that<br />
aid reduces the share of manufacturing. One reason they suggest for this is Dutch<br />
Disease, according to which inflows of aid cause a real exchange-rate appreciation<br />
through rising wages in the affected sectors. Rajan and Subramanian (2011) show<br />
that ODA reduces the share of labor-intensive and tradable industries compared<br />
to other industries, which are less likely to be affected by aid inflows. Nevertheless,<br />
the relation of these industries to economic freedom is not entirely clear. Industries<br />
under competitive pressure might also push for supporting measures like export<br />
subsidies, which undermine economic freedom.<br />
Corruption can be more directly related to decreases in economic freedom. In<br />
the Fraser Institute’s EFW index, it affects the legal-structure component, the security<br />
of property rights, and parts of business regulation. The literature on aid and<br />
corruption has not converged to a commonly accepted result. Tavares (2003) uses<br />
the ICRG indicator of perceived corruption for a panel of non-OECD recipients<br />
with 200 observations and finds that bilateral aid significantly decreases corruption,<br />
at the 5% level. The effect is larger when he uses the inverse of the bilateral distance<br />
to the donor and three dummy variables for common land border, same majority<br />
religion, and same official language as instruments for aid. The result is in line with<br />
Alesina and Weder (2002), who suggest that increases in aid tend to be associated<br />
with an increase in corruption. Svensson (2000) presents similar results for ethnically<br />
diverse recipient countries in which social groups compete over commonpool<br />
resources.<br />
More recently, Okada and Samreth (2012) support this finding for a sample of<br />
120 developing countries for the period from 1995 to 2009. Okada and Samreth<br />
measure corruption using the <strong>World</strong>wide Governance Indicators (Kaufmann, Kraay,<br />
and Mastruzzi, 2009) that capture perceptions of how much public power is exercised<br />
for private gains. This study concludes that aid reduces corruption overall,<br />
significant at the 1% level, an effect that is stronger in countries with already lower<br />
levels of corruption. The effect of aid on corruption, however, depends on the donor.<br />
For example, Japanese aid was shown to reduce corruption, while aid from the<br />
United Kingdom and the United States increased corruption. These results point<br />
to the importance of disaggregated analyses. Clearly, countries differ in the degree<br />
to which they provide aid for strategic purposes or attach conditions to their aid.<br />
Empirically, it seems hard to justify pooling all donors and restricting the coefficient<br />
of aid on freedom to be the same. These findings thus highlight the importance of<br />
a more nuanced look at the origin of aid in future research.
Does Aid Buy (<strong>Economic</strong>) <strong>Freedom</strong>? • 233<br />
In addition to the origin of aid, its destination also seems to matter. Asongu<br />
(2012) focuses on Africa, where the negative effect of ODA on corruption does<br />
not hold, based on regressions for 52 countries in the period from 1996 to 2010.<br />
His dependent variables are the “control of corruption” index from the <strong>World</strong> Bank<br />
and the “corruption perception” index from Transparency International. He uses<br />
contemporaneous rather than lagged values of aid and levels instead of changes in<br />
economic freedom. His use of yearly data instead of longer-term averages makes<br />
the results prone to short-term economic fluctuations. Asongu employs the system<br />
GMM estimator to address the endogeneity of aid and alternatively uses legal origin,<br />
income levels, and religious denominations as external instruments. These variables<br />
could well be directly related to corruption levels, however. Both sets of regressions<br />
show similar results: When the sample is restricted to sub-Saharan Africa, ODA<br />
increases corruption.<br />
Another important component of economic freedom is the size of government.<br />
Using data from the <strong>World</strong> Development Indicators for the period from 1970 to<br />
1999, Remmer (2004) finds that bilateral aid increases government spending as a<br />
share of GDP, significant at the 5% level. He does not address the potential endogeneity<br />
of aid. The robustness of the positive relation between aid and government<br />
spending is supported by the results of an Extreme Bound Analysis (EBA), which<br />
tests for the sensitivity of the impact of aid towards changes in the set of control variables.<br />
With the data in Remmer (2004), it is not possible to distinguish government<br />
spending on infrastructure from those on consumption, whose effects on economic<br />
freedom might arguably differ. Boone (1996) separates the two. He finds that aid<br />
increases government consumption, but not investment. His sample, however, only<br />
extends until 1990, the end of the Cold War.<br />
Regarding freedom to trade, Cali and te Velde (2011) assess the effect of bilateral<br />
aid on the costs of trade, taken from the <strong>World</strong> Bank’s “Doing Business Indicators.”<br />
Rather than looking at aggregate measures, Cali and te Velde focus on the effect<br />
of a particular type of aid (aid for trade) on a particular area of economic freedom<br />
(freedom to trade). Their fixed-effects estimations include a time trend, which captures<br />
country-specific trends in trade costs. As instruments for aid, they use political<br />
proximity measured by the voting similarity between donor and recipient in the<br />
United Nations General Assembly (UNGA) and the degree of civil liberties. Their<br />
results suggest that this type of aid reduces trading costs. The data refer to a comparably<br />
short period of time (2005–2009), however, and the use of 1-year periods<br />
does not allow them to evaluate the more interesting medium- to long-term consequences<br />
of aid. Still, if at least parts of aid are not fungible, their approach of looking<br />
at specific types of aid rather than all aid, and linking it to a specific outcome might<br />
more easily allow detecting causal effects, which might be blurred when using more<br />
aggregate measures.<br />
The effect of bilateral aid on regulation was examined in Kilby (2005), using<br />
the respective component of the Fraser Institute’s EFW index for the period from<br />
1975 to 1995. Kilby uses the levels of the regulation component and finds that<br />
EDA reduces the regulatory burden. He uses contemporaneous values of aid and<br />
levels of aid and regulation. The recipient’s population size is used as an instrument<br />
for aid; the time dimension of the data is not accounted for. His results are<br />
disputed by Coviello and Islam (2006), who show that the level and changes in<br />
ODA as a percentage of GDP reduce legal security and property rights (at the<br />
10% level) and increase regulation (at the 1% level) in the period from 1970 to<br />
www.freetheworld.com • www.fraserinstitute.org • Fraser Institute ©2012
234 • <strong>Economic</strong> <strong>Freedom</strong> of the <strong>World</strong>: 2012 Annual Report<br />
Fraser Institute ©2012 • www.fraserinstitute.org • www.freetheworld.com<br />
2000. They address potential endogeneity by using the system GMM estimator<br />
and alternatively use a comprehensive set of external instruments following Rajan<br />
and Subramanian (2005).<br />
Coviello and Islam (2006) show that other dimensions of economic freedom—<br />
bureaucratic quality, law and order, risk of expropriation, repudiation risk, and<br />
corruption (taken from the ICRG)—are not robustly affected by aid. The robust<br />
relationship of aid on regulation might imply that aid enables governments to<br />
enlarge their influence on the economy. Legal security can be negatively affected if<br />
large amounts of aid encourage rent seeking and criminal activities.<br />
Ear (2007) also focuses on regulatory quality (and political stability). He finds<br />
that ODA reduces regulatory quality and political stability in the period from 1996<br />
to 2004, significant at the 5% level. More aid can increase the probability of military<br />
coups and civil wars, as it makes holding government more attractive (de Ree<br />
and Nillesen, 2009). While the effect of aid on regulation and stability prevails in<br />
a cross-sectional analysis only, the negative effect of aid on the rule of law remains<br />
significant at the 10% level in a fixed-effects panel specification, using infant mortality<br />
as an instrument for aid. As Ear (2007) describes for the case of Cambodia,<br />
ill-suited legal advice by foreign experts without detailed knowledge about the<br />
recipient country might deteriorate the rule of law. Existing traditional land-use<br />
systems could, for example, be replaced by more complicated laws. This can provide<br />
an opportunity for the well-informed and better-connected to exploit the poor who<br />
cannot afford legal advice.<br />
Multilateral aid<br />
In assessing the effects of multilateral aid on economic freedom, Boockmann and<br />
Dreher (2003) examine each component of the Fraser Institute’s EFW index in<br />
isolation. Their motivation is that the <strong>World</strong> Bank and the IMF only include some<br />
of the components of the overall index as conditions for granting new loans, while<br />
other components are never made a condition. In relation to the composite freedom<br />
index, the absence of an effect of IMF involvement, for instance, may simply<br />
mean that the EFW index does not appropriately represent the policy goals<br />
of the IMF, rather than being evidence for the ineffectiveness of the Fund. Hence,<br />
there might be an effect on some areas of economic freedom but not on others.<br />
Boockmann and Dreher’s results for the components, however, are similar to the<br />
findings for the composite index. In cases where the effects are significant, <strong>World</strong><br />
Bank credit is in most cases negatively correlated with economic freedom, the only<br />
exception being the use of non-tariff restraints. <strong>World</strong> Bank credit was shown to<br />
have a significantly negative effect on three sub-indexes for the whole period and<br />
on eleven sub-indexes after 1990. It appears that <strong>World</strong> Bank money induces countries<br />
to have less private ownership of banks, and a higher level and standard deviation<br />
of inflation. For the IMF, Dreher (2005) found arrangements under the IMF<br />
Standby and Extended Fund Facility to have a strong negative effect on the rate of<br />
monetary growth for the pre-1990 period. Such a decline in monetary growth is<br />
usually followed by lower inflation, which effectively increases economic freedom.<br />
When Boockmann and Dreher (2003) look at the post-1990 period separately, policies<br />
concerning the freedom to own currency accounts abroad, the black-market<br />
premium, private ownership rights, enforcement of contracts, as well as policies<br />
concerning the financial system are all influenced in the “wrong” direction by the<br />
amount of <strong>World</strong> Bank credit.
Does Aid Buy (<strong>Economic</strong>) <strong>Freedom</strong>? • 235<br />
The number of <strong>World</strong> Bank programs, however, increases economic freedom,<br />
in particular for the category of variables relating to the legal system (only in the<br />
1990s).16 These topics are frequently covered under the Bank’s structural conditionality.<br />
The number of programs are also found to increase the difference between the<br />
official and the black-market exchange rate. Although the Bank does not directly<br />
condition its loans on exchange-rate devaluations, some adjustment programs aim<br />
at liberalizing the exchange rate. Consequently, overvalued currencies may devalue,<br />
which decreases the black market premium (and increases economic freedom ratings).<br />
The <strong>World</strong> Bank’s activities are also related to the use of conscripts in national<br />
defense forces (which is rather surprising), and interest-rate controls (only for the<br />
1990s). Hence, the overall effect of a <strong>World</strong> Bank presence in a country negatively<br />
depends on the amount of credit, and positively depends on the number of programs.<br />
Arguably, the number of programs can increase the extent of conditionality<br />
and the amount of contact between donors and recipients, and thus aid the transfer<br />
of knowledge.<br />
Dreher and Rupprecht (2008) focus on changes in economic freedom and the<br />
average number of IMF programs in the previous five-year period. According to<br />
their results, the number of programs has no significant impact on the size of government<br />
and access to sound money. This might be due to the potential positive<br />
effects that are achieved by privatization and other conditions, which are curbed<br />
by adverse effects like the softening of the budget constraint. IMF programs, however,<br />
significantly prevent reforms of the legal structure and security of property<br />
rights, with a coefficient significant at least at the 5% level. When the endogeneity of<br />
IMF programs is taken into account (via system GMM estimation), IMF programs<br />
also delay reforms of exchanges with foreigners, at the 5% level of significance. As<br />
for regulation of credit, labor, and business, the negative coefficient is marginally<br />
insignificant once controlled for economic growth and significant at the 5% level<br />
otherwise (estimated with Feasible GLS). In other words, according to Dreher and<br />
Rupprecht the overall effect of the IMF on economic freedom is negative in some<br />
important areas.<br />
Mukherjee and Singer (2010), report a positive effect of IMF loans on capital<br />
account liberalization, measured by a continuous index derived from four indicators<br />
reported in the IMF’s Annual Report on Exchange Arrangements and Exchange<br />
Restrictions. They use a Heckman selection model to correct for selection bias. The<br />
model takes into account that a country is more likely to liberalize its capital account<br />
when its neighbors do the same. In their second stage regression, they regress capital<br />
account liberalization on IMF loan volumes, an interaction between IMF loans and<br />
welfare spending and a number of control variables. They argue that liberal reforms<br />
are politically costly and more likely when the potential losers are somehow compensated.<br />
Governments in favor of capital account liberalization, but lacking political<br />
bargaining power, can use the IMF’s conditions as political cover to implement<br />
these reforms. Their regressions for a panel of 87 countries over the period from<br />
1975 to 2002 yield a significant positive interaction effect (at the 1% level). The marginal<br />
effect of IMF loans is positive and significant at the 5% level for all levels of<br />
welfare spending. Therefore, IMF loans seem to ease the implementation of reforms<br />
if the money is at least partly used to compensate potential losers.<br />
16 In line with this, Okada and Samreth (2012) show that aid from multilateral organizations<br />
reduces corruption.<br />
www.freetheworld.com • www.fraserinstitute.org • Fraser Institute ©2012
236 • <strong>Economic</strong> <strong>Freedom</strong> of the <strong>World</strong>: 2012 Annual Report<br />
Fraser Institute ©2012 • www.fraserinstitute.org • www.freetheworld.com<br />
Biglaiser and DeRouen (2011) focus on Latin America. They find that participation<br />
in an IMF program increases trade and promotes capital-market reforms, at the<br />
1% level of significance (for 12 countries over the period from 1980 to 2003). IMF<br />
conditions in that period often pushed free trade. Governments can blame the IMF<br />
as a scapegoat for these reforms, which decreases their political costs of implementing<br />
the reform. On the other hand, IMF programs often aim to foster privatization<br />
in an attempt to increase productivity. The results show that in Latin America IMF<br />
programs reduced privatization efforts. This is in line with the hypothesis that inefficient<br />
structures are more likely to survive with IMF credit because the pressure<br />
to reform is reduced (Dreher and Rupprecht, 2007). Therefore, the IMF can be<br />
seen as having a negative effect on economic freedom in most areas, while enhancing<br />
freedom in some (mostly capital markets and sometimes freedom to trade).<br />
However, the lack of a common framework makes it impossible to know whether<br />
the differences in results arise from the different dimensions of economic freedom<br />
under consideration or differences in samples and methods.<br />
4 Conclusion<br />
Does aid buy economic freedom? The literature does not provide a clear answer.<br />
The majority of studies have focused on individual dimensions of economic freedom.<br />
Most of the studies that examined individual dimensions did not look at the<br />
pre- and post-Cold-War period separately, even though development paradigms<br />
changed fundamentally during the 1980s (Hodler and Dreher, 2012). There is, however,<br />
evidence that Official Development Aid in general leads to a deteriorating<br />
quality of governance. The effect on perceived corruption differs among donors.<br />
Bilateral aid seems to have negative effects on measures of legal quality, regulatory<br />
quality, and government spending. It has been suggested that most of this increase<br />
in spending is targeted towards consumption, an effect that is yet to be verified for<br />
the post-Cold-War period. Aid given to strengthen trade decreases the costs of trading,<br />
which effectively increases economic freedom. Given the large differences in<br />
the choice of control variables and persistent problems with the endogeneity of aid,<br />
however, these results can only be preliminary.<br />
For multilateral aid, the empirical results suggest that international financial<br />
organizations can increase freedom. This positive effect most likely comes from<br />
conditionality and the information transmission between donor and recipient. This<br />
effect was found to diminish or even turn negative with increases in loan amounts.<br />
The international financial institutions’ influence differs across areas of economic<br />
freedom. The IMF is more successful in promoting trade or capital reform than in<br />
promoting privatization, at least in Latin America. There is some evidence that the<br />
Fund provides recipient governments with the necessary political bargaining power<br />
to implement liberal capital-account reforms, increasing economic freedom.<br />
The effect of aid on overall economic freedom measured by composite indices<br />
remains disputed. In the post-Cold-War era, economic freedom tends to increase<br />
with aid, while the effect of aid on freedom tends to be negative during the Cold War.<br />
This is in line with the observation that the bulk of donors supported an inwardlooking<br />
development paradigm until the mid-1980s (Hodler and Dreher, 2012).<br />
Moreover, some studies reveal the importance of looking at different donor countries<br />
and recipient regions separately.<br />
Overall, the lack of a unified framework is obvious. There have been attempts<br />
to control for the endogeneity of aid, with instrumental variable estimators (e.g.,
Does Aid Buy (<strong>Economic</strong>) <strong>Freedom</strong>? • 237<br />
Heckelman and Knack, 2008) or by using the System GMM estimator (e.g., Dreher<br />
and Rupprecht, 2007; Coviello and Islam, 2006). Most studies have tested for the<br />
sensitivity of their results with regard to some dimensions: the choice of the aid<br />
variable and time period (e.g., Bearce and Tirone, 2010), the choice of estimation<br />
method (Ear, 2007) or the choice of control variables (Remmer, 2004). Given the<br />
different periods under investigation, methods of estimation, and sets of control<br />
and instrumental variables, it is impossible to know what drives the differences in<br />
results. Ideally, a unified framework should be thoroughly assessed by separately<br />
varying each of these components, and comparing the results.<br />
First, future studies should start with a clear theory establishing which donor is<br />
likely to promote or restrict a specific component of economic freedom at which<br />
period in time, and with which aid instrument. Clearly, some donors are more likely<br />
to target economic freedom than others, and are more likely to do so at certain times<br />
than at others. Donors might also differ in their effectiveness in achieving recipient<br />
cooperation. On the recipient side, distinguishing between recipient regions might<br />
also reveal differing effects of aid inflows. Additional research on the different channels<br />
by which aid can affect freedom is needed. The theoretical literature has identified<br />
the direct effect of money and conditions, and indirect effects like moral hazard<br />
and scapegoat effects as potential channels. Their proper identification is difficult<br />
given the data at hand.<br />
Second, future studies should take the existing set of control variables as a starting<br />
point to ensure comparability. An important avenue for improvement is a careful<br />
test for robustness. The literature applies Extreme Bounds Analysis or Bayesian<br />
Averaging of Classical Estimates to test for the robustness of particular variables in<br />
similar settings (e.g., Lamla, 2009; Gassebner et al., 2011). These methods could<br />
easily be applied to the impact of aid on economic freedom.<br />
Finally, properly controlling for the potential endogeneity of aid to freedom provides<br />
an important avenue for additional research. The existing literature on aid and<br />
growth can provide useful guidance in this respect. Many instruments that are exogenous<br />
to economic growth might be exogenous to economic policies as well. Rajan<br />
and Subramanian (2005), for example, who model the supply side of aid, could be<br />
used as a starting point for the choice of instruments. They suggest the relative size<br />
of the donor compared to the recipient as a proxy for donor influence and colonial<br />
origin for the existence of a common history. Political variables like temporary<br />
membership in the United Nations Security Council (Kuziemko and Werker, 2006;<br />
Dreher et al., 2009a, 2009b) or voting in line with donors in the United Nations<br />
General Assembly (Carter and Stone, 2010) might also prove useful.<br />
Overall, future research should address the problems prevailing in the literature,<br />
and try to provide a more nuanced view of the effects of aid on economic freedom.<br />
Considering that the current way of providing and conditioning aid seems<br />
to have (at least partly) adverse effects on economic freedom, this is an important<br />
endeavor. Researchers need to begin with a clear definition of each of the components<br />
involved, including the type of aid given and the component of economic freedom<br />
to be assessed. Moreover, they need to be aware of the problems in assessing<br />
the effect of aid across different time periods due to changing aid paradigms. Only<br />
with a unified framework that takes account of the issues outlined above is it possible<br />
to derive practical policy implications and augment the existing knowledge on<br />
whether or not aid affects economic freedom.<br />
www.freetheworld.com • www.fraserinstitute.org • Fraser Institute ©2012
238 • <strong>Economic</strong> <strong>Freedom</strong> of the <strong>World</strong>: 2012 Annual Report<br />
Appendix: Selected studies on the relationship<br />
between aid and economic freedom<br />
This Appendix covers studies that use economic freedom as a dependent variable. That includes the overall index, but also individual dimensions<br />
like the rule of law or size of government. While corruption and other dimensions of governance can also be considered measures of economic<br />
freedom, the relation is less direct and we do not cover these studies in the Appendix. We admit that this choice can sometimes appear arbitrary.<br />
Data Dependent variable Independent variables Results<br />
Biglaiser and DeRouen Jr. (2011)<br />
15 Latin American<br />
countries<br />
1980–2003 (annual<br />
data)<br />
353 observations<br />
ML treatment effects<br />
regression<br />
Trade index<br />
Financial reform index<br />
Privatization index<br />
Tax reform index<br />
Capital account index<br />
(changes, indexes from<br />
Morley et al., 2003)<br />
Bearce and Tirone (2010)<br />
1975–2000<br />
<strong>Economic</strong> freedom<br />
(5-year intervals)<br />
(Fraser Inst.), change<br />
181–408 observations<br />
OLS<br />
Other variables not<br />
shown<br />
Fraser Institute ©2012 • www.fraserinstitute.org • www.freetheworld.com<br />
Binary IMF SBA-program participation dummy<br />
Affinity with US on UN votes<br />
SBA * affinity with US on UN votes<br />
Government ideology<br />
GDP p.c.<br />
GDP p.c. growth rate<br />
Democracy from Polity IV data<br />
Age of regime, chief executive party tenure<br />
Number of years since last election<br />
Total reserves<br />
Inflation measured by CPI<br />
Country and time fixed effects<br />
Instrument for participation:<br />
Number of years country is<br />
under IMF program<br />
Net amount of bi- and multilateral<br />
development assistance from Western<br />
countries (t-1), change<br />
Initial economic freedom<br />
GDP and GDP p.c.<br />
Population growth<br />
Democratic transition dummy (Polity IV)<br />
External and internal military conflict dummy<br />
Regional and time fixed effects<br />
Heckelman and Knack (2008)<br />
50–91 countries <strong>Economic</strong> freedom ODA/GNI or ODA p.c. (20 year average)<br />
1980–2000, (20-year<br />
intervals)<br />
(Fraser Inst.), individual<br />
components, change<br />
Initial economic freedom<br />
Initial GDP p.c. and av. GDP p.c. growth<br />
Cross-section, OLS, and<br />
2SLS<br />
Linguistic fractionalization<br />
Democracy<br />
Initial level and change in democracy<br />
(<strong>Freedom</strong> House)<br />
Instruments for aid:<br />
Life expectancy<br />
Sectorial composition of economy<br />
Population size<br />
In a two-stage model, IMF programs<br />
have a positive effect on trade and<br />
capital reform, but a negative effect on<br />
privatization. With OLS, IMF programs<br />
positively affect trade reform. Affinity<br />
with the US influences the effect of the<br />
program on reform.<br />
The “honeymoon effect,” i.e., the<br />
number of years since the last election,<br />
has a positive effect on reform<br />
implementation. Leftist governments<br />
are less likely to introduce capital<br />
liberalization and privatization<br />
measures.<br />
Regards aid as a “bribe” to the<br />
recipient government to encourage<br />
economic reforms. Aid was unrelated<br />
to economic freedom before 1990, but<br />
positively related in the post-1990<br />
period. A possible reason is that, after<br />
the end of the Cold-War era, Western<br />
donor governments can more credibly<br />
threaten to stop aid when conditions<br />
are not fulfilled.<br />
With OLS, average aid/GDP for the<br />
years 1980–2000 negatively and<br />
mostly sig. affects economic freedom;<br />
aid for the years 1990–2000 has no<br />
sig. effect. With 2SLS, the coefficients<br />
are similar but larger, and exhibit<br />
higher significance levels. The effect<br />
is larger for Sub-Saharan and high-aid<br />
countries; not sig. for low-aid countries.<br />
Aid Type did not play a role.<br />
The only single, negative coefficient<br />
was for government size. The results<br />
seem to be influenced by extreme<br />
values. Moreover, there are signs that<br />
the effect of aid is non-linear.
Data Dependent variable Independent variables Results<br />
Knedlik and Kronthaler (2007)<br />
104 countries<br />
<strong>Economic</strong> freedom<br />
1995–2004<br />
(Heritage), change<br />
Random-effects model<br />
(ODA) p.c. or official aid (OA) p.c.<br />
IMF disbursements, p.c.<br />
GDP p.c. growth rate<br />
Terms of trade<br />
Political rights<br />
Percent of fuel exports<br />
School enrolment<br />
Dreher and Rupprecht (2008)<br />
106–109 countries <strong>Economic</strong> freedom Number of IMF programs (t-1)<br />
1970–2000<br />
446–523 observations<br />
(Fraser Inst.), individual<br />
components, change<br />
Initial economic freedom<br />
GDP p.c. growth<br />
(5-year intervals)<br />
Linguistic fractionalization<br />
FGLS and GMM<br />
Civil liberties (initial and change)<br />
Aid/GDP<br />
Ear (2007)<br />
155 countries,<br />
1996–2004<br />
(2-year intervals)<br />
750 observations<br />
OLS, 2SLS, fixed- and<br />
random-effects model<br />
Voice and<br />
accountability<br />
Political stability<br />
Government<br />
effectiveness<br />
Regulatory quality<br />
Rule of law<br />
Control of corruption<br />
(from Kaufmann et al.,<br />
2005)<br />
Coviello and Islam (2006)<br />
104–176 countries Regulation and legal<br />
1970–2002<br />
security & property<br />
rights (part of<br />
(5-year intervals) economic freedom,<br />
602–1500 observations, Fraser Inst.), change<br />
OLS, 2SLS, Difference Bureaucratic quality,<br />
and System GMM law and order,<br />
expropriation risk,<br />
repudiation risk and<br />
corruption (ICRG,<br />
1984–2002 annually),<br />
change<br />
Financial assets kept<br />
in the banking system,<br />
change<br />
Net ODA plus OA/ GNI (t-1, 5-year average)<br />
GNI<br />
Initial dependent variable<br />
Population<br />
Instruments for aid:<br />
Infant mortality in 1980<br />
Log (initial GDP) and log (initial population)<br />
Franc zone and Central America dummy<br />
EDA/GDP, level and change<br />
Initial level of dependent variable<br />
Initial or current level of GDP<br />
Legal origin<br />
Latitude<br />
Settler mortality rates<br />
Ethnic fractionalization<br />
Openness to trade<br />
Population<br />
Time fixed effects<br />
Instruments for aid:<br />
Lag of GDP p.c. and log of population<br />
Ex-colonies and regional dummies<br />
Does Aid Buy (<strong>Economic</strong>) <strong>Freedom</strong>? • 239<br />
In all regressions, the IMF disbursements<br />
sign. decrease economic freedom. It is<br />
mainly fiscal burden and trade policy<br />
that deteriorate, as taxes are increased<br />
instead of expenditures cut.<br />
Aid in general increases economic<br />
freedom in 7 out of 8 regressions.<br />
However, it is insig. when all control<br />
variables are included and for a Sub-<br />
Saharan subsample.<br />
IMF programs reduce economic<br />
freedom with FGSL and GMM. There<br />
is a negative impact of IMF programs<br />
on legal security and property rights<br />
and freedom to trade. Regulation of<br />
credit, labor, and business is negatively<br />
affected when using FGLS and not<br />
controlling for growth.<br />
Other aid has no effect with GMM<br />
and is negative with FGSL only if not<br />
controlling for GDP p.c. growth.<br />
In a cross-section analysis, aid reduces<br />
government effectiveness and<br />
control of corruption. When being<br />
instrumented with 2SLS, rule of law,<br />
regulatory quality, and political stability<br />
are also reduced by aid.<br />
With a fixed-effects panel model, aid<br />
reduces regulatory quality and rule<br />
of law if it is not instrumented. When<br />
looking at technical assistance and aid<br />
separately, both reduce the rule of law.<br />
With OLS, the most robust empirical<br />
relationship is between higher aid and<br />
more regulation. Legal security and<br />
property rights are also negatively<br />
affected by aid, but only when aid is<br />
not instrumented.<br />
All other indicators are not robust to<br />
different specifications or change when<br />
there is a large set of control variables.<br />
The past level of institutional quality<br />
had the largest influence on the change<br />
in, and the current, institutional quality.<br />
With a 1- or 2-step difference-<br />
GMM estimator, there was no sign.<br />
connection between aid and the<br />
institutional dependent variables.<br />
www.freetheworld.com • www.fraserinstitute.org • Fraser Institute ©2012
240 • <strong>Economic</strong> <strong>Freedom</strong> of the <strong>World</strong>: 2012 Annual Report<br />
Data Dependent variable Independent variables Results<br />
Kilby (2005)<br />
71 countries<br />
1975–1995<br />
235–306 observations<br />
(5-year intervals)<br />
Cross-section, OLS and<br />
2SLS<br />
Powell and Ryan (2005)<br />
79 countries<br />
1970–2000<br />
173–476 observations<br />
(5- and 10-year<br />
intervals)<br />
Fixed-effects<br />
estimations<br />
Regulation area of<br />
economic freedom<br />
(Fraser Inst.), level<br />
<strong>Economic</strong> freedom<br />
(Fraser Inst.), level<br />
<strong>Economic</strong> freedom<br />
(Fraser Inst.), change<br />
<strong>Economic</strong> freedom<br />
(Fraser Inst.), change<br />
Boockmann and Dreher (2003)<br />
85 countries<br />
<strong>Economic</strong> freedom<br />
1970–1997<br />
(Fraser Inst.), level<br />
192–404 observations<br />
(5-year intervals)<br />
Fixed-effects and<br />
Aranello-Bond GMM<br />
Boone (1996)<br />
1971–1990<br />
96 countries<br />
(10-year average),<br />
countries with aid share<br />
≤15% of GNP; excludes<br />
OPEC countries and<br />
Israel<br />
Government<br />
consumption<br />
Black-market premium<br />
Indirect taxes/GNP<br />
Inflation tax rate<br />
(change in GDP<br />
deflator/100)<br />
EDA/ GDP, level<br />
Fraser Institute ©2012 • www.fraserinstitute.org • www.freetheworld.com<br />
Initial level of dependent variable<br />
Initial level of GDP per capita<br />
Ethno-linguistic fractionalization in 1960<br />
Share of imports that is military equipment<br />
Franc zone dummy<br />
Regional dummies<br />
Instrument for aid:<br />
Population<br />
Specification 1 and 2:<br />
ODA/GNI or ODA/government expenditure<br />
(previous 5- or 10-year averages), level<br />
Ex-communist dummy<br />
GNI p.c.<br />
Specification 3:<br />
Changes in Aid/GNI or aid/government<br />
expenditure (previous 5- or 10-year<br />
averages), changes<br />
Ex-communist dummy<br />
GNI p.c., changes<br />
Sum of credits and number of projects <strong>World</strong><br />
Bank and IMF (t-1)<br />
Military rule dummy<br />
Exports into industrial countries<br />
Technical assistance<br />
Secondary-school enrollment<br />
Radios per capita<br />
Post-1990 dummy<br />
Net ODA/ GNP (t-1)<br />
GNP p.c. and GNP p.c. growth rate<br />
Regional dummies<br />
Instruments for aid:<br />
Political proxies:<br />
friend of US,<br />
of OPEC,<br />
of France<br />
Log of population<br />
Higher aid levels are related to lower<br />
levels of regulation, both if aid is being<br />
instrumented and if not. Excluding all<br />
potential outliers, there is no significant<br />
effect. There is some evidence that aid<br />
is targeted towards more regulated<br />
economies.<br />
In specification 1, both measures<br />
of aid had significant and negative<br />
coefficients. In specification 2, aid was<br />
mainly insig., but three times sign.<br />
and positive for the 10-year average<br />
Aid/GNI measure. With specification<br />
3, the aid measures have negative but<br />
insignificant coefficients.<br />
The authors conclude that<br />
improvements in economic freedom<br />
have no effect on aid in the subsequent<br />
period when controlling for GDP.<br />
The number of <strong>World</strong> Bank (WB)<br />
projects increases economic freedom,<br />
but the sum of WB credit decreases<br />
economic freedom.<br />
The sum of IMF loans has on average<br />
no significant effect.<br />
The effects of both IMF and <strong>World</strong><br />
Bank vary for different components<br />
of economic freedom, and the sign.<br />
positive and negative effects are<br />
mainly after 1990.<br />
There is a significant positive effect<br />
of foreign aid on government<br />
consumption. There is no sign. effect<br />
on the black market premium, the<br />
share of indirect taxes or the change in<br />
the GDP deflator.
References<br />
Does Aid Buy (<strong>Economic</strong>) <strong>Freedom</strong>? • 241<br />
Alesina, A. (2003). The Size of Countries: Does It Matter? Journal of the European<br />
<strong>Economic</strong> Association 1, 2: 301–316.<br />
Alesina, A., and D. Dollar (2000). Who Gives Foreign Aid to Whom and Why?<br />
Journal of <strong>Economic</strong> Growth 5, 1: 33–63.<br />
Alesina, A., and B. Weder (2002). Do Corrupt Governments Receive Less<br />
Foreign Aid? American <strong>Economic</strong> Review 92, 4: 1126–1137.<br />
Arellano, M., and S. Bond (1991). Some Tests of Specification for Panel Data:<br />
Monte Carlo Evidence and an Application to Employment Equations. The Review<br />
of <strong>Economic</strong> Studies 2, 58: 277–297.<br />
Asongu, S. (2012). On the Effect of Foreign Aid on Corruption. Working paper,<br />
MPRA Paper No. 36545 (February). University of Munich.<br />
Bauer, P.T. (1991). The Development Frontier: Essays in Applied <strong>Economic</strong>s. Harvard<br />
University Press.<br />
Bearce, D.H., and D.C. Tirone (2010). Foreign Aid Effectiveness and the Strategic<br />
Goals of Donor Governments. The Journal of Politics 72, 3: 837–851.<br />
Berggren, N. (2003). The Benefits of <strong>Economic</strong> <strong>Freedom</strong>: A Survey. The<br />
Independent Review 8, 2: 193–211.<br />
Bermeo, S.B. (2008). Foreign Aid, Foreign Policy, and Strategic Development.<br />
Dissertation. Department of Politics, Princeton University.<br />
Biglaiser, G., and K. DeRouen (2011). How Soon Is Now? The Effects of the IMF<br />
on <strong>Economic</strong> Reforms in Latin America. The Review of International Organizations<br />
6, 2: 189–213.<br />
Boockmann, B., and A. Dreher (2003). The Contribution of the IMF and the<br />
<strong>World</strong> Bank to <strong>Economic</strong> <strong>Freedom</strong>. European Journal of Political Economy 19, 3:<br />
633–649.<br />
Boone, P. (1996). Politics and the Effectiveness of Foreign Aid. European<br />
<strong>Economic</strong> Review 40: 289–329. Correct citation is:<br />
Bräutigam, D. (2000). Aid Dependence and Governance. Expert Group on<br />
Development Issues.<br />
Bräutigam, D., and S. Knack (2004). Foreign Aid, Institutions, and Governance in<br />
Sub-Saharan Africa. <strong>Economic</strong> Development and Cultural Change 52, 2: 255–285.<br />
www.freetheworld.com • www.fraserinstitute.org • Fraser Institute ©2012
242 • <strong>Economic</strong> <strong>Freedom</strong> of the <strong>World</strong>: 2012 Annual Report<br />
Fraser Institute ©2012 • www.fraserinstitute.org • www.freetheworld.com<br />
Busse, M., and S. Gröning (2009). Does Foreign Aid Improve Governance?<br />
<strong>Economic</strong>s Letters 104, 2: 76–78.<br />
Cali, M., and D.W. te Velde (2011). Does Aid for Trade Really Improve Trade<br />
Performance? <strong>World</strong> Development 39, 5: 725–740.<br />
Carlsson, F., and S. Lundström (2002). <strong>Economic</strong> <strong>Freedom</strong> and Growth:<br />
Decomposing the Effects. Public Choice 112, 3: 335–344.<br />
Carter, D.B., and R.W. Stone (2010). Sincere or Strategic? U.S. Aid<br />
Disbursements and Voting in the United Nations General Assembly. Unpublished<br />
paper prepared for presentation at the conference, The Political Economy of<br />
International Organizations, ETH and University Zurich ( January 2011).<br />
Clemens M.A., S. Radelet, R.R. Bhavnani, and S. Bazzi (2012). Counting<br />
Chickens When They Hatch: Timing and the Effects of Aid on Growth. The<br />
<strong>Economic</strong> Journal 122: 590–617.<br />
Coviello, D. (2006). Does Aid Help Improve <strong>Economic</strong> Institutions? <strong>World</strong> Bank<br />
Policy Research Working Paper 3990 (August).<br />
Crawford, G. (2001). Foreign Aid and Political Reform: A Comparative Analysis of<br />
Democracy Assistance and Political Conditionality (1st ed.). Palgrave.<br />
Cummings, J.T. (2000). <strong>Economic</strong> <strong>Freedom</strong> Indices: Their Use as Tools for<br />
Monitoring and Evaluation. SCS Working Paper 00/01: 1–64.<br />
Dawson, J. (2003). Causality in the <strong>Freedom</strong>–Growth Relationship. European<br />
Journal of Political Economy 19, 3: 479–495.<br />
De Haan, J., S. Lundström, and J.-E. Sturm (2006). Market-Oriented Institutions<br />
and Policies and <strong>Economic</strong> Growth: A Critical Survey. Journal of <strong>Economic</strong> Surveys<br />
20, 2: 157–181.<br />
De Haan, J., and J.-E. Sturm (2000). On the Relationship between <strong>Economic</strong><br />
<strong>Freedom</strong> and <strong>Economic</strong> Growth. European Journal of Political Economy 16: 215–241.<br />
Doucouliagos, H., and M. Paldam (2009). The Aid Effectiveness Literature: The<br />
Sad Results of 40 Years of Research. Journal of <strong>Economic</strong> Surveys 23, 3: 433–461.<br />
Drake, P. (1998). The International Causes of Democratization. In P. Drake and<br />
M. McCubbins, eds., The Origins of Liberty: Political and <strong>Economic</strong> Liberalization in<br />
the Modern <strong>World</strong> (Princeton University Press): 70–91.<br />
Dreher, A. (2005). Does the IMF Influence Fiscal and Monetary Policy? The<br />
Journal of Policy Reform 8, 3: 225–238.<br />
Dreher, A. (2009). IMF Conditionality: Theory and Evidence. Public Choice 141,<br />
1-2: 233–267.
Does Aid Buy (<strong>Economic</strong>) <strong>Freedom</strong>? • 243<br />
Dreher, A., and A. Fuchs (2011). Rogue Aid? The Determinants of China’s Aid<br />
Allocation. Courant Research Centre “Poverty, Equity and Growth” Discussion<br />
Paper 93, University of Goettingen (September).<br />
Dreher, A., P. Nunnenkamp, and R. Thiele (2011). Are “New” Donors Different?<br />
Comparing the Allocation of Bilateral Aid between NonDAC and DAC Donor<br />
Countries? <strong>World</strong> Development 39, 11: 1950–1968.<br />
Dreher, A., and S. Rupprecht (2007). IMF Programs and Reforms—Inhibition or<br />
Encouragement? <strong>Economic</strong>s Letters 95, 3: 320–326.<br />
Dreher, A., J.-E. Sturm, and J.R. Vreeland (2009a). Development Aid and<br />
International Politics: Does Membership on the UN Security Council Influence<br />
<strong>World</strong> Bank Decisions? Journal of Development <strong>Economic</strong>s 88: 1–18.<br />
Dreher, A., J.-E. Sturm, and J.R. Vreeland (2009b). Global Horse Trading: IMF<br />
Loans for Votes in the United Nations Security Council. European <strong>Economic</strong><br />
Review 53: 742–757.<br />
Dreher, A., and R. Vaubel (2004). Do IMF and IBRD Cause Moral Hazard and<br />
Political Business Cycles? Evidence from Panel Data. Open Economies Review 15: 5–22.<br />
Dreher, A., and S. Walter (2010). Does the IMF Help or Hurt? The Effect of<br />
IMF Programs on the Likelihood and Outcome of Currency Crises. <strong>World</strong><br />
Development 38, 1: 1–18.<br />
Ear, S. (2007). Does Aid Dependence Worsen Governance? International Public<br />
Management Journal 10, 3: 259–286.<br />
Easterly, W.R., and I. Ebrary (2002). The Elusive Quest for Growth: Economists’<br />
Adventures and Misadventures in the Tropics. MIT press.<br />
Edwards, S. (2012). Is Tanzania a Success Story? A Long Term Analysis.NBER<br />
Working Paper No. 17764 ( January).<br />
Esarey, J. (2012). Overconfidence in Testing of Interaction Hypotheses:<br />
Determining and Controlling the False Positive Rate. Working paper. .<br />
Feinberg, R.E. (2006). Presidential Mandates and Ministerial Institutions:<br />
Summitry of the Americas, the Organization of American States (OAS) and<br />
the Inter-American Development Bank (IDB). The Review of International<br />
Organizations 1, 1: 69–94.<br />
Fuchs, A., and K.C. Vadlamannati (2012). The Needy Donor: An Empirical Analysis<br />
of India’s Aid Motives. Mimeo. Department of <strong>Economic</strong>s, Heidelberg University.<br />
Gassebner, M., M. Lamla, and J.-E. Sturm (2011). The Inverse Domino Effect: Are<br />
<strong>Economic</strong> Reforms Contagious? International <strong>Economic</strong> Review 52, 1: 183–200.<br />
www.freetheworld.com • www.fraserinstitute.org • Fraser Institute ©2012
244 • <strong>Economic</strong> <strong>Freedom</strong> of the <strong>World</strong>: 2012 Annual Report<br />
Fraser Institute ©2012 • www.fraserinstitute.org • www.freetheworld.com<br />
Gehring, K. (2012). Benefit or Burden? Unraveling the Effect of <strong>Economic</strong> <strong>Freedom</strong><br />
on Subjective Well-Being. Discussion papers series no. 531. Heidelberg University,<br />
Department of <strong>Economic</strong>s. .<br />
Goldsmith, A. (1997). <strong>Economic</strong> Rights and Government in Developing<br />
Countries: Cross-National Evidence on Growth and Development. Studies in<br />
Comparative International Development 32, 2: 29–44.<br />
Gwartney, J., J. Hall, and R. Lawson, with C.J. Coyne, J.W. Dawson, H. Feldmann,<br />
J. Levendis, R.S. Sobel, and E.P. Stringham (2010). <strong>Economic</strong> <strong>Freedom</strong> of the <strong>World</strong>:<br />
2010 Annual Report. Fraser Institute.<br />
Haggard, S., and S.B. Webb (1994). Voting for Reform: Democracy, Political<br />
Liberalization, and <strong>Economic</strong> Adjustment. <strong>World</strong> Bank and Oxford University Press.<br />
Harms, P., and M. Lutz (2004). The Macroeconomic Effects of Foreign Aid: A<br />
Survey. Discussion Paper no. 2004-11 (September). University of St. Gallen.<br />
Heckelman, J.C., and S. Knack (2008). Foreign Aid and Market-Liberalizing<br />
Reform. <strong>Economic</strong>a 75, 299: 524–548.<br />
Hodler, R., and A. Dreher (2012). Development (Paradigm) Failures. Journal of<br />
Development <strong>Economic</strong>s, forthcoming.<br />
Kaufmann, D., A. Kraay, and M. Mastruzzi (2009). <strong>World</strong>wide Governance<br />
Indicators. <strong>World</strong> Bank. .<br />
Kilby, C. (2005). Aid and Regulation. The Quarterly Review of <strong>Economic</strong>s and<br />
Finance 45, 2-3: 325–345.<br />
Kilby, C. (2009). The Political Economy of Conditionality: An Empirical<br />
Analysis of <strong>World</strong> Bank Loan Disbursements. Journal of Development <strong>Economic</strong>s 89,<br />
1: 51–61.<br />
Kilby, C., and A. Dreher (2010). The Impact of Aid on Growth Revisited: Do<br />
Donor Motives Matter? <strong>Economic</strong>s Letters 107, 3: 338–340.<br />
Knack, S. (2001). Aid Dependence and the Quality of Governance: Cross-<br />
Country Empirical Tests. Southern <strong>Economic</strong> Journal 68, 2: 310–329.<br />
Knedlik, T., and F. Kronthaler (2007). Aid and <strong>Economic</strong> <strong>Freedom</strong>: An Empirical<br />
Investigation Using the Heritage Index. Journal of Development Perspectives 3, 1: 116–135.<br />
Kuziemko, I., and E. Werker (2006). How Much I s a Seat on the Security<br />
Council Worth? Foreign Aid and Bribery at the United Nations. Journal of Political<br />
Economy 114, 5: 905–930.<br />
Lamla, M. (2009). Long-Run Determinants of Pollution: A Robustness Analysis.<br />
Ecological <strong>Economic</strong>s 69, 1: 135–144.
Does Aid Buy (<strong>Economic</strong>) <strong>Freedom</strong>? • 245<br />
Lancaster, C. (2007). Foreign Aid: Diplomacy, Development, Domestic Politics.<br />
University of Chicago Press.<br />
Miller, T., and K.R. Holmes (2011). 2011 Index of <strong>Economic</strong> <strong>Freedom</strong>. Heritage<br />
Foundation and Dow Jones & Co. .<br />
Morley, S.A., R. Machado, and S. Pettinato (2003). Indexes of Structural Reform<br />
in Latin America. ECLAC—<strong>Economic</strong> Commission for Latin America and the<br />
Caribbean. Part of the project, Growth, Employment and Equity: Latin America<br />
in the 1990s (HOL/97/6034).<br />
Mukherjee, B., and D.A. Singer (2010). International Institutions and Domestic<br />
Compensation: The IMF and the Politics of Capital Account Liberalization.<br />
American Journal of Political Science 54, 1: 45–60.<br />
Norton, S.W. (1998). Poverty, Property Rights, and Human Well-Being: A Cross-<br />
National Study. Cato Journal 18, 2: 233–246.<br />
Nowak-Lehmann, D.F., A. Dreher, I. Martínez-Zarzoso, D. Herzer, and S. Klasen<br />
(2012). Does Foreign Aid Really Raise Per-Capita Income? A Time Series<br />
Perspective. Canadian Journal of <strong>Economic</strong>s 45: 288–313.<br />
Oehler, H., A. Dreher, and P. Nunnenkamp (2012). Does Conditionality Work? A<br />
Test for an Innovative US Aid Scheme. European <strong>Economic</strong> Review 56: 138–153.<br />
Okada, K., and S. Samreth (2012). The Effect of Foreign Aid on Corruption: A<br />
Quantile Regression Approach. <strong>Economic</strong>s Letters 115, 2: 240–243.<br />
Olson, M. (1965). The Logic of Collective Action: Public Goods and the Theory of<br />
Groups. Harvard University Press.<br />
Paldam, M. (2003). <strong>Economic</strong> <strong>Freedom</strong> and the Success of the Asian Tigers: An<br />
Essay on Controversy. European Journal of Political Economy 19, 3: 453–477.<br />
Powell, B., and M.E. Ryan (2006). Does Development Aid Lead to <strong>Economic</strong><br />
<strong>Freedom</strong>? Journal of Private Enterprise 22, 1: 1–21.<br />
PRS Group (various issues). International Country Risk Guide. .<br />
Quinn, D., and M. Schindler (2011). Assessing Measures of Financial Openness<br />
and Integration. IMF <strong>Economic</strong> Review 59, 3: 488–522.<br />
Rajan, R.G., and A. Subramanian (2005). Aid and Growth: What Does the<br />
Cross-Country Evidence Really Show? The Review of <strong>Economic</strong>s and Statistics 90<br />
(November): 643–665.<br />
Rajan, R.G., and A. Subramanian (2007). Does Aid Affect Governance. The<br />
American <strong>Economic</strong> Review 97, 2: 322–327.<br />
www.freetheworld.com • www.fraserinstitute.org • Fraser Institute ©2012
246 • <strong>Economic</strong> <strong>Freedom</strong> of the <strong>World</strong>: 2012 Annual Report<br />
Fraser Institute ©2012 • www.fraserinstitute.org • www.freetheworld.com<br />
Rajan, R.G., and A. Subramanian (2011). Aid, Dutch disease, and Manufacturing<br />
Growth. Journal of Development <strong>Economic</strong>s 94: 106–118.<br />
Ratnam, C. (1996). Trade Unions and Structural Adjustment. Working paper,<br />
International Labour Office, Geneva.<br />
Ree, J. de, and E. Nillesen (2009). Aiding Violence or Peace? The Impact of<br />
Foreign Aid on the Risk of Civil Conflict in Sub-Saharan Africa. Journal of<br />
Development <strong>Economic</strong>s 88, 2: 301–313.<br />
Remmer, K.L. (2004). Does Foreign Aid Promote the Expansion of<br />
Government? Political Science 48, 1: 77–92.<br />
Roodman, D. (2007). The Anarchy of Numbers: Aid, Development, and Cross-<br />
Country Empirics. The <strong>World</strong> Bank <strong>Economic</strong> Review 21, 2: 255–277.<br />
Rose, A.K. (2004). Do WTO Members Have More Liberal Trade Policy? Journal<br />
of International <strong>Economic</strong>s 63, 2: 209–235.<br />
Svensson, J. (2000). Foreign Aid and Rent-Seeking. Journal of International<br />
<strong>Economic</strong>s 51, 2: 437–461.<br />
Tavares, J. (2003). Does Foreign Aid Corrupt? <strong>Economic</strong>s Letters 79, 1: 99–106.<br />
Vasquez, I. (1998). Official Assistance, <strong>Economic</strong> <strong>Freedom</strong>, and Policy Change: Is<br />
Foreign Aid like Champagne? Cato Journal 18, 2: 275–286.<br />
Vaubel, R. (1991). The Political Economy of the International Monetary Fund:<br />
A Public Choice Analysis. In Roland Vaubel and Thomas D. Willett, eds., The<br />
Political Economy of International Organizations: A Public Choice Approach<br />
(Westview Press): 204–244 .<br />
White, H., and A.G. Dijkstra (2003). Programme Aid and Development: Beyond<br />
Conditionality. Routledge.
Chapter 6 How Institutions of Liberty Promote<br />
Entrepreneurship and Growth<br />
Christian Bjørnskov and Nicolai J. Foss<br />
Introduction<br />
Because of its aggregate nature, much of the economics of growth seems “individualless,”<br />
growth being driven by the accumulation of capital along equilibrium growth<br />
paths and/or fuelled by investments in research and development with (probabilistically)<br />
known outcomes. Yet, individuals, and particularly entrepreneurs, are central to<br />
the growth process, a process propelled by individuals who exercise their judgment in<br />
the recognition, evaluation, and exploitation of opportunities for profit in the face of<br />
uncertainty (Knight, 1921; Mises, 1949; Foss and Klein, 2012). There are rather large<br />
differences in the supply and allocation of entrepreneurial activity across countries<br />
and time (Blau, 1987; Blanchflower, 2000). For example, France and Australia differ<br />
dramatically with respect to formation of new firms. Given such stylized facts, two<br />
highly pertinent questions are: 1) how do institutions affect the supply of entrepreneurship;<br />
and 2) how is entrepreneurship linked to growth? These are the two overall<br />
questions that we deal with in this chapter, starting from and summarizing our own<br />
work (Bjørnskov and Foss, 2008, 2012). We answer both questions by arguing that<br />
entrepreneurship is a main mediator between institutions and growth.<br />
Although Baumol (1990) rightly points out that entrepreneurial creativity need<br />
not necessarily be socially beneficial, new products, processes, ways of organizing—all<br />
essential aspects of the growth process—are outcomes of entrepreneurship<br />
(Schumpeter, 1911; Rosenberg, 1992). Recognizing this, economists have over<br />
the last two decades or so increasingly tried to integrate entrepreneurship with the<br />
economics of growth (Aghion and Howitt, 1998; Baumol, 1993; Wennekers and<br />
* Christian Bjørnskov is from the Department of <strong>Economic</strong>s and Business, Aarhus University, Aarhus,<br />
Denmark; Nicolai J. Foss is from the Department for Strategic Management and Globalization,<br />
Copenhagen Business School, Frederiksberg, Denmark and the Department of Strategy and<br />
Management, Norwegian School of <strong>Economic</strong>s and Business Administration, Bergen, Norway.<br />
This chapter draws on passages and sections in Bjørnskov and Foss, 2008 and 2012. Cite this<br />
chapter: Bjørnskov, Christian, and Nicolai J. Foss (2012). How Institutions of Liberty Promote<br />
Entrepreneurship and Growth. In James Gwartney, Robert Lawson, and Joshua Hall, <strong>Economic</strong><br />
<strong>Freedom</strong> of the <strong>World</strong>: 2012 Annual Report (Fraser Institute): 247–270.<br />
www.freetheworld.com • www.fraserinstitute.org • Fraser Institute ©2012
248 • <strong>Economic</strong> <strong>Freedom</strong> of the <strong>World</strong>: 2012 Annual Report<br />
Fraser Institute ©2012 • www.fraserinstitute.org • www.freetheworld.com<br />
Thurik, 1999; Audretsch and Thurik, 2001). However, many gaps remain in our<br />
understanding of how entrepreneurship and economic growth are linked. For example,<br />
most research has focused on firms just starting up although established firms<br />
are perfectly capable of exercising entrepreneurship (Foss and Klein, 2012).<br />
As a parallel development in the same time period, economists have increasingly<br />
looked for institutional and policy-related determinants of growth performance<br />
(e.g., Barro, 1991; Temple, 1999; Glaeser et al., 2004). Here, too, gaps remain, in particular<br />
with respect to the understanding of the transmission mechanisms between<br />
institutions and growth. This is not surprising: to the extent that entrepreneurship<br />
plays a significant role in this mechanism—and we trust few economists would disagree<br />
with this—we face the well-known difficulties of modeling the entrepreneurial<br />
function and measuring the incidence and effects of entrepreneurship (Bianchi<br />
and Henrekson, 2005).<br />
In previous work, we have explored the links between institutions and entrepreneurship<br />
(Bjørnskov and Foss, 2008) and entrepreneurship and economic growth,<br />
with institutions playing a moderating role (Bjørnskov and Foss, 2012). We proffer<br />
a specific theoretical mechanism through which institutions affect growth. Thus,<br />
we build on the argument that transaction costs, which are to a large extent shaped<br />
by the institutional matrix of society (North, 1990), include the costs of entrepreneurs<br />
searching for, combining, adapting, and fitting heterogeneous resources in<br />
the pursuit of profit under uncertainty (cf. Matsusaka, 2001; Foss et al., 2007; Foss<br />
and Foss, 2008). The lower the transaction costs, the more such activity will take<br />
place (Agarwal et al., 2010). In turn, entrepreneurial experimentation with new<br />
combinations of heterogeneous resources is one of the drivers of growth. In related<br />
work, we have explored the reasons that the institutional matrix, and particularly<br />
measures of economic freedom, influences the supply of entrepreneurship. In sum,<br />
institutions and entrepreneurship influence growth because they influence total<br />
factor productivity (TFP).<br />
It is exactly this mediation that we examine in this chapter. Our basic research<br />
model is graphically represented in figure 6.1, and we follow the logic of this research<br />
model in the following. We first discuss how institutions of economic freedom may<br />
determine entrepreneurship and how entrepreneurial activity in turn affects total<br />
factor productivity (TFP). We next report on our empirical findings in two steps.<br />
First, we explore the effects of economic freedom on entrepreneurial activity across<br />
25 countries observed in six five-year periods. Second, we estimate the effects of<br />
entrepreneurship on a standard measure of total factor productivity. We end the<br />
chapter by discussing some of the many questions left for future research.<br />
Figure 6.1: Research approach<br />
Elements of economic freedom<br />
Entrepreneurship Productivity
How Institutions of Liberty Promote Entrepreneurship and Growth • 249<br />
The determinants of entrepreneurship<br />
Entrepreneurship<br />
Because entrepreneurs are often taken to be the drivers of economic dynamism and<br />
change, one may expect the entrepreneur be recognized as “the single most important<br />
player in a modern economy” (Lazear, 2002: 1). However, as numerous writers<br />
(Hayek, 1945; Baumol, 1990; Bianchi and Henrekson, 2005) have argued, the<br />
real-world importance of entrepreneurs is not reflected in economic theorizing,<br />
although increasingly economists address the formation of new firms in the context<br />
of self-employment (both are usually associated with entrepreneurship in the<br />
economics literature). Moreover, much work has been done on entrepreneurship at<br />
the fringes of mainstream economics (i.e., Austrian and Schumpeterian traditions).<br />
Foss and Klein (2012) identify notions of entrepreneurship as innovation (e.g.,<br />
Schumpeter, 1911; Aghion and Howitt, 1998; Baumol, 1993); entrepreneurship as<br />
alertness and discovery (Kirzner, 1997); and entrepreneurship as judgment, that is,<br />
profit-oriented decision-making under conditions of uncertainty, as the dominant<br />
conceptions in the economics literature.<br />
Drawing on these conceptions, and echoing Wennekers and Thurik (1999:<br />
46–47), in Bjørnskov and Foss (2008, 2012) we define “entrepreneurship as the<br />
manifest ability and willingness of individuals” to perceive new economic opportunities<br />
and to introduce their ways of seizing these opportunities into the market<br />
in the face of uncertainty. These opportunities may be new products, new processes,<br />
new modes of organization, and new product-market combinations, as well as possibilities<br />
for inter- and intra-market arbitrage.<br />
Institutions<br />
How institutions affect the supply, quality, and allocation (for example, across the<br />
categories of productive, unproductive, and destructive entrepreneurship described<br />
in Baumol 1990) of entrepreneurial efforts, and even their consequences, has been<br />
a relatively under-researched area in mainstream economics. The set of possible<br />
determinants of entrepreneurship is very large indeed, including the size of the government,<br />
the degree of administrative complexity and bureaucracy, the tax environment,<br />
the intellectual property rights regime, the enforcement of property rights in<br />
general, the level of trust, competition law, political freedom, labor laws, social security<br />
regime, bankruptcy law, corruption, crime, the ethnic composition of the population,<br />
availability of finance capital, and so on. Some of these have been examined<br />
in previous work. For example, in a survey of obstacles to the formation of firms in<br />
the private sector, Brunetti and colleagues (1997) show that the most frequently<br />
mentioned obstacles to entrepreneurs are taxes, labor, and safety regulations, and<br />
access to finance.1 In a series of papers, Grilo and Thurik (e.g., 2004) build what<br />
they term an “eclectic framework” of determinants of entrepreneurship, highlighting<br />
demography, various kinds of government intervention, unemployment levels,<br />
and the risk-reward profiles of self-employment compared to other types of employment.<br />
While elements of their framework relate to economic freedom, and it may<br />
1 It is a matter of argument how much finance really matters. For example, Kreft and Sobel (2005)<br />
apply Granger causality testing to US panel data, and argue that venture capital follows entrepreneurial<br />
activity rather than the other way around. For the contrary view, see Kortum and<br />
Lerner, 2000.<br />
www.freetheworld.com • www.fraserinstitute.org • Fraser Institute ©2012
250 • <strong>Economic</strong> <strong>Freedom</strong> of the <strong>World</strong>: 2012 Annual Report<br />
Fraser Institute ©2012 • www.fraserinstitute.org • www.freetheworld.com<br />
be possible to build indices of economic freedom from this framework, they do not<br />
directly develop any theory concerning how such freedom affects entrepreneurship,<br />
a generally neglected focus in the academic literature.<br />
<strong>Economic</strong> freedom variables<br />
In order to relate economic freedom to entrepreneurship, operational definitions<br />
of economic freedom are needed. Economists have typically treated economic<br />
freedom as a composite construct that includes components that all ultimately<br />
boil down to the security and extent of property rights, but include, for example,<br />
the freedom to save, to change jobs, to devise contracts, and to keep legal income.<br />
In the following, we discuss these components and relate them to the supply of<br />
entrepreneurship.<br />
Many scholars have used the size of government in a broad sense as a good measure<br />
of economic freedom (e.g., Gwartney et al., 1999; Carlsson and Lundström,<br />
2002). For many reasons, the size of government influences entrepreneurship. Thus,<br />
and perhaps most obviously, if economic activities in certain industries or sectors<br />
have been nationalized de facto (e.g., child care, health care, and care of the elderly),<br />
the scope for entrepreneurship is reduced to the extent that nationalization means<br />
public monopoly. Likewise, government enterprises—that is, when government<br />
directly competes with the private sector—also tend to crowd out private activity.<br />
More indirect governmental control, such as requirements that certain trades be<br />
licensed, may reduce entrepreneurial activity because public licensing amounts to<br />
a barrier to entry (Demsetz, 1967). To the extent that a large government is associated<br />
with high levels of publicly financed provision of various services (e.g., care<br />
of the elderly, education) and with generous social security systems, the incentives<br />
to engage in entrepreneurial acts in order to make a living—what is sometimes<br />
referred to as “necessity entrepreneurship”—are reduced because a relatively high<br />
reservation wage is practically guaranteed.<br />
However, such schemes also reduce incentives for individual wealth formation<br />
that may be expected to influence the level of non-necessity entrepreneurial activity<br />
negatively (Henrekson, 2005: 11). One reason has to do with entrepreneurial judgment<br />
being idiosyncratic and often hard to communicate clearly to potential investors<br />
(Knight, 1921; Foss and Klein, 2012). The entrepreneur may have to finance<br />
his venture himself, at least in the start-up phase. As Kuznets (1955) argued, if individual<br />
wealth formation is reduced because of generous public-transfer schemes<br />
and highly progressive tax burdens, this makes such financing difficult. Moreover,<br />
if entrepreneurs are able to only commit small amounts of personal capital to their<br />
entrepreneurial venture, their signal to potential outside investors concerning their<br />
commitment to the venture is correspondingly weaker. In addition, assets that may<br />
otherwise function as collateral are not applicable with weakly defined property<br />
rights, which may limit access to credit.<br />
A large government also needs to be financed, ultimately by taxation. As<br />
Henrekson rightly points out, “[i]n order to analyze how the tax system impacts on<br />
entrepreneurial behaviour, it is not sufficient to focus on the taxation of owners of<br />
firms. To a large extent, the return on entrepreneurial effort is taxed as wage income”<br />
(2005: 9). One reason is that parts of the income that accrue from closely held companies<br />
may be paid out as wage income (depending on the specific tax regime), and<br />
that entrepreneurial activity may be carried out by employees. Rewards for entrepreneurial<br />
behavior in firms (e.g., stock options, bonuses for suggesting improvements)
How Institutions of Liberty Promote Entrepreneurship and Growth • 251<br />
are taxed as wage income. Henrekson (2005: 14) also points out that a high level of<br />
taxation moves many household-related services out of the reach for entrepreneurial<br />
exploitation: “… higher rates of personal taxation discourage the market provision of<br />
goods and services that substitute closely for home-produced services” (2005: 15).<br />
A related, yet distinct, item in an overall measure of economic freedom relates<br />
to the enforcement of property rights, that is, the extent to which property rights<br />
are secure over time (North, 1990; Barzel, 2005). Huge literatures in economic<br />
history, on intellectual property rights, and on innovation stress the importance<br />
for entrepreneurial activity at the micro-level and economic development at the<br />
macro-level of property rights being well-defined and enforced (e.g., Rosenberg<br />
and Birdzell, 1986; North et al., 2000; Glaeser et al. 2004). As we explain in greater<br />
detail later, well-defined and enforced property rights reduce the transaction costs<br />
of carrying out the commercial experimentation that we associate with entrepreneurship<br />
(Rosenberg, 1992). Well-defined and enforced rights to residual income<br />
imply that the risk of undertaking entrepreneurial activities is reduced, which may<br />
also stimulate the supply of entrepreneurship. If so, it should be expected that institutional<br />
features, such as the quality of regulations and the judicial system, affect<br />
the overall level of entrepreneurial activity. However, it is uncertain whether this<br />
activity is likely to take place within existing firms, which are better protected by<br />
legal institutions, or in new firms.<br />
A third important item in a measure of economic freedom arguably is sound<br />
money (Friedman, 1962), in particular the rate and variability of inflation. While<br />
anticipations of future relative prices are important in general for economic decision<br />
makers, it is arguable that they matter particularly for entrepreneurs because they<br />
are essentially speculators who receive a residual income (Knight, 1921; Kirzner,<br />
1997). Inflation, and particularly erratic inflation, “jams” the signaling effects of<br />
relative prices (Friedman, 1977). While this may be less of a problem for risk-loving<br />
entrepreneurs, many entrepreneurs, particularly those who engage in necessity<br />
entrepreneurship or activity within well-developed sectors, may well be averse<br />
to risk. In addition, the concept and measurement of sound money is associated<br />
with the level of financial development and financial depth, and as such is a proxy<br />
for the access to capital, which classical theories stress as a crucial condition of<br />
entrepreneurship.<br />
The fourth area of economic freedom is the degree of openness to international<br />
trade and investment. A greater flow of trade through a country may imply more<br />
access to international price signals, thus allowing potential entrepreneurs to take<br />
advantage not only of national but also of international opportunities. In addition,<br />
freedom to invest may, as is often found in empirical studies, increase the rate at<br />
which technology is adopted (cf. Wazciarg, 2001), providing further impetus for<br />
entrepreneurial discovery, as well as competition from foreign entrepreneurs. In<br />
addition, the absence of capital restrictions also implies that entrepreneurs gain<br />
easier access to international capital markets, thereby potentially increasing the supply<br />
of venture capital.<br />
Finally, following Kirzner (1985) public regulation is an important item in an<br />
economic freedom measure that is relevant to explaining the prevalence of entrepreneurial<br />
activity. Arguably, regulations can both help and hinder entrepreneurs<br />
who need clear rules and predictable enforcement of those rules. On the other hand,<br />
excessive regulation imposes burdens on all firms, not the least start-ups that may<br />
be faced with prohibitive start-up costs.<br />
www.freetheworld.com • www.fraserinstitute.org • Fraser Institute ©2012
252 • <strong>Economic</strong> <strong>Freedom</strong> of the <strong>World</strong>: 2012 Annual Report<br />
Fraser Institute ©2012 • www.fraserinstitute.org • www.freetheworld.com<br />
In sum, many elements of economic freedom and institutional quality are likely to<br />
influence entrepreneurial activity. This activity is, in turn, likely affects productivity<br />
and development.<br />
The consequences of entrepreneurship<br />
Total factor productivity<br />
Economists have studied a variety of consequences of entrepreneurship, such as<br />
profit, self-employment (with which it is often identified), foundation of new firms,<br />
market equilibration, and, more recently, growth. Historically, there has been a<br />
divide in the understanding of the growth process between those who stress the<br />
driving role of capital accumulation ( Jorgenson and Griliches, 1967; Lucas, 1988)<br />
and those who stress “technology” (Solow, 1956, 1957) and other factors that fall<br />
outside the accumulation of (physical and human) capital (cf. Aghion and Howitt,<br />
1998; Hulten, 2001). According to the latter camp, the growth process is fundamentally<br />
one of improvements in total factor productivity (TFP). Thus, disparities in<br />
wealth and productivity across nations are driven by “residual factors.” Klenow and<br />
Rodriguez-Clare (1997), Hall and Jones (1999), and Parente and Prescott (2005)<br />
present evidence that most of the extant cross-country differences in output per<br />
worker is driven by differences in total factor productivities.<br />
Entrepreneurship as a driver of total factor productivity<br />
Since the initial identification of the “unexplained” causes of growth (Solow, 1956),<br />
significant attention has been devoted to research and development (R&D) as a<br />
driver of growth (e.g., Romer, 1990; Coe and Helpman, 1995). However, R&D itself<br />
does not drive TFP; innovations that emerge from R&D do (Acs et al., 2009). In<br />
turn, innovations are introduced by enterprising firms and individuals (Schumpeter,<br />
1939; Baumol, 1993; Ireland et al., 2003; Kuratko and Audretsch, 2009). In addition,<br />
innovations have many other sources than R&D, and include process innovations<br />
and innovations of management and organization. Fundamentally, these processes<br />
are entrepreneurial (Baumol, 1993; Foss and Klein, 2012): they amount to combining<br />
and recombining heterogeneous resources (Schumpeter, 1911; Rosenberg,<br />
1992; Barney, 1991) in the uncertain pursuit of opportunities for profit. Their aggregate<br />
results are productivity advances and improvements in the use of resources,<br />
that is, increases in TFP.<br />
While Kirzner (1980) and others point to the logical conclusion that the “entrepreneur<br />
is the prime mover of progress,” growth economists until recently ignored<br />
any discussion or modelling of the entrepreneurial function (the first attempt to<br />
seriously grapple with the entrepreneur in growth economics is Aghion and Howitt,<br />
1998). The dominance of the production function paradigm since the 1950s is a<br />
main cause of this neglect (Foss and Klein, 2012): if production factors are assumed<br />
to be homogenous within categories, such as Solow’s assumption of “shmoo” capital,<br />
and production is assumed to be at the efficient frontier, there are, in Olson’s<br />
(1996) words, no “big bills left on the sidewalk.” In other words, there is no role for<br />
entrepreneurs or other actors to move the economy in any direction. Yet, within any<br />
description of the real world, factors of production are heterogeneous (Lachmann,<br />
1956), and how they should be combined is not obvious and a matter of discussion.<br />
Settling this matter with the given tangible knowledge available at any time<br />
necessarily requires technical and commercial processes that are fundamentally
How Institutions of Liberty Promote Entrepreneurship and Growth • 253<br />
experimental (Hayek, 2002; Matsusaka, 2001). In addition, what is at any moment<br />
the optimal combination will change as a result of changes in underlying scarcities<br />
and newly discovered knowledge. Hayek (2002) argues that, given the dispersed<br />
nature of knowledge in society, competition performs this matching mechanism in<br />
a superior way compared to any known (political) alternatives.<br />
On-going processes of industrial dynamics, that is, processes of mergers, divestments,<br />
spin-offs, new firm formation, and so on reflect such experimentation. On<br />
the aggregate level, these processes make the economy track its (moving) production-possibility<br />
frontier, improving the efficiency with which resources are used.<br />
These processes are driven by entrepreneurs and entrepreneurial firms. Also, entrepreneurs<br />
who are alert to knowledge produced abroad and import it in the hope of<br />
realizing a profit opportunity contribute to national catching-up (Fagerberg, 1987),<br />
that is, the national production possibility frontier tracking those of more advanced<br />
nations. In sum, entrepreneurship positively contributes to TFP.<br />
Institutions and transaction costs<br />
In addition to stressing the role of entrepreneurs in the growth process, economic<br />
historians have also pointed to the decisive role of institutions in the growth process<br />
(North, 1990; Rosenberg, 1992). The specialized literature on economic growth<br />
has for the last decade repeatedly documented the importance of different institutions<br />
and how they differentially affect growth (Acemoglu, 1995; Glaeser et al., 2004;<br />
Rodrik et al., 2004). The primary role of high-quality institutions seems to be that<br />
they entail decreased transaction costs through reducing the uncertainty of economic<br />
transactions. As North explains, “[t]he major role of institutions in a society is to<br />
reduce uncertainty by establishing a stable (but not necessarily efficient) structure to<br />
human interaction. The overall stability of an institutional framework makes complex<br />
exchange possible across both time and space” (North, 1990: 6; see also Barzel, 2005).<br />
The general characteristics of such institutional frameworks are generality (equals<br />
are treated equally), transparency and accountability in public decision-making and,<br />
importantly, a rational and verifiable expectation that the institutional decisions will<br />
be properly implemented and enforced. Thus, by creating proper incentives of political<br />
and economic actors to behave honestly and predictably, high-quality institutions<br />
help ensure that the consequences of economic undertakings are more easily foreseen<br />
and that incentives stimulate productive rather than unproductive behavior (Baumol,<br />
1990). This certainty increases the expected value of projects, reduces risk premia,<br />
and hence makes projects where medium profits and high risk are foreseen more<br />
likely to be undertaken, which eventually contributes to economic growth.<br />
Transmission mechanisms—freedom variables, entrepreneurship,<br />
and total factor productivity<br />
Increases in TFP result from a large number of radical and incremental processes<br />
involving start-ups as well as the entrepreneurship exercised by established firms.<br />
Given this, the flexibility (that is, costliness) with which such changes can be carried<br />
out becomes highly important. In terms of economic-production theory, this flexibility<br />
is captured by the notion of the elasticity of factor substitution (Klump and<br />
de la Grandville, 2000), that is, the percentage change in factor proportions due<br />
to a change in the marginal rate of technical substitution (in the extreme case of a<br />
Leontieff technology, for example, the elasticity is 0). At the level of a country, the<br />
(aggregate) elasticity of substitution is a measure of the flexibility of the economy<br />
www.freetheworld.com • www.fraserinstitute.org • Fraser Institute ©2012
254 • <strong>Economic</strong> <strong>Freedom</strong> of the <strong>World</strong>: 2012 Annual Report<br />
Fraser Institute ©2012 • www.fraserinstitute.org • www.freetheworld.com<br />
in reacting to, say, external shocks. It is also clear that the elasticity of substitution<br />
is affected by a number of forces: for example, an argument for liberalizing trade is<br />
that it expands the possibility set with respect to input combinations that a country’s<br />
entrepreneurs face. Hence, it becomes less likely that a single factor will act as<br />
a brake on the growth process (Ventura, 1997).<br />
Thus, as argued by Arrow and colleagues (1961) the aggregate elasticity of substitution<br />
is endogenous. Although certain inherent technical constraints imply that<br />
factors will never be perfect substitutes, we argue that the aggregate elasticity of<br />
substitution is to a large extent endogenous to institutional variables, specifically<br />
to freedom variables. In turn, a high elasticity of substitution implies high factor<br />
productivity, because it means that resources are more easily allocated to highly<br />
valued uses, new modes of organization and new processes are more easily put into<br />
practice, and so on.<br />
Underlying the positive impact on factor productivity of high elasticity of substitution<br />
is a high degree of certainty in dealings and, therefore, low transaction costs<br />
in searching for contract partners, bargaining, monitoring, and enforcing contracts.<br />
As we have already suggested, huge literatures in economic history, on intellectual<br />
property rights, and on innovation stress the importance for entrepreneurial activity<br />
at the micro-level and economic development at the macro-level of property rights<br />
being well defined and enforced (e.g., North, 1990; Mokyr, 2006). Well-defined and<br />
enforced property rights reduce the transaction costs of carrying out entrepreneurial<br />
activities: contracting costs are relatively low, implying low costs of searching for,<br />
negotiating with, and concluding bargains with owners of those inputs that enter<br />
into entrepreneurial ventures (Rosenberg, 1992). In short, the transaction costs of<br />
searching for, measuring, combining, and recombining heterogeneous assets in the<br />
pursuit of uncertain profits are low. Moreover, well-defined and enforced income<br />
rights imply that the risk of undertaking entrepreneurial activities is reduced (Foss<br />
and Foss, 2008), which may also stimulate the supply of entrepreneurship (Baumol,<br />
1993). If so, it can be expected that institutional features, such as the quality of regulations<br />
and the judicial system, positively affect TFP. As we outline above, similar reasoning<br />
applies to the freedom variable of sound money (cf. Friedman, 1962, 1977).<br />
Based on our earlier reasoning, the degree of openness to international trade<br />
and investment has a positive impact upon the elasticity of substitution and, in turn,<br />
TFP (Ventura, 1997). The reason is that a greater flow of trade through a country<br />
may imply a greater exposure to international opportunities, including adopting<br />
foreign technology, and a higher supply of venture capital.<br />
Following Kirzner (1985), public regulation is another important item in any<br />
measure of economic freedom that is relevant to understanding the flexibility with<br />
which the market system works and, therefore, also how TFP develops. Arguably,<br />
regulations can both help and hinder entrepreneurs who need clear rules and predictable<br />
enforcement of those rules. On one hand, excessive regulations impose<br />
burdens on all firms, not the least firms just starting up, that may imply prohibitive<br />
start-up costs. On the other hand, a measurement problem may arise since<br />
heavy regulations can force individuals with low marginal productivity entirely out<br />
of the labor force, thereby seemingly increasing productivity while lowering overall<br />
wealth. In addition, as Baumol (1990) pointed out, individuals operating in a<br />
heavily regulated economic environment may have larger gains from engaging in<br />
rent-seeking activities within the public sector—what he termed “destructive entrepreneurship”—than<br />
in real economic activities.
How Institutions of Liberty Promote Entrepreneurship and Growth • 255<br />
There are many reasons that the size of government may be expected on a priori<br />
grounds to influence TFP. As we note above, the degree of nationalization and the<br />
extent to which public monopolies are prevalent directly influence the ability of the<br />
industries to adapt effectively to changing circumstances (Mises, 1949). High levels<br />
of publicly financed provision of various services (e.g., care of the elderly, education),<br />
generous social security systems, and high levels of taxation, also negatively<br />
influence the level of entrepreneurial activity (Henrekson, 2005: 11), as already<br />
explained, and thereby put a brake on TFP.<br />
However, some scholars have argued that large welfare states create the sufficient<br />
stability to allow more people to commit larger amounts of capital to entrepreneurial<br />
activities (Galbraith, 2006). Another mechanism, introduced by Hirschman<br />
(1958), is the notion of a creative tension between government interventions and<br />
innovation: if government controls a large share of the economy, it places an artificial<br />
competitive pressure on private actors, which induces them to search for more<br />
productive solutions; that is, it forces them into entrepreneurial activities.<br />
In sum, the above suggests the hypothesis that secure property rights and a<br />
high-quality judicial system, sound money, and openness to international trade and<br />
investment positively influence TFP, while a high level of regulation and a large government<br />
and high taxes may or may not be harmful to TFP. We next move on to<br />
describing the data and empirical strategies to explore these issues.<br />
Data on entrepreneurship and total factor productivity<br />
First, our institutional data all derive from the annual reports of the Fraser Institute<br />
in <strong>Economic</strong> <strong>Freedom</strong> in the <strong>World</strong>. These data have been used in many studies on<br />
growth and other macroeconomic outcomes (de Haan and Sturm, 2000; Méon<br />
and Weill, 2005; de Haan et al., 2006; Dreher et al., 2007; Knack and Keefer, 1995;<br />
Bjørnskov, 2008; Justesen, 2008; Aghion et al., 2010). This literature documents<br />
how several aspects of economic freedom are strongly associated with economic<br />
growth, productivity, and various measures of human development. Our interest is<br />
in how these aspects influence entrepreneurship and, through this channel, affect<br />
TFP. We therefore need proxies for entrepreneurship and productivity.<br />
While TFP cannot be measured with any high degree of precision, we follow<br />
the standard in a growing literature in calculating a Solow residual from growth<br />
accounting exercises (e.g., Caselli, 2005; Bjørnskov and Foss, 2012). The identifying<br />
assumption in using the Solow residual is that production can be approximately<br />
characterized by a Cobb-Douglas production function with Y as output, K as physical<br />
real capital, L as labor input, and h as the stock of human capital; α captures the<br />
capital share of output while 1−α measures the share contributed by quality-adjusted<br />
labor. We outline this function in logs:<br />
logY = logA + α logK + (1−α)log (Lh) [1]<br />
Sorting out the share of output that can be attributed to capital and effective labor<br />
implies that the rest, A, must logically derive from the productivity of inputs, TFP.<br />
Following Bjørnskov and Méon’s (2010) estimates and setting α at .4, and using investment<br />
and output data from Heston et al. (2009) and human-capital data from Barro and<br />
Lee (2001), yields our TFP measure. We summarize the 2005 TFP measures in table 6.1.2<br />
2 Bjørnskov and Foss (2012) provide all specific details relating to the calculation of these numbers,<br />
as well as their robustness to different assumptions of the capital share or the depreciation<br />
www.freetheworld.com • www.fraserinstitute.org • Fraser Institute ©2012
256 • <strong>Economic</strong> <strong>Freedom</strong> of the <strong>World</strong>: 2012 Annual Report<br />
Fraser Institute ©2012 • www.fraserinstitute.org • www.freetheworld.com<br />
Table 6.1: Total factor productivity (TFP) and entrepreneurship in 2005<br />
TFP Entrepreneurship TFP Entrepreneurship<br />
Australia 90.03 17.3 Japan 78.83 10.9<br />
Austria 97.08 11.9 Mexico 64.66 27.4<br />
Belgium 109.62 12.1 Netherlands 93.81 12.5<br />
Canada 90.04 12.9 New Zealand 68.90 17.0<br />
Denmark 82.28 7.6 Norway 95.09 9.1<br />
Finland 87.45 10.9 Poland 67.71 16.8<br />
France 97.31 9.8 Portugal 84.99 22.2<br />
Germany 90.31 10.3 Spain 100.49 15.0<br />
Greece 88.46 27.2 Sweden 99.07 9.2<br />
Hungary 79.72 12.2 Switzerland 76.69 8.9<br />
Iceland 96.08 13.7 United Kingdom 99.54 11.7<br />
Ireland 116.03 15.8 United States 100.00 10.6<br />
Italy 99.26 22.7<br />
Note: all TFP data are percent of US productivity.<br />
Comparable, non-agricultural, self-employment rates would seem to be good<br />
proxies for entrepreneurship. Yet, while OECD statistics provide raw data on selfemployment,<br />
these data do not rest on similar definitions of self-employment and<br />
incorporated businesses and are, in general, not comparable across countries (OECD,<br />
2009). We therefore follow recent studies by employing the Compendia database,<br />
which provides the only cross-country data available that are comparable across countries<br />
by including owners and managers of both unincorporated and incorporated<br />
businesses, but neither family members nor self-employment as a secondary activity<br />
(van Stel, 2005). Although this excludes entrepreneurial activity that is kept within<br />
existing firms, entrepreneurship theory suggests that entrepreneurship is fundamentally<br />
about deploying resources to new uses in the pursuit of profit under uncertainty<br />
(Knight, 1921; Kirzner, 1997; Foss and Klein, 2012). Focusing entirely on primary<br />
self-employment ensures that we measure actual reported economic activity, and not<br />
prospective activities or activity in the shadow economy (Nyström, 2009).<br />
In the following, we combine the data on economic freedom in the six fiveyear<br />
periods ending in 1980, 1985, 1990, 1995, 2000, and 2005 with a set of control<br />
variables to get at estimates of the joint importance of economic freedom and<br />
entrepreneurship. In regressions in which entrepreneurship is the dependent variable,<br />
we add control variables to the set of economic freedom indices. These controls<br />
are a post-communist dummy, openness to trade, investment prices and a<br />
measure of international information flows. The price level of capital and investment<br />
goods (from the Penn <strong>World</strong> Tables) captures the costs of entrepreneurial<br />
start-ups (cf. Fonseca et al., 2001) while international information flows, which<br />
we get from Dreher (2006), proxy for the ease with which entrepreneurs can get<br />
rate used to calculate capital stocks. The capital stocks are calculated using the perpetual inventory<br />
method (King and Levine, 1994; Hall and Jones, 1999). In two robustness tests, we also<br />
provide the same numbers calculated with α set at either .3 or .5.
How Institutions of Liberty Promote Entrepreneurship and Growth • 257<br />
Table 6.2: Descriptive statistics of all variables<br />
Variable Mean Standard deviation Observations<br />
Agricultural employment 3.80572 2.7413 140<br />
Government consumption 4.784 1.650 140<br />
Government enterprise 6.807 2.487 140<br />
Government final consumption 15.043 3.882 140<br />
Government size 4.864 1.268 140<br />
Information flows 75.318 17.318 140<br />
Investment prices 82.857 23.410 140<br />
Legal quality 7.917 1.068 140<br />
Log population size 9.609 1.469 140<br />
Openness 68.746 32.439 140<br />
Post-communist 0.050 .219 140<br />
Entrepreneurship 14.988 5.816 140<br />
Sound money 8.507 1.627 140<br />
Special production 0.086 0.289 140<br />
Tax burden 2.856 2.226 139<br />
Total factor productivity 87.858 12.254 140<br />
Transfers and subsidies 5.012 1.694 140<br />
Regulatory freedom 6.357 1.02 140<br />
information from the rest of the world. In TFP regressions, we follow the general<br />
literature by adding a set of determinants of TFP: openness (trade volumes as percentage<br />
of GDP), two dummies for post-communist and Asian countries, the share<br />
of the population employed in agriculture, and a full set of period dummies to take<br />
joint international productivity increases into account. All variables derive from the<br />
Penn <strong>World</strong> Tables, mark 6.3 (Heston et al., 2009) except agricultural employment,<br />
which is from the <strong>World</strong> Bank’s (2011) database.<br />
Finally, we note the possibility that entrepreneurship might respond to productivity<br />
potential, that is, that productivity differences across countries would drive<br />
entrepreneurial differences. We handle this causality problem in our TFP regressions<br />
by employing three variables as instruments. Investment prices and information<br />
flows derive from the first set of regressions, while we also add the logarithm<br />
to population as an instrument, based on the assumption that countries with faster<br />
growing populations also have more entrepreneurs. This has the benefit of giving<br />
us more temporal identification. All data are summarized in table 6.2.<br />
These data provide a slightly unbalanced panel of 25 countries observed in the<br />
six five-year intervals between 1980 and 2005. We estimate determinants of entrepreneurship<br />
and TFP by simple OLS with Beck and Katz’s (1995) panel-corrected<br />
standard errors, to which we add instrumental variables for entrepreneurship in the<br />
second set of regressions. In Bjørnskov and Foss, 2012, we argue that this is necessary<br />
if potential or actual entrepreneurs rationally react to opportunities resulting<br />
from being behind the international production possibility frontier. In this case,<br />
TPF difference would drive entrepreneurship.<br />
www.freetheworld.com • www.fraserinstitute.org • Fraser Institute ©2012
258 • <strong>Economic</strong> <strong>Freedom</strong> of the <strong>World</strong>: 2012 Annual Report<br />
Determinants of entrepreneurship<br />
and total factor productivity<br />
Fraser Institute ©2012 • www.fraserinstitute.org • www.freetheworld.com<br />
Entrepreneurship estimates<br />
First, we estimate the effects of economic freedom on entrepreneurial activity. We<br />
mainly follow our approach in Bjørnskov and Foss (2008) but use self-employment<br />
as our measure of entrepreneurship in order to make all results comparable to the<br />
following estimates. As such, our overall estimates in table 6.3 here closely resemble<br />
those in Nyström (2009).<br />
We first note that the government-size index is positively associated with entrepreneurship.<br />
In other words, as in Bjørnskov and Foss (2008), which used a different<br />
measure of entrepreneurship, as well as the comparable analysis in Nyström<br />
(2009), more government intervention in the economy is detrimental to entrepreneurial<br />
activity. Similarly, we find that sound money and policies ensuring stable<br />
and predictable monetary institutions are associated with more entrepreneurship.<br />
Conversely, although legal quality is strongly associated with overall development,<br />
we find that it decreases the rate of entrepreneurship. While we can only speculate,<br />
this is consistent with legal institutions protecting innovation in formal firms, thus<br />
making self-employment and semiformal economic activity less attractive (Dreher<br />
and Gassebner, forthcoming).<br />
We also find that investment prices and information flows, which we use as<br />
instrumental variables in the following, are both negatively associated with entrepreneurship.<br />
On one hand, more expensive capital goods reduce the supply of entrepreneurial<br />
activity simply by making starting-up a firm more expensive. On the<br />
other hand, while perhaps not immediately intuitive, reduced information flows<br />
increase the premium on people with a comparative advantage in collecting, combining,<br />
and recombining information, that is, entrepreneurs.<br />
Results in columns 1 and 2 of table 6.3 suggest that a one-point improvement<br />
in the government size index is associated with almost half a percent more selfemployment.<br />
In columns 3 to 6, we move beyond Nyström’s (2009) study by<br />
exploring which subcomponents of government size are responsible for this effect.<br />
We find that two components are significant: government consumption and government<br />
enterprises, while transfers and subsidies and the tax burden are insignificant.<br />
This being the case, the estimates suggest that governments actively engaging in the<br />
economy, either through pure consumption or by competing with private actors<br />
through either government-owned enterprises or government subsidies, effectively<br />
crowd out entrepreneurial activity. Government enterprises, in particular, exert a<br />
strongly significant and sizeable negative effect on entrepreneurship. The same<br />
applies to sound money, which is also often negatively affected by governments<br />
trying to affect the economy and raise seignorage. Freely operating capital markets<br />
and predictable monetary circumstances clearly enable entrepreneurship.<br />
In sum, elements of economic freedom thus affect entrepreneurial activity substantially.<br />
In the following, we assess the dynamic productivity consequences of<br />
these direct effects on entrepreneurship.<br />
Estimates of total factor productivity<br />
The estimates in table 6.4 first exhibit intuitive results with respect to the small set of<br />
control variables. Openness to trade is significantly positive in three of five columns<br />
and larger agricultural sectors are associated with substantially smaller measured
Table 6.3: Determinants of entrepreneurship<br />
Information flows −.156 ***<br />
(.027)<br />
Investment price level −.069 ***<br />
(.014)<br />
Openness .010<br />
(.007)<br />
Agricultural employment .889 ***<br />
(.168)<br />
Government size .411 **<br />
(.187)<br />
How Institutions of Liberty Promote Entrepreneurship and Growth • 259<br />
1 2 3 4 5 6<br />
−.145 ***<br />
(.026)<br />
−.072 ***<br />
(.013)<br />
.915 ***<br />
(.151)<br />
.385 **<br />
(.157)<br />
−.131 ***<br />
(.027)<br />
−.065 ***<br />
(.014)<br />
.963 ***<br />
(.148)<br />
Government consumption .340 ***<br />
(.124)<br />
−.142 ***<br />
(.026)<br />
−.076 ***<br />
(.013)<br />
.908 ***<br />
(.155)<br />
Transfers and subsidies .184<br />
(.133)<br />
−.163 ***<br />
(.026)<br />
−.073 ***<br />
(.012)<br />
.945 ***<br />
(.149)<br />
Government enterprise .367 ***<br />
(.103)<br />
−.141 ***<br />
(.026)<br />
−.077 ***<br />
(.013)<br />
Tax burden .007<br />
(.092)<br />
Legal quality −1.439 ***<br />
(.309)<br />
Sound money .999 ***<br />
(.235)<br />
<strong>Freedom</strong> to trade −.151<br />
(.411)<br />
Regulatory freedom .089<br />
(.403)<br />
Post-Communist −6.502 ***<br />
(1.047)<br />
−1.392 ***<br />
(.295)<br />
.948 ***<br />
(.219)<br />
−6.595 ***<br />
(1.065)<br />
−1.308 ***<br />
(.301)<br />
.889 ***<br />
(.219)<br />
−7.465 ***<br />
(.988)<br />
−1.388 ***<br />
(.296)<br />
.989 ***<br />
(.219)<br />
−6.819 ***<br />
(1.120)<br />
−1.437 ***<br />
(.298)<br />
1.008 ***<br />
(.221)<br />
−5.860 ***<br />
(1.173)<br />
Period dummies Yes Yes Yes Yes Yes Yes<br />
№ of observations 140 140 140 140 140 139<br />
Countries 25 25 25 25 25 25<br />
.959 ***<br />
(.153)<br />
−1.364 ***<br />
(.303)<br />
.978 ***<br />
(.224)<br />
−7.084 ***<br />
(1.098)<br />
R-squared .825 .823 .823 .819 .829 .817<br />
Wald Chi 741.69 684.37 660.49 636.18 622.52 585.39<br />
Note: all estimates are 2SLS; *** (**) [*] denote significance at p
260 • <strong>Economic</strong> <strong>Freedom</strong> of the <strong>World</strong>: 2012 Annual Report<br />
Table 6.4: Basic estimates, determinants of total factor productivity<br />
Openness .072 **<br />
(.031)<br />
Agricultural employment −5.733 ***<br />
(.720)<br />
Asia −8.014 ***<br />
(2.373)<br />
Post-communist .970<br />
(4.892)<br />
<strong>Economic</strong> freedom −2.879 *<br />
(1.507)<br />
Fraser Institute ©2012 • www.fraserinstitute.org • www.freetheworld.com<br />
1 2 3 4 5<br />
.059 *<br />
(.034)<br />
−6.282 ***<br />
(.884)<br />
−7.921 **<br />
(3.157)<br />
7.078<br />
(5.622)<br />
Government size −.157<br />
(.728)<br />
Legal quality 3.901 **<br />
(1.657)<br />
Sound money −.373<br />
(.839)<br />
<strong>Freedom</strong> to trade −1.095<br />
(1.765)<br />
Regulatory freedom −4.871 ***<br />
(1.493)<br />
Entrepreneurship 1.820 ***<br />
(.323)<br />
2.185 ***<br />
(.431)<br />
.051<br />
(.032)<br />
−6.282 ***<br />
(.849)<br />
−7.474 ***<br />
(2.695)<br />
9.329<br />
(6.111)<br />
4.350 **<br />
(1.754)<br />
−5.207 ***<br />
(1.378)<br />
2.339 ***<br />
(.487)<br />
.065 **<br />
(.033)<br />
−6.563 ***<br />
(.925)<br />
−4.343<br />
(2.800)<br />
3.526<br />
(6.635)<br />
4.970 ***<br />
(1.861)<br />
−6.922 ***<br />
(1.465)<br />
2.464 ***<br />
(.512)<br />
.035<br />
(.032)<br />
−5.992 ***<br />
(.812)<br />
−10.769 ***<br />
(2.623)<br />
Period dummies Yes Yes Yes Yes Yes<br />
№ of observations 140 140 140 140 140<br />
Countries 25 25 25 25 25<br />
15.802 ***<br />
(5.966)<br />
3.672**<br />
(1.774)<br />
−3.453 ***<br />
(1.344)<br />
R-squared .433 .430 .396 .429 .383<br />
Wald Chi / F stat 21.82 13.54 16.18 17.72 15.73<br />
First stage F stat 23.52 18.33 14.61 14.61 14.61<br />
Hansen J stat, p< .329 .065 .458 .459 .084<br />
Note: all estimates are 2SLS; *** (**) [*] denote significance at p
How Institutions of Liberty Promote Entrepreneurship and Growth • 261<br />
direct government intervention, entrepreneurial talent and effort might arguably<br />
flow more readily to its most productive uses. What the estimates show is that this<br />
entrepreneurial activity is actually contributing positively to productivity differences<br />
across OECD countries.<br />
However, one needs to be careful when interpreting TFP studies, as results can<br />
often depend on specific identifying assumptions. In column 4 of table 6.4, we<br />
therefore replace our preferred TFP measures with data calculated using a much<br />
lower capital share (α = .3) while in column 5 we do the opposite and assume a<br />
high capital share (α = .5). While these changes cause large differences in the estimates<br />
of regulatory freedom, openness and the Asian dummy, the point estimate of<br />
entrepreneurship remains remarkably stable. As such, this finding is not sensitive<br />
to assumptions of the production function, that is, it is not driven by economies<br />
that are particularly labor- or capital-intensive. It also remains stable when deleting<br />
single countries, single periods, or adding further control variables (Bjørnskov<br />
and Foss, 2012).<br />
How large are the effects?<br />
As a final exercise, we therefore use the central estimates from both tables to track<br />
the effects of changes in economic freedom on TFP within a time horizon of five<br />
years (figure 6.2). First, a one-point improvement in the overall size-of-government<br />
index is associated with .39 percentage points additional entrepreneurial<br />
activity, or roughly 7% of a standard deviation. However, as only two of four elements<br />
of government size are significantly associated with entrepreneurship, the<br />
estimate of the overall index is likely to be biased towards zero. Adding the two<br />
significant components instead suggests a joint effect of the government consumption<br />
and government enterprise indices roughly double of the overall index.<br />
Similarly, a one-point improvement in sound money yields almost one percentage<br />
point more entrepreneurship, or 16 % of a standard deviation. A similar improvement<br />
in legal quality conversely causes a 1.3 percentage point (24% of a standard<br />
deviation) decline.<br />
These changes in turn affect TFP. The government size improvements add<br />
1.6 points to the TFP measure, an improvement of 13% of a standard deviation,<br />
entirely mediated by entrepreneurship. In the same way, an improvement in sound<br />
money results in a 2.2 point (16% of a standard deviation) improvement in TFP.<br />
Finally, while legal quality exerts a negative indirect effect through entrepreneurship<br />
within new firms, its direct effect—most likely by causing more entrepreneurial<br />
activity in existing firms—dominates and creates a net effect of 1.1 points (9%<br />
of a standard deviation).<br />
As such, the total effects on TFP of changes in economic freedom are substantial.<br />
A one-point change to total economic freedom, arising from changes to government<br />
size, legal quality, and sound money, therefore result in an increase in TFP<br />
of approximately 35% to 40% of a standard deviation. In 2005, this was approximately<br />
the productivity difference between Portugal and Germany and, therefore,<br />
a substantial effect.<br />
Concluding discussion<br />
Entrepreneurship has often been linked to the growth process, albeit mainly informally<br />
and in policy-oriented work. The same may be said of institutions of economic<br />
freedom. However, few studies consider both determinants simultaneously,<br />
www.freetheworld.com • www.fraserinstitute.org • Fraser Institute ©2012
262 • <strong>Economic</strong> <strong>Freedom</strong> of the <strong>World</strong>: 2012 Annual Report<br />
Size of eect on TFP<br />
3<br />
2<br />
1<br />
0<br />
-1<br />
-2<br />
-3<br />
-4<br />
Fraser Institute ©2012 • www.fraserinstitute.org • www.freetheworld.com<br />
Figure 6.2: Eect on total factor productivity of one-point change in three areas<br />
of economic freedom: size of government, sound money and legal quality<br />
Size of government<br />
Sound money<br />
Area of economic freedom<br />
Indirect eect<br />
Total eect<br />
Legal quality<br />
which is the main purpose of this chapter, perhaps due to the intricacies involved in<br />
featuring institutions and entrepreneurship in the same model, as well as the general<br />
problem of securing reliable data on entrepreneurship. There is nevertheless a<br />
need to bring these determinants together, as there are strong reasons to suspect<br />
that they are closely intertwined in the growth process. We have argued that entrepreneurship<br />
influences total factor productivity because the optimal combination<br />
of productive factors is not a datum but needs to be discovered and rediscovered<br />
in response to changing circumstances by enterprising firms and individuals (however,<br />
we do not possess the micro-level data that will allow us to test this part<br />
of our overall argument). We argued that it is particularly natural to assume that<br />
entrepreneurship affects TFP. Similarly, we argued that the effects of institutions<br />
of economic freedom on TFP are mediated through the reduction of uncertainty<br />
and transaction costs that institutions may bring about (cf. North, 1990), which<br />
in turns eases the process of commercial experimentation. Relative to the extant<br />
literature, our emphasis on TPF as well as the mediating role of entrepreneurship<br />
are novel contributions.<br />
Relying on harmonized entrepreneurship data (van Stel, 2005), we exploit<br />
a unique dataset consisting of 25 countries observed in the six five-year intervals<br />
between 1980 and 2005, and test the influence of economic freedom on<br />
entrepreneurship, and in turn the influence of entrepreneurship on TFP. While<br />
entrepreneurship strongly and significantly affects TFP, our results only partially<br />
support the intuition that institutions of liberty as well as liberal economic policies<br />
promote growth in productivity. In fact, we find no significant direct effects<br />
of size of government or sound money on TFP in the medium run. What our set<br />
of estimates suggests is that two main elements of economic freedom—size of<br />
government and the access to sound money—affect TFP entirely through their<br />
influence on entrepreneurial activity. Conversely, institutions of property rights<br />
protection reduce entrepreneurial activity in new firms but still exert an overall<br />
positive effect on TFP.
How Institutions of Liberty Promote Entrepreneurship and Growth • 263<br />
Our results thus suggest that large welfare states and societies with weak monetary<br />
institutions suffer productivity loses relative to other comparable countries,<br />
as these features significantly reduce the supply of entrepreneurship (Henrekson,<br />
2005; Kreft and Sobel, 2005; Bjørnskov and Foss, 2008; Nyström, 2009). However,<br />
while the mass of all these entrepreneurial activities have historically caused major<br />
technological breakthroughs that influenced growth and development in the course<br />
of economic history (cf. Mokyr, 2006), they are seldom visible from the point of<br />
view of politics. Yet, while very few single entrepreneurial innovations visibly drive<br />
overall job creation, a substantial part of job creation is driven by self-employment<br />
and small firms (Baptista et al., 2007; Malchow-Møller et al., 2011). In this perspective,<br />
it is a paradox that, although entrepreneurial ventures as activities are limited by<br />
the rise of the welfare state, they at the same time protect welfare states from falling<br />
too far behind in terms of productivity in the private sector that necessarily finances<br />
welfare spending. The long-run dynamics of such political-economic systems seem<br />
worthy of further research.<br />
www.freetheworld.com • www.fraserinstitute.org • Fraser Institute ©2012
264 • <strong>Economic</strong> <strong>Freedom</strong> of the <strong>World</strong>: 2012 Annual Report<br />
References<br />
Fraser Institute ©2012 • www.fraserinstitute.org • www.freetheworld.com<br />
Acemoglu, Daron (1995). Reward Structures and the Allocation of Talent.<br />
European <strong>Economic</strong> Review 39: 17–33.<br />
Acs, Zoltan, J. Pontus Braunerhjelm, David B. Audretsch, and Bo Carlsson<br />
(2009). The Knowledge Spillover Theory of Entrepreneurship. Small Business<br />
<strong>Economic</strong>s 32: 15-30.<br />
Agarwal, Rajshree, Jay B. Barney, Nicolai J. Foss, and Peter G. Klein (2010).<br />
Heterogeneous Resources and the Financial Crisis: Implications of Strategic<br />
Management Theory. Strategic Organization 7: 467–484.<br />
Aghion, Philippe, Yann Algan, Pierre Cahuc, and Andrei Shleifer (2010).<br />
Regulation and Distrust. Quarterly Journal of <strong>Economic</strong>s 25, 1015–1049.<br />
Aghion, Philippe, and Peter Howitt (1998). Capital Accumulation and Innovation<br />
as Complementary Factors in Long-Run Growth. Journal of <strong>Economic</strong> Growth 3:<br />
111–130.<br />
Arrow, K.J., H.B. Chenery, B.S. Minhas, and R.M. Solow (1961). Capital-Labour<br />
Substitution and <strong>Economic</strong> Efficiency. Review of <strong>Economic</strong>s and Statistics 43:<br />
225–250.<br />
Audretsch, David B., and Roy Thurik (2001). What’s New about the New<br />
Economy? Sources of Growth in the Managed and Entrepreneurial Economies.<br />
Industrial and Corporate Change 10: 267–315.<br />
Baptista, Rui, Vitor Escária, and Paulo Madruga (2008). Entrepreneurship,<br />
Regional Development and Job Creation: The Case of Portugal. Small Business<br />
<strong>Economic</strong>s 30: 49–58.<br />
Barney, Jay B. (1991). Firm Resources and Sustained Competitive Advantage.<br />
Journal of Management 17: 99–120.<br />
Barro, Robert J. (1991). <strong>Economic</strong> Growth in a Cross-Section of Countries.<br />
Quarterly Journal of <strong>Economic</strong>s 106: 407–443.<br />
Barro, Robert J., and Jong-Wha Lee (2001). International Data on Educational<br />
Attainment: Updates and Implications. Oxford <strong>Economic</strong> Papers 53: 541–563.<br />
Barzel, Yoram (2005). A Theory of the State. Cambridge University Press.<br />
Baumol, William J. (1990). Entrepreneurship: Productive, Unproductive, and<br />
Destructive. Journal of Political Economy 98: 893–919.<br />
Baumol, William J. (1993). Entrepreneurship, Management, and the Structure of<br />
Payoffs. MIT Press.
How Institutions of Liberty Promote Entrepreneurship and Growth • 265<br />
Beck, Nathaniel, and Jonathan N. Katz (1995). Nuisance vs. Substance: Specifying<br />
and Estimating Time-Series Cross Section Models. Political Analysis 6: 1–36.<br />
Bianchi, Milo, and Magnus Henrekson (2005). Is Neoclassical <strong>Economic</strong>s Still<br />
Entrepreneurless? Kyklos 58: 353–377.<br />
Bjørnskov, Christian (2008). The Growth-Inequality Association: Government<br />
Ideology Matters. Journal of Development <strong>Economic</strong>s 87: 300–308.<br />
Bjørnskov, Christian, and Nicolai J. Foss (2008). <strong>Economic</strong> <strong>Freedom</strong> and<br />
Entrepreneurial Activity: Some Cross-Country Evidence. Public Choice 134: 307–328.<br />
Bjørnskov, Christian, and Nicolai J. Foss (2012). Do <strong>Economic</strong> <strong>Freedom</strong> and<br />
Entrepreneurship Impact Total Factor Productivity? Mimeo. Copenhagen<br />
Business School.<br />
Bjørnskov, Christian, and Pierre-Guillaume Méon (2010). The Productivity<br />
of Trust. Centre Emil Bernheim Working Paper 10-042. Université Libre de<br />
Bruxelles.<br />
Blanchflower, David G. (2000). Self-Employment in OECD countries. Labour<br />
<strong>Economic</strong>s 7: 471–505.<br />
Blau, David M. (1987). A Time-Series Analysis of Self-Employment in the United<br />
States. Journal of Political Economy 95: 445–467.<br />
Brunetti, Aymo, Gregory Kisunko, and Beatrice Weder (1997). Institutional<br />
Obstacles to Doing Business: Region-By-Region Results from a <strong>World</strong>wide<br />
Survey of the Private Sector. Background paper for <strong>World</strong> Development Report<br />
1997, Policy Research Working Paper 1759. The <strong>World</strong> Bank.<br />
Cagetti, Marco, and Mariacristina De Nardi (2006). Entrepreneurship, Frictions,<br />
and Wealth. Journal of Political Economy 114: 835–870.<br />
Carlsson, Fredrik, and Susanna Lundström (2002). <strong>Economic</strong> <strong>Freedom</strong> and<br />
Growth: Decomposing the Effects. Public Choice 112: 335–344.<br />
Caselli, Francesco (2005). Accounting for Cross-Country Income Differences.<br />
In Philippe Aghion and Steven Durlauf (eds.), Handbook of <strong>Economic</strong> Growth<br />
(Elsevier): 679–742.<br />
Coe, David T., and Elhanan Helpman (1995). International R&D Spillovers.<br />
European <strong>Economic</strong> Review 39: 859–887.<br />
Demsetz, Harold (1967). Toward a Theory of Property Rights. American<br />
<strong>Economic</strong> Review 57: 347–359.<br />
Dreher, Axel (2006). Does Globalization Affect Growth? Evidence From a New<br />
Index of Globalization. Applied <strong>Economic</strong>s 38: 10 91–1110.<br />
www.freetheworld.com • www.fraserinstitute.org • Fraser Institute ©2012
266 • <strong>Economic</strong> <strong>Freedom</strong> of the <strong>World</strong>: 2012 Annual Report<br />
Fraser Institute ©2012 • www.fraserinstitute.org • www.freetheworld.com<br />
Dreher, Axel, and Martin Gassebner (forthcoming). Greasing the Wheels? The<br />
Impact of Regulation and Corruption on Firm Entry. Public Choice.<br />
Dreher, Axel, Christos Kotsogiannis, and Steve McCorriston (2007). Corruption<br />
around the <strong>World</strong>: Evidence from a Structural Model. Journal of Comparative<br />
<strong>Economic</strong>s 35: 443–466.<br />
Fagerberg, Jan (1987). A Technology Gap Approach to Why Growth Rates Differ.<br />
Research Policy 16: 87–99.<br />
Fonseca, Raquel, Paloma Lopez-Garcia, and Christopher A. Pissarides (2001).<br />
Entrepreneurship, Start-up Costs and Employment. European <strong>Economic</strong> Review<br />
45: 692–705.<br />
Foss, Kirsten, and Nicolai J. Foss (2008). Understanding Opportunity Discovery<br />
and Sustainable Advantage: the Role of Transaction Costs and Property Rights.<br />
Strategic Entrepreneurship Journal 2: 191–207.<br />
Foss, Kirsten, Nicolai J. Foss, Peter G. Klein, and Sandra Klein (2007).<br />
Heterogenous Capital and the Organization of Entrepreneurship. Journal of<br />
Management Studies 4 4: 1165–1186.<br />
Foss, Nicolai J., and Peter G. Klein (2012). Organizing Entrepreneurial Judgment: A<br />
New Theory of the Firm. Cambridge University Press.<br />
Friedman, Milton (1962). Capitalism and <strong>Freedom</strong>. University of Chicago Press.<br />
Friedman, Milton (1977). Nobel Lecture: Inflation and Unemployment. Journal<br />
of Political Economy 85: 451–472.<br />
Galbraith, James K. (2006). Some Notes on Entrepreneurship and Welfare State.<br />
Industrial and Corporate Change 15: 203–207.<br />
Glaeser, Edward L., Rafael La Porta, Florencio Lopez de Silanes, and Andrei<br />
Shleifer (2004). Do Institutions Cause Growth? Journal of <strong>Economic</strong> Growth 9:<br />
271–303.<br />
Gwartney, James, Robert Lawson, and Randall Holcombe (1999). <strong>Economic</strong><br />
<strong>Freedom</strong> and the Environment for <strong>Economic</strong> Growth. Journal of Institutional and<br />
Theoretical <strong>Economic</strong>s 155: 643–663.<br />
Grilo, Isabel, and Roy Thurik (2004). Determinants of Entrepreneurship in<br />
Europe. Discussion Paper no. 3004, Max Planck Institute for Research into<br />
<strong>Economic</strong> Systems, Group Entrepreneurship, Growth and Public Policy.<br />
Haan, Jakob de, Susanna Lundström, and Jan-Egbert Sturm (2006). Market-<br />
Oriented Institutions and Policies and <strong>Economic</strong> Growth: A Critical Survey.<br />
Journal of <strong>Economic</strong> Surveys 20: 157–191.
How Institutions of Liberty Promote Entrepreneurship and Growth • 267<br />
Haan, Jakob de, and Jan-Egbert Sturm (2000). On the Relationship between<br />
<strong>Economic</strong> <strong>Freedom</strong> and <strong>Economic</strong> Growth. European Journal of Political Economy<br />
16: 215–241.<br />
Hall, R.E., and C.I. Jones (1999). Why Do Some Countries Produce So Much<br />
More Output per Worker Than Others? The Quarterly Journal of <strong>Economic</strong>s 114:<br />
83–116.<br />
Hayek, Friedrich A. (1945). The Use of Knowledge in Society. American <strong>Economic</strong><br />
Review 35: 519–530.<br />
Hayek, Friedrich A. (2002). Competition as a Discovery Procedure. Translation<br />
by Marcellus S. Snow from German of Der Wettbewerb als Entdeckungsverfahren<br />
(1968), a lecture sponsored by the Institut für Weltwirtschaft, University of Kiel;<br />
published as No. 56 in the series, Kieler Vorträge. Quarterly Journal of Austrian<br />
<strong>Economic</strong>s 5: 9–23.<br />
Henrekson, Magnus (2005). Entrepreneurship: A Weak Link in the Welfare<br />
State? Industrial and Corporate Change 14: 437–467.<br />
Heston, Alan, Robert Summers, and Betina Aten (2009). Penn <strong>World</strong> Tables<br />
Version 6.3. University of Pennsylvania, Center for International Comparisons of<br />
Production, Income and Prices.<br />
Hirschman, Albert O. (1958). The Strategy of <strong>Economic</strong> Development. Yale<br />
University Press.<br />
Holcombe, Randall (1998). Entrepreneurship and <strong>Economic</strong> Growth. Quarterly<br />
Journal of Austrian <strong>Economic</strong>s 1: 45–62.<br />
Hulten, Charles R. (2001). Total Factor Productivity: A Short Biography.<br />
In Charles R. Hulten, Edwin. R. Dean, and Michael J. Harper (eds.), New<br />
Developments in Productivity Analysis (NBER Books): 1–54.<br />
Ireland, R Duane, Michael A. Hitt, and David G. Sirmon (2003). A Model<br />
of Strategic Entrepreneurship: The Construct and its Dimensions. Journal of<br />
Management 29: 963–989.<br />
Jorgenson, Dale W., and Zvi Griliches (1967). The Explanation of Productivity<br />
Change. Review of <strong>Economic</strong> Studies 34: 249–283.<br />
Justesen, Mogens K. (2008). The Effect of <strong>Economic</strong> <strong>Freedom</strong> on Growth: New<br />
Evidence from a Panel of Countries, 1970–1999. European Journal of Political<br />
Economy 24, 642–660.<br />
Kirzner, Israel M. (1980). The Prime Mover of Progress. In Israel M. Kirzner and<br />
Arthur Seldon (eds.), The Entrepreneur in Capitalism and Socialism (Institute of<br />
<strong>Economic</strong> Affairs): 1–30.<br />
www.freetheworld.com • www.fraserinstitute.org • Fraser Institute ©2012
268 • <strong>Economic</strong> <strong>Freedom</strong> of the <strong>World</strong>: 2012 Annual Report<br />
Fraser Institute ©2012 • www.fraserinstitute.org • www.freetheworld.com<br />
Kirzner, Israel M. (1985). Discovery and the Capitalist Process. University of<br />
Chicago Press.<br />
Kirzner, Israel M. (1997). Entrepreneurial Discovery and the Competitive Market<br />
Process: An Austrian Approach. Journal of <strong>Economic</strong> Literature 35: 60–85.<br />
Klenow, Peter J., and Andrés Rodriguez-Clare (1997). The Neoclassical Revival<br />
in Growth <strong>Economic</strong>s: Has It Gone Too Far? NBER Macroeconomics Annual 12:<br />
73–103.<br />
Klump, Rainer, and Olivier de la Grandville (2000). <strong>Economic</strong> Growth and<br />
the Elasticity of Substitution: Two Theorems and Some Suggestions. American<br />
<strong>Economic</strong> Review 90: 282–291.<br />
Knack, Stephen, and Philip Keefer (1995). Institutions and <strong>Economic</strong><br />
Performance: Cross-Country Tests Using Alternative Institutional Measures.<br />
<strong>Economic</strong>s and Politics 7: 207–227.<br />
Knight, Frank H. (1921). Risk, Uncertainty, and Profit. Augustus M. Lelley.<br />
Kortum, Samuel S., and Josh Lerner (2000). Assessing the Contribution of<br />
Venture Capital to Innovation. Rand Journal of <strong>Economic</strong>s 31: 674–691.<br />
Kreft, Steven F., and Russell S. Sobel (2005). Public Policy, Entrepreneurship, and<br />
<strong>Economic</strong> <strong>Freedom</strong>. Cato Journal 25: 595–616.<br />
Kuratko, Donald F., and David B. Audretsch (2009). Strategic Entrepreneurship:<br />
Exploring Different Perspectives on an Emerging Concept. Entrepreneurship<br />
Theory and Practice 33: 1–17.<br />
Kuznets, Simon (1955). <strong>Economic</strong> Growth and Income Inequality. American<br />
<strong>Economic</strong> Review 45: 1–28.<br />
Lachmann, Ludwig M. (1956). Capital and Its Structure. Sheed, Andrews, and<br />
McMeel.<br />
Lazear, Edward M. (2002). Entrepreneurship. NBER working paper 9109.<br />
Lucas, Robert (1988). On the Mechanics of <strong>Economic</strong> Development. Journal of<br />
Monetary <strong>Economic</strong>s 22: 3–42.<br />
Malchow-Møller, Nikolaj, Bertel Schjerning, and Anders Sørensen (2011).<br />
Entrepreneurship, Job Creation, and Wage Growth. Small Business <strong>Economic</strong>s 36:<br />
15–32.<br />
Matsusaka, John (2001). Corporate Diversification, Value Maximization, and<br />
Organizational Capabilities. Journal of Business 74: 409–432.
How Institutions of Liberty Promote Entrepreneurship and Growth • 269<br />
Méon, Pierre-Guillaume, and Laurent Weill (2005). Does Better Governance<br />
Foster Efficiency? An Aggregate Frontier Analysis. <strong>Economic</strong>s of Governance 6:<br />
75–90.<br />
Mises, Ludvig von (1949). Human Action: A Treatise on <strong>Economic</strong>s. William Hodge.<br />
Mokyr, Joel (2006). Long-Term <strong>Economic</strong> Growth and the History of<br />
Technology. In Philippe Aghion and Steven Durlauf (eds.), Handbook of <strong>Economic</strong><br />
Growth (Oxford University Press): 1113–1180.<br />
North, Douglass N. (1990). Institutions, Institutional Change, and <strong>Economic</strong><br />
Performance. Cambridge University Press.<br />
North, Douglass N., William Summerhill, and Barry R. Weingast (2000).<br />
Order, Disorder and <strong>Economic</strong> Change: Latin America vs. North America. In<br />
Bruce Bueno de Mesquita and Hilton Root, eds., Governing for Prosperity (Yale<br />
University Press): 17–58.<br />
Nyström, Kristina (2009). The Institutions of <strong>Economic</strong> <strong>Freedom</strong> and<br />
Entrepreneurship: Evidence From Panel Data. Public Choice 136: 269–282.<br />
Olson, Mancur (1996). Big Bills Left on the Sidewalk: Why Some Nations Are<br />
Rich, Others Poor. Journal of <strong>Economic</strong> Perspectives 10: 3–24.<br />
Organisation for <strong>Economic</strong> Co-operation and Development [OECD] (2009).<br />
Measuring Entrepreneurship. OECD.<br />
Parente, Stephen, and Edward C. Prescott (2005). A Unified Theory of<br />
International Income Levels. In Philippe Aghion and Steven Durlauf (eds.),<br />
Handbook of <strong>Economic</strong> Growth (Oxford University Press): 1371–1416.<br />
Rodrik, Dani, Arvind Subramanian, and Francesco Trebbi (2004). Institutions<br />
Rule: The Primacy of Institutions over Geography and Integration in <strong>Economic</strong><br />
Development. Journal of <strong>Economic</strong> Growth 9: 131–165.<br />
Romer, Paul (1990). Endogenous Technological Change. Journal of Political<br />
Economy 98: 71–102.<br />
Rosenberg, Nathan (1992). <strong>Economic</strong> Experiments. Industrial and Corporate<br />
Change 1: 181–203.<br />
Rosenberg, Nathan, and L.E. Birdzell, Jr. (1986). How the West Grew Rich: The<br />
<strong>Economic</strong> Transformation of the Industrial <strong>World</strong>. Basic Books.<br />
Schumpeter, Joseph A. (1911). Theorie der Wirtschaftlichen Entwicklung.<br />
Eine Untersuchung ueber Unternehmergewinn, Kaptial, Kredit, Zins und den<br />
Konjunkturzyklus. Duncker und Humblot.<br />
www.freetheworld.com • www.fraserinstitute.org • Fraser Institute ©2012
270 • <strong>Economic</strong> <strong>Freedom</strong> of the <strong>World</strong>: 2012 Annual Report<br />
Fraser Institute ©2012 • www.fraserinstitute.org • www.freetheworld.com<br />
Schumpeter, Joseph A. (1939). Business Cycles: A Theoretical, Historical and<br />
Statistical Analysis of the Capitalist Process. McGraw-Hill.<br />
Solow, Robert (1956). A Contribution to the Theory of Growth. Quarterly Journal<br />
of <strong>Economic</strong>s 70: 65–94.<br />
Solow, Robert (1957). Technical Change and the Aggregate Production Function.<br />
Review of <strong>Economic</strong>s and Statistics 39: 312–320.<br />
Temple, Jonathan (1999). The New Growth Evidence. Journal of <strong>Economic</strong><br />
Literature 37: 112–156.<br />
van Stel, André J. (2005). COMPENDIA: Harmonising Business Ownership<br />
Data across Countries and over Time. International Entrepreneurship and<br />
Management Journal 1: 105–123.<br />
Ventura, Jaume (1997). Growth and Interdependence. Quarterly Journal of<br />
<strong>Economic</strong>s 62: 57–84.<br />
Wazciarg, Romain (2001). Measuring the Dynamic Gains from Trade. <strong>World</strong><br />
Bank <strong>Economic</strong> Review 15: 393–429.<br />
Wennekers, Sander, and Roy Thurik (1999). Linking Entrepreneurship and<br />
<strong>Economic</strong> Growth. Small Business <strong>Economic</strong>s 13: 27–55.<br />
<strong>World</strong> Bank (2011). <strong>World</strong> Development Indicators. The <strong>World</strong> Bank.<br />
Young, Andrew (1995). The Tyranny of Numbers: Confronting the Statistical<br />
Realities of the East Asian Growth Experience. Quarterly Journal of <strong>Economic</strong>s 110:<br />
641–680.
Appendix Explanatory Notes and Data Sources<br />
Area 1 Size of Government<br />
A Government consumption<br />
This component is measured as general government consumption spending as a<br />
percentage of total consumption. The rating for this component is equal to: (V max −<br />
V i ) / (V max − V min ) multiplied by 10. The V i is the country’s actual government consumption<br />
as a proportion of total consumption, while the V max and V min were set at<br />
40 and 6, respectively. The 1990 data were used to derive the maximum and minimum<br />
values for this component. Countries with a larger proportion of government<br />
expenditures received lower ratings. In contrast, as the ratio approaches the maximum<br />
value, the ratio moves toward zero.<br />
Sources <strong>World</strong> Bank, <strong>World</strong> Development Indicators (various issues); International<br />
Monetary Fund, International Financial Statistics (various issues); United Nations<br />
National Accounts.<br />
B Transfers and subsidies<br />
This component is measured as general government transfers and subsidies as a<br />
percentage of GDP. The rating for this component is equal to: (V max − V i ) / (V max −<br />
V min ) multiplied by 10. The V i is the country’s ratio of transfers and subsidies to GDP,<br />
while the V max and V min values are set at 37.2 and 0.5, respectively. The 1990 data<br />
were used to derive the maximum and minimum values for this component. The<br />
formula will generate lower ratings for countries with larger transfer sectors. When<br />
the size of a country’s transfer sector approaches that of the country with the largest<br />
transfer sector during the 1990 benchmark year, the rating of the country will<br />
approach zero.<br />
Sources International Monetary Fund, Government Finance Statistics Yearbook<br />
(various years); <strong>World</strong> Bank, <strong>World</strong> Development Indicators (various issues); International<br />
Monetary Fund, International Financial Statistics (various issues); United<br />
Nations National Accounts.<br />
C Government enterprises and investment<br />
Data on the number, composition, and share of output supplied by State-Operated<br />
Enterprises (SOEs) and government investment as a share of total investment<br />
www.freetheworld.com • www.fraserinstitute.org • Fraser Institute ©2012
272 • <strong>Economic</strong> <strong>Freedom</strong> of the <strong>World</strong>: 2012 Annual Report<br />
Fraser Institute ©2012 • www.fraserinstitute.org • www.freetheworld.com<br />
were used to construct the zero-to-10 ratings. Countries with more government<br />
enterprises and government investment received lower ratings. When government<br />
investment was generally less than 15% of total investment, countries were given a<br />
rating of 10. When government investment was between 15% and 20% of the total,<br />
countries received a rating of 8. When government investment was between 20%<br />
and 25% of the total, countries were rated at 7. When government investment was<br />
between 25% and 30% of the total, countries were assigned a rating of 6. When<br />
government investment was generally between 30% and 40% of the total, countries<br />
received a rating of 4. When government investment was between 40% and 50% of<br />
the total, countries were rated at 2. A rating of zero was assigned when government<br />
investment exceeded 50% of total investment.<br />
In cases where government investment data were unavailable we used qualitative<br />
data on the scope of SOEs to assign ratings. Also, in some cases, this rating was<br />
estimated from the Global Competitiveness Report questions: “State-owned enterprises<br />
in your country: 1 = Play a dominant role in the economy; 7 = Have little or<br />
no role in the economy”; and “State-owned enterprises in your country: 1 = Are<br />
heavily favoured over private sector competitors; 7 = Compete on an equal basis<br />
with the private sector.”<br />
Sources International Monetary Fund, Government Finance Statistics Yearbook (various<br />
issues); <strong>World</strong> Bank, <strong>World</strong> Development Indicators (various issues); International<br />
Monetary Fund, International Finance Statistics (various issues); <strong>World</strong> <strong>Economic</strong><br />
Forum, Global Competitiveness Report (various issues); United Nations National<br />
Accounts; European Bank for Reconstruction and Development, Transition Indicators.<br />
D Top marginal tax rate<br />
i Top marginal income tax rate<br />
Countries with higher marginal tax rates that take effect at lower income thresholds<br />
received lower ratings based on the matrix below. The income threshold data<br />
were converted from local currency to 1982/1984 US dollars (using beginning-ofyear<br />
exchange rates and the US Consumer Price Index). These figures include subnational<br />
rates if applicable.<br />
ii Top marginal income and payroll tax rates<br />
Countries with higher marginal income and payroll (wage) tax rates that take effect<br />
at lower income thresholds received lower ratings based on the matrix below. The<br />
income threshold data were converted from local currency to 1982/1984 US dollars<br />
(using beginning-of-year exchange rates and the US Consumer Price Index). These<br />
figures include sub-national rates if applicable.<br />
Source PricewaterhouseCoopers, <strong>World</strong>wide Tax Summaries Online, via ;<br />
PricewaterhouseCoopers, Individual Taxes: A <strong>World</strong>wide Summary (various issues).
Top Marginal Tax Rate<br />
Income Threshold at Which the Top Marginal<br />
Rate Applies (1982/1984 US$)<br />
Area 2 Legal System and Property Rights<br />
Explanatory Notes and Data Sources • 273<br />
< $25,000 $25,000 – $50,000 $50,000 – $150,000 > $150,000<br />
< 20% 10 10 10 10<br />
21% – 25% 9 9 10 10<br />
26% – 30% 8 8 9 9<br />
31% – 35% 7 7 8 9<br />
36% – 40% 5 6 7 8<br />
41% – 45% 4 5 6 7<br />
46% – 50% 3 4 5 5<br />
51% – 55% 2 3 4 4<br />
56% – 60% 1 2 3 3<br />
61% – 65% 0 1 2 2<br />
66% – 70% 0 0 1 1<br />
> 70% 0 0 0 0<br />
Note The ratings for Area 2 from 1970 to 1995 are the same as the Area V ratings<br />
from <strong>Economic</strong> <strong>Freedom</strong> of the <strong>World</strong>: 2001 Annual Report. Please see that report for<br />
methodological details.<br />
A Judicial independence<br />
This component is from the Global Competitiveness Report question: “Is the judiciary<br />
in your country independent from political influences of members of government,<br />
citizens, or firms? No—heavily influenced (= 1) or Yes—entirely independent<br />
(= 7).” The question’s wording has varied slightly over the years. All variables from<br />
the Global Competitiveness Report were converted from the original 1-to-7 scale to<br />
a 0-to-10 scale using this formula: EFW i = ((GCR i – 1) ÷ 6) × 10.<br />
Source <strong>World</strong> <strong>Economic</strong> Forum, Global Competitiveness Report (various issues),<br />
.<br />
B Impartial courts<br />
This component is from the Global Competitiveness Report question: “The legal<br />
framework in your country for private businesses to settle disputes and challenge<br />
the legality of government actions and/or regulations is inefficient and subject to<br />
manipulation (= 1) or is efficient and follows a clear, neutral process (= 7).” The<br />
question’s wording has varied slightly over the years.<br />
Note The “Rule of Law” ratings from the <strong>World</strong> Bank’s <strong>World</strong>wide Governance Indicators<br />
have been used to fill in country omissions in the primary data source since 1995.<br />
Source <strong>World</strong> <strong>Economic</strong> Forum, Global Competitiveness Report (various issues),<br />
; <strong>World</strong> Bank, <strong>World</strong>wide Governance<br />
Indicators (various years), .<br />
www.freetheworld.com • www.fraserinstitute.org • Fraser Institute ©2012
274 • <strong>Economic</strong> <strong>Freedom</strong> of the <strong>World</strong>: 2012 Annual Report<br />
C Protection of property rights<br />
This component is from the Global Competitiveness Report question: “Property<br />
rights, including over financial assets, are poorly defined and not protected by law<br />
(= 1) or are clearly defined and well protected by law (= 7).”<br />
Fraser Institute ©2012 • www.fraserinstitute.org • www.freetheworld.com<br />
Note This replaces a previous Global Competitiveness Report question on protection<br />
of intellectual property.<br />
Source <strong>World</strong> <strong>Economic</strong> Forum, Global Competitiveness Report (various issues),<br />
.<br />
D Military interference in rule of law and politics<br />
This component is based on the International Country Risk Guide Political Risk<br />
Component G. Military in Politics: “A measure of the military’s involvement in<br />
politics. Since the military is not elected, involvement, even at a peripheral level,<br />
diminishes democratic accountability. Military involvement might stem from an<br />
external or internal threat, be symptomatic of underlying difficulties, or be a fullscale<br />
military takeover. Over the long term, a system of military government will<br />
almost certainly diminish effective governmental functioning, become corrupt, and<br />
create an uneasy environment for foreign businesses.”<br />
Note The “Political Stability and Absence of Violence” ratings from the <strong>World</strong><br />
Bank’s <strong>World</strong>wide Governance Indicators Project have been used to fill in country<br />
omissions in the primary data source since 1995.<br />
Sources PRS Group, International Country Risk Guide (various issues), ; <strong>World</strong> Bank, <strong>World</strong>wide Governance Indicators (various<br />
years), .<br />
E Integrity of the legal system<br />
This component is based on the International Country Risk Guide Political Risk<br />
Component I for Law and Order: “Two measures comprising one risk component.<br />
Each sub-component equals half of the total. The ‘law’ sub-component assesses<br />
the strength and impartiality of the legal system, and the ‘order’ sub-component<br />
assesses popular observance of the law.”<br />
Source PRS Group, International Country Risk Guide (various issues), .<br />
F Legal enforcement of contracts<br />
This component is based on the <strong>World</strong> Bank’s Doing Business estimates for the time<br />
and money required to collect a clear-cut debt. The debt is assumed to equal 200%<br />
of the country’s per-capita income where the plaintiff has complied with the contract<br />
and judicial judgment is rendered in his favor. Zero-to-10 ratings were constructed<br />
for (1) the time cost (measured in number of calendar days required from<br />
the moment the lawsuit is filed until payment) and (2) the monetary cost of the<br />
case (measured as a percentage of the debt). These two ratings were then averaged<br />
to arrive at the final rating for this sub-component. The formula used to calculate<br />
the zero-to-10 ratings was: (V max − V i) / (V max − V min) multiplied by 10. V i represents
Explanatory Notes and Data Sources • 275<br />
the time or money cost value. The values for V max and V min were set at 725 days and<br />
82.3% (1.5 standard deviations above average) and 62 days (1.5 standard deviations<br />
below average), and 0%, respectively. Countries with values outside the V max and<br />
V min range received ratings of either zero or 10 accordingly.<br />
Source <strong>World</strong> Bank, Doing Business (various issues), .<br />
G Regulatory restrictions on the sale of real property<br />
This sub-component is based on the <strong>World</strong> Bank’s Doing Business data on the time<br />
measured in days and monetary costs required to transfer ownership of property<br />
that includes land and a warehouse. Zero-to-10 ratings were constructed for (1) the<br />
time cost (measured in number of calendar days required to transfer ownership) and<br />
(2) the monetary cost of transferring ownership (measured as a percentage of the<br />
property value). These two ratings were then averaged to arrive at the final rating for<br />
this sub-component. The formula used to calculate the zero-to-10 ratings was: (V max<br />
− V i ) / (V max − V min ) multiplied by 10. V i represents the time or money cost value.<br />
The values for V max and V min were set at 265 days and 15% (1.5 standard deviations<br />
above average) and 0 days and 0%, respectively. Countries with values outside the<br />
V max and V min range received ratings of either zero or ten accordingly.<br />
Source <strong>World</strong> Bank, Doing Business (various issues), .<br />
H Reliability of police<br />
This component is from the Global Competitiveness Report question: “To what extent<br />
can police services be relied upon to enforce law and order in your country? (1 =<br />
Cannot be relied upon at all; 7 = Can be completely relied upon).”<br />
Source <strong>World</strong> <strong>Economic</strong> Forum, Global Competitiveness Report (various issues),<br />
.<br />
I Business costs of crime<br />
This component is from the Global Competitiveness Report question: “To what extent<br />
does the incidence of crime and violence impose costs on businesses in your country?<br />
(1 =To a great extent; 7 = Not at all).”<br />
Source <strong>World</strong> <strong>Economic</strong> Forum, Global Competitiveness Report (various issues),<br />
.<br />
Area 3 Sound Money<br />
A Money growth<br />
The component measures the average annual growth of the money supply in the last<br />
five years minus average annual growth of real GDP in the last ten years. The M1<br />
money-supply figures were used to measure the growth rate of the money supply. The<br />
rating is equal to: (V max − V i ) / (V max − V min ) multiplied by 10. V i represents the average<br />
annual growth rate of the money supply during the last five years adjusted for the<br />
growth of real GDP during the previous ten years. The values for V min and V max were set<br />
www.freetheworld.com • www.fraserinstitute.org • Fraser Institute ©2012
276 • <strong>Economic</strong> <strong>Freedom</strong> of the <strong>World</strong>: 2012 Annual Report<br />
Fraser Institute ©2012 • www.fraserinstitute.org • www.freetheworld.com<br />
at zero and 50%, respectively. Therefore, if the adjusted growth rate of the money supply<br />
during the last five years was zero, indicating that money growth was equal to the<br />
long-term growth of real output, the formula generates a rating of 10. Ratings decline<br />
as the adjusted growth of the money supply increases toward 50%. When the adjusted<br />
annual money growth is equal to (or greater than) 50%, a rating of zero results.<br />
Sources <strong>World</strong> Bank, <strong>World</strong> Development Indicators (various issues); International<br />
Monetary Fund, International Financial Statistics (various issues); United Nations<br />
National Accounts.<br />
B Standard deviation of inflation<br />
The component measures the standard deviation of the inflation rate over the last<br />
five years. Generally, the GDP deflator was used as the measure of inflation for this<br />
component. When these data were unavailable, the Consumer Price Index was used.<br />
The following formula was used to determine the zero-to-10 scale rating for each<br />
country: (V max − V i ) / (V max − V min ) multiplied by 10. V i represents the country’s<br />
standard deviation of the annual rate of inflation during the last five years. The values<br />
for V min and V max were set at zero and 25%, respectively. This procedure will<br />
allocate the highest ratings to the countries with least variation in the annual rate of<br />
inflation. A perfect 10 results when there is no variation in the rate of inflation over<br />
the five-year period. Ratings will decline toward zero as the standard deviation of<br />
the inflation rate approaches 25% annually.<br />
Sources <strong>World</strong> Bank, <strong>World</strong> Development Indicators (various issues); International<br />
Monetary Fund, International Financial Statistics (various issues).<br />
C Inflation: most recent year<br />
Generally, the CPI was used as the measure of inflation for this component. When<br />
these data were unavailable, the GDP deflator inflation rate was used. The zero-to-10<br />
country ratings were derived by the following formula: (V max − V i ) / (V max − V min )<br />
multiplied by 10. V i represents the rate of inflation during the most recent year. The<br />
values for V min and V max were set at zero and 50%, respectively—the lower the rate<br />
of inflation, the higher the rating. Countries that achieve perfect price stability earn<br />
a rating of 10. As the inflation rate moves toward a 50% annual rate, the rating for<br />
this component moves toward zero. A zero rating is assigned to all countries with<br />
an inflation rate of 50% or more.<br />
Sources <strong>World</strong> Bank, <strong>World</strong> Development Indicators (various issues); International<br />
Monetary Fund, International Financial Statistics (various issues).<br />
D <strong>Freedom</strong> to own foreign currency bank accounts<br />
When foreign currency bank accounts were permissible without restrictions both<br />
domestically and abroad, the rating was 10; when these accounts were restricted, the<br />
rating was zero. If foreign currency bank accounts were permissible domestically but<br />
not abroad (or vice versa), the rating was 5.<br />
Sources International Monetary Fund, Annual Report on Exchange Arrangements<br />
and Exchange Restrictions (various issues).
Area 4 <strong>Freedom</strong> to Trade Internationally<br />
A Tariffs<br />
Explanatory Notes and Data Sources • 277<br />
i Revenue from trade taxes (% of trade sector)<br />
This sub-component measures the amount of tax on international trade as a share<br />
of exports and imports. The formula used to calculate the ratings for this subcomponent<br />
was: (V max − V i ) / (V max − V min ) multiplied by 10. V i represents the revenue<br />
derived from taxes on international trade as a share of the trade sector. The<br />
values for V min and V max were set at zero and 15%, respectively. This formula leads<br />
to lower ratings as the average tax rate on international trade increases. Countries<br />
with no specific taxes on international trade earn a perfect 10. As the revenues<br />
from these taxes rise toward 15% of international trade, ratings decline toward<br />
zero. (Note that except for two or three extreme observations, the revenues from<br />
taxes on international trade as a share of the trade sector are within the zeroto-15%<br />
range.)<br />
Sources International Monetary Fund, Government Finance Statistics Yearbook<br />
(various issues); International Monetary Fund, International Financial Statistics<br />
(various issues).<br />
ii Mean tariff rate<br />
This sub-component is based on the unweighted mean of tariff rates. The formula<br />
used to calculate the zero-to-10 rating for each country was: (V max − V i ) /<br />
(V max − V min ) multiplied by 10. V i represents the country’s mean tariff rate. The<br />
values for V min and V max were set at 0% and 50%, respectively. This formula will<br />
allocate a rating of 10 to countries that do not impose tariffs. As the mean tariff<br />
rate increases, countries are assigned lower ratings. The rating will decline<br />
toward zero as the mean tariff rate approaches 50%. (Note that except for two<br />
or three extreme observations, all countries have mean tariff rates within this<br />
0%-to-50% range.)<br />
Sources <strong>World</strong> Trade Organization, <strong>World</strong> Tariff Profiles (various issues).<br />
iii Standard deviation of tariff rates<br />
Compared to a uniform tariff, wide variation in tariff rates exerts a more restrictive<br />
impact on trade and, therefore, on economic freedom. Thus, countries with<br />
greater variation in their tariff rates should be given lower ratings. The formula<br />
used to calculate the zero-to-10 ratings for this component was: (V max − V i ) /<br />
(V max − V min ) multiplied by 10. V i represents the standard deviation of the country’s<br />
tariff rates. The values for V min and V max were set at 0% and 25%, respectively.<br />
This formula will allocate a rating of 10 to countries that impose a uniform tariff.<br />
As the standard deviation of tariff rates increases toward 25%, ratings decline<br />
toward zero. (Note that except for a few very extreme observations, the standard<br />
deviations of the tariff rates for the countries in our study fall within this 0%-to-<br />
25% range.)<br />
Sources <strong>World</strong> Trade Organization, <strong>World</strong> Tariff Profiles (various issues).<br />
www.freetheworld.com • www.fraserinstitute.org • Fraser Institute ©2012
278 • <strong>Economic</strong> <strong>Freedom</strong> of the <strong>World</strong>: 2012 Annual Report<br />
B Regulatory trade barriers<br />
i Non-tariff trade barriers<br />
This sub-component is based on the Global Competitiveness Report survey question:<br />
“In your country, tariff and non-tariff barriers significantly reduce the ability<br />
of imported goods to compete in the domestic market.” The question’s wording has<br />
varied slightly over the years.<br />
Fraser Institute ©2012 • www.fraserinstitute.org • www.freetheworld.com<br />
Source <strong>World</strong> <strong>Economic</strong> Forum, Global Competitiveness Report (various issues),<br />
.<br />
ii Compliance costs of importing and exporting<br />
This sub-component is based on the <strong>World</strong> Bank’s Doing Business data on the time<br />
(i.e., non-money) cost of procedures required to import a full 20-foot container of<br />
dry goods that contains no hazardous or military items. Countries where it takes<br />
longer to import and export are given lower ratings. Zero-to-10 ratings were constructed<br />
for (1) the time cost to export a good (measured in number of calendar<br />
days required) and (2) the time cost to import a good (measured in number of<br />
calendar days required). These two ratings were then averaged to arrive at the final<br />
rating for this sub-component. The formula used to calculate the zero-to-10 ratings<br />
was: (V max − V i ) / (V max − V min ) multiplied by 10. V i represents the time cost<br />
value. The values for V max and V min were set at 62 and 80 days (1.5 standard deviations<br />
above average), and 2 days (1.5 standard deviations below average) and 0 days,<br />
respectively. Countries with values outside the V max and V min range received ratings<br />
of either zero or ten accordingly.<br />
Source <strong>World</strong> Bank, Doing Business (various issues), .<br />
C Black-market exchange rates<br />
This component is based on the percentage difference between the official and the<br />
parallel (black) market exchange rate. The formula used to calculate the zero-to-10<br />
ratings for this component was the following: (V max − V i ) / (V max − V min ) multiplied<br />
by 10. V i is the country’s black-market exchange rate premium. The values for V min<br />
and V max were set at 0% and 50%, respectively. This formula will allocate a rating of<br />
10 to countries without a black-market exchange rate—that is, those with a domestic<br />
currency that is fully convertible without restrictions. When exchange rate controls<br />
are present and a black market exists, the ratings will decline toward zero as<br />
the black-market premium increases toward 50%. A zero rating is given when the<br />
black-market premium is equal to, or greater than, 50%.<br />
Sources MRI Bankers’ Guide to Foreign Currency (various issues).<br />
D Controls of the movement of capital and people<br />
i Foreign ownership/investment restrictions<br />
This sub-component is based on the following two Global Competitiveness Report<br />
questions: “How prevalent is foreign ownership of companies in your country? 1 =<br />
Very rare , 7 = Highly prevalent”; and “How restrictive are regulations in your country<br />
relating to international capital flows? 1 = Highly restrictive, 7 = Not restrictive at all.”
Explanatory Notes and Data Sources • 279<br />
Source <strong>World</strong> <strong>Economic</strong> Forum, Global Competitiveness Report (various issues),<br />
.<br />
ii Capital controls<br />
The International Monetary Fund reports on up to 13 types of international capital<br />
controls. The zero-to-10 rating is the percentage of capital controls not levied as a<br />
share of the total number of capital controls listed multiplied by 10.<br />
Source International Monetary Fund, Annual Report on Exchange Arrangements<br />
and Exchange Restrictions (various issues).<br />
iii <strong>Freedom</strong> of foreigners to visit<br />
This component measures the percentage of countries for which this country<br />
requires a visa from foreign visitors. It reflects the freedom of foreigners to travel<br />
to this country for tourist and short-term business purposes. The formula used to<br />
calculate the zero-to-10 ratings was: (V i − V min ) / (V max − V min ) multiplied by 10.<br />
V i represents the component value. The values for V max and V min were set at 47.2<br />
(1 standard deviation above average) and 0. Countries with values outside the V max<br />
and V min range received ratings of either zero or ten accordingly.<br />
Source Robert Lawson and Jayme Lemke, Travel Visas, Public Choice (2011),<br />
.<br />
Area 5 Regulation<br />
A Credit market regulations<br />
i Ownership of banks<br />
Data on the percentage of bank deposits held in privately owned banks were used<br />
to construct rating intervals. Countries with larger shares of privately held deposits<br />
received higher ratings. When privately held deposits totaled between 95%<br />
and 100%, countries were given a rating of 10. When private deposits constituted<br />
between 75% and 95% of the total, a rating of 8 was assigned. When private deposits<br />
were between 40% and 75% of the total, the rating was 5. When private deposits<br />
totaled between 10% and 40%, countries received a rating of 2. A zero rating was<br />
assigned when private deposits were 10% or less of the total.<br />
Sources James R. Barth, Gerard Caprio, Jr., and Ross Levine, Bank Regulation<br />
and Supervision (various years); James R. Barth, Gerard Caprio, and Ross Levine,<br />
Rethinking Bank Regulation: Till Angels Govern (2006).<br />
ii Private sector credit<br />
This sub-component measures the extent to which government borrowing crowds<br />
out private borrowing. If available, this sub-component is calculated as the government<br />
fiscal deficit as a share of gross saving. Since the deficit is expressed as a<br />
negative value, higher numerical values result in higher ratings. The formula used to<br />
derive the country ratings for this sub-component was (−V max − V i) / (V max + V min)<br />
www.freetheworld.com • www.fraserinstitute.org • Fraser Institute ©2012
280 • <strong>Economic</strong> <strong>Freedom</strong> of the <strong>World</strong>: 2012 Annual Report<br />
Fraser Institute ©2012 • www.fraserinstitute.org • www.freetheworld.com<br />
multiplied by 10. V i is the deficit to gross investment ratio, and the values for V max<br />
and V min are set at 0 and −100.0%, respectively. The formula allocates higher ratings<br />
as the deficit gets smaller (i.e., closer to zero) relative to gross saving.<br />
If the deficit data are not available, the component is instead based on the share<br />
of private credit to total credit extended in the banking sector. Higher values are<br />
indicative of greater economic freedom. Thus, the formula used to derive the country<br />
ratings for this sub-component was (V i − V min ) / (V max − V min ) multiplied by 10.<br />
V i is the share of the country’s total domestic credit allocated to the private sector<br />
and the values for V max and V min are set at 99.9% and 10.0%, respectively. The 1990<br />
data were used to derive the maximum and minimum values for this component.<br />
The formula allocates higher ratings as the share of credit extended to the private<br />
sector increases.<br />
Note In previous editions, this component was based only on the ratio of private<br />
credit to total credit in the banking sector. The database has been updated back to<br />
1990 using this new methodology.<br />
Sources <strong>World</strong> Bank, <strong>World</strong> Development Indicators (various issues); International<br />
Monetary Fund, International Financial Statistics (various issues).<br />
iii Interest rate controls/negative real interest rates<br />
Data on credit-market controls and regulations were used to construct rating intervals.<br />
Countries with interest rates determined by the market, stable monetary policy,<br />
and positive real deposit and lending rates received higher ratings. When interest<br />
rates were determined primarily by market forces and the real rates were positive,<br />
countries were given a rating of 10. When interest rates were primarily marketdetermined<br />
but the real rates were sometimes slightly negative (less than 5%) or<br />
the differential between the deposit and lending rates was large (8% or more), countries<br />
received a rating of 8. When the real deposit or lending rate was persistently<br />
negative by a single-digit amount or the differential between them was regulated<br />
by the government, countries were rated at 6. When the deposit and lending rates<br />
were fixed by the government and the real rates were often negative by single-digit<br />
amounts, countries were assigned a rating of 4. When the real deposit or lending<br />
rate was persistently negative by a double-digit amount, countries received a rating<br />
of 2. A zero rating was assigned when the deposit and lending rates were fixed by<br />
the government and real rates were persistently negative by double-digit amounts<br />
or hyperinflation had virtually eliminated the credit market.<br />
Source <strong>World</strong> Bank, <strong>World</strong> Development Indicators (various issues); International<br />
Monetary Fund, International Financial Statistics (various issues).<br />
B Labor market regulations<br />
i Hiring regulations and minimum wage<br />
This sub-component is based on the <strong>World</strong> Bank’s Doing Business “Difficulty of<br />
Hiring Index,” which is described as follows: “The difficulty of hiring index measures<br />
(i) whether fixed-term contracts are prohibited for permanent tasks; (ii) the<br />
maximum cumulative duration of fixed-term contracts; and (iii) the ratio of the<br />
minimum wage for a trainee or first-time employee to the average value added per
Explanatory Notes and Data Sources • 281<br />
worker. An economy is assigned a score of 1 if fixed-term contracts are prohibited<br />
for permanent tasks and a score of 0 if they can be used for any task. A score of 1 is<br />
assigned if the maximum cumulative duration of fixed-term contracts is less than 3<br />
years; 0.5 if it is 3 years or more but less than 5 years; and 0 if fixed-term contracts<br />
can last 5 years or more. Finally, a score of 1 is assigned if the ratio of the minimum<br />
wage to the average value added per worker is 0.75 or more; 0.67 for a ratio of 0.50<br />
or more but less than 0.75; 0.33 for a ratio of 0.25 or more but less than 0.50; and<br />
0 for a ratio of less than 0.25.” Countries with higher difficulty of hiring are given<br />
lower ratings.<br />
Source <strong>World</strong> Bank, Doing Business (various issues), .<br />
ii Hiring and firing regulations<br />
This sub-component is based on the Global Competitiveness Report question: “The<br />
hiring and firing of workers is impeded by regulations (= 1) or flexibly determined<br />
by employers (= 7).” The question’s wording has varied slightly over the years.<br />
Source <strong>World</strong> <strong>Economic</strong> Forum, Global Competitiveness Report (various issues),<br />
.<br />
iii Centralized collective bargaining<br />
This sub-component is based on the Global Competitiveness Report question: “Wages<br />
in your country are set by a centralized bargaining process (= 1) or up to each individual<br />
company (= 7).” The question’s wording has varied slightly over the years.<br />
Source <strong>World</strong> <strong>Economic</strong> Forum, Global Competitiveness Report (various issues),<br />
.<br />
iv Hours regulations<br />
This sub-component is based on the <strong>World</strong> Bank’s Doing Business “Rigidity of Hours<br />
Index,” which is described as follows: “The rigidity of hours index has 5 components:<br />
(i) whether there are restrictions on night work; (ii) whether there are restrictions<br />
on weekly holiday work; (iii) whether the work-week can consist of 5.5 days;<br />
(iv) whether the work-week can extend to 50 hours or more (including overtime)<br />
for 2 months a year to respond to a seasonal increase in production; and (v) whether<br />
paid annual vacation is 21 working days or fewer. For questions (i) and (ii), when<br />
restrictions other than premiums apply, a score of 1 is given. If the only restriction<br />
is a premium for night work and weekly holiday work, a score of 0, 0.33, 0.66, or 1<br />
is given according to the quartile in which the economy’s premium falls. If there are<br />
no restrictions, the economy receives a score of 0. For questions (iii), (iv), and (v),<br />
when the answer is ‘no’, a score of 1 is assigned; otherwise a score of 0 is assigned.”<br />
Countries with less rigid work rules receive better scores in this component.<br />
Source <strong>World</strong> Bank, Doing Business (various issues), .<br />
Note This component was previously denoted “Mandated cost of hiring a worker”<br />
and was based on the <strong>World</strong> Bank’s Doing Business data on the cost of all social<br />
security and payroll taxes and the cost of other mandated benefits including those<br />
for retirement, sickness, health care, maternity leave, family allowance, and paid<br />
www.freetheworld.com • www.fraserinstitute.org • Fraser Institute ©2012
282 • <strong>Economic</strong> <strong>Freedom</strong> of the <strong>World</strong>: 2012 Annual Report<br />
Fraser Institute ©2012 • www.fraserinstitute.org • www.freetheworld.com<br />
vacations and holidays associated with hiring an employee. Because of pressure<br />
from the International Labour Organization this measure was dropped from<br />
the Doing Business project. In recent years, the entire labor market area has been<br />
dropped from the Doing Business project; however, they continue to present the<br />
data in a separate section. In order to maintain as much consistency over time as<br />
possible, we have revised the dataset back to 2002 with these data replacing the<br />
previous values.<br />
v Mandated cost of worker dismissal<br />
This sub-component is based on the <strong>World</strong> Bank’s Doing Business data on the cost<br />
of the advance notice requirements, severance payments, and penalties due when<br />
dismissing a redundant worker. The formula used to calculate the zero-to-10 ratings<br />
was: (V max − V i ) / (V max − V min ) multiplied by 10. V i represents the dismissal<br />
cost (measured in weeks of wages). The values for V max and V min were set at 108<br />
weeks (1.5 standard deviations above average) and 0 weeks, respectively. Countries<br />
with values outside the V max and V min range received ratings of either zero or ten<br />
accordingly.<br />
Source <strong>World</strong> Bank, Doing Business (various issues), .<br />
vi Conscription<br />
Data on the use and duration of military conscription were used to construct rating<br />
intervals. Countries with longer conscription periods received lower ratings. A rating<br />
of 10 was assigned to countries without military conscription. When length of<br />
conscription was six months or less, countries were given a rating of 5. When length<br />
of conscription was more than six months but not more than 12 months, countries<br />
were rated at 3. When length of conscription was more than 12 months but not<br />
more than 18 months, countries were assigned a rating of 1. When conscription<br />
periods exceeded 18 months, countries were rated zero. If conscription was present,<br />
but apparently not strictly enforced or the length of service could not be determined,<br />
the country was given a rating of 3. In cases where it is clear conscription<br />
is never used, even though it may be possible, a rating of 10 is given. If a country’s<br />
mandated national service includes clear non-military options, the country was<br />
given a rating of 5.<br />
Source International Institute for Strategic Studies, The Military Balance (various<br />
issues); War Resisters International, <strong>World</strong> Survey of Conscription and Conscientious<br />
Objection to Military Service, .<br />
C Business regulations<br />
i Administrative requirements<br />
This sub-component is based on the Global Competitiveness Report question:<br />
“Complying with administrative requirements (permits, regulations, reporting)<br />
issued by the government in your country is (1 = burdensome, 7 = not burdensome).”<br />
Source <strong>World</strong> <strong>Economic</strong> Forum, Global Competitiveness Report (various issues),<br />
.
Explanatory Notes and Data Sources • 283<br />
ii Bureaucracy costs<br />
This sub-component is based on the Global Competitiveness Report question:<br />
“Standards on product/service quality, energy and other regulations (outside environmental<br />
regulations) in your country are: (1 = Lax or non-existent, 7 = among<br />
the world’s most stringent)”.<br />
Source <strong>World</strong> <strong>Economic</strong> Forum, Global Competitiveness Report (various issues),<br />
.<br />
iii Starting a business<br />
This sub-component is based on the <strong>World</strong> Bank’s Doing Business data on the amount<br />
of time and money it takes to start a new limited-liability business. Countries where<br />
it takes longer or is more costly to start a new business are given lower ratings.<br />
Zero-to-10 ratings were constructed for three different variables: (1) time (measured<br />
in days) necessary to comply with regulations when starting a limited liability<br />
company, (2) money costs of the fees paid to regulatory authorities (measured as a<br />
share of per-capita income) and (3) minimum capital requirements, that is, funds<br />
that must be deposited into a company bank account (measured as a share of percapita<br />
income). These three ratings were then averaged to arrive at the final rating<br />
for this sub-component. The formula used to calculate the zero-to-10 ratings was:<br />
(V max − V i ) / (V max − V min ) multiplied by 10. V i represents the variable value. The<br />
values for V max and V min were set at 104 days, 317%, and 1017% (1.5 standard deviations<br />
above average), and 0 days, 0%, and 0%, respectively. Countries with values<br />
outside the V max and V min range received ratings of either zero or ten accordingly.<br />
Source <strong>World</strong> Bank, Doing Business (various issues), .<br />
iv Extra payments/bribes/favoritism<br />
This sub-component is based on the Global Competitiveness Report questions: “In<br />
your industry, how commonly would you estimate that firms make undocumented<br />
extra payments or bribes connected with the following: A – Import and export permits;<br />
B – Connection to public utilities (e.g., telephone or electricity); C – Annual<br />
tax payments; D – Awarding of public contracts (investment projects); E – Getting<br />
favorable judicial decisions. Common (= 1) Never occur (= 7)”; “Do illegal payments<br />
aimed at influencing government policies, laws or regulations have an impact<br />
on companies in your country? 1 = Yes, significant negative impact, 7 = No, no<br />
impact at all”; and “To what extent do government officials in your country show<br />
favoritism to well-connected firms and individuals when deciding upon policies and<br />
contracts? 1 = Always show favoritism, 7 = Never show favoritism.”<br />
Source <strong>World</strong> <strong>Economic</strong> Forum, Global Competitiveness Report (various issues),<br />
.<br />
v Licensing restrictions<br />
This sub-component is based on the <strong>World</strong> Bank’s Doing Business data on the time<br />
in days and monetary costs required to obtain a license to construct a standard<br />
warehouse. Zero-to-10 ratings were constructed for (1) the time cost (measured in<br />
number of calendar days required to obtain a license) and (2) the monetary cost of<br />
www.freetheworld.com • www.fraserinstitute.org • Fraser Institute ©2012
284 • <strong>Economic</strong> <strong>Freedom</strong> of the <strong>World</strong>: 2012 Annual Report<br />
Fraser Institute ©2012 • www.fraserinstitute.org • www.freetheworld.com<br />
obtaining the license (measured as a share of per-capita income). These two ratings<br />
were then averaged to arrive at the final rating for this sub-component. The formula<br />
used to calculate the zero-to-10 ratings was: (V max − V i ) / (V max − V min ) multiplied<br />
by 10. V i represents the time or money cost value. The values for V max and V min were<br />
set at 363 days and 2763% (1.5 standard deviations above average), and 56 days<br />
(1.5 standard deviations below average) and 0%, respectively. Countries with values<br />
outside the V max and V min range received ratings of either zero or 10 accordingly.<br />
Source <strong>World</strong> Bank, Doing Business (various issues), .<br />
vi Cost of tax compliance<br />
This sub-component is based on the <strong>World</strong> Bank’s Doing Business data on the time<br />
required per year for a business to prepare, file, and pay taxes on corporate income,<br />
value added or sales taxes, and taxes on labor. The formula used to calculate the<br />
zero-to-10 ratings was: (V max − V i ) / (V max − V min ) multiplied by 10. V i represents the<br />
time cost (measured in hours) of tax compliance. The values for V max and V min were<br />
set at 892 hours (1.5 standard deviations above average) and 0 hours, respectively.<br />
Countries with values outside the V max and V min range received ratings of either zero<br />
or 10 accordingly.<br />
Source <strong>World</strong> Bank, Doing Business (various issues), .
About the Authors<br />
James D. Gwartney James Gwartney holds the Gus A. Stavros Eminent Scholar Chair at Florida State<br />
University, where he directs the Stavros Center for the Advancement of Free<br />
Enterprise and <strong>Economic</strong> Education. He is the coauthor of <strong>Economic</strong>s: Private and<br />
Public Choice (Cengage/South-Western Press, 2012), a widely used text on the principles<br />
of economics that is now in its 14th edition. He is also coauthor of an economics<br />
primer, Common Sense <strong>Economic</strong>s: What Everyone Should Know about Wealth and<br />
Prosperity (St. Martin’s Press, 2010). His publications have appeared in both professional<br />
journals and popular media such as the Wall Street Journal and the New<br />
York Times. He served as Chief Economist of the Joint <strong>Economic</strong> Committee of the<br />
US Congress during 1999/2000. In 2004, he was the recipient of the Adam Smith<br />
Award of the Association of Private Enterprise Education for his contribution to the<br />
advancement of free-market ideals. He is a past President of the Southern <strong>Economic</strong><br />
Association and the Association of Private Enterprise Education. His Ph.D. in economics<br />
is from the University of Washington.<br />
Robert A. Lawson Robert Lawson is the Jerome M. Fullinwider Chair in <strong>Economic</strong> <strong>Freedom</strong> in the<br />
O’Neil Center for Global Markets and <strong>Freedom</strong> in the Cox School of Business at<br />
Southern Methodist University. Prior to taking a position at SMU, he taught at<br />
Auburn University, Capital University, and Shawnee State University. Lawson has<br />
numerous professional publications in journals such as Public Choice, Journal of<br />
<strong>Economic</strong> Behavior and Organization, Cato Journal, Kyklos, Journal of Labor Research,<br />
Journal of Institutional and Theoretical <strong>Economic</strong>s, and European Journal of Political<br />
Economy. Lawson has served as president of the Association of Private Enterprise<br />
Education and is a member of the Mont Pelerin Society. He earned his B.S. in economics<br />
from the Honors Tutorial College at Ohio University and his M.S. and Ph.D.<br />
in economics from Florida State University.<br />
Joshua C. Hall Joshua C. Hall is the Elbert H. Neese, Jr. Professor of <strong>Economic</strong>s at Beloit College<br />
in Beloit, Wisconsin. He earned his B.B.A. and M.A. in economics from Ohio<br />
University and his Ph.D. from West Virginia University. Formerly an economist for<br />
the Joint <strong>Economic</strong> Committee of the US Congress, he has published numerous<br />
policy studies and professional publications. Professor Hall’s research has appeared<br />
in journals such as the Atlantic <strong>Economic</strong> Journal, Cato Journal, Journal of <strong>Economic</strong><br />
Behavior and Organization, Journal of <strong>Economic</strong> Education, Journal of Labor Research,<br />
Southern <strong>Economic</strong> Journal, and Public Finance Review.<br />
www.freetheworld.com • www.fraserinstitute.org • Fraser Institute ©2012
About the Contributors<br />
Scott L. Baier Scott Baier is currently an associate professor of economics in the John E. Walker<br />
Department of <strong>Economic</strong>s at Clemson University. He has been a visiting scholar<br />
at the Federal Reserve Bank in Atlanta and has served as a Senior Economist at<br />
the Council of <strong>Economic</strong> Advisers. Prof. Baier received his Ph.D. from Michigan<br />
State University and his undergraduate from Bowling Green State University. His<br />
current research focuses on international trade and economic growth. Prof. Baier<br />
has written many articles that have been published in scholarly journals such as<br />
the Journal of International <strong>Economic</strong>s, Journal of International Money and Finance,<br />
<strong>Economic</strong> Inquiry, and Journal of <strong>Economic</strong> Growth.<br />
Christian Bjørnskov Christian Bjørnskov is currently associate professor of economics at Aarhus<br />
University in Denmark and is also affiliated with the Center for Political Studies in<br />
Copenhagen. He earned his Ph.D. in economics from Aarhus School of Business.<br />
Christian Bjørnskov has published articles in a range of journals including Public<br />
Choice, European Journal of Political Economy, Journal of <strong>Economic</strong> Behavior and<br />
Organization, Journal of Development <strong>Economic</strong>s, and Journal of Law and <strong>Economic</strong>s.<br />
He is a member of the editorial board of Public Choice and the European Journal<br />
of Political Economy. His most recent research focuses on the institutional determinants<br />
of long-run development. Prof. Bjørnskov teaches development economics,<br />
international economics, and general macroeconomics at the Department of<br />
<strong>Economic</strong>s as well as the Department of Political Science, Aarhus University.<br />
Matthew Clance Matthew Clance received his Ph.D. in economics from Clemson University in 2012.<br />
His current research interests include international trade, open-economy macroeconomics,<br />
banking crises, and applied econometrics. In 2011, he worked as a Research<br />
Associate for the Federal Reserve Bank of Atlanta on a project that focused on the<br />
movement of macroeconomic variables due to financial crises.<br />
Alice M. Crisp Alice M. Crisp is currently working on a Ph.D. in <strong>Economic</strong>s from Florida State<br />
University in Tallahassee, Florida. As a Charles G. Koch Doctoral Fellowship recipient,<br />
she serves as a research assistant for Dr. James Gwartney. Ms Crisp’s research<br />
will be published in the Journal of <strong>Economic</strong>s and Finance Education, forthcoming. She<br />
earned her B.B.A in <strong>Economic</strong>s from Mercer University in Macon, Georgia, USA.<br />
Mercer University awarded her the Algernon Sydney Sullivan Award for exemplary<br />
scholarship, character, leadership, and service. As an undergraduate, she participated in<br />
Fraser Institute ©2012 • www.fraserinstitute.org • www.freetheworld.com
<strong>Economic</strong> <strong>Freedom</strong> of the <strong>World</strong>: 2012 Annual Report • 287<br />
the Koch Internship Program, working for the Atlas <strong>Economic</strong> Research Foundation<br />
in Washington, DC as coordinator for the Sound Money Project. She also worked as<br />
an intern for the Foundation for <strong>Economic</strong> Education in Atlanta, Georgia.<br />
Axel Dreher Axel Dreher is professor of International and Development Politics at Heidelberg<br />
University. He received his Ph.D. from the University of Mannheim in 2003 and has<br />
since then been employed at the Universities of Exeter, Konstanz, and Goettingen,<br />
and the KOF Swiss <strong>Economic</strong> Institute at ETH Zurich. Prof. Dreher is Affiliated<br />
Professor at the University of Goettingen and the KOF Swiss <strong>Economic</strong> Institute,<br />
and Research Fellow at IZA and CESifo. He has published numerous articles in refereed<br />
journals, among them the International <strong>Economic</strong> Review, Journal of Development<br />
<strong>Economic</strong>s, International Organization, and the Journal of International <strong>Economic</strong>s. He<br />
is editor of the Review of International Organizations and author of the KOF Index<br />
of Globalization. Most of his current research is in the fields of political economy,<br />
economic development, and globalization.<br />
Gerald P. Dwyer Gerald P. Dwyer is an adjunct faculty member at the University of Carlos III, Madrid<br />
and at Trinity College Dublin. Outside academe, most recently he was Director of the<br />
Center for Financial Innovation and Stability at the Federal Reserve Bank of Atlanta<br />
and, before that, Vice President in charge of the Finance group in the Research<br />
Department. Prof. Dwyer has been a faculty member at Clemson University, the<br />
University of Houston, Emory University, and Texas A&M University and an adjunct<br />
faculty member at other universities; a Visiting Scholar at the Federal Reserve Banks<br />
of Atlanta, St. Louis and Minneapolis; and an economist at the Federal Reserve<br />
Banks of St. Louis and Chicago. Prof. Dwyer’s research focuses on financial markets<br />
and banking. This research has appeared in leading economics and finance journals,<br />
in Reviews published by Federal Reserve Banks, and in books and conference<br />
volumes. He serves on the editorial boards of <strong>Economic</strong> Inquiry and the Journal of<br />
Financial Stability; and is a past President of the Association of Private Enterprise<br />
Education and the Society for Nonlinear Dynamics and Econometrics, which honored<br />
him by creating the Gerald P. Dwyer Prize in Financial Econometrics.<br />
Nicolai J. Foss Nicolai J Foss is a professor of Organization and Strategy at the Copenhagen Business<br />
School and the head of department of the Department of Strategic Management and<br />
Globalization at the CBS. He is also professor of Knowledge-based Value Creation at the<br />
Norwegian School of <strong>Economic</strong>s. The author of 140 papers in reviewed journals, Foss’<br />
main research interests are entrepreneurship, strategic management and the economics<br />
of the firm. He is one of the founders of the Center for Policy Studies, a Danish freemarket<br />
think tank. Prof. Foss blogs at the popular blog, .<br />
Kai Gehring Kai Gehring is a Ph.D. student at the University of Goettingen and Heidelberg<br />
University and is part of the Research Training Group (RTG 1723), Globalization<br />
and Development. He carried out his studies in business and economics at the<br />
University of Mannheim and the University of Canterbury, New Zealand; and completed<br />
Ph.D. courses in economics at the Graduate School of <strong>Economic</strong> & Social<br />
Sciences in Mannheim. Kai Gehring gained working experience as a management<br />
consultant and as a student assistant at the Centre for European <strong>Economic</strong> Research.<br />
His main research interest is political economy and public-choice theory, with a<br />
focus on international organizations, globalization, and economic development.<br />
www.freetheworld.com • www.fraserinstitute.org • Fraser Institute ©2012
Acknowledgments<br />
Fraser Institute ©2012 • www.fraserinstitute.org • www.freetheworld.com<br />
As always, we are grateful for the intellectual and financial assistance of the Fraser<br />
Institute and Niels Veldhuis, the Institute’s president. Without the assistance and<br />
guidance of both Michael Walker, former Executive Director of the Fraser Institute,<br />
and the late Milton Friedman, this project would never have gotten off the ground.<br />
The members of the <strong>Economic</strong> <strong>Freedom</strong> Network again provided valuable support<br />
for this report. Our thanks also go to Kathy Makinen and Joe Connors at Florida<br />
State University, both of whom provided us with research assistance. We are grateful<br />
for the hard work of many at the Fraser Institute who help with the project, including<br />
especially Fred McMahon, Miguel Cervantes, and Jean-François Minardi. Also,<br />
thanks to Ian Vasquez at the Cato Institute for his continued support. Steve Knack<br />
(<strong>World</strong> Bank) and Ciara Browne (<strong>World</strong> <strong>Economic</strong> Forum) were instrumental in<br />
helping secure data from their respective organizations.<br />
Thanks also go to the Charles G. Koch Charitable Foundation and Searle <strong>Freedom</strong><br />
Trust for their support.<br />
James Gwartney, Robert Lawson & Joshua Hall
The <strong>Economic</strong> <strong>Freedom</strong> Network<br />
Co-publishers of <strong>Economic</strong> <strong>Freedom</strong> of the <strong>World</strong><br />
Afghanistan Afghanistan <strong>Economic</strong> and Legal Studies Organization<br />
The Afghanistan <strong>Economic</strong> and Legal Studies Organization (AELSO) is a non governmental<br />
think thank that aims to introduce and promote a free market economy,<br />
the rule of law and good governance to the people of Afghanistan.<br />
e-mail: info@aelso.org • website: <br />
Albania Albanian Center for <strong>Economic</strong> Research<br />
Established in November 1992, the Albanian Center for <strong>Economic</strong> Research<br />
(ACER) is Albania’s first independent, non-governmental organization dedicated<br />
to the value of democracy and market economy.<br />
e-mail: acer@icc-al.org • website: <br />
Argentina Fundación Libertad<br />
Fundación Libertad is a private, non-profit institution working towards two main<br />
goals: the research and distribution of public-policy issues (specifically in socio-economic<br />
and business areas) and the promotion of the concept of a free-market society.<br />
Founded in Rosario, Argentina, in 1988 by a group of businessmen, professionals,<br />
and intellectuals, the Foundation has developed its activities with the support of<br />
more than 200 private companies. Its projects include courses, lectures, seminars,<br />
research, studies, and publications as well as a strong permanent presence in the media,<br />
through columns, and television and radio programs produced by the Foundation.<br />
These projects have focused on economic policies, education, regulations, and public<br />
spending. Outstanding guest speakers have delivered lectures and conferences for<br />
the Fundación Libertad; these include Peruvian writer Mario Vargas Llosa, Nobel<br />
prize-winning economists such as Gary Becker, Douglass North, Robert Lucas, and<br />
James Buchanan, historian Paul Johnson, Nobel Peace Prize Laureate Lech Walessa,<br />
and other intellectuals like Jean Francois Revel. Fundación Libertad has also led the<br />
creation of REFUNDAR, a network of Argentine foundations made up of ten organizations,<br />
located in the country’s major cities. This network has helped us spread<br />
our ideas all over the country and is affiliated with similar international organizations.<br />
e-mail: fundacion@libertad.org.ar • website: <br />
Armenia Centre of Political, Legal and <strong>Economic</strong> Researches and Forecasting<br />
The Centre of Political, Legal and <strong>Economic</strong> Researches and Forecasting (PLERF)is a<br />
non-governmental organization created in 2002. Its mission is to assist the development<br />
www.freetheworld.com • www.fraserinstitute.org • Fraser Institute ©2012
290 • <strong>Economic</strong> <strong>Freedom</strong> of the <strong>World</strong>: 2012 Annual Report<br />
Fraser Institute ©2012 • www.fraserinstitute.org • www.freetheworld.com<br />
of an effective socio-economic policy; to establish an economy based on the free market;<br />
and to contribute to the development of democracy in the Republic of Armenia. PLERF<br />
organizes seminars and conferences related to its goals and carries out research, independent<br />
estimations of social and economic reforms, government policy in certain spheres,<br />
and assessment of transition process and surveys among experts and policy makers.<br />
e-mail: khachatryanvahagn@yahoo.com<br />
Australia Institute of Public Affairs<br />
Established in 1943, the Institute of Public Affairs (IPA) is Australia’s oldest and<br />
largest private-sector think-tank. Its aim is to foster prosperity and full employment,<br />
the rule of law, democratic freedoms, security from crime and invasion, and<br />
high standards in education and family life for the Australian people. To identify<br />
and promote the best means of securing these values, the IPA undertakes research,<br />
organizes seminars, and publishes widely.<br />
e-mail: ipa@ipa.org.au • website: <br />
Austria TIGRA®<br />
TIGRA® is the premier Austrian think-tank on governance research. Headquartered in<br />
Salzburg, it was founded to study and advance effective and efficient economic policies.<br />
TIGRA® organizes workshops and publishes papers and reports. Their mission is<br />
“From analysis to action.” TIGRA® is a network of experts who provide effective market<br />
solutions to policy-makers. Special emphasis is put on knowledge management, monitoring<br />
the scope and quality of regulations (“cutting red tape”), and setting benchmarks.<br />
e-mail: bendl@erwin.tc<br />
Azerbaijan Center for <strong>Economic</strong> and Political Research<br />
The Center for <strong>Economic</strong> and Political Research, Azerbaijan, is a non-profit, nongovernmental,<br />
research institute founded in 1994. Its mission is to facilitate the<br />
country’s democratization and economic liberalization and to increase the role of<br />
civil society. The main objectives of the Center’s activities are analyzing the economic<br />
situation and progress of market reforms, political processes, foreign political<br />
relations, and regional economic and political tendencies. The Center also conducts<br />
sociological surveys and holds conferences, round-tables, and seminars on different<br />
aspects of economic and political reforms in the country.<br />
e-mail: info@cesd.az • website: <br />
Bahamas The Nassau Institute<br />
The Nassau Institute is an independent, non-political, non-profit institute that promotes<br />
economic growth, employment, and entrepreneurial activity. It believes that<br />
this can best be achieved with a free-market economy and a decent society—one that<br />
embraces the rule of law, the right of private property, the free exchange of property<br />
and services, and the individual virtues of self-control, commitment, and good will.<br />
e-mail: joan@nassauinstitute.org • website: <br />
Bangladesh Making Our Economy Right<br />
Making Our Economy Right (MOER), founded in 1991, is the country’s lone freemarket<br />
institute and continues to struggle to promote free-market capitalism against<br />
all odds. The concept of individual freedom and free markets determining the supply<br />
of goods, services, and capital is little understood in Bangladesh. For the past 50
<strong>Economic</strong> <strong>Freedom</strong> of the <strong>World</strong>: 2012 Annual Report • 291<br />
years or so, Fabian socialism and the doctrines of Karl Marx were the basis of our<br />
country’s economy. MOER contributes free-market, libertarian articles in English<br />
and Bangla newspapers. MOER also publishes books both in Bangla and in English<br />
for free distribution to libraries and others with the support of the International<br />
Policy Network of London. MOER’s fourth book, published in 2002, Clamoring<br />
for Free Market <strong>Freedom</strong> in Bangladesh, has a foreword by Nobel laureate Milton<br />
Friedman. The book is a compilation of articles by Nizam Ahmad.<br />
Belarus Scientific Research Mises Center<br />
Scientific Research Mises Center was founded in 2001. Its mission is to advance ideas<br />
and ideals of a free-market democratic society based on individual choice and personal<br />
responsibility and to create an open community of people who share those ideas. The<br />
Center promotes the original ideas of limited government, individual liberty, and private<br />
property through publications and discussion forums and conferences. The goal<br />
of the Center is to demonstrate the power of private institutions, both for-profit and<br />
non-profit, to create a good society and to foster the understanding that free choice of<br />
a fully informed individual is the foundation for a just, prosperous, and open society.<br />
e-mail: liberti@belsonet.net • website: <br />
Belgium Centre for the New Europe<br />
The Centre for the New Europe (CNE) is a European research institute based in<br />
Brussels that promotes a market economy, personal liberty, and creativity and<br />
responsibility in an ordered society. CNE is founded on the belief that European<br />
integration can work only in a society led by a spirit of democratic capitalism. The<br />
Centre develops policy alternatives, encourages economic growth and deregulation,<br />
seeks new market-based solutions for social and environmental concerns, and promotes<br />
individual freedom, choice and responsibility.<br />
e-mail: info@cne.org<br />
Bolivia Política Publicas para la Libertad<br />
The mission of Política Publicas para la Libertad (POPULI) is to generate and promote<br />
public policies, in accordance with the country’s social and economic realities,<br />
within the field of private enterprise, under the principle of state subsidiarity, preserving<br />
property rights, human rights, and strengthening the concept of liberty. Its<br />
vision is to generate and promote a benchmark of public policies while maintaining<br />
institutional independence and a strong commitment to the values of a free society.<br />
e-mail: populi@populi-bo.org • website: <br />
Brazil Instituto Liberal do Rio de Janeiro<br />
Instituto Liberal was founded to persuade Brazilians of the advantages of a liberal<br />
order. It is a non-profit institution supported by donations and the sponsorship of<br />
private individuals and corporations. Its by-laws provide for a Board of Trustees and<br />
forbid any political or sectarian affiliations. The institute publishes books, organizes<br />
seminars, and elaborates policy papers on subjects related to public policy.<br />
e-mail: ilrj@gbl.com.br • website: <br />
Bulgaria Institute for Market <strong>Economic</strong>s<br />
Established in 1993, the Institute for Market <strong>Economic</strong>s (IME) is the first independent<br />
economic think-tank in Bulgaria. It is a private, registered, non-profit<br />
www.freetheworld.com • www.fraserinstitute.org • Fraser Institute ©2012
292 • <strong>Economic</strong> <strong>Freedom</strong> of the <strong>World</strong>: 2012 Annual Report<br />
Fraser Institute ©2012 • www.fraserinstitute.org • www.freetheworld.com<br />
corporation that receives international support and is widely respected for its expertise.<br />
IME designs and promotes solutions to the problems that Bulgaria is facing in<br />
its transition to a market economy, provides independent assessment and analysis<br />
of the government’s economic policies, and supports an exchange of views on market<br />
economics and relevant policy issues.<br />
e-mail: mail@ime.bg • website: <br />
Burkina Faso Le Centre des Affaires Humaines<br />
Le Centre des Affaires Humaines (CEDAH) is a free-market educational and research<br />
public-policy think-tank founded in December 2007 in Burkina Faso. The CEDAH<br />
is an independent, non-profit organization with no affiliations to any political party.<br />
It is financed entirely from contributions from individuals, organizations, and foundations.<br />
In order to protect its research independence, it does not accept grants from<br />
the government of Burkina Faso or political parties. The mission of CEDAH is to<br />
propose original and innovative solutions for the crafting of efficient public policies,<br />
using successful reforms applied elsewhere as models. The CEDAH studies how markets<br />
function with the aim of identifying the mechanisms and institutions that foster<br />
the prosperity and long-term welfare of all the individuals that make up our society.<br />
e-mail: info@cedah.org • website: <br />
Cambodia The Cambodia Institute of Development Study<br />
The Cambodia Institute of Development Study (CIDS) is a non-profit, independent,<br />
local research institute founded in December 2004. The Institute’s mission is<br />
to provide high-quality research on the local and provincial levels in the specialized<br />
areas of economics, natural resources and environment, agriculture and rural development,<br />
and public finance and governance, within the context of world integration.<br />
Its objectives are to generate and disseminate research on the national and provincial<br />
economies, and to enhance the capacity and promote the professional development<br />
of local resources by providing training and practical research opportunities.<br />
e-mail: info@cids.cambodia.org • website: <br />
Canada The Fraser Institute<br />
The vision of the Fraser Institute is a free and prosperous world where individuals<br />
benefit from greater choice, competitive markets, and personal responsibility. Our<br />
mission is to measure, study, and communicate the impact of competitive markets<br />
and government interventions on the welfare of individuals. Founded in 1974, we<br />
are an independent research and educational organization with locations throughout<br />
North America and international partners in over 85 countries. Our work is<br />
financed by tax-deductible contributions from thousands of individuals, organizations,<br />
and foundations. In order to protect its independence, the Institute does not<br />
accept grants from government or contracts for research.<br />
e-mail: info@fraserinstitute.org • websites: <br />
Chile Instituto Libertad y Desarrollo<br />
The Instituto Libertad y Desarrollo is a private think-tank wholly independent of<br />
any religious, political, financial, or governmental groups. It is committed to the free<br />
market and to political and economic freedom. It publishes studies and analyses of<br />
public-policy issues.<br />
e-mail: lyd@lyd.org • website:
<strong>Economic</strong> <strong>Freedom</strong> of the <strong>World</strong>: 2012 Annual Report • 293<br />
China Center for China & Globalization<br />
The Center for China & Globalization (CCG) is a non-profit and independent<br />
think-tank. It has a pool of first-class scholars, business leaders, and experts in government<br />
addressing issues on the challenges and opportunities of positioning China<br />
in the process of globalization. CCG conducts timely strategic analysis and feasibility<br />
studies of policy-making options for China’s economic development and social<br />
progress. The top-level experts, Chinese and foreign alike, help assess the regional<br />
and global implications of China’s rise in the context of international political and<br />
economic reconfiguration. CCG aims to become the leading international thinktank<br />
for China’s society and business community and seeks to remain independent,<br />
objective and constructive in all its research activities.<br />
e-mail: ccg@ccg.org.cn • website: <br />
Colombia Instituto de Ciencia Politica<br />
Since 1987, the Instituto de Ciencia Política (ICP) has established itself as a center<br />
of democratic thought and as an association of free men and women united by a<br />
common affection for an intellectual identity with the principles, values, and feelings<br />
that constitute democracy as a political, economic, social, and cultural system,<br />
and united also by their desire to act constantly and efficiently towards overcoming<br />
the lack of stability and mistakes of our political sector, in order to achieve economic,<br />
political, social, and environmental development.<br />
ICP, as an influential think-tank in the nation, has been able, through its studies,<br />
recommendations and debates, to mediate decisively in the new directions<br />
and measures taken on different occasions by public authorities, as well as in the<br />
formation of new national political thought, favorable to the market economy,<br />
economic openness, necessary privatizations, and the modernization of the State.<br />
The institution is not, nor aspires to be, a new political party or movement, and it<br />
is independent of parties, religions, and governments. Its mission is to establish<br />
as fundamental principles the free-market economy, competition, and individual<br />
initiative, as well as the reduction of State intervention and control to the minimum<br />
indispensable.<br />
e-mail: info@icpcolombia.org • website: <br />
Costa Rica Instituto para la Libertad y el Análisis de Políticas<br />
The Instituto para la Libertad y el Análisis de Políticas (INLAP—the Institute for<br />
Liberty and Public Policy Analysis) is a non-profit, non-partisan organization created<br />
to defend and promote individual liberty through analysis of public policy<br />
and educational activities. Its specific objectives are to increase awareness of the<br />
moral foundations of liberty and to promote liberty as an individual right necessary<br />
to achieve the highest levels of economic and human development; and to foster<br />
changes in social organization and public policies by influencing the thinking of<br />
policy makers, community leaders, and citizens. INLAP produces timely analyses of<br />
proposed laws, decrees, and regulations, and its recommendations provide guidance<br />
for elected officials who seek to achieve greater individual liberty and creativity and<br />
a more productive economy. It also conducts detailed studies of well-meant public<br />
policies that may ultimately have unintended adverse effects. The Institute’s studies<br />
and recommendations are published in books, journals, and newspapers, appear as<br />
position papers and bulletins, and are also available via our website.<br />
e-mail: inlapp@racsa.co.cr<br />
www.freetheworld.com • www.fraserinstitute.org • Fraser Institute ©2012
294 • <strong>Economic</strong> <strong>Freedom</strong> of the <strong>World</strong>: 2012 Annual Report<br />
Côte d’Ivoire Audace Institut Afrique<br />
Audace Institut Afrique (AIA) is a think-tank established in November 2009 that<br />
aims to promote classical liberalism, the theory and politics of the market economy<br />
as well as the philosophy of the Austrian school in Africa. The Insitute wishes to<br />
initiate reflections on economic and political freedoms in Africa through the organization<br />
of symposia, seminars, conferences, workshops, training at the university,<br />
and a research program.<br />
e-mail: institut@audace-afrique.org • website: <br />
Croatia The Institute of <strong>Economic</strong>s<br />
The Institute of <strong>Economic</strong>s, Zagreb, established in 1939, is a major scientific and<br />
research institution for the study of economic processes and the application of<br />
contemporary theories in economics. The Institute’s objective is the economic and<br />
social advance of Croatia. Research encompasses both macroeconomics and microeconomics,<br />
policy issues (including specialized areas such as business economics),<br />
current economic trends, methods of economic analysis, development of human<br />
resources, spatial and regional economics, international economics and technological<br />
development, and investment project planning. Researchers from inside and<br />
outside the Institute work together on research projects. The Institute employs 40<br />
full-time researchers, the majority of whom have completed specialized training<br />
courses in foreign countries. Results of the Institute’s research activities are published<br />
in books, reports, and studies as well as in scientific journals. The Institute<br />
maintains close contact with international organizations, professional associations,<br />
institutes, and universities.<br />
Email: eizagreb@eizg.hr • website: <br />
Czech Republic Liberální Institut<br />
Liberální Institut is an independent, non-profit organization for the development<br />
and application of classical liberal ideas: individual rights, private property, rule of<br />
law, self-regulating markets, and delineated government functions. It is financed by<br />
its various activities and by donations from individuals and private corporations.<br />
E-mail: eva.horova@libinst.cz • website: <br />
Denmark Center for Politiske Studier<br />
The Center for Politiske Studier (CEPOS—Center for Political Studies) was<br />
founded in 2004 as an independent, non-profit think-tank based in Copenhagen.<br />
It seeks to promote a free and prosperous society by conducting research that will<br />
foster the policies, institutions, and culture that will best support a market economy,<br />
rule of law, and a civil society consisting of free and responsible individuals. It<br />
does so by producing academic studies and policy analyses aimed partly at general<br />
political debates and partly at the political process in areas such as welfare, taxation,<br />
regulation, education, entrepreneurship, health care, the environment, and the organization<br />
of the public sector.<br />
e-mail: info@cepos.dk • website: <br />
Dominican Republic Fundación Economía y Desarrollo, Inc.<br />
The Fundación Economía y Desarrollo, Inc. (FEyD) is a private, non-profit organization<br />
dedicated to fostering competitive markets, private enterprise, and strategies<br />
that promote economic development. To meet its objectives, FEyD has several<br />
Fraser Institute ©2012 • www.fraserinstitute.org • www.freetheworld.com
<strong>Economic</strong> <strong>Freedom</strong> of the <strong>World</strong>: 2012 Annual Report • 295<br />
one-hour television program called “Triálogo,” which is broadcast three times a week<br />
and explains studies of the performance of the Dominican economy and its sectors.<br />
Ecuador Instituto Ecuatoriano de Economía Política<br />
The Instituto Ecuatoriano de Economia Politica (IEEP) is a private, independent,<br />
non-profit institution that defends and promotes the classical liberal ideals of individual<br />
liberty, free markets, limited govern ment, property rights, and the rule of law.<br />
The IEEP achieves its mission through publications, seminars, and workshops that<br />
debate socioeconomic and political issues. The IEEP’s funding comes from voluntary<br />
donations, membership subscriptions, and income from sales of its publications.<br />
e-mail: info@ieep.org.ec • website: <br />
Finland Libera Foundation<br />
Libera Foundation is a private, independent, non-political think tank that advances<br />
and supports the principles and values of individual liberty, free enterprise, free markets,<br />
and a free society. Libera is supported solely by contributions from private individuals,<br />
foundations, and businesses, and it accepts no taxpayer money. Libera works<br />
by disseminating information, arranging seminars and events, publishing relevant literature,<br />
supporting and facilitating academic knowledge creation and ideas, conducting<br />
research and raising public awareness of the current issues related to its mission.<br />
e-mail: info@libera.fi • website: <br />
France Institut Economique Molinari<br />
The Molinari <strong>Economic</strong> Institute (MEI) is a research and educational think-tank. It aims<br />
to initiate and stimulate an economic approach to the analysis of public policy. It was<br />
named after Gustave de Molinari, a Franco-Belgian economist and journalist; he himself<br />
has worked all his life to promote this approach. The MEI has set as its mission to<br />
propose alternative and innovative solutions favorable to the prosperity of all individuals<br />
in society. The MEI is a non-profit organization funded by the voluntary contributions<br />
of its members: individuals, corporations, or other foundations. Affirming its intellectual<br />
independence, it accepts no government funding or support from political parties.<br />
website: <br />
Georgia Society for Disseminating <strong>Economic</strong> Knowledge: New <strong>Economic</strong> School<br />
The Society was founded in 2001. The goal of the Society is to disseminate and<br />
promote free-market ideas and to create a resource center promoting free-market<br />
economics for students, young scientists, teachers, and other interested parties.<br />
Through publications, conferences, seminars, lectures, panel workshops, summer<br />
and winter schools, scientific Olympiads, and competitions, the Society seeks to<br />
disseminate classical liberal ideas.<br />
Email: office@nesgeorgia.org • website: <br />
Germany Liberales Institut<br />
The Liberales Institut (Liberty Institute), based in Potsdam, is the think-tank of the<br />
Friedrich-Naumann-Foundation. It spreads free-market ideas through the publication<br />
of classical liberal literature, the analysis of current political trends, and the promotion<br />
of research. The Institute organizes conferences and workshops to stimulate<br />
an intellectual exchange among liberals around the world.<br />
e-mail: libinst@freiheit.org • <br />
www.freetheworld.com • www.fraserinstitute.org • Fraser Institute ©2012
296 • <strong>Economic</strong> <strong>Freedom</strong> of the <strong>World</strong>: 2012 Annual Report<br />
Ghana The Institute of <strong>Economic</strong> Affairs<br />
The Institute of <strong>Economic</strong> Affairs (IEA), Ghana, was founded in October 1989<br />
as an independent, non-governmental institution dedicated to the establishment<br />
and strengthening of a market economy and a democratic, free, and open society.<br />
It considers improvements in the legal, social, and political institutions as<br />
necessary conditions for sustained economic growth and human development.<br />
The IEA supports research and promotes and publishes studies on important<br />
economic, socio-political, and legal issues in order to enhance understanding<br />
of public policy.<br />
e-mail: iea@ieagh.org • website: < http://www.ieagh.org/ ><br />
Guatemala Centro de Investigaciones Económicas Nacionales<br />
The Centro de Investigaciones Económicas Nacionales (CIEN—the Center for<br />
Research on the National Economy) was established in Guatemala in 1982. It is a<br />
private, non-partisan, not-for-profit, public-policy institute, funded by the sale of<br />
its books and periodical publications, income from conferences and seminars, and<br />
the support it receives from its members and the public. The Center’s program is<br />
devoted to the technical study of economic and social problems that impede the<br />
stable development of the nation. Its members, staff, research associates, and supporters<br />
share the principles of a social order of free and responsible individuals interacting<br />
through a market economy functioning within the rule of law.<br />
e-mail: cien@cien.org.gt • website: <br />
Guinea InafEcon—Institute of African <strong>Economic</strong>s<br />
The Institute of African <strong>Economic</strong>s aims to promote and stimulate economic<br />
research and training in Guinea and other African countries through organizing<br />
conferences, congresses, seminars, and courses; publishing technical and scientific<br />
studies; granting scholarships and prizes; and advising sound economic policy. By<br />
doing so, the Institute would like to help reverse the tendencies of afro-pessimism<br />
and the marginalization of the African continent in worldwide cultural, scientific,<br />
and commercial exchanges through the ownership by the African public (academics,<br />
political leaders, civil servants, corporate managers, and civil society) of the development<br />
challenges in a world integrated globally between the North, the South, the<br />
East, and, the West.<br />
e-mail: inafecon@inafecon.org • website: <br />
Haiti Institut de Recherche pour la Liberté Économique et la Prospérité<br />
L’Institut de Recherche pour la Liberté Économique et la Prospérité (IRLEP), Haiti,<br />
was founded in 2004. It is a non-partisan, non-profit, research and educational organization<br />
devoted to improving the quality of life in Haiti through economic growth<br />
and development. Through publications and conferences, IRLEP promotes the<br />
principles and concepts of individual rights, limited government, competition, free<br />
trade, and physical and intellectual property rights. IRLEP does not accept funding<br />
and subsidies from public institutions and political parties.<br />
e-mail: irlephaiti@yahoo.com<br />
Honduras Centro de Investigaciones <strong>Economic</strong>as y Sociales (CIES)<br />
website: <br />
Fraser Institute ©2012 • www.fraserinstitute.org • www.freetheworld.com
<strong>Economic</strong> <strong>Freedom</strong> of the <strong>World</strong>: 2012 Annual Report • 297<br />
Hong Kong Hong Kong Centre for <strong>Economic</strong> Research<br />
The Hong Kong Centre for <strong>Economic</strong> Research is an educational, charitable trust<br />
established in 1987 to promote the free market in Hong Kong by fostering public<br />
understanding of economic affairs and developing alternative policies for government.<br />
The Centre publishes authoritative research studies and is widely recognized<br />
as the leading free-market think-tank in Asia. It has been influential in persuading<br />
public opinion and the government in Hong Kong to liberalize telecommunications,<br />
open up air-cargo-handling franchises, privatize public housing, adopt a fully<br />
funded provident scheme instead of a pay-as-you-go pension scheme, remove the<br />
legally sanctioned fixing of deposit interest rates by banks, and adopt market mechanisms<br />
for protecting the environment.<br />
e-mail: hkcer@econ.hku.hk • website: <br />
Hungary Szazadveg Foundation<br />
The Szazadveg Foundation is a non-profit organization performing political and economic<br />
research, and advisory and training activities. This think-tank is independent<br />
of the government or any political parties and has been operating as a foundation<br />
since its establishment in 1990. Szazadveg publishes the results of its research to<br />
the public at large and also provides professional services to economic institutions,<br />
political and civil organizations, political parties, and the government.<br />
e-mail: varkonyi@szazadveg.hu • website: <br />
Iceland Centre for Social and <strong>Economic</strong> Research<br />
The Centre for Social and <strong>Economic</strong> Research (RSE) is an independent, non partisan,<br />
non-profit organization in Reykjavik, Iceland, founded in 2004. Its mission is<br />
to promote an understanding of private property and free-market ideas for a progressive,<br />
democratic society. RSE achieves its mission through programs of publication<br />
and conferences. Its work is assisted by a council of academic advisors of the<br />
highest standard from various academic fields. RSE is funded entirely by voluntary<br />
contributions from its supporters.<br />
website: <br />
India Centre for Civil Society<br />
The Centre for Civil Society (CCS) is an independent, non-profit, research and<br />
educational organization inaugurated on August 15, 1997 and devoted to improving<br />
the quality of life for all citizens of India. The CCS maintains that, having earlier<br />
attained their political independence from an alien state, the Indian people<br />
must now seek economic, social, and cultural independence from the Indian<br />
state. This can work from two directions simultaneously: a “mortar” program<br />
of building or rebuilding the institutions of civil society and a “hammer” program<br />
of readjusting the size and scope of the political society. The CCS conducts<br />
monthly dialogues on topical issues to introduce classical liberal philosophy and<br />
market-based solutions into public debate. It has published Agenda for Change,<br />
a volume in 17 chapters that outlines policy reforms for the Indian government,<br />
Israel Kirzner’s How Markets Work, and Self-Regulation in the Civil Society, edited<br />
by Ashok Desai. It organizes Liberty and Society seminars for college students<br />
and journalists.<br />
e-mail: ccs@ccs.in • website: <br />
www.freetheworld.com • www.fraserinstitute.org • Fraser Institute ©2012
298 • <strong>Economic</strong> <strong>Freedom</strong> of the <strong>World</strong>: 2012 Annual Report<br />
Indonesia The Institute for Development of <strong>Economic</strong>s and Finance<br />
Indonesian Development of <strong>Economic</strong>s and Finance (INDEF) is an NGO founded<br />
in Jakarta in 1996. It is a source of information in economics for policy makers, press,<br />
students, and business.<br />
Fraser Institute ©2012 • www.fraserinstitute.org • www.freetheworld.com<br />
e-mail: Indef@indo.net.id • website: <br />
Ireland Open Republic Institute<br />
The Open Republic Institute (ORI) is Ireland’s only platform for public-policy discussion<br />
that is specifically interested in individual rights within the context of opensociety<br />
and open-market ideas. The ORI works within a non-political framework<br />
to provide public-policy analysis and new policy ideas to government, public representatives,<br />
civil servants, academics, students, and citizens.<br />
website: <br />
Israel Jerusalem Institute for Market Studies<br />
The Jerusalem Institute for Market Studies ( JIMS) was founded in 2003 in<br />
Jerusalem, Israel, as an independent non-profit, economic policy think-tank. JIMS’<br />
mission is to promote market solutions and limited government in Israel and the<br />
region. In order to spread free-market ideas, JIMS conducts original research and<br />
publishes public-policy papers and editorials. JIMS also runs a wide range of educational<br />
programs for young professionals and students in elementary school, high<br />
school, and college.<br />
e-mail: corinne.sauer@jims-israel.org • website: <br />
Italy Centro Einaudi<br />
The Centro di Ricerca e Documentazione “Luigi Einaudi” was founded in 1963 in Turin,<br />
Italy, as a free association of businessmen and young intellectuals to foster individual<br />
freedom and autonomy, economic competition, and the free market. The Centro is<br />
an independent, non-profit institute financed by contributions from individuals and<br />
corporations, by the sale of its publications, and by specific research commissions. The<br />
Centro carries on research activities, trains young scholars and researchers, organizes<br />
seminars, conferences and lectures, and publishes monographs, books, and periodicals,<br />
including: the quarterly journal, Biblioteca della libertà; Rapporto sull’economia<br />
globale e l’Italia (Report on the Global Economy and Italy); Rapporto sul risparmio e<br />
sui risparmiatori in Italia (Report on Savings and Savers in Italy); and Rapporto sulla<br />
distribuzione in Italia (Report on the Retail Trade in Italy—published also in English).<br />
e-mail: segreteria@centroeinaudi.it • website: <br />
Jordan Young Entrepreneurs Association<br />
The Young Entrepreneurs Association (YEA) is a non-profit organization that aims<br />
to help small and medium-sized Jordanian companies become investor- and marketready,<br />
and develop their ideas to facilitate the growth of their businesses. The YEA<br />
aims to foster fellowship and the exchnage of ideas between entrepreneurs; educate<br />
and train entrepreneurs; and be the voice for the entrepreneurial community as a<br />
whole. For entrepreneurial activities to succeed in Jordan, the YEA must act as an<br />
advocate for legislative change, thereby helping shape, through rules and regulation,<br />
a favorable business environment for startups and expanding businesses.<br />
Email: director@yea.com.jo • website:
<strong>Economic</strong> <strong>Freedom</strong> of the <strong>World</strong>: 2012 Annual Report • 299<br />
Kazakhstan Central Asian Free Market Institute<br />
The Central Asian Free Market Institute is an independent think-tank. Its mission<br />
is to increase the individual freedom and responsibility of people in Central Asia.<br />
That includes strengthening the institutions of the market economy, property, and<br />
the rule of law.<br />
email: office@freemarket.kg • website: <br />
Kenya African Research Center for Public Policy and Market Process<br />
The African Research Center for Public Policy and Market Process, Kenya, is the first<br />
research centre founded in Africa by the African Educational Foundation for Public<br />
Policy and Market Process, an independent educational organization registered in<br />
the United States. The primary mission of the Center and the Foundation is to promote<br />
ideas about free markets and voluntary associations in Africa. The Center conducts<br />
research on all aspects of free markets, voluntary association, and individual<br />
liberty, and publishes the results to as wide an audience as possible. The Center also<br />
organizes seminars and conferences to examine liberty and enterprise in Africa.<br />
e-mail: kimenyi@kippra.or.ke<br />
Korea Center for Free Enterprise<br />
The Center for Free Enterprise (CFE) is a foundation committed to promoting free<br />
enterprise, limited government, freedom and individual responsibility, the rule of<br />
law, and restraint of violence. Funded by the members of the Federation of Korean<br />
Industries (FKI), the CFE was founded as a non-profit, independent foundation on<br />
April 1, 1997, at a time of economic crisis in Korean society. The CFE has concentrated<br />
on championing a free economy through books and reports on public policies,<br />
statistics, and analyses. In workshops and policy forums, the CFE has put forward<br />
alternatives to policies proposed as solutions for issues facing Korean society.<br />
e-mail: csn@cfe.org • website: <br />
Kosovo Group for Legal and Political Studies<br />
The Group for Legal and Political Studies is a non-profit organization, based in<br />
Kosovo. The Group’s main aim is to provide a qualitative and highly competitive<br />
research environment with the intention to offer a new perspective for the reform,<br />
democratization, and development of the governing system of Kosovo.<br />
e-mail: office@legalpoliticalstudies.org • website: <br />
Kyrgyz Republic <strong>Economic</strong> Policy Institute—Bishkek Consensus<br />
The <strong>Economic</strong> Policy Institute—Bishkek Consensus (EPI), Kyrgyzstan, was created<br />
in December of 2003 as a non-profit, non-partisan, independent institute with<br />
developed partnerships and cooperative relationships with government, business,<br />
the international community, civil society, and the news media. EPI’s mission is to<br />
promote economic, social, and governance reforms in Kyrgyzstan, involving institutions<br />
of civil society to elaborate and execute the reforms, developing local potential<br />
and using the best international experience. Its strategic position is to be an independent<br />
and highly objective source of information and research on public-policy<br />
issues, as well as an unbiased forum for collaboration of diverse interest groups in<br />
the reform of public policy.<br />
e-mail: office@epi.kg<br />
www.freetheworld.com • www.fraserinstitute.org • Fraser Institute ©2012
300 • <strong>Economic</strong> <strong>Freedom</strong> of the <strong>World</strong>: 2012 Annual Report<br />
Lithuania Lithuanian Free Market Institute<br />
The Lithuanian Free Market Institute (LFMI) is an independent, non-profit organization<br />
established in 1990 to advance the ideas of individual freedom and responsibility,<br />
free markets, and limited government. Since its inception, LFMI has been<br />
at the forefront of economic thought and reform in Lithuania. Not only has LFMI<br />
helped frame policy debates by conducting research and creating reform packages<br />
on key issues, it has also conducted extensive educational campaigns and played<br />
a key role “behind the scenes” in helping to craft and refine legislative proposals.<br />
LFMI promoted the idea of a currency board and provided decisive input to the<br />
Law on Litas Credibility; it led the creation of the legal and institutional framework<br />
for the securities market and contributed significantly to the country’s privatization<br />
legislation; and it initiated and participated in the policy-making process on private,<br />
fully funded pension insurance. LFMI’s recommendations were adopted in legislation<br />
on commercial banks, the Bank of Lithuania, credit unions, insurance, and<br />
foreign investment. LFMI significantly influenced the improvement of company,<br />
bankruptcy, and competition law.<br />
e-mail: lfmi@freema.org • website: <br />
Malaysia Institute for Democracy and <strong>Economic</strong> Affairs<br />
The Institute for Democracy and <strong>Economic</strong> Affairs (IDEAS) is Malaysia’s first thinktank<br />
dedicated to promoting market-based solutions to public policy challenges. We<br />
are an independent, not-for-profit organization. As a cross-partisan think-tank, we<br />
work across the political spectrum. Our purpose is to advance market-based principles,<br />
and we are not bound by party politics, race, or religion. Our office is in Bukit<br />
Tunku, Kuala Lumpur, just minutes away from Parliament. We achieve our aims by<br />
working with an extensive network of experts who share our ideals.<br />
e-mail: admin@ideas.org.my • website: <br />
Mexico Centro de Investigación para el Desarrollo A.C.<br />
The Centro de Investigación para el Desarrollo A.C. (CIDAC) is an independent,<br />
not-for-profit research institution devoted to the study of Mexico’s economy and<br />
political system. Its philosophy is that Mexico’s economy can be made viable only<br />
through a greater, more efficient, and more competitive private sector. CIDAC was<br />
founded in 1980 as an executive training facility for the financial sector at large (public<br />
and private, banking and business). It received an endowment from Banamex, then<br />
Mexico’s largest private bank. In 1983, immediately after the expropriation of the private<br />
banks, CIDAC changed its mandate from teaching to research. Over the last five<br />
years, CIDAC has held over 40 conferences for businessmen and its professionals<br />
continuously address academic, policy, and business forums. CIDAC has also published<br />
19 books on various economic, political, and policy issues, 45 monographs, and<br />
over 500 op-ed pieces in Mexican, American, and European papers and magazines.<br />
e-mail: info@cidac.org • website: <br />
Mongolia Open Society Forum<br />
The Open Society Forum is an independent, non-governmental, organization<br />
founded in 2004. The Forum’s goals are to provide quality policy research and analysis<br />
and broad public access to information resources pertaining to governance, economic,<br />
and social policies. It focuses on economic freedom, land reform, rule of<br />
Fraser Institute ©2012 • www.fraserinstitute.org • www.freetheworld.com
<strong>Economic</strong> <strong>Freedom</strong> of the <strong>World</strong>: 2012 Annual Report • 301<br />
law, freedom of media, campaign financing, nomadic pastoralism, privatization, the<br />
shadow economy, and education policy. The Forum conducts research and holds<br />
conferences to encourage public participation in policy formulation.<br />
e-mail: osf@forum.mn • website: <br />
Montenegro The Center for Entrepreneurship and <strong>Economic</strong> Development<br />
The Center for Entrepreneurship and <strong>Economic</strong> Development (CEED) is the first<br />
non-governmental, non-partisan free-market center established in Montenegro. Its<br />
mission is to educate entrepreneurs about private ownership, democratic society,<br />
free markets, and the rule of law through a number of programs, initiatives, publications,<br />
and events. The Center was established to meet the demand for business<br />
knowledge by pioneering entrepreneurs who needed training to operate in a new<br />
environment after the break-up of the former Yugoslavia.<br />
e-mail: ceed@t-com.me • website: <br />
Nepal The Prosperity Foundation<br />
Samriddhi, The Prosperity Foundation, envisions a free and prosperous Nepal<br />
where individuals can live a dignified life in a vibrant and democratic society with<br />
equal access to opportunities and respect for the rule of law. Its mission is to promote<br />
ideas of freedom—civil, political, and economic—through public-policy recommendations<br />
(based on independent research), educational programs, and public<br />
participation for a free and prosperous Nepal.<br />
e-mail: info@samriddhi.org • website: <br />
New Zealand New Zealand Business Roundtable<br />
The New Zealand Business Roundtable is made up of the chief executives of about<br />
60 of New Zealand’s largest businesses. Its aim is to contribute to the development<br />
of sound public policies that reflect New Zealand’s overall interests. It has been a<br />
prominent supporter of the country’s economic liberalization.<br />
e-mail: nzbr@nzbr.org.nz • website: <br />
Nigeria Initiative of Public Policy Analysis<br />
The Initiative of Public Policy Analysis (IPPA) is a private, non-profit organization<br />
involved in research, education, and publication on matters affecting the freedom<br />
of individuals. Its objective is to provide market-oriented analysis of current and<br />
emerging policy issues, with a view to influencing the public debate and the political<br />
decision-making process.<br />
e-mail: info@ippanigeria.org • website: <br />
Norway Center for Business and Society Incorporated<br />
The Center for Business and Society Incorporated (Civita), the first market-oriented<br />
think-tank in Norway, was established in 2004. It strives for increased consensus on<br />
important market economic principles and their implications for welfare, freedom,<br />
and democracy. Civita is also dedicated to promoting personal responsibility and<br />
civil society to achieve larger, more important roles in society’s development. To<br />
communicate its ideas to the public, it conducts research, publishes reports, and<br />
holds seminars and conferences.<br />
e-mail: civita@civita.no • website: <br />
www.freetheworld.com • www.fraserinstitute.org • Fraser Institute ©2012
302 • <strong>Economic</strong> <strong>Freedom</strong> of the <strong>World</strong>: 2012 Annual Report<br />
Oman International Research Foundation<br />
The International Research Foundation (IRF), Sultanate of Oman, was established<br />
in 2005 as a non-governmental, independent, non-profit “Think-Tank” based in<br />
Oman to conduct research on domestic and international economic issues with<br />
emphasis on the Arab <strong>World</strong>. The IRF has set its research and public-affairs agenda<br />
on a collegial basis, relying on the input of its research staff, its editorial board, and<br />
its Senior Fellows. It maintains a working arrangement with governmental and nongovernmental<br />
organizations in the region and other parts of the world. IRF is the<br />
regional member of the Fraser Institute’s <strong>Economic</strong> <strong>Freedom</strong> Network.<br />
The vision of IRF is to create wealth and jobs through the promotion of economic<br />
freedom. Its mission is to measure, research, and communicate to a global<br />
audience the impact of competitive markets on the welfare of individuals. The<br />
Board of Trustees of the IRF consists of high-profile private-sector members from<br />
different organizations. IRF has initiated the establishment of a network of academic<br />
researchers to facilitate research projects, which will help in its endeavor to<br />
research economic issues affecting the daily life of individuals.<br />
e-mail: azzan@ociped.com • website: <br />
Pakistan Alternate Solutions Institute<br />
Alternate Solutions Institute, founded in 2003, is the first free-market think-tank in<br />
Pakistan. Its mission is (1) to seek solutions to challenges pertaining to the economy,<br />
law, education, and health in accordance with the principles of classical liberalism<br />
and (2) to promote the implementation of these solutions. The Institute aims to<br />
promote the concept of a limited, responsible government in Pakistan under the<br />
rule of law protecting life, liberty, and property of all of its citizens without any discrimination.<br />
The Institute conducts research and holds seminars, workshops, and<br />
conferences to educate interested students, teachers, and journalists about the principles<br />
of classical liberalism.<br />
e-mail: info@asinstitute.org • website: <br />
Palestine Pal-Think for Strategic Studies<br />
Pal-Think for Strategic Studies is an independent, non-profit, institute in Gaza,<br />
Palestine. It was established in March 2007. Pal-Think’s mission is to promote peace,<br />
freedom, and prosperity through debates on public issues, producing policy recommendations<br />
for the decision-makers in Palestine and the Middle East. The main<br />
objective of Pal-Think is to conduct research on thematic issues that serve as a basis<br />
for policy debates on matters that are important to the Palestinians, the region, and<br />
the international community.<br />
To achieve its vision of being a leading think-tank in Palestine and the Middle<br />
East, Pal-Think also organizes conferences, workshops, round-table discussions, and<br />
other events on specific issues in Palestine and the region to deepen the understanding<br />
by the various constituencies and to provide appropriate policy solutions.<br />
e-mail: info@palthink.org • website: <br />
Panama Fundación Libertad<br />
The Fundación Libertad, Panama, is a non-profit foundation engaged in the promotion<br />
and development of liberty, individual choice, and voluntary cooperation, and<br />
in the reduction of the size of government. Fundación Libertad was founded in 2001<br />
Fraser Institute ©2012 • www.fraserinstitute.org • www.freetheworld.com
<strong>Economic</strong> <strong>Freedom</strong> of the <strong>World</strong>: 2012 Annual Report • 303<br />
by members of professional and business organizations to promote free enterprise<br />
and democracy and to address issues affecting the freedom of the common citizen,<br />
including the increasing discretionary power of the state and the proliferation of<br />
legislation fostering discrimination and establishing privileges, all of which are contrary<br />
to the spirit of democratic capitalism. Fundación Libertad has drawn initial<br />
support from sister organizations such as Centro de Divulgación del Conocimiento<br />
Económico (CEDICE) in Caracas, Venezuela, and the Centro de Investigación y<br />
Estudios Nacionales (CIEN) in Guatemala.<br />
Email: info@fundacionlibertad.org.pa • website: <br />
Peru Centro de Investigación y Estudios Legales<br />
The Centro de Investigación y Estudios Legales (CITEL) was organized in<br />
1989. Its principal field is the economic analysis of law. To that end, it conducts<br />
research on different legal institutions, publishes books, and organizes seminars<br />
and colloquia.<br />
e-mail: info@citel.org • website: <br />
Philippines Center for Research and Communication<br />
The Center for Research and Communication (CRC) has, since 1967, conducted<br />
research and published works on domestic and international economic and political<br />
issues that affect the Asia-Pacific region. It provides forums for discussion and<br />
debate among academicians, businessmen, civil officials, and representatives of<br />
other sectors that shape public opinion and chart the course of policies. The Center<br />
for Research and Communicationis the main research arm of the University of Asia<br />
and the Pacific in Metro Manila.<br />
e-mail: crc@uap.asia; crc@uap.edu.ph • website: <br />
Poland Centrum im. Adama Smitha<br />
The Centrum im. Adama Smitha (the Adam Smith Research Centre—ASRC) is<br />
a private, non-partisan, non-profit, public-policy institute. It was founded in 1989<br />
and was the first such institute in Poland and in Eastern Europe. The ASRC promotes<br />
a free and fair market economy, participatory democracy, and a virtuous<br />
society. Its activities in research and development, education, and publishing cover<br />
almost all important issues within the areas of economy and social life. The ASRC<br />
acts as a guardian of economic freedom in Poland. More than 50 experts are associated<br />
with the ASRC.<br />
e-mail: 1989@smith.pl • website: <br />
Portugal Causa Liberal<br />
Causa Liberal is an independent, non-partisan, non-profit organization of<br />
Portuguese individuals who share the principles of the classical liberal tradition<br />
and wish to further its application in modern-day Portugal. Its mission is to defend<br />
the principles of the free society and its building blocks: individual rights, the<br />
rule of law, free markets, and private property. Its primary goals are to establish and<br />
consolidate a network of individuals with an interest in the study, discussion, and<br />
promotion of the classical liberal tradition, and to advance free-market ideas and<br />
policies in Portugal.<br />
e-mail: Geral@causaliberal.net • website: <br />
www.freetheworld.com • www.fraserinstitute.org • Fraser Institute ©2012
304 • <strong>Economic</strong> <strong>Freedom</strong> of the <strong>World</strong>: 2012 Annual Report<br />
Romania Romania Think Tank<br />
Romania Think Tank is an independent research institute founded in 2003. The<br />
Think Tank is funded entirely by its founding members. Its objective is to promote<br />
the development of free markets, low taxation, reduction of bureaucracy, free trade,<br />
and the stimulation of foreign investment. To this end, the Romania Think Tank publishes<br />
numerous articles in the Romanian and international media, and studies and<br />
analyzes issues relevant to the development of a free-market economy in Romania.<br />
Fraser Institute ©2012 • www.fraserinstitute.org • www.freetheworld.com<br />
e-mail: office@rtt.ro • website: <br />
Russia Institute of <strong>Economic</strong> Analysis<br />
The Institute of <strong>Economic</strong> Analysis is an institute for macroeconomic research that<br />
analyzes the current economic situation and policies, and provides expert analysis<br />
of acts, programs, and current economic policy. It offers advice to Russian government<br />
bodies, enterprises, and organizations; and prepares and publishes scientific,<br />
research, and methodological economic literature. It also conducts seminars,<br />
conferences, and symposia on economic topics. The Institute is an independent,<br />
non-governmental, non-political, non-profit research center that works closely with<br />
leading Russian and international research centres. Its research focuses on macroeconomic,<br />
budget, and social policies.<br />
e-mail: iea@iea.ru • website: <br />
Serbia Free Market Center<br />
The Free Market Center (FMC) is a non-profit, non-governmental organization<br />
founded in 2001. The Center promotes the understanding and acceptance of ideas<br />
like individual liberty, the free-market economy, limited government, and peaceful<br />
cooperation. To that end, the FMC strives to achieve greater involvement in redirecting<br />
the attention not only of leading thinkers but also of members of the public,<br />
entrepreneurs, policy-makers, and students to the role of free markets and the<br />
proper role of government. Through publications, discussion forums, and conferences,<br />
the Center seeks to disseminate classical liberal ideas.<br />
e-mail: fmc@yubc.net<br />
Slovak Republic F.A. Hayek Foundation<br />
The F.A. Hayek Foundation is an independent and non-partisan, non-profit organization<br />
that provides a forum for the exchange of opinions among scholars,<br />
businessmen, and policy-makers on the causes of, and solutions to, economic,<br />
social, and political problems. It proposes practical reforms of the economy, education,<br />
social security, and legislation as the Slovak Republic is transformed into<br />
an open society. Education of high-school and university students is a large part<br />
of its activities. The F.A. Hayek Foundation promotes the ideas of classical liberalism,<br />
virtually absent until 1989: market economy, reduced role for the government,<br />
rule of law and individual choice, responsibilities, and rights to life,<br />
liberty, and property.<br />
e-mail: hayek@hayek.sk • website: <br />
Slovenia Svetilnik<br />
Svetilnik—društvo za promocijo svobode—is an independent, non-partisan, nonprofit<br />
organization founded in 2008. Its aim is the dissemination of classical liberal<br />
ideas in Slovenia. To that end, Svetilnik has been organizing a spectrum of
<strong>Economic</strong> <strong>Freedom</strong> of the <strong>World</strong>: 2012 Annual Report • 305<br />
events and providing a platform for open and informative discussion on the classical<br />
liberal solutions to economic and political issues.<br />
e-mail: info@svetilnik-slovenija.org • website: <br />
South Africa Free Market Foundation of Southern Africa<br />
The Free Market Foundation is an independent policy research and educational organization<br />
founded in 1975 to promote the principles of limited government, economic<br />
freedom, and individual liberty in southern Africa. Funding is received from members<br />
(corporate, organizational and individual), sponsorships, and the sale of publications.<br />
e-mail: fmf@mweb.co.za • website: <br />
Spain Fundacio Catalunya Oberta<br />
Fundació Catalunya Oberta (Open Catalonia Foundation) was founded in 2001 with<br />
the objective of promoting, analyzing, and extending the values of the open society,<br />
freedom, democracy, and the market economy. The Foundation also defends the<br />
rights of Catalonia as a nation, especially in the cultural and economic fields. It is a<br />
private foundation, espousing liberal ideology, with no political connections, whose<br />
aim is to influence the public opinion of civil society. The Open Catalonia Foundation<br />
organizes a range of activities every year and publishes a number of reports. The<br />
Foundation also awards a yearly prize of €10,000 to prestigious journalists from all<br />
over the world to reward their endeavors on behalf of democracy and freedom.<br />
e-mail: fund@fco.cat • website: <br />
Sri Lanka Pathfinder Foundation<br />
The Pathfinder Foundation has replaced the Center for Policy Research. Through<br />
informed and well-researched information, it seeks to challenge old ideas and conventional<br />
wisdom, stimulate debate, change public attitudes, and seek new and innovative<br />
solutions to the economic and social problems of Sri Lanka.<br />
e-mail: pm@pathfinderfoundation.org • website: <br />
Sudan Nile Institute of <strong>Economic</strong> Studies<br />
The mission of the Nile Institute of <strong>Economic</strong> Studies is to serve as one of the leading<br />
promoters of economic and social freedom. We look to promote the public’s<br />
understanding of free-market principles such as individual liberty, rights to private<br />
property, rule of law, limited government, and free enterprise in Khartoum. Our primary<br />
focus is to achieve a considerable level of influence as a catalyst in Khartoum<br />
within the policy community and to establish a reputation for intellectual honesty,<br />
providing reliable, non-biased policy research that will help drive understanding of<br />
Sudan’s development.<br />
e-mail: nileinstitute@gmail.com<br />
Sweden Timbro<br />
Timbro is a Swedish think-tank that encourages public opinion to favor free enterprise,<br />
a free economy, and a free society. Timbro publishes books, papers, reports,<br />
and the magazine, Smedjan. It also arranges seminars and establishes networks<br />
among people. Founded in 1978, Timbro is owned by the Swedish Free Enterprise<br />
Foundation, which has as its principals a large number of Swedish companies and<br />
organizations.<br />
e-mail: info@timbro.se • website: <br />
www.freetheworld.com • www.fraserinstitute.org • Fraser Institute ©2012
306 • <strong>Economic</strong> <strong>Freedom</strong> of the <strong>World</strong>: 2012 Annual Report<br />
Switzerland Liberales Institut<br />
The Liberales Institut is a forum where the basic values and concepts of a free society<br />
can be discussed and questioned. The Institute’s aim is the establishment of free<br />
markets as the best way towards the goals of openness, diversity, and autonomy.<br />
The Liberales Institut is not associated with any political party. Through publications,<br />
discussion forums, and seminars, it seeks to develop and disseminate classical<br />
liberal ideas.<br />
Fraser Institute ©2012 • www.fraserinstitute.org • www.freetheworld.com<br />
e-mail: libinst@libinst.ch • website: <br />
Tajikistan Tajikistan Free Market Centre<br />
The long-term objectives of the Tajikistan Free Market Center are: advancement<br />
and protection of values of individualism and personal freedom; dissemination<br />
and advocacy of ideas about the priority of private property and the free market;<br />
advancement of the principle of a limited state (non-interference of the<br />
state in the personal and economic life of the individual); training and support<br />
of activists and the organizations that are supporters of ideas of individual and<br />
economic freedom.<br />
e-mail: freemarket.tj@gmail.com • website: <br />
Trinidad and Tobago Arthur Lok Jack Graduate School of Business, University of the West Indies<br />
The Arthur Lok Jack Graduate School of Business was created in 1989 as a channel<br />
partner for developing managerial talent for the business community in<br />
Trinidad and Tobago. Its mission is to empower people and organizations in<br />
developing nations to optimize their performance capabilities and international<br />
competitiveness through development and deployment of consulting; education,<br />
research, and training resources. One of the Institute’s core services are business<br />
and academic research in areas of real concern to business managers, enabling<br />
them to improve their ability to manage successfully in the face of increasingly<br />
complex markets.<br />
e-mail: r.balgobin@gsb.tt • website: <br />
Turkey Association for Liberal Thinking<br />
The Association for Liberal Thinking is a non-profit, non-governmental organization<br />
seeking to introduce the liberal democratic tradition into Turkey. The Association<br />
promotes the understanding and acceptance of ideas like liberty, justice, peace,<br />
human rights, equality, and tolerance. It also encourages academic writing on liberal<br />
themes to help the Turkish people assess contemporary domestic and international<br />
changes and attempts to find effective solutions to Turkey’s problems within<br />
liberal thought. The Association for Liberal Thinking is not involved in day-to-day<br />
politics and has no direct links to any political party or movement. Instead, as an<br />
independent intellectual group, it aims to set broader political agendas so as to contribute<br />
to the liberalization of economics and politics in Turkey.<br />
e-mail: info@liberal-dt.org.tr • website: <br />
Ukraine Ukrainian Center for Independent Political Research<br />
The Ukrainian Center for Independent Political Research (UCIPR) was established<br />
in early 1991 as a non-profit, non-partisan, and non-governmental research institution<br />
that would increase awareness of democracy among the Ukrainian people and<br />
analyze domestic and international politics and security. The UCIPR is politically
<strong>Economic</strong> <strong>Freedom</strong> of the <strong>World</strong>: 2012 Annual Report • 307<br />
independent; it does not accept any funding from either the state or any political<br />
party. The UCIPR publishes books and research papers on Ukraine’s domestic<br />
and foreign policy, the economy in transition, security, relations with neighboring<br />
states, the Crimean dilemma, interethnic relations, and the freedom of the news<br />
media. The Center has hosted a number of national and international conferences<br />
and workshops.<br />
e-mail: ucipr@ucipr.kiev.ua • website: <br />
United Kingdom Institute of <strong>Economic</strong> Affairs<br />
The mission of the Institute of <strong>Economic</strong> Affairs (IEA) is to improve public understanding<br />
of the foundations of a free and harmonious society by expounding and<br />
analyzing the role of markets in solving economic and social problems, and bringing<br />
the results of that work to the attention of those who influence thinking. The IEA<br />
achieves its mission by a high-quality publishing program; conferences, seminars,<br />
and lectures on a range of subjects; outreach to school and college students; brokering<br />
media introductions and appearances; and other related activities. Incorporated<br />
in 1955 by the late Sir Antony Fisher, the IEA is an educational charity, limited by<br />
guarantee. It is independent of any political party or group, and is financed by sales<br />
of publications, conference fees, and voluntary donations.<br />
e-mail: iea@iea.org.uk • website: <br />
United States of America Cato Institute<br />
Founded in 1977, the Cato Institute is a research foundation dedicated to broadening<br />
debate about public policy to include more options consistent with the traditional<br />
American principles of limited government, individual liberty, free markets,<br />
and peace. To that end, the Institute strives to achieve greater involvement by the<br />
intelligent, concerned, lay public in questions of policy and the proper role of government<br />
through an extensive program of publications and seminars.<br />
e-mail: ivasquez@cato.org • website: <br />
Venezuela Center for the Dissemination of <strong>Economic</strong> Knowledge<br />
The Center for the Dissemination of <strong>Economic</strong> Knowledge (CEDICE) is a nonpartisan,<br />
non-profit, private association dedicated to the research and promotion<br />
of philosophical, economic, political, and social thinking that focuses on individual<br />
initiative and a better understanding of the free-market system and free and responsible<br />
societies. To this end, CEDICE operates a library and bookstore, publishes the<br />
series, Venezuela Today, and other studies, provides economic training for journalists,<br />
and conducts special events and community programs.<br />
e-mail: cedice@cedice.org.ve • website: <br />
Vietnam Research Center for Entrepreneurship Development<br />
The Research Center for Entrepreneurship Development, founded in 2004, is a nongovernment<br />
research and educational organization devoted to the entrepreneurial<br />
development of the private sector in Vietnam. Its mission is to study the development<br />
of policies that create the most favorable institutional and policy environment<br />
for entrepreneurial development of the private sector in Vietnam. Through publications,<br />
discussion forums, and conferences, the Center seeks to disseminate and<br />
encourage appropriate polices and entrepreneurial development.<br />
e-mail: rced@rced.com.vn • website: <br />
www.freetheworld.com • www.fraserinstitute.org • Fraser Institute ©2012
308 • <strong>Economic</strong> <strong>Freedom</strong> of the <strong>World</strong>: 2012 Annual Report<br />
Zambia Zambia Institute for Public Policy Analysis<br />
The mission of the Zambia Institute for Public Policy Analysis (ZIPPA) is to promote<br />
wider appreciation of the key role of free markets and competition in economic<br />
development. ZIPPA wants to play a constructive role by promoting realistic<br />
economic policies and by suggesting solutions that have been successfully applied<br />
in other countries to similar economic problems.<br />
Fraser Institute ©2012 • www.fraserinstitute.org • www.freetheworld.com<br />
e-mail: zippamail@gmail.com • website:
Publishing history<br />
Prepatory studies<br />
Walker, Michael A., ed. (1988). <strong>Freedom</strong>, Democracy, and <strong>Economic</strong> Welfare:<br />
Proceedings of an International Symposium. (Volume 1.) Fraser Institute.<br />
Block, Walter E., ed. (1991). <strong>Economic</strong> <strong>Freedom</strong>: Proceedings of an International<br />
Symposium. (Volume 2.) Fraser Institute.<br />
Easton, Stephen T., and Michael A. Walker, eds. (1992). Rating Global <strong>Economic</strong><br />
<strong>Freedom</strong>. Fraser Institute.<br />
Annual reports—<strong>Economic</strong> <strong>Freedom</strong> of the <strong>World</strong><br />
Gwartney, James, Robert Lawson, and Walter Block (1996). <strong>Economic</strong> <strong>Freedom</strong> of<br />
the <strong>World</strong>: 1975–1995. Fraser Institute.<br />
Gwartney, James, and Robert Lawson (1997). <strong>Economic</strong> <strong>Freedom</strong> of the <strong>World</strong>:<br />
1997 Annual Report. Fraser Institute.<br />
Gwartney, James, and Robert Lawson (1998). <strong>Economic</strong> <strong>Freedom</strong> of the <strong>World</strong>:<br />
1998/1999 Interim Report. Fraser Institute.<br />
Gwartney, James, and Robert Lawson, with Dexter Samida (2000). <strong>Economic</strong><br />
<strong>Freedom</strong> of the <strong>World</strong>: 2000 Annual Report. Fraser Institute.<br />
Gwartney, James, and Robert Lawson, with Walter Park and Charles Skipton<br />
(2001). <strong>Economic</strong> <strong>Freedom</strong> of the <strong>World</strong>: 2001 Annual Report. Fraser Institute.<br />
Gwartney, James, and Robert Lawson, with Chris Edwards, Walter Park,<br />
Veronique de Rugy, and Smita Wagh (2002). <strong>Economic</strong> <strong>Freedom</strong> of the <strong>World</strong>:<br />
2002 Annual Report. Preface by Milton Friedman. Fraser Institute.<br />
Gwartney, James, and Robert Lawson, with Neil Emerick (2003). <strong>Economic</strong><br />
<strong>Freedom</strong> of the <strong>World</strong>: 2003 Annual Report. Fraser Institute.<br />
Note Links to these publications can be found at .<br />
www.freetheworld.com • www.fraserinstitute.org • Fraser Institute ©2012
310 • <strong>Economic</strong> <strong>Freedom</strong> of the <strong>World</strong>: 2012 Annual Report<br />
Fraser Institute ©2012 • www.fraserinstitute.org • www.freetheworld.com<br />
Gwartney, James, and Robert Lawson (2004). <strong>Economic</strong> <strong>Freedom</strong> of the <strong>World</strong>:<br />
2004 Annual Report. Fraser Institute.<br />
Gwartney, James, and Robert Lawson, with Erik Gartzke (2005). <strong>Economic</strong><br />
<strong>Freedom</strong> of the <strong>World</strong>: 2005 Annual Report. Fraser Institute.<br />
Gwartney, James, and Robert Lawson, with William Easterly (2006). <strong>Economic</strong><br />
<strong>Freedom</strong> of the <strong>World</strong>: 2006 Annual Report. Fraser Institute.<br />
Gwartney, James, and Robert Lawson, with Russell S. Sobel and Peter T. Leeson<br />
(2007). <strong>Economic</strong> <strong>Freedom</strong> of the <strong>World</strong>: 2007 Annual Report. Fraser Institute.<br />
Gwartney, James, and Robert Lawson, with Seth Norton (2008). <strong>Economic</strong><br />
<strong>Freedom</strong> of the <strong>World</strong>: 2008 Annual Report. Fraser Institute.<br />
Gwartney, James, and Robert Lawson, with Herbert Grubel, Jakob de Haan, Jan-<br />
Egbert Sturm, and Eelco Zandberg (2009). <strong>Economic</strong> <strong>Freedom</strong> of the <strong>World</strong>: 2009<br />
Annual Report. Fraser Institute.<br />
Gwartney, James, Joshua Hall, and Robert Lawson, with Christopher J. Coyne,<br />
John W. Dawson, Horst Feldmann, John Levendis, Russell S. Sobel, and Edward<br />
Peter Stringham (2010). <strong>Economic</strong> <strong>Freedom</strong> of the <strong>World</strong>: 2010 Annual Report.<br />
Fraser Institute.<br />
Gwartney, James, Robert Lawson, and Joshua Hall, with Jean-Pierre Chauffour<br />
and Michael D. Stroup (2011). <strong>Economic</strong> <strong>Freedom</strong> of the <strong>World</strong>: 2011 Annual<br />
Report. Fraser Institute.<br />
Annual reports—<strong>Economic</strong> <strong>Freedom</strong> of North America<br />
Karabegović, Amela, and Fred McMahon, with Glenn Mitchell (2005). <strong>Economic</strong><br />
<strong>Freedom</strong> of North America: 2005 Annual Report. Fraser Institute; National Center<br />
for Policy Analysis.<br />
Karabegović, Amela, and Fred McMahon, with Christy G. Black (2006).<br />
<strong>Economic</strong> <strong>Freedom</strong> of North America: 2006 Annual Report. Fraser Institute;<br />
National Center for Policy Analysis.<br />
Karabegović, Amela, and Fred McMahon, with Nathan J. Ashby and Russell S.<br />
Sobel (2008). <strong>Economic</strong> <strong>Freedom</strong> of North America: 2008 Annual Report. Fraser<br />
Institute; National Center for Policy Analysis.<br />
Ashby, Nathan J., Amela Karabegović, Fred McMahon, and Avilia Bueno, with<br />
Noel D. Campbell, Joab Corey, Alex Fayman, Deborah Martinez, and Tammy<br />
Rogers (2010). <strong>Economic</strong> <strong>Freedom</strong> of North America 2010. Fraser Institute.<br />
Ashby, Nathan J., Avilia Bueno, and Fred McMahon, with Deborah Martinez<br />
(2011). <strong>Economic</strong> <strong>Freedom</strong> of North America 2011. Fraser Institute.
<strong>Economic</strong> <strong>Freedom</strong> of the <strong>World</strong>: 2012 Annual Report • 311<br />
Annual reports—<strong>Economic</strong> <strong>Freedom</strong> of the Arab <strong>World</strong><br />
Al Ismaily, Salem Ben Nasser, Amela Karabegović, and Fred McMahon (2007).<br />
<strong>Economic</strong> <strong>Freedom</strong> of the Arab <strong>World</strong>: Report and Index – 2006–07. Fraser Institute.<br />
Al Ismaily, Salem Ben Nasser, Amela Karabegović, and Fred McMahon (2008).<br />
<strong>Economic</strong> <strong>Freedom</strong> of the Arab <strong>World</strong>: 2008 Annual Report. Friedrich Naumann<br />
Foundation for Liberty; International Research Foundation of Oman; Fraser<br />
Institute.<br />
Al Ismaily, Salem Ben Nasser, Amela Karabegović, and Fred McMahon, with<br />
Marisha Warrington (2009). <strong>Economic</strong> <strong>Freedom</strong> of the Arab <strong>World</strong>: 2009 Annual<br />
Report. Friedrich Naumann Foundation for Liberty; International Research<br />
Foundation of Oman; Fraser Institute.<br />
Al Ismaily, Salem Ben Nasser, Fred McMahon, Miguel Cervantes, and Amela<br />
Karabegović (2010). <strong>Economic</strong> <strong>Freedom</strong> of the Arab <strong>World</strong>: 2010 Annual Report.<br />
Friedrich Naumann Foundation for Liberty; International Research Foundation<br />
of Oman; Fraser Institute.<br />
Al Ismaily, Salem Ben Nasser, Miguel Cervantes, and Fred McMahon, (2011).<br />
<strong>Economic</strong> <strong>Freedom</strong> of the Arab <strong>World</strong>: 2011 Annual Report. Friedrich Naumann<br />
Foundation for Liberty; International Research Foundation of Oman; Fraser<br />
Institute.<br />
www.freetheworld.com • www.fraserinstitute.org • Fraser Institute ©2012