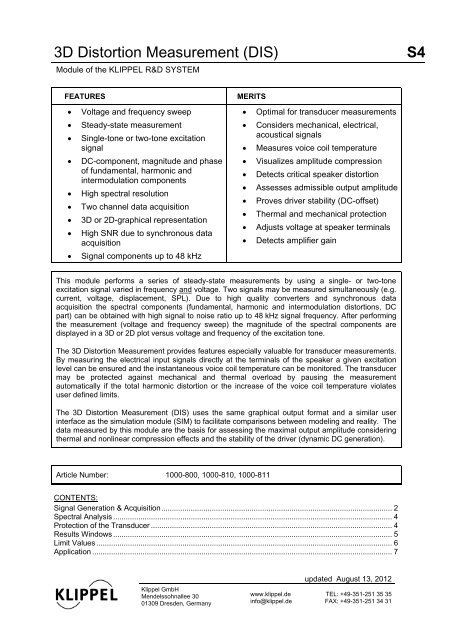
3D Distortion Measurement (DIS) S4 - Klippel GmbH
3D Distortion Measurement (DIS) S4 - Klippel GmbH
3D Distortion Measurement (DIS) S4 - Klippel GmbH

Create successful ePaper yourself
Turn your PDF publications into a flip-book with our unique Google optimized e-Paper software.
<strong>3D</strong> <strong>Distortion</strong> <strong>Measurement</strong> (<strong>DIS</strong>) <strong>S4</strong><br />
Module of the KLIPPEL R&D SYSTEM<br />
FEATURES MERITS<br />
Voltage and frequency sweep<br />
Steady-state measurement<br />
Single-tone or two-tone excitation<br />
signal<br />
DC-component, magnitude and phase<br />
of fundamental, harmonic and<br />
intermodulation components<br />
High spectral resolution<br />
Two channel data acquisition<br />
<strong>3D</strong> or 2D-graphical representation<br />
High SNR due to synchronous data<br />
acquisition<br />
Signal components up to 48 kHz<br />
<strong>Klippel</strong> <strong>GmbH</strong><br />
Mendelssohnallee 30<br />
01309 Dresden, Germany<br />
Optimal for transducer measurements<br />
Considers mechanical, electrical,<br />
acoustical signals<br />
Measures voice coil temperature<br />
Visualizes amplitude compression<br />
Detects critical speaker distortion<br />
Assesses admissible output amplitude<br />
Proves driver stability (DC-offset)<br />
Thermal and mechanical protection<br />
Adjusts voltage at speaker terminals<br />
Detects amplifier gain<br />
This module performs a series of steady-state measurements by using a single- or two-tone<br />
excitation signal varied in frequency and voltage. Two signals may be measured simultaneously (e.g.<br />
current, voltage, displacement, SPL). Due to high quality converters and synchronous data<br />
acquisition the spectral components (fundamental, harmonic and intermodulation distortions, DC<br />
part) can be obtained with high signal to noise ratio up to 48 kHz signal frequency. After performing<br />
the measurement (voltage and frequency sweep) the magnitude of the spectral components are<br />
displayed in a <strong>3D</strong> or 2D plot versus voltage and frequency of the excitation tone.<br />
The <strong>3D</strong> <strong>Distortion</strong> <strong>Measurement</strong> provides features especially valuable for transducer measurements.<br />
By measuring the electrical input signals directly at the terminals of the speaker a given excitation<br />
level can be ensured and the instantaneous voice coil temperature can be monitored. The transducer<br />
may be protected against mechanical and thermal overload by pausing the measurement<br />
automatically if the total harmonic distortion or the increase of the voice coil temperature violates<br />
user defined limits.<br />
The <strong>3D</strong> <strong>Distortion</strong> <strong>Measurement</strong> (<strong>DIS</strong>) uses the same graphical output format and a similar user<br />
interface as the simulation module (SIM) to facilitate comparisons between modeling and reality. The<br />
data measured by this module are the basis for assessing the maximal output amplitude considering<br />
thermal and nonlinear compression effects and the stability of the driver (dynamic DC generation).<br />
Article Number: 1000-800, 1000-810, 1000-811<br />
CONTENTS:<br />
Signal Generation & Acquisition .............................................................................................................. 2<br />
Spectral Analysis ..................................................................................................................................... 4<br />
Protection of the Transducer ................................................................................................................... 4<br />
Results Windows ..................................................................................................................................... 5<br />
Limit Values ............................................................................................................................................. 6<br />
Application ............................................................................................................................................... 7<br />
www.klippel.de<br />
info@klippel.de<br />
updated August 13, 2012<br />
TEL: +49-351-251 35 35<br />
FAX: +49-351-251 34 31
<strong>S4</strong> <strong>3D</strong> <strong>Distortion</strong> <strong>Measurement</strong><br />
Signal Generation & Acquisition<br />
Overview<br />
Signal<br />
Source<br />
Amplifier<br />
Protection<br />
Current<br />
Sensor<br />
Transducer<br />
KLIPPEL R&D SYSTEM page 2<br />
U(t)<br />
I(t)<br />
Data Acquisition<br />
Hardware The <strong>Distortion</strong> Analyzer (DA) is a perfect hardware platform for the software module <strong>3D</strong><br />
<strong>Distortion</strong> <strong>Measurement</strong> (<strong>DIS</strong>). The digital signal processor generates the excitation<br />
signal at the output OUT 1. This signal may be amplified and is linked via the high<br />
power path of the <strong>Distortion</strong> Analyzer to the transducer under test. Voltage and current<br />
sensors measure the amplifier output (at connector AMPLIFIER) and the electrical<br />
signals at the transducer terminals (at connector SPEAKER 1 or SPEAKER 2). At the<br />
beginning of the measurement the transducer is disconnected from the amplifier output<br />
to determine the amplifier gain automatically.<br />
FFT<br />
Laser<br />
Micro<br />
Two external signals may be provided via input IN1 and IN2 from microphones or laser<br />
displacement meter. A high-quality ADC with 24 bit resolution at 96kHz sample rate<br />
converts two signals Y1(t) and Y2(t) selected by the user. An additional ADC is provided<br />
for measuring the electrical signals independently from the routing of Y1 and Y2 for a<br />
maximum of protection of the measurement object.<br />
Stimulus A two tone signal defined by<br />
2ftUsin2 f t<br />
U ( t)<br />
U1<br />
sin 1 2 2<br />
is an optimal excitation signal to measure fundamental, harmonic, difference-tone and<br />
summed-tone intermodulation components. The frequencies f1 and f2 and the voltages<br />
U1 and U2 may be specified by the user explicitly or may be varied automatically to<br />
perform frequency or voltage sweeps.<br />
The duration of the stimulus depends on the sample frequency adjusted by the module<br />
automatically.<br />
Amplifier Gain If the voltage of the stimulus refers to the transducer terminals the gain of the power<br />
amplifier connected between generator output and transducer is determined<br />
automatically at 375, 750 or 2250 Hz without load and the stimulus signal will be<br />
adjusted accordingly. The user will be informed if major variations of the amplifier gain<br />
occur during the measurement.<br />
Frequency<br />
Sweep<br />
The user may choose between measurements performed with a constant frequency f1<br />
or a series of sequential measurements performed for different values of f1. The user<br />
can specify the start value fstart and the end value fend for the frequency f1 as well as<br />
the number of intermediate points spaced linearly or logarithmically.<br />
p(t)<br />
x(t)
Voltage Sweep<br />
<strong>Measurement</strong> of<br />
Harmonics<br />
<strong>Measurement</strong> of<br />
Intermodulations<br />
<strong>Measurement</strong> of<br />
total harmonics<br />
+ noise<br />
Additional<br />
excitation before<br />
measurement<br />
<strong>3D</strong> <strong>Distortion</strong> <strong>Measurement</strong> <strong>S4</strong><br />
The user may choose between measurements performed with constant voltage U1 or a<br />
series of sequential measurements performed for different values of U1 . The user can<br />
specify the start value Ustart and the end value Uend for the voltage U1 as well as the<br />
number of intermediate points spaced linearly or logarithmically. The voltage U2 of the<br />
second tone is coupled to the voltage U1 of the first tone and the user specifies the<br />
ratio U2 /U1.<br />
The user can choose between four measurement modes, i.e.<br />
Harmonics,<br />
Harmonics + Intermodulations (f1),<br />
Harmonics + Intermodulations (f2),<br />
Intermodulations (f1),<br />
THDN<br />
The Harmonics mode is used to measure the harmonic components of tone f1. The<br />
second excitation tone is switched off. This reduces the amplitude of the excitation<br />
signal U(t) and avoids interferences between harmonic and intermodulation<br />
components.<br />
In the Harmonics + Intermodulation (f1) and Harmonics + Intermodulation (f2) modes<br />
summed-tone and difference-tone intermodulation components (centred around f1 and<br />
f2 respectively) are measured additionally to the harmonic components of f1. No<br />
harmonic components are measured if Intermodulations (f1) is selected. There are<br />
three different ways to specify the frequency f2 of the second tone:<br />
f2 = const.<br />
The user specifies the frequency f2 which is held constant during frequency sweep of<br />
f1. This mode allows to generate a very critical stimulus for most transducers. Selecting<br />
f2 < f1, f2 may represent a bass tone producing large voice coil displacement and f1<br />
represents any audio component (voice) in the pass band of the transducer.<br />
f2/f1 = const.<br />
The user specifies the frequency ratio between both excitation tones. Selecting f2 > f1<br />
and using a fractional ratio (e.g. 5.5) this mode avoids interferences between the<br />
harmonic and intermodulation distortion components.<br />
f2-f1 = const.<br />
The user specifies the distance between both excitation frequencies. This mode<br />
produces difference intermodulation at the same frequency independent of f1.<br />
The THDN mode is for measuring the harmonics and the total harmonics + noise. The<br />
measurement is exited by tone f1 . The second excitation tone is switched off. The sample<br />
frequency is hold constant for all sweep points to get comparable measurement conditions.<br />
Prior the measurement of the distortion components the transducer is excited to reach<br />
steady state for each voltage-frequency point . The duration of this pre-excitation is<br />
adjusted automatically. The user may specify an additional pre-excitation time to<br />
investigate the thermal behavior of the transducer and to compensate time delays.<br />
Procedure The measurement consist of an initial part to identify<br />
gain of the power amplifier<br />
amplifier limiting<br />
initial voice coil temperature<br />
and the kernel routine processed periodically for all samples of the voltage and<br />
frequency sweep comprising the following four steps:<br />
Signal Y1<br />
pre-excitation to reach steady-state conditions<br />
additional pre-excitation of user specified duration<br />
acquisition of Signal Y1 and Y2<br />
measurement of voice coil temperature<br />
The first signal Y1 may be selected from the following choices :<br />
Signal at input IN 1 (microphone or external Laser)<br />
Voltage at terminals SPEAKER 1 or SPEAKER 2<br />
KLIPPEL R&D SYSTEM page 3
<strong>S4</strong> <strong>3D</strong> <strong>Distortion</strong> <strong>Measurement</strong><br />
Signal Y2<br />
The second signal Y2 may be selected from the following choices :<br />
Signal at input IN 2 (microphone or external Laser)<br />
Current at terminals SPEAKER 1 or SPEAKER 2<br />
Internal laser displacement signal<br />
Sample Rate The signals Y1 and Y2 are sampled at various rates (6, 12, 24, 48, 96 kHz) adjusted to<br />
the maximal frequency of fundamental or distortion components which are of interest to<br />
the user. In case of a conflict between signal components and maximal Nyquist<br />
frequency suggestions are provided to the user such as to reduce maximal order of<br />
analyzed distortion components or fend. Noise and distortion components of higher<br />
order are attenuated by a low-pass filter to avoid aliasing effects.<br />
Spectral Analysis<br />
FFT The steady-state responses of Y1 and Y2 are subject of a FFT analysis having the<br />
same size as of the stimulus to dispense with additional windowing of the time signal.<br />
This reveals the spectra at maximal resolution without any smearing effects.<br />
Pause During a frequency and voltage sweep the measurement may be paused to view<br />
details of the waveform and the spectrum.<br />
Spectrum<br />
Data<br />
Compression<br />
The fundamental frequencies f1 and f2 are represented by distinct colors to facilitate<br />
the identification of the distortion components.<br />
IN1 [V]<br />
10-1<br />
10-2<br />
10-3<br />
10-4<br />
KLIPPEL R&D SYSTEM page 4<br />
KLIPPEL<br />
0 500 1000 1500 2000 2500<br />
Frequency [Hz]<br />
3000 3500 4000 4500 5000<br />
In the example above the harmonics of the lower frequency tone f2 may be easily distinguished from the<br />
intermodulation components centered around the higher tone f1.<br />
The magnitudes and phases of spectral components that are of particular interest such<br />
as fundamental, DC-component and the harmonic and intermodulation components<br />
up to the specified order n are stored in the database and are may be listed.<br />
Protection of the Transducer<br />
Principle Performing measurements at high voltages may damage the transducer. Permanent<br />
monitoring of the electrical signals at the terminals and the measurement of a<br />
mechanical state variable (displacement) or acoustical output (sound pressure) is the<br />
basis for protecting the transducer against thermal and mechanical overload. The<br />
protection system may be activated by the user by defining limit values (increase of<br />
voice coil temperature, total harmonic distortion). If one of the monitored variables<br />
exceeds the allowed limits the measurement will be interrupted automatically. The user<br />
may activate an voltage sweep with sufficiently fine steps starting at low voltages to<br />
detect an overload situation in time.<br />
Voice Coil<br />
Temperature<br />
Harmonic<br />
<strong>Distortion</strong><br />
The increase of the voice coil temperature during a measurement is the criterion for<br />
the thermal protection. Before staring the voltage-frequency measurement sweep the<br />
voice coil resistance is determined and stored as a reference value. During the sweep<br />
the voice coil resistance is measured after each step. The voice coil temperature is<br />
calculated from the increase of voice coil resistance and stored in the database.<br />
The total harmonic distortion in the analyzed signals Y1 and Y2 is the criterion for<br />
detecting the mechanical load.
Results Windows<br />
Signals (only displayed during measurement)<br />
Signal Y1 vs. time<br />
Signal Y2 vs. time<br />
Spectrum of signal Y1<br />
Spectrum of signal Y2<br />
Spectral Components of Y1 or Y2<br />
<strong>3D</strong> <strong>Distortion</strong> <strong>Measurement</strong> <strong>S4</strong><br />
DC component vs. frequency f1 and voltage U1 of excitation<br />
Fundamental component vs. frequency f1 and voltage U1 of excitation<br />
nth-order harmonic distortion component vs. frequency f1 and voltage U1 of excitation<br />
nth-order summed frequency modulation distortion component vs. frequency f1 and voltage U1 of excitation<br />
nth-order difference frequency modulation distortion component vs. frequency f1 and voltage U1 of excitation<br />
Compression ( = Fundamental Ustart / U1) vs. frequency f1 of excitation<br />
<strong>Distortion</strong> (IEC 60268) of Y1 or Y2<br />
Relative total harmonic distortion vs. frequency f1 and voltage U1 of excitation<br />
Relative second-order harmonic distortion in vs. frequency f1 and voltage U1 of excitation<br />
Relative third-order harmonic distortion vs. frequency f1 and voltage U1 of excitation<br />
Relative second-order modulation distortion vs. frequency f1 and voltage U1 of excitation<br />
Relative third-order modulation distortion vs. frequency f1 and voltage U1 of excitation<br />
Relative total harmonic distortion + noise vs. frequency f1 and voltage U1 of excitation<br />
Additional <strong>Distortion</strong> Measures available in <strong>DIS</strong> Pro (1000-810)<br />
Weighted harmonic distortion (Hi-2, Blat) distortion<br />
Amplitude modulation distortion (called IMD in automotive applications) given as RMS, top and bottom value<br />
Summaries<br />
Peak values, headroom, RMS-value of AC-part<br />
Graphical Representation<br />
Example: Total harmonic distortion (THD) in the radiated sound pressure.<br />
<strong>3D</strong>-Graphic Performing a measurement with voltage and frequency sweep the magnitude of the<br />
spectral and distortion components may be displayed in a <strong>3D</strong>-plot versus frequency f1<br />
and voltage U1 of the first excitation tone. Viewing the plot from different perspectives<br />
is convenient for interpreting the data. An additional contour plot may be activated.<br />
197.0<br />
Percent<br />
75<br />
50<br />
25<br />
0<br />
250<br />
500<br />
Frequency [Hz]<br />
KLIPPEL R&D SYSTEM page 5<br />
750<br />
7.5<br />
5.0<br />
1000<br />
2.5<br />
U [V]
<strong>S4</strong> <strong>3D</strong> <strong>Distortion</strong> <strong>Measurement</strong><br />
2D-Graphic<br />
(versus U)<br />
2D-Graphic<br />
(versus f)<br />
Limit Values<br />
Spectral Analysis<br />
Percent<br />
Percent<br />
<strong>Measurement</strong>s performed with a voltage sweep may be displayed as a 2D-plot of<br />
output variables versus voltage U1 of the first excitation tone. This representation<br />
shows the nonlinear relationship between input and output amplitude (compression<br />
and expansion). Performing a measurement with a frequency sweep additional curves<br />
represent the individual frequencies f1.<br />
80<br />
70<br />
60<br />
50<br />
40<br />
30<br />
20<br />
10<br />
0<br />
F = 20.508 F = 999.02<br />
KLIPPEL R&D SYSTEM page 6<br />
KLIPPEL<br />
1 2 3 4 5<br />
U [V]<br />
6 7 8 9<br />
<strong>Measurement</strong>s performed with an frequency sweep may be displayed as a 2D-plot of<br />
output variables versus frequency f1 of the first excitation tone (frequency response).<br />
Variations of the voltage U1 of the first excitation tone are represented as additional<br />
curves. The scaling of the y-axis is chosen by default according to the spacing of the<br />
voltage sweep samples (linear or logarithmic). In this representation the frequency<br />
responses of a linear system measured at different voltages will always appear as<br />
multiple equally spaced. Compression and expansion of the amplitude transfer function<br />
due to thermal and nonlinear mechanisms can so easily be detected.<br />
80<br />
70<br />
60<br />
50<br />
40<br />
30<br />
20<br />
10<br />
0<br />
U = 1 U = 3 U = 5 U = 7 U = 9<br />
KLIPPEL<br />
4*101 6*101 8*101 102 2*102 4*102 6*102 8*102 Frequency [Hz]<br />
Symbol Min Typ Max Unit<br />
stimulus length 64 8192 samples<br />
sample frequency fs 6 3*2 i<br />
i=1,..,5<br />
96 kHz<br />
resolution f 0.73 Hz<br />
order of distortion analysis n 2 4 16<br />
Excitation tone<br />
frequency of first tone<br />
frequency of second tone<br />
f1 0.73 48000/n Hz<br />
constant frequency f2 0.73<br />
1)<br />
Hz<br />
constant difference f1 – f2 = d 0.73<br />
2)<br />
Hz<br />
constant ratio f1 / f2 = r<br />
3)<br />
5.5<br />
3)<br />
voltage first tone at SPEAKER 1 4)<br />
U1 0 300 V<br />
voltage first tone at OUT1 4)<br />
U1 0 3 V<br />
voltage ratio between tones U2 /U1 -1000 0 20 dB
Frequency sweep<br />
<strong>3D</strong> <strong>Distortion</strong> <strong>Measurement</strong> <strong>S4</strong><br />
lg(300V/U1)<br />
points 1 500<br />
start value of frequency sweep f1 fstart 0.73 fend Hz<br />
final value of frequency sweep f1 fend fstart 48000/n Hz<br />
Voltage sweep<br />
points 1 50<br />
start value of voltage sweep U1 at<br />
SPEAKER connector 1)<br />
Ustart 0 Uend V<br />
final value of voltage sweep U1 at<br />
SPEAKER connector 1)<br />
Uend Ustart 300 V<br />
start value of voltage sweep U1 at OUT 1 1)<br />
Ustart 0 Uend V<br />
final value of voltage sweep U1 at OUT 1 1)<br />
Uend Ustart 3 V<br />
Duration of additional excitation before<br />
measurement<br />
multiples of tmeas tmeas tmeas 131072 s<br />
1)<br />
f1+ (n-1) f2 < 48 kHz<br />
2)<br />
f1+ (n-1) (f1–d) < 48 kHz<br />
3)<br />
f1+ (n-1) (f1/r) < 48 kHz<br />
4)<br />
@ U2 /U1 = 1<br />
Application<br />
Maximal Output<br />
Intermodulation<br />
<strong>Distortion</strong><br />
In the large signal domain there is no linear relationship between input and output<br />
amplitude. Thermal and nonlinear mechanisms limit the maximal output of the driver.<br />
This module allows assessing the maximal displacement and maximal SPL for<br />
admissible distortion values.<br />
142.0<br />
U [V]<br />
7.5<br />
5.0<br />
2.5<br />
KLIPPEL R&D SYSTEM page 7<br />
250<br />
500<br />
Frequency [Hz]<br />
Nonlinearities of the speaker generate additional spectral components in the output<br />
signal. The measurement of harmonic distortion is not sufficient to describe the large<br />
signal behavior adequately. A fixed tone at resonance frequency fs (representing a<br />
bass) and a second tone f1 varied over the audio band (representing a voice)<br />
produce audible summed-tone and difference-tone intermodulation in the pass band.<br />
By examining intermodulation components the dominant sources of distortion<br />
(suspension, motor, radiation) can be revealed.<br />
2<br />
1<br />
0<br />
dB<br />
-1<br />
-2<br />
-3<br />
Amplitude modulation distortion<br />
(AMD)<br />
M top Mean Value M bottom<br />
Limits<br />
750<br />
110<br />
100<br />
90<br />
80<br />
70<br />
1000<br />
KLIPPEL<br />
4*10 2 6*10 2 8*10 2 103 2*103<br />
Frequency f1 [Hz]<br />
4*10 3 6*103 8*103<br />
Stability A driver with asymmetrical nonlinearities rectifies an AC-input and will generate a<br />
IN1 [dB] 0dB=1.41e-006 V
<strong>S4</strong> <strong>3D</strong> <strong>Distortion</strong> <strong>Measurement</strong><br />
Compression,<br />
Expansion<br />
Voice Coil<br />
Temperature<br />
X [mm]<br />
DC-component in the displacement dynamically. In some cases the driver might<br />
become instable causing excessive distortion and reducing the output of the driver.<br />
<strong>Measurement</strong>s of the DC-component are required to show the stability of the driver<br />
at high amplitudes.<br />
1,5<br />
1,0<br />
0,5<br />
-0,0<br />
-0,5<br />
-1,0<br />
-1,5<br />
U = 1 U = 3 U = 5 U = 7 U = 9<br />
KLIPPEL<br />
4*101 6*101 8*101 102 2*102 4*102 6*102 8*102 Frequency [Hz]<br />
The diagram shows the response of a driver with a coil offset causing an asymmetry in<br />
the Bl(x)-curve. At frequencies below the resonance ( < 80 Hz) the coil will shifted<br />
dynamically to 1.4 mm which is the maximum of the Bl(x)-curve (self-centering<br />
capability). However, at 150 Hz the DC-displacement rises rapidly showing an<br />
instability of the motor (coil jump out effect).<br />
K<br />
The amplitude of the nonlinear distortion depend very much on the amplitude of the<br />
stimulus. For example the picture below shows the amplitude of the 2 nd -order<br />
harmonic distortion of a woofer with measured between 20-200 Hz at 5 amplitudes<br />
increased linearly. At 40 Hz the distortion increase but at 75 Hz the distortion<br />
decrease with the amplitude of the stimulus. At 150 Hz the distortion converge to a<br />
constant value. Thus the "natural" compression or expansion effects have to be<br />
considered in the interpretation of the nonlinear distortion measurements.<br />
25<br />
20<br />
%<br />
15<br />
10<br />
5<br />
3.71 V 4.79 V 5.86 V 6.93 V 8.00 V<br />
4*10 1 6*10 1 8*10 1 10 2<br />
Frequency f1 [Hz]<br />
KLIPPEL R&D SYSTEM page 8<br />
KLIPPEL<br />
The heating of the voice coil will reduce the acoustical output (thermal power<br />
compression) and may damage the speaker. Monitoring of the voice coil temperature<br />
is the basis for predicting the instantaneous or final voice coil temperature if the coil<br />
and/or magnet is in thermal equilibrium. In order to investigate the heating up of the<br />
voice coil and its impact on the speaker performance in detail the user can specify an<br />
additional pre-excitation that is performed before the main measurement is started.<br />
80<br />
70<br />
60<br />
50<br />
40<br />
30<br />
20<br />
10<br />
Increase of voice coil temperature Delta Tv<br />
U = 4 U = 6 U = 8 U = 10<br />
KLIPPEL<br />
102 103<br />
Frequency [Hz]<br />
Find explanations for symbols at http://www.klippel.de/know-how/literature.html<br />
<strong>Klippel</strong> <strong>GmbH</strong><br />
Mendelssohnallee 30<br />
01309 Dresden, Germany<br />
www.klippel.de<br />
info@klippel.de<br />
updated August 13, 2012<br />
TEL: +49-351-251 35 35<br />
FAX: +49-351-251 34 31