Evolutionary analysis of circumsporozoite surface ... - Bioinformation
Evolutionary analysis of circumsporozoite surface ... - Bioinformation
Evolutionary analysis of circumsporozoite surface ... - Bioinformation

Create successful ePaper yourself
Turn your PDF publications into a flip-book with our unique Google optimized e-Paper software.
open access www.bioinformation.net Hypothesis<br />
Volume 6(8)<br />
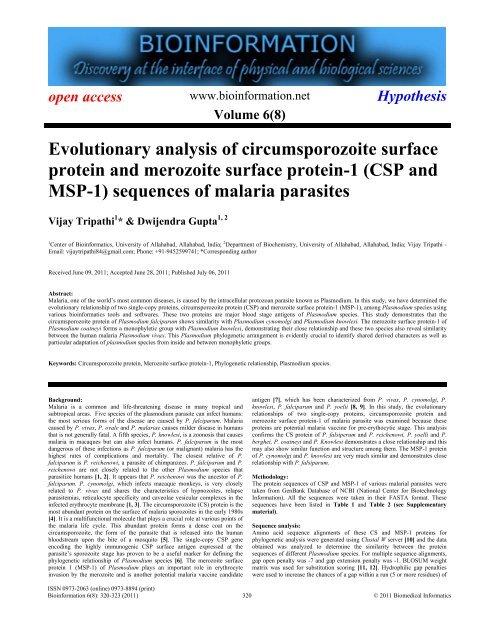
<strong>Evolutionary</strong> <strong>analysis</strong> <strong>of</strong> <strong>circumsporozoite</strong> <strong>surface</strong><br />
protein and merozoite <strong>surface</strong> protein-1 (CSP and<br />
MSP-1) sequences <strong>of</strong> malaria parasites<br />
Vijay Tripathi 1 1, 2<br />
* & Dwijendra Gupta<br />
1 Center <strong>of</strong> Bioinformatics, University <strong>of</strong> Allahabad, Allahabad, India; 2 Department <strong>of</strong> Biochemistry, University <strong>of</strong> Allahabad, Allahabad, India; Vijay Tripathi -<br />
Email: vijaytripathi84@gmail.com; Phone: +91-9452599741; *Corresponding author<br />
Received June 09, 2011; Accepted June 28, 2011; Published July 06, 2011<br />
Abstract:<br />
Malaria, one <strong>of</strong> the world’s most common diseases, is caused by the intracellular protozoan parasite known as Plasmodium. In this study, we have determined the<br />
evolutionary relationship <strong>of</strong> two single-copy proteins, <strong>circumsporozoite</strong> protein (CSP) and merozoite <strong>surface</strong> protein-1 (MSP-1), among Plasmodium species using<br />
various bioinformatics tools and s<strong>of</strong>twares. These two proteins are major blood stage antigens <strong>of</strong> Plasmodium species. This study demonstrates that the<br />
<strong>circumsporozoite</strong> protein <strong>of</strong> Plasmodium falciparum shows similarity with Plasmodium cynomolgi and Plasmodium knowlesi. The merozoite <strong>surface</strong> protein-1 <strong>of</strong><br />
Plasmodium coatneyi forms a monophyletic group with Plasmodium knowlesi, demonstrating their close relationship and these two species also reveal similarity<br />
between the human malaria Plasmodium vivax. This Plasmodium phylogenetic arrangement is evidently crucial to identify shared derived characters as well as<br />
particular adaptation <strong>of</strong> plasmodium species from inside and between monophyletic groups.<br />
Keywords: Circumsporozoite protein, Merozoite <strong>surface</strong> protein-1, Phylogenetic relationship, Plasmodium species.<br />
Background:<br />
Malaria is a common and life-threatening disease in many tropical and<br />
subtropical areas. Five species <strong>of</strong> the plasmodium parasite can infect humans:<br />
the most serious forms <strong>of</strong> the disease are caused by P. falciparum. Malaria<br />
caused by P. vivax, P. ovale and P. malariae causes milder disease in humans<br />
that is not generally fatal. A fifth species, P. knowlesi, is a zoonosis that causes<br />
malaria in macaques but can also infect humans. P. falciparum is the most<br />
dangerous <strong>of</strong> these infections as P. falciparum (or malignant) malaria has the<br />
highest rates <strong>of</strong> complications and mortality. The closest relative <strong>of</strong> P.<br />
falciparum is P. reichenowi, a parasite <strong>of</strong> chimpanzees. P. falciparum and P.<br />
reichenowi are not closely related to the other Plasmodium species that<br />
parasitize humans [1, 2]. It appears that P. reichenowi was the ancestor <strong>of</strong> P.<br />
falciparum. P. cynomolgi, which infects macaque monkeys, is very closely<br />
related to P. vivax and shares the characteristics <strong>of</strong> hypnozoites, relapse<br />
parasitemias, reticulocyte specificity and caveolae vesicular complexes in the<br />
infected erythrocyte membrane [1, 3]. The <strong>circumsporozoite</strong> (CS) protein is the<br />
most abundant protein on the <strong>surface</strong> <strong>of</strong> malaria sporozoites in the early 1980s<br />
[4]. It is a multifunctional molecule that plays a crucial role at various points <strong>of</strong><br />
the malaria life cycle. This abundant protein forms a dense coat on the<br />
<strong>circumsporozoite</strong>, the form <strong>of</strong> the parasite that is released into the human<br />
bloodstream upon the bite <strong>of</strong> a mosquito [5]. The single-copy CSP gene<br />
encoding the highly immunogenic CSP <strong>surface</strong> antigen expressed at the<br />
parasite’s sporozoite stage has proven to be a useful marker for defining the<br />
phylogenetic relationship <strong>of</strong> Plasmodium species [6]. The merozoite <strong>surface</strong><br />
protein 1 (MSP-1) <strong>of</strong> Plasmodium plays an important role in erythrocyte<br />
invasion by the merozoite and is another potential malaria vaccine candidate<br />
antigen [7], which has been characterized from P. vivax, P. cynomolgi, P.<br />
knowlesi, P. falciparum and P. yoelii [8, 9]. In this study, the evolutionary<br />
relationships <strong>of</strong> two single-copy proteins, <strong>circumsporozoite</strong> protein and<br />
merozoite <strong>surface</strong> protein-1 <strong>of</strong> malaria parasite was examined because these<br />
proteins are potential malaria vaccine for pre-erythocytic stage. This <strong>analysis</strong><br />
confirms the CS protein <strong>of</strong> P. falsiperum and P. reichenowi, P. yoelli and P.<br />
berghei, P. coatneyi and P. Knowlesi demonstrates a close relationship and this<br />
may also show similar function and structure among them. The MSP-1 protein<br />
<strong>of</strong> P. cynomolgi and P. knowlesi are very much similar and demonstrates close<br />
relationship with P. falsiparum.<br />
Methodology:<br />
The protein sequences <strong>of</strong> CSP and MSP-1 <strong>of</strong> various malarial parasites were<br />
taken from GenBank Database <strong>of</strong> NCBI (National Center for Biotechnology<br />
Information). All the sequences were taken in their FASTA format. These<br />
sequences have been listed in Table 1 and Table 2 (see Supplementary<br />
material).<br />
Sequence <strong>analysis</strong>:<br />
Amino acid sequence alignments <strong>of</strong> these CS and MSP-1 proteins for<br />
phylogenetic <strong>analysis</strong> were generated using Clustal W server [10] and the data<br />
obtained was analyzed to determine the similarity between the protein<br />
sequences <strong>of</strong> different Plasmodium species. For multiple sequence alignments,<br />
gap open penalty was -7 and gap extension penalty was -1. BLOSUM weight<br />
matrix was used for substitution scoring [11, 12]. Hydrophilic gap penalties<br />
were used to increase the chances <strong>of</strong> a gap within a run (5 or more residues) <strong>of</strong><br />
ISSN 0973-2063 (online) 0973-8894 (print)<br />
<strong>Bioinformation</strong> 6(8): 320-323 (2011) 320 © 2011 Biomedical Informatics
BIOINFORMATION<br />
hydrophilic amino acids; these are likely to be loop or random coil regions<br />
where gaps are more common. BioEdit 7.0.2 [13] was also used to perform the<br />
protein sequence alignment to determine the number <strong>of</strong> conserved sites,<br />
parsimony info sites, variable sites and singleton sites.<br />
Determination <strong>of</strong> the Entropy and hydrophobicity:<br />
BioEdit 7.0.2 was used to determine the entropy plot and hydrophobicity<br />
values <strong>of</strong> CS and MSP-1 proteins. From information theory, Entropy can be<br />
defined as a measure <strong>of</strong> the unpredictable nature <strong>of</strong> a set <strong>of</strong> possible elements.<br />
The higher level <strong>of</strong> variation within the set, higher the entropy. Entropy is then<br />
calculated as given in supplementary material. The information content <strong>of</strong> a<br />
position l, then, is defined as a decrease in uncertainty or entropy at that<br />
position. As an alignment improves in quality, the entropy at each position<br />
(especially conserved regions) should decrease. This gives a measure <strong>of</strong><br />
uncertainty at each position relative to other positions. Maximum total<br />
uncertainty will be defined by the maximum number <strong>of</strong> different characters<br />
found in a column. The mean hydrophobicity value was plotted for the middle<br />
residue <strong>of</strong> the window. Eisenberg method [14] and Kyte Doolittle method [15]<br />
were used to plot hydrophobic moment pr<strong>of</strong>ile with a window size <strong>of</strong> 13<br />
residues having six residues on either side <strong>of</strong> the current residue and rotation<br />
angle, θ =100 degrees. (see Supplementary material)<br />
Phylogenetic Analysis:<br />
Phylogenetic and molecular evolutionary <strong>analysis</strong> was conducted using MEGA<br />
version 4.0 [16]. The multiple alignments <strong>of</strong> sequences <strong>of</strong> CS and MSP-1<br />
proteins were used to create phylogenetic trees. The evolutionary history was<br />
inferred using the Neighbour-Joining method [17]. All the characters were<br />
given equal weights. The bootstrap consensus tree inferred from 10000<br />
replicates was taken to represent the evolutionary history <strong>of</strong> the taxa analyzed<br />
[18]. Branches corresponding to partitions reproduced in less than 50%<br />
bootstrap replicates were collapsed. The percentage <strong>of</strong> replicate trees in which<br />
the associated taxa clustered together in the bootstrap test (1000 replicates) is<br />
shown next to the branches. The tree is drawn to scale, with branch lengths in<br />
the same units as those <strong>of</strong> the evolutionary distances used to infer the<br />
phylogenetic tree. The evolutionary distances were computed using the poisson<br />
correction method and are in the units <strong>of</strong> the number <strong>of</strong> amino acid<br />
substitutions per site. All positions containing gaps and missing data were<br />
eliminated from the dataset (Complete deletion option). Phylogenetic <strong>analysis</strong><br />
was conducted in MEGA4.<br />
Figure 1: Entropy plot (CS protein). X-axis shows the positions <strong>of</strong> residues in<br />
MSA pr<strong>of</strong>ile and the Y-axis shows entropy scores for individual positions in<br />
MSA pr<strong>of</strong>ile. In this plot conserved regions in the pr<strong>of</strong>ile are to be found from<br />
220-260, 287-320 and 387-400 amino acid positions.<br />
Figure 2: Entropy plot (MSP 1 protein). X-axis shows the positions <strong>of</strong> MSA<br />
and the Y-axis shows entropy scores for individual positions in MSA. In this<br />
plot conserved regions in the pr<strong>of</strong>ile are to be found from 90-100, 130-190,<br />
240-260 and 360-380 amino acid positions.<br />
open access<br />
Results and Discussion:<br />
Multiple Sequence Alignment: In the case <strong>of</strong> CS protein, the protein resulted<br />
into 446 positions out <strong>of</strong> which 297 are parsimony informative, 378 are<br />
variable sites, and conserved sites were 36 and 71 singleton sites. The most<br />
frequent amino acid <strong>of</strong> these sequences are Aparagine, Alanine, Glycine,<br />
Proline, Aspartic acid, Lysine, Glutamine and its composition observed 15.46,<br />
13.34, 11.19, 10.07, 6.37, 5.79, 5.28 respectively. MSA <strong>of</strong> MSP-1 protein<br />
resulted into 465 positions out <strong>of</strong> which 25 are parsimony informative, 383 are<br />
variable sites, and conserved sites were 20 and 291 singleton sites. By<br />
statistical <strong>analysis</strong> <strong>of</strong> multiple aligned sequences it is observed that Lysin,<br />
Glutamic acid, Lucine, Serine, Asparagine, Alanine, Isolucine, Glutamine,<br />
Aspartic acid are the most frequently present amino acids with frequency<br />
percentage <strong>of</strong> 11.04, 9.76, 8.89, 7.21, 6.73, 6.26, 6.06, 5.86, 5.05 respectively.<br />
Conserved Domain Search:<br />
A conserved domain region search in CS protein from amino acid 220-260,<br />
287-320, 387-400 region and we have found four conserved regions from<br />
amino acid positions 90-100, 130-190, 240-260, 360-380 in MSP-1 protein<br />
sequences. This conservation has already been upheld by minimal entropy<br />
shown by respective positions <strong>of</strong> the previous half <strong>of</strong> the MSA results.<br />
Entropy Plot <strong>of</strong> CS proteins and MSP-1 Proteins:<br />
An entropy plot, measure <strong>of</strong> the lack <strong>of</strong> the information content and the amount<br />
<strong>of</strong> variability, was generated for all the aligned positions. The plot shows that<br />
entropy rarely touches a scale <strong>of</strong> 1, showing minimal entropy at several<br />
positions subjected to previous half <strong>of</strong> the protein sequences, which is a sign <strong>of</strong><br />
higher similarities in the region. The lower entropy value implies that the<br />
randomness <strong>of</strong> these amino acid residues in that particular column <strong>of</strong> MSA<br />
pr<strong>of</strong>ile is less and hence those are the most conserved region. These results<br />
have already been upheld by finding conserved regions. According to entropy<br />
plot the conserved region in CS proteins (Figure 1) to be found from 220-260,<br />
287-320 and 387-400 amino acid positions and in MSP-1 proteins (Figure 2)<br />
the conserved regions belongs from these regions: 90-100, 130-190, 240-260,<br />
360-380 because entropy values <strong>of</strong> these amino acids are less than 1.<br />
Figure 3: Hydrophobicity plot (CS protein). X-axis demonstrates the positions<br />
<strong>of</strong> MSA pr<strong>of</strong>ile and the Y-axis shows hydrophobicity scores for individual<br />
positions in MSA pr<strong>of</strong>ile. In this plot conserved regions in the pr<strong>of</strong>ile are to be<br />
found from 135-200, 220-260, 360-400 and 420-435 amino acid positions.<br />
Figure 4: Hydrophobicity plot (MSP 1 protein). X-axis demonstrates the<br />
positions <strong>of</strong> MSA pr<strong>of</strong>ile and the Y-axis shows hydrophobicity scores for<br />
individual positions in MSA pr<strong>of</strong>ile. In this plot conserved regions in the<br />
pr<strong>of</strong>ile are to be found from 165-185, 240-290, 330-390 and 425-450 amino<br />
acid positions.<br />
Hydrophobicity pr<strong>of</strong>ile <strong>of</strong> CS proteins and MSP-1 proteins:<br />
A hydrophobicity pr<strong>of</strong>ile plot shows that mean hydrophobicity <strong>of</strong> the protein<br />
for most <strong>of</strong> the positions in all the species is below zero; occasionally it turns to<br />
be positive. From the pr<strong>of</strong>ile it is clear that the regions related to conserved<br />
positions also have a characteristic <strong>of</strong> possessing residues in a balanced way<br />
and the pr<strong>of</strong>ile is always around zero value. However, the amino acid regions<br />
from 135-200, 220-260, 360-400, 420-435 in CS proteins and 165-185, 240-<br />
290, 330-390, 425-450 amino acid regions in MSP-1 proteins have lower<br />
hydrophobicity, subjected to more conserved part <strong>of</strong> the protein (Figure 3, 4).<br />
ISSN 0973-2063 (online) 0973-8894 (print)<br />
<strong>Bioinformation</strong> 6(8): 320-323 (2011) 321 © 2011 Biomedical Informatics
BIOINFORMATION<br />
Figure 5: Phylogenetic tree <strong>of</strong> CS Protein.<br />
Figure 6: Phylogenetic tree <strong>of</strong> MSP-1 Protein.<br />
Phylogenetic Analysis <strong>of</strong> CS proteins and MSP-1 proteins:<br />
The phylogenetic trees were constructed by using Neighbour–joining method.<br />
In the case <strong>of</strong> CS proteins the tree is divided into three different clades (Figure<br />
5). In the first clade, P. falsiperum shows very much similarity with P.<br />
reichenowi and the bootstrap percentage <strong>of</strong> this similarity is 100. P. yoelli<br />
shows similarity with P. berghei in a second clade <strong>of</strong> this tree with 100 boot<br />
strap percentage. But in the third clade P. coatneyi shows very close<br />
relationship between P. knowlesi with 100 boot strap percentage and these two<br />
malaria parasites show similarity with P. vivax and the boot strap percentage <strong>of</strong><br />
this similarity is 100. Esmeralda Vargas-Serrato et al. [19] study also shows<br />
that these two species (P. coatneyi and P. Knowlesi) are very much similar.<br />
The phylogenetic tree <strong>of</strong> MSP-1 proteins (Figure 6) demonstrates that P.<br />
cynomolgi is highly similar with P. knowlesi and the boot strap percentage <strong>of</strong><br />
this similarity is 83. These two malarial parasites show similarity with P.<br />
falsiparum with boot strap percentage <strong>of</strong> 99. P. yoelli appears with a totally<br />
diverged branch from the main tree. The CS and MSP-1 proteins derived<br />
open access<br />
phylogenetic trees reveal different topologies, conclusively showing that P.<br />
coatneyi and P. knowlesi are evolutionarily closely related and these two<br />
malaria parasites show similarity with P. vivax but in case <strong>of</strong> MSP 1 the P.<br />
cynomolgi is highly similar with P. knowlesi and the boot strap percentage <strong>of</strong><br />
this similarity is 83. P. falsiparum shows very much similarity with these two<br />
malarial parasites.<br />
Conclusion:<br />
This study presents a comparative proteomics study and evolutionary <strong>analysis</strong><br />
<strong>of</strong> the CS and MSP-1 proteins based on molecular phylogeny across different<br />
species <strong>of</strong> malaria parasite. According to this study we have concluded that CS<br />
protein <strong>of</strong> P. coatneyi and P. knowlesis demonstrate a close relationship with P.<br />
vivax and thus it may also show similarity in their structure and function. The<br />
MSP-1 protein <strong>of</strong> P. cynomolgi and P. knowlesi is very much similar and<br />
demonstrate close relationship with P. falsiparum.<br />
References:<br />
[1] Coatneyi RS et al. Plasmodium coatneyi. In: The Primate Malarias. US<br />
Government Printing Office, Washington, DC. 1971, 289–299<br />
[2] Escalante AA et al. Proc Natl Acad Sci U S A. 1998 95: 8124 [PMID:<br />
9653151]<br />
[3] Barmwell JW & Galinski MR. Ann Trop Med Parasitol. 1995 89: 113<br />
[PMID: 7605120]<br />
[4] Nussenzweig V & Nussenzweig RS. Cell 1985 42: 401 [PMID: 2411417]<br />
[5] Good MF. Trends Parasitol. 2005 21: 29 [PMID: 15639738]<br />
[6] McCutchan TF et al. Proc Natl Acad Sci U S A. 1996 93: 11889 [PMID:<br />
8876233]<br />
[7] Ferreira MU et al. Gene 2003 304: 65 [PMID: 12568716]<br />
[8] Barnwell JW et al. Exp Parasitol. 1999 91: 238 [PMID: 10072326]<br />
[9] Vargas-Serrato E et al. Mol Biochem Parasitol. 2002 120: 41 [PMID:<br />
11849704]<br />
[10] Thompson JD et al. Nucleic Acids Res. 1994 22: 4673 [PMID: 7984417]<br />
[11] Altschul SF & Gish W. Methods Enzymol. 1996 266: 460 [PMID:<br />
8743700]<br />
[12] Henik<strong>of</strong>f S & Henik<strong>of</strong>f JG. Proc Natl Acad Sci U S A. 1992 89: 10915<br />
[PMID: 1438297]<br />
[13] Hall TA. Nucleic Acids Symposium Series 1999 41: 95<br />
[14] Eisenberg D et al. J Mol Biol. 1984 179: 125 [PMID: 6502707]<br />
[15] Kyte J & Doolittle RF. Journal <strong>of</strong> Molecular Biology 1982 157: 105<br />
[PMID: 7108955]<br />
[16] Tamura K et al. Mol Biol Evol. 2007 24: 1596 [PMID: 17488738]<br />
[17] Saitou N & Nei M. Mol Biol Evol. 1987 4: 406 [PMID: 3447015]<br />
[18] Felsenstein J. Evolution 1985 39: 783<br />
[19] Vargas-Serrato E et al. Infection Genetics and Evolution 2003 3: 67<br />
Edited by P Kangueane<br />
Citation: Tripathi et al. <strong>Bioinformation</strong> 6(8): 320-323 (2011)<br />
License statement: This is an open-access article, which permits unrestricted use, distribution, and reproduction in any medium, for non-commercial purposes,<br />
provided the original author and source are credited.<br />
ISSN 0973-2063 (online) 0973-8894 (print)<br />
<strong>Bioinformation</strong> 6(8): 320-323 (2011) 322 © 2011 Biomedical Informatics
BIOINFORMATION<br />
Supplementary material:<br />
open access<br />
Entropy:<br />
H (I) = -Σf(b,l)ln(f(b,l)),<br />
where H(I) = the uncertainty, also called entropy at position s l, b represents a residue (out <strong>of</strong> the allowed choices for the sequence in question), and f(b, l) is the<br />
frequency at which residue b is found at position l.<br />
μH= {[Hn sin(δn)]^2+[Hn cos(δn)]^2}<br />
Where μH is the hydrophobic moment, Hn is the hydrophobicity score <strong>of</strong> the residue H at position n, δ=100 degrees, n is position within the segment, and each<br />
hydrophobic moment is summed over a segment <strong>of</strong> the same defined window length.<br />
Table 1: Protein sequences <strong>of</strong> CS protein used for comparative genomics and evolutionary studies<br />
Name <strong>of</strong> Species Accession No. Length<br />
Plasmodium coatneyi AAN16518.1 341<br />
Plasmodium falciparum AAN87612.1 408<br />
Plasmodium vivax ABJ53009.1 281<br />
Plasmodium knowlesi ABG29610.2 364<br />
Plasmodium malariae AAA29557.1 429<br />
Plasmodium reichenowi AAA29561.1 388<br />
Plasmodium yoelii AAA29558.1 367<br />
Plasmodium berghei AAA29541.1 332<br />
Plasmodium gallinaceum AAC47344.1 388<br />
Table 2: Protein sequences <strong>of</strong> MSP-1 protein used for comparative genomics and evolutionary studies<br />
Name <strong>of</strong> Species Accession No. Length<br />
Plasmodium cynomolgi AAW65096.1 380<br />
Plasmodium yoelii AAA66185.1 462<br />
Plasmodium falciparum ABF18819.1 116<br />
Plasmodium vivax ABJ53051.1 200<br />
Plasmodium knowlesi CAA62966.1 327<br />
ISSN 0973-2063 (online) 0973-8894 (print)<br />
<strong>Bioinformation</strong> 6(8): 320-323 (2011) 323 © 2011 Biomedical Informatics