- Page 1 and 2:
Investigating the role of the JAK/S
- Page 3 and 4:
Abstract The signal transducer and
- Page 5 and 6:
Acknowledgements First and foremost
- Page 7 and 8:
Table of Contents Abstract 3 Dedica
- Page 9 and 10:
2.4.3 Hypoxia/Reoxygenation of Neon
- Page 11 and 12:
Chapter 6: Regulation of the MAPK P
- Page 13 and 14:
Figure 3.11 - STAT3 mRNA expression
- Page 15 and 16:
Figure 6.6 - Prolonged MAPK activit
- Page 17 and 18:
Abbreviations 7-AAD 7-amino-actinom
- Page 19 and 20:
SOCS Supressor of cytokine signalli
- Page 21 and 22:
1.1 Myocardial Infarction Coronary
- Page 23 and 24:
Reperfusion induced arrhythmias are
- Page 25 and 26:
eceptors such as Fas or TNFR1; thes
- Page 27 and 28:
1.2.3 Bcl-2 Proteins The intrinsic
- Page 29 and 30:
addition to caspase inhibition. XIA
- Page 31 and 32:
staurosporine induced cell death. L
- Page 33 and 34:
stress thus occurs when excess ROS
- Page 35 and 36:
1.3 The JAK/STAT Pathway 1.3.1 JAK/
- Page 37 and 38:
Receptor SOCS3 Cytokines/Growth Fac
- Page 39 and 40:
Dimerization of STATs appears to be
- Page 41 and 42:
Fig 1.7. STAT import/export cycle.
- Page 43 and 44:
Kinase Stimulus Cell Type Reference
- Page 45 and 46:
domain determines other target sele
- Page 47 and 48:
1.3.8 Inhibition of STAT DNA Bindin
- Page 49 and 50:
(BRM/SWI2-related gene 1) the ATPas
- Page 51 and 52:
deficient mammary glands (Abell et
- Page 53 and 54:
and COX-2 induction. Adenoviral med
- Page 55 and 56:
compensatory hypertrophy, mediated
- Page 57 and 58:
1.5.3 Urocortins and Ischaemia As w
- Page 59 and 60:
Ott et al. recently showed that the
- Page 61 and 62:
1.6.4 The SAM Complex The outer mem
- Page 63 and 64:
etain H2AX activity for longer than
- Page 65 and 66:
esulting in an ATM-MDC1-H2AX positi
- Page 67 and 68:
1.8.3 TLR Adaptors TLR signalling i
- Page 69 and 70:
1.9 The Adaptive Immune System 1.9.
- Page 71 and 72:
Fig 1.14. Outline of T-helper cell
- Page 73 and 74:
1.10.3 IL-12 IL-12 is a potent pro-
- Page 75 and 76:
1.11.2 p38 MAPK p38 is induced by a
- Page 77 and 78:
negative JNK overcomes LPS induced
- Page 79 and 80:
1.12 Inflammatory Diseases 1.12.1 M
- Page 81 and 82:
10 producing Th2 response appears t
- Page 83 and 84:
2.1 Reagents The following TLR liga
- Page 85 and 86:
2.3.2 Endotoxic shock Toxic shock o
- Page 87 and 88:
2.4 Cell Culture 2.4.1 Freezing and
- Page 89 and 90:
emove red blood cells. CD4 and CD8
- Page 91 and 92:
2.5.2 ELISA ELISA was used as a met
- Page 93 and 94:
mM NaCl, 1 mM EDTA, 1 mM EGTA and p
- Page 95 and 96:
To measure gene promoter regulation
- Page 97 and 98:
uffer (200 mM MES buffer, 2 M NaCl,
- Page 99 and 100:
was added (10 mM RbCl, 50 mM , 100
- Page 101 and 102:
2.9 Cell Death Measurements 2.9.1 T
- Page 103 and 104:
Chapter 3: Investigating the Role o
- Page 105 and 106:
3.2 Overexpression of STAT3 Protect
- Page 107 and 108:
A B % Cell Death 50 40 30 20 10 0 G
- Page 109 and 110:
cell death were examined. Using thi
- Page 111 and 112:
A B 7AAD GFP %Cell Death 100 75 50
- Page 113 and 114:
3.4 Deletion of STAT3 Sensitises Ce
- Page 115 and 116:
Next, wild type and STAT3 knockout
- Page 117 and 118:
3.5 STAT3 becomes Phosphorylated an
- Page 119 and 120:
While STAT3 is phosphorylated at bo
- Page 121 and 122: Two STAT3 target genes, SOCS3 and c
- Page 123 and 124: A STAT3 B C Fold Change Fold Change
- Page 125 and 126: 3.6 Oxidative stress induces STAT3
- Page 127 and 128: 3. 7 Activation of STAT1 and STAT3
- Page 129 and 130: Next, the extent of DNA damage and
- Page 131 and 132: A B C pSTAT3 Y705 pSTAT3 S727 Total
- Page 133 and 134: 3.9 I/R injury in the brain induces
- Page 135 and 136: 3.10 Reperfusion Induced Myocardial
- Page 137 and 138: Tempol infusion before the onset of
- Page 139 and 140: In order to examine the tissue dist
- Page 141 and 142: Fig 3.22. Effect of I/R and drug in
- Page 143 and 144: 3.12 Discussion STAT transcription
- Page 145 and 146: may be involved. JAK2 activity has
- Page 147 and 148: studies have begun to address the r
- Page 149 and 150: 4.1 Aims In the previous chapter, t
- Page 151 and 152: all 15 arrays to be included in dow
- Page 153 and 154: C D A Log intensity Raw Intensity B
- Page 155 and 156: A B C I/R Ucn1 Probe Sets Annotated
- Page 157 and 158: Table 4.2. The 20 genes with the hi
- Page 159 and 160: A B 209 245 150 111 133 30 44 41 30
- Page 161 and 162: A B 161
- Page 163 and 164: E Activation Inhibition Translocati
- Page 165 and 166: Number of Genes 20 15 10 5 0 No Ide
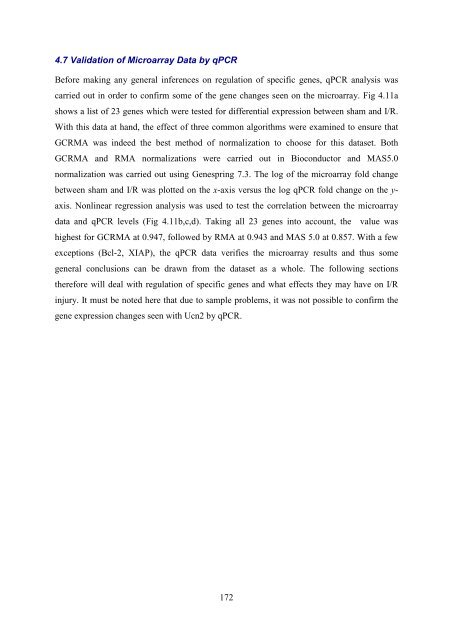
- Page 167 and 168: 4.6 Differential Expression mediate
- Page 169 and 170: Number of Genes Number of Genes 20
- Page 171: Ucn1 Ucn2 Fig 4.10 Network analysis
- Page 175 and 176: Table 4.5. Genes differentially reg
- Page 177 and 178: A C Fold Change Fold Change 17.5 15
- Page 179 and 180: A C Fold Change Fold Change 30 20 1
- Page 181 and 182: order to examine if neonatal cardia
- Page 183 and 184: 4.10 Differential Regulation of MAP
- Page 185 and 186: 4.11 Uracil Metabolism is Altered b
- Page 187 and 188: 4.12 Reduced Expression of Mitochon
- Page 189 and 190: Gene Gene Title FC p value Nqo2 NAD
- Page 191 and 192: ATP thus allowing protons to be pum
- Page 193 and 194: A Fold Change 1.00 0.75 0.50 0.25 0
- Page 195 and 196: Fig 4.19. Tempol and Ucn1 upregulat
- Page 197 and 198: A B Fold Change [MDA] µmol/g prote
- Page 199 and 200: exogenously added IL-17 could induc
- Page 201 and 202: The subunits that comprise the mito
- Page 203 and 204: Taken together, these observations
- Page 205 and 206: mediator of Ucn1 and Ucn2 cardiopro
- Page 207 and 208: 5.1 Aims In chapter 3 it was shown
- Page 209 and 210: To show that reduced DNA repair in
- Page 211 and 212: A pATM S1981 GAPDH C H2AX GAPDH STA
- Page 213 and 214: 5.4. STAT3 Facilitates DNA Damage M
- Page 215 and 216: The STAT3 dependent regulation of M
- Page 217 and 218: 5.5 Discussion Efficient repair of
- Page 219 and 220: (Cimprich and Cortez, 2008). Chk1 c
- Page 221 and 222: Chapter 6: Regulation of the MAPK P
- Page 223 and 224:
700 bp 450 bp +/+ -/- +/- Fig 6.1 M
- Page 225 and 226:
The pathological consequences of en
- Page 227 and 228:
6.3 MKP-1 Negatively Regulates p38
- Page 229 and 230:
A B AP-1 AP-1 Fold Change 1500 1000
- Page 231 and 232:
A B C MKP-1 Actin D MKP-1 Actin Act
- Page 233 and 234:
A B MKP-1 Actin Fig 6.9. MKP-1 upre
- Page 235 and 236:
A B IL-10 (pg/ml) 700 600 500 400 3
- Page 237 and 238:
B A Fold Change 1000 750 500 250 0
- Page 239 and 240:
6.6 Dynamic Regulation of TNF- is M
- Page 241 and 242:
levels seen by 5 hr LPS challenge i
- Page 243 and 244:
Previous studies have shown that IL
- Page 245 and 246:
6.7 MKP-1 Activity Promotes IL-12 E
- Page 247 and 248:
B A Fold Change 6000 4000 2000 0 +/
- Page 249 and 250:
A B IL-12p70 pg/ml IL-12p70 500 +/+
- Page 251 and 252:
% Weight 105 100 95 90 DSS 0 5 10 1
- Page 253 and 254:
6.10 Loss of MKP-1 does not Effect
- Page 255 and 256:
Taken together, these results demon
- Page 257 and 258:
Since loss of MKP-1 does not appear
- Page 259 and 260:
mice leads increased NO levels (Zha
- Page 261 and 262:
Fig 6.26. Model of MKP-1 mediated t
- Page 263 and 264:
of DSS induced colitis. Other possi
- Page 265 and 266:
wild type mice but failed to do so
- Page 267 and 268:
STAT3 was found to be active during
- Page 269 and 270:
Both Ucn1 and Ucn2 were found to lo
- Page 271 and 272:
cytokine production (IL-2, IL-4, IF
- Page 273 and 274:
(A) Table of Antibodies Appendix 1
- Page 275 and 276:
IL-6_F ACTGCCTTCCCTACTTCACA IL-6_R
- Page 277 and 278:
Alexander WS, Starr R, Fenner JE, S
- Page 279 and 280:
Bevan MJ: Helping the CD8(+) T-cell
- Page 281 and 282:
Chen P, Li J, Barnes J, Kokkonen GC
- Page 283 and 284:
Deveraux QL, Takahashi R, Salvesen
- Page 285 and 286:
Garcia R, Bowman TL, Niu G, Yu H, M
- Page 287 and 288:
Hirota H, Izumi M, Hamaguchi T, Sug
- Page 289 and 290:
Kassel O, Sancono A, Kratzschmar J,
- Page 291 and 292:
Kuwata H, Watanabe Y, Miyoshi H, Ya
- Page 293 and 294:
Lufei C, Ma J, Huang G, Zhang T, No
- Page 295 and 296:
Minners J, McLeod CJ, Sack MN: Mito
- Page 297 and 298:
KL, JA, TL, R, TE: Activation of ST
- Page 299 and 300:
F, Y, D, C, SB, PT, RJ, Monte F. Pr
- Page 301 and 302:
Roucou X, Montessuit S, Antonsson B
- Page 303 and 304:
Shen Y, Schlessinger K, Zhu X, Meff
- Page 305 and 306:
Szabo SJ, Sullivan BM, Peng SL, Gli
- Page 307 and 308:
Valledor AF, Xaus J, Comalada M, So
- Page 309 and 310:
Yamamoto M, Sato S, Hemmi H, Hoshin
- Page 311 and 312:
Zhang J, Yang J, Roy SK, Tininini S