GBM/LAT LLE joint data analysis capability - Fermi - Nasa
GBM/LAT LLE joint data analysis capability - Fermi - Nasa
GBM/LAT LLE joint data analysis capability - Fermi - Nasa

You also want an ePaper? Increase the reach of your titles
YUMPU automatically turns print PDFs into web optimized ePapers that Google loves.
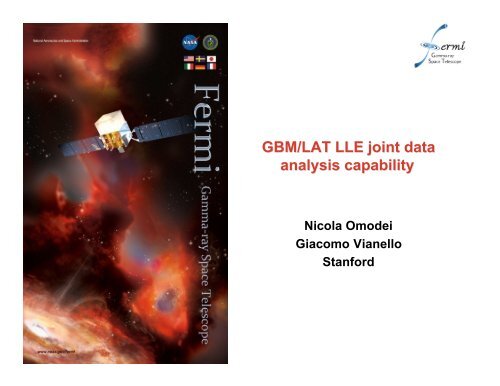
<strong>GBM</strong>/<strong>LAT</strong> <strong>LLE</strong> <strong>joint</strong> <strong>data</strong><br />
<strong>analysis</strong> <strong>capability</strong><br />
Nicola Omodei<br />
Giacomo Vianello<br />
Stanford
<strong>LAT</strong> Low Energy (<strong>LLE</strong>) <strong>analysis</strong><br />
• How to think about the <strong>data</strong><br />
– In our standard <strong>analysis</strong> (steady source, diffuse emission,<br />
flaring blazars,…) background rejection on “event by event”<br />
basis, using classification trees to reduce the particle<br />
contamination, classify the event, improve the quality of the<br />
signal (PSF, energy dispersion,…).<br />
– <strong>LLE</strong> Analysis: For GRBs, Solar Flares (rapid transients) we can<br />
also use the temporal profile to reduce the background. This<br />
information can be used to relax the “standard cuts” and open<br />
the effective area at low energy by an enormous amount.<br />
<strong>LLE</strong><br />
Pass7 - Transient<br />
Pass7 - Source<br />
<strong>LLE</strong> <strong>analysis</strong> makes accessible a new energy range.<br />
At high energy Standard <strong>analysis</strong> more efficient.<br />
<strong>LLE</strong><br />
Standard<br />
<strong>analysis</strong><br />
>100MeV<br />
Standard<br />
<strong>analysis</strong><br />
>1GeV
Opening new windows on transient sources<br />
Solar Flares<br />
During solar flares the high flux of hard X-rays causes<br />
pileup in the ACD. High probability to discard gammarays<br />
during the on-ground <strong>analysis</strong> due to ACD hits.<br />
<strong>LLE</strong> is immune to this feature.<br />
3
Delivery of <strong>LLE</strong> <strong>data</strong> products<br />
Major -non scheduled- improvement!<br />
• New <strong>data</strong> products are delivered by the <strong>LAT</strong> team to the FSSC (and<br />
to the public)<br />
• The new <strong>data</strong> products are delivered for every GRBs and Solar Flare<br />
detected in <strong>LLE</strong> <strong>data</strong>! (to date: 23 GRBs and 5 Solar Flares)<br />
– <strong>LLE</strong> events: un-binned event file, suitable for temporal studies<br />
(high resolution light curve >30 MeV)<br />
– <strong>LLE</strong> spectrum files (PHAII,PHAI and RSP): ready-to-use burst<br />
products in rmfit and XSPEC<br />
– Quick look files (png images)<br />
Usage Notes and Caveats<br />
a) The <strong>LLE</strong> <strong>data</strong> selection and response depend on the input localization of the GRB. Although the procedure to obtain <strong>LLE</strong><br />
<strong>data</strong> and response is fully automatic, the update of the <strong>GBM</strong> trigger catalog is not, and this might introduce a latency in the<br />
delivery of the <strong>data</strong> products with the optimized location.<br />
b) The Monte Carlo used to generate the response covers an energy range between 10 MeV and 100 GeV. At low energy<br />
(
Serving the community:<br />
The <strong>LLE</strong> <strong>data</strong> portal @ FSSC<br />
• All the <strong>LLE</strong> <strong>data</strong> products as well as usage notes, caveats, <strong>data</strong><br />
description will be uploaded to the FSSC Browse web interface<br />
• Expect a latency of <strong>LLE</strong> <strong>data</strong> ~ 5 48 hours (+ updates)
<strong>LLE</strong> catalog of GRBs and Solar Flares<br />
6
<strong>LLE</strong> <strong>data</strong> product (bn100612038)<br />
• gll_lle_bn100612038_v04.fits : <strong>LLE</strong> events, FT1 file format, basically<br />
• gll_cspec_bn100612038_v04.pha (cspec file format, ready to be used in rmfit)<br />
• gll_cspec_bn100612038_v04.rsp (response file, rmfit and XSPEC)<br />
• gll_pha_bn100612038_v04.fit (PHAI file)<br />
• gll_pt_bn100612038_v04.fit (FT2 – 1 second)<br />
• gll_selected_bn100612038_v04.fit (selected events for the selected time interval)
• Learn how to analyze <strong>LLE</strong> <strong>data</strong><br />
– Compute the background;<br />
– Extract PHA1 spectrum file;<br />
In this tutorial<br />
– Use XSPEC to analyze <strong>LLE</strong> and <strong>GBM</strong> <strong>data</strong><br />
• <strong>LLE</strong> <strong>data</strong> (publicly available):<br />
– cspec file<br />
– Rsp file<br />
• <strong>GBM</strong> <strong>data</strong> (publicly available, for some flares you will need to<br />
compute the response using HERA, or use the pre-computed ones:<br />
– http://hesperia.gsfc.nasa.gov/fermi/gbm/rsp/<br />
– Cspec file<br />
– Rspfile
<strong>LLE</strong> <strong>analysis</strong> GUI<br />
• We have written a simple tool to help in the <strong>analysis</strong> of <strong>LLE</strong><br />
<strong>data</strong><br />
– Wrapper around <strong>Fermi</strong> Science Tools<br />
– Graphical User Interface<br />
• Why reinventing the wheel?<br />
– Tool optimized for <strong>LLE</strong> <strong>data</strong> (but can work with <strong>GBM</strong><br />
CSPEC files)<br />
• Low counts: use poissonian likelihood<br />
• Download <strong>LLE</strong> the <strong>data</strong> from the FSSC<br />
– Produces (OGIP) PHA2 files that can be converted in PHA1<br />
and used in several fitting programs (OSPEX,XSPEC,rmfit)
<strong>LLE</strong> Analysis GUI<br />
• In SolarTutorial/lleBackground<br />
• ./lleGUI.py<br />
• Select both <strong>GBM</strong> and <strong>LLE</strong> <strong>data</strong><br />
• Select only the RSP (no CTIME nor TTE)<br />
Select only b0<br />
and <strong>LAT</strong>
<strong>LLE</strong> Analysis GUI
Select the signal<br />
Press p, to zoom (right click, 2 finger click on MAC)<br />
Hold x, click on the start, then click on the end<br />
Hold q and click.
Select the pre-flare background<br />
Hold z, click on the start, then click on the end<br />
of the interval you want to select
Select the post-flare background<br />
Hold z, click on the start, then click on the end<br />
of the interval you want to select
Results:<br />
• A series of output files have been produced:<br />
– <strong>LAT</strong>_bkgintervals.out<br />
– <strong>LAT</strong>_srcintervals.out<br />
– <strong>LAT</strong>_bkgspectra.out THIS IS A PHAII file<br />
– <strong>LAT</strong>_srcspectra.out THIS IS A PHAII file<br />
• Produces a xspec file to load the <strong>data</strong>.<br />
• If you want to use PHA I instead:<br />
– cmppha -- Converts a TYPE II to a TYPE I OGIP pha file
Fitting with XSPEC<br />
Solar flare <strong>analysis</strong> requires the use of spectrum templates<br />
(nuclear lines, pion model)<br />
We have generated tabular models (atable) for Narrow Nuclear<br />
Lines and Broad Nuclear Lines, as well as pion decay models.<br />
XSPEC/*fits<br />
NAI.fits BRD.fits piontemplate.fits
XSPEC command (load the <strong>data</strong>)
XSPEC command (define the model)<br />
setplot energy<br />
ignore 1:1 2e4-**<br />
ignore 2:**-3e4 7e5-**<br />
mod pow+pegpwrl*highecut+atable{../XSPEC/NAR.fits}+atable{../XSPEC/BRD.fits}+gauss+gauss+atable{../XSPEC/piontemplate.fits} & /* \n<br />
newpar 1 2.7<br />
newpar 2 1.0<br />
newpar 3 2.0<br />
newpar 4 1000<br />
newpar 5 1000<br />
newpar 6 1.0<br />
newpar 7 0 -1 0 0 1 1<br />
newpar 8 3e3 100 1e3 1e3 1e6 1e6<br />
newpar 9 4.0<br />
newpar 10 1<br />
newpar 11 =9<br />
newpar 12 = 10*0.75<br />
newpar 13 2.2e3,1e2,2e3,2e3,3e3,3e3<br />
newpar 15 0.1,0.001,0.01,0.01,1000,1000<br />
newpar 16 1.0<br />
newpar 17 511.,1.,500.,500.,515.,515.<br />
newpar 18 0.1,0.001,0.01,0.01,1000,1000<br />
newpar 19 4.0<br />
newpar 20 1.0<br />
statistic chi<br />
fit 100<br />
cpd /xw<br />
plot ld<br />
statistic pgstat<br />
fit 100<br />
show
The result<br />
• Using chi^2 statistic is not correct for <strong>LLE</strong> <strong>data</strong>, but it is faster<br />
and helps to find the minimum.<br />
• The fit MUST be re-run with pg-stat, which assumes<br />
Poissonian statistics for the signal, and Gaussian for the<br />
background. It’s based on likelihood.<br />
This is just an example, you will need to play with the parameter to get the right<br />
spectrum… have fun!