Full directors report - Mondi
Full directors report - Mondi
Full directors report - Mondi

You also want an ePaper? Increase the reach of your titles
YUMPU automatically turns print PDFs into web optimized ePapers that Google loves.
Turkish corrugated business) and<br />
<strong>Mondi</strong> Packaging South Africa<br />
(70% owned).<br />
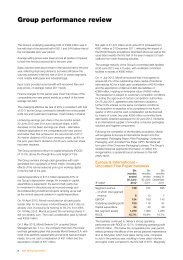
Cash flow and<br />
borrowings<br />
E million 2009 2008<br />
EBITDA<br />
Fair value adjustments<br />
and other non-cash<br />
645 814<br />
movements<br />
Cash flow from working<br />
(26) (46)<br />
capital<br />
Cash generated from<br />
248 27<br />
operations<br />
Taxes paid and<br />
dividends from<br />
867 795<br />
associates<br />
Net cash generated<br />
from operating<br />
(30) (69)<br />
activities (837) 726<br />
Capital expenditure<br />
Investment in forestry<br />
(517) (693)<br />
assets<br />
Acquisitions of<br />
subsidiaries and<br />
(40) (43)<br />
associates (2) (49)<br />
Disposals of businesses 57 17<br />
Other investing activities<br />
including interest<br />
received<br />
Net cash used in<br />
10 58<br />
investing activities<br />
Cash (used)/generated<br />
from financing<br />
(492) (710)<br />
activities (364) 8<br />
Net cash flow (19) 24<br />
EBITDA of E645 million for the year<br />
was 21%, or E169 million, lower than<br />
in 2008, reflecting the more difficult<br />
trading environment. Cash generated<br />
from operations of E867 million<br />
increased by E72 million, or 9%,<br />
compared with the previous year,<br />
mainly because of significantly higher<br />
inflows from working capital than<br />
were achieved in 2008, offset by the<br />
lower EBITDA. Cash inflow from<br />
working capital of E248 million was<br />
achieved despite an already strong<br />
performance in the 2007 and 2008<br />
financial years (E124 million<br />
cumulative inflow).<br />
Capital expenditure, including<br />
purchase of intangible assets, of<br />
E222 million (excluding spend on the<br />
two major strategic projects of around<br />
E300 million), was significantly lower<br />
than depreciation and amortisation of<br />
E351 million, reflecting the decision<br />
taken in the fourth quarter of 2008 to<br />
limit new capital expenditure<br />
approvals to below 40% of<br />
depreciation. The remaining<br />
expenditure on the two major projects<br />
is estimated at around E210 million,<br />
the bulk of which will be spent in<br />
2010 with minimal flow through to<br />
2011. There were no major business<br />
acquisitions during the year.<br />
Cash generated from<br />
operations increased<br />
by 9% to E867 million<br />
Balance sheet<br />
E million 2009 2008<br />
Trading capital<br />
employed 4,314 4,367<br />
ROCE<br />
(pre taxation) (%) 7.6% 9.5%<br />
Shareholders funds 2,399 2,323<br />
Return on shareholders<br />
funds (%) 4.0% 6.5%<br />
Net debt 1,517 1,690<br />
Gearing (Net debt/<br />
trading capital<br />
employed) (%) 35.1% 38.7%<br />
Net debt to EBITDA<br />
(times) 2.4 2.1<br />
Trading capital employed at year<br />
end was E4,314 million, E53 million<br />
lower than in 2008, mainly because<br />
of working capital inflows of<br />
E248 million, special item impairments<br />
of E98 million and disposals of<br />
E59 million, partially offset by capital<br />
expenditure including purchases of<br />
intangible assets of E522 million<br />
(E171 million in excess of<br />
depreciation) and foreign exchange<br />
movements of E195 million.<br />
Treasury and borrowings<br />
The Group’s treasury function operates<br />
within clearly defined Board-approved<br />
policies and limits, follows controlled<br />
Directors’ <strong>report</strong><br />
Annual <strong>report</strong> and accounts 2009 <strong>Mondi</strong> Group 29