The Rug Rat Race - UC San Diego Department of Economics
The Rug Rat Race - UC San Diego Department of Economics
The Rug Rat Race - UC San Diego Department of Economics

You also want an ePaper? Increase the reach of your titles
YUMPU automatically turns print PDFs into web optimized ePapers that Google loves.
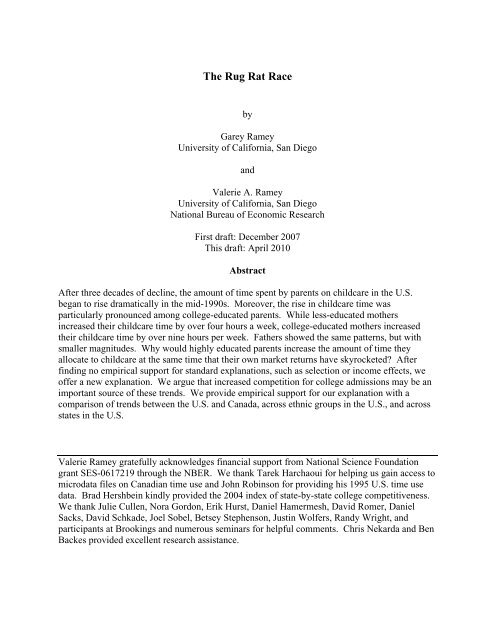
<strong>The</strong> <strong>Rug</strong> <strong>Rat</strong> <strong>Race</strong><br />
by<br />
Garey Ramey<br />
University <strong>of</strong> California, <strong>San</strong> <strong>Diego</strong><br />
and<br />
Valerie A. Ramey<br />
University <strong>of</strong> California, <strong>San</strong> <strong>Diego</strong><br />
National Bureau <strong>of</strong> Economic Research<br />
First draft: December 2007<br />
This draft: April 2010<br />
Abstract<br />
After three decades <strong>of</strong> decline, the amount <strong>of</strong> time spent by parents on childcare in the U.S.<br />
began to rise dramatically in the mid-1990s. Moreover, the rise in childcare time was<br />
particularly pronounced among college-educated parents. While less-educated mothers<br />
increased their childcare time by over four hours a week, college-educated mothers increased<br />
their childcare time by over nine hours per week. Fathers showed the same patterns, but with<br />
smaller magnitudes. Why would highly educated parents increase the amount <strong>of</strong> time they<br />
allocate to childcare at the same time that their own market returns have skyrocketed? After<br />
finding no empirical support for standard explanations, such as selection or income effects, we<br />
<strong>of</strong>fer a new explanation. We argue that increased competition for college admissions may be an<br />
important source <strong>of</strong> these trends. We provide empirical support for our explanation with a<br />
comparison <strong>of</strong> trends between the U.S. and Canada, across ethnic groups in the U.S., and across<br />
states in the U.S.<br />
Valerie Ramey gratefully acknowledges financial support from National Science Foundation<br />
grant SES-0617219 through the NBER. We thank Tarek Harchaoui for helping us gain access to<br />
microdata files on Canadian time use and John Robinson for providing his 1995 U.S. time use<br />
data. Brad Hershbein kindly provided the 2004 index <strong>of</strong> state-by-state college competitiveness.<br />
We thank Julie Cullen, Nora Gordon, Erik Hurst, Daniel Hamermesh, David Romer, Daniel<br />
Sacks, David Schkade, Joel Sobel, Betsey Stephenson, Justin Wolfers, Randy Wright, and<br />
participants at Brookings and numerous seminars for helpful comments. Chris Nekarda and Ben<br />
Backes provided excellent research assistance.
I. Introduction<br />
As work time increased over the last four decades, time spent on most home production<br />
activities trended downward (e.g. Robinson and Godbey (1999), Bianchi, et al. (2006), Aguiar<br />
and Hurst (2007)). One notable exception is time spent on childcare. Bianchi (2000) and Sayer,<br />
Bianchi, and Robinson (2004) show that despite shrinking families, parents in the late 1990s<br />
reported spending as much or more time on childcare than parents in earlier decades.<br />
In this paper, we show that there has in fact been a dramatic increase in time spent on<br />
childcare. Linking thirteen time use surveys between 1965 and 2008, we show that after<br />
declining for several decades, time spent on childcare started increasing in the early 1990s. <strong>The</strong><br />
trends follow a pronounced S-shaped pattern, rising markedly from the early 1990s to the early<br />
2000s, and then flattening out. Moreover, the increase in childcare time has been twice as great<br />
for college-educated parents. This differential trend between college- and less-educated parents<br />
is particularly puzzling in view <strong>of</strong> the dramatic increases in wages <strong>of</strong> college-educated<br />
individuals. We also show that an important component <strong>of</strong> the increase in childcare time was<br />
time spent on older children, and in particularly on coordinating and transporting them to their<br />
activities.<br />
Our estimates imply increases in average weekly hours <strong>of</strong> childcare time ranging from 3<br />
hours per week for less educated fathers to more than 9 hours per week for mothers with a four-<br />
year college degree. <strong>The</strong> implications for the allocation <strong>of</strong> time are large by any metric.<br />
According to our estimates, the time spent on childcare by the entire adult population in 2008 is<br />
equal to almost 20 percent <strong>of</strong> the time it spends on work. <strong>The</strong> increase in average weekly time<br />
spent on childcare during the 10 years from the early 1990s to the early 2000s was equal to 70<br />
percent <strong>of</strong> the absolute decline in work hours during the current “Great Recession.” If the hours<br />
1
were valued at their market wage rate, the increase in childcare time would amount to over $300<br />
billion per year.<br />
<strong>The</strong> literature has <strong>of</strong>fered several explanations, both for why childcare time increased and<br />
why educated parents spent more time with their children (e.g., Bianchi, et al. (2006, p. 87),<br />
Aguiar and Hurst (2007), Guryan, Hurst, and Kearney (2008)). <strong>The</strong>se explanations include<br />
selection effects, income effects, safety concerns, enjoyment, and more flexible work schedules.<br />
We test each <strong>of</strong> them and find that they are not consistent with the data.<br />
<strong>The</strong> inability <strong>of</strong> existing explanations to account for the evidence leads us to <strong>of</strong>fer a new<br />
explanation for the upward trends. We argue that much <strong>of</strong> the increase in time spent in childcare,<br />
particularly among the college educated, may be a response to an increase in the perceived return<br />
to attending a good college, coupled with an increase in competition in college admissions.<br />
Importantly, the size <strong>of</strong> college-bound cohorts rose dramatically beginning in the early 1990s,<br />
coincident with the increase in time spent on childcare. Bound and Turner (2007) have provided<br />
evidence that larger cohorts are associated with increasingly severe cohort crowding at quality<br />
schools. Increased scarcity <strong>of</strong> college slots appears to have induced heightened rivalry among<br />
parents, taking the form <strong>of</strong> more hours spent on college preparatory activities. In other words,<br />
the rise in childcare time resulted from a “rug rat race” for admission to good colleges.<br />
In order to clarify the mechanics <strong>of</strong> this explanation, we develop a simple theoretical<br />
model in which college admission depends on parents’ choice <strong>of</strong> college preparation time.<br />
College-educated parents are assumed to have a comparative advantage in preparation time.<br />
When slots at good colleges are relatively plentiful, the marginal slots are filled by children <strong>of</strong><br />
less-educated parents. Competition among these parents determines the preparation required for<br />
admissions. When good slots become relatively scarce, rivalry for the marginal slots shifts to the<br />
2
college-educated parents, who are better able to compete. A rug rat race emerges among these<br />
parents, driving up both admissions requirements and the time spent on childcare.<br />
We provide support for this explanation using three comparisons. First, we compare<br />
childcare trends in the U.S. to those in Canada. <strong>The</strong> U.S. and Canada are similar along many<br />
dimensions, but differ in one respect that is key to our explanation: the Canadian system lacks a<br />
steep prestige hierarchy among institutions, so that Canadians do not experience the intense<br />
rivalry to gain admission into higher rated colleges. Thus, our theory predicts that we should not<br />
see the same increase in time spent in childcare in Canada among the more educated. Employing<br />
time-use data from Canada’s General Social Survey, we show that time spent in childcare by<br />
educated Canadian parents changed very little over this period, corroborating our theory.<br />
Second, we show that black and Hispanic parents spend less time in childcare than white parents.<br />
Since affirmative action policies may attenuate the rivalry for scarce slots for underrepresented<br />
minorities, there would be less pressure for them to spend time on childcare. Third, we use<br />
Bound, Hershbein and Long’s (2009) measure <strong>of</strong> college competitiveness to demonstrate a<br />
positive correlation between competitiveness and childcare time across U.S. states.<br />
<strong>The</strong> paper proceeds as follows. Section II documents trends in childcare over the 1965-<br />
2008 period. <strong>The</strong> standard explanations are evaluated in Section III. Section IV presents<br />
evidence showing increased competition for college over this period, and develops our new<br />
explanation along with the empirical support. Section V concludes.<br />
II. Trends in Time Spent in Childcare<br />
Long-term trends in time spent in care <strong>of</strong> children have been the subject <strong>of</strong> many studies<br />
in sociology (e.g. Bryant and Zick (1996), Robinson and Godbey (1999), Sayer, Bianchi, and<br />
3
Robinson (2004)). It has long been noted that college-educated mothers devote more time to<br />
child rearing than less educated mothers (e.g. USDA (1944), Leibowitz (1974), Bianchi, et al.<br />
(2006), Guryan, et al. (2008)). Here, we document that since the mid-1990s there has been a<br />
substantial increase in childcare time as well as a widening <strong>of</strong> the gap between college-educated<br />
and less-educated parents.<br />
A. Data Description<br />
To document trends, we use information from thirteen nationally representative surveys<br />
from 1965, 1975, 1985, 1992-94, 1995, 1998, 2000 and 2003-2008. All <strong>of</strong> the surveys are based<br />
on time diary information, which is considered to be the most reliable measure <strong>of</strong> how<br />
individuals spend their time. Table A1 <strong>of</strong> the online data appendix provides details about the<br />
surveys. We use the American Heritage Time Use Study (AHTUS) versions <strong>of</strong> the 1965, 1975,<br />
1985, and 1992-94 surveys (Fisher, Egerton and Gershuny (2006)), and the original versions <strong>of</strong><br />
the other surveys.<br />
<strong>The</strong> key measurement issue is the extent to which the studies give consistent measures<br />
over time. <strong>The</strong> potentially problematic surveys are the 1992-94 survey and the BLS surveys<br />
starting in 2003. Many childcare researchers believe that the 1992-94 survey undercounts<br />
primary childcare activities (Robinson and Godbey (1999), Bianchi, Cohen, Raley and<br />
Nomaguchi (2004), Bianchi et al (2006)). Using results from other time use studies that are not<br />
part <strong>of</strong> the AHTUS, but are considered comparable to the earlier studies, Allard, Bianchi, Stewart<br />
and Wight (2007, footnote 19) argue that the 1992-94 study is not comparable. <strong>The</strong> 1992-94<br />
survey suggests that time spent in childcare was one hour per week lower in the early 1990s<br />
(compared to 1985), whereas the 1995 survey suggest that it was one hour per week higher.<br />
4
Thus, any drops in childcare time between 1985 and 1992-94 may be due to problems with the<br />
1992-94 survey. Another important drawback <strong>of</strong> the 1992-94 study is the lack <strong>of</strong> information on<br />
key controls, such as marital status.<br />
Concerns have also been expressed about the comparability <strong>of</strong> the 2003-2008 BLS<br />
surveys with the earlier surveys. Allard, et al. (2007) compare the 2003 BLS survey to the 2000<br />
Survey Research Center survey <strong>of</strong> parents and find very similar estimates <strong>of</strong> primary time spent<br />
in childcare (though not secondary time spent in childcare). <strong>The</strong> 2000 survey was designed to be<br />
comparable to the earlier surveys, so it appears that the increase in time spent on childcare in the<br />
BLS surveys relative to earlier surveys is real rather than due to methodological differences in<br />
the survey.<br />
Fortunately, the 1965, 1975, 1985, 1995, 1998, and 2000 surveys all involved John<br />
Robinson as a principal investigator. As a result, the coding <strong>of</strong> activities is very similar across<br />
surveys. Because these studies span the time period in which childcare began trending upward,<br />
we feel confident that the trends we find in time spent in childcare reflect actual trends rather<br />
than changes in activity classification.<br />
We use a comprehensive measure <strong>of</strong> childcare that includes care <strong>of</strong> infants, older<br />
children, medical care <strong>of</strong> children, playing with children, helping with homework, reading to and<br />
talking with children, dealing with childcare providers, and travel related to childcare. <strong>The</strong><br />
online data appendix gives details <strong>of</strong> the activity codes used.<br />
B. Trends in Total Childcare<br />
5
To study changes in childcare over time, we regress individual-level time spent on<br />
childcare on various sets <strong>of</strong> controls. Most <strong>of</strong> our results are based on the following simple<br />
descriptive model:<br />
CH = X β + ε ,<br />
it<br />
where CHit is the number <strong>of</strong> hours per week spent on childcare for person i in year t, Xit is a set<br />
<strong>of</strong> controls, and ε it captures omitted other factors affecting childcare time. Our sample consists<br />
<strong>of</strong> parents aged 18 to 64 who are not students, where “parent” is defined as having a child under<br />
18 years in the household. 1 We use the recommended weights from the various studies,<br />
normalized so that a representative individual in 1965 has the same weight as a representative<br />
individual in 2008. In addition to the year <strong>of</strong> the survey, Xit may also include dummy variables<br />
for the age group <strong>of</strong> the individual (ages 18-24, 25-34, 35-44, 45-54, and 55-64), whether or not<br />
the individual has a four-year college degree, the interaction <strong>of</strong> the college degree dummy with<br />
year, marital status, the number <strong>of</strong> children, the number <strong>of</strong> children squared, category variables<br />
for the age <strong>of</strong> the youngest child (age
women, as defined above. <strong>The</strong> omitted dummy variables are 1975, less-than-college education,<br />
and ages 25-34. 2<br />
Column 1 <strong>of</strong> Table 1 shows the results from this estimation. <strong>The</strong> levels effects for the<br />
year indicators show that the amount <strong>of</strong> time spent in childcare decreased from 1965 to 1975,<br />
and again in 1985 and 1992-94 (“1993” for short). Recall, though, that many believe that the<br />
1992-94 survey undercounted childcare, so this estimate may not indicate an actual decrease.<br />
Childcare time in 1995 was 1.74 hours more per week than in 1975, and by 2000 it had risen to<br />
nearly four hours more. From 2003 through 2008, less-educated mothers spent over four hours<br />
more per week in childcare activities than they did in 1975.<br />
Of additional interest are the coefficients on the interactions between year and college<br />
education. After a trough in the early 1990s, the coefficients on this interaction began to grow in<br />
the late 1990s. <strong>The</strong>se estimates show that from 1965 to 1995, college-educated mothers spent<br />
between 0.03 and 2 more hours per week on childcare than did non-college-educated mothers.<br />
Beginning in 1998, however, this differential underwent a dramatic increase: college-educated<br />
mothers spent over three hours more per week in 1998, roughly five hours more in 2000 and<br />
2003, and over six hours more in 2004 and 2005. Between 1998 and 2008, the college<br />
differential in every year was at least double the highest differential observed between 1965 and<br />
1995.<br />
<strong>The</strong>se trends are depicted graphically in panel A <strong>of</strong> Figure 1, which is based on the<br />
estimates from column 1 <strong>of</strong> Table 1. <strong>The</strong> numbers shown indicate the time spent in childcare by<br />
mothers in the 25-34 age group; the trends for other age groups follow the same time series<br />
pattern, differing only in the time-invariant constant term. For both education groups, time spent<br />
2 We use 1975 as the omitted year because we will later be comparing 2000 and later studies to 1975 with the more<br />
complete set <strong>of</strong> controls that are available for those studies, but not for other years.<br />
7
in childcare rose beginning in 1995, but after 1998 the upward movement was much sharper<br />
among college-educated mothers, following a pronounced S-shaped pattern. As discussed<br />
earlier, problems with the 1992-1994 study make it likely that the true 1993 value was somewhat<br />
higher.<br />
Column 2 <strong>of</strong> Table 1 compares childcare by mothers in 1975, 2000, and 2003-2008 using<br />
the more complete set <strong>of</strong> controls that are available for these eight years. In addition to the age<br />
category <strong>of</strong> the mother, we also control for marital status, the number <strong>of</strong> children (using a<br />
quadratic), and the five dummy variables for the age category <strong>of</strong> the youngest discussed above.<br />
<strong>The</strong> full set <strong>of</strong> controls is useful for controlling for trends in fertility, such as the number <strong>of</strong><br />
children and the rising maternal age at first birth. In this specification, we are seeking to<br />
compare mothers with similar numbers and ages <strong>of</strong> children across education levels for the seven<br />
years. <strong>The</strong> results are similar to those without the complete controls. <strong>The</strong> amount <strong>of</strong> time spent<br />
on childcare by less-educated mothers rose by four hours per week from 1975 to the 2000s, and<br />
time spent by college-educated mothers rose by more than eight hours per week. Thus, even<br />
with the more complete sets <strong>of</strong> controls, we find that college-educated mothers increased the<br />
amount <strong>of</strong> time spent in childcare by double the amount <strong>of</strong> less-educated mothers.<br />
Is the same true for men? Column 3 <strong>of</strong> Table 1 and panel B <strong>of</strong> Figure 1 show the results<br />
<strong>of</strong> our benchmark specification for fathers. While fathers on average spent much less time on<br />
childcare, the time spent on childcare for men also rose sharply in the late 1990s and early 2000s.<br />
<strong>The</strong> final column <strong>of</strong> Table 1 compares childcare <strong>of</strong> fathers in 1975 to later years and includes the<br />
full set <strong>of</strong> controls. <strong>The</strong> results are similar to those without the additional controls. We conclude<br />
8
that time spent on childcare by both mothers and fathers increased beginning in 1995, and that<br />
this increase was significantly steeper among the college educated. 3<br />
One might worry that the rise in reported childcare time might be the result <strong>of</strong> changing<br />
social norms causing parents to exaggerate their estimates <strong>of</strong> time spent with children. However,<br />
corroborating evidence for these trends is provided by time use studies <strong>of</strong> children. For example,<br />
<strong>San</strong>dberg and H<strong>of</strong>ferth (2005) link time diary studies <strong>of</strong> children in 1981 and 1997 to determine<br />
trends in time spent with parents. <strong>The</strong>y find that children between the ages <strong>of</strong> 3 to 12 spent 18<br />
more hours per week with one or both parents in 1997 as compared to 1981. Thus, children’s<br />
time diaries corroborate the trends found using parents’ time diaries.<br />
C. Trends in Categories <strong>of</strong> Childcare<br />
We now break down the trends into particular categories <strong>of</strong> childcare. To produce<br />
consistent estimates <strong>of</strong> trends over time, we limited the sample to 1965, 1975, 1985, 1995, 1998,<br />
and 2000 because these six surveys (i) had the same activity codes for subsets <strong>of</strong> childcare; (ii)<br />
distinguished between basic care <strong>of</strong> young children versus care <strong>of</strong> older or mixed age children;<br />
and (iii) included key variables we could use as controls. 4 <strong>The</strong> controls included age categories<br />
<strong>of</strong> parents, marital status, a quadratic in the number <strong>of</strong> children, and the number <strong>of</strong> young<br />
children. 5 We construct five subcategories <strong>of</strong> childcare: (1) general care <strong>of</strong> young children; (2)<br />
general care <strong>of</strong> older children or mixed age children; (3) playing with children; (4) teaching<br />
3 Our results differ from Bianchi, et al. (2004). <strong>The</strong>y do not find a statistically significant increase in the differential<br />
between college-educated parents and less-educated parents from 1975 to 2000. On the other hand, a recent paper<br />
by Chalasani (2007) that studies married parents finds results similar to ours: a larger increase in childcare time<br />
among the college-educated between 1985 and 2003.<br />
4 <strong>The</strong> reason we could not construct these categories for the BLS data is that they do not distinguish between basic<br />
care <strong>of</strong> younger children and older children.<br />
5 <strong>The</strong> definition <strong>of</strong> “young children” changed slightly across surveys. In 1965, it was “under 4 years <strong>of</strong> age,” in<br />
1998 it was “under 7 years <strong>of</strong> age,” and in the rest it was “under 5 years <strong>of</strong> age.”<br />
9
children, which involves reading, helping with homework, disciplining and conversing; and (5)<br />
travel related to childcare, coordinating children’s activities, and picking up and dropping <strong>of</strong>f<br />
children. 6<br />
Figure 2 shows the various categories for mothers and Figure 3 shows the various<br />
categories for fathers. <strong>The</strong> estimates have been normalized to be zero in 1975. As the figures<br />
reveal, time spent in basic care <strong>of</strong> younger children fell for all four gender-education groups,<br />
although it recovered after the mid-1990s for college-educated mothers. This recovery could be<br />
due in part to the increased propensity to breastfeed, as documented in Daniel Sacks and Betsey<br />
Stevenson’s discussion. However, Sacks and Stevenson also show that the gap in breastfeeding<br />
by education level decreased between the early 1990s and 2005-2006. Thus, breastfeeding<br />
cannot explain the increase in the gap in childcare time across education levels. <strong>The</strong> childcare<br />
category with the greatest increase for all four gender-education groups is general care <strong>of</strong> older<br />
or mixed age children. Time spent in this category increased by four hours for college-educated<br />
mothers and by three hours for college-educated fathers. <strong>The</strong> second most important category<br />
was travel and children’s extracurricular activities.<br />
Our discussants compare trends in childcare time from the earlier studies to the BLS<br />
studies by looking at childcare time in households in which the youngest child is under five years<br />
old versus households in which the youngest child is five years old or older. Based on the<br />
unconditional means from this cut <strong>of</strong> the data, they argue that much <strong>of</strong> the childcare time<br />
increase, and in particular the increase in the educational differential, was due to households with<br />
young children. This result is interesting in itself, but it does not imply time spent on young<br />
children constitutes the bulk <strong>of</strong> the increase. Childcare time in families with at least one child<br />
6 We omit medical care in order to make the graph clearer. <strong>The</strong>re was no noticeable trend in time spent in medical<br />
care for any group.<br />
10
under the age <strong>of</strong> five is distributed across all children in the household. Only the surveys<br />
through 2000 distinguish childcare by age <strong>of</strong> child, and those surveys indicate that care <strong>of</strong><br />
younger children is not the source <strong>of</strong> the increase.<br />
Although the BLS surveys do not distinguish time spent with younger children versus<br />
older children, they contain other detailed categories <strong>of</strong> interest. We examine the following<br />
categories for the pooled sample from 2003-2008: (1) physical care <strong>of</strong> children and supervision;<br />
(2) educating and teaching children, including reading, helping with homework, and meeting<br />
with teachers; (3) playing with children, including sports and arts and crafts; (4) health care; (5)<br />
organizing activities and attending child’s events; and (6) chauffeuring, which includes dropping<br />
<strong>of</strong>f/picking up, waiting, and travel associated with childcare.<br />
Figure 4 shows time spent by parents whose youngest child is less than five years old.<br />
<strong>The</strong> bulk <strong>of</strong> time spent by mothers is physical care and supervision, followed by playing.<br />
College-educated mothers spend substantially more time on these two categories than less-<br />
educated mothers, 11 hours in physical care and supervision and six hours in playing. <strong>The</strong> other<br />
categories for this age group are much lower, two hours or less per week. <strong>The</strong> time spent by<br />
education level does not differ much for the other categories, with the exception <strong>of</strong> educational<br />
activities where college-educated mothers spend more time. <strong>The</strong> story is similar for fathers, but<br />
at lower levels <strong>of</strong> hours. College-educated fathers spend more time in both categories than less-<br />
educated fathers.<br />
Figure 5 shows time spent by parents whose youngest child is five years or older. Note<br />
that the scale is different on this graph: time spent in physical care and supervision has shrunk to<br />
2.5 hours per week for mothers. <strong>The</strong> most important category for college educated mothers with<br />
older children is chauffeuring. Physical care and supervision is the second most important<br />
11
category, and activities associated with education constitute the third most important category for<br />
college-educated mothers. Also important are organizing and attending extracurricular activities.<br />
Fathers spend less time than mothers in all categories except playing. <strong>The</strong> two most important<br />
categories for fathers are chauffering and physical care and supervising, followed by attending<br />
activities and playing. Overall, college-educated parents spend more time in each category<br />
except for health care. <strong>The</strong> most important sources <strong>of</strong> the extra time spent by college-educated<br />
parents, however, are in chauffeuring, education- and activity-related categories. 7<br />
<strong>The</strong> patterns highlighted in Figure 5 mirror the differences highlighted in other research.<br />
For example, Mahoney, Harris, and Eccles (2006) used pooled data from the 1997 and 2002<br />
Child Development Survey <strong>of</strong> the PSID to show that children <strong>of</strong> college-educated parents spend<br />
at least three more hours per week on organized activities than children <strong>of</strong> less-educated parents.<br />
H<strong>of</strong>ferth (2008) found an increase in time spent in academic activities from 1997 to 2003.<br />
Lareau’s (2003) ethnographic study, Unequal Childhoods, documents the dramatic differences in<br />
how educated parents raise their children compared to less educated parents. <strong>The</strong> children <strong>of</strong><br />
less-educated parents spend most <strong>of</strong> their free time playing with friends and relatives in their<br />
neighborhood, unsupervised by adults. Lareau calls this the “natural development” approach.<br />
On the other hand, more-educated parents take a “concerted cultivation” approach, which<br />
requires significant commitments <strong>of</strong> parental time:<br />
Children’s activities create substantial work for their parents. Parents fill out enrollment<br />
forms, write checks, call to arrange car pools, wash uniforms, drive children to events,<br />
and make refreshments…. Simply getting ready for an activity – collecting the<br />
equipment, organizing the children, loading the car – can be exhausting…, in addition to<br />
the labor <strong>of</strong> preparing, there is the labor <strong>of</strong> watching. (page 47)<br />
7 One should not infer from these results that pure travel time accounts for most <strong>of</strong> the increase in childcare time.<br />
Total travel time associated with childcare increased by approximately one hour from 1975 to the 2000s.<br />
12
In sum, it appears that college-educated parents with children age 5 or over spend a good deal <strong>of</strong><br />
their time on education and children’s organized activities.<br />
D. Trends in Overall Time Use <strong>of</strong> Mothers<br />
Figure 6 sheds light on the source <strong>of</strong> the extra time devoted to children by mothers. We<br />
have categorized other time expenditures into “work,” “chores,” and “free and personal care<br />
time.” “Chores” include housekeeping, cooking, and shopping. “Free and personal care time”<br />
includes any time not included in the other categories, such as sleeping, personal care time, and<br />
leisure activities. All time use surveys are used and the only controls are the age category. We<br />
have subtracted 65 hours from personal and free care time so that magnitudes are similar.<br />
Work time <strong>of</strong> less-educated mothers increased until the late 1990s, and then fell<br />
somewhat. Work time <strong>of</strong> college-educated mothers increased between 1985 and the mid-1990s,<br />
and then flattened out. Time spent on “Chores” fell steadily over the entire sample for both<br />
education levels. “Free time” for both types <strong>of</strong> mothers fell starting in the mid-1990s. For<br />
college-educated mothers, free time in 2008 was 10 hours less per week than in 1975 and 1985.<br />
Thus, the decline in free time makes up for all <strong>of</strong> the increase in childcare time. In their<br />
discussion, Dan Sacks and Betsey Stevenson point out that college-educated parents are more<br />
likely to do childcare together. This behavior may be the result <strong>of</strong> having so little free time to<br />
spend together.<br />
In sum, the evidence suggests that all time spent in childcare has increased since 1975,<br />
but it increased much more for higher educated parents. Moreover, with the caveats about the<br />
1993 study in mind, it appears that these increases largely occurred within a single 10-year<br />
interval beginning in the mid-1990s, and an important part <strong>of</strong> the rising childcare differential<br />
13
etween college- and less-educated parents was due to travel and activities <strong>of</strong> older children.<br />
<strong>The</strong> trends we highlight are consistent with descriptions from popular publications, such as<br />
Judith Warner’s book Perfect Madness: Motherhood in the Age <strong>of</strong> Anxiety (2005). <strong>The</strong> key<br />
question is, why have educated parents decided to spend their time in this way? <strong>The</strong> next section<br />
will evaluate various possible explanations.<br />
III. Conventional Explanations<br />
As discussed in the Introduction, Bianchi, et al. (2006, p. 87) and others have <strong>of</strong>fered<br />
several potential explanations that could explain a rise in time spent on childcare. We find,<br />
however, that none <strong>of</strong> these explanations is consistent with the evidence.<br />
A. Selection Effects<br />
One possible explanation for this time reallocation involves the declining incidence <strong>of</strong><br />
parenthood over this time period. Since fewer individuals choose to be parents, those who do<br />
choose to be parents might be those persons who enjoy childcare more. This selection effect<br />
could account for the observed trends in childcare hours per week spent by parents.<br />
<strong>The</strong> easiest way to test for selection effects is to see how the results change when the<br />
universe <strong>of</strong> adults is included. To be specific, if selection into parenthood explains the rise in<br />
childcare time, then childcare time averaged over both parents and nonparents (who presumably<br />
spend close to zero time on childcare) cannot rise over time. If anything, childcare time should<br />
decline over time since the number <strong>of</strong> children per adult has declined over time. To test this<br />
argument, we obtained a new set <strong>of</strong> estimates using an expanded sample that included all adults<br />
aged 18-64 who were not students. Results are presented in Figure 7. <strong>The</strong> trends in total<br />
14
childcare and the college differential are clearly present among the general population <strong>of</strong> women;<br />
in particular, the rise in childcare beginning in 1995 continues to be much steeper for college-<br />
education women. Thus, our findings are not an artifact <strong>of</strong> selection into parenthood.<br />
B. Income Effects<br />
A second possible explanation for the increase in childcare time pertains to income<br />
effects. If childcare is a normal good, then increases in income should raise the time spent in<br />
childcare. However, since most income increases are from wages, the substitution effect works<br />
in the opposite direction. <strong>The</strong> case is analogous to leisure, which has not risen by much over the<br />
last century, despite a dramatic rise in real wages, because income and substitution effects cancel<br />
each other. Thus, the theoretical prediction for an increase in wages on childcare time is<br />
ambiguous.<br />
We <strong>of</strong>fer two types <strong>of</strong> evidence against income effects as a potential explanation. We<br />
first analyze the cross section relationship between time spent on childcare and income and then<br />
use the estimates to determine whether they can explain the time series trends. According to our<br />
time use surveys, average real household income in households with children rose by $25,902<br />
from about $72,706 in 1975 to $98,608 in 2008 (in $2008). Thus, real income rose by about 36<br />
percent from 1975 to 2008.<br />
We pooled the BLS surveys from 2003-2008 and focused on parents. We used real<br />
household income in thousands <strong>of</strong> 2008 dollars. <strong>The</strong> online data appendix contains more details<br />
on how we constructed income. In the regressions, we controlled for year fixed effects, age<br />
category dummy variables, dummy variables for education (high school dropouts, college<br />
graduates, and those with a graduate degree), the full set <strong>of</strong> dummy variables for the age <strong>of</strong><br />
15
youngest child, a quadratic in the number <strong>of</strong> children, and marital status. It is important to<br />
include controls for education because we do not want to attribute to income effects what are<br />
actually the effects <strong>of</strong> education itself on childcare. Less than 20 percent <strong>of</strong> the variation in<br />
income is explained by the education controls.<br />
An unobserved preference for spending time with children could lead parents to spend<br />
less time working and spend more time with children, resulting in a negative correlation between<br />
income and time spent with children. Thus, in some specifications we also included controls for<br />
usual hours <strong>of</strong> work <strong>of</strong> the respondent as well as the spouse. Also, in order to try to estimate the<br />
pure income effect <strong>of</strong> childcare, we show results where the sample is limited to just nonworking<br />
mothers.<br />
We consider a quadratic in income. Table 2 shows that while a number <strong>of</strong> the income<br />
coefficients are statistically different from zero, all <strong>of</strong> them are miniscule in terms <strong>of</strong> economic<br />
impact. <strong>The</strong> fourth column uses the estimated cross-sectional coefficients combined with the<br />
actual change in income from 1975 to 2008 to see how much <strong>of</strong> the increase in childcare could<br />
have been induced by an increase in real income. Every number in the column is a mere fraction<br />
<strong>of</strong> an hour. Particularly damaging to the income hypothesis is the fact that the pure income<br />
effects for nonworking mothers are very small. Thus, for the set <strong>of</strong> mothers who decide not to<br />
work, household income has a very small effect on time spent in childcare after controlling for<br />
the mother’s education. Thus, the cross-sectional evidence implies that income cannot explain<br />
the increase in childcare. 8<br />
<strong>The</strong> time series behavior <strong>of</strong> time spent in childcare also contradicts the income hypothesis<br />
because the time trends do not match. We demonstrate this by comparing the trends in<br />
8 We find similarly small coefficient estimates if we instead use earnings as Kimmel and Connelly (2007) did. In his<br />
discussion, Hurst shows a positive correlation between childcare time and GDP across countries. We suspect that<br />
this correlation is due to educational differences rather than income differences.<br />
16
household income with childcare time. In order to make comparisons to published tabulations <strong>of</strong><br />
trends in household income from the Census, we focus on households with married parents.<br />
According to our time use data, for both married mothers and fathers (<strong>of</strong> any education level),<br />
time spent on childcare was flat or slightly decreasing through 1985. It began to rise in the early<br />
1990s, increasing by almost seven hours a week for mothers and 4.5 hours per week for fathers<br />
by the mid-2000s. In contrast, inflation-adjusted median household income for married parents<br />
grew at approximately the same annual rate from 1969 to 1990 as it did from 1990 to 2008, just<br />
over one percent per year. 9 If income were the driving force, we would expect childcare time to<br />
have risen from 1965 to 1990. In fact, it did not.<br />
In sum, neither the cross-section evidence nor the time series evidence provides any<br />
support for the hypothesis that rising incomes can explain the pattern <strong>of</strong> trends in childcare.<br />
C. Safety Concerns<br />
Bianchi, et al. (2006) suggest that heightened concerns about safety may induce parents<br />
to accompany their children in their activities and to substitute structured activities for the free,<br />
unaccompanied play on neighborhood streets that was the norm in earlier times. This<br />
explanation is problematic for two reasons. First, the violent crime rate rose from 200 (per<br />
100,000 population) in 1965 to a peak <strong>of</strong> 758 in 1991, and then began declining again (U.S.<br />
Census, 2010 Statistical Abstract, Historical Statistics, HS-23,) reaching 467 in 2007. Thus, the<br />
violent crime rate moves negatively with time spent in childcare, which is contrary to the<br />
hypothesis <strong>of</strong> a positive crime-childcare link. Second, educated parents tend to live in safer<br />
neighborhoods than less educated parents. Thus, if this explanation were important, then we<br />
9 <strong>The</strong> data appendix discusses the data sources.<br />
17
would expect the educated parents to spend less time on childcare, which is inconsistent with the<br />
evidence.<br />
Of course, what matters is parents’ perceptions <strong>of</strong> safety. However, the evidence<br />
suggests that parents now worry less about numerous safety issues. Safe Kids USA (2008)<br />
reported the results <strong>of</strong> Harris polls in 1987 and 2007, which asked parents about their major<br />
concerns about raising kids. Among the categories were concerns about children being involved<br />
in accidents, kidnapped by strangers, influenced adversely by friends, and exposed to street<br />
drugs. In every case, parents were significantly less concerned in 2007 than they were in 1987<br />
(Safe Kids USA (2008), page 9). Thus, trends in safety perceptions cannot be the source <strong>of</strong><br />
trends in time spent in childcare.<br />
D. Enjoyment<br />
A fourth possible explanation is that parents now experience greater enjoyment from<br />
childcare. However, measures <strong>of</strong> enjoyment do not indicate rising enjoyment <strong>of</strong> most types <strong>of</strong><br />
childcare. Robinson and Godbey (1999) report enjoyment ratings for various activities from the<br />
1985 survey. In this survey, which covered both men and women, basic childcare ranked below<br />
work and cooking, but above housework. Krueger, Kahneman, Schkade, Schwarz, and Stone<br />
(2007) report measures <strong>of</strong> enjoyment <strong>of</strong> various activities by women in 2004 and 2005.<br />
According to their Table 8.3, basic childcare ranked below both cooking and housework. Thus,<br />
there is no evidence that basic childcare has become more pleasant. Additional evidence against<br />
the increased enjoyment hypothesis is the lack <strong>of</strong> an increase in the fertility rate or in family size:<br />
if parents now enjoy childcare much more than in earlier years, one would expect them to choose<br />
to have more children.<br />
18
One caveat is that playing with children has always ranked highly in terms <strong>of</strong> enjoyment.<br />
We have followed the standard practice <strong>of</strong> including these activities in our measure <strong>of</strong> childcare<br />
because they are <strong>of</strong>ten considered to be crucial activities for investment in children’s human<br />
capital. However, it might alter the interpretation <strong>of</strong> the results if one believes that the increase<br />
in childcare time is simply a redirection <strong>of</strong> time from one high enjoyment activity to another.<br />
To investigate this possibility, we re-estimated the regressions for the subsample <strong>of</strong><br />
parents, excluding time spent playing with children from our measure <strong>of</strong> childcare. Only<br />
parents’ ages are used as controls. <strong>The</strong> results for mothers are shown in the first two columns <strong>of</strong><br />
Table 3. Column 1 reproduces the first column <strong>of</strong> Table 1, while column 2 gives the results<br />
using the restricted childcare variable. By comparing the columns, one can see that omitting<br />
playing with children reduces the amount <strong>of</strong> the increase by about one hour for less-educated<br />
mothers, and by about three hours for college-educated mothers. Nevertheless, most <strong>of</strong> the<br />
increase over time and across education levels remains even when playing with children is<br />
omitted. <strong>The</strong> results are similar for fathers, as seen in columns 3 and 4.<br />
E. More Flexible Work Schedules<br />
Yet another possible explanation is that parents now have more flexible work schedules,<br />
and can thus reallocate their time in a way that allows them to spend more time with their<br />
children even when they are working. Unfortunately, we do not have measures <strong>of</strong> work schedule<br />
flexibility, either in our time use data or to gauge aggregate trends. However, one implication <strong>of</strong><br />
this hypothesis is that the biggest increases in childcare time should be among working mothers<br />
rather than stay-at-home mothers.<br />
19
To test this implication, we split the sample by work status and re-ran our basic<br />
regressions. <strong>The</strong> reports are reported in Table 4. <strong>The</strong> table shows that the increase in childcare<br />
from 1975 to 2008 is much greater for those mothers who do not work, and that the gap is much<br />
greater across educational levels. One might worry about selection effects since the labor force<br />
participation rate <strong>of</strong> mothers has increased since 1975, which is our usual comparison year.<br />
However, even when we compare to 1985, a year when the labor force participation rate for<br />
college-educated mothers was about the same as in 2008, we find that the increase in childcare<br />
time among college-educated nonworking mothers was around 11 hours per week as compared<br />
to an increase <strong>of</strong> 6.8 hours per week for college-educated working mothers. Thus, some other<br />
factor must have been at play to lead even nonworking mothers to increase their childcare time<br />
so much.<br />
IV. A New Explanation: <strong>The</strong> <strong>Rug</strong> <strong>Rat</strong> <strong>Race</strong><br />
We now <strong>of</strong>fer a new explanation for the trends in time spent in childcare, tied to<br />
increased competition for college admissions, particularly among the college-educated. Our<br />
claim is that increased competition was driven by a steep rise in demand for college admissions<br />
together with a relatively constant number <strong>of</strong> slots at the more attractive colleges. <strong>The</strong> resulting<br />
“cohort crowding” for college admissions gave rise to heightened competition among parents for<br />
attractive slots, manifesting itself in greater time spent on college preparation <strong>of</strong> their children.<br />
This expenditure <strong>of</strong> childcare time in dissipative rivalry may be dubbed the “rug rat race.”<br />
A. Shifts in Demand and Supply for College<br />
20
Empirical trends in demand for college have displayed a remarkable agreement with<br />
trends in time spent on childcare. <strong>The</strong> top panel <strong>of</strong> Figure 8 shows the number <strong>of</strong> high school<br />
graduates each year since 1965. 10 <strong>The</strong> initial large hump is due to the large size <strong>of</strong> the baby<br />
boom generation. <strong>The</strong> number <strong>of</strong> high school graduates fell to a low around 1990, and has since<br />
spiked up as a result <strong>of</strong> the “baby boomlet.” <strong>The</strong> number <strong>of</strong> high school graduates is expected to<br />
peak in 2009 before decreasing again.<br />
<strong>The</strong> second panel <strong>of</strong> Figure 8 indicates the number <strong>of</strong> recent high school graduates who<br />
have enrolled in college. This graph shows a somewhat different pattern because <strong>of</strong> the long-run<br />
upward trend in the propensity for high school graduates to go to college. As the figure reveals,<br />
after declining from 1980 to 1990, this number increased dramatically during the 1990s and,<br />
while fluctuating from year to year, has stayed high through the present. Observe that the path<br />
<strong>of</strong> college enrollment displays the same pronounced S-shaped pattern as does the path <strong>of</strong><br />
childcare time that we estimated previously, shown in Figure 1, with the increases in college<br />
enrollment and childcare time occurring at the same time.<br />
Turning to the supply side, the number <strong>of</strong> slots at the more attractive colleges has not<br />
expanded commensurately with demand. Between 1990 and 2005, total enrollment in college by<br />
recent high school completers increased by 30 percent. In contrast, the number <strong>of</strong> full-time<br />
enrolled freshman increased only 13 percent at the ten elite universities <strong>of</strong> “<strong>The</strong> Ivy Plus” and by<br />
only 10 percent at the top 25 liberal arts colleges. 11 Bound and Turner (2007) show that this<br />
“cohort crowding” phenomenon extends to public institutions as well. Using variation in cohort<br />
size across states, they show that the elasticity <strong>of</strong> undergraduate enrollment with respect to the<br />
10 <strong>The</strong>se data are from the 2007 Digest <strong>of</strong> Education Statistics, Table 191.<br />
11 <strong>The</strong>se numbers are based on our calculations using data extracted from Integrated Postsecondary Education Data<br />
System.<br />
21
age 18 population is well below unity. According to Table 4 <strong>of</strong> their paper, two-year community<br />
colleges have the highest elasticity <strong>of</strong> 0.8, followed by non-flagship public universities with 0.56,<br />
and flagship public universities with an elasticity <strong>of</strong> only 0.2. This evidence indicates that the<br />
number <strong>of</strong> slots becomes much less responsive to enrollment pressure as the quality <strong>of</strong> the<br />
institution increases.<br />
B. Evidence on Competition for College Slots<br />
For the last several years, the popular press has been filled with stories <strong>of</strong> unprecedented<br />
competition for college. Some <strong>of</strong> the perceived increase in competition is simply a statistical<br />
mirage: the average student now applies to more colleges, both because <strong>of</strong> the increased ease <strong>of</strong><br />
filling out applications and the perceived greater uncertainty about getting into a given college.<br />
However, there is ample evidence that part <strong>of</strong> the increase in competition is real. Within the<br />
University <strong>of</strong> California system, average GPAs and test scores <strong>of</strong> admitted students increased<br />
from 1994 to 2007 for seven <strong>of</strong> the eight campuses. 12 <strong>UC</strong> <strong>San</strong>ta Barbara, which ranks 5 th among<br />
the campuses in selectivity, increased the average GPA <strong>of</strong> admitted students by 0.3 points on a<br />
4.0 scale. Bound, et al. (2009) document many other facets <strong>of</strong> the increase in competition. For<br />
example, they show that test scores <strong>of</strong> entering students are higher now, particularly at the top<br />
ranked schools. <strong>The</strong>y also show that the percentage <strong>of</strong> high school graduates applying to a four-<br />
year institution has increased over time. Moreover, they show that the probability <strong>of</strong> acceptance<br />
to a four-year college for a student <strong>of</strong> a given ability has declined significantly since 1982. 13<br />
12 Our calculations are based on data available at www.university<strong>of</strong>california.edu .<br />
13 Hoxby (2009) shows that in the aggregate, test scores <strong>of</strong> students admitted to U.S. colleges fell from the 1960s to<br />
the 1970s and 1980s, and rose again in the last couple <strong>of</strong> decades. She also shows that the colleges with higher test<br />
scores in the 1960s experienced an increase in the test scores <strong>of</strong> admitted students, whereas colleges with lower test<br />
scores in the 1960s experienced a decrease in test scores <strong>of</strong> admitted students. <strong>The</strong>se trends were noted earlier by<br />
the various studies surveyed by Davies and Hammack (2005). Based on this evidence, Hoxby argues that overall<br />
22
Although there are still many colleges that will accept most applicants, there is evidence<br />
to suggest that parents and children have increased the attention paid to selective colleges.<br />
Hoxby (1997) documents that the market for higher education has changed from a collection <strong>of</strong><br />
local markets to a nationally integrated market. Hoxby (2009) surveys the evidence and<br />
concludes that there are higher returns to attending a more selective college. According to the<br />
International Herald Tribune (May 16, 2007), “the preoccupation with the top universities, once<br />
primarily a phenomenon in the Northeastern United States, has become a more countrywide<br />
obsession.” Observers note that college admissions anxiety has spread to the Midwest and Sun<br />
Belt, where enrollment in SAT/ACT prep classes has grown more than seven times the overall<br />
national growth rate over the last five years (Justin Pope (AP) October 22, 2006). In its annual<br />
report, State <strong>of</strong> College Admission, the National Association for College Admission Counseling<br />
(2008) documents that the group <strong>of</strong> 257 four-year colleges that accept fewer than 50 percent <strong>of</strong><br />
applicants receive 31 percent <strong>of</strong> all applications (Table 6, page 18).<br />
Numerous other disciplines, such as developmental psychology, pediatrics, and<br />
sociology, have drawn an explicit link between competition for college slots and the increase in<br />
time devoted to academics and extracurricular activities. For example, Luthar and Becker (2002)<br />
and Lareau (2003) argue that many middle- and upper middle-class parents see building up their<br />
children’s “after-school resumes” as absolutely necessary because <strong>of</strong> the competition for college<br />
admission. <strong>The</strong> American Academy <strong>of</strong> Pediatrics (Ginsburg (2007)) cites the increase in<br />
college selectivity has not increased. Moreover, Hoxby bases her argument entirely on standardized test scores, as<br />
opposed to the controlled experiment run by Bound, et al (2009). Her analysis further neglects the wide-spread<br />
belief that colleges now put greater emphasis on “extra-curricular activities.”<br />
23
competition in college admissions as a key reason for the decrease in free play time and increase<br />
in scheduled activities among children nationwide. 14<br />
Perhaps the most direct evidence for our hypothesis is presented by Levey (2009). Her<br />
study asks the question: “What explains the increase in children’s participation in activities<br />
outside <strong>of</strong> the home, structured and monitored by their parents, when family time is so scarce?”<br />
(Levey (2009), p. i) After 16 months <strong>of</strong> fieldwork involving 172 interviews <strong>of</strong> middle and<br />
upper-middle class parents, children, coaches, and teachers, Levey concludes that parents believe<br />
that extracurricular activities are essential for obtaining credentials for their children, in order to<br />
gain admittance to “good” colleges which are seen as necessary and sufficient conditions for<br />
their children’s future economic welfare. She specifically notes parents’ perceptions <strong>of</strong> the<br />
increased competition to get into college and the “race towards college admissions.” (Levey<br />
(2009), p. 11)<br />
C. <strong>The</strong>oretical Model <strong>of</strong> the <strong>Rug</strong> <strong>Rat</strong> <strong>Race</strong><br />
<strong>The</strong> evidence is consistent with the idea that an increase in rivalry for scarce college slots<br />
has induced parents to raise the time they spend preparing their children for college. In this<br />
section we develop a simple theoretical model that shows how shifts in the demand and supply<br />
for college, <strong>of</strong> the sort documented above, can account for the observed behavior <strong>of</strong> childcare<br />
hours based on rivalry for college slots. <strong>The</strong> model is able to link the coincident S-shaped<br />
patterns <strong>of</strong> childcare hours and college demand, as seen in Figures 1 and 8, respectively.<br />
Our model posits that parents compete for college slots by investing in their children’s<br />
college preparation. Each parent is assumed to have a single child. Parent’s schooling may be<br />
14 An ongoing debate among child development experts asks whether the dramatic increase in extracurricular<br />
activities helps or hurts children. See, for example, Rosenfeld, Wise, and Coles (2001) and Mahoney, et al. (2006).<br />
24
either college- or less-educated, represented by c and l, respectively. <strong>The</strong> numbers <strong>of</strong> college-<br />
and less-educated parents are denoted by and , respectively, and gives the<br />
m m m + =<br />
total number <strong>of</strong> parents. Children’s college attendance is restricted by the availability <strong>of</strong> slots.<br />
We assume that there are k slots available at first-tier colleges, and m slots available at<br />
second-tier colleges, where<br />
1<br />
mc l m c l<br />
1 + k m < m . <strong>The</strong> demographic shifts <strong>of</strong> Figure 8 are modeled as<br />
k 2<br />
an increase in the parameters and . When this occurs, college slots become scarcer<br />
m<br />
mc l<br />
overall, and the first-tier slots become relatively scarcer, in line with the evidence.<br />
We assume that a child’s preparation for college depends on her parent’s time spent in<br />
childcare, denoted by h. <strong>The</strong> college admissions process operates as follows. Parents<br />
simultaneously choose h, and colleges observe the values <strong>of</strong> h for each child. <strong>The</strong> colleges then<br />
fill their slots in descending order <strong>of</strong> h. This acceptance rule may be rationalized in a number <strong>of</strong><br />
ways. For example, children may contribute a proportion <strong>of</strong> their wealth, which increases in h,<br />
to their alma maters, and admissions decisions may be made in order to maximize total<br />
contributions. Since first-tier slots are most valuable, they will be filled first. In equilibrium, a<br />
threshold will exist such that children with are accepted to first-tier colleges, and there<br />
h h ≥<br />
h1 1<br />
are exactly such children. <strong>The</strong> second-tier slots are filled next: there is a threshold such h<br />
k1 2<br />
that children with , ) , numbering , are accepted to second-tier colleges. Finally, the<br />
h h ∈ m<br />
[ 2 1 h<br />
remaining k k m children with h < do not attend college.<br />
k 2<br />
m 1 2 − − 2 h<br />
If a child goes to college, her ultimate wealth is given by wqh , where w > 1 reflects the<br />
college wage premium and q reflects the quality <strong>of</strong> the college attended by the child. <strong>The</strong><br />
parameter q is meant to capture both pecuniary and psychic benefits from college attendance.<br />
For example, parents may value the prestige <strong>of</strong> sending their children to more elite institutions.<br />
25<br />
k 2
Moreover, q may change over time across all quality levels, reflecting generalized changes in the<br />
value <strong>of</strong> a college education. Let and denote the quality parameters for first- and second-<br />
q<br />
q1 2<br />
tier colleges, respectively, where q > q > 0 . If a child does not attend college, then wealth is<br />
assumed to be h , where q > q > 0.<br />
q 0<br />
2<br />
0<br />
1<br />
2<br />
Parents choose h to maximize their children’s wealth net <strong>of</strong> their own disutility. A less-<br />
educated parent incurs a disutility <strong>of</strong> (h)<br />
from choosing h, while a college-educated parent<br />
incurs (h)<br />
; note that a rise in w leads to greater disutility for the college-educated. <strong>The</strong><br />
wd c<br />
disutility functions satisfy, for<br />
d l<br />
s = l,<br />
c , d , ′<br />
> 0 , 0 ) 0 ( ) 0 ( = ′ d d and d ′ ( ∞)<br />
= ∞ .<br />
′ s s d<br />
Moreover, we assume that college-educated parents incur lower marginal disutility in the<br />
absence <strong>of</strong> a wage premium, i.e., ′ ( h)<br />
< d′<br />
( h)<br />
. 15<br />
d c<br />
l<br />
<strong>The</strong> objective function <strong>of</strong> a less-educated parent is − d (h)<br />
. For a college <strong>of</strong> quality<br />
s<br />
= s<br />
wqh l<br />
*<br />
q, the unconstrained optimal level or preparation, hl ( q)<br />
, is determined by<br />
′ ( h ( q))<br />
= qw<br />
*<br />
.<br />
d l l<br />
For a college-educated parent, the objective function is − wd (h)<br />
, and the unconstrained<br />
*<br />
optimal preparation level, hc ( q)<br />
, satisfies<br />
′ ( h ( q))<br />
= q<br />
*<br />
.<br />
d c c<br />
wqh c<br />
<strong>The</strong> effect <strong>of</strong> parent’s schooling on optimal preparation time is considered in Figure 9.<br />
For less-educated parents, the optimal decision occurs at point A, where the marginal return wq<br />
equals the marginal disutility d ′ l . A parent’s college education shifts the marginal disutility<br />
15<br />
Instead <strong>of</strong> assuming differences in marginal disutility across education levels, the model could specify college<br />
preparation as an increasing function <strong>of</strong> childcare hours, (h)<br />
, s = c,n, where an hour spent by a college educated<br />
p s<br />
parent has a higher productivity effect, so that pc ( h)<br />
> pl<br />
( h)<br />
. This would yield the same comparative advantage for<br />
college-educated parents in preparing their children for college.<br />
26<br />
s
locus down to d ′ . This captures a productivity effect in preparing children for college.<br />
c<br />
Countering this is an opportunity cost effect, whereby a given quantity <strong>of</strong> time commands a<br />
higher market wage. <strong>The</strong> marginal return to preparation, adjusted for opportunity cost, drops to<br />
q, and the optimal decision occurs at point B. We assume that the productivity effect dominates<br />
*<br />
*<br />
the opportunity cost effect, so that ( q)<br />
> h ( q)<br />
holds for every level <strong>of</strong> q. Thus, college-<br />
hc l<br />
educated parents have a comparative advantage in investing in college preparation.<br />
We first consider the case in which m is small, in the sense that there are sufficiently<br />
many first-tier slots to accommodate the children <strong>of</strong> college-educated parents. Proposition 1 <strong>of</strong><br />
the <strong>The</strong>oretical Appendix characterizes the outcome for the case <strong>of</strong> mc < k . In equilibrium,<br />
college-educated parents exploit their comparative advantage in college preparation to get their<br />
children into first-tier colleges. <strong>The</strong> children <strong>of</strong> less-educated parents take up the remaining first-<br />
tier slots along with all <strong>of</strong> the second-tier slots. <strong>The</strong> acceptance thresholds and make the h<br />
latter parents just indifferent between first-tier, second-tier and no college. <strong>The</strong> thresholds are<br />
distorted upwards relative to the corresponding unconstrained optimal preparation levels<br />
*<br />
and hl q ) , reflecting rivalry among these parents for scarce slots.<br />
( 2<br />
c<br />
1<br />
h1 2<br />
*<br />
hl ( q1)<br />
Now suppose that m rises to the point where there are too few first-tier slots for the<br />
c<br />
children <strong>of</strong> college-educated parents. As shown in Proposition 2 <strong>of</strong> the <strong>The</strong>oretical Appendix,<br />
once mc > k the focus <strong>of</strong> rivalry shifts from less-educated to college-educated parents. <strong>The</strong><br />
1<br />
children <strong>of</strong> the less-educated are driven completely from the first tier, as the acceptance threshold<br />
h1<br />
jumps to a level that makes the college-educated parents indifferent between the first and<br />
second tiers. This new level is distorted upwards relative to unconstrained optimal preparation,<br />
27
*<br />
hc ( q1)<br />
. In this way, the change in the competition for college slots is directly linked to the<br />
increase in childcare hours among college-educated parents.<br />
Figure 10 illustrates the time paths <strong>of</strong> college preparation choices when and rise m<br />
gradually, with mc = k occurring at time T. We interpret T as corresponding to a point <strong>of</strong> time<br />
in the mid 1990s. <strong>The</strong> wage premium w is also assumed to rise over time, leading to gradually<br />
increasing paths <strong>of</strong> and .<br />
1<br />
mc l<br />
h1 2 h 16 Prior to T, the growth <strong>of</strong> mc<br />
gradually squeezes the children <strong>of</strong><br />
less-educated parents out <strong>of</strong> the first-tier colleges, shifting their parents’ preparation choices<br />
from to . <strong>The</strong> average level nevertheless increases if the growth <strong>of</strong> w is sufficiently rapid.<br />
h<br />
h1 2<br />
*<br />
<strong>The</strong> preparation choices <strong>of</strong> college-educated parents also rise if > h q ) . At time T the latter<br />
parents jump to a discretely higher level <strong>of</strong> college preparation, while the choices <strong>of</strong> the less-<br />
h2 17<br />
educated continue to rise with .<br />
h1 c ( 1<br />
<strong>The</strong> model shows how rivalry for ever-scarcer slots can fuel a rug rat race among parents,<br />
where rivalry is manifested in higher college preparation requirements. Following a sharp<br />
increase in demand for college slots, rivalry among the college-educated parents intensifies<br />
greatly, driving up their time spent in childcare relative to that <strong>of</strong> the non-college-educated. This<br />
matches the coincident S-shaped patterns <strong>of</strong> childcare and college demand seen in the U.S.<br />
data. 18<br />
16<br />
<strong>The</strong> increasing paths and could also be induced by a rise over time in the college quality parameters q and<br />
q 2<br />
h1 h2 1<br />
, due to greater psychic benefits, for example.<br />
17 <strong>The</strong> segment <strong>of</strong> the tier 1 acceptance threshold following time T is flat because we have assumed that changes in<br />
the wage premium have exactly <strong>of</strong>fsetting effects on the costs and benefits <strong>of</strong> preparation by college-educated<br />
parents. Thus, the wage premium does not affect their preparation incentives.<br />
18 Akerl<strong>of</strong> (1976) introduced the first “rat race” model in economics. In his model, imperfect information causes<br />
workers to work faster in order to signal their underlying ability. In our model, there is perfect information, but the<br />
scarcity <strong>of</strong> college slots causes parents to exert greater preparation effort in order to capture slots for their children.<br />
In other words, our model is based on rivalry, rather than signaling.<br />
28
D. A Comparison <strong>of</strong> Trends in the U.S. and Canada<br />
Our theory links changes in childcare hours to rivalry for scare college slots. This rivalry<br />
is tied in turn to competitive admissions procedures used at U.S. colleges. <strong>The</strong> theory would<br />
predict a different path <strong>of</strong> hours in a country such as Canada, where college admissions are<br />
determined in a much less rivalrous fashion. Thus, as a test <strong>of</strong> our theory, we compare trends in<br />
childcare in the U.S. and Canada.<br />
<strong>The</strong> comparison <strong>of</strong> these two countries is ideal for our purposes. Because <strong>of</strong> geographic<br />
proximity and similarity <strong>of</strong> language and culture, we would expect that changes in childcare time<br />
caused by such broad factors as knowledge diffusion and social fads to affect both countries<br />
similarly. However, these two countries differ significantly in the nature <strong>of</strong> competition in<br />
higher education.<br />
Davies and Hammack (2005) document the similarities and differences in higher<br />
education between the U.S. and Canada. <strong>The</strong> countries are similar in that just over 60 percent <strong>of</strong><br />
high school graduates in both countries pursue a postsecondary education. Both higher<br />
education systems have decentralized governance and both have experienced similar patterns <strong>of</strong><br />
rising enrollment and increased scarcity <strong>of</strong> college slots.<br />
However, as Davies and Hammack document, the nature <strong>of</strong> the competition in the two<br />
countries is very different. <strong>The</strong>y argue that while the Canadian system consists <strong>of</strong> formally equal<br />
public universities, the U.S. system is distinguished by a steep prestige hierarchy <strong>of</strong> higher<br />
education, and that this national hierarchy leads to a distinctive form <strong>of</strong> competition that has<br />
increased over the last decade. In contrast, there is no national market in Canada; few<br />
Canadians go to college outside their home province. Thus, it is not surprising that there is no<br />
29
Canadian equivalent to the SAT and that extra-curricular activities are irrelevant for admission to<br />
Canadian colleges. Instead, competition in Canada occurs within the post-secondary system<br />
itself and takes the form <strong>of</strong> competition to enter lucrative majors. Davies and Hammack argue<br />
“Where one studies is seen as more important in the U.S., while what one studies dominates in<br />
Canada.” In fact, many Canadian college students who cannot get into their desired programs at<br />
4-year colleges <strong>of</strong>ten transfer to community colleges in order to pursue their desired field.<br />
<strong>The</strong> lower competition to secure slots within the hierarchy <strong>of</strong> colleges suggests that there<br />
should be less pressure on educated Canadian parents to invest time in preparing their children to<br />
get into college as slots become scarcer. We test this prediction by studying trends in childcare<br />
in Canada.<br />
To this end, we use microdata from the 1986 (cycle 2), 1992 (cycle 7), 1998 (cycle 12)<br />
and 2005 (cycle 19) <strong>of</strong> the Time Use Survey from Canada’s General Social Survey (Statistics<br />
Canada) to construct trends in childcare time by education level. 19 However, there was a<br />
significant break in a definition between the two earlier surveys and the two later surveys. In<br />
particular, the two earlier surveys counted as childcare any care <strong>of</strong> children between the ages <strong>of</strong> 0<br />
and 18. In the two later surveys, it counted as childcare any care <strong>of</strong> children between the ages <strong>of</strong><br />
0 and 14. Using the standard childcare variables would therefore bias down the trends over time.<br />
We use total family care (children and adults) as the most consistent measure. <strong>The</strong> online data<br />
appendix shows that the change implied by this measure lies between the lower bound using the<br />
available childcare variable and the upper bound based on some imputations we made.<br />
19 We used the Statistics Canada microdata file <strong>of</strong> the 4 cycles, which contain anonymized data. All computations<br />
on these microdata were prepared by Nova Scotia <strong>Department</strong> <strong>of</strong> Finance and the responsibility for the use and<br />
interpretation <strong>of</strong> these data is entirely that <strong>of</strong> the authors. We are deeply grateful to Tarek Harchaoui for obtaining<br />
access to the data for us.<br />
30
Otherwise, we analyze the data similarly to the way we analyzed the U.S. data. We<br />
estimate the same baseline regressions as before, controlling for the age group <strong>of</strong> the parent and<br />
interacted year and education variables. 20<br />
Table 5 and Figure 11 show the results. Columns (1) and (3) <strong>of</strong> Table 5 show the results<br />
with baseline controls whereas columns (2) and (4) show the results in which controls for marital<br />
status and the age group <strong>of</strong> the youngest child. Figure 11 plots the results for the baseline<br />
regressions. We have normalized the hours to be zero in the base year in each country, 1985 in<br />
the U.S. and 1986 in Canada.<br />
Figure 12 shows that time spent in childcare by less educated parents increased by about<br />
the same amount in both countries, about four to five hours per week for mothers and about three<br />
hours per week for fathers since the mid-1980s. <strong>The</strong> contrast is in time spent by college-<br />
educated parents. Whereas time spent by college-educated mothers rose by nine hours per week<br />
in the U.S., it rose by only one hour per week in Canada. For college-educated fathers, the<br />
increase in the U.S. was six hours per week and the increase in Canada was two hours per week.<br />
Thus, as our theory would predict, Canada did not mirror the big increases in time by educated<br />
parents. In fact, the educational gap in childcare time grew in the U.S., but shrank in the Canada.<br />
Our findings are broadly consistent with other analyses <strong>of</strong> trends in the Canadian data.<br />
Pronovost (2007) finds that the amount <strong>of</strong> time that parents spent in the presence <strong>of</strong> their children<br />
fell from 1986 to 2005. Turcotte (2008) similarly finds a decrease in time spent with family<br />
members over the period 1986 to 2005.<br />
20 Because <strong>of</strong> data limitations in some <strong>of</strong> the years, the youngest age category includes those ages 20-24 rather than<br />
18-24 as in the U.S. data.<br />
31
E. Comparisons by Ethnic Groups in the U.S.<br />
As an additional test <strong>of</strong> our theory, we compare childcare time across ethnic groups. One<br />
group in the U.S. that should not have felt as much increased competition to enter college is<br />
underrepresented minorities. 21 Despite the overall increase in applicants, most colleges are still<br />
eager to admit underrepresented minorities.<br />
Unfortunately, we cannot compare trends over time because the samples before 2003<br />
were too small to allow a meaningful distinction across racial groups, particularly by education<br />
level. Instead, we make a cross-section comparison using pooled 2003-2008 data and estimate<br />
regressions separately on less-educated and college-educated groups. We include the full set <strong>of</strong><br />
controls as well as a control for high school dropouts (within the less educated group) and<br />
graduate degrees (within the college educated group) because <strong>of</strong> potential differences across<br />
racial groups.<br />
Table 7 shows that among less-educated mothers, black and Hispanic mothers spend<br />
about three hours less per week than other mothers. Among college-educated mothers, black<br />
mothers spend three hours less and Hispanic mothers spend about two hours less than other<br />
mothers. Among less-educated fathers, black and Hispanic fathers spend 1.5 to 1.9 hours less<br />
than other fathers. Among college-educated fathers, black fathers spend half an hour less<br />
whereas Hispanic fathers spend two hours less. Thus, the results are consistent with our<br />
hypothesis that underrepresented minorities feel less pressure to compete for college slots and<br />
hence spend less time in childcare.<br />
F. Correlations with Competitiveness Measures across States in the U.S.<br />
21 We are indebted to Daniel Hamermesh for suggesting this test to us.<br />
32
While national integration <strong>of</strong> the U.S. college market has increased, regional factors still<br />
play an important role in determining competition for college. Bound, Hershbein, and Long<br />
(2009), using their new index <strong>of</strong> college competition by state, provide evidence that both levels<br />
and trends <strong>of</strong> competition vary across states. As a further test <strong>of</strong> our theory, we can use this<br />
index to test whether greater college competition at the state level is associated with greater<br />
hours <strong>of</strong> childcare among college-educated parents who live in the state. Here we interpret our<br />
theory as applying to state-level college markets.<br />
Ideally, we would compare trends in childcare by state over time to changes in the index<br />
over time. Unfortunately, the time use surveys before 2003 are too small to provide information<br />
by state. Thus, we make cross-state comparisons using the later surveys. To construct childcare<br />
time by state, we use pooled data from the 2003-2008 surveys to estimate state-level childcare<br />
time measures by education and sex, controlling for the full set <strong>of</strong> parent age, marital status, and<br />
child number and age variables. <strong>The</strong> Bound et al. (2009) index <strong>of</strong> competitiveness by state is<br />
constructed by summing the following variables at the state level: PSAT participation rates, AP<br />
participation rates, fraction <strong>of</strong> students reporting 10+ homework hours per week, the fraction<br />
applying to 5 or more colleges, and the fraction using private test preparation in 2004.<br />
Table 8 shows the results <strong>of</strong> regressing state childcare time on the Bound et al index <strong>of</strong><br />
competitiveness. Three <strong>of</strong> the four coefficients suggest a positive correlation, and the coefficients<br />
for both less-educated and college-educated mothers are significantly positive, consistent with<br />
our hypothesis. Figure 12 shows the scatter plot. South Dakota has the lowest index <strong>of</strong> college<br />
competitiveness in 2004 and Connecticut has the highest. College-educated mothers spend an<br />
average <strong>of</strong> 13.2 hours per week on childcare in South Dakota (after controlling for family size<br />
and age characteristics) and 18.6 hours in Connecticut. According to the regression coefficient,<br />
33
3 hours <strong>of</strong> the difference may be related to the differential college competitiveness. Thus, for<br />
mothers there is evidence that greater college competitiveness at the state level is associated with<br />
greater time spent on childcare.<br />
G. Discussion<br />
Our theoretical model and empirical evidence emphasize the role <strong>of</strong> college preparation<br />
as a motive for childcare. According to this view, parents recognize the link between college<br />
attendance and the value <strong>of</strong> human capital, and they exert effort, in the form <strong>of</strong> childcare time, to<br />
influence their children’s college outcomes. As we have shown, numerous studies from other<br />
disciplines have made this link. Moreover, the additional evidence we have presented is<br />
consistent with the idea that greater scarcity <strong>of</strong> desirable college slots has induced strong<br />
increases in childcare effort by parents who possess a comparative advantage in college<br />
preparation, i.e., college-educated parents.<br />
One question is whether this factor alone can explain the magnitude <strong>of</strong> the increase. It is<br />
possible that the rise in competition for college slots, triggered by the increase in college-eligible<br />
population, provided the underlying impulse, but that other forces worked to amplify it. For<br />
example, if a subset <strong>of</strong> parents in a neighborhood get caught up in the “rug rat race” and enroll<br />
their children in multiple organized activities, other families with less concern about college<br />
competition might decide to follow suit simply because there are fewer children available for<br />
unstructured play in the neighborhood. One could also envision models with “social contagion”<br />
that serve to amplify the effects.<br />
From a broader perspective, any factors that alter the returns to college may enter<br />
parents’ calculations, and thus have the potential to affect childcare decisions. Changes in the<br />
34
college wage premium, in particular, may have an important influence on college preparation<br />
incentives. Figure 13 depicts the evolution <strong>of</strong> the college wage premium, measured as the log<br />
difference between wages <strong>of</strong> college and high school graduates, in the U.S. over the last half<br />
century; the data are from Autor, Katz, and Kearney (2008). While the wage premium has risen<br />
steadily since the early 1980s, the rate <strong>of</strong> increase has slowed: the average annual change fell<br />
from 1.3 percent from 1980 to 1990 to 0.85 per year from 1990 to 2005. <strong>The</strong> path <strong>of</strong> the wage<br />
premium does not closely fit the S-shaped pattern <strong>of</strong> childcare hours for any <strong>of</strong> the four groups<br />
depicted in Figure 1, even after adjusting for possible downward bias in the 1992-94 time use<br />
survey. Importantly, it seems very difficult to rationalize the sharp upward movements in<br />
childcare hours <strong>of</strong> college-educated parents in the beginning in the mid-1990s as a response to<br />
the much smoother secular upward trend <strong>of</strong> the college wage premium.<br />
<strong>The</strong> Canadian evidence provides further perspective on the role <strong>of</strong> the wage premium.<br />
Boudarbat, Lemieux, and Riddell (2006) show that between 1980 and 2000 the wage premium <strong>of</strong><br />
a college degree relative to a high school degree in Canada rose by about 10 percentage points<br />
for men and 5 percentage points for women. This contrasts with an average rise over both sexes<br />
<strong>of</strong> 25 percentage points in the U.S. over the same period (Autor, et al. (2008)). Thus, the returns<br />
to college have increased much more in the U.S. However, as seen in Figure 11, childcare hours<br />
for less-educated parents display very similar behavior across the two countries over this period.<br />
Moreover, these parents ought to be most sensitive to changes in the wage premium, since<br />
college-educated parents experience a relatively greater increase in the opportunity cost <strong>of</strong><br />
childcare time as the wage premium rises. In summary, the evidence does not point to changes<br />
in the college wage premium as an important factor for explaining the behavior <strong>of</strong> childcare<br />
hours.<br />
35
Nonpecuniary benefits <strong>of</strong> college, such as prestige or general “well-roundedness,” may<br />
also have important effects on parents’ calculations. <strong>The</strong> increased focus on selective colleges<br />
that we discuss above may reflect changes in social attitudes that have raised the relative demand<br />
for prestigious institutions. This motivation is complementary to our rivalry theory: there are<br />
more children chasing a relatively constant supply <strong>of</strong> desirable college slots, and these slots may<br />
have themselves become relatively more desirable.<br />
It is possible to imagine a plethora <strong>of</strong> alternative theories based on various parental<br />
motivations for investing time in children in order to increase their general human capital. To<br />
be persuasive, such theories must be capable <strong>of</strong> accounting for the key aspects <strong>of</strong> the evidence<br />
that we highlight. (i) Timing: weekly hours spent in childcare follow a pronounced S-shaped<br />
pattern, with almost all <strong>of</strong> the growth concentrated in a 10-year period. (ii) Composition: the<br />
increase in hours is much greater for college-educated parents. It is also comprised chiefly <strong>of</strong><br />
increases in time spent caring for older children, travel and activities, which are the categories<br />
that relate most directly to the college application process. (iii) U.S.-Canada comparison: the<br />
hours increase for college-educated parents is not observed in Canada, despite the similarity <strong>of</strong><br />
its economic and cultural environment to that <strong>of</strong> the U.S. 22 <strong>The</strong>ories that rely on forces that<br />
unfold broadly and gradually will not easily explain this evidence.<br />
V. Conclusion<br />
This paper has documented a dramatic increase in time spent in childcare by college-<br />
educated parents since the mid-1990s. While time spent in childcare rose for all parents, the rise<br />
was far more pronounced for college-educated parents. Since the mid-1990s, less-educated<br />
22 For example, Stevenson (2010) shows that participation in sports raises educational attainment and wages, but we<br />
are not aware <strong>of</strong> any evidence suggesting that the return to sports or other organized activities has increased over<br />
time.<br />
36
mothers have reallocated over four hours per week to childcare. College-educated mothers have<br />
reallocated more than nine hours per week from leisure time to childcare time. This reallocation<br />
occurred at the same time that competition to get into college intensified, as demographic forces<br />
led to a surge in the demand for college slots. In contrast, time spent in childcare by educated<br />
parents in Canada, where college competition is much lower, has changed very little over this<br />
period.<br />
We have explained these trends using a model in which the rise in time devoted to<br />
childcare is the optimal response to the increase in rivalry for scarce college slots. We postulate<br />
that college-educated parents have a comparative advantage in preparing their children for<br />
college, which they exploit to get their children into the most attractive colleges. When slots are<br />
plentiful relative to demand, the required amount <strong>of</strong> child preparation is relatively low.<br />
However, when demand rises, rivalry among the college-educated parents drives the required<br />
preparation upwards.<br />
In this paper we have focused on explaining observed trends in time use, but our results<br />
also have implications for socially efficient time allocation. To the extent that the private costs<br />
and benefits <strong>of</strong> college preparation reflect social costs and benefits, the rivalry for college slots<br />
implies wasteful overinvestment in preparation. Overinvestment may be mitigated by expanding<br />
the number <strong>of</strong> slots, or by modifying college acceptance rules to place greater emphasis on<br />
criteria that cannot be directly influenced by parents. In a broader context, however, parents may<br />
not fully internalize the social benefits <strong>of</strong> preparing their children, which raises the possibility<br />
that the rug rat race provides a useful stimulus to human capital investment. <strong>The</strong>se issues<br />
warrant closer investigation in future work.<br />
37
<strong>The</strong>oretical Appendix<br />
Proposition 1. If mc < k , then the equilibrium acceptance threshold 1 is uniquely determined<br />
h<br />
A *<br />
by = h > h q ) and<br />
h1 1 l ( 0<br />
1<br />
A *<br />
*<br />
( h1<br />
) = hl<br />
( q0<br />
) − d l ( h ( q0<br />
)) ,<br />
A<br />
wq1h1 − d l<br />
l<br />
*<br />
and the equilibrium threshold h is uniquely determined by > h q ) and<br />
Moreover, h h , and:<br />
A ><br />
1<br />
2<br />
2<br />
h2 l ( 2<br />
*<br />
*<br />
( h2<br />
) = hl<br />
( q0<br />
) − d l ( h ( q0<br />
)) .<br />
wq2h 2 − d l<br />
l<br />
* A<br />
• College-educated parents choose h = h ( q ), h } ;<br />
max{ c 1 1<br />
A<br />
• Less-educated parents divide themselves between h , and ,<br />
h<br />
*<br />
h = = h q )<br />
h = 1<br />
2<br />
( h l 0<br />
*<br />
where hl q ) is the optimal preparation choice when a child does not attend college.<br />
( 0<br />
Pro<strong>of</strong>. Let ( h | q)<br />
= wqh − d ( h)<br />
and ( h | q)<br />
= wqh − wd ( h)<br />
represent the objective<br />
Gl n<br />
Gc c<br />
functions <strong>of</strong> less- and college-educated mothers, respectively. Under our assumptions, these<br />
functions are strictly concave in h and decrease without bound as h approaches infinity. Since<br />
Gl > l<br />
h1 ><br />
*<br />
*<br />
A *<br />
( hl<br />
( q1)<br />
| q1)<br />
Gl<br />
( h ( q0<br />
) | q0<br />
/ w)<br />
, there is a unique point hl ( q1)<br />
satisfying<br />
A<br />
*<br />
*<br />
*<br />
l ( h1<br />
| q1)<br />
= Gl<br />
( h ( q0<br />
) | q0<br />
/ w)<br />
. Similarly, Gl ( hl<br />
( q2<br />
) | q2<br />
) > Gl ( hl<br />
( q0<br />
) | q0<br />
/ w)<br />
implies that<br />
G l<br />
*<br />
there is a unique point > h q ) satisfying | ) = h G *<br />
l h ( q ) | q / w)<br />
. Furthermore,<br />
h2 l ( 2<br />
( 2 2 q<br />
*<br />
A<br />
( h2<br />
| q1)<br />
> Gl<br />
( h2<br />
| q2<br />
) = Gl<br />
( h ( q0<br />
) | q0<br />
/ w)<br />
implies h2 h1<br />
. <<br />
Gl l<br />
Gl ( l 0 0<br />
*<br />
A<br />
*<br />
Consider the h choices <strong>of</strong> college-educated mothers when ( q ) ≥ h . Clearly, hc q )<br />
hc 1 1<br />
A<br />
A<br />
*<br />
*<br />
is optimal among ≥ h . Moreover, for all h ∈ h , h ) , h ( q ) | q ) > G ( h ( q ) | q ) ≥<br />
h 1<br />
38<br />
[ 2 1<br />
Gc ( c 1 1 c c 2 2<br />
( 1
| ) q h G *<br />
*<br />
c , and for all h < h , h ( q ) | q ) > G ( h ( q ) | q / w)<br />
≥ G ( h | q / w)<br />
. Thus,<br />
( 2<br />
*<br />
hc ( q1)<br />
A<br />
h2 h1<br />
<<br />
is strictly preferred to any other h.<br />
2<br />
Gc ( c 1 1 c c 0 0<br />
c 0<br />
A *<br />
Next suppose > h q ) . Let ˆ<br />
*<br />
*<br />
*<br />
= max{ h ( q ), h } . Note that q ) < h ( q ) and<br />
h1 c ( 1<br />
h c<br />
A<br />
imply hˆ < h1<br />
. Moreover, hˆ ≥ h2<br />
implies ˆ<br />
*<br />
Gl ( h | q2<br />
) ≤ Gl<br />
( hl<br />
( q0<br />
) | q0<br />
/ w)<br />
. Thus,<br />
ˆ<br />
*<br />
ˆ<br />
A<br />
0 ≥ Gl<br />
( h | q2<br />
) − Gn<br />
( hl<br />
( q0<br />
) | q0<br />
/ w)<br />
= Gl<br />
( h | q2<br />
) − Gl<br />
( p1<br />
| q1)<br />
= wq hˆ<br />
− wq h<br />
2<br />
A<br />
1 1<br />
+<br />
∫<br />
A<br />
h 1<br />
hˆ<br />
d′<br />
( h)<br />
dh > wq hˆ<br />
− wq h<br />
l<br />
ˆ<br />
A<br />
= G h | q ) − G ( h | q ) ,<br />
c ( 2 c 1 1<br />
2<br />
2<br />
2<br />
A<br />
1 1<br />
+<br />
∫<br />
A<br />
h 1<br />
hˆ<br />
hc ( 2 c 1<br />
wd<br />
′ ( h)<br />
dh<br />
*<br />
*<br />
where the strict inequality comes from the fact that ( q)<br />
h ( q)<br />
for all implies<br />
A<br />
d ′ ( q)<br />
< d ′ ( q)<br />
for all q. Thus, G ˆ<br />
c ( h1<br />
| q1)<br />
> Gc<br />
( h | q2<br />
) , and it follows that G h | q )<br />
A<br />
w c<br />
l<br />
| ) for all since maximizes over this range <strong>of</strong> h. Finally,<br />
q h<br />
A<br />
> h ∈ h , h ) hˆ | ) q h<br />
( 2 Gc [ 2 1<br />
consider h < h . If ˆ *<br />
= h ( q ) , then ˆ<br />
*<br />
h | q ) > G ( h ( q ) | q / w)<br />
≥ G ( h | q / w)<br />
for all<br />
2<br />
h c<br />
h < h2<br />
, whereas h ˆ = h2<br />
implies ˆ *<br />
> h ( q ) and<br />
2<br />
h c<br />
0<br />
( 2 Gc c<br />
hc > l<br />
q<br />
Gc ( 2 c c 0 0<br />
c 0<br />
*<br />
ˆ<br />
*<br />
0 = G ( ( ) | ) ( | ) ( ( ) | ) ( ˆ<br />
l hl<br />
q0<br />
q0<br />
− Gl<br />
h q2<br />
> Gl<br />
hc<br />
q0<br />
q2<br />
− Gl<br />
h | q2<br />
)<br />
h<br />
*<br />
*<br />
= h ( q ) − wq hˆ<br />
+ ψ ′ ( h)<br />
dh > h ( q ) − wq hˆ<br />
+<br />
c<br />
0<br />
2<br />
∫<br />
ˆ<br />
*<br />
hc<br />
( q0<br />
)<br />
whence hˆ<br />
| q ) G ( h | q / w)<br />
for all h h <<br />
Gc ( 2 > c 0<br />
2<br />
l<br />
*<br />
= h ( q ) | q / w)<br />
− G ( hˆ<br />
| q ) ,<br />
Gc ( c 0 0<br />
c 2<br />
c<br />
0<br />
2<br />
∫<br />
hˆ<br />
*<br />
hc<br />
( q0<br />
)<br />
wd<br />
′ ( h)<br />
dh<br />
c<br />
c ( 1 2<br />
Now consider the h choices <strong>of</strong> the less-educated mothers. Because <strong>of</strong> strict concavity and<br />
A *<br />
A<br />
A<br />
> h q ) , G h | q ) < G ( h | q ) for all > q . Similarly, q | q ) < G ( h | q ) for all<br />
h1 l ( 1<br />
l ( 1 l 1 1<br />
q 1<br />
Gl ( 2 n 2 2<br />
A<br />
*<br />
*<br />
h ∈ h , h ) . Since hl ( q0<br />
) < h2<br />
and hl ( q0<br />
) maximizes ( | 0 / ) , it follows that<br />
w q h<br />
[ 2 1<br />
39<br />
G l
*<br />
Gl ( h | q0<br />
) < Gl<br />
( hl<br />
( q0<br />
) | q0<br />
/ w)<br />
for all 2<br />
h<br />
* A<br />
*<br />
h < , ≠ h q ) . Thus, the choices , h and hl q )<br />
h l ( 0<br />
h 1 2<br />
are strictly preferred to any others, and by construction these three are equally preferred. Q.E.D.<br />
Proposition 2. If k < m , then the equilibrium acceptance threshold is uniquely determined<br />
h<br />
B *<br />
by = h > h q ) and<br />
h1 1 c ( 1<br />
1 c<br />
1<br />
( 0<br />
B<br />
( h ) ˆ ( ˆ<br />
1 = q0h<br />
− wq0d<br />
h)<br />
, (1)<br />
B<br />
wq1h1 − wdc<br />
c<br />
where ˆ<br />
*<br />
max{ h ( q ), h } , and is determined as in Proposition 1. Moreover, , and<br />
h<br />
B A<br />
h<br />
h = c 0 2<br />
2<br />
B<br />
• College-educated parents divide themselves between = h and h = hˆ<br />
;<br />
h 1<br />
• Less-educated parents divide themselves between 2 h h = and . )<br />
*<br />
= h q<br />
( h l 0<br />
h1 1 ><br />
B<br />
Pro<strong>of</strong>. Equation (1) can be expressed as h | q ) = G ( hˆ<br />
| q ) . Moreover,<br />
*<br />
ˆ<br />
B *<br />
B<br />
( q ) | q ) > G ( h ( q ) | q ) ≥ G ( h | q ) . Since > h q ) , it follows that is uniquely<br />
*<br />
Gc ( hc<br />
1 1 c c 2 2 c 2<br />
defined, and G ˆ ˆ<br />
c ( h | q1)<br />
> Gc<br />
( h | q2<br />
) implies h h .<br />
B ˆ<br />
1 ><br />
B A<br />
We now verify that h .<br />
c<br />
h1 1 ><br />
0 = G ( hˆ<br />
| q ) − G ( h<br />
2<br />
c<br />
B<br />
1<br />
Gc ( 1 1 c 2<br />
h1 c ( 1<br />
| q ) = wq hˆ<br />
− wq h<br />
1<br />
2<br />
B<br />
1 1<br />
B<br />
h<br />
1<br />
+ ∫ wd<br />
′ c ( h)<br />
dh<br />
ˆ<br />
h<br />
ˆ<br />
B 1<br />
ˆ<br />
B<br />
< wq h − wq h + ∫ d′<br />
( h)<br />
dh = G ( h | q ) − G ( h | q ) .<br />
2<br />
1<br />
1<br />
hˆ<br />
B<br />
l<br />
B<br />
This implies h | q ) < G ( hˆ<br />
| q ) ≤ G ( h | q ) , and comparison with (1) and (2) shows that<br />
B A<br />
h1 > h1<br />
G B<br />
c<br />
.<br />
Gl ( 1 1 l 2 l 2 2<br />
*<br />
Consider the h choices <strong>of</strong> college-educated mothers. Since h q ) ,<br />
( h1<br />
| q1)<br />
l<br />
2<br />
h<br />
l<br />
1<br />
1<br />
h 1<br />
B<br />
h1 > c ( 1 ( | 1)<br />
< q h Gc B<br />
*<br />
*<br />
for all h . If hc ( q ) ≥ h , then hc q ) is strictly preferred to any other<br />
h > 1<br />
2 2<br />
40<br />
( 2
B<br />
*<br />
B<br />
h ∈ [ h2<br />
, h1<br />
) , while if > h q ) , then Gc ( h | q2<br />
) < Gc<br />
( h2<br />
|, q2<br />
) for all h ∈ ( h2<br />
, h1<br />
) . Thus,<br />
h2 c ( 2<br />
hˆ<br />
| q ) maximizes | ) over . <strong>The</strong> argument from the pro<strong>of</strong> <strong>of</strong> Proposition<br />
q h<br />
B<br />
h ∈ h , h )<br />
Gc ( 2<br />
( 2 Gc [ 2 1<br />
1 shows that hˆ<br />
| q ) G ( h | q / w)<br />
for all h<br />
B<br />
h < . Thus, the choices and h are strictly<br />
ˆ<br />
Gc ( 2 > c 0<br />
2<br />
preferred to any others, and they are equally preferred by construction.<br />
B<br />
B<br />
As for the non-college-educated mothers, ≥ h implies G h | q ) ≤ G ( h | q ) <<br />
*<br />
B<br />
Proposition 1 establish that h and h ( 1)<br />
are strictly preferred to any other < h , and they are<br />
equally preferred by construction. Q.E.D.<br />
h 1<br />
h 1<br />
l ( 1 l 1 1<br />
( 2 | 2 ) , so is strictly preferred to any such h. <strong>The</strong> arguments from the pro<strong>of</strong> <strong>of</strong><br />
q h h<br />
G l 2<br />
2<br />
n<br />
41<br />
h 1
References<br />
Aguiar, Mark and Erik Hurst, “Measuring Trends in Leisure: <strong>The</strong> Allocation <strong>of</strong> Time Over Five<br />
Decades,” Quarterly Journal <strong>of</strong> <strong>Economics</strong>, 122 (2007): 969-1006.<br />
Akerl<strong>of</strong>, George, “<strong>The</strong> <strong>Economics</strong> <strong>of</strong> Caste and <strong>of</strong> the <strong>Rat</strong> <strong>Race</strong> and Other Woeful Tales,” <strong>The</strong><br />
Quarterly Journal <strong>of</strong> <strong>Economics</strong>, 90 (November 1976): 599-617<br />
Allard, Mary Dorinda, Suzanne Bianchi, Jay Stewart and Vanessa R. Wight, “Comparing<br />
Childcare Measures in the ATUS and Earlier Time Use Studies,” Monthly Labor Review,<br />
May 2007, pp. 27-36.<br />
Autor, David H., Lawrence F. Katz, and Melissa S. Kearney, “Trends in US Wage Inequality:<br />
Revising the Revisionists,” <strong>The</strong> Review <strong>of</strong> <strong>Economics</strong> and Statistics 90 (May 2008):<br />
300 – 323.<br />
Bianchi, Suzanne, “Maternal Employment and Time with Children: Dramatic Change or<br />
Surprising Continuity?” Demography 37 (November 2000): 401-414.<br />
Bianchi, Suzanne, Philip N. Cohen, Sara Raley and Kei Nomaguchi, “Inequality in Parental<br />
Investment in Child-Rearing: Expenditures, Time, and Health,” in Social Inequality, ed.<br />
by Kathryn M. Neckerman, New York: Russell Sage Foundation, 2004.<br />
Bianchi, Suzanne M., John P. Robinson, and Melissa A. Milkie, Changing Rhythms <strong>of</strong> American<br />
Family Life, New York: Russell Sage Foundation, 2006.<br />
Bound, John and Sarah Turner, “Cohort Crowding: How Resources Affect Collegiate<br />
Attainment,” Journal <strong>of</strong> Public <strong>Economics</strong> 91 (2007): 877-899.<br />
Bound, John, Hershbein, Brad, and Bridget Terry Long, “Playing the Admissions Game: Student<br />
Reactions to Increasing College Competition,” <strong>The</strong> Journal <strong>of</strong> Economic Perspectives, 23<br />
(Fall 2009): 119-146.<br />
Boudarbat, Brahim, Thomás Lemieux, and Craig Riddell, “Recent Trends in Wage Inequality<br />
and the Wage Structure in Canada,” in Dimensions <strong>of</strong> Inequality in Canada, D. Green<br />
and J. Kesselman, eds. UBC Press, 2006.<br />
Bryant, W. Keith and Cathleen D. Zick, “Are We Investing Less in the Next Generation?<br />
Historical Trends in Time Spent Caring for Children,” Journal <strong>of</strong> Family and Economic<br />
Issues 17(3/4) (1996): 365-92.<br />
Chalasani, Satvika, “<strong>The</strong> Changing Relationship between Parents’ Education and their Time with<br />
Children,” International Journal <strong>of</strong> Time Use Research, 4 (September 2007): 93-117.<br />
42
Davies, Scott and Floyd M. Hammack, “<strong>The</strong> Channeling <strong>of</strong> Student Competition in Higher<br />
Education: Comparing Canada and the U.S.,” Journal <strong>of</strong> Higher Education, 76<br />
(January/February 2005): 89-106.<br />
Fisher, Kimberly, Muriel Egerton and Jonathan Gershuny. 2006. American Heritage Time Use<br />
Survey. http://www.timeuse.org/ahtus/ .<br />
Ginsburg, Kenneth R., “<strong>The</strong> Importance <strong>of</strong> Play in Promoting Healthy Child Development and<br />
Maintaining Strong Parent-Child Bonds,” American Academy <strong>of</strong> Pediatrics Report, 2007.<br />
Guryan, Jon, Erik Hurst, and Melissa Kearney, “Parental Education and Parental Time With<br />
Children,” Journal <strong>of</strong> Economic Perspectives, Summer 2008: 23-46.<br />
H<strong>of</strong>ferth, <strong>San</strong>dra L., “Changes in American Childrens’ Time, 1997 to 2003,” manuscript,<br />
University <strong>of</strong> Maryland School <strong>of</strong> Public Health, October 2008.<br />
Hoxby, Caroline, “How the Changing Market Structure <strong>of</strong> U.S. Higher Education Explains<br />
College Tuition,” NBER Working Paper 6323, December 1997.<br />
Hoxby, Caroline M., “<strong>The</strong> Changing Selectivity <strong>of</strong> American Colleges,” <strong>The</strong> Journal <strong>of</strong><br />
Economic Perspectives, 23 (Fall 2009): 95-118.<br />
Krueger, Alan B., Daniel Kahneman, David Schkade, Norbert Schwarz, and Arthur A. Stone,<br />
“National Time Accounting: <strong>The</strong> Currency <strong>of</strong> Life,” 2007 manuscript.<br />
Kimmel, Jean and Rachel Connelly, “Mothers’ Time Choices: Caregiving, Leisure, Home<br />
Production, and Paid Work,” Journal <strong>of</strong> Human Resources, Summer 2007: 643-681.<br />
Lareau, Annette, Unequal Childhoods, Berkeley: University <strong>of</strong> California Press, 2003.<br />
Leibowitz, Arleen, “Home Investments in Children,” Journal <strong>of</strong> Political Economy 82(2): S111-<br />
S131, 1974.<br />
Levey, Hilary Leigh, Playing to Win: Raising Children in a Competitive Culture, Princeton<br />
University Dissertation, September 2009.<br />
Luthar, Suniya S. and Bronwyn E. Becker, “Privileged But Pressured: A Study <strong>of</strong> Affluent<br />
Young,” Child Development, 73 (2002): 1593-1610.<br />
Mahoney, Joseph L., Angel L. Harris, and Jacquelynne S. Eccles, “Organized Activity<br />
Participation, Positive Youth Development, and the Over-Scheduling Hypothesis,” Social<br />
Policy Report, 10 (2006): 3-31.<br />
National Association <strong>of</strong> College Counseling, State <strong>of</strong> College Admission, author Melissa E.<br />
Clinedinst, editor David Hawkins. Arlington, VA: NCAC, 2008.<br />
43
Pronovost, Gilles, “Le temps dans tous ses états: temps de travail, temps de loisir et temps pour<br />
le famille à l’aube du XXI e siècle,” Enjeux Public IRPP, Février 2007.<br />
Robinson, John P. and Ge<strong>of</strong>frey Godbey, Time for Life: <strong>The</strong> Surprising Ways Americans Use<br />
their Time, University Park, Pennsylvania: <strong>The</strong> Pennsylvania State University Press,<br />
1999, 2 nd edition.<br />
Rosenfeld, Alvin, Nicole Wise, and Robert Coles, <strong>The</strong> Overscheduled Child: Avoiding the<br />
Hyperparenting Trap, St. Martin’s Griffin, 2001.<br />
Saez, Emmanuel, “Tables and Figures Updated to 2007,” August 2009. Available at:<br />
http://elsa.berkeley.edu/~saez/ .<br />
Safe Kids USA, “Report to the Nation: Trends in Unintentional Childhood Injury Mortality and<br />
Parental Views on Child Safety,” April 2008<br />
http://sk.convio.net/site/DocServer/STUDY-SKWK-08-LRApril26.pdf?docID=9561<br />
<strong>San</strong>dberg, John F. and <strong>San</strong>dra L. H<strong>of</strong>ferth, “Changes in Childrens’ Time with Parents: A<br />
Correction, Demography 42 (May 2005): 391-395.<br />
Sayer, Liana C., Suzanne M. Bianchi, and John P. Robinson, “Are Parents Investing Less in<br />
Childcare? Trends in Mothers’ and Fathers’ Time with Children,” American Journal <strong>of</strong><br />
Sociology 110 (July 2004): 1-43.<br />
Stevenson, Betsey, “Beyond the Classroom: Using Title IX to Measure the Return to High<br />
School Sports,” Review <strong>of</strong> <strong>Economics</strong> and Statistics, forthcoming 2010.<br />
Statistics Canada, General Social Survey, Cycles 2, 7, 12, and 19.<br />
Turcotte, Martin, “Time Spent with Family During a Typical Workday, 1986-2005,” Canadian<br />
Social Trends, Statistics Canada Catalogue No. 11-008.<br />
United States Census Bureau, Statistical Abstract, Historical Statistics, HS-23.<br />
United States <strong>Department</strong> <strong>of</strong> Agriculture, Agricultural Research Administration, Bureau <strong>of</strong><br />
Human Nutrition and Home <strong>Economics</strong>, <strong>The</strong> Time Costs <strong>of</strong> Homemaking – A Study <strong>of</strong><br />
1,500 Rural and Urban Households, 1944 manuscript.<br />
Warner, Judith, Perfect Madness: Motherhood in the Age <strong>of</strong> Anxiety, New York: Riverhead<br />
Books, 2005.<br />
44
Table 1. Trends in Weekly Hours Spent on Childcare by Parents a<br />
(1) (2) (3) (4)<br />
Mothers Mothers Fathers Fathers<br />
1965 1.636<br />
0.290<br />
(0.613)**<br />
(0.512)<br />
1985 -0.369<br />
0.005<br />
(0.689)<br />
(0.583)<br />
1993 -1.013<br />
0.210<br />
(0.552)<br />
(0.516)<br />
1995 1.744<br />
1.232<br />
(0.883)*<br />
(0.821)<br />
1998 1.842<br />
3.102<br />
(0.933)*<br />
(0.856)**<br />
2000 3.928<br />
3.936<br />
4.522<br />
4.472<br />
(0.640)** (0.603)** (0.579)** (0.587)**<br />
2003 4.676<br />
4.527<br />
3.184<br />
3.446<br />
(0.398)** (0.380)** (0.340)** (0.352)**<br />
2004 4.071<br />
4.065<br />
3.444<br />
3.449<br />
(0.435)** (0.413)** (0.367)** (0.378)**<br />
2005 3.992<br />
3.628<br />
3.327<br />
3.520<br />
(0.436)** (0.415)** (0.372)** (0.383)**<br />
2006 4.324<br />
4.122<br />
3.104<br />
3.286<br />
(0.443)** (0.421)** (0.375)** (0.387)**<br />
2007 4.227<br />
3.898<br />
3.277<br />
3.395<br />
(0.452)** (0.430)** (0.377)** (0.389)**<br />
2008 4.288<br />
3.983<br />
4.44<br />
4.324<br />
(0.450)**<br />
college 0.026<br />
(0.900)<br />
(1965)*college 2.048<br />
(2.174)<br />
(1985)*college 1.873<br />
(1.671)<br />
(1993)*college 1.373<br />
(1.264)<br />
(1995)*college 0.741<br />
(2.153)<br />
(1998)*college 3.117<br />
(2.052)<br />
(2000)*college 4.868<br />
(1.479)**<br />
(2003)*college 4.999<br />
(1.015)**<br />
(2004)*college 6.344<br />
(1.062)**<br />
(2005)*college 6.038<br />
(1.073)**<br />
(2006)*college 4.109<br />
(1.072)**<br />
(2007)*college 5.291<br />
(1.073)**<br />
(2008)*college 4.659<br />
(1.074)**<br />
(0.429)**<br />
-0.633<br />
(0.851)<br />
4.149<br />
(1.389)**<br />
3.948<br />
(0.958)**<br />
5.478<br />
(1.002)**<br />
5.293<br />
(1.012)**<br />
3.015<br />
(1.011)**<br />
4.456<br />
(1.012)**<br />
3.872<br />
(1.013)**<br />
45<br />
(0.382)**<br />
0.854<br />
(0.579)<br />
0.093<br />
(1.229)<br />
-0.321<br />
(1.142)<br />
-0.422<br />
(0.972)<br />
1.799<br />
(1.642)<br />
2.134<br />
(1.666)<br />
-0.406<br />
(1.098)<br />
1.913<br />
(0.688)**<br />
1.425<br />
(0.733)<br />
2.514<br />
(0.746)**<br />
2.296<br />
(0.741)**<br />
2.138<br />
(0.755)**<br />
0.900<br />
(0.745)<br />
(0.393)**<br />
0.873<br />
(0.585)<br />
-0.496<br />
(1.109)<br />
1.132<br />
(0.696)<br />
0.903<br />
(0.741)<br />
2.043<br />
(0.754)**<br />
1.692<br />
(0.749)*<br />
1.511<br />
(0.764)<br />
0.682<br />
(0.753)
Constant 11.656<br />
-3.251<br />
3.565<br />
-2.655<br />
(0.342)** (0.524)** (0.300)** (0.496)**<br />
Observations 24,342 21,659 17,806 15,829<br />
R-squared 0.09 0.21 0.06 0.10<br />
Source: Authors’ regressions based on time use surveys.<br />
a. This table shows the regression <strong>of</strong> weekly hours spent on total childcare<br />
on the variables <strong>of</strong> interest. Columns (1) and (2) report results for all<br />
mothers 18-64 who are not students; columns (3) and (4) report results for<br />
fathers 18-64 who are not students. “Mother” and “father” are defined as<br />
having a child under the age <strong>of</strong> 18 in the house. <strong>The</strong> omitted year is 1975.<br />
Controls for parents’ ages (dummies for 18-24, 25-34, 35-44, 45-54, 55-64)<br />
are included in columns (1) and (3). <strong>The</strong> omitted category is age 25-34.<br />
Columns (2) and (4) also include marital status, a quadratic in the number <strong>of</strong><br />
children, dummies for the youngest child in each <strong>of</strong> the following age<br />
categories: (i) age ≤ 1; (ii) age = 2; (iii) 2 < age < 6; (iv) 6 ≤ age < 10;<br />
(v) 10 ≤ age < 14. Standard errors in parentheses. * significant at 5%; **<br />
significant at 1%.<br />
46
A. Mothers<br />
Row Income Income<br />
squared<br />
1 0.0105<br />
(0.0050)<br />
2 0.0313<br />
(0.006)**<br />
3 0.0348<br />
(0.010)**<br />
B. Fathers<br />
Row Income Income<br />
squared<br />
1 0.023<br />
(0.005)**<br />
2 0.025<br />
(0.006)**<br />
Table 2. <strong>The</strong> Relationship between Childcare and Income a<br />
-0.000012<br />
(0.000010) 0.22<br />
-0.000057<br />
(0.000013)** 0.56<br />
-0.000066<br />
(0.000022)** 0.61<br />
-0.000045<br />
(0.000011)** 0.40<br />
-0.000049<br />
(0.000012)** 0.44<br />
Incomeinduced<br />
increase in<br />
childcare<br />
from 1975 to<br />
2008<br />
Incomeinduced<br />
increase in<br />
childcare<br />
from 1975 to<br />
2007<br />
Sample Usual<br />
hours <strong>of</strong><br />
work<br />
included?<br />
All No<br />
All Yes<br />
Homemakers<br />
No<br />
Sample Usual<br />
hours <strong>of</strong><br />
work<br />
included?<br />
All No<br />
All Yes<br />
Source: Regressions on pooled BLS surveys from 2003-2008.<br />
a. <strong>The</strong> income variable is in thousands <strong>of</strong> 2008 dollars. <strong>The</strong> income-induced<br />
increase in childcare is calculated by applying the cross-sectional income<br />
coefficients to the actual changes in average family income from 1975 to<br />
2008. Quantities are in hours per week. All regressions include controls<br />
for year, age categories <strong>of</strong> parents, full controls for children’s ages and<br />
numbers, marital status, and dummy variables for high school dropouts,<br />
college-educated and post-college degree.<br />
47
Table 3. Trends in Weekly Hours Spent on Childcare a<br />
(1) (2) (3) (4)<br />
Mothers Fathers<br />
Total Excl. play Total Excl. play<br />
1965 1.636<br />
1.919<br />
0.290<br />
-0.187<br />
(0.613)** (0.538)** (0.512) (0.413)<br />
1985 -0.369<br />
-0.443<br />
0.005<br />
-0.144<br />
(0.689) (0.602) (0.583) (0.471)<br />
1993 -1.013<br />
-1.247<br />
0.210<br />
-0.172<br />
(0.552) (0.485)** (0.516) (0.417)<br />
1995 1.744<br />
0.770<br />
1.232<br />
0.441<br />
(0.883)* (0.775) (0.821) (0.663)<br />
1998 1.842<br />
1.182<br />
3.102<br />
2.143<br />
(0.933)* (0.819) (0.856)** (0.692)**<br />
2000 3.928<br />
3.482<br />
4.522<br />
3.439<br />
(0.640)** (0.562)** (0.579)** (0.468)**<br />
2003 4.676<br />
3.584<br />
3.184<br />
2.242<br />
(0.398)** (0.349)** (0.340)** (0.274)**<br />
2004 4.071<br />
3.013<br />
3.444<br />
2.307<br />
(0.435)** (0.382)** (0.367)** (0.296)**<br />
2005 3.992<br />
3.115<br />
3.327<br />
2.472<br />
(0.436)** (0.382)** (0.372)** (0.300)**<br />
2006 4.324<br />
2.879<br />
3.104<br />
1.982<br />
(0.443)** (0.389)** (0.375)** (0.303)**<br />
2007 4.227<br />
2.993<br />
3.277<br />
2.165<br />
(0.452)** (0.396)** (0.377)** (0.305)**<br />
2008 4.288<br />
3.182<br />
4.44<br />
2.850<br />
(0.450)** (0.395)** (0.382)** (0.309)**<br />
college 0.026<br />
0.193<br />
0.854<br />
0.718<br />
(0.900) (0.790) (0.579) (0.468)<br />
(1965)*college 2.048<br />
1.124<br />
0.093<br />
0.007<br />
(2.174) (1.908) (1.229) (0.993)<br />
(1985)*college 1.873<br />
1.488<br />
-0.321<br />
-0.399<br />
(1.671) (1.467) (1.142) (0.923)<br />
(1993)*college 1.373<br />
0.452<br />
-0.422<br />
-0.434<br />
(1.264) (1.110) (0.972) (0.785)<br />
(1995)*college 0.741<br />
-0.021<br />
1.799<br />
1.387<br />
(2.153) (1.890) (1.642) (1.327)<br />
(1998)*college 3.117<br />
1.705<br />
2.134<br />
1.978<br />
(2.052) (1.801) (1.666) (1.346)<br />
(2000)*college 4.868<br />
3.840<br />
-0.406<br />
0.144<br />
(1.479)** (1.298)** (1.098) (0.887)<br />
(2003)*college 4.999<br />
3.788<br />
1.913<br />
1.344<br />
(1.015)** (0.890)** (0.688)** (0.556)*<br />
(2004)*college 6.344<br />
4.110<br />
1.425<br />
0.803<br />
(1.062)** (0.932)** (0.733) (0.592)<br />
(2005)*college 6.038<br />
4.183<br />
2.514<br />
1.055<br />
(1.073)** (0.942)** (0.746)** (0.603)<br />
(2006)*college 4.109<br />
2.968<br />
2.296<br />
1.625<br />
(1.072)**<br />
(2007)*college 5.291<br />
(1.073)**<br />
(0.941)**<br />
3.193<br />
(0.942)**<br />
48<br />
(0.741)**<br />
2.138<br />
(0.755)**<br />
(0.599)**<br />
1.032<br />
(0.611)
(2008)*college 4.659<br />
3.487<br />
0.900<br />
0.846<br />
(1.074)** (0.942)** (0.745) (0.602)<br />
Constant 11.656<br />
9.787<br />
3.565<br />
2.206<br />
(0.342)** (0.300)** (0.300)** (0.2143)**<br />
Observations 24,342 24,342 17,806 17806<br />
R-squared 0.09 0.07 0.06 0.04<br />
Source: Authors’ estimates based on time use surveys.<br />
a. Columns (1) and (2) report results mothers, (3) and (4) for fathers.<br />
Columns (1) and (3) reproduce results for all childcare from Tables 1 and 2,<br />
column(3). Columns (2) and (4) show the results when playing with children<br />
is excluded from the childcare measure. <strong>The</strong> omitted year is 1975. Dummy<br />
variables for parents’ age are also included (dummies for 18-24, 25-34, 35-<br />
44, 45-54, 55-64). <strong>The</strong> omitted category is age 25-34. Standard errors in<br />
parentheses. * significant at 5%; ** significant at 1%.<br />
Table 4. Change in Childcare Time: 1975 – 2008 a<br />
Working Mothers vs. Stay-at-Home Mothers<br />
Less than college College Educated<br />
Working mothers 4.8 7.1<br />
Stay-at-home mothers 5.5 16.3<br />
Source: Authors’ regressions on time use data.<br />
a. <strong>The</strong> differences are based on coefficients from regressions that are the<br />
same as those reported in column (1) <strong>of</strong> Table 1, except that they are<br />
estimated separately on mothers who report that they are employed. <strong>The</strong>se<br />
regressions include controls for mothers’ ages (dummies for 18-24, 25-34, 35-<br />
44, 45-54, 55-64).<br />
49
Table 5. Trends in Weekly Hours Spent in Family Care<br />
by English-Speaking Parents in Canada a<br />
(1) (2) (3) (4)<br />
Mothers Mothers Fathers Fathers<br />
1992 2.235<br />
1.967<br />
1.258<br />
1.020<br />
(0.606)** (0.561)** (0.509)* (0.491)*<br />
1998 3.652<br />
3.404<br />
3.183<br />
3.134<br />
(0.5491)** (0.547)** (0.508)** (0.491)**<br />
2005 5.050<br />
4.894<br />
2.453<br />
2.476<br />
(0.533)** (0.501)** (0.442)** (0.435)**<br />
college 7.307<br />
3.037<br />
2.736<br />
1.758<br />
(1.151)** (1.068)** (0.841)** (0.807)*<br />
(1992)*college -3.669<br />
-1.346<br />
-0.712<br />
-0.397<br />
(1.585)** (1.463) (1.180) (1.130)<br />
(1998)*college -3.141<br />
-2.099<br />
-0.784<br />
-0.993<br />
(1.536)* (1.417) (1.117) (1.070)<br />
(2005)*college -4.229<br />
-2.091<br />
-0.553<br />
-0.278<br />
(1.307)** (1.206) (0.974) (0.933)<br />
Constant 14.209<br />
-2.836<br />
6.508<br />
-4.215<br />
Controls for<br />
marital status and<br />
age <strong>of</strong> youngest<br />
(0.464)** (1.110)** (0.407)** (1.155)**<br />
child?<br />
No Yes No Yes<br />
Observations 6548 6548 4671 4671<br />
R-squared 0.12 0.25 0.06 0.14<br />
Source: Regressions using the GSS <strong>of</strong> Canada.<br />
a. This table shows the regression <strong>of</strong> weekly hours spent on family care on<br />
the variables <strong>of</strong> interest. Columns (1) and (2) report results for all<br />
mothers ages 20-64; columns (3) and (4) report results for fathers ages 20-<br />
64. “Mother” and “father” are defined as having one’s own child under the<br />
age <strong>of</strong> 19 in the house. <strong>The</strong> omitted year is 1986. Controls for parents’<br />
ages (dummies for 20-24, 25-34, 35-44, 45-54, 55-64) are included in all<br />
columns. <strong>The</strong> omitted category is age 25-34. Columns (2) and (4) also<br />
include marital status and a dummy for (i) the youngest child under the age<br />
<strong>of</strong> 5; (ii) the youngest child between the ages <strong>of</strong> 5 and 9; and (iii) the<br />
youngest child between the ages 10 and 14. Standard errors in parentheses.<br />
* significant at 5%; ** significant at 1%.<br />
50
Table 7. Childcare by Underrepresented Minorities a<br />
Differential Relative to Non-Black, Non-Hispanic Parents with Same Education<br />
Mothers<br />
Difference in<br />
hours <strong>of</strong><br />
childcare<br />
Observations<br />
in group<br />
Fathers<br />
Difference in<br />
hours <strong>of</strong><br />
childcare<br />
Observations<br />
in group<br />
Black, lesseducated<br />
-3.090<br />
(0.375)**<br />
Hispanic, less<br />
educated<br />
-2.893<br />
(0.328)**<br />
Black, collegeeducated<br />
-3.182<br />
(0.705)**<br />
Hispanic,<br />
collegeeducated<br />
-1.768<br />
(0.716)**<br />
1,409 2,235 341 350<br />
-1.404<br />
(0.392)**<br />
-1.890<br />
(0.314)**<br />
-0.478<br />
(0.671)<br />
-2.272<br />
(0.647)**<br />
571 1,409 184 225<br />
Source: Authors’ regressions based on pooled BLS time use surveys.<br />
a. Regressions are estimated separately on samples <strong>of</strong> less-educated and college-educated.<br />
All regressions include controls for age categories <strong>of</strong> parents, full controls for children’s ages<br />
and numbers, marital status, and dummy variables for high school dropouts and post-college<br />
degree.<br />
51
Bound,<br />
Hershbein,<br />
Long variable<br />
Coefficient<br />
(S.E)<br />
R-squared<br />
Number <strong>of</strong><br />
observations<br />
Table 8. Cross-State Analysis <strong>of</strong> Time Spent in Childcare<br />
Regression <strong>of</strong> Childcare time on Bound, Hershbein, Long Index a<br />
Less educated<br />
mothers<br />
1.504<br />
(0.747)**<br />
Collegeeducated<br />
mothers<br />
1.987<br />
(0.825)**<br />
Less educated<br />
fathers<br />
-0.658<br />
(0.563)<br />
Collegeeducated<br />
fathers<br />
0.940<br />
(0.682)<br />
0.085 0.117 0.030 0.041<br />
46 46 46<br />
Source: Authors’ regressions based on pooled time use data.<br />
a. <strong>The</strong> Bound, Hershbein, and Long (2009) Competitiveness index is the sum <strong>of</strong><br />
PSAT participation rates, AP participation rates, fraction <strong>of</strong> students<br />
reporting 10+ homework hours per week, the fraction applying to 5 or more<br />
colleges, and the fraction using private test preparation in 2004. <strong>The</strong> time<br />
spent in childcare by state is estimated by combining the 2003-2008 ATUS<br />
surveys. <strong>The</strong> estimate is the residual after controlling for parents’ ages<br />
(dummies for 18-24, 25-34, 35-44, 45-54, 55-64), marital status, a quadratic<br />
in the number <strong>of</strong> children, dummies for the youngest child in each <strong>of</strong> the<br />
following age categories: (i) age ≤ 1; (ii) age = 2; (iii) 2 < age < 6; (iv)<br />
6 ≤ age < 10; (v) 10 ≤ age < 14. Standard errors in parentheses.<br />
* significant at 5%; ** significant at 1%.<br />
52<br />
46
hours per week<br />
10 12 14 16 18 20 22<br />
hours per week<br />
4 6 8 10<br />
Figure 1. Weekly Hours Spent in Childcare a<br />
A. Mothers<br />
1965 1975 1985 1995 2005<br />
year<br />
college-educated less than college<br />
B. Fathers<br />
1965 1975 1985 1995 2005<br />
year<br />
college-educated less than college<br />
Source: Authors’ estimates from Table 1, columns (1) and (3), based on time use surveys.<br />
a. <strong>The</strong> means shown are for ages 25-34.<br />
53
hours per week<br />
-4 -2 0 2 4<br />
hours per week<br />
-4 -2 0 2 4<br />
Figure 2. Trends in Time Spent by Mothers: Categories <strong>of</strong> Childcare, 1965-2000 a<br />
A. Less than College<br />
1965 1975 1985 1995<br />
year<br />
care <strong>of</strong> young children care <strong>of</strong> older children<br />
education play<br />
travel, activities<br />
B. College-Educated<br />
1965 1975 1985 1995<br />
year<br />
Source: Authors’ estimates from time use surveys.<br />
a. Each category normalized to 0 in 1975.<br />
care <strong>of</strong> young children care <strong>of</strong> older children<br />
education play<br />
travel, activities<br />
54
hours per week<br />
-2 -1 0 1 2 3<br />
hours per week<br />
-2 -1 0 1 2 3<br />
Figure 3. Trends in Time Spent by Fathers: Categories <strong>of</strong> Childcare, 1965-2000 a<br />
A. Less than College<br />
1965 1975 1985 1995<br />
year<br />
care <strong>of</strong> young children care <strong>of</strong> older children<br />
education play<br />
travel, activities<br />
B. College-Educated<br />
1965 1975 1985 1995<br />
year<br />
Source: Authors’ estimates from time use surveys.<br />
a. Each category normalized to 0 in 1975.<br />
care <strong>of</strong> young children care <strong>of</strong> older children<br />
education play<br />
travel, activities<br />
55
Figure 4. Time Spent Types <strong>of</strong> Childcare in 2003-2008 a<br />
A. Mothers with children under 5 years <strong>of</strong> age<br />
Physical care, supervising<br />
Educating<br />
Playing<br />
Health care<br />
Organizing & attending activities<br />
Chauffering<br />
0 2 4 6 8 10 12<br />
hours per week<br />
less than college college-educated<br />
B. Fathers with children under 5 years <strong>of</strong> age<br />
Physical care, supervising<br />
Educating<br />
Playing<br />
Health care<br />
Organizing & attending activities<br />
Chauffering<br />
Source: Authors’ calculations using time use surveys.<br />
a. Parents with youngest child less than 5 years <strong>of</strong> age.<br />
0 2 4 6 8 10 12<br />
hours per week<br />
less than college college-educated<br />
56
Figure 5. Time Spent Types <strong>of</strong> Childcare in 2003-2008<br />
A. Mothers with children 5 years or older<br />
Physical care, supervising<br />
Educating<br />
Playing<br />
Health care<br />
Organizing & attending activities<br />
Chauffering<br />
0 .5 1 1.5 2 2.5 3<br />
hours per week<br />
less than college college-educated<br />
B. Fathers with children 5 years or older<br />
Physical care, supervising<br />
Educating<br />
Playing<br />
Health care<br />
Organizing & attending activities<br />
Chauffering<br />
0 .5 1 1.5 2 2.5 3<br />
hours per week<br />
less than college college-educated<br />
Source: Authors’ calculations using time use surveys.<br />
a. Parents with youngest child less than 5 years <strong>of</strong> age.<br />
57
hours per week<br />
10 15 20 25 30 35 40 45<br />
hours per week<br />
10 15 20 25 30 35 40 45<br />
Figure 6. Time Use <strong>of</strong> Mothers a<br />
A. Less than College<br />
1965 1975 1985 1995 2005<br />
year<br />
childcare chores<br />
work free time less 65 hours<br />
B. College-Educated<br />
1965 1975 1985 1995 2005<br />
year<br />
Source: Authors’ estimates from time use surveys.<br />
a. <strong>The</strong> means shown are for ages 25-34.<br />
childcare chores<br />
work free time less 65 hours<br />
58
hours per week<br />
6 8 10 12<br />
hours per week<br />
1 2 3 4 5<br />
Figure 7. Weekly Hours Spent in Childcare a<br />
A. All Women Ages 18 - 64<br />
1965 1975 1985 1995 2005<br />
year<br />
college-educated less than college<br />
B. All Men Ages 18-64<br />
1965 1975 1985 1995 2005<br />
year<br />
college-educated less than college<br />
Source: Authors’ estimates from Table 2, columns (1) and (3), based on time use surveys.<br />
a. <strong>The</strong> means shown are for ages 25-34.<br />
59
Figure 8. High School Graduates and College Enrollment<br />
thousands<br />
2200 2400 2600 2800 3000 3200<br />
thousands<br />
1300 1450 1600 1750 1900<br />
A. High School Graduates<br />
1965 1975 1985 1995 2005<br />
year<br />
B. Recent High School Graduates Enrolled in College<br />
1965 1975 1985 1995 2005<br />
year<br />
Source: 2007 Digest <strong>of</strong> Education Statistics, Table 191.<br />
60
qw<br />
q<br />
Figure 9: Choice <strong>of</strong> College Preparation<br />
61<br />
hl<br />
A<br />
*<br />
( qw)<br />
d′ l (h)<br />
hc<br />
B<br />
*<br />
( q)<br />
d ′ c (h)<br />
h
h<br />
A<br />
h 1<br />
Figure 10: Time Paths <strong>of</strong> College Preparation<br />
h 2<br />
62<br />
B<br />
h 1<br />
T time
hours per week<br />
0 2 4 6 8<br />
hours per week<br />
0 2 4 6<br />
Figure 11. Change in Weekly Hours Spent in Childcare: Canada vs. US a<br />
Less-Educated Mothers<br />
1985 1990 1995 2000 2005<br />
year<br />
Canada US<br />
Less-Educated Fathers<br />
1985 1990 1995 2000 2005<br />
year<br />
Canada US<br />
hours per week<br />
0 2 4 6 8<br />
hours per week<br />
0 2 4 6<br />
Source: Estimates from Table 1 and Table 5, columns (1) and (3))<br />
a. Hours are normalized to 0 for each group in the initial year.<br />
63<br />
College-Educated Mothers<br />
1985 1990 1995 2000 2005<br />
year<br />
Canada US<br />
College-Educated Fathers<br />
1985 1990 1995 2000 2005<br />
year<br />
Canada US
Figure 12. Cross-State Correlation <strong>of</strong> Childcare Time and College Competitiveness<br />
(College-Educated Mothers)<br />
hours per week<br />
10 15 20 25<br />
SD<br />
ID<br />
WV<br />
NE<br />
MO<br />
MI<br />
TN<br />
AL<br />
MT<br />
AR<br />
IA<br />
MSWI<br />
KS<br />
CO FLIL<br />
NM KT<br />
IN<br />
MN<br />
TX<br />
AZ<br />
OR<br />
OH<br />
PA CA<br />
VTWA<br />
SC<br />
ME<br />
OK<br />
LA<br />
UT<br />
NH<br />
NC RI<br />
NJ<br />
.5 1 1.5 2<br />
college competitiveness index<br />
Source: Estimates based on Table 8.<br />
Actual Fitted values<br />
64<br />
VA<br />
HI<br />
MA<br />
GA<br />
NY<br />
DC<br />
MD<br />
CT
log differential<br />
.4 .45 .5 .55 .6 .65<br />
Figure 13. Log College/High School Wage Gap<br />
1965 1970 1975 1980 1985 1990 1995 2000 2005<br />
year<br />
Source: Autor, Katz, and Kearney (2008).<br />
65