Excessively Volatile Stock Markets - NYU Stern School of Business
Excessively Volatile Stock Markets - NYU Stern School of Business
Excessively Volatile Stock Markets - NYU Stern School of Business

Create successful ePaper yourself
Turn your PDF publications into a flip-book with our unique Google optimized e-Paper software.
<strong>Excessively</strong> <strong>Volatile</strong> <strong>Stock</strong> <strong>Markets</strong>:<br />
Equilibrium Computation and Policy Analysis<br />
Thomas M. Mertens ∗<br />
November 14, 2008<br />
JOB MARKET PAPER<br />
Abstract<br />
This paper incorporates excess volatility in stock prices into a standard general equilibrium<br />
model and finds large welfare gains from stabilizing policies. <strong>Stock</strong> prices in this model<br />
aggregate information about fundamentals which is dispersed in the economy but also reflect<br />
excess volatility stemming from correlated distortions in beliefs. To solve the model, this paper<br />
develops a novel solution method for nonlinear models with dispersed information which<br />
can be applied to a large class <strong>of</strong> dynamic general equilibrium models. The innovation lies in<br />
a nonlinear change <strong>of</strong> variables which, when combined with perturbation methods, yields the<br />
nonlinear price function consistent with equilibrium expectation operators. The main positive<br />
result shows that dispersion <strong>of</strong> information allows arbitrarily small distortions in beliefs<br />
to generate large amounts <strong>of</strong> excess volatility and renders arbitrage infeasible. The government<br />
cannot observe whether a given stock price movement originates from information or<br />
noise. As a normative result, price stabilizing policies lead to a higher level <strong>of</strong> consumption:<br />
a fall in the risk premium lowers the marginal product <strong>of</strong> capital and raises the capital stock<br />
and production. History-dependent policies may improve the information content <strong>of</strong> prices<br />
and result in even higher welfare gains.<br />
JEL classification: C63, E44, E61, G18, H21<br />
I am indebted to John Y. Campbell, Nicola Fuchs-Schündeln, Kenneth L. Judd, N. Gregory<br />
Mankiw, and Andrei Shleifer for many discussions and suggestions. I also thank George-Marios<br />
Angeletos, Robert Barro, Emmanuel Farhi, Tarek Hassan, David Laibson, and seminar partic-<br />
ipants at Harvard University, MIT, and the Federal Reserve Bank <strong>of</strong> New York for valuable<br />
comments.<br />
∗ Department <strong>of</strong> Economics, Harvard University, e-mail: mertens@fas.harvard.edu<br />
1
1 Introduction<br />
<strong>Stock</strong> markets around the world display high levels <strong>of</strong> aggregate volatility. Since Shiller (1981)<br />
and LeRoy and Porter (1981), a large body <strong>of</strong> literature has demonstrated that stock prices<br />
fluctuate more than their ex-post realized net present value <strong>of</strong> dividends. This finding has gen-<br />
erated some concern among economists about the possible adverse effects on welfare. However,<br />
policymakers have been reluctant to stabilize asset prices partially for fear <strong>of</strong> negative effects on<br />
the aggregation <strong>of</strong> information in financial markets.<br />
This paper incorporates excess volatility in stock prices into a standard general equilibrium<br />
model by assuming distorted beliefs under dispersed information. The model provides a frame-<br />
work to study the welfare consequences <strong>of</strong> price stabilizing policies and their effects on the<br />
aggregation <strong>of</strong> information. However, the literature does not provide a method for solving this<br />
type <strong>of</strong> model. Therefore this paper develops a solution method for general equilibrium models<br />
with dispersed information.<br />
The starting point <strong>of</strong> the analysis is a standard neoclassical economy with capital accumula-<br />
tion. As in the q-theory <strong>of</strong> investment, the link between stock prices and real investment arises<br />
from capital adjustment costs. The streams <strong>of</strong> dividends and labor income are stochastic due to<br />
shocks to total factor productivity which is the only source <strong>of</strong> fundamental uncertainty in the<br />
model.<br />
When forming expectations, agents learn from two sources about the economy’s future path.<br />
First, they receive an exogenous private signal about next period’s total factor productivity<br />
(a “news shock”) that contains idiosyncratic noise. Information about fundamentals is thus<br />
dispersed across the economy. Second, agents observe the resulting equilibrium stock price which<br />
acts as an endogenous public signal. In equilibrium, the stock price contains the news shock as<br />
well as aggregate noise which inhibits full revelation <strong>of</strong> information. The optimal forecast solves<br />
the signal extraction problem to get the best prediction <strong>of</strong> next period’s productivity given both<br />
private and public signals.<br />
Agents are assumed to deviate from optimal forecasts by slight distortions in beliefs (“belief<br />
shocks”) which are perfectly correlated across households. The equilibrium stock price influences<br />
households’ expectations which, in turn, determine the stock price. In equilibrium, belief shocks<br />
enter prices and, as a solution to this fixed point, constitute the source <strong>of</strong> aggregate noise. I<br />
assume distortions in beliefs (as in Cecchetti, Lam and Mark (2000)) and suggest one among<br />
many possible micr<strong>of</strong>oundations.<br />
Typically, simplifying assumptions guarantee linearity <strong>of</strong> policy rules in models with dis-<br />
persed information and learning from prices, so called Noisy Rational Expectations equilibria.<br />
In linear models, we can obtain the price function as a solution to the fixed point problem in<br />
2
closed form. This paper shows that capital accumulation and resulting nonlinearities are the<br />
driving forces <strong>of</strong> welfare gains from policy intervention and hence it is essential to quantify them.<br />
However, to the best <strong>of</strong> my knowledge, there are no tools available to solve the model.<br />
Therefore, I develop a general solution technique that is applicable to nonlinear Noisy Ra-<br />
tional Expectations equilibria in open and closed economies. The innovation lies in a specific<br />
nonlinear change <strong>of</strong> variables that allows me to solve the signal extraction problem for house-<br />
holds in closed form. The solution technique delivers a closed-form approximation <strong>of</strong> arbitrary<br />
accuracy not only for the equilibrium variables but also for social welfare.<br />
The method proceeds in five steps. The first step obtains an approximation to the solution<br />
using perturbation methods which are discussed in Judd (1998) and Jin and Judd (2002) and<br />
applied in Fernández-Villaverde and Rubio-Ramírez (2006). The basic idea <strong>of</strong> perturbation is to<br />
find the deterministic steady-state <strong>of</strong> the system and expand the solution in all state variables<br />
around it to get a higher-order approximation to equilibrium variables. The second step is the<br />
important part in the procedure. I show that there is a nonlinear change <strong>of</strong> variables that<br />
allows me to solve for an equilibrium with dispersed information. To implement the change <strong>of</strong><br />
variables, I build on the method in Judd (2002). It directly leads to step three in which I obtain<br />
a guess for the equilibrium price function. Given the guess, it is possible to carry out the signal<br />
extraction problem in closed form in step four. Step five imposes market clearing and verifies the<br />
guess for prices. With the solution to competitive equilibrium at hand, we can analyze positive<br />
predictions and potential gains from policy intervention.<br />
As the main positive result, I show that in equilibrium a given level <strong>of</strong> excess volatility can<br />
be sustained by arbitrarily small distortions in beliefs if information is sufficiently dispersed.<br />
Intuitively, a higher level <strong>of</strong> idiosyncratic noise in private signals leads households to rely more<br />
on stock prices when forming expectations. Aggregate noise thus increasingly feeds into optimal<br />
beliefs, households’ expectations, and hence back into prices (similar to the reasoning suggested<br />
by Black (1986)). This feedback effect amplifies the impact <strong>of</strong> distortions in beliefs on aggregate<br />
noise in prices.<br />
In the limiting case where information is fully dispersed, the same price function arises as<br />
in a model with noise traders where agents hold optimal beliefs as in Grossman and Stiglitz<br />
(1980) and Hellwig (1980). In that sense, the assumption <strong>of</strong> distorted beliefs merely serves as<br />
a modeling tool to generate noise trader risk while retaining a framework with a single class <strong>of</strong><br />
investors with heterogenous information.<br />
I then turn to the normative analysis. Distorted beliefs constitute the only departure from<br />
the first welfare theorem in this model and thus the only possible reason for intervention. The<br />
government aims at raising expected utility <strong>of</strong> households through intervention while not having<br />
superior information. Thus the government cannot condition its policy on belief shocks and has<br />
3
to rely on observable quantities. I study two general types <strong>of</strong> policies that aim at improving on<br />
competitive market allocations.<br />
First, I look at stabilization policies that condition on the current period’s stock price. De-<br />
mand for stocks might change unexpectedly for two reasons: either information about next<br />
period’s productivity arrives and alters demand for capital or distortions in beliefs lead house-<br />
holds to misjudge next period’s productivity. While the first movement in demand is desirable,<br />
the government wants to diminish movements due to the latter. Owing to its inability to distin-<br />
guish sources <strong>of</strong> price movements, the government conditions its policy on prices. It can therefore<br />
only reduce the response to all sources <strong>of</strong> price movements simultaneously and faces a trade<strong>of</strong>f<br />
between stabilizing fluctuations due to aggregate noise and maintaining efficient responses to<br />
true information. The optimal solution to this stability-efficiency trade<strong>of</strong>f determines optimal<br />
intervention.<br />
Policy intervention conditioning on prices raises the level <strong>of</strong> aggregate consumption after<br />
optimal policies are put in place. The higher level <strong>of</strong> consumption is supported by a higher level<br />
<strong>of</strong> capital in steady-state. Since lowering excess volatility translates into a lower risk premium,<br />
the now smaller expected return on stocks has to be matched by a lower marginal product <strong>of</strong><br />
capital in equilibrium. Consequently, the steady-state level <strong>of</strong> capital rises in response to policy<br />
intervention. In this sense, the standard thought experiment for the cost <strong>of</strong> business cycles which<br />
is <strong>of</strong>ten used as an upper bound on gains from stabilization (see for example Barlevy (2005))<br />
does not apply to this economy. Lucas (1987) computes the cost <strong>of</strong> fluctuations in consumption<br />
by comparing welfare under a stochastic stream <strong>of</strong> consumption to utility under its mean as a<br />
deterministic consumption stream. The cost <strong>of</strong> fluctuations around mean consumption turn out<br />
to be very small. Contrary to this result, policy intervention in this paper leads to a higher level<br />
<strong>of</strong> consumption and thus to significant gains from stabilization.<br />
The second general type <strong>of</strong> policy conditions on the previous period’s misjudgment, once it<br />
becomes public information, in addition to the current stock price. With this policy in place,<br />
the government can influence the way people use information in the economy. When forecasting<br />
asset pay<strong>of</strong>fs, agents no longer only predict next period’s productivity to determine the pay<strong>of</strong>f<br />
but now also take next period’s policy intervention into account. If the policy leads asset pay<strong>of</strong>fs<br />
to fall in response to previous period’s overpricings, stock prices have less power in predicting<br />
stock pay<strong>of</strong>fs. Households consequently put relatively more weight on private signals when<br />
forming expectations and thus improve the information content <strong>of</strong> prices in equilibrium. The<br />
mechanism that amplifies distortions in beliefs is mitigated, leading to a lower level <strong>of</strong> excess<br />
volatility. The government thus faces an improved stability-efficiency trade<strong>of</strong>f.<br />
Having derived implications <strong>of</strong> stabilizing policies in a general framework, I turn to a calibra-<br />
tion for several concrete policy instruments. Quantification <strong>of</strong> welfare gains depends crucially<br />
on the ability <strong>of</strong> the solution technique to capture changes <strong>of</strong> the risk premium for stocks.<br />
4
I study the effects <strong>of</strong> two policy interventions for financial markets: open market operations<br />
and an interest rate policy. In this paper, open market operations refer to a policy <strong>of</strong> equity<br />
purchases and sales by the government as in Kiyotaki and Moore (2008). I implement open<br />
market operations as a time-invariant rule that conditions on current period’s stock demand.<br />
The government sells stocks whenever current demand is unexpectedly high and thus reduces<br />
stock prices. This policy enables the government to stabilize stock prices. The optimal policy<br />
intervention is determined by the stability-efficiency trade<strong>of</strong>f. For the benchmark economy,<br />
optimally designed open market operations lead to welfare gains <strong>of</strong> 0.24% <strong>of</strong> consumption. These<br />
benefits from stabilization are several orders <strong>of</strong> magnitude larger than what the standard upper<br />
bound on stabilization policies would predict.<br />
The other type <strong>of</strong> intervention, an interest rate policy conditioning on stock prices, depends<br />
on an “asset price gap” similar to an output gap in a Taylor rule. Under this policy, interest rates<br />
rise with higher stock prices. This policy is a blunter instrument than open market operations as<br />
it distorts the intertemporal margin for bonds which results in higher variance <strong>of</strong> consumption<br />
over time. Yet these fluctuations imply only small reductions in utility <strong>of</strong> agents. Welfare gains<br />
from interest rate policy amount to an equivalent <strong>of</strong> 0.23% <strong>of</strong> consumption and are thus <strong>of</strong><br />
similar magnitude as gains under open market operations.<br />
To implement the second class <strong>of</strong> policies, I choose a backward-looking interest rate rule that<br />
conditions on an asset price gap as well as on the previous period’s misjudgment. It influences<br />
the way households use information and reduces the level <strong>of</strong> excess volatility in stock prices.<br />
With a more favorable stability-efficiency trade<strong>of</strong>f, welfare gains almost double compared to<br />
previous policies and achieve an equivalent <strong>of</strong> a 0.55% rise in consumption.<br />
This paper relates to a strand <strong>of</strong> literature that studies the welfare cost <strong>of</strong> excess volatility.<br />
For example, DeLong, Shleifer, Summers and Waldmann (1990), Stein (1987), Kurz (2005),<br />
and Lansing (2008) analyze the cost <strong>of</strong> volatility. In closely related work, Hassan and Mertens<br />
(2008) study a capitalist-worker economy where excess volatility is generated by near-rational<br />
investment, and find the welfare effects to be high due to effects on capital accumulation. In<br />
a similar mechanism to the one in this paper, near-rational errors get magnified in equilibrium<br />
to generate excess volatility in stock prices. The setup <strong>of</strong> the present paper starts out from a<br />
first-best economy to isolate the intervention due to distortions in beliefs.<br />
Another related literature studies costs and gains from stabilizing non-fundamental price<br />
movements. This research analyzes distortions in expectations in a New-Keynesian framework,<br />
as for example in Bernanke and Gertler (2000), Bernanke and Gertler (2001), Cecchetti, Genberg<br />
and Wadhwani (2002), Woodford (2002), Woodford (2005), Dupor (2005), Bullard, Evans and<br />
Honkapohja (2007), Christiano, Ilut, Motto and Rostagno (2007), and Gilchrist and Saito (2008).<br />
Relative to this strand <strong>of</strong> literature, the present paper compares various policies in a frictionless<br />
economy and quantifies their welfare gains.<br />
5
A third evolving strand <strong>of</strong> literature studies the optimal use <strong>of</strong> information. How policy<br />
can change the information content <strong>of</strong> prices through changing the use <strong>of</strong> information has been<br />
explored by King (1982). More recently, following Morris and Shin (2002), several papers have<br />
studied the social value <strong>of</strong> information and policies to correct for informational inefficiencies,<br />
among them Hellwig (2005), Amador and Weill (2007), Amador and Weill (2008), Angeletos and<br />
Pavan (2007), Angeletos and Pavan (2008), Angeletos and La’O (2008), and Lorenzoni (2008).<br />
Most closely related to this paper is Angeletos, Lorenzoni and Pavan (2007) who analyze the<br />
interaction between asset prices and investment in an economy where complementarities for<br />
investors lead to a suboptimal use <strong>of</strong> information. Price stabilization turns out to be an effective<br />
strategy to improve welfare. While previous papers assume (log-) linear models, this paper<br />
shows the importance <strong>of</strong> the interplay between dispersed information and nonlinearities.<br />
The structure in the body <strong>of</strong> the paper follows that <strong>of</strong> the introduction: section 2 presents<br />
the model and the definition <strong>of</strong> equilibrium. Section 3 provides tools for obtaining a solution<br />
analyzed in section 4. Section 5 introduces a government and derives implications <strong>of</strong> intervention.<br />
Section 6 contains a calibration for particular policy instruments whose robustness is laid out in<br />
section 7. Section 8 concludes.<br />
2 Model<br />
I study the effects <strong>of</strong> distortions in beliefs and remedies for their adverse impacts on asset markets<br />
in a decentralized small open economy 1 . The economy can borrow and lend from abroad at a risk-<br />
free return Rbt b,t . Foreign direct investment and international contracts contingent on technology<br />
shocks are not permitted. Consequently, domestic agents bear all risk originating within their<br />
borders. Economic actors in this model are households and a representative firm. Households<br />
consume, work, and hold stocks and bonds. The representative firm rents capital services and<br />
hires labor from households.<br />
2.1 Households<br />
There is a continuum <strong>of</strong> households indexed by i ∈ [0,1]. Agents supply their endowment <strong>of</strong> L<br />
units <strong>of</strong> labor inelastically. They invest in a risky and a riskless asset and choose their portfolio<br />
to maximize expected utility. Agents take prices and the distribution <strong>of</strong> returns as given when<br />
choosing their optimal actions. When forming expectations about future returns, agents observe<br />
the equilibrium asset price for the risky asset Pt which acts as an endogenous public signal and<br />
1 The assumption <strong>of</strong> a small open economy merely serves as a convenient modeling device to study excess<br />
volatility. In a small open economy, consumption, investment, and stock prices comove in response to information<br />
about future productivity (for a discussion, see Beaudry and Portier (2004) and Jaimovich and Rebelo (2006)).<br />
With standard capital adjustment costs, this comovement is necessary to generate excess volatility in stock prices.<br />
6
a noisy private signal st(i) about the state <strong>of</strong> the economy next period. The signal has the<br />
logarithm <strong>of</strong> next period’s true aggregate productivity zt+1 as its mean clouded by idiosyncratic<br />
noise θt(i) and is defined as<br />
st(i) = zt+1 + θt(i).<br />
The logarithm <strong>of</strong> productivity z and idiosyncratic noise θ are normally distributed with mean<br />
z ∗ resp. 0 and variances σ 2 z and σ 2 θ . Household i chooses optimal consumption Ct(i) and stock<br />
holdings Kt+1(i) to solve the maximization problem<br />
max ˜Et<br />
Ct(i),Kt+1(i)<br />
<br />
∞<br />
β t <br />
<br />
u(Ct(i)) <br />
st(i),Pt <br />
t=0<br />
subject to the budget constraint I discuss below. The utility function features constant relative<br />
risk aversion, u(C) = C1−γ<br />
1−γ , and the expectation operator ˜E corresponds to agents’ beliefs.<br />
The probability density function <strong>of</strong> agents’ beliefs deviates from that <strong>of</strong> the optimal fore-<br />
cast. Let ϕ(zt+1|st(i),Pt) denote the conditional density <strong>of</strong> the best possible forecast given a<br />
private signal st(i) and the market clearing price Pt that contains true information zt+1 and<br />
aggregate noise. Agents’ forecast with density ˜ϕ deviates from the optimal forecast by a shift εt<br />
in expectations where the distortion εt ∼ N(− 1<br />
2σ2 ε ,σ2 ε ) is i.i.d over time. Hence, the expectation<br />
operator ˜ Et used by households is defined as<br />
<br />
˜Et[zt+1|st(i),Pt] =<br />
<br />
zt+1 ˜ϕi(zt+1|st(i),Pt)dzt+1 =<br />
ϕ(zt+1|st(i), Pt)<br />
z t+1<br />
(1)<br />
zt+1ϕi(zt+1 − εt|st(i),Pt)dzt+1. (2)<br />
Figure 1: Distortions in beliefs result in beliefs with the density (dashed line) being a shifted<br />
version <strong>of</strong> the optimal forecast (solid line).<br />
Figure 1 plots the shape <strong>of</strong> distortions in beliefs for one particular private signal st(i). All<br />
agents deviate symmetrically from the best forecast. Since the equilibrium stock price is de-<br />
7
termined by expectations, it not only contains true information but also distortions in beliefs<br />
acting as aggregate noise. Agents understand the economy perfectly but they neither know the<br />
realization <strong>of</strong> the news shock zt+1 nor the current distortion in beliefs εt. They try to infer both<br />
shocks from their signals. Note that all higher moments under optimal forecasts and distorted<br />
beliefs are identical which rules out any role for higher-order expectations.<br />
I follow Cecchetti, Lam and Mark (2000) in assuming distortions in beliefs rather than mod-<br />
eling their precise nature. There are several appealing features <strong>of</strong> distorted beliefs. First, their<br />
effects on individual losses are tiny. Yet each agent with distorted beliefs imposes a risk exter-<br />
nality on society by adding noise to prices and inhibiting them from being perfectly revealing.<br />
Distortions in beliefs are in that sense rather a modeling tool to introduce noise into prices than<br />
a deviation from rationality as in Hellwig (1980) or Grossman and Stiglitz (1980). Section 4<br />
makes this statement more precise. Furthermore, they allow for a variety <strong>of</strong> micr<strong>of</strong>oundations<br />
through which they can be linked to previous models <strong>of</strong> excess volatility as, for example, over-<br />
confidence (similar to Odean (1998)) or noise trader risk (see e.g. DeLong, Shleifer, Summers<br />
and Waldmann (1988)). Shiller (2003) provides a survey <strong>of</strong> the literature. One possible mi-<br />
cr<strong>of</strong>oundation for the present setup is the presence <strong>of</strong> aggregate noise in private signals that<br />
agents are unaware <strong>of</strong>. Redefining the private signal shows that the micr<strong>of</strong>oundation leads to<br />
an equivalent setup to the one in this paper. Lastly, as Cecchetti, Lam and Mark (2000) show,<br />
appropriately designed distortions <strong>of</strong> beliefs can account for numerous asset pricing anomalies.<br />
Besides buying stocks and bonds, households trade contingent claims on the information prior<br />
to its arrival which are settled at the beginning <strong>of</strong> the following period. Trading <strong>of</strong> contingent<br />
claims merely serves the purpose <strong>of</strong> eliminating the wealth distribution from the state space in<br />
equilibrium. Contingent claim holdings Q i t(zt+1,εt,θt(i)) denote the security holdings <strong>of</strong> agent<br />
i that pay <strong>of</strong>f if the household receives idiosyncratic noise θt(i) when the news shock is zt+1 and<br />
the belief shock εt. Agents can purchase contingent claims at price ωt(zt+1,εt,θt(i)). Households<br />
face the budget constraint<br />
Bt(i) + PtKt+1(i) =R at<br />
c,tPt−1Kt(i) + R at<br />
b,t−1Bt−1(i) − Ct(i) + wtL<br />
+ Q i t−1 −<br />
<br />
ωtQ i t − τg + Tt(i)<br />
where I suppress arguments for contingent claims Q i and their prices ω. wt denotes wages in pe-<br />
riod t, Bt(i) bond holdings, and Rat c,t and Rat b,t the post-intervention returns on capital and bonds<br />
respectively. Households deliver distortionary payments τg defined below, and receive lump-sum<br />
transfers Tt(i) from the government. The first-order conditions with respect to consumption and<br />
stock holdings as choice variables yield the optimality conditions<br />
u ′ (Ct(i)) = β ˜ E u ′ (Ct+1(i))R at<br />
c,t+1 |st(i),Pt<br />
<br />
8<br />
(3)<br />
(4)
and<br />
u ′ (Ct(i)) = βR at<br />
b,t ˜ E u ′ <br />
(Ct+1(i))|st(i),Pt . (5)<br />
Appendix A contains details on the optimal choices for contingent claims trading.<br />
2.2 Representative Firm<br />
A representative firm produces a single consumption good which serves as the numeraire. Inputs<br />
in the production process are capital Kt and labor Lt. The production possibility set is charac-<br />
terized by a Cobb-Douglas production function f(·, ·) and the shock to total factor productivity<br />
zt. We write production <strong>of</strong> output as<br />
e zt f(Kt,Lt) = e zt K α t L1−α<br />
t<br />
with α being the capital share <strong>of</strong> output. Capital depreciates at rate δ and evolves according to<br />
Kt+1 = (1 − δ)Kt + It<br />
where It denotes aggregate investment. There are convex adjustment costs to capital investment<br />
where χ is a positive constant 2 .<br />
ACt = 1<br />
2 χ I2 t<br />
Kt<br />
A representative firm rents capital and labor services at competitive prices from households<br />
to produce the consumption good. It converts It units <strong>of</strong> output, where It can be negative,<br />
into capital goods to sell them at price Pt while incurring adjustment costs. The remaining<br />
output goods are sold on the goods market at a price <strong>of</strong> one. The firm’s problem reduces to a<br />
period-by-period maximization problem given by 3<br />
max e<br />
Kt,Lt,It<br />
zt f(Kt,Lt) − It − wtLt − (Dt + δPt)Kt + PtIt − 1<br />
2 χ I2 t<br />
Kt<br />
where Dt denotes dividend payments. First-order conditions with respect to capital, investment,<br />
2<br />
Models <strong>of</strong> capital accumulation <strong>of</strong> that form have found empirical support (see e.g. Eberly, Rebelo and<br />
Vincent (2008) for a recent contribution).<br />
3<br />
The firm is assumed to be purely equity financed here. However, the same first-order conditions arise in<br />
models where the firm has access to bonds and shares the beliefs <strong>of</strong> agents.<br />
9
and labor determine the optimal choices<br />
e zt fK(Kt,Lt) + 1<br />
2 χ I2 t<br />
K 2 t<br />
e zt fL(Kt,Lt) = wt<br />
− δPt = Dt<br />
(6)<br />
(7)<br />
It = Kt<br />
χ (Pt − 1) (8)<br />
Every period, the proceeds <strong>of</strong> putting capital to work are distributed among shareholders whereas<br />
the marginal product <strong>of</strong> labor determines the wage. The third optimality condition requires some<br />
attention: the firm does arbitrage between consumption and investment goods. The price <strong>of</strong><br />
capital is given by Pt and the firm decides how much to buy or sell at that given price. At<br />
the same time, the price <strong>of</strong> consumption goods is fixed at one. Since the firm pays a quadratic<br />
adjustment costs, <strong>of</strong> converting goods, it makes a non-trivial investment decision. As a result,<br />
the third necessary condition determines the supply <strong>of</strong> capital. The link between stock prices,<br />
i.e. the price <strong>of</strong> capital, and real investment is tight. Whenever stock prices move up, it becomes<br />
lucrative for the firm to convert more goods.<br />
2.3 Resources<br />
The economy is subject to the resource constraint<br />
Ct + Bt + Kt+1 ≤ e zt f(Kt,Lt) + R bt<br />
b,t Bt−1 + (1 − δ)Kt − 1<br />
2 χ I2 t<br />
Kt<br />
where X denotes aggregate variables X = C,K,B,I as opposed to X(i) denoting individual<br />
variables for agent i. In order to guarantee a deterministic steady-state, the risk-free return<br />
pre-intervention Rbt b,t is endogenized via<br />
R bt<br />
b,t = 1 + r + ψeB∗ −Bt . (10)<br />
The world interest rate r, a parameter for decreasing returns to bond holdings ψ, and the<br />
deterministic steady-state level <strong>of</strong> bond holdings B ∗ are all constants. Endogenizing the interest<br />
rate ensures a unique deterministic steady-state and is one among several alternatives to close<br />
a small open economy (for details, see Schmitt-Grohé and Uribe (2003)).<br />
2.4 Definition <strong>of</strong> Equilibrium<br />
The choices <strong>of</strong> households and the firm define a competitive equilibrium. Optimality conditions<br />
for households (4) and (5) have to hold as well as their budget constraints (3), and capital<br />
10<br />
(9)
market clearing given by<br />
<br />
Kt+1(i)φθ(θt(i))di = (1 − δ)Kt + Kt<br />
χ (Pt − 1) (11)<br />
which follows directly from the equation <strong>of</strong> motion for capital. φθ(·) denotes the probability<br />
density function for the normal distribution representing the cross-section <strong>of</strong> households in the<br />
economy. Market clearing in the labor market Lt = L yields wages and dividends and investment<br />
are determined by the firm’s first-order conditions. Furthermore, returns to stocks are defined<br />
in the usual way as<br />
R bt<br />
c,t+1 = Pt+1 + Dt+1<br />
Pt<br />
ensuring that aggregating households’ budget constraints yields the resource constraint.<br />
Since contingent claims trading eliminates the wealth distribution from the set <strong>of</strong> state vari-<br />
ables, we are left with only five state variables, namely capital, bonds, current and next period’s<br />
logarithm <strong>of</strong> total factor productivity, and the belief shock. Let St = (Kt,Bt−1,zt,εt,zt+1) de-<br />
note the set <strong>of</strong> state variables. Except for the distortion <strong>of</strong> beliefs and next period’s total factor<br />
productivity, the state variables S k t = (Kt,Bt−1,zt) are common knowledge among households.<br />
Agents try to infer the remaining two states Su t = (εt,zt+1) from prices and private signals.<br />
Lastly, S∗ = (K∗ ,B ∗ , −1 2σ2 z , −1<br />
2σ2 ε , −1<br />
2σ2 z ) denotes steady-state levels <strong>of</strong> all state variables.<br />
3 Solution method<br />
The model <strong>of</strong> the previous section features dispersion <strong>of</strong> information in a standard small open<br />
economy setup. This section develops a solution technique capable <strong>of</strong> solving this model. Fur-<br />
thermore, the method is applicable to general nonlinear open and closed economy models with<br />
dispersed information. The reader only interested in the results might want to skip this section<br />
and move on to the next. However, there it becomes clear that the results <strong>of</strong> this paper crucially<br />
depend on the novel solution method.<br />
General equilibrium models with capital accumulation and standard preferences are inher-<br />
ently nonlinear. On the one hand, we want to capture nonlinearities through higher-order<br />
approximations, on the other hand closed-form solutions to signal extraction problems are only<br />
available in special (linear) settings. This section provides a tool to bridge the two needs. I show<br />
that a nonlinear change <strong>of</strong> variables can bring the problem into a form in which we can avail <strong>of</strong><br />
perturbation methods to solve for the equilibrium in closed form. Perturbation methods have<br />
previously been used for the study <strong>of</strong> nonlinear dynamic representative agent models. They<br />
deliver an expansion in state variables <strong>of</strong> an arbitrary order and hence accuracy.<br />
The solution method involves the following five steps. First, we build an expansion around<br />
11<br />
(12)
the deterministic steady-state <strong>of</strong> the system and find an approximation to the optimal policy.<br />
Second, I show how a nonlinear change <strong>of</strong> variables brings equilibrium conditions in a form in<br />
which we can compute conditional expectations in closed form. Third, we propose a form for the<br />
market price. Given the nonlinear change <strong>of</strong> variables, there is a natural guess for the functional<br />
form <strong>of</strong> the equilibrium price function. Fourth, taking prices as given, we obtain a solution to<br />
the signal extraction problem. Lastly, we get market clearing and confirm the validity <strong>of</strong> the<br />
guess. In summary, the first two steps make the problem amenable to the standard procedure<br />
for computing linear models with dispersed information carried out in steps three to five.<br />
Starting points for the solution method are the optimality conditions (4) and (5). We stack<br />
them in a vector<br />
F(St,St+1,σ) =<br />
<br />
u ′ (Ct(i)) − βu ′ (Ct+1(i))R at<br />
c,t+1<br />
u ′ (Ct(i)) − βR at<br />
b,t u′ (Ct+1(i))<br />
<br />
. (13)<br />
The expansion in standard deviation <strong>of</strong> shocks σ allows us to get from the deterministic system<br />
(σ = 0) to the stochastic system. There, we choose σ = σz as a normalization and scale<br />
the standard deviation <strong>of</strong> belief shocks proportionately ( σε<br />
σ). We plug in for stock returns<br />
σz<br />
using their definitions (10) and (12) and for consumption using the budget constraints (3).<br />
Furthermore, stock markets clear (see equation (11)). The resulting functional equation that we<br />
ultimately want to solve takes the form<br />
˜Et[F(St,St+1)|st(i),Pt] = 0. (14)<br />
Note that St involves unknown state variables that agents need to forecast.<br />
3.1 Higher-order expansion<br />
This section describes the first step <strong>of</strong> the solution method in which we obtain an approximation<br />
to optimal choices using perturbation methods.<br />
3.1.1 Intuition<br />
Perturbation methods exploit the fact that the solution to a functional equation possesses all<br />
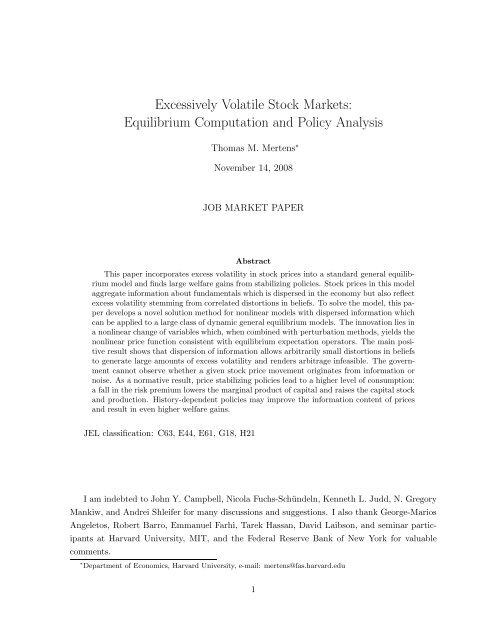
derivatives around a steady-state point. As an example, figure 2 shows optimal stock holdings<br />
as a function <strong>of</strong> capital Kt. It displays the steps to derive an approximate solution. In a first<br />
step, we compute the steady-state value <strong>of</strong> a deterministic version <strong>of</strong> the system (14). The<br />
deterministic steady-state allows us to anchor the expansion. We first expand with respect to<br />
the state variable Kt on the x-axis leading to the thick solid line. Continuing with the expansion<br />
in a second state variable causes the approximation <strong>of</strong> the deterministic system to shift up or<br />
12
down (plotted as thin solid lines around the thick solid line). The crucial step in the procedure is<br />
K t+1<br />
Figure 2: Perturbation methods build an approximation in state variables around the deterministic<br />
steady-state (thick solid line). Expansions in other state variables than the one plotted<br />
shift the approximate solution up or down.<br />
to get to the original problem <strong>of</strong> interest: in order to get to a stochastic economy, we expand the<br />
solution in the standard deviation <strong>of</strong> shocks. In the first step, we follow standard perturbation<br />
procedures that solve the auxiliary problem to (14) using only unconditional expectations. The<br />
following step in section 3.2 then shows how to get to the problem <strong>of</strong> dispersed information<br />
where we solve for conditional expectations.<br />
To get from the deterministic to the stochastic economy, we have to build at least a second-<br />
order expansion with respect to the standard deviation <strong>of</strong> shocks. Applied to our problem, it<br />
means that the stochasticity affects the economy through the second moment <strong>of</strong> shocks and hence<br />
through a risk premium channel. When returns become risky, agents demand a compensation<br />
through higher mean returns. Incorporating second-order terms with respect to the standard<br />
deviation leads the deterministic solutions (solid lines) to shift (here down to the dashed lines).<br />
The effect shows that a second-order term can have a first-order effect on equilibria through<br />
risk-premium effects. The 45 ◦ line intersects with the stochastic solution to the left <strong>of</strong> the<br />
intersection with the deterministic choice. Hence, the stochastic steady-state level <strong>of</strong> capital is<br />
lower than the deterministic.<br />
3.1.2 Expansion<br />
For the method to be applicable to a specific problem, we have to make sure that the policies<br />
are analytic in the neighborhood <strong>of</strong> the deterministic steady-state. Since all derivatives <strong>of</strong> our<br />
equilibrium equations F(·, ·, ·) in equation (13) exist, we have the necessary regularity to carry<br />
out the expansion. Jin and Judd (2002) discuss appropriate implicit function theorems in detail.<br />
13<br />
K t
In a first step, we solve the nonlinear system <strong>of</strong> equations F(·, ·,0) to get deterministic steady-<br />
state values. Obtaining first derivatives with respect to states involves solving nonlinear systems<br />
<strong>of</strong> equations for coefficients <strong>of</strong> the approximation. For all higher derivatives, the systems to be<br />
solved are linear. Appendix B contains details <strong>of</strong> the solution procedure.<br />
The resulting approximation to the optimal policies can be written as<br />
Xt(St, θt(i)) ≈ <br />
(i1 + i2 + . . . + i6)!<br />
i1,i2,...,i6<br />
1<br />
∂ i1+i2+...+i6Xt(St)<br />
∂K i1<br />
t ∂Bi2 t−1∂zi3 t ∂εi4 t ∂zi5 t+1∂σi6 <br />
<br />
<br />
<br />
St=S ∗<br />
· (Kt − K ∗ ) i1 (Bt−1 − B ∗ ) i2 (zt − z ∗ ) i3 (εt − ε ∗ ) i4 (zt+1 − z ∗ ) i5 σ i6 + xθ(St, θt(i))<br />
for X = Kt+1,Ct. It takes the form <strong>of</strong> a Taylor approximation around the deterministic steady-<br />
state. We approximate optimal policies with a polynomial whose coefficients we get from ap-<br />
plying perturbation methods. For the sake <strong>of</strong> brevity, we can rewrite the expansion <strong>of</strong> equation<br />
(15) as<br />
ˆX(S,θ(i)) = <br />
n∈S<br />
1<br />
|n|!<br />
∂ n X<br />
∂S n<br />
<br />
<br />
St=S ∗<br />
<br />
i<br />
(Sni − S∗ ni )ni + xθ(S,θ(i))<br />
where S = {(1,0,0,0,0,0),(2,0,0,0, 0, 0), ...} is the set <strong>of</strong> all multi-indices <strong>of</strong> the expansion,<br />
|n| = <br />
i ni, xn = <br />
i xni , and Sni is the ni-th component <strong>of</strong> the state vector S.<br />
3.2 Change <strong>of</strong> variables<br />
This section describes the crucial step that enables us to solve nonlinear models with dispersed<br />
information. To solve the signal extraction problem analytically, we want an expansion <strong>of</strong> the<br />
form (15) for all terms in Euler equations (4) and (5). Recall that in the first step we only<br />
solved for the unconditional expectation in (14). This section demonstrates how we can obtain<br />
a nonlinear price function that allows us to solve the conditional expectations operator consistent<br />
with the price function as in equation (14).<br />
The variables <strong>of</strong> interest in the Euler equations are marginal utility, returns, and stock<br />
prices. To get from the optimal choice for consumption to marginal utility, we can perform an<br />
expansion in the logarithm <strong>of</strong> consumption. For the logarithm <strong>of</strong> stock prices, the idea is to map<br />
individual demand Kt+1(i) into an individually requested “price” p(i) which we can aggregate<br />
to get market prices. A nonlinear change <strong>of</strong> variables allows us to get the right transformation.<br />
The “individual price” p(i) would prevail as a market price if agent i’s capital holdings would<br />
coincide with average holdings in that period. We define it as<br />
<br />
Kt+1(i)<br />
pt(i) = log χ − (1 − δ) + 1 . (16)<br />
Kt<br />
Lower case letters for state variables and aggregate variables denote the logarithm there<strong>of</strong>. Judd<br />
(2002) shows that a nonlinear change <strong>of</strong> variables can be carried out in a simple operation. In a<br />
14<br />
(15)
slight extension, I show that a state-dependent nonlinear change <strong>of</strong> variables such as the one for<br />
pt(i) can be computed in the same fashion. Using the chain rule, we see that we have to take<br />
the derivative <strong>of</strong> the transformation at the point <strong>of</strong> expansion into account:<br />
ˆp(i) = 1<br />
|n|!<br />
n∈S<br />
∂ n p<br />
∂K n t+1<br />
∂ n Kt+1<br />
∂S n<br />
<br />
<br />
St=S ∗<br />
<br />
i<br />
(Sni − S∗ ni )ni + pθθ(i). (17)<br />
Hence, we only have to multiply the coefficient in the expansion by the derivative <strong>of</strong> the trans-<br />
formation. We also transform consumption into log consumption in the same fashion. To get an<br />
expansion for the logarithm <strong>of</strong> returns, we use the definition <strong>of</strong> stock returns given by equation<br />
(12) and hence know the nonlinear transformation. The implementation is analogous to stock<br />
prices and can be found in more detail in appendix B.1.<br />
3.3 Proposal<br />
As in any linear noisy rational expectations equilibrium, we guess a form <strong>of</strong> the price that we<br />
confirm subsequently. To form the right proposal, it is important to notice that the stock market<br />
clearing condition can be written as an aggregation over individual choices pt(i)<br />
<br />
pt =<br />
pt(i)φθ(θ(i))di. (18)<br />
This form <strong>of</strong> aggregation is equivalent to the previously described market clearing condition (11)<br />
as can be seen using equation (16). Hence, a natural proposal for the price is the average <strong>of</strong> all<br />
“individual prices” p(i). Furthermore, averaging over all prices preserves the structure <strong>of</strong> the<br />
expansion and eliminates all idiosyncratic noise from equation (17). Contrary to standard lin-<br />
ear setups, coefficients are state dependent, there are higher-order terms in the proposed price,<br />
and we have a nonlinear guess for the equilibrium price function. A higher-order approxima-<br />
tion in unknown state variables εt and zt+1 incorporates higher moments <strong>of</strong> their distributions.<br />
Since higher moments are common knowledge among households, they do not influence signal<br />
extraction directly.<br />
3.4 Signal extraction<br />
Given the functional form <strong>of</strong> stock prices in (17) that delivers a guess for stock prices, we can<br />
compute conditional expectations operators. With transformations <strong>of</strong> consumption to marginal<br />
utility, returns to log returns, and stock holdings to individual prices, both Euler equations (4)<br />
and (5) are in a form where all terms that are not common knowledge are split into a normally<br />
distributed part and higher moments. As derived in subsection 3.2, we have expansions for all<br />
15
terms in the Euler equations to which we apply the logarithm on both sides <strong>of</strong> the equation<br />
and<br />
−γct = log(β) + r at<br />
b,t − γ ˜ Et[ct+1|st(i),Pt] + γ2<br />
2 vart[ct+1|st(i),Pt] (19)<br />
−γct = log(β) + ˜ Et[r at<br />
c,t+1 − γct+1|st(i),Pt] + 1 at<br />
vart[rc,t+1 − γct+1|st(i),Pt] (20)<br />
2<br />
When carrying out the signal extraction problem, it becomes clear why it is helpful if distortions<br />
in beliefs only affect the mean and not higher moments. Given beliefs defined in equation (2), we<br />
can take a higher-order approximation but only have to carry out the signal extraction problem<br />
over mean productivity. All higher moments <strong>of</strong> the distribution are common knowledge.<br />
Exploiting the normality assumption <strong>of</strong> shocks, we can solve for the conditional expectation<br />
in the regular fashion. The signal extraction problem results in expectations <strong>of</strong> the form<br />
Et[x|st(i),Pt] = e x S(S k t ) + e x s(S k t )st(i) + e x p(S k t )pt.<br />
where x can be the logarithm <strong>of</strong> consumption, returns, or prices. The first part is a known<br />
state-dependent part independent <strong>of</strong> the information from private signals and the stock price.<br />
Expectations put weight on two signals to get the optimal expectation about variable x.<br />
3.5 Market clearing<br />
The last step is to make the result <strong>of</strong> the signal extraction problem compatible with the proposal.<br />
The perturbation method relies on having fixed volatilities for all shocks. In particular, the noise<br />
in prices was fixed at some free parameter value (as a multiple <strong>of</strong> the noise in the system measured<br />
by σ). In order to get market clearing, the volatility <strong>of</strong> the noise in prices has to match the<br />
volatility implied by signal extraction, i.e. the coefficients have to match. Appendix C carries<br />
out all steps in detail.<br />
3.6 Value function<br />
In the same fashion as we compute an approximation to the optimal policies, we can find an<br />
asymptotically valid approximation for the value function 4 . Define the objective function for<br />
households as in equation (1); the residual <strong>of</strong> the recursion for the value function is<br />
FV (St,St+1) = V (St) − u(Ct(i)) − βV (St+1). (21)<br />
4 I am indebted to Ken Judd for suggesting the use <strong>of</strong> computing welfare by approximating value functions.<br />
16
The value function then has to obey the functional equation ˜ Et[FV |st(i),Pt] = 0. Using the<br />
same techniques as in section 3.1, we can derive an expansion for the value function<br />
ˆV = <br />
l∈S<br />
1<br />
|l|!<br />
∂ l X<br />
∂S l<br />
<br />
<br />
S=S ∗<br />
<br />
i<br />
(Sli − S∗ li )li + vθθ.<br />
We use the true law <strong>of</strong> motion for all states to derive the value function. Therefore, agents<br />
understand the economy perfectly and agree on transitions. The disagreement only occurs for<br />
unobserved states. In order to compute expected utility under distorted beliefs, agents then<br />
forecast the unknown states S u t = (εt,zt+1) at time t.<br />
Having an approximation to the value function simplifies welfare comparisons under different<br />
policies significantly. For a given state, we simply evaluate V for given private and public signals<br />
to get expected utility <strong>of</strong> an agent. Furthermore, we can aggregate over all agents to get the<br />
value <strong>of</strong> social welfare.<br />
3.7 Discussion<br />
The method developed in this section has the advantage <strong>of</strong> being universally applicable to nonlin-<br />
ear noisy rational expectations equilibria. In particular, it does not require specific assumptions<br />
such as constant absolute risk aversion or the absence <strong>of</strong> labor income risk or intertemporal hedg-<br />
ing demand as do previously suggested methods. However the functional form for the change<br />
<strong>of</strong> variables might have to be adapted to the model at hand. Approximating the logarithm <strong>of</strong><br />
consumption, as suggested here, is useful since it prevents consumption from becoming negative.<br />
Since the resulting approximation is asymptotically valid, it is up to the user to decide how many<br />
orders are necessary for a good fit. There is a reliable way <strong>of</strong> performing error estimation via<br />
first-order conditions discussed in appendix B.2 which applies to other nonlinear models accord-<br />
ingly. Most importantly, due to asymptotic validity, we can compute effects on steady-states<br />
through higher-order expansions in state variables and the standard deviation. A computer al-<br />
gebra system as for example Mathematica allows for easy implementation and circumvents the<br />
arduousness <strong>of</strong> having to compute derivatives by hand.<br />
4 Equilibrium and Positive Implications<br />
This section applies the solution method <strong>of</strong> the previous section to the model and studies prop-<br />
erties <strong>of</strong> the competitive equilibrium.<br />
17
4.1 Equilibrium<br />
To obtain a solution for all equilibrium variables, I follow the five steps prescribed in the previous<br />
section. Given the parameters, I compute an expansion <strong>of</strong> optimal policies for consumption and<br />
stock holdings to complete the first step and transform the solution into the logarithms <strong>of</strong><br />
consumption, stock prices, and stock returns. Aggregation over transformed stock holdings<br />
yields a guess for the logarithm <strong>of</strong> stock prices <strong>of</strong> the form<br />
ˆpt = pS(S k t ) + pε(S k t )µεt + pzt+1 (Sk t )zt+1<br />
where µ is a constant that relates distortions in beliefs to noise in prices. This constant deter-<br />
mines whether there is amplification <strong>of</strong> distortions in beliefs when aggregation <strong>of</strong> information<br />
takes place.<br />
The guess for the price function looks intriguingly simple. The key to understanding the<br />
form lies in the nonlinear expansion carried out in the previous section (see equation (17)). The<br />
known state-dependent part <strong>of</strong> the price function pS(S k t<br />
(22)<br />
) is a nonlinear function <strong>of</strong> all known<br />
state variables and also contains information about higher moments <strong>of</strong> the distribution which<br />
are known to all agents. The only unknown parts <strong>of</strong> the logarithm <strong>of</strong> stock prices are true<br />
information zt+1 versus aggregate noise µεt. Thus the equilibrium stock price contains not<br />
only information about the state <strong>of</strong> the economy in a given period but also information about<br />
productivity in the following period as well as noise stemming from distorted beliefs. Hence it<br />
is excessively volatile.<br />
Since total factor productivity z and belief shifters ε are normally distributed, expectations<br />
on the right-hand side <strong>of</strong> logged Euler equations (19) and (20) are normally distributed. Because<br />
the state variables capital and bonds are determined this period and tomorrow’s unknown states<br />
are unforecastable, the only remaining state to be predicted is next period’s productivity. The<br />
undistorted expectation <strong>of</strong> next period’s logarithm <strong>of</strong> productivity zt+1 takes a linear form<br />
Et[zt+1|st(i),Pt] = eS + esst(i) + epˆpt<br />
= eS + eppS + (es + ep)zt+1 + epµεt + esθt(i).<br />
where I suppressed the state variables as an argument to state-dependent constants.<br />
The state-dependent constant in front is known to all agents. The coefficients on shocks solve<br />
the signal extraction problem that makes the best prediction about next period’s total factor<br />
productivity given the two signals. The private signal contains information and idiosyncratic<br />
noise whereas the public signal contains information and aggregate noise. Optimal expectations<br />
put positive weight on the private as well as the public signal. Therefore, optimal expectations<br />
themselves contain noise from belief shifters as it is impossible to filter them out.<br />
18<br />
(23)
Yet agents in the economy do not hold optimal beliefs. Their expectation about next period’s<br />
total factor productivity is distorted by a belief shock ε as defined in (2). It is given by<br />
˜E[zt+1|st(i),Pt] = Et[zt+1|st(i),Pt] + εt.<br />
The last step completes the procedure by imposing market clearing and verification <strong>of</strong> the<br />
guess. There is a unique solution for the coefficients that solves the signal extraction problem<br />
as well as market clearing. Consequently, the approximate solution to the equilibrium is unique.<br />
Appendix C contains a derivation <strong>of</strong> this result and lays out how to obtain coefficients for optimal<br />
expectations.<br />
4.2 Positive Implications <strong>of</strong> the Model<br />
As shown in the previous subsection, optimal beliefs use both signals to make the best possi-<br />
ble forecast about next period’s productivity. Households deviate from optimal forecasts by a<br />
distortion in beliefs that adds to aggregate noise in prices. This property stems from the fact<br />
that aggregate noise is a multiple <strong>of</strong> distortions in beliefs. The equilibrium price function then<br />
solves the following fixed point problem: it delivers the price which prevails under households’<br />
expectations that deviate by their distortion in beliefs from the optimal expectation obtained<br />
under a given price.<br />
The following proposition shows that even tiny distortions can create a substantial amount<br />
<strong>of</strong> excess volatility in stock prices. Agents with and without belief shifters have the same<br />
expectations in the limit and the economy displays excess volatility.<br />
Proposition 4.1 (Amplification)<br />
An equilibrium with a given amount <strong>of</strong> excess volatility in stock prices below an upper bound<br />
<strong>of</strong> pε(S k t )µεt < γσ2 η<br />
σ 2 η +σ2 θ<br />
can be sustained with arbitrarily small distortions in beliefs as informa-<br />
tion gets more dispersed in the economy. More formally, aggregation <strong>of</strong> information amplifies<br />
distortions in beliefs, i.e.<br />
µ → ∞ for σθ → ∞.<br />
Pro<strong>of</strong>: Appendix D lays out the pro<strong>of</strong> <strong>of</strong> the proposition. <br />
As information gets more dispersed across households, the private signal becomes less in-<br />
formative. Optimal beliefs adjust by putting relatively more attention to the public signal.<br />
There are two immediate implications: first, if agents put less weight on private signals, less<br />
information enters the equilibrium stock price and hence optimal expectations. Second, optimal<br />
expectations catch more aggregate noise. Households deviate from those optimal expectations<br />
by their belief shocks, thus adding more noise to expectations and in turn prices. This noise<br />
19
feeds back into optimal expectations and so forth. Proposition 4.1 shows that, in the limit as<br />
information becomes more dispersed, amplification becomes arbitrarily small.<br />
We can use arbitrarily small distortions in beliefs to generate a given level <strong>of</strong> excess volatility<br />
in prices. By definition this means that the difference between households’ and optimal expec-<br />
tations is arbitrarily small. In the limit, both expectations coincide and we get the following<br />
corollary.<br />
Corollary 4.2 (Convergence to Noise Trader Equilibrium)<br />
The limit <strong>of</strong> completely dispersed information, i.e. σθ = ∞, is an equilibrium with the same<br />
price function and allocation as an economy with rational agents and noise traders.<br />
The corollary shows that belief distortions serve as a way <strong>of</strong> generating noise in prices and<br />
create excess volatility. The main purpose <strong>of</strong> an individual distortion in beliefs remains to<br />
make the equilibrium price function consistent with individual choices. Hence it is an alter-<br />
native to assuming noise traders as, for example, in Hellwig (1980) or Grossman and Stiglitz<br />
(1980). Furthermore, as distortions in beliefs can be arbitrarily small, they impose little costs<br />
on households. Through having the same mistaken beliefs as everybody else, though not costly<br />
individually, agents impose a risk externality on the economy. Since each household’s distortions<br />
add to aggregate noise, each individual demand pushes prices even further in the direction <strong>of</strong><br />
noise and makes it more difficult for others to filter out information from prices.<br />
The difference in expectations between households and optimal beliefs is a measure for how<br />
much pr<strong>of</strong>its optimally acting agents can earn. Since the expectation about next period’s pro-<br />
ductivity pins down the expectation <strong>of</strong> the stock return, it determines the difference in portfolio<br />
decisions between households and a hypothetical agent with optimal beliefs. From proposition<br />
4.1, it then follows:<br />
Corollary 4.3 (Absence <strong>of</strong> Excess Pr<strong>of</strong>its for Optimally Acting Agents)<br />
There are no extra pr<strong>of</strong>its to be made for agents with optimal beliefs if information in the economy<br />
is fully dispersed.<br />
In other words, if expectations about future returns and state variables coincide, portfolio and<br />
consumption decisions will be the same, too. But although agents might hold almost optimal<br />
beliefs, welfare in the economy might be severely affected through noise in prices. The following<br />
sections explore whether a government can improve on equilibrium allocations.<br />
5 Policy Intervention<br />
This section introduces a government into the model which aims at improving on social welfare.<br />
Distortions in beliefs constitute the only departure from the first welfare theorem. The govern-<br />
20
ment wants to shield the economy from harmful effects <strong>of</strong> excess volatility. I study two classes <strong>of</strong><br />
policy intervention capable <strong>of</strong> stabilizing prices. First, the government can condition its policy<br />
on prices which generates a trade<strong>of</strong>f between reducing volatility <strong>of</strong> prices and preserving the<br />
reaction to true information. Second, policy can additionally condition on previous period’s<br />
misjudgment. While the first class <strong>of</strong> policies merely treats the symptoms <strong>of</strong> excess volatility,<br />
the latter policy is able to alter the information content <strong>of</strong> prices and even reduce the level <strong>of</strong><br />
excess volatility.<br />
5.1 Government<br />
The government maximizes social welfare <strong>of</strong> agents defined as the sum <strong>of</strong> all expected discounted<br />
utilities in the economy. Importantly, the government does not have superior information. The<br />
government observes equilibrium prices and the state <strong>of</strong> the economy ins<strong>of</strong>ar as it is common<br />
knowledge. The government can thus be thought <strong>of</strong> as all agents agreeing on policy intervention<br />
prior to the arrival <strong>of</strong> information in a given period. The crucial difference between the govern-<br />
ment and individuals lies in the ability to change prices. The government therefore has various<br />
policy interventions τ j at hand which it can install in order to raise social welfare. For now, I<br />
am intentionally vague about the exact nature <strong>of</strong> the policy intervention which the next section<br />
then discusses. The government balances its budget every period by redistributing any revenues<br />
arising in a lump-sum fashion. The government’s task is to maximize<br />
max E<br />
τj <br />
<br />
∞<br />
˜Et β t <br />
<br />
<br />
u(Ct(i)) s(i),P φθ(θ(i))di<br />
subject to the economy being in an equilibrium and budget balance.<br />
t=0<br />
Using results <strong>of</strong> section 3.6, we get an approximate closed-form expression for social welfare<br />
<strong>of</strong> the form<br />
(24)<br />
ˆV (St) = VS(S k t ) + Vε(S k t )µεt + Vzt+1 (Sk t )zt+1 + Vσ(S k t ). (25)<br />
As a robustness check, I study the social welfare function that takes forecasts under optimal<br />
beliefs as its argument rather than social welfare under distorted beliefs. The resulting policy<br />
intervention is less aggressive than the one implied from social welfare in equation (24) but the<br />
effects are tiny. The reason for very small differences between the two policies lies in the fact<br />
that distortions are very small. Section 7.3 contains details on the robustness check.<br />
21
5.2 Policy intervention<br />
The government’s goal is to shield the economy from negative impacts <strong>of</strong> excess volatility. At the<br />
same time, it wants to preserve price responses to true information and let investment respond to<br />
it. Lastly, the government acknowledges that policies might affect the formation <strong>of</strong> expectations<br />
and it does not want to exacerbate amplification <strong>of</strong> belief shocks to aggregate noise. Since the<br />
government cannot detect distortions in beliefs, it is left with the options <strong>of</strong> stabilizing prices<br />
by conditioning its policy on stock prices or it can additionally use information about previous<br />
periods. The following sections explore the implications <strong>of</strong> policies <strong>of</strong> this sort.<br />
5.2.1 Policy conditioning on prices<br />
In a first step, I analyze a policy that allows the government to target the reaction to both<br />
unknown shocks, true information as well as aggregate noise, simultaneously. Therefore, I study<br />
a general policy that allows the government to stabilize prices, i.e. a policy that lowers the<br />
volatility <strong>of</strong> prices in equation (22). The next section deals with specific instruments as for<br />
example an interest rate policy. The general policy takes the form<br />
τ(p,p ref ) = t g (p − p ref ). (26)<br />
The reference price p ref is the price that would occur given current known state variables if news<br />
and belief shocks would take on their mean. The policymaker determines the price that would<br />
occur solely based on the knowledge <strong>of</strong> known state variables. In other words, it is the known<br />
state dependent part in equation (22), p ref<br />
t = pS(S k ). Any deviation <strong>of</strong> the current period’s<br />
stock price from the reference price has to stem from current period’s news and belief shocks<br />
τ(p,p ref ) = t g (pzt+1 zt+1 + pεtµεt).<br />
Policy conditioning on prices hence affects price reactions to both shocks symmetrically. If<br />
the reaction to excess volatility is dampened, it also reduces the reaction <strong>of</strong> prices and hence<br />
investment to true information.<br />
Observation 5.1 (Stability-Efficiency Trade<strong>of</strong>f)<br />
The government faces a trade<strong>of</strong>f between stabilizing prices and efficiency (since dampened re-<br />
sponses reduce reactions to shocks to fundamentals).<br />
This stability-efficiency trade<strong>of</strong>f determines the optimal policy intervention. To see the effects<br />
formally, we can use the closed-form approximation to social welfare <strong>of</strong> equation (25). Four<br />
22
terms matter for changes due to policy intervention:<br />
dV<br />
= κ1<br />
dtg ∂Vε ∂Vzt+1<br />
+ κ2 + κ3<br />
∂tg ∂tg ∂Cσ2 + κ4<br />
∂tg ∂Kσ2 .<br />
∂tg The first term is positive as it describes a correction for Jensen’s inequality due to reduced<br />
reaction <strong>of</strong> the economy to aggregate noise. The second term corrects social welfare for a loss<br />
in efficiency due to a dampened reaction <strong>of</strong> prices and thus investment to true information.<br />
The last two terms only appear in a nonlinear equilibrium but have a first-order effect.<br />
A (log-) linear solution around the deterministic steady-state would not contain the effects <strong>of</strong><br />
volatility on consumption and capital. These two terms represent the influence <strong>of</strong> the variance<br />
<strong>of</strong> shocks on the two margins. The third term captures the impact <strong>of</strong> policy intervention on<br />
how volatility affects the consumption-savings decisions while the last term reflects the effect on<br />
capital accumulation. The consumption-savings margin tilts towards less savings if stock returns<br />
become more volatile without a compensation in mean returns. Policy intervention mitigates the<br />
influence <strong>of</strong> volatility and the consumption-savings margin reacts less to impacts <strong>of</strong> shocks. The<br />
main effect comes from the impact <strong>of</strong> volatility on capital accumulation. In equilibrium, capital<br />
has to adjust in order to deliver the required return on stocks. Policy intervention shields the<br />
economy from shocks by dampening the volatility in stock prices. Price stabilizing policies not<br />
only reduce the price response to shocks but indirectly lower the variance <strong>of</strong> returns and thus the<br />
risk premium. Since the now lower expected return must be reflected in lower mean dividends,<br />
the marginal product <strong>of</strong> capital falls leading to a higher level <strong>of</strong> capital and production in the<br />
stochastic steady-state. Policy thus affects consumption through raising the net present value<br />
<strong>of</strong> production.<br />
Observation 5.2 (Welfare gains)<br />
The standard upper bound for the gains from stabilization does not apply to the economy. A sta-<br />
bilizing policy increases mean consumption and can thus bring about considerably larger welfare<br />
gains.<br />
Lucas (1987) computes the cost <strong>of</strong> business cycles as the percentage share <strong>of</strong> consumption that<br />
agents would be willing to give up to replace a stochastic consumption path by constant mean<br />
consumption. Calibrating the consumption stream to the data, Lucas (1987) finds the cost <strong>of</strong><br />
business cycles to be very small. The reduction in the volatility <strong>of</strong> consumption streams serves<br />
as a measure for the welfare benefits the best stabilizing policy can achieve. Results in this<br />
economy suggest otherwise: stabilizing asset markets brings about a higher mean consumption<br />
and thus large welfare gains.<br />
The discussion so far dealt with the direct effects <strong>of</strong> policy intervention on price responses.<br />
The question is how the use <strong>of</strong> information and thus the amount <strong>of</strong> excess volatility in prices<br />
is affected. The following proposition shows that the use <strong>of</strong> information does not change in<br />
23
esponse to policy intervention in this setting.<br />
Proposition 5.3<br />
The information content <strong>of</strong> prices does not change in response to policy intervention.<br />
Pro<strong>of</strong>: The pro<strong>of</strong> <strong>of</strong> proposition 5.3 is in Appendix E. <br />
This proposition states that policy does not alter agents’ expectations about next period’s<br />
productivity. Intuitively, agents know prices in the setting without intervention and hence do<br />
not gain any information through policy intervention. Furthermore, policy affects the reaction<br />
to news and belief shocks symmetrically so that no incentives for a different use <strong>of</strong> information<br />
arise.<br />
The choice <strong>of</strong> the social welfare function ensures that households would favor policy interven-<br />
tion prior to arrival <strong>of</strong> information in a given period. Since every agent has the same expected<br />
utility in equilibrium after contingent claims have been settled, any policy intervention that<br />
raises social welfare would necessarily be favored by all agents. The social welfare function thus<br />
guarantees unanimous support for stabilizing policy. Even after the arrival <strong>of</strong> private and public<br />
signals, the median voter would still favor policy intervention. Since we have a shift in mean<br />
consumption, the government can raise welfare for the majority <strong>of</strong> households.<br />
5.2.2 Backward-looking Policy<br />
The previous class <strong>of</strong> policies trades <strong>of</strong>f stability for efficiency in the best possible manner<br />
without affecting the use <strong>of</strong> information. Policies conditioning only on prices, however, do not<br />
exploit all information the government has in a given period. <strong>Stock</strong> prices in period t reflect<br />
news about next period’s productivity as well as aggregate noise. In the period t + 1, total<br />
factor productivity becomes public information and so does period t’s misjudgment. Thus the<br />
government can condition its policy on the misjudgment <strong>of</strong> the previous period to get a policy<br />
intervention <strong>of</strong> the form<br />
τ(pt,εt−1) = t e p(pt − p ref<br />
t ) + t e ε(εt−1 − ε ∗ ). (27)<br />
In order to compute the competitive equilibrium under this policy, the set <strong>of</strong> state variables has<br />
to be enlarged. Last period’s distortion in beliefs becomes part <strong>of</strong> the state space leading to a<br />
vector <strong>of</strong> states Se,t = (Kt,Bt−1,εt−1,zt,εt,zt+1).<br />
If the government lowers the pay<strong>of</strong>f <strong>of</strong> stocks in response to revelation <strong>of</strong> previous period’s<br />
overpricing and conversely for undervaluations, investors not only have to forecast stock pay<strong>of</strong>fs<br />
but also policy interventions. As a result, stock prices lose some <strong>of</strong> their predictive power for<br />
asset pay<strong>of</strong>fs because stock prices depend positively on belief shocks whereas policy leads stock<br />
24
payouts to decrease in them. Agents thus have an incentive to put relatively more weight on<br />
the private signal. As a direct consequence, we get:<br />
Lemma 5.4 (Backward-looking Policy Influences Use <strong>of</strong> Information)<br />
By conditioning its policy on previous period’s misjudgments, the government can alter the way<br />
people use information to form expectations.<br />
Pro<strong>of</strong>: Appendix F contains the pro<strong>of</strong>. <br />
When people put relatively more weight on private signals, more information about funda-<br />
mentals enters the stock price. The thereby improved information content <strong>of</strong> prices together<br />
with the fact that agents put less weight on the price to form expectations implies that optimal<br />
beliefs contain less aggregate noise. Therefore, aggregate noise feeds back less into expectations<br />
<strong>of</strong> all agents and amplification partly unravels.<br />
Proposition 5.5 (Mitigated Amplification)<br />
Backward-looking policy mitigates amplification <strong>of</strong> belief shocks in prices and thus reduces excess<br />
volatility.<br />
Pro<strong>of</strong>: Please see appendix G for the pro<strong>of</strong>. <br />
A history-dependent (backward-looking) policy gets to the root <strong>of</strong> the problem and mitigates<br />
amplification. The policy rule influences the stability-efficiency trade<strong>of</strong>f advantageously and can<br />
thus bring about larger welfare gains. The next section contains a calibration and the welfare<br />
effects <strong>of</strong> policy instruments.<br />
6 Policy Instruments and their Effects<br />
We now turn to a discussion on implementable policies <strong>of</strong> the classes studied in the previous<br />
section. I first discuss a benchmark calibration for parameters and a welfare measure that allows<br />
to quantify gains from implementation. I discuss a reference equilibrium without any distortions<br />
for comparison <strong>of</strong> welfare gains. The next parts discuss policies conditional on prices, specifically<br />
open market operations, an interest rate rule, and a backward-looking interest rate rule.<br />
6.1 Calibration<br />
Table 1 lists parameter values for the benchmark economy. There seems to be a consensus in<br />
the literature over some <strong>of</strong> the parameters, others require further discussion. I choose a utility<br />
function with relative risk aversion γ = 1 for the benchmark case and carry out robustness checks<br />
with respect to the value <strong>of</strong> γ. The depreciation rate δ is set at 10% and the capital share α at<br />
25
one third. The risk-free world interest rate r is constant at 3% which implies a time preference<br />
rate β <strong>of</strong> 1/(1 + r) ≈ 0.97 to pin down constant consumption in deterministic steady-state. The<br />
risk-free rate moves only slightly with the level <strong>of</strong> bond holdings. The corresponding parameter<br />
ψ is set at 10 −5 . I set the parameter for adjustment costs χ to one. In section 7.1, I perform<br />
robustness checks. A labor force <strong>of</strong> 1 merely serves as a normalization. As a natural benchmark,<br />
I look at an economy that holds all wealth inside its boundaries in deterministic steady-state. I<br />
therefore choose steady-state bond holdings B ∗ to be zero. The remaining parameters require<br />
further discussion. I match the standard deviation <strong>of</strong> returns σR to be 0.18 measured for US data<br />
(see Campbell (2003)). In the benchmark calibration, I set the standard deviation <strong>of</strong> returns<br />
due to fundamentals to be two thirds <strong>of</strong> the standard deviation <strong>of</strong> returns. The remainder <strong>of</strong><br />
0.06 <strong>of</strong> the standard deviation <strong>of</strong> returns is due to noise where the standard deviation <strong>of</strong> belief<br />
shifters σε is only 0.000015. A one standard deviation event <strong>of</strong> agents belief distortions is thus<br />
marginal and households hold almost optimal beliefs.<br />
Relative risk aversion γ 1<br />
Depreciation rate δ 0.1<br />
Capital share <strong>of</strong> output α 1<br />
3<br />
Endogenized interest rate ψ 0.00001<br />
Adjustment cost parameter χ 1<br />
Labor force L 1<br />
World interest rate r 0.03<br />
Steady-state bond holdings B ∗ 0<br />
Time preference rate β 1<br />
1+r<br />
Standard deviation <strong>of</strong> returns σR 0.18<br />
Std. dev. <strong>of</strong> excess volatility σε,R 0.06<br />
Table 1: Parameter values for benchmark case.<br />
As a welfare measure, I use the percentage increase <strong>of</strong> consumption that agents would have<br />
to receive in competitive equilibrium to be indifferent between remaining in equilibrium and<br />
putting a policy in place and transitioning to a new equilibrium. More formally, it is the<br />
fraction λ that equates utility from competitive equilibrium consumption streams C ce<br />
t (i) and<br />
consumption streams under policies C pi<br />
t (i)<br />
˜Et<br />
∞<br />
t=0<br />
β t log((1 + λ)C ce<br />
t )<br />
<br />
= ˜ Et<br />
6.2 Reference equilibrium without distortions<br />
∞<br />
t=0<br />
β t log(C pi<br />
t )<br />
As a reference point for welfare gains, this section discusses an equilibrium in which all agents<br />
hold optimal beliefs. The signal extraction problem is trivial as there is no idiosyncratic com-<br />
26
ponent in expectations because prices reveal next period’s total factor productivity as shown by<br />
Grossman (1976). Since in this economy only news shocks remain, there is no noise in stock<br />
prices and returns. Steady-state levels <strong>of</strong> capital and consumption are thus higher than in the<br />
benchmark case with distorted beliefs. The first welfare theorem applies for this economy and<br />
hence there is no welfare improving intervention. Compared to the equilibrium without inter-<br />
vention, agents would gain 1.13% <strong>of</strong> consumption if they would start out from the steady-state<br />
<strong>of</strong> the competitive equilibrium with distortions in beliefs and beliefs were undistorted from then<br />
on.<br />
Welfare gains originate from an initial jump in consumption and the transition to the new<br />
steady-state level. Higher consumption is justified by a higher steady-state level <strong>of</strong> capital and<br />
thus a higher net present value <strong>of</strong> production. Effects on capital accumulation arise for the same<br />
reason that I discuss in the previous section: the risk-premium <strong>of</strong> the economy falls which allows<br />
a lower expected return on stocks which matches the marginal product <strong>of</strong> capital. Hence the<br />
capital stock rises with less volatility and brings about welfare gains.<br />
6.3 Policies conditional on prices<br />
This section analyzes the effects <strong>of</strong> two policies that condition on economic activity. First, I<br />
discuss open market operations where the government buys and sells securities. Second, I look<br />
at an interest rate policy which comes closest to monetary policy in a model without frictions.<br />
6.3.1 Open Market Operations<br />
The government can influence stock markets in the most direct way by participating in them.<br />
<strong>Stock</strong> prices are invariably linked to the amount <strong>of</strong> investment in the economy. The government<br />
can influence the amount <strong>of</strong> investment and thus affect stock prices to shield the economy from<br />
harmful effects <strong>of</strong> excess volatility. The form <strong>of</strong> intervention I consider is a linear time-invariant<br />
demand schedule for the government <strong>of</strong> the form<br />
K gov ref<br />
t+1 (Kt+1,Kt+1 ) = tk (Kt+1 − K ref<br />
t+1<br />
). (28)<br />
The reference demand corresponds to the reference price discussed in the previous section (as<br />
demand for stocks and prices are directly linked). It is the demand that would have arisen had<br />
the economy not received any news or belief shocks. The policy is a time-invariant feedback rule<br />
as it takes capital demand as its input that prevails only when the policy is in place. Capital<br />
demand affects the amount <strong>of</strong> intervention which in turn affects the demand for stocks <strong>of</strong> agents.<br />
The intervention works as follows: Whenever demand is above reference demand, the gov-<br />
ernment suspects a positive belief shock and wants to lean against it. It sells stocks to lower<br />
27
prices which in turn leads to a reduction in investment. The government thereby stabilizes stock<br />
prices and real investment.<br />
2.0<br />
1.5<br />
1.0<br />
0.5<br />
Marginal gains<br />
Marginal losses<br />
0.1 0.2 0.3 0.4 0.5 0.6 0.7<br />
7.45<br />
7.40<br />
7.35<br />
7.30<br />
7.25<br />
7.20<br />
7.15<br />
V<br />
0.2 0.4 0.6 0.8 1.0 tk<br />
Figure 3: Marginal gains (downward sloping) and losses (upward sloping) from policy intervention.<br />
To the right: Social welfare function plotted over parameter <strong>of</strong> intervention t k .<br />
Since the government reacts to news and belief shocks symmetrically, the previously discussed<br />
stability-efficiency trade<strong>of</strong>f arises. The graph to the left in figure 3 shows the marginal gains<br />
from reducing excess volatility compared to marginal losses due to a dampened reaction to news.<br />
Optimal policy intervention lies where the two lines meet. The graph demonstrates that a price<br />
stabilizing policy is beneficial. The graph to the right shows social welfare as a function <strong>of</strong> the<br />
sensitivity <strong>of</strong> government’s demand for stocks with respect to deviations from reference demand.<br />
Social welfare rises significantly as a result <strong>of</strong> policy intervention.<br />
Ct<br />
1.35<br />
1.30<br />
1.25<br />
1.20<br />
1.15<br />
0 50 100 150 200 t<br />
0 10 20 30 40 50<br />
Figure 4: Graph to the left: consumption dynamics in an economy without intervention (dashed<br />
line) compared to an economy that starts out from the same equilibrium but an optimal price<br />
stabilizing policy <strong>of</strong> the form (28) is implemented (solid line). The graph to the right shows the<br />
dynamics <strong>of</strong> the capital stock.<br />
Kt<br />
4.0<br />
3.9<br />
3.8<br />
3.7<br />
3.6<br />
3.5<br />
3.4<br />
Welfare gains stem from a level effect on consumption as shown by the left graph in figure<br />
4. The dashed line shows an economy starting out from stochastic steady-state and following<br />
28<br />
t
Volatility effects<br />
Cross-sectional dispersion 0.002%<br />
Variance <strong>of</strong> consumption over time 4.7 × 10 −5 %<br />
Level effects<br />
Excess adjustment costs 0.04%<br />
Capital accumulation 0.20%<br />
Overall 0.24%<br />
Table 2: Sources <strong>of</strong> welfare gains for open market operations.<br />
a path in which all news and belief shocks are at their mean. The solid line displays the path<br />
<strong>of</strong> consumption the economy would follow if it started out in a no-intervention equilibrium,<br />
implemented the optimal policy in equation (28), and transitioned to the new stochastic steady-<br />
state. For the path, I again set news and belief shocks to their mean. The graph to the right<br />
hand side shows the corresponding graphs for the dynamics <strong>of</strong> the capital stock.<br />
Welfare can rise significantly after intervention since policy intervention raises the level <strong>of</strong><br />
consumption. Table 2 breaks the overall welfare gains <strong>of</strong> an equivalent <strong>of</strong> a 0.24% rise in<br />
consumption down into its components. Gains due to a reduction in the variance <strong>of</strong> consumption<br />
in the cross-section and over time do not contribute significantly to gains. Since there are<br />
adjustment costs to investment in the economy, stabilizing prices over time reduces the dead-<br />
weight loss from adjustment costs. With 0.04% <strong>of</strong> consumption, the contribution to overall<br />
welfare gains is still small. The bulk <strong>of</strong> gains lies in the effect on capital accumulation. Hence,<br />
solving for a nonlinear equilibrium is key to analyzing welfare cost <strong>of</strong> stabilizing policies as the<br />
effect on capital accumulation would be absent in a (log-) linearized version <strong>of</strong> the model.<br />
6.3.2 Feedback rule on interest rates<br />
The government has two margins it can tackle with its policies since there are two optimality<br />
conditions for households, the Euler equations (4) and (5). An interest rate rule distorts the<br />
Euler equation for bonds. The objective is the same: <strong>Stock</strong> prices are excessively volatile because<br />
agents want to revise their portfolio decisions too <strong>of</strong>ten compared to the optimum.<br />
The government conditions changes <strong>of</strong> the interest rate on asset prices. We might imagine the<br />
government here to take the form <strong>of</strong> a Central Bank that sets interest rates 5 . The analysis then<br />
applies ins<strong>of</strong>ar as the Central Bank can move real interest rates. The post-intervention return<br />
for the risky asset does not display any intervention R at<br />
c,t = R bt<br />
c,t whereas the post-intervention<br />
5 Rigobon and Sack (2003) measure this interaction between monetary policy and asset prices empirically.<br />
29
eturn <strong>of</strong> the riskless asset in Euler equation (5) is subject to intervention<br />
R b,at<br />
b,t = (1 + rt)(1 − τ b (pt,p ref<br />
t )).<br />
Interest rate policy can stabilize asset prices. If the government raises interest rates, the equity<br />
premium falls and bonds become a relatively more attractive investment opportunity. At the<br />
same time, the policy affects the intertemporal margin for consumption. Raising real interest<br />
rates makes savings more attractive in that period. Thus consumption remains slightly more<br />
volatile after policy intervention compared to the policy using open market operations. The first<br />
policy intervention I consider conditions on asset prices and takes a linear form in the logarithm<br />
<strong>of</strong> stock prices<br />
τ b (pt,p ref<br />
t ) = t b (pt − p ref<br />
t ). (29)<br />
The time-invariant rule (29) conditional on an “asset price gap” resembles a Taylor rule. The<br />
choice <strong>of</strong> the reference price plays a crucial role. In the benchmark intervention, I choose the<br />
reference price to be the price that would result if beliefs were undistorted and next period’s<br />
productivity would be at its mean but perform robustness checks in the next section.<br />
The analogous stability-efficiency trade<strong>of</strong>f to the previous sections determines optimal inter-<br />
est rate policy. Figure 5 shows the resulting interest rate schedule as a function <strong>of</strong> the size <strong>of</strong><br />
the movement <strong>of</strong> stock prices measured in standard deviations. The magnitudes <strong>of</strong> the interven-<br />
tion are quite large: A one standard deviation event requires a 3.7 percentage points change <strong>of</strong><br />
interest rates. Empirical estimates <strong>of</strong> how strongly monetary policy affects interest rates can be<br />
found for instance in Bernanke and Kuttner (2005).<br />
0.03<br />
0.02<br />
0.01<br />
1.0 0.5 0.5 1.0 Σp<br />
0.01<br />
0.02<br />
0.03<br />
Τ b<br />
Figure 5: Tax schedule showing changes in interest rates plotted over standard deviation movements<br />
in stock prices.<br />
Since the same stability-efficiency trade<strong>of</strong>f arises as before, welfare implications are similar.<br />
With a welfare gain <strong>of</strong> the equivalent <strong>of</strong> a 0.23% increase in consumption, welfare improves<br />
slightly less than for open market operations. The difference lies in the fact that interest rate<br />
adjustments distort consumption decisions over time.<br />
30
6.4 Backward-looking Policy<br />
The previous policy instruments are <strong>of</strong> the class that merely depends on stock prices. The post-<br />
intervention riskless return under the backward-looking policy is history-dependent and takes<br />
the form<br />
for which interventions for real interest rates are chosen to be<br />
R e,at<br />
b,t = (1 + rt)(1 − τ e (pt,p ref<br />
t )) (30)<br />
τ e (pt,p ref<br />
t ) = t e p(pt − p ref<br />
t ) + t e ε(εt−1 − ε ∗ ). (31)<br />
0.003<br />
0.002<br />
0.001<br />
1.0 0.5 0.5 1.0 Σ<br />
0.001<br />
0.002<br />
0.003<br />
Τ e<br />
Reaction to price p<br />
Reaction toΕ t1<br />
Figure 6: Tax schedules for standard deviation movements in stock prices (solid) and previous<br />
period’s misjudgments (dashed).<br />
The first part <strong>of</strong> (31) is equivalent to the policy in equation (29) with the same reference price<br />
but the second term is new. The policy takes the deviation <strong>of</strong> previous period’s misjudgment<br />
from its mean value into account. Since the previous policy is a special case <strong>of</strong> the one in this<br />
section, the welfare gains will be at least as high as before.<br />
The interest rate policy works as follows: Whenever this period’s stock price is higher than<br />
the price that would have occurred in the absence <strong>of</strong> news or belief shocks, policy raises the<br />
risk-free rate to lower the equity premium. Demand for stocks falls and their price is stabilized<br />
in equilibrium. New to this policy is that it also raises interest rates in response to overpricings<br />
in the previous period. Since stock prices and thus stock pay<strong>of</strong>fs in the following period fall<br />
with this period’s overpricing, stock prices have less predictive power for stock returns than in<br />
the previous cases. Agents thus put relatively more weight on private signals which reduces<br />
amplification and improves the information content <strong>of</strong> prices.<br />
31
Optimal policy intervention reduces the level <strong>of</strong> excess volatility and thus gets to the root <strong>of</strong><br />
the problem. Figure 6 plots optimal policy intervention for both terms in interest rate schedule<br />
(31). Compared to the previous interest rate rule, reactions to the asset price gap are less<br />
aggressive. Since the reaction to last period’s mispricing reduces amplification by 17% in the<br />
optimum, there is less need for aggressive intervention with regard to this period’s price. The<br />
government faces an improved stability-efficiency trade<strong>of</strong>f and is able to raise welfare significantly<br />
more than before. The overall welfare gains amount to an equivalent <strong>of</strong> a permanent increase <strong>of</strong><br />
consumption <strong>of</strong> 0.55% .<br />
7 Robustness<br />
Having established the main results <strong>of</strong> the paper, I study three kinds <strong>of</strong> deviations from previ-<br />
ous exercises. First, I look at the robustness <strong>of</strong> results with respect to variations in parameters.<br />
Second, I study policies that extend previously studied policies or might simplify their imple-<br />
mentation. And in the last section, I study the welfare effects <strong>of</strong> policy interventions under the<br />
social welfare function that takes optimal expectations for agents as its input.<br />
7.1 Comparative Statics<br />
Previous results use the baseline calibration <strong>of</strong> section 6.1. This section shows comparative<br />
statics with respect to parameter values.<br />
Welfare gains λ<br />
0.4<br />
0.35<br />
0.3<br />
0.25<br />
0.2<br />
0.15<br />
0.1<br />
0.05<br />
Comparative statics w.r.t. adjustment cost χ<br />
Open Market Operations<br />
Interest Rate Rule<br />
0<br />
0.8 1 1.2 1.4 1.6 1.8 2<br />
Adjustment cost parameter χ<br />
Welfare gains λ<br />
0.7<br />
0.6<br />
0.5<br />
0.4<br />
0.3<br />
0.2<br />
0.1<br />
Open Market Operations<br />
Interest Rate Rule<br />
0<br />
0.1 0.2 0.3 0.4 0.5 0.6<br />
Amount <strong>of</strong> excess volatility σ /σ<br />
ε,R R<br />
Figure 7: Comparative statics with respect to adjustment cost parameter χ (left) and the amount<br />
<strong>of</strong> excess volatility in returns (right).<br />
The graph to the left in figure 7 shows how welfare gains from policy intervention change for<br />
different values <strong>of</strong> the adjustment cost parameter χ. The link between real investment and stock<br />
32
prices decreases with higher adjustment costs (see equation (8)). Price volatility affects the real<br />
economy less and hence policy intervention cannot improve on welfare as much. The graph to<br />
the right shows the welfare changes due to different levels <strong>of</strong> excess volatility in stock returns.<br />
The higher the amount <strong>of</strong> aggregate noise in prices, the more effective policy becomes. If the<br />
true information to aggregate noise ratio falls, optimal intervention becomes more aggressive<br />
and brings about higher welfare gains.<br />
The last comparative statics concern the level <strong>of</strong> risk aversion. If the utility function changes<br />
from logarithmic utility to a general utility displaying constant relative risk aversion γ, two<br />
opposing effects arise. On the one hand, higher levels <strong>of</strong> risk aversion γ cause the risk premium to<br />
rise. Capital accumulation should therefore be affected more strongly and welfare gains should<br />
rise. On the other hand, a higher level <strong>of</strong> risk aversion leads the elasticity <strong>of</strong> intertemporal<br />
substitution to fall. Since effects from distorted beliefs are temporary, there exists negative<br />
serial correlation in stock prices. An overpricing in a given period means that stock prices will,<br />
on average, return to lower values in the next period. A departure from logarithmic utility<br />
introduces an intertemporal hedging demand on the part <strong>of</strong> households. Agents realize this<br />
negative serial correlation and adjust their demand accordingly. Since a given mispricing only<br />
has temporary effects, the intertemporal hedging lowers the cost <strong>of</strong> that component <strong>of</strong> volatility.<br />
Hence, it works in the opposite direction as a higher risk premium. Figure 8 shows that the<br />
latter effect slightly dominates and welfare gains from policy intervention fall with risk aversion.<br />
0.3<br />
0.25<br />
0.2<br />
0.15<br />
0.1<br />
0.05<br />
7.2 Variations on Policies<br />
Welfare gains λ<br />
Comparative statics w.r.t γ<br />
Open Market Operations<br />
Interest Rate Rule<br />
0<br />
1 1.2 1.4 1.6 1.8 2<br />
Risk aversion γ<br />
Figure 8: Comparative statics with respect to risk aversion.<br />
The following three subsections test the robustness <strong>of</strong> previous policies along several dimensions.<br />
The first paragraph studies the welfare effects using a different reference price which might be<br />
easier to implement. The second section demonstrates the ineffectiveness <strong>of</strong> conditioning on<br />
33
known state variables only compared to conditioning policy on economic activity measured by<br />
prices. The third paragraph deals with a policy intervention for each margin <strong>of</strong> adjustment, i.e.<br />
both Euler equations.<br />
7.2.1 Different reference prices<br />
The previously discussed choice <strong>of</strong> references prices for the interest rate rule is designed to let<br />
the government respond to forecasting variables only. It might be the case, however, that the<br />
reference price and thus the “asset price gap” might be hard to determine. An alternative choice<br />
would be to use steady-state stock prices p ref<br />
t<br />
results remain intact.<br />
0.010<br />
0.005<br />
= log(1 + δχ) as a reference. Qualitatively, all<br />
1.0 0.5 0.5 1.0 Σ<br />
0.005<br />
0.010<br />
Τ b<br />
Figure 9: Interest rate policy as a function plotted over standard deviation movements in stock<br />
prices away from steady-state reference price.<br />
Since the policy is not as well targeted towards responding to news and belief shocks only,<br />
optimal intervention is much less aggressive than in the benchmark case. As figure 9 shows, a<br />
one standard deviation event requires a 1.4% change in real interest rates compared to 3.7% in<br />
the benchmark case (as in figure 5). Consequently, welfare improvements relative to competitive<br />
equilibrium without intervention are only 0.05% <strong>of</strong> consumption. The welfare gains are about<br />
five times smaller than for the interest rate rule that conditions on an asset price gap.<br />
7.2.2 State-(in-)dependent interest-rate rules<br />
An alternative to the form <strong>of</strong> intervention in the benchmark case (29) would be to condition<br />
interest rate rules not on economic activity but on state variables only or not to condition on<br />
anything at all. The first implementation is a constant change in interest rates. The intuition<br />
for why such a rule might be helpful would be that a permanently higher risk-free rate leads to a<br />
reduction in the risk premium exogenously imposed by the government. Welfare gains, however,<br />
34
are tiny at λ = 0.006% for an optimally chosen constant change in interest rates. The reason for<br />
the result is that if policy changes the level <strong>of</strong> risk premia, it automatically distorts the margin<br />
<strong>of</strong> a consumption-savings choice. Lowering risk premia while not reducing their variance leads to<br />
inefficiently high returns on risk-free savings for households and lower consumption. Policy thus<br />
needs to stabilize stock prices rather than adjusting the level <strong>of</strong> expected returns. An interest<br />
rate rule depending on capital and bond holdings only reduces welfare. Again, such a policy is<br />
incapable <strong>of</strong> reducing volatility in stock prices and cannot bring about welfare gains.<br />
This observation implies that policy needs to condition on economic activity rather than state<br />
variables, similar to the findings <strong>of</strong> Angeletos and Pavan (2008). The reason for intervention,<br />
however, is very different. While the use <strong>of</strong> information changes in their setup in which private<br />
and public signals are exogenous, it does not change in this economy because agents have access<br />
to market prices when forming expectations.<br />
7.2.3 Additional tax on capital<br />
Since there are two optimality conditions, it might prove useful to adjust both margins. A<br />
feedback rule on interest rates distorts not only the choice between stocks and bonds but also<br />
the intertemporal margin <strong>of</strong> consumption. Having an additional capital tax in place allows to<br />
distort both Euler equations separately. For the purpose <strong>of</strong> computing optimal interventions,<br />
we keep the same feedback rule for interest rates (29) in place. We add a tax on capital that<br />
takes the analogous form<br />
R c,at<br />
c,t+1 = Rc,bt c,t+1 (1 − τc (pt,p ref<br />
t )) = R c,bt<br />
c,t+1 (1 − tc (pt − p ref<br />
t ))<br />
The addition <strong>of</strong> a second margin <strong>of</strong> adjustment reduces intertemporal fluctuations in consump-<br />
tion. Yet, these fluctuations are not very costly for agents as table 2 shows. Thus it comes as<br />
no surprise that the welfare gains from having both policies in place is 0.24% <strong>of</strong> consumption<br />
relative to the case with no intervention compared to 0.23% for the benchmark case with only<br />
an interest rate policy.<br />
7.3 Different Social Welfare Function<br />
The benchmark case uses the average utility <strong>of</strong> households under distorted beliefs as objective<br />
function for the government. An alternative specification would specify agents’ expected utility<br />
levels under optimal beliefs given competitive equilibrium allocations. The government wants to<br />
lean against prices more aggressively in that case since the government has a stronger aversion<br />
to distortions in beliefs. As proposition 4.1 states, the difference between optimal and distorted<br />
beliefs is minimal. Changing the social welfare function consequently does not translate into<br />
35
large effects on policies. Figure 10 plots optimal policy interventions <strong>of</strong> the form (29). The<br />
solid line represents the optimal interest rate rule under a social welfare function with distorted<br />
beliefs and the dashed line its counterpart under optimal beliefs. The resulting difference in<br />
welfare gains is minimal: welfare gains under distorted beliefs are by 0.0001 percentage points<br />
higher than under optimal beliefs.<br />
0.04<br />
0.02<br />
1.0 0.5 0.5 1.0 Σp<br />
0.02<br />
0.04<br />
Τ<br />
SWF distorted<br />
SWF optimal<br />
Figure 10: Comparison between tax schedules under social welfare function using optimal versus<br />
distorted beliefs.<br />
8 Conclusion<br />
This paper presents a model <strong>of</strong> excess volatility, develops a way <strong>of</strong> solving this and general<br />
nonlinear models with dispersed information, and shows the gains from stabilizing policies. Price<br />
stabilizing policy conditioning on stock prices not only reduces the variance <strong>of</strong> consumption but<br />
raises its level through capital accumulation. Since the effect works through the risk premium<br />
on stock returns, it demonstrates the necessity <strong>of</strong> the nonlinear solution method to capture<br />
higher-order terms. Backward-looking policies can further raise welfare by reducing the amount<br />
<strong>of</strong> excess volatility in stock prices directly. Excess volatility diminishes after intervention due to<br />
mitigated amplification <strong>of</strong> distortions in beliefs which backward-looking policies achieve through<br />
a change in the use <strong>of</strong> information. The paper analyzes the effects <strong>of</strong> two policy instruments:<br />
stock trades through open market operations and interest rate policy.<br />
Concerns might arise about the implementability <strong>of</strong> specific policies in reality. Open market<br />
operations could require the government to engage in large stock trades. Nevertheless, recent<br />
academic contributions consider open market operations for equity purchases and sales as pos-<br />
sible policy interventions (see, for example, Kiyotaki and Moore (2008)). However, this policy<br />
might not meet with everyone’s approval if the government holds shares which allow it to exercise<br />
voting rights.<br />
36
These concerns might explain why the main academic debate has taken place with respect to<br />
monetary policy reactions to asset prices. Central Banks are established institutions that might<br />
be able to adopt a policy <strong>of</strong> the discussed form more easily. Monetary policy works best as a tool<br />
to correct for mispricings if potential mispricings in different markets (for stocks, housing, etc.)<br />
are highly correlated. With regard to a history-dependent policy, it is crucial that misjudgments<br />
become known in a timely manner to react to them.<br />
The present paper might prove useful for future research for two reasons. First, it provides<br />
a solution method that is applicable to a large class <strong>of</strong> models. Using the technique, we can<br />
incorporate models with dispersed information into standard dynamic general equilibrium set-<br />
tings. Hence, we can start making quantitative predictions with these models and test them<br />
empirically. Second, we can merge the present framework with a standard New Keynesian model<br />
and compute the welfare gains monetary policy can achieve by reacting to asset prices.<br />
In summary, the paper demonstrates large welfare gains from price stabilizing policies for<br />
economies with excess volatility due to distorted beliefs. Arbitrarily small distortions in beliefs<br />
suffice to generate large amounts <strong>of</strong> excess volatility. The paper presents a novel solution method<br />
which applies to general nonlinear models with dispersed information.<br />
37
References<br />
Amador, Manuel and Pierre-Olivier Weill, “Learning from Private and Public Observa-<br />
tions <strong>of</strong> Others’ Actions,” mimeo, Stanford University, 2007.<br />
and , “Learning from Prices: Public Communication and Welfare,” NBER Working Paper<br />
No. W14255, 2008.<br />
Angeletos, George-Marios and Alessandro Pavan, “Efficient Use <strong>of</strong> Information and So-<br />
cial Value <strong>of</strong> Information,” Econometrica, 2007, 75 (4), 1103 – 1142.<br />
and , “Policy with Dispersed Information,” forthcoming in Journal <strong>of</strong> the European Eco-<br />
nomic Association, 2008.<br />
and Jennifer La’O, “Dispersed Information over the <strong>Business</strong> Cycle: Optimal Fiscal and<br />
Monetary Policy,” mimeo, Massachusetts Institute <strong>of</strong> Technology, 2008.<br />
, Guido Lorenzoni, and Alessandro Pavan, “Wall Street and Silicon Valley: A Delicate<br />
Interaction,” mimeo, Massachusetts Institute <strong>of</strong> Technology, 2007.<br />
Barlevy, Gadi, “The Cost <strong>of</strong> <strong>Business</strong> Cycles and the Benefits <strong>of</strong> Stabilization,” Economic<br />
Perspectives, Federal Reserve Bank <strong>of</strong> Chicago, 2005.<br />
Beaudry, Paul and Franck Portier, “An Exploration into Pigou’s Theory <strong>of</strong> Cycles,” Journal<br />
<strong>of</strong> Monetary Economics, 2004, 51 (6), 1183–1216.<br />
Bernanke, Ben S. and Kenneth N. Kuttner, “What Explains the <strong>Stock</strong> Market’s Reaction<br />
to Federal Reserve Policy?,” Journal <strong>of</strong> Finance, 2005, 60 (3), 1221 – 1257.<br />
Bernanke, Benjamin S. and Mark Gertler, “Monetary Policy and Asset Price Volatility,”<br />
NBER Working Paper No. W7559, 2000.<br />
and , “Should Central Banks Respond to Movements in Asset Prices?,” American Eco-<br />
nomic Review, Papers and Proceedings, 2001, 91 (2), 253–257.<br />
Black, Fischer, “Noise,” The Journal <strong>of</strong> Finance, 1986, 41 (3), 529–543.<br />
Bullard, James, George W. Evans, and Seppo Honkapohja, “Monetary Policy, Judgment<br />
and Near-Rational Exuberance,” Federal Reserve Bank <strong>of</strong> St. Louis, Working Paper 2007-<br />
008A, 2007.<br />
Campbell, John Y., “Consumption-based Asset Pricing,” in George Constantinides, Milton<br />
Harris, and Rene Stulz eds. Handbook <strong>of</strong> the Economics <strong>of</strong> Finance Vol. IB, North-Holland,<br />
Amsterdam, 2003, IB, 803–887.<br />
38
Cecchetti, Stephen G., Hans Genberg, and Sushil Wadhwani, “Asset Prices in a Flexible<br />
Inflation Targeting Framework,” NBER Working Paper No. W8970, 2002.<br />
, Pok-Sang Lam, and Nelson C. Mark, “Asset Pricing with Distorted Beliefs: Are Equity<br />
Returns Too Good to Be True?,” American Economic Review, 2000, 90 (4), 787–805.<br />
Christiano, Lawrence, Cosmin Ilut, Roberto Motto, and Massimo Rostagno, “Mon-<br />
etary Policy and <strong>Stock</strong> Market Boom-Bust Cycles,” mimeo, Northwestern University, 2007.<br />
DeLong, J. Bradford, Andrei Shleifer, Lawrence H. Summers, and Robert J. Wald-<br />
mann, “The Size and Incidence <strong>of</strong> the Losses from Noise Trading,” Journal <strong>of</strong> Finance, 1988,<br />
44 (3), 681–696.<br />
, , , and , “Noise Trader Risk in Financial <strong>Markets</strong>,” Journal <strong>of</strong> Political Economy,<br />
1990, 98 (4), 703–738.<br />
Dupor, Bill, “Stabilizing Non-Fundamental Asset Price Movements under Discretion and Lim-<br />
ited Information,” Journal <strong>of</strong> Monetary Economics, 2005, 52 (4), 727–747.<br />
Eberly, Janice, Sergio Rebelo, and Nicolas Vincent, “Investment and Value: A Neoclas-<br />
sical Benchmark,” NBER Working Paper No. W13866, 2008.<br />
Fernández-Villaverde, Jesús and Juan F. Rubio-Ramírez, “Solving DSGE Models with<br />
Perturbation Methods and a Change <strong>of</strong> Variables,” Journal <strong>of</strong> Economic Dynamics and Con-<br />
trol, 2006, 30 (12), 2509–2531.<br />
Gilchrist, Simon and Masahi Saito, “Expectations, Asset Prices, and Monetary Policy: The<br />
Role <strong>of</strong> Learning,” Asset Prices and Monetary Policy, edited by John Y. Campbell, 2008.<br />
Grossman, Sanford J., “On the Efficiency <strong>of</strong> Competitive <strong>Stock</strong> <strong>Markets</strong> Where Traders Have<br />
Diverse Information,” Journal <strong>of</strong> Finance, 1976, 31 (2), 573–585.<br />
and Joseph E. Stiglitz, “On the Impossibility <strong>of</strong> Informationally Efficient <strong>Markets</strong>,” Amer-<br />
ican Economic Review, 1980, 70 (3), 393–408.<br />
Hassan, Tarek A. and Thomas M. Mertens, “The Social Cost <strong>of</strong> Near-Rational Invest-<br />
ment,” mimeo, Harvard University, 2008.<br />
Hellwig, Christian, “Heterogeneous Information and the Welfare Effects <strong>of</strong> Public Information<br />
Disclosures,” mimeo, University <strong>of</strong> California, Los Angeles, 2005.<br />
Hellwig, Martin, “On the Aggregation <strong>of</strong> Information in Competitive <strong>Markets</strong>,” Journal <strong>of</strong><br />
Economic Theory, 1980, 22, 477–498.<br />
39
Jaimovich, Nir and Sergio Rebelo, “Can News about the Future Drive <strong>Business</strong> Cycles?,”<br />
NBER Working Paper No. W12537, 2006.<br />
Jin, Hehui and Kenneth L. Judd, “Perturbation Methods for General Dynamic Stochastic<br />
Models,” mimeo, Hoover Institution, Stanford University, 2002.<br />
Judd, Kenneth L., Numerical Methods in Economics, The MIT Press, 1998.<br />
, “Perturbation Methods with Nonlinear Change <strong>of</strong> Variables,” mimeo, Hoover Institution,<br />
Stanford University, 2002.<br />
King, Robert G., “Monetary Policy and the Information Content <strong>of</strong> Prices,” Journal <strong>of</strong> Po-<br />
litical Economy, 1982, 90 (2), 247–279.<br />
Kiyotaki, Nobuhiro and John Moore, “Liquidity, <strong>Business</strong> Cycles, and Monetary Policy,”<br />
mimeo, Princeton University, 2008.<br />
Kurz, Mordecai, “Measuring the Ex-Ante Social Cost <strong>of</strong> Aggregate Volatility,” SIEPR Dis-<br />
cussion Paper No. 04-06, 2005.<br />
Lansing, Kevin J., “Speculative Growth and Overreaction to Technology Shocks,” Federal<br />
Reserve Bank <strong>of</strong> San Francisco, Working Paper 2008-08, 2008.<br />
LeRoy, Stephen F. and Richard D. Porter, “The Present-Value Relation: Tests Based on<br />
Implied Variance Bounds,” Econometrica, 1981, 49 (3), 555–574.<br />
Lorenzoni, Guido, “Optimal Monetary Policy with Uncertain Fundamentals and Dispersed<br />
Information,” mimeo, Massachusetts Institute <strong>of</strong> Technology, 2008.<br />
Lucas, Robert E., Models <strong>of</strong> <strong>Business</strong> Cycles, Oxford: Basil Blackwell, 1987.<br />
Morris, Stephen and Hyun Song Shin, “Social Value <strong>of</strong> Public Information,” The American<br />
Economic Review, Dec 2002, 92 (5), 1521–1534.<br />
Odean, Terrance, “Volume, Volatility, Price, and Pr<strong>of</strong>it When All Traders Are above Aver-<br />
age,” Journal <strong>of</strong> Finance, 1998, 53 (6), 1887–1934.<br />
Rigobon, Roberto and Brian Sack, “Measuring the Reaction <strong>of</strong> Monetary Policy to the<br />
<strong>Stock</strong> Market,” Quarterly Journal <strong>of</strong> Economics, 2003, 118 (2), 639–669.<br />
Schmitt-Grohé, Stephanie and Martín Uribe, “Closing Small Open Economy Models,”<br />
Journal <strong>of</strong> International Economics, 2003, 61 (1), 163–185.<br />
Shiller, Robert J., “Do <strong>Stock</strong> Prices Move Too Much to be Justified by Subsequent Changes<br />
in Dividends?,” The American Economic Review, 1981, 71 (3), 421–436.<br />
40
, “From Efficient <strong>Markets</strong> to Behavioral Finance,” Journal <strong>of</strong> Economic Perspectives, 2003,<br />
17 (1), 83–104.<br />
Stein, Jeremy C., “Informational Externalities and Welfare-Reducing Speculation,” Journal<br />
<strong>of</strong> Political Economy, 1987, 95 (6), 1123–1145.<br />
Woodford, Michael, “Inflation Stabilization and Welfare,” Contributions to Macroeconomics,<br />
2002, 2 (1), Article 1.<br />
, “Robustly Optimal Monetary Policy with Near-Rational Expectations,” NBER Working<br />
Paper No. W11896, 2005.<br />
41
A First-order conditions<br />
Households trade contingent claims prior to the arrival <strong>of</strong> signals. They maximize unconditional<br />
expected utility subject to their budget constraint (3) with respect to contingent claims demand<br />
taking future demand <strong>of</strong> stocks and bonds as given. Maximizing ex-ante expected utility, i.e.<br />
prior to the arrival <strong>of</strong> information,<br />
max<br />
Q i t<br />
Et[ ˜ ∞<br />
Et[ β t u(Ct)|st(i),Pt]]<br />
subject to budget constraint (3) yields the first order condition<br />
t=0<br />
u ′ (Ct(i))ω(zt+1,εt,θt(i))φθ(θt(i))φz(zt+1)φε(εt) = βEt[u ′ (Ct+1(i)].<br />
φ· denotes the probability function corresponding to the normal distribution.<br />
Since agents maximize unconditional expectations <strong>of</strong> utility, they form undistorted beliefs<br />
about their future utility levels. Market clearing prices reflect true probabilities <strong>of</strong> receiving<br />
signals. Trading contingent claims completes markets and lets agents insure against risk due to<br />
idiosyncratic information they receive. It serves the purpose <strong>of</strong> eliminating the wealth distribu-<br />
tion from the state space.<br />
B Details on perturbation methods<br />
Before getting to the expansion <strong>of</strong> policy rules in state variables, I determine the steady-state<br />
value <strong>of</strong> capital and bonds. In the present model, I exploit the fact that deterministic steady-<br />
state levels for bonds are pinned down at B ∗ and for capital by<br />
R ∗ c = R ∗ b<br />
= 1 + r<br />
which allows to solve for steady-state consumption using the resource constraint.<br />
Having obtained the deterministic steady-state, we start exploiting the fact that the solution<br />
is analytic around the steady-state and expand optimal policies. We first have to expand in stock<br />
variables, here capital and bonds. We start out by totally differentiating equilibrium conditions<br />
(13) with respect to capital and bonds. We end up with a nonlinear system <strong>of</strong> equations with<br />
four variables and four unknowns (the first derivatives <strong>of</strong> the vector F(·, ·) with respect to K<br />
and B). Having solved the system and using its solution, we can recursively proceed to higher<br />
derivatives. The resulting system <strong>of</strong> equations is linear in all higher derivatives, starting with<br />
a second-order approximation. Having solved for all desired derivatives in capital and bond,<br />
42
we move on to the other known state, the log <strong>of</strong> productivity zt, where we can solve for higher<br />
derivatives and cross derivatives between z and K and B. It turns out that the second derivative<br />
with respect to z depends on the first mixed derivative <strong>of</strong> z with the previous states. The order<br />
is thus important. To generate a proposal, we expand with respect to the unknown variables εt<br />
and the news shocks zt+1.<br />
Having obtained an approximation for the deterministic system, we expand with respect to<br />
the standard deviation σ. All first and first mixed derivatives with respect to σ are zero. The<br />
second-order term, however, is important as it quantifies effects due to risk premia.<br />
B.1 Expansion for log returns<br />
In order to solve the signal extraction problem in closed form, we want all terms in the Euler<br />
equations to be lognormal. Therefore, we perform a nonlinear change <strong>of</strong> variables for the returns<br />
as well. This step is only important for the solution <strong>of</strong> the signal extraction problem. We start<br />
out by taking logs on both sides <strong>of</strong> the definition <strong>of</strong> returns (12)<br />
log(R bt<br />
c,t+1 ) = log(Pt+1 + Dt+1) − pt.<br />
The pay<strong>of</strong>f <strong>of</strong> the asset is a nonlinear function in states. Therefore, we perform a nonlinear<br />
change <strong>of</strong> variables as we did with consumption and stock holdings to get:<br />
log(Pt+1<br />
+<br />
Dt+1) = <br />
l∈S<br />
1<br />
|l|!<br />
∂ l log(Pt+1 + Dt+1)<br />
∂S l<br />
<br />
<br />
S=S ∗<br />
<br />
i<br />
(Sli − S∗ li )li + rθθ<br />
Analogously to the computation <strong>of</strong> prices (17), we obtain the coefficients applying the chain rule<br />
such that we can utilize previously computed coefficients. Using this expression, we have all<br />
terms in the Euler equation in log-form.<br />
B.2 Orders <strong>of</strong> expansion<br />
Table 3 lists the order <strong>of</strong> expansions for each state variable I use to solve the model. In order<br />
to carry out welfare comparisons, I expand the value function in the same fashion as optimal<br />
policies with the same order.<br />
To see how good a given expansion approximates the true solution, we can compute the error<br />
in the optimality condition defined as<br />
<br />
<br />
<br />
<br />
F(s t ,s t+1 )<br />
u ′ (Ct)<br />
<br />
<br />
<br />
=<br />
<br />
<br />
βRat<br />
1<br />
−<br />
u ′ (Ct)<br />
43<br />
b,t u′ (Ct+1)<br />
<br />
<br />
<br />
<br />
.
Expansion in<br />
Mixed with derivative k b zt εt zt+1 σ<br />
none 4 4 3 2 2 2<br />
1st order in k and b - - 2 2 2 2<br />
2nd order in k and b - - 2 2 2 -<br />
3rd order in k and b - - 1 - - -<br />
1st order in zt - - - 1 1 1<br />
1st order in εt - - - - 1 1<br />
Table 3: Order <strong>of</strong> approximation for different states.<br />
The higher the order, the smaller should be the error. In other words, we have an error estimation<br />
at hand that allows to check for convergence. Figure 11 shows the resulting Euler equation errors<br />
for equation (4). All variables except for capital are held at the deterministic steady-state. The<br />
figure shows how the error decreases with the order <strong>of</strong> approximation.<br />
logerror<br />
3<br />
4<br />
5<br />
6<br />
7<br />
8<br />
9<br />
3 4 5<br />
Figure 11: Euler equation error for Euler equation (4) plotted over capital. The error decreases<br />
with approximation order. The plot, here from order 1 to 4, displays convergence.<br />
C Details for signal extraction<br />
This section lays out how to derive expectations on the right-hand side <strong>of</strong> the Euler equations.<br />
Having solved for expectations, we impose market clearing to solve for all coefficients <strong>of</strong> the<br />
approximation.<br />
Let us begin with steps I and II <strong>of</strong> the approximation method using the expansions for<br />
optimal policies. We start out by taking logs on both sides <strong>of</strong> the Euler equations and use the<br />
44<br />
K
standard formula for the log <strong>of</strong> an expectation <strong>of</strong> a lognormal variable 6 to get<br />
−γct(i) = log(β) − ˜ E[γct+1(i) − r at<br />
c,t+1 |st(i),Pt] + γ2<br />
2 var[rat<br />
c,t+1 − ct+1(i)) st(i),Pt] (32)<br />
−γct(i) = log(β) + r at<br />
b,t − γ ˜ E[ct+1(i)|st(i),Pt] + γ2<br />
2 var[ct+1(i)) st(i),Pt] (33)<br />
Note that while expectations are subject to a belief shock, agent’s perception <strong>of</strong> all higher<br />
moments coincides with those <strong>of</strong> the optimal forecast. The form <strong>of</strong> Euler equations gives us a<br />
natural guess for the form <strong>of</strong> consumption<br />
ct(i) = cS(S k t ) + czt(S k t )zt + cε(S k t )µεt + czt+1 (Sk t )zt+1 + cθ(S k t )θt(i)<br />
and prices (see equation (22)). We guess the functional forms here and verify them subsequently.<br />
After plugging in for consumption and returns on the right-hand side <strong>of</strong> expectations, we<br />
see that we only need to forecast log productivity zt+1. The coefficients depend on Kt+1 and Bt<br />
which are common knowledge at time t:<br />
where<br />
−γct = κb,t − γczt(S k t ) ˜ E[zt+1|st(i),Pt]. (34)<br />
κb,t = log(β) + r at γ2<br />
b,t +<br />
2 var[ct+1(i)) st(i),Pt] − γcS(S k t ) + γcε(S k t )µε∗ + γczt+1 (Sk t )z∗<br />
collects all known terms. Using the expansion for the logarithm <strong>of</strong> the pay<strong>of</strong>f for the asset<br />
<br />
log(Pt+1 + Dt+1) = rS(S k t ) + rzt(S k t )zt + rε(S k t )µεt + rzt+1 (Sk t )zt+1<br />
we can analogously rewrite the Euler equation for capital as<br />
−γct + pt = κc,t + (rzt(S k t ) − γczt(S k t )) ˜ E[zt+1|st(i),Pt]. (35)<br />
Again, we collected constant terms in κc,t.<br />
We guess and verify later that expectations <strong>of</strong> future log productivity are a linear function<br />
<strong>of</strong> the private and public signal (as written in (23)).<br />
6 For a lognormally distributed random variable X, we can write the logarithm <strong>of</strong> its expectation as<br />
log E[X] = E[log X] + 1<br />
var[log X].<br />
2<br />
45
In the last step, we subtract equation (32) from (33) to get<br />
pt = κc,t − κb,t + rzt(S k t ) ˜ E[zt+1|st(i),Pt].<br />
Having derived the variable that we need to forecast, we can move on to steps three and<br />
five <strong>of</strong> the solution method. We now get to the point where the distortion in beliefs enters the<br />
equations. In order to simplify further pro<strong>of</strong>s, I introduce a rescaled version <strong>of</strong> the belief shock.<br />
It will prove to be useful to change the scale <strong>of</strong> the belief shock that enters the system as esrztµε.<br />
It allows us to match coefficients in equation (34) more easily which give us the identities<br />
and in equation (35) to get<br />
czt(S k t ) = czt(Kt+1,Bt)(es + eppzt+1 )<br />
cε(S k t ) = czt(Kt+1,Bt)(eppε + rzt<br />
cθ(S k t ) = czt(Kt+1,Bt)es<br />
czt<br />
µes)<br />
pzt+1 = rzt(es + eppzt+1 ) (36)<br />
pε = rzt(eppε + µes) (37)<br />
where I suppressed arguments. Using the identities, we can apply the projection theorem to get<br />
closed-form expressions for all coefficients.<br />
With the market clearing conditions at hand, we can<br />
⎡<br />
⎢<br />
⎣<br />
where Λ = (z ∗ ,z ∗ ,pεµε ∗ + pzt+1 z∗ ) ′ and<br />
Σ =<br />
⎡<br />
⎢<br />
⎣<br />
σ 2 z<br />
σ 2 z<br />
rz t es<br />
1−rz t ep σ2 z<br />
zt+1<br />
st(i)<br />
pt<br />
⎤<br />
⎥<br />
⎦ ∼ N (Λ,Σ) (38)<br />
σ2 rztes z 1−rztep σ2 z<br />
σ2 z + σ2 rztes θ 1−rztep σ2 z<br />
rztes 1−rztep σ2 z ( rz tes 1−rztep )2σ2 z + µ 2σ2 ε<br />
Applying the projection theorem lets us solve for the coefficients <strong>of</strong> the linear form <strong>of</strong> expec-<br />
tations. The conditional variable (zt+1|st(i),Pt) is itself normally distributed according to<br />
(zt+1|st,Pt) ∼ N<br />
<br />
Λ1 + Σ (1,2:3)Σ −1<br />
(2:3,2:3)<br />
<br />
st<br />
pt<br />
46<br />
<br />
− Λ2:3<br />
<br />
⎤<br />
⎥<br />
⎦<br />
,Σ (1,1) − Σ (1,2:3)Σ −1<br />
(2:3,2:3) Σ (2:3,1)
Solving for coefficients <strong>of</strong> expectations yields a unique solution for the coefficients <strong>of</strong> expectations<br />
and<br />
es =<br />
r 2 zt µ2 σ 2 εσ 2 z<br />
r 2 zt µ2 σ 2 ε σ2 z + r2 zt σ2 θ σ2 z + r2 zt µ2 σ 2 ε σ2 θ<br />
ep =<br />
rztσ 2 θ<br />
r 2 zt µ2 σ 2 ε + r2 zt σ2 θ<br />
Recursively plugging the values into equations above, we can verify the loglinear guesses and<br />
compute coefficients. In particular, we get the following lemma:<br />
Lemma C.1<br />
Noise in prices is a multiple <strong>of</strong> distortions in beliefs.<br />
Pro<strong>of</strong>: The verification <strong>of</strong> the guess delivers the pro<strong>of</strong>. <br />
In order to finalize the procedure, we choose µ to match the coefficients <strong>of</strong> the expansion:<br />
D Pro<strong>of</strong> <strong>of</strong> proposition 4.1<br />
.<br />
(39)<br />
µ = 1<br />
. (40)<br />
rztes<br />
The pro<strong>of</strong> <strong>of</strong> the proposition involves taking comparative statics <strong>of</strong> the solution to competitive<br />
equilibrium with respect to dispersion <strong>of</strong> information. Lemma C.1 in appendix C shows that<br />
noise in prices is a multiple <strong>of</strong> belief shocks. The question now concerns the size <strong>of</strong> the factor.<br />
The solution to the signal extraction problem in appendix C delivers a closed-form solution<br />
for coefficients in expectations. From equation (36), we see that the factor µ that links distortions<br />
in beliefs with aggregate noise can be computed as in (40). It suffices to show that es → 0 as<br />
information gets more and more dispersed. Taking limits <strong>of</strong> equation (39) delivers the result.<br />
At the same time, however, coefficients in prices converge to a constant<br />
rztes<br />
1 − rztep<br />
E Pro<strong>of</strong> <strong>of</strong> proposition 5.3<br />
→ rztσ 2 θ<br />
µ 2 σ 2 ε + σ 2 θ<br />
for σθ → ∞.<br />
The solution method shows that tax interventions <strong>of</strong> the form (26) do not change the response<br />
<strong>of</strong> the economy to known state variables such as capital stock Kt, aggregate bond holdings Bt−1,<br />
and total factor productivity zt. Hence, the response <strong>of</strong> stock returns to changes in total factor<br />
productivity rzt is unaltered. Prices are known at the time <strong>of</strong> formulating expectations about<br />
47
next period’s pay<strong>of</strong>f. The reaction to news and belief shocks is lower for the case <strong>of</strong> stabilization<br />
policies but when forming expectations, agents take that into account. The signal extraction<br />
problem then makes up for the dampened reaction in prices such that expectations are unaltered<br />
after policy intervention.<br />
Equations (36) turn into<br />
(1 − t g )pzt+1 = rzt(es + eppzt+1 )<br />
(1 − t g )pε = rzt(eppε + µes).<br />
Carrying out the signal extraction problem as in (38) yields the same weight on private signals.<br />
The weight on the public signal in expectations however is<br />
and hence expectations do not change.<br />
F Pro<strong>of</strong> <strong>of</strong> lemma 5.4<br />
e t p<br />
1<br />
= ep<br />
1 − tg Having a backward-looking policy in place requires solving a different signal extraction problem.<br />
Pay<strong>of</strong>fs to stocks no longer only depend on total factor productivity and unforecastable shocks<br />
but also previous period’s misjudgments. Agents thus forecast<br />
where<br />
and<br />
zt+1−t e µεt|st,Pt<br />
∼ N<br />
<br />
Λ1 + Σ (1,2:3)Σ −1<br />
(2:3,2:3)<br />
⎛<br />
Σ e ⎜<br />
= ⎜<br />
⎝<br />
t e2 µ 2 σ 2 ε + σ2 z<br />
σ 2 z<br />
<br />
st<br />
pt<br />
<br />
− Λ2:3<br />
<br />
Λ e = (z ∗ ,z ∗ ,pεµε ∗ + pzt+1 z∗ ) ′<br />
rz t esσ 2 z<br />
1−rz t ep − te rz t esµ 2 σ 2 ε<br />
1−rz t ep<br />
σ 2 z<br />
σ 2 z + σ 2 θ<br />
rz t esσ 2 z<br />
1−rz t ep<br />
,Σ (1,1) − Σ (1,2:3)Σ −1<br />
(2:3,2:3) Σ (2:3,1)<br />
rztesσ2 z<br />
1−rztep − terztesµ 2σ2 ε<br />
1−rztep rztesσ2 z<br />
1−rztep r2 z e<br />
t 2 sµ 2σ2 ε<br />
(1−rztep) 2 + r2 z e<br />
t 2 sσ2 z<br />
(1−rztep) 2<br />
Applying the projection theorem to this problem solves the signal extraction problem. The<br />
weight on the private signal the becomes<br />
(t e + 1)µ 2 σ 2 εσ 2 z<br />
e e s =<br />
µ 2σ2 εσ2 z + σ2 θσ2 z + µ2σ2 εσ2 θ<br />
48<br />
⎞<br />
⎟<br />
⎠<br />
<br />
(41)
and the weight households put on the public signal<br />
e e p = −te µ 2σ2 εσ2 z + σ2 θσ2 z − te µ 2σ2 εσ2 θ<br />
rzt µ 2σ2 εσ2 z + σ2 θσ2 z − te µ 2σ2 εσ2 <br />
θ<br />
Both es and ep change with policy rules that condition on previous period’s misjudgment.<br />
G Pro<strong>of</strong> <strong>of</strong> proposition 5.5<br />
The previous appendix demonstrates the signal extraction problem that agents solve when a<br />
policy <strong>of</strong> the form (27) is in place. The multiplier µ that links distortions in beliefs to aggregate<br />
noise in stock prices is defined as in (40). Hence, we have to look for the effects <strong>of</strong> policy on es<br />
and rzt. Using equation (41), we get<br />
∂rztes<br />
> 0.<br />
∂te The change <strong>of</strong> the multiplier µ thus takes the opposite sign which proves the proposition.<br />
49