Hoofdstuk 1 - Faculteit Economie en Bedrijfskunde
Hoofdstuk 1 - Faculteit Economie en Bedrijfskunde
Hoofdstuk 1 - Faculteit Economie en Bedrijfskunde

Create successful ePaper yourself
Turn your PDF publications into a flip-book with our unique Google optimized e-Paper software.
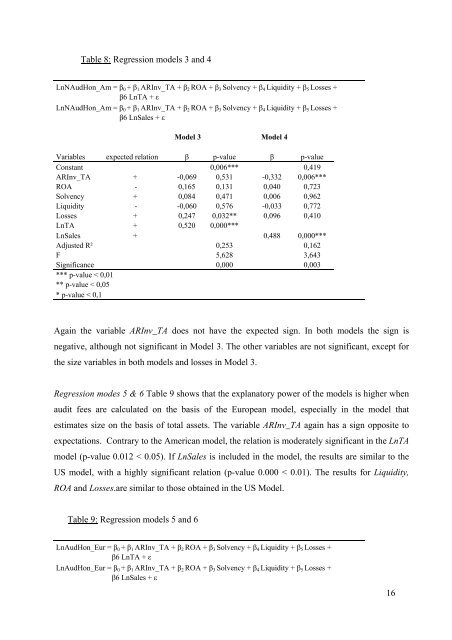
Table 8: Regression models 3 and 4<br />
LnNAudHon_Am = β0 + β1 ARInv_TA + β2 ROA + β3 Solv<strong>en</strong>cy + β4 Liquidity + β5 Losses +<br />
β6 LnTA + ε<br />
LnNAudHon_Am = β0 + β1 ARInv_TA + β2 ROA + β3 Solv<strong>en</strong>cy + β4 Liquidity + β5 Losses +<br />
β6 LnSales + ε<br />
Model 3 Model 4<br />
Variables expected relation β p-value β p-value<br />
Constant 0,006*** 0,419<br />
ARInv_TA + -0,069 0,531 -0,332 0,006***<br />
ROA - 0,165 0,131 0,040 0,723<br />
Solv<strong>en</strong>cy + 0,084 0,471 0,006 0,962<br />
Liquidity - -0,060 0,576 -0,033 0,772<br />
Losses + 0,247 0,032** 0,096 0,410<br />
LnTA + 0,520 0,000***<br />
LnSales + 0,488 0,000***<br />
Adjusted R² 0,253 0,162<br />
F 5,628 3,643<br />
Significance 0,000 0,003<br />
*** p-value < 0,01<br />
** p-value < 0,05<br />
* p-value < 0,1<br />
Again the variable ARInv_TA does not have the expected sign. In both models the sign is<br />
negative, although not significant in Model 3. The other variables are not significant, except for<br />
the size variables in both models and losses in Model 3.<br />
Regression modes 5 & 6 Table 9 shows that the explanatory power of the models is higher wh<strong>en</strong><br />
audit fees are calculated on the basis of the European model, especially in the model that<br />
estimates size on the basis of total assets. The variable ARInv_TA again has a sign opposite to<br />
expectations. Contrary to the American model, the relation is moderately significant in the LnTA<br />
model (p-value 0.012 < 0.05). If LnSales is included in the model, the results are similar to the<br />
US model, with a highly significant relation (p-value 0.000 < 0.01). The results for Liquidity,<br />
ROA and Losses.are similar to those obtained in the US Model.<br />
Table 9: Regression models 5 and 6<br />
LnAudHon_Eur = β0 + β1 ARInv_TA + β2 ROA + β3 Solv<strong>en</strong>cy + β4 Liquidity + β5 Losses +<br />
β6 LnTA + ε<br />
LnAudHon_Eur = β0 + β1 ARInv_TA + β2 ROA + β3 Solv<strong>en</strong>cy + β4 Liquidity + β5 Losses +<br />
β6 LnSales + ε<br />
16