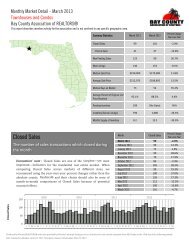
Panama City/Bay County March 2013 Single Family Market Summary

Create successful ePaper yourself
Turn your PDF publications into a flip-book with our unique Google optimized e-Paper software.
Pct. of Closed<br />
Sales Paid in Cash<br />
<strong>Single</strong> <strong>Family</strong> Homes<br />
<strong>Bay</strong> <strong>County</strong> Association of REALTORS®<br />
This report describes member activity for the association and is not confined to any specific geographic area.<br />
Cash Sales<br />
The number of Closed Sales during the month in which<br />
buyers exclusively paid in cash<br />
Economists' note : Cash Sales can be a useful indicator of the extent to<br />
which investors are participating in the market. Why? Investors are<br />
far more likely to have the funds to purchase a home available up front,<br />
whereas the typical homebuyer requires a mortgage or some other<br />
form of financing. There are, of course, many possible exceptions, so<br />
this statistic should be interpreted with care.<br />
60<br />
50<br />
40<br />
30<br />
20<br />
Cash Sales Monthly <strong>Market</strong> Detail - <strong>March</strong> <strong>2013</strong><br />
10<br />
0<br />
Economists' note : This statistic is simply another way of viewing<br />
Cash Sales. The remaining percentages of Closed Sales (i.e. those not<br />
paid fully in cash) each month involved some sort of financing, such as<br />
mortgages, owner/seller financing, assumed loans, etc.<br />
40%<br />
30%<br />
20%<br />
10%<br />
0%<br />
Produced by Florida REALTORS® with data provided by Florida's multiple listing services. Statistics for each month compiled from MLS feeds on the 15th day of the following month.<br />
Data released on Monday, April 22, <strong>2013</strong>. Next data release is Wednesday, May 22, <strong>2013</strong>.<br />
Month Cash Sales<br />
Percent Change<br />
Year-over-Year<br />
<strong>March</strong> <strong>2013</strong> 53 47.2%<br />
February <strong>2013</strong> 46 64.3%<br />
January <strong>2013</strong> 34 61.9%<br />
December 2012 45 164.7%<br />
November 2012 42 223.1%<br />
October 2012 46 1050.0%<br />
September 2012 30 50.0%<br />
August 2012 55 52.8%<br />
July 2012 39 -7.1%<br />
June 2012 41 10.8%<br />
May 2012 34 -24.4%<br />
April 2012 55 19.6%<br />
<strong>March</strong> 2012 36 -32.1%<br />
2009 2010 2011 2012<br />
J F M A M J J A S O N D J F M A M J J A S O N D J F M A M J J A S O N D J F M A M J J A S O N D J F M<br />
Cash Sales as a Percentage of Closed Sales<br />
The percentage of Closed Sales during the month<br />
which were Cash Sales<br />
Month<br />
Percent of Closed<br />
Sales Paid in Cash<br />
Percent Change<br />
Year-over-Year<br />
<strong>March</strong> <strong>2013</strong> 27.7% 33.3%<br />
February <strong>2013</strong> 28.8% 30.4%<br />
January <strong>2013</strong> 24.5% 30.5%<br />
December 2012 21.7% 88.0%<br />
November 2012 25.5% 135.0%<br />
October 2012 24.1% 749.0%<br />
September 2012 16.2% 49.2%<br />
August 2012 25.5% 16.0%<br />
July 2012 21.2% -20.8%<br />
June 2012 20.6% -3.1%<br />
May 2012 18.8% -19.4%<br />
April 2012 30.4% 16.3%<br />
<strong>March</strong> 2012 20.8% -21.9%<br />
2009 2010 2011 2012<br />
J F M A M J J A S O N D J F M A M J J A S O N D J F M A M J J A S O N D J F M A M J J A S O N D J F M