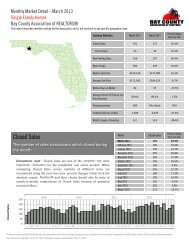
March 2013 Townhome and Condo Market Summary
Courtesy of Dawn Dunlap, Broker for Property Connections Boutique.
Courtesy of Dawn Dunlap, Broker for Property Connections Boutique.

Create successful ePaper yourself
Turn your PDF publications into a flip-book with our unique Google optimized e-Paper software.
Closed Sales<br />
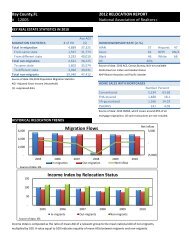
Monthly <strong>Market</strong> Detail - <strong>March</strong> <strong>2013</strong><br />
Townhouses <strong>and</strong> <strong>Condo</strong>s<br />
Bay County Association of REALTORS®<br />
This report describes member activity for the association <strong>and</strong> is not confined to any specific geographic area.<br />
Closed Sales<br />
Produced by Florida REALTORS® with data provided by Florida's multiple listing services. Statistics for each month compiled from MLS feeds on the 15th day of the following month.<br />
Data released on Monday, April 22, <strong>2013</strong>. Next data release is Wednesday, May 22, <strong>2013</strong>.<br />
<strong>Summary</strong> Statistics<br />
Closed Sales<br />
Paid in Cash<br />
New Pending Sales<br />
New Listings<br />
Median Sale Price<br />
Average Sale Price<br />
Median Days on <strong>Market</strong><br />
Average Percent of Original List<br />
Price Received<br />
Pending Inventory<br />
Inventory (Active Listings)<br />
The number of sales transactions which closed during<br />
the month<br />
Economists' note : Closed Sales are one of the simplest—yet most<br />
important—indicators for the residential real estate market. When<br />
comparing Closed Sales across markets of different sizes, we<br />
recommend using the year-over-year percent changes rather than the<br />
absolute counts. Realtors® <strong>and</strong> their clients should also be wary of<br />
month-to-month comparisons of Closed Sales because of potential<br />
seasonal effects.<br />
150<br />
100<br />
50<br />
0<br />
<strong>March</strong> <strong>2013</strong><br />
123<br />
$212,073<br />
92.1%<br />
109<br />
796<br />
Months Supply of Inventory 8.2<br />
<strong>March</strong> 2012<br />
88.2%<br />
Percent Change<br />
Year-over-Year<br />
99 101 -2.0%<br />
41 47 -12.8%<br />
90 36.7%<br />
140 153 -8.5%<br />
$190,000 $170,000 11.8%<br />
$186,892 13.5%<br />
73 54 35.2%<br />
4.4%<br />
(No Data) N/A<br />
1,080 -26.3%<br />
12.2 -33.3%<br />
Month<br />
Closed Sales<br />
Percent Change<br />
Year-over-Year<br />
<strong>March</strong> <strong>2013</strong><br />
99<br />
-2.0%<br />
February <strong>2013</strong> 96 14.3%<br />
January <strong>2013</strong> 72<br />
December 2012 99<br />
November 2012 79<br />
October 2012 82<br />
September 2012 105<br />
August 2012 99<br />
July 2012 100<br />
June 2012 126<br />
May 2012 112<br />
April 2012 100<br />
<strong>March</strong> 2012 101<br />
2009 2010 2011 2012<br />
J F M A M J J A S O N D J F M A M J J A S O N D J F M A M J J A S O N D J F M A M J J A S O N D J F M<br />
2.9%<br />
28.6%<br />
17.9%<br />
-2.4%<br />
38.2%<br />
19.3%<br />
37.0%<br />
27.3%<br />
-12.5%<br />
-13.8%<br />
-4.7%
Pct. of Closed<br />
Sales Paid in Cash<br />
Townhouses <strong>and</strong> <strong>Condo</strong>s<br />
Bay County Association of REALTORS®<br />
This report describes member activity for the association <strong>and</strong> is not confined to any specific geographic area.<br />
Cash Sales<br />
The number of Closed Sales during the month in which<br />
buyers exclusively paid in cash<br />
Economists' note : Cash Sales can be a useful indicator of the extent to<br />
which investors are participating in the market. Why? Investors are<br />
far more likely to have the funds to purchase a home available up front,<br />
whereas the typical homebuyer requires a mortgage or some other<br />
form of financing. There are, of course, many possible exceptions, so<br />
this statistic should be interpreted with care.<br />
60<br />
50<br />
40<br />
30<br />
20<br />
Cash Sales Monthly <strong>Market</strong> Detail - <strong>March</strong> <strong>2013</strong><br />
10<br />
0<br />
Economists' note : This statistic is simply another way of viewing<br />
Cash Sales. The remaining percentages of Closed Sales (i.e. those not<br />
paid fully in cash) each month involved some sort of financing, such as<br />
mortgages, owner/seller financing, assumed loans, etc.<br />
60%<br />
50%<br />
40%<br />
30%<br />
20%<br />
10%<br />
0%<br />
Produced by Florida REALTORS® with data provided by Florida's multiple listing services. Statistics for each month compiled from MLS feeds on the 15th day of the following month.<br />
Data released on Monday, April 22, <strong>2013</strong>. Next data release is Wednesday, May 22, <strong>2013</strong>.<br />
Month Cash Sales<br />
Percent Change<br />
Year-over-Year<br />
<strong>March</strong> <strong>2013</strong> 41 -12.8%<br />
February <strong>2013</strong> 47 38.2%<br />
January <strong>2013</strong> 26 18.2%<br />
December 2012 38 100.0%<br />
November 2012 25 316.7%<br />
October 2012 25 257.1%<br />
September 2012 38 216.7%<br />
August 2012 38 15.2%<br />
July 2012 44 18.9%<br />
June 2012 46 21.1%<br />
May 2012 44 -18.5%<br />
April 2012 47 -13.0%<br />
<strong>March</strong> 2012 47 -16.1%<br />
2009 2010 2011 2012<br />
J F M A M J J A S O N D J F M A M J J A S O N D J F M A M J J A S O N D J F M A M J J A S O N D J F M<br />
Cash Sales as a Percentage of Closed Sales<br />
The percentage of Closed Sales during the month<br />
which were Cash Sales<br />
Month<br />
Percent of Closed<br />
Sales Paid in Cash<br />
Percent Change<br />
Year-over-Year<br />
<strong>March</strong> <strong>2013</strong> 41.4% -11.0%<br />
February <strong>2013</strong> 49.0% 21.0%<br />
January <strong>2013</strong> 36.1% 14.9%<br />
December 2012 38.4% 55.6%<br />
November 2012 31.6% 253.4%<br />
October 2012 30.5% 265.9%<br />
September 2012 36.2% 129.2%<br />
August 2012 38.4% -3.5%<br />
July 2012 44.0% -13.2%<br />
June 2012 36.5% -4.9%<br />
May 2012 39.3% -6.9%<br />
April 2012 47.0% 1.0%<br />
<strong>March</strong> 2012 46.5% -11.9%<br />
2009 2010 2011 2012<br />
J F M A M J J A S O N D J F M A M J J A S O N D J F M A M J J A S O N D J F M A M J J A S O N D J F M
New Listings<br />
Townhouses <strong>and</strong> <strong>Condo</strong>s<br />
Bay County Association of REALTORS®<br />
This report describes member activity for the association <strong>and</strong> is not confined to any specific geographic area.<br />
New Pending Sales<br />
The number of property listings that went from<br />
"Active" to "Pending" status during the month<br />
Economists' note : Because of the typical length of time it takes for a<br />
sale to close, economists consider Pending Sales to be a decent<br />
indicator of potential future Closed Sales. It is important to bear in<br />
mind, however, that not all Pending Sales will be closed successfully.<br />
So, the effectiveness of Pending Sales as a future indicator of Closed<br />
Sales is susceptible to changes in market conditions such as the<br />
availability of financing for homebuyers <strong>and</strong> the inventory of<br />
distressed properties for sale.<br />
200<br />
150<br />
100<br />
50<br />
0<br />
Pending Sales Monthly <strong>Market</strong> Detail - <strong>March</strong> <strong>2013</strong><br />
New Listings<br />
Economists' note : In a recovering market, we expect that new listings<br />
will eventually rise as sellers raise their estimations of value. But this<br />
increase will take place only after the market has turned up, so New<br />
Listings are a lagging indicator of the health of the market. Also be<br />
aware of properties which have been withdrawn from the market <strong>and</strong><br />
then relisted. These are not really New Listings.<br />
400<br />
300<br />
200<br />
100<br />
0<br />
Produced by Florida REALTORS® with data provided by Florida's multiple listing services. Statistics for each month compiled from MLS feeds on the 15th day of the following month.<br />
Data released on Monday, April 22, <strong>2013</strong>. Next data release is Wednesday, May 22, <strong>2013</strong>.<br />
Month<br />
<strong>March</strong> <strong>2013</strong><br />
February <strong>2013</strong><br />
January <strong>2013</strong><br />
December 2012<br />
November 2012<br />
October 2012<br />
September 2012<br />
August 2012<br />
July 2012<br />
June 2012<br />
May 2012<br />
April 2012<br />
<strong>March</strong> 2012<br />
New Pending Sales<br />
2009 2010 2011 2012<br />
123<br />
127<br />
130<br />
99<br />
101<br />
109<br />
87<br />
108<br />
103<br />
119<br />
123<br />
103<br />
90<br />
New Listings<br />
140<br />
153<br />
164<br />
107<br />
126<br />
127<br />
109<br />
169<br />
162<br />
171<br />
137<br />
158<br />
153<br />
Percent Change<br />
Year-over-Year<br />
36.7%<br />
16.5%<br />
68.8%<br />
15.1%<br />
77.2%<br />
51.4%<br />
3.6%<br />
33.3%<br />
33.8%<br />
38.4%<br />
18.3%<br />
-10.4%<br />
-26.8%<br />
J F M A M J J A S O N D J F M A M J J A S O N D J F M A M J J A S O N D J F M A M J J A S O N D J F M<br />
The number of properties put onto the market during<br />
the month<br />
2009 2010 2011 2012<br />
Percent Change<br />
Year-over-Year<br />
-8.5%<br />
7.7%<br />
4.5%<br />
1.9%<br />
6.8%<br />
-9.3%<br />
-16.8%<br />
35.2%<br />
36.1%<br />
37.9%<br />
-12.7%<br />
-6.0%<br />
-25.0%<br />
J F M A M J J A S O N D J F M A M J J A S O N D J F M A M J J A S O N D J F M A M J J A S O N D J F M
Median Sale Price<br />
Average Sale<br />
Price<br />
Monthly <strong>Market</strong> Detail - <strong>March</strong> <strong>2013</strong><br />
Townhouses <strong>and</strong> <strong>Condo</strong>s<br />
Bay County Association of REALTORS®<br />
This report describes member activity for the association <strong>and</strong> is not confined to any specific geographic area.<br />
Median Sale Price<br />
The median sale price reported for the month (i.e. 50%<br />
of sales were above <strong>and</strong> 50% of sales were below)<br />
Economists' note : Median Sale Price is our preferred summary<br />
statistic for price activity because, unlike Average Sale Price, Median<br />
Sale Price is not sensitive to high sale prices for small numbers of<br />
homes that may not be characteristic of the market area.<br />
$260K<br />
$240K<br />
$220K<br />
$200K<br />
$180K<br />
$160K<br />
$140K<br />
Economists' note : As noted above, we prefer Median Sale Price over<br />
Average Sale Price as a summary statistic for home prices. However,<br />
Average Sale Price does have its uses—particularly when it is analyzed<br />
alongside the Median Sale Price. For one, the relative difference<br />
between the two statistics can provide some insight into the market for<br />
higher-end homes in an area.<br />
$300K<br />
$250K<br />
$200K<br />
$150K<br />
Produced by Florida REALTORS® with data provided by Florida's multiple listing services. Statistics for each month compiled from MLS feeds on the 15th day of the following month.<br />
Data released on Monday, April 22, <strong>2013</strong>. Next data release is Wednesday, May 22, <strong>2013</strong>.<br />
Month<br />
Median Sale Price<br />
Percent Change<br />
Year-over-Year<br />
<strong>March</strong> <strong>2013</strong> $190,000 11.8%<br />
February <strong>2013</strong> $199,950 26.2%<br />
January <strong>2013</strong> $173,200 -5.1%<br />
December 2012 $204,500 2.3%<br />
November 2012 $175,000 -5.4%<br />
October 2012 $167,500 -13.0%<br />
September 2012 $170,000 -0.3%<br />
August 2012 $192,000 12.9%<br />
July 2012 $175,500 9.8%<br />
June 2012 $201,125 25.7%<br />
May 2012 $180,000 -0.8%<br />
April 2012 $175,000 16.2%<br />
<strong>March</strong> 2012 $170,000 -14.8%<br />
2009 2010 2011 2012<br />
J F M A M J J A S O N D J F M A M J J A S O N D J F M A M J J A S O N D J F M A M J J A S O N D J F M<br />
Average Sale Price<br />
The average sale price reported for the month (i.e.<br />
total sales in dollars divided by the number of sales)<br />
Month<br />
Average Sale Price<br />
Percent Change<br />
Year-over-Year<br />
<strong>March</strong> <strong>2013</strong> $212,073 13.5%<br />
February <strong>2013</strong> $198,153 9.8%<br />
January <strong>2013</strong> $191,352 -15.5%<br />
December 2012 $210,149 2.2%<br />
November 2012 $181,461 -10.2%<br />
October 2012 $176,254 -11.9%<br />
September 2012 $174,015 -7.4%<br />
August 2012 $199,361 12.5%<br />
July 2012 $202,015 21.3%<br />
June 2012 $263,197 51.8%<br />
May 2012 $197,006 1.0%<br />
April 2012 $200,315 14.8%<br />
<strong>March</strong> 2012 $186,892 -9.5%<br />
2009 2010 2011 2012<br />
J F M A M J J A S O N D J F M A M J J A S O N D J F M A M J J A S O N D J F M A M J J A S O N D J F M
Median Days on<br />
<strong>Market</strong><br />
Monthly <strong>Market</strong> Detail - <strong>March</strong> <strong>2013</strong><br />
Townhouses <strong>and</strong> <strong>Condo</strong>s<br />
Bay County Association of REALTORS®<br />
This report describes member activity for the association <strong>and</strong> is not confined to any specific geographic area.<br />
Avg. Pct. of Orig.<br />
List Price<br />
Received<br />
Median Days on <strong>Market</strong><br />
The median number of days that properties sold during<br />
the month were on the market<br />
Economists' note : Median Days on <strong>Market</strong> is the amount of time the<br />
"middle" property selling this month was on the market. That is, 50%<br />
of homes selling this month took less time to sell, <strong>and</strong> 50% of homes<br />
took more time to sell. We use the median rather than the average<br />
because the median is not particularly sensitive to sales of homes that<br />
took an unusually large amount of time to sell relative to the vast<br />
majority of homes in the market.<br />
200<br />
150<br />
100<br />
50<br />
0<br />
Economists' note : The Average Percent of Original List Price Received<br />
is an indicator of market conditions, in that in a recovering market, the<br />
measure rises as buyers realize that the market may be moving away<br />
from them <strong>and</strong> they need to match the selling price (or better it) in<br />
order to get a contract on the house. This is usually the last measure to<br />
indicate a market that has shifted from down to up, <strong>and</strong> is another<br />
lagging indicator.<br />
95%<br />
90%<br />
85%<br />
80%<br />
75%<br />
Produced by Florida REALTORS® with data provided by Florida's multiple listing services. Statistics for each month compiled from MLS feeds on the 15th day of the following month.<br />
Data released on Monday, April 22, <strong>2013</strong>. Next data release is Wednesday, May 22, <strong>2013</strong>.<br />
Month<br />
Median Days on<br />
<strong>Market</strong><br />
Percent Change<br />
Year-over-Year<br />
<strong>March</strong> <strong>2013</strong> 73 35.2%<br />
February <strong>2013</strong> 71 -33.6%<br />
January <strong>2013</strong> 93 55.0%<br />
December 2012 61 -7.6%<br />
November 2012 73 -44.7%<br />
October 2012 81 -1.2%<br />
September 2012 61 -28.2%<br />
August 2012 89 0.0%<br />
July 2012 76 7.0%<br />
June 2012 90 20.0%<br />
May 2012 73 -25.5%<br />
April 2012 50 -30.6%<br />
<strong>March</strong> 2012 54 -47.6%<br />
2009 2010 2011 2012<br />
J F M A M J J A S O N D J F M A M J J A S O N D J F M A M J J A S O N D J F M A M J J A S O N D J F M<br />
Average Percent of Original List Price Received<br />
The average of the sale price (as a percentage of the original list<br />
price) across all properties selling during the month<br />
Month<br />
Avg. Pct. of Orig. List<br />
Price Received<br />
Percent Change<br />
Year-over-Year<br />
<strong>March</strong> <strong>2013</strong> 92.1% 4.4%<br />
February <strong>2013</strong> 91.9% 4.1%<br />
January <strong>2013</strong> 92.5% 2.7%<br />
December 2012 93.4% 4.5%<br />
November 2012 90.0% 3.0%<br />
October 2012 90.5% 0.1%<br />
September 2012 90.5% 3.9%<br />
August 2012 91.2% 2.8%<br />
July 2012 91.9% 3.7%<br />
June 2012 92.0% 5.4%<br />
May 2012 91.9% 3.3%<br />
April 2012 91.8% 4.9%<br />
<strong>March</strong> 2012 88.2% -0.8%<br />
2009 2010 2011 2012<br />
J F M A M J J A S O N D J F M A M J J A S O N D J F M A M J J A S O N D J F M A M J J A S O N D J F M
Inventory<br />
Months Supply of<br />
Inventory<br />
Monthly <strong>Market</strong> Detail - <strong>March</strong> <strong>2013</strong><br />
Townhouses <strong>and</strong> <strong>Condo</strong>s<br />
Bay County Association of REALTORS®<br />
This report describes member activity for the association <strong>and</strong> is not confined to any specific geographic area.<br />
Inventory (Active Listings)<br />
The number of property listings active at the end of<br />
the month<br />
Economists' note : There are a number of ways to calculate Inventory,<br />
so these numbers may not match up to others you see in your market.<br />
We calculate Inventory by counting the number of active listings on the<br />
last day of the month, <strong>and</strong> hold this number to compare with the same<br />
month the following year.<br />
2,100<br />
1,600<br />
1,100<br />
600<br />
Economists' note : This is an indicator of the state of the market,<br />
whether it is a buyers' market or a sellers' market. The benchmark for<br />
a balanced market (favoring neither buyer nor seller) is 5.5 Months of<br />
Inventory. Higher numbers indicate a buyers' market, lower numbers<br />
a sellers' market.<br />
37.0<br />
32.0<br />
27.0<br />
22.0<br />
17.0<br />
12.0<br />
7.0<br />
Produced by Florida REALTORS® with data provided by Florida's multiple listing services. Statistics for each month compiled from MLS feeds on the 15th day of the following month.<br />
Data released on Monday, April 22, <strong>2013</strong>. Next data release is Wednesday, May 22, <strong>2013</strong>.<br />
Month<br />
Inventory<br />
Percent Change<br />
Year-over-Year<br />
<strong>March</strong> <strong>2013</strong> 796 -26.3%<br />
February <strong>2013</strong> 801 -26.9%<br />
January <strong>2013</strong> 789 -30.5%<br />
December 2012 849 -24.2%<br />
November 2012 847 -30.3%<br />
October 2012 881 -26.3%<br />
September 2012 921 -21.8%<br />
August 2012 951 -19.9%<br />
July 2012 952 -21.9%<br />
June 2012 971 -21.9%<br />
May 2012 996 -22.1%<br />
April 2012 1,053 -19.2%<br />
<strong>March</strong> 2012 1,080 -18.4%<br />
2009 2010 2011 2012<br />
J F M A M J J A S O N D J F M A M J J A S O N D J F M A M J J A S O N D J F M A M J J A S O N D J F M<br />
Months Supply of Inventory<br />
An estimate of the number of months it will take to<br />
deplete the current Inventory given recent sales rates<br />
Month<br />
Months Supply<br />
Percent Change<br />
Year-over-Year<br />
<strong>March</strong> <strong>2013</strong> 8.2 -33.3%<br />
February <strong>2013</strong> 8.2 -33.7%<br />
January <strong>2013</strong> 8.2 -37.0%<br />
December 2012 8.8 -30.6%<br />
November 2012 9.0 -34.6%<br />
October 2012 9.4 -30.0%<br />
September 2012 9.8 -27.7%<br />
August 2012 10.4 -22.6%<br />
July 2012 10.6 -25.1%<br />
June 2012 11.1 -24.2%<br />
May 2012 11.6 -23.9%<br />
April 2012 12.1 -26.9%<br />
<strong>March</strong> 2012 12.2 -29.8%<br />
2009 2010 2011 2012<br />
J F M A M J J A S O N D J F M A M J J A S O N D J F M A M J J A S O N D J F M A M J J A S O N D J F M
Closed Sales<br />
Median Days<br />
on <strong>Market</strong><br />
Monthly <strong>Market</strong> Detail - <strong>March</strong> <strong>2013</strong><br />
Townhouses <strong>and</strong> <strong>Condo</strong>s<br />
Bay County Association of REALTORS®<br />
This report describes member activity for the association <strong>and</strong> is not confined to any specific geographic area.<br />
Closed Sales by Sale Price<br />
The number of sales transactions which closed during<br />
the month<br />
Economists' note : Closed Sales are one of the simplest—yet most<br />
important—indicators for the residential real estate market. When<br />
comparing Closed Sales across markets of different sizes, we<br />
recommend using the year-over-year percent changes rather than the<br />
absolute counts. Realtors® <strong>and</strong> their clients should also be wary of<br />
month-to-month comparisons of Closed Sales because of potential<br />
seasonal effects.<br />
25<br />
20<br />
15<br />
10<br />
5<br />
0<br />
Less than<br />
$50,000<br />
$50,000 -<br />
$99,999<br />
$100,000 -<br />
$149,999<br />
$150,000 -<br />
$199,999<br />
$200,000 -<br />
$249,999<br />
$250,000 -<br />
$299,999<br />
Median Days on <strong>Market</strong> by Sale Price<br />
The median number of days that properties sold during<br />
the month were on the market<br />
Economists' note: Median Days on <strong>Market</strong> is the amount of time the<br />
"middle" property selling this month was on the market. That is, 50%<br />
of homes selling this month took less time to sell, <strong>and</strong> 50% of homes<br />
took more time to sell. We use the median rather than the average<br />
because the median is not particularly sensitive to sales of homes that<br />
took an unusually large amount of time to sell relative to the vast<br />
majority of homes in the market.<br />
700<br />
600<br />
500<br />
400<br />
300<br />
200<br />
100<br />
0<br />
Less than<br />
$50,000<br />
$50,000 -<br />
$99,999<br />
$100,000 -<br />
$149,999<br />
$150,000 -<br />
$199,999<br />
$200,000 -<br />
$249,999<br />
$250,000 -<br />
$299,999<br />
Sale Price Closed Sales<br />
$100,000 - $149,999 16 -5.9%<br />
$150,000 - $199,999 21 5.0%<br />
$200,000 - $249,999 21 10.5%<br />
$250,000 - $299,999 14 16.7%<br />
$300,000 - $399,999 11 120.0%<br />
$400,000 - $599,999 1 -75.0%<br />
$600,000 - $999,999 0 -100.0%<br />
$1,000,000 or more 1 N/A<br />
Sale Price<br />
$150,000 - $199,999 91 184.4%<br />
$200,000 - $249,999 35 -28.6%<br />
$250,000 - $299,999<br />
Median Days on<br />
<strong>Market</strong><br />
47 17.5%<br />
$300,000 - $399,999 84 -71.5%<br />
$400,000 - $599,999 2 -95.6%<br />
$600,000 - $999,999 (No Sales) N/A<br />
$1,000,000 or more 598 N/A<br />
Produced by Florida REALTORS® with data provided by Florida's multiple listing services. Statistics for each month compiled from MLS feeds on the 15th day of the following month.<br />
Data released on Monday, April 22, <strong>2013</strong>. Next data release is Wednesday, May 22, <strong>2013</strong>.<br />
Percent Change<br />
Year-over-Year<br />
Less than $50,000 (No Sales) N/A<br />
$50,000 - $99,999 146 114.7%<br />
$100,000 - $149,999<br />
Percent Change<br />
Year-over-Year<br />
Less than $50,000 0 -100.0%<br />
$50,000 - $99,999 14 -22.2%<br />
$300,000 -<br />
$399,999<br />
$300,000 -<br />
$399,999<br />
$400,000 -<br />
$599,999<br />
$400,000 -<br />
$599,999<br />
$600,000 -<br />
$999,999<br />
$600,000 -<br />
$999,999<br />
$1,000,000 or<br />
more<br />
25<br />
20<br />
15<br />
10<br />
5<br />
0<br />
63 28.6%<br />
$1,000,000 or<br />
more<br />
700<br />
600<br />
500<br />
400<br />
300<br />
200<br />
100<br />
0
New Listings<br />
Inventory<br />
Monthly <strong>Market</strong> Detail - <strong>March</strong> <strong>2013</strong><br />
Townhouses <strong>and</strong> <strong>Condo</strong>s<br />
Bay County Association of REALTORS®<br />
This report describes member activity for the association <strong>and</strong> is not confined to any specific geographic area.<br />
New Listings by Initial Listing Price<br />
The number of properties put onto the market during<br />
the month<br />
Economists' note: In a recovering market, we expect that new listings<br />
will eventually rise as sellers raise their estimations of value. But this<br />
increase will take place only after the market has turned up, so New<br />
Listings are a lagging indicator of the health of the market. Also be<br />
aware of properties which have been withdrawn from the market <strong>and</strong><br />
then relisted. These are not really New Listings.<br />
25<br />
20<br />
15<br />
10<br />
5<br />
0<br />
Less than<br />
$50,000<br />
$50,000 -<br />
$99,999<br />
$100,000 -<br />
$149,999<br />
$150,000 -<br />
$199,999<br />
$200,000 -<br />
$249,999<br />
Inventory by Current Listing Price<br />
The number of property listings active at the end of<br />
the month<br />
Economists' note: There are a number of ways to calculate Inventory,<br />
so these numbers may not match up to others you see in your market.<br />
We calculate Inventory by counting the number of active listings on the<br />
last day of the month, <strong>and</strong> hold this number to compare with the same<br />
month the following year.<br />
180<br />
160<br />
140<br />
120<br />
100<br />
80<br />
60<br />
40<br />
20<br />
0<br />
Less than<br />
$50,000<br />
$50,000 -<br />
$99,999<br />
$100,000 -<br />
$149,999<br />
$150,000 -<br />
$199,999<br />
$200,000 -<br />
$249,999<br />
$250,000 -<br />
$299,999<br />
$250,000 -<br />
$299,999<br />
Initial Listing Price New Listings<br />
$50,000 - $99,999 18 -10.0%<br />
$100,000 - $149,999 17 -10.5%<br />
$150,000 - $199,999 22 -40.5%<br />
$200,000 - $249,999 23 -11.5%<br />
$250,000 - $299,999 17 0.0%<br />
$300,000 - $399,999 21 23.5%<br />
$400,000 - $599,999 21 200.0%<br />
$600,000 - $999,999 1 -85.7%<br />
$1,000,000 or more 0 N/A<br />
Current Listing Price Inventory<br />
$50,000 - $99,999 96 -24.4%<br />
$100,000 - $149,999 96 -38.9%<br />
$150,000 - $199,999 159 -26.4%<br />
$200,000 - $249,999 99 -29.8%<br />
$250,000 - $299,999 89 -36.9%<br />
$300,000 - $399,999 127 -14.2%<br />
$400,000 - $599,999 95 -10.4%<br />
$600,000 - $999,999 29 -3.3%<br />
$1,000,000 or more 3 -40.0%<br />
Produced by Florida REALTORS® with data provided by Florida's multiple listing services. Statistics for each month compiled from MLS feeds on the 15th day of the following month.<br />
Data released on Monday, April 22, <strong>2013</strong>. Next data release is Wednesday, May 22, <strong>2013</strong>.<br />
Percent Change<br />
Year-over-Year<br />
Less than $50,000 0 -100.0%<br />
$300,000 -<br />
$399,999<br />
$400,000 -<br />
$599,999<br />
$600,000 -<br />
$999,999<br />
$1,000,000 or<br />
more<br />
Percent Change<br />
Year-over-Year<br />
Less than $50,000 3 -66.7%<br />
$300,000 -<br />
$399,999<br />
$400,000 -<br />
$599,999<br />
$600,000 -<br />
$999,999<br />
$1,000,000 or<br />
more<br />
25<br />
20<br />
15<br />
10<br />
5<br />
0<br />
180<br />
160<br />
140<br />
120<br />
100<br />
80<br />
60<br />
40<br />
20<br />
0
Closed Sales<br />
Median Sale Price<br />
Monthly <strong>Market</strong> Detail - <strong>March</strong> <strong>2013</strong><br />
Townhouses <strong>and</strong> <strong>Condo</strong>s<br />
Bay County Association of REALTORS®<br />
This report describes member activity for the association <strong>and</strong> is not confined to any specific geographic area.<br />
100%<br />
90%<br />
80%<br />
70%<br />
60%<br />
50%<br />
40%<br />
30%<br />
20%<br />
10%<br />
0%<br />
$300,000<br />
$250,000<br />
$200,000<br />
$150,000<br />
$100,000<br />
$50,000<br />
$0<br />
Traditional<br />
Foreclosure/REO<br />
Short Sale<br />
Closed Sales<br />
Median Sale Price<br />
Closed Sales<br />
Median Sale Price<br />
Closed Sales<br />
Median Sale Price<br />
Traditional Foreclosure/REO Short Sale<br />
<strong>March</strong> <strong>2013</strong> <strong>March</strong> 2012<br />
10 21 -52.4%<br />
$132,250 $110,000 20.2%<br />
5 21 -76.2%<br />
$80,000 $110,000 -27.3%<br />
Produced by Florida REALTORS® with data provided by Florida's multiple listing services. Statistics for each month compiled from MLS feeds on the 15th day of the following month.<br />
Data released on Monday, April 22, <strong>2013</strong>. Next data release is Wednesday, May 22, <strong>2013</strong>.<br />
Percent Change<br />
Year-over-Year<br />
84 80 5.0%<br />
$224,000 $177,875 25.9%<br />
2009 2010 2011 2012<br />
J F M A M J J A S O N D J F M A M J J A S O N D J F M A M J J A S O N D J F M A M J J A S O N D J F M<br />
J F M A M J J A S O N D J F M A M J J A S O N D J F M A M J J A S O N D J F M A M J J A S O N D J F M<br />
2009 2010 2011 2012