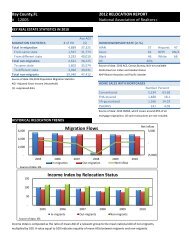
March 2013 Townhome and Condo Market Summary
Courtesy of Dawn Dunlap, Broker for Property Connections Boutique.
Courtesy of Dawn Dunlap, Broker for Property Connections Boutique.

You also want an ePaper? Increase the reach of your titles
YUMPU automatically turns print PDFs into web optimized ePapers that Google loves.
Median Sale Price<br />
Average Sale<br />
Price<br />
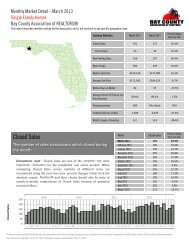
Monthly <strong>Market</strong> Detail - <strong>March</strong> <strong>2013</strong><br />
Townhouses <strong>and</strong> <strong>Condo</strong>s<br />
Bay County Association of REALTORS®<br />
This report describes member activity for the association <strong>and</strong> is not confined to any specific geographic area.<br />
Median Sale Price<br />
The median sale price reported for the month (i.e. 50%<br />
of sales were above <strong>and</strong> 50% of sales were below)<br />
Economists' note : Median Sale Price is our preferred summary<br />
statistic for price activity because, unlike Average Sale Price, Median<br />
Sale Price is not sensitive to high sale prices for small numbers of<br />
homes that may not be characteristic of the market area.<br />
$260K<br />
$240K<br />
$220K<br />
$200K<br />
$180K<br />
$160K<br />
$140K<br />
Economists' note : As noted above, we prefer Median Sale Price over<br />
Average Sale Price as a summary statistic for home prices. However,<br />
Average Sale Price does have its uses—particularly when it is analyzed<br />
alongside the Median Sale Price. For one, the relative difference<br />
between the two statistics can provide some insight into the market for<br />
higher-end homes in an area.<br />
$300K<br />
$250K<br />
$200K<br />
$150K<br />
Produced by Florida REALTORS® with data provided by Florida's multiple listing services. Statistics for each month compiled from MLS feeds on the 15th day of the following month.<br />
Data released on Monday, April 22, <strong>2013</strong>. Next data release is Wednesday, May 22, <strong>2013</strong>.<br />
Month<br />
Median Sale Price<br />
Percent Change<br />
Year-over-Year<br />
<strong>March</strong> <strong>2013</strong> $190,000 11.8%<br />
February <strong>2013</strong> $199,950 26.2%<br />
January <strong>2013</strong> $173,200 -5.1%<br />
December 2012 $204,500 2.3%<br />
November 2012 $175,000 -5.4%<br />
October 2012 $167,500 -13.0%<br />
September 2012 $170,000 -0.3%<br />
August 2012 $192,000 12.9%<br />
July 2012 $175,500 9.8%<br />
June 2012 $201,125 25.7%<br />
May 2012 $180,000 -0.8%<br />
April 2012 $175,000 16.2%<br />
<strong>March</strong> 2012 $170,000 -14.8%<br />
2009 2010 2011 2012<br />
J F M A M J J A S O N D J F M A M J J A S O N D J F M A M J J A S O N D J F M A M J J A S O N D J F M<br />
Average Sale Price<br />
The average sale price reported for the month (i.e.<br />
total sales in dollars divided by the number of sales)<br />
Month<br />
Average Sale Price<br />
Percent Change<br />
Year-over-Year<br />
<strong>March</strong> <strong>2013</strong> $212,073 13.5%<br />
February <strong>2013</strong> $198,153 9.8%<br />
January <strong>2013</strong> $191,352 -15.5%<br />
December 2012 $210,149 2.2%<br />
November 2012 $181,461 -10.2%<br />
October 2012 $176,254 -11.9%<br />
September 2012 $174,015 -7.4%<br />
August 2012 $199,361 12.5%<br />
July 2012 $202,015 21.3%<br />
June 2012 $263,197 51.8%<br />
May 2012 $197,006 1.0%<br />
April 2012 $200,315 14.8%<br />
<strong>March</strong> 2012 $186,892 -9.5%<br />
2009 2010 2011 2012<br />
J F M A M J J A S O N D J F M A M J J A S O N D J F M A M J J A S O N D J F M A M J J A S O N D J F M