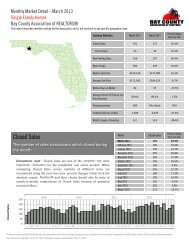
March 2013 Townhome and Condo Market Summary
Courtesy of Dawn Dunlap, Broker for Property Connections Boutique.
Courtesy of Dawn Dunlap, Broker for Property Connections Boutique.

You also want an ePaper? Increase the reach of your titles
YUMPU automatically turns print PDFs into web optimized ePapers that Google loves.
New Listings<br />
Inventory<br />
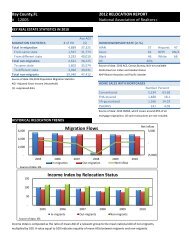
Monthly <strong>Market</strong> Detail - <strong>March</strong> <strong>2013</strong><br />
Townhouses <strong>and</strong> <strong>Condo</strong>s<br />
Bay County Association of REALTORS®<br />
This report describes member activity for the association <strong>and</strong> is not confined to any specific geographic area.<br />
New Listings by Initial Listing Price<br />
The number of properties put onto the market during<br />
the month<br />
Economists' note: In a recovering market, we expect that new listings<br />
will eventually rise as sellers raise their estimations of value. But this<br />
increase will take place only after the market has turned up, so New<br />
Listings are a lagging indicator of the health of the market. Also be<br />
aware of properties which have been withdrawn from the market <strong>and</strong><br />
then relisted. These are not really New Listings.<br />
25<br />
20<br />
15<br />
10<br />
5<br />
0<br />
Less than<br />
$50,000<br />
$50,000 -<br />
$99,999<br />
$100,000 -<br />
$149,999<br />
$150,000 -<br />
$199,999<br />
$200,000 -<br />
$249,999<br />
Inventory by Current Listing Price<br />
The number of property listings active at the end of<br />
the month<br />
Economists' note: There are a number of ways to calculate Inventory,<br />
so these numbers may not match up to others you see in your market.<br />
We calculate Inventory by counting the number of active listings on the<br />
last day of the month, <strong>and</strong> hold this number to compare with the same<br />
month the following year.<br />
180<br />
160<br />
140<br />
120<br />
100<br />
80<br />
60<br />
40<br />
20<br />
0<br />
Less than<br />
$50,000<br />
$50,000 -<br />
$99,999<br />
$100,000 -<br />
$149,999<br />
$150,000 -<br />
$199,999<br />
$200,000 -<br />
$249,999<br />
$250,000 -<br />
$299,999<br />
$250,000 -<br />
$299,999<br />
Initial Listing Price New Listings<br />
$50,000 - $99,999 18 -10.0%<br />
$100,000 - $149,999 17 -10.5%<br />
$150,000 - $199,999 22 -40.5%<br />
$200,000 - $249,999 23 -11.5%<br />
$250,000 - $299,999 17 0.0%<br />
$300,000 - $399,999 21 23.5%<br />
$400,000 - $599,999 21 200.0%<br />
$600,000 - $999,999 1 -85.7%<br />
$1,000,000 or more 0 N/A<br />
Current Listing Price Inventory<br />
$50,000 - $99,999 96 -24.4%<br />
$100,000 - $149,999 96 -38.9%<br />
$150,000 - $199,999 159 -26.4%<br />
$200,000 - $249,999 99 -29.8%<br />
$250,000 - $299,999 89 -36.9%<br />
$300,000 - $399,999 127 -14.2%<br />
$400,000 - $599,999 95 -10.4%<br />
$600,000 - $999,999 29 -3.3%<br />
$1,000,000 or more 3 -40.0%<br />
Produced by Florida REALTORS® with data provided by Florida's multiple listing services. Statistics for each month compiled from MLS feeds on the 15th day of the following month.<br />
Data released on Monday, April 22, <strong>2013</strong>. Next data release is Wednesday, May 22, <strong>2013</strong>.<br />
Percent Change<br />
Year-over-Year<br />
Less than $50,000 0 -100.0%<br />
$300,000 -<br />
$399,999<br />
$400,000 -<br />
$599,999<br />
$600,000 -<br />
$999,999<br />
$1,000,000 or<br />
more<br />
Percent Change<br />
Year-over-Year<br />
Less than $50,000 3 -66.7%<br />
$300,000 -<br />
$399,999<br />
$400,000 -<br />
$599,999<br />
$600,000 -<br />
$999,999<br />
$1,000,000 or<br />
more<br />
25<br />
20<br />
15<br />
10<br />
5<br />
0<br />
180<br />
160<br />
140<br />
120<br />
100<br />
80<br />
60<br />
40<br />
20<br />
0