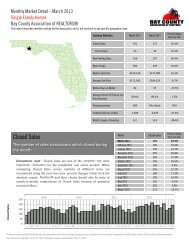
March 2013 Townhome and Condo Market Summary
Courtesy of Dawn Dunlap, Broker for Property Connections Boutique.
Courtesy of Dawn Dunlap, Broker for Property Connections Boutique.

Create successful ePaper yourself
Turn your PDF publications into a flip-book with our unique Google optimized e-Paper software.
Pct. of Closed<br />
Sales Paid in Cash<br />
Townhouses <strong>and</strong> <strong>Condo</strong>s<br />
Bay County Association of REALTORS®<br />
This report describes member activity for the association <strong>and</strong> is not confined to any specific geographic area.<br />
Cash Sales<br />
The number of Closed Sales during the month in which<br />
buyers exclusively paid in cash<br />
Economists' note : Cash Sales can be a useful indicator of the extent to<br />
which investors are participating in the market. Why? Investors are<br />
far more likely to have the funds to purchase a home available up front,<br />
whereas the typical homebuyer requires a mortgage or some other<br />
form of financing. There are, of course, many possible exceptions, so<br />
this statistic should be interpreted with care.<br />
60<br />
50<br />
40<br />
30<br />
20<br />
Cash Sales Monthly <strong>Market</strong> Detail - <strong>March</strong> <strong>2013</strong><br />
10<br />
0<br />
Economists' note : This statistic is simply another way of viewing<br />
Cash Sales. The remaining percentages of Closed Sales (i.e. those not<br />
paid fully in cash) each month involved some sort of financing, such as<br />
mortgages, owner/seller financing, assumed loans, etc.<br />
60%<br />
50%<br />
40%<br />
30%<br />
20%<br />
10%<br />
0%<br />
Produced by Florida REALTORS® with data provided by Florida's multiple listing services. Statistics for each month compiled from MLS feeds on the 15th day of the following month.<br />
Data released on Monday, April 22, <strong>2013</strong>. Next data release is Wednesday, May 22, <strong>2013</strong>.<br />
Month Cash Sales<br />
Percent Change<br />
Year-over-Year<br />
<strong>March</strong> <strong>2013</strong> 41 -12.8%<br />
February <strong>2013</strong> 47 38.2%<br />
January <strong>2013</strong> 26 18.2%<br />
December 2012 38 100.0%<br />
November 2012 25 316.7%<br />
October 2012 25 257.1%<br />
September 2012 38 216.7%<br />
August 2012 38 15.2%<br />
July 2012 44 18.9%<br />
June 2012 46 21.1%<br />
May 2012 44 -18.5%<br />
April 2012 47 -13.0%<br />
<strong>March</strong> 2012 47 -16.1%<br />
2009 2010 2011 2012<br />
J F M A M J J A S O N D J F M A M J J A S O N D J F M A M J J A S O N D J F M A M J J A S O N D J F M<br />
Cash Sales as a Percentage of Closed Sales<br />
The percentage of Closed Sales during the month<br />
which were Cash Sales<br />
Month<br />
Percent of Closed<br />
Sales Paid in Cash<br />
Percent Change<br />
Year-over-Year<br />
<strong>March</strong> <strong>2013</strong> 41.4% -11.0%<br />
February <strong>2013</strong> 49.0% 21.0%<br />
January <strong>2013</strong> 36.1% 14.9%<br />
December 2012 38.4% 55.6%<br />
November 2012 31.6% 253.4%<br />
October 2012 30.5% 265.9%<br />
September 2012 36.2% 129.2%<br />
August 2012 38.4% -3.5%<br />
July 2012 44.0% -13.2%<br />
June 2012 36.5% -4.9%<br />
May 2012 39.3% -6.9%<br />
April 2012 47.0% 1.0%<br />
<strong>March</strong> 2012 46.5% -11.9%<br />
2009 2010 2011 2012<br />
J F M A M J J A S O N D J F M A M J J A S O N D J F M A M J J A S O N D J F M A M J J A S O N D J F M