


You also want an ePaper? Increase the reach of your titles
YUMPU automatically turns print PDFs into web optimized ePapers that Google loves.
GIEWS<br />
<strong>Crop</strong> <strong>Prospects</strong> and<br />
<strong>Food</strong> <strong>Situation</strong><br />
HIGHLIGHTS CONTENTS<br />
n FAO’s first forecast for world wheat production in 2013 stands at<br />
690 million tonnes, about 28 million tonnes up from 2012 and the<br />
second largest crop on record. The increase is expected mostly in Europe,<br />
driven by an expansion in area in response to high prices, and in some countries<br />
due to an expected recovery in yields from last year’s below-average levels.<br />
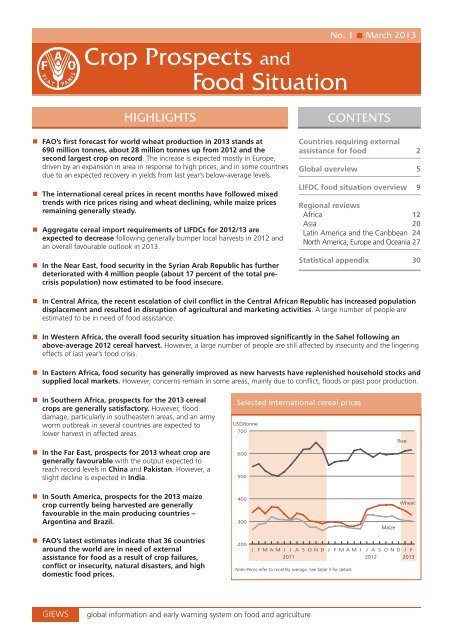
n The international cereal prices in recent months have followed mixed<br />
trends with rice prices rising and wheat declining, while maize prices<br />
remaining generally steady.<br />
n Aggregate cereal import requirements of LIFDCs for 2012/13 are<br />
expected to decrease following generally bumper local harvests in 2012 and<br />
an overall favourable outlook in 2013.<br />
n In the Near East, food security in the Syrian Arab Republic has further<br />
deteriorated with 4 million people (about 17 percent of the total precrisis<br />
population) now estimated to be food insecure.<br />
global information and early warning system on food and agriculture<br />
No. 1 n March 2013<br />
Countries requiring external<br />
assistance for food 2<br />
Global overview 5<br />
LIFDC food situation overview 9<br />
Regional reviews<br />
Africa 12<br />
Asia 20<br />
Latin America and the Caribbean 24<br />
North America, Europe and Oceania 27<br />
Statistical appendix 30<br />
n In Central Africa, the recent escalation of civil conflict in the Central African Republic has increased population<br />
displacement and resulted in disruption of agricultural and marketing activities. A large number of people are<br />
estimated to be in need of food assistance.<br />
n In Western Africa, the overall food security situation has improved significantly in the Sahel following an<br />
above-average 2012 cereal harvest. However, a large number of people are still affected by insecurity and the lingering<br />
effects of last year’s food crisis.<br />
n In Eastern Africa, food security has generally improved as new harvests have replenished household stocks and<br />
supplied local markets. However, concerns remain in some areas, mainly due to conflict, floods or past poor production.<br />
n In Southern Africa, prospects for the 2013 cereal<br />
crops are generally satisfactory. However, flood<br />
damage, particularly in southeastern areas, and an army<br />
worm outbreak in several countries are expected to<br />
lower harvest in affected areas.<br />
n In the Far East, prospects for 2013 wheat crop are<br />
generally favourable with the output expected to<br />
reach record levels in China and Pakistan. However, a<br />
slight decline is expected in India.<br />
n In South America, prospects for the 2013 maize<br />
crop currently being harvested are generally<br />
favourable in the main producing countries –<br />
Argentina and Brazil.<br />
n FAO’s latest estimates indicate that 36 countries<br />
around the world are in need of external<br />
assistance for food as a result of crop failures,<br />
conflict or insecurity, natural disasters, and high<br />
domestic food prices.<br />
Selected international cereal prices<br />
USD/tonne<br />
700<br />
600<br />
500<br />
400<br />
300<br />
200<br />
Maize<br />
Rice<br />
Wheat<br />
J F M A M J J A S O N D J F M A M J J A S O N D J F<br />
2011 2012 2013<br />
Note: Prices refer to monthly average. See Table 3 for details
<strong>Crop</strong> <strong>Prospects</strong> and <strong>Food</strong> <strong>Situation</strong><br />
Countries requiring external assistance for food 1<br />
World: 36 countries<br />
country requiring<br />
external assistance<br />
for food<br />
AFRICA (28 countries)<br />
Exceptional shortfall in aggregate food production/supplies<br />
Lesotho<br />
Lower household food stocks and high prices limit food<br />
availability and access. An estimated 39 percent of the<br />
population is food insecure.<br />
Zimbabwe<br />
An estimated 1.67 million people are food insecure following<br />
the poor cereal output in 2012. However, generally stable<br />
prices and adequate maize supplies, due to imports, have<br />
stabilized food security conditions.<br />
Widespread lack of access<br />
Bukina Faso<br />
Massive influx of refugees from Mali has put additional<br />
pressure on local food markets. Although production recovered<br />
significantly in 2012, assistance is still needed in parts, due to<br />
the lingering effects of last year’s drought-induced food crisis.<br />
Chad<br />
Lingering effects of 2011 sharp drop in production resulted<br />
in depletion of household assets. Moreover, over 300 000<br />
people from the Sudan’s Darfur region and the Central African<br />
Republic are located as refugees in southern and eastern<br />
regions of Chad. Also, the return of an estimated 79 000<br />
Chadians from Libya is putting additional pressure on the local<br />
food supply.<br />
Djibouti<br />
About 70 000 people, mainly pastoralists affected by high food<br />
prices and consecutive poor rainy seasons, are estimated to be<br />
in need of humanitarian assistance.<br />
Eritrea<br />
Vulnerability to food insecurity due to economic constraints<br />
and high food and fuel prices.<br />
2<br />
No. 1 n March 2013<br />
<br />
<br />
<br />
<br />
<br />
<br />
Gambia<br />
A steep drop in 2011 cereal production and high food prices<br />
led to a deterioration of the food security situation in several<br />
parts of the country. In spite of last year’s increased national<br />
production assistance is still needed.<br />
Guinea<br />
Access to food negatively affected by several years of high<br />
food prices and general inflation.<br />
Liberia<br />
Slow recovery from war-related damages, inadequate social<br />
services and infrastructure, as well as high food prices and poor<br />
market access. Massive influx of refugees from Côte d’Ivoire<br />
- some 65 647 Ivorian refugees were still living in Liberia as of<br />
November 2012.<br />
Malawi<br />
Rapid rise in food prices has severely constrained food access,<br />
while localized floods in the south during January aggravated<br />
the poor food insecurity situation. Nearly 2 million people are<br />
in need of food assistance.<br />
Mali<br />
Insecurity in northern Mali have disrupted food commodity<br />
flows and resulted in large population displacements. This has<br />
worsened the already precarious food security situation created<br />
by the drought-induced 2011 poor harvest.<br />
Mauritania<br />
Lingering effects of the 2011 sharp drop in production which<br />
resulted in depletion of household assets. The country is also<br />
affected by high international food prices due to its high<br />
import dependency. Moreover, more than 110 000 Malian<br />
refugees have been registered in Hodh Ech Chargui Region in<br />
the southeastern part of the country.
Niger<br />
The country has been struck by successive severe food crises<br />
in recent years that resulted in depletion of household assets<br />
and high levels of indebtedness. In addition, large numbers of<br />
refugees and returning national migrant workers from Mali<br />
and Libya placed an increasing demand on food.<br />
Sierra Leone<br />
Slow recovery from war-related damage. Depreciation of<br />
currency led to higher inflation negatively affecting households’<br />
purchasing power and food security conditions.<br />
Severe localized food insecurity<br />
Burundi<br />
Below-average seasonal harvests, coupled with high food prices,<br />
continue to erode purchasing power of low-income households.<br />
Cameroon<br />
About 400 000 individuals in need of relief food assistance<br />
due to production shortfalls in some northern areas. The<br />
situation in the north of the country was further aggravated<br />
in August by floods affecting about 60 000 people.<br />
Central Africa Republic<br />
Renewed civil conflict caused the displacement of 173 000<br />
individuals and restricted access to agricultural land and food.<br />
Congo<br />
Widespread floods had already occurred in August/<br />
September affecting about 54 000 people. In November<br />
and December, persistent torrential rains caused extensive<br />
flooding in the capital, Brazzaville and in Pointe-Noire, the<br />
two largest cities in the country, causing the displacement of<br />
further 13 500 persons.<br />
Côte d’Ivoire<br />
Conflict-related damage to agriculture in recent years and<br />
the lack of support services mainly in the northern regions.<br />
The 2011 post-election crisis forced thousands of people to<br />
leave the country and seek refuge, mostly in eastern Liberia,<br />
where over 65 000 Ivorian refugees were still living as of<br />
November 2012.<br />
Democratic Republic of the Congo<br />
Escalation of conflict has displaced additional people<br />
increasing the total number of IDPs to an estimated 2.7<br />
million. Agricultural activities were hindered, especially in<br />
eastern parts, while high food prices continue to impede<br />
food access. Nationally, a total of 6.4 million people are<br />
estimated to be in food and livelihood crisis.<br />
Ethiopia<br />
Although the food security conditions are improving with<br />
the commercialization of the favourable 2012 meher season<br />
harvest, some 3.7 million people are still estimated to be in<br />
need of humanitarian assistance.<br />
Kenya<br />
The number of people in need of humanitarian assistance is<br />
still estimated at 2.1 million. However, food security conditions<br />
are expected to deteriorate in some southeast and coastal<br />
zones due to below average 2012/13 short rains harvest.<br />
Madagascar<br />
Stable national rice prices are benefiting food security<br />
conditions, however, the passing of Cyclone Felleng in<br />
January 2013 led to some flood damages and market<br />
disruptions. Further flooding remains a possibility until the<br />
end of the cyclone season in April 2013. Overall, 35 percent<br />
of households are estimated to be food insecure.<br />
<br />
<br />
<br />
<br />
<br />
<br />
<br />
<br />
<br />
<br />
<br />
<strong>Crop</strong> <strong>Prospects</strong> and <strong>Food</strong> <strong>Situation</strong><br />
Mozambique<br />
Heavy rains and flooding in January and February affected<br />
about 213 000 people, causing damage to cropped fields<br />
and loss of food stocks. Maize prices continue to climb<br />
across the country, negatively impacting on households’<br />
food access.<br />
Senegal<br />
Production shortfalls and high food prices in 2012 led to a<br />
deterioration of the food security situation in several parts<br />
of the country. Although production recovered significantly<br />
last year, assistance is still needed in parts.<br />
Somalia<br />
The number of people in need of emergency assistance<br />
has been halved in the past six months to 1.05 million as a<br />
consequence of continued humanitarian interventions and<br />
improved food supply due to the ongoing 2012/13 deyr.<br />
South Sudan<br />
About 1 million people are estimated to be severely food<br />
insecure, mainly in pocket areas affected by civil insecurity,<br />
trade restrictions and floods.<br />
Sudan<br />
About 3.5 million people are estimated to be in need of<br />
humanitarian assistance, mainly in conflict-affected areas.<br />
ASIA (6 countries)<br />
Exceptional shortfall in aggregate food production/supplies<br />
Iraq<br />
Severe civil insecurity.<br />
Syrian Arab Republic<br />
Severe civil conflict continues. The number of people in<br />
need of urgent food and livelihood assistance is estimated<br />
to be 4 million. Although, some international food<br />
assistance is provided, the Syrian refugees are putting strain<br />
on other countries in the region.<br />
Widespread lack of access<br />
Democratic People’s Republic of Korea<br />
A dry spell in May-June 2012 affected early season harvest<br />
of wheat, barley and potatoes and main season soybeans.<br />
Localized floods in July-August have damaged agricultural<br />
infrastructure, including fish ponds. Chronic food insecurity<br />
exists, despite improved cereal harvest of 2012 main season,<br />
with 2.8 million severely vulnerable people requiring food<br />
assistance during the 2012/13 marketing year (November/<br />
October).<br />
Yemen<br />
The severely food-insecure population in need of emergency<br />
food assistance is estimated at over 10 million people (46<br />
percent of the population) as a result of high levels of<br />
poverty, prolonged conflict and high prices of food and fuel.<br />
Severe localized food insecurity<br />
Afghanistan<br />
Some areas, particularly in the extreme northeast and<br />
some higher elevations of the central highlands are faced<br />
with increased food insecurity due to loss of livestock and<br />
reduced remittances from the Islam Republic of Iran.<br />
Kyrgyzstan<br />
A lower cereal production makes the country dependant<br />
on the import of staple foods and vulnerable to global food<br />
price rises, which adversely affect the purchasing power<br />
of the poorest families. Socio-political tensions still exist in<br />
Jalalabad, Osh and Batken Oblasts.<br />
<br />
<br />
<br />
<br />
<br />
<br />
<br />
<br />
<br />
<br />
<br />
No. 1 n March 2013 3
<strong>Crop</strong> <strong>Prospects</strong> and <strong>Food</strong> <strong>Situation</strong><br />
LATIN AMERICA AND THE CARIBBEAN (2 country)<br />
Severe localized food insecurity<br />
Cuba<br />
<strong>Crop</strong> losses and agricultural damage due to Hurricane Sandy<br />
in October 2012. About 563 000 most vulnerable people<br />
affected by the hurricane have been targeted by WFP as<br />
beneficiaries of emergency food assistance.<br />
Haiti<br />
Severe damage to agriculture, housing and infrastructure<br />
caused by Tropical Storm Isaac and Hurricane Sandy in 2012.<br />
Countries with unfavourable prospects for<br />
current crops 2<br />
AFRICA (1 country)<br />
Namibia<br />
Below normal rains during the 2012/13 cropping season,<br />
with dry conditions intensifying at the start of 2013, except<br />
in the far northeastern areas.<br />
4<br />
No. 1 n March 2013<br />
+<br />
<br />
+<br />
Key - Changes since last report (December 2012)<br />
No change Improving Deteriorating New Entry +<br />
Terminology<br />
1 Countries requiring external assistance for food are expected to lack<br />
the resources to deal with reported critical problems of food insecurity. <strong>Food</strong><br />
crises are nearly always due to a combination of factors but for the purpose<br />
of response planning, it is important to establish whether the nature of food<br />
crises is predominantly related to lack of food availability, limited access<br />
to food, or severe but localized problems. Accordingly, the list of countries<br />
requiring external assistance is organized into three broad, not mutually<br />
exclusive, categories:<br />
• Countries facing an exceptional shortfall in aggregate food<br />
production/supplies as a result of crop failure, natural disasters,<br />
interruption of imports, disruption of distribution, excessive post-harvest<br />
losses, or other supply bottlenecks.<br />
• Countries with widespread lack of access, where a majority of the<br />
population is considered to be unable to procure food from local markets,<br />
due to very low incomes, exceptionally high food prices, or the inability to<br />
circulate within the country.<br />
• Countries with severe localized food insecurity due to the influx of<br />
refugees, a concentration of internally displaced persons, or areas with<br />
combinations of crop failure and deep poverty.<br />
2 Countries facing unfavourable prospects for current crops are countries<br />
where prospects point to a shortfall in production of current crops as a result of<br />
a reduction of the area planted and/or yields due to adverse weather conditions,<br />
plant pests, diseases and other calamities.
Global overview<br />
EARLY PROSPECTS FOR 2013<br />
CEREAL CROPS<br />
Overall favourable outlook for<br />
global 2013 wheat production<br />
At this stage of the season, with the<br />
bulk of the coarse grains and paddy<br />
crops yet to be planted in the coming<br />
months it is still too early for even a<br />
preliminary forecast of global cereal<br />
output in 2013. For wheat, however,<br />
in the northern hemisphere, which<br />
accounts for the bulk of the global<br />
production, winter crops are already<br />
developing or are soon to come out<br />
of dormancy, while spring planting<br />
is underway in some countries and a<br />
preliminary picture of global prospects<br />
is already available.<br />
FAO’s first forecast for world<br />
wheat production in 2013 stands at<br />
690 million tonnes, representing an<br />
increase of 4.3 percent from the 2012<br />
harvest and, the second largest crop on<br />
record after that of 2011. The increase<br />
is expected mostly in Europe, driven by<br />
an expansion in area in response to high<br />
prices, and a recovery in yields from<br />
below-average levels in some parts last<br />
year, notably the Russian Federation.<br />
Aggregate plantings in the EU are<br />
estimated to be 3 percent higher and<br />
weather conditions have been generally<br />
favourable so far. Elsewhere in Europe,<br />
prospects are satisfactory in the Russian<br />
Federation: although winter plantings<br />
have decreased, this is expected to be<br />
more than offset by an increase in the<br />
spring wheat area, and assuming yields<br />
recover from last year’s drought-reduced<br />
levels, output is forecast to increase<br />
sharply. Also in Ukraine, a large recovery<br />
in wheat output is forecast as the winter<br />
wheat area recovered from last year’s<br />
reduced level and winter conditions<br />
have been generally satisfactory.<br />
In North America, the outlook in<br />
the United States is less favourable<br />
than among the other major wheat<br />
producing countries: although good<br />
precipitation in February has greatly<br />
improved the outlook in previously<br />
drought-affected winter wheat areas,<br />
it is likely too late for the stressed<br />
crops to make a full recovery. Thus,<br />
despite an estimated 1 percent<br />
increase in winter wheat plantings and<br />
the likelihood that spring plantings<br />
will at least match last year’s level,<br />
if not expand slightly, aggregate<br />
wheat output is tentatively forecast<br />
to decrease by about 6 percent to 58<br />
million tonnes, below the average of<br />
the past five years.<br />
In Asia, prospects for the 2013<br />
wheat crop, to be harvested from<br />
April, are mostly favourable in the<br />
main producing countries. In China,<br />
higher minimum purchase prices<br />
have encouraged farmers to maintain<br />
last year’s good area and favourable<br />
weather conditions have benefited<br />
Table 1. Wheat production: leading producers 1<br />
(million tonnes)<br />
Average<br />
2010-12 2011<br />
2012<br />
estimate<br />
<strong>Crop</strong> <strong>Prospects</strong> and <strong>Food</strong> <strong>Situation</strong><br />
2013<br />
forecast<br />
Change: 2013 over<br />
2012 (%)<br />
European Union 135.2 137.6 132.0 138.0 4.5<br />
China (Mainland) 117.7 117.4 120.6 121.4 0.7<br />
India 87.5 86.9 94.9 92.3 -2.7<br />
United States of America 58.8 54.4 61.8 58.0 -6.1<br />
Russian Federation 45.2 56.2 38.0 53.0 39.5<br />
Australia 26.5 29.9 22.1 23.0 4.1<br />
Canada 25.3 25.3 27.2 28.0 2.9<br />
Pakistan 23.9 24.3 24.0 24.7 2.9<br />
Turkey 20.5 21.8 20.1 20.5 2.0<br />
Ukraine 18.3 22.3 15.8 19.5 23.4<br />
Kazakhstan 14.3 22.7 10.3 15.2 47.6<br />
Iran Islamic Rep. of 14.1 13.5 13.8 13.5 -2.2<br />
Argentina 13.4 14.1 10.1 12.5 23.8<br />
Egypt 8.1 8.4 8.7 8.5 -2.3<br />
Uzbekistan 6.6 6.3 6.7 6.5 -3.0<br />
World 672.5 700.2 661.8 690.0 4.3<br />
1 Countries ranked according to average production 2010-12.<br />
crops and early official forecasts point<br />
to a record wheat output of some<br />
121 million tonnes in 2013. Also in<br />
Pakistan, a record wheat output is<br />
forecast reflecting larger plantings and<br />
good yield prospects. In India, plantings<br />
are around last year’s good level and<br />
another bumper crop is in prospect<br />
although forecast slightly below the<br />
2012 record because of limited rainfall<br />
in some important producing areas.<br />
In North Africa, early prospects<br />
for the 2013 wheat crops are good.<br />
Soil moisture was reported to be<br />
ample for planting last autumn and<br />
winter conditions have favoured crop<br />
development.<br />
In the southern hemisphere, the<br />
major wheat crops will be sown later<br />
this year. In Australia, where planting<br />
starts from April, early prospects are<br />
uncertain: tight supplies and strong<br />
prices are expected to provide incentive<br />
to farmers to increase plantings,<br />
but soil moisture reserves have been<br />
severely depleted by the summer<br />
heat wave in some major producing<br />
areas and much more precipitation is<br />
needed to ensure satisfactory planting<br />
conditions.<br />
No. 1 n March 2013 5
<strong>Crop</strong> <strong>Prospects</strong> and <strong>Food</strong> <strong>Situation</strong><br />
Favourable outlook for<br />
southern hemisphere 2013<br />
coarse grains crops<br />
In South America, the first 2013 maize<br />
crops are already developing or, in<br />
some case, about to be harvested, and<br />
prospects are generally favourable.<br />
In Brazil, following favourable<br />
precipitation, official forecasts point<br />
to a 9 percent increase in production<br />
compared to the same season’s output<br />
last year. Planting progress for the<br />
second season crop is also satisfactory<br />
under the good moisture conditions and<br />
the area is expected to increase from<br />
last year’s level. In Argentina, official<br />
estimates indicate that maize plantings<br />
have fallen some 8 percent from the<br />
record high of 2012. Nevertheless, at<br />
the estimated area, a recovery of yields<br />
after last year’s drought-reduced level<br />
could see production rise to a record<br />
high of 25.5 million tonnes. However,<br />
a dry spell from early January through<br />
early February may impact negatively<br />
on yields of late planted crops if more<br />
rains don’t arrive soon. In Southern<br />
Africa, the 2013 cereal crops have<br />
developed satisfactorily overall in the<br />
large producing areas and current<br />
indications point to improved yields<br />
over last year’s average level, except<br />
in Namibia, where rains were below<br />
normal. In South Africa, the subregion’s<br />
main producer, 2013 maize production<br />
is anticipated to reach near record<br />
levels, around 13 million tonnes, if<br />
favourable weather persists. However,<br />
an army worm outbreak and flooding<br />
is expected to depress production in<br />
localized areas of the subregion.<br />
The 2013 paddy season starts<br />
under generally favourable<br />
conditions<br />
Several countries located along and<br />
south of the equator have already<br />
started, or are about to start, collecting<br />
their first 2013 rice crops. In Asia,<br />
Indonesia is targeting a 5 percent<br />
6<br />
No. 1 n March 2013<br />
increase in production in the coming<br />
season, under the Government<br />
expansionary drive. This is despite<br />
delays in the planting of the main crop,<br />
due to drought, and subsequent flood-<br />
related damage. Although also incurring<br />
losses to its main crop due to floods, Sri<br />
Lanka is heading towards a 4 percent<br />
area-based increase in output in 2013.<br />
In Southern Africa, Mozambique and<br />
Madagascar are now bearing the effects<br />
of cyclones and tropical storms, which<br />
are being associated with heavy rains<br />
and floods. In the case of Madagascar,<br />
the excessive precipitation has helped<br />
overcome the moisture deficits resulting<br />
from below average rains in December<br />
and January. Although still subject to<br />
much uncertainty, the replenishment<br />
could help foster an increase in output,<br />
especially as the Government is<br />
supporting an expansion of plantings.<br />
Likewise, Mozambique has announced<br />
an official production target of 350 000<br />
tonnes, which would break the 2012<br />
record by 2 percent. In South America,<br />
Argentina, which will officially open the<br />
rice harvest on 8 March, has reported<br />
a 2 percent retrenchment in plantings.<br />
However, growing conditions have<br />
been more favourable this year, which<br />
may result in a rebounding of yields<br />
to near record levels. The season is<br />
also well advanced in Brazil, where<br />
officials are predicting production to<br />
rise by 3.7 percent to about 12 million<br />
tonnes, despite a small contraction in<br />
the area. Uruguay is also estimated to<br />
have planted 5 percent less this year,<br />
which could curb the final output. In<br />
Bolivia, excessive precipitation has also<br />
prompted a contraction of the area<br />
under rice. <strong>Prospects</strong> are more buoyant<br />
in Paraguay and Peru where producer<br />
organizations have announced an<br />
increase in rice cultivation. In Oceania,<br />
despite below average rainfall and high<br />
temperatures in December and January<br />
in New South Wales where much of the<br />
Australian rice is grown, production in<br />
the country is expected to expand by 15<br />
percent, to its highest level since 2002,<br />
thanks to the availability of abundant<br />
irrigation water in reservoirs.<br />
2012/13 CEREAL SUPPLY AND<br />
DEMAND<br />
World 2012 cereal production<br />
revised upward but remains<br />
below 2011<br />
FAO’s latest forecast for world cereal<br />
production in 2012 has been revised<br />
upward by 4 million tonnes since the<br />
February figure to 2 306 million tonnes<br />
(including rice in milled terms), but still<br />
about 2 percent down from the previous<br />
year’s record. The latest revision largely<br />
reflects some upward adjustment for<br />
rice as the 2012 secondary crop harvests<br />
in some countries are still ongoing or<br />
have just been completed. At the current<br />
forecast of 489 million tonnes (milled<br />
terms), world rice production in 2012<br />
would be 1 percent up from the previous<br />
year. The estimate of global wheat output<br />
in 2012 remains at 662 million tonnes,<br />
5.5 percent down from 2011, while that<br />
for coarse grains also remains virtually<br />
unchanged at 1 156 million tonnes,<br />
1 percent down from 2011.<br />
Figure 1. World cereal<br />
production and utilization<br />
Million tonnes<br />
2400<br />
2300<br />
2200<br />
2100<br />
2000<br />
1900<br />
1800<br />
2002<br />
2004<br />
Production<br />
Utilization<br />
2006<br />
2008<br />
2010<br />
2012<br />
estim.
Utilization up marginally, due<br />
to falling demand for ethanol<br />
production<br />
The forecast for world cereal utilization<br />
in 2012/13 has been raised slightly (by<br />
about 3 million tonnes) since February<br />
to 2 330 million tonnes, reflecting small<br />
adjustments to the estimates for food and<br />
other uses. At the current forecast level,<br />
global cereal utilization would be barely<br />
3.8 million tonnes greater than in 2011/12,<br />
sustained mainly by increases in food<br />
consumption, now predicted to expand<br />
by 14 million tonnes, or 1.3 percent. This<br />
rate is sufficient to keep per caput food<br />
availability stable at 152.8 kg per year for<br />
cereals as a whole, with a small decline<br />
in wheat to 66.9 kg offset by modest<br />
increases in rice and coarse grains to<br />
57 kg and 28.9 kg, respectively. On the<br />
other hand, world utilization of cereals as<br />
feed is likely to be only marginally higher<br />
than in 2011/12, as a sharp reduction<br />
in wheat feed usage from the previous<br />
season’s record level is expected to be fully<br />
made up by coarse grains.<br />
The tightening of wheat supplies and<br />
resulting high prices since the middle<br />
of last year are behind the expected<br />
2 percent contraction of total wheat<br />
utilization in 2012/13, to 683 million<br />
Figure 2. Ratio of world cereal<br />
stocks to utilization 1<br />
%<br />
36<br />
32<br />
28<br />
24<br />
20<br />
16<br />
12<br />
08/09<br />
09/10<br />
Rice<br />
Wheat<br />
Total cereals<br />
%<br />
36<br />
32<br />
28<br />
24<br />
20<br />
16<br />
Coarse grains<br />
12<br />
10/11 11/12 12/13 2<br />
estimate<br />
f’cast<br />
1 Compares closing stocks with utilization in following season.<br />
2 Utilization in 2012/13 is a trend value based on<br />
extrapolation from the 2001/02-2011/12 period.<br />
tonnes. Much of this decline would be on<br />
account of an 8 percent reduction in feed<br />
utilization from the previous year’s record,<br />
a drop that is expected in most countries<br />
except in the United States, where feed<br />
wheat use could double in 2012/13 and<br />
reach a record, mainly in substitution for<br />
maize. Total utilization of coarse grains<br />
is forecast to rise by 0.8 percent to<br />
1 169.7 million tonnes. While world feed<br />
use is expected to rebound by 2.4 percent<br />
to a record 649 million tonnes, the<br />
anticipated 10 percent fall in the use of<br />
maize for production of fuel ethanol in<br />
the United States, which is forecast to fall<br />
to 114 million tonnes in 2012/13 from<br />
127 million tonnes in 2011/12, is behind<br />
an overall 3.2 percent contraction in<br />
world usage of coarse grains other than<br />
food and feed. World rice consumption in<br />
2012/13 is forecast at 477 million tonnes,<br />
1.6 percent (7.4 million tonnes) higher<br />
Table 2. Basic facts of world cereal situation<br />
(million tonnes)<br />
PRODUCTION 1<br />
2010/11<br />
<strong>Crop</strong> <strong>Prospects</strong> and <strong>Food</strong> <strong>Situation</strong><br />
than the previous season, underpinned<br />
by a rise in human food consumption to<br />
403 million tonnes, or 85 percent of the<br />
total utilization.<br />
Inventories higher than was<br />
projected earlier but the stockto-use<br />
ratio still falls<br />
The forecast for world cereal stocks at the<br />
close of crop seasons ending in 2013 has<br />
been scaled up by about 4 million tonnes<br />
compared to February, mainly reflecting<br />
upward revisions in wheat inventories. At<br />
499 million tonnes, the new estimate of<br />
cereal carryovers would still be 2.7 percent<br />
(14 million tonnes) lower than in the<br />
previous season, reflecting an anticipated<br />
drawdown in wheat and coarse grains,<br />
while rice inventories are expected to rise<br />
further. At the current forecast level, the<br />
world cereal stock-to-use ratio would<br />
reach 20.7 percent in 2012/13, down from<br />
2011/12<br />
estimate<br />
2012/13<br />
forecast<br />
Change: 2012/13<br />
over 2011/12 (%)<br />
World 2 259.6 2 352.1 2 306.4 -1.9<br />
Developing countries 1 318.8 1 350.4 1 400.0 3.7<br />
Developed countries 940.8 1 001.7 906.4 -9.5<br />
TRADE 2<br />
World 284.9 317.1 302.9 -4.5<br />
Developing countries 93.7 98.9 119.6 20.9<br />
Developed countries 191.2 218.2 183.4 -16.0<br />
UTILIZATION<br />
World 2 276.7 2 326.1 2 329.9 0.2<br />
Developing countries 1 424.8 1 468.9 1 495.5 1.8<br />
Developed countries 851.8 857.2 834.4 -2.7<br />
Per caput cereal food use<br />
(kg per year) 152.3 152.7 152.8 0.1<br />
STOCKS 3<br />
World 492.7 513.4 499.4 -2.7<br />
Developing countries 343.7 368.2 388.1 5.4<br />
Developed countries 149.0 145.2 111.3 -23.4<br />
WORLD STOCK-TO-USE RATIO% 21.2 22.0 20.7 -6.0<br />
Note: Totals and percentage change computed from unrounded data.<br />
1 Data refer to calendar year of the first year shown and include rice in milled terms.<br />
2 For wheat and coarse grains, trade refers to exports based on July/June marketing season. For rice, trade<br />
refers to exports based on the calendar year of the second year shown.<br />
3 Data are based on an aggregate of carryovers level at the end of national crop years and, therefore, do not<br />
represent world stock levels at any point in time.<br />
No. 1 n March 2013 7
<strong>Crop</strong> <strong>Prospects</strong> and <strong>Food</strong> <strong>Situation</strong><br />
22 percent in 2011/12. As much of the<br />
contraction of world cereal reserves stems<br />
from reductions in exporting countries,<br />
the ratio of major cereal exporters’ closing<br />
stocks to their total disappearance (defined<br />
as domestic utilization plus exports) is<br />
estimated to slide from 17.9 percent in<br />
the previous season to 16.4 percent in<br />
2012/13. World wheat inventories are<br />
anticipated to fall from the previous<br />
year by 9 percent (15 million tonnes)<br />
to 162.5 million tonnes, despite a 3.6<br />
million tonnes increase from the forecast<br />
in February on higher than earlier projected<br />
stocks in the Russian Federation and<br />
Ukraine. Nonetheless, the contraction over<br />
the season would still be mainly on account<br />
of Kazakhstan, the Russian Federation and<br />
Ukraine, while lower ending stocks are also<br />
projected for Australia, the EU and the<br />
United States. The forecast for world coarse<br />
grains carryovers remains unchanged from<br />
the February level of 165 million tonnes.<br />
At this level, world inventories would have<br />
fallen by 6 percent (10 million tonnes) from<br />
their opening level, with the United States<br />
and the EU expected to draw drown their<br />
reserves by almost 9 million and 4.3 million<br />
tonnes, respectively. By contrast, global<br />
rice inventories are expected to surge<br />
by 7.3 percent (11.7 million tonnes)<br />
to 172 million tonnes, sustained by a<br />
sharp accumulation in China but also<br />
in Thailand, where the Government<br />
pledging programme continues to divert<br />
supplies away from the market into public<br />
stockpiles.<br />
Trade in 2012/13 contracts less<br />
than was anticipated earlier<br />
World trade in cereals in 2012/13 is<br />
forecast to reach nearly 303 million<br />
tonnes, 5.4 million tonnes more than<br />
predicted in February, but 4.5 percent<br />
(14.2 million tonnes) less than the record<br />
registered in 2011/12. Compared to<br />
the previous season, more than half<br />
of the expected contraction would be<br />
on account of wheat trade (including<br />
wheat flour in wheat equivalent), which<br />
8<br />
No. 1 n March 2013<br />
is forecast at 139.5 million tonnes in<br />
2012/13 (July/June), down 8 million<br />
tonnes from 2011/12. This is 3 million<br />
tonnes more than previously foreseen,<br />
with the revision reflecting higher<br />
prospects for exports by India and the<br />
EU and larger imports by the Russian<br />
Federation and Ukraine. The expected<br />
sharp retreat in wheat imports in<br />
2012/13 reflects reduced purchases by<br />
several countries; namely, Afghanistan,<br />
Algeria, Egypt, Kenya, Saudi Arabia,<br />
Thailand, Turkey and Uzbekistan. On the<br />
exporter side, tight supplies are forecast<br />
to reduce shipments by the Russian<br />
Federation, Kazakhstan and Ukraine<br />
as well as Argentina, Australia and the<br />
EU. Against this backdrop, large wheat<br />
exports by India, currently forecast to<br />
reach 7.5 million tonnes, have helped in<br />
easing the market situation. World trade<br />
in coarse grains is now forecast to reach<br />
126.5 million tonnes, some 2.5 million<br />
tonnes higher than was anticipated<br />
earlier but still as much as 5.5 million<br />
tonnes (4 percent) below the estimated<br />
trade volume in 2011/12. This month’s<br />
upward revision is mostly on account<br />
of much higher maize imports by the<br />
EU, which could reach a five-year high<br />
of 9 million tonnes in 2012/13, up 3<br />
million tonnes from the previous season<br />
due to lower production and reduced<br />
feed wheat supplies in domestic markets.<br />
The projected contraction in world trade<br />
in 2012/13 reflects anticipated reduced<br />
imports by a number of countries,<br />
including Brazil, Canada, Egypt,<br />
Indonesia, Saudi Arabia, South Africa and<br />
Venezuela, more than offsetting larger<br />
imports by the EU, Kenya, Ukraine and<br />
the United States. An emerging feature<br />
in 2012/13 has been the sharp decline<br />
in maize exports from the United States<br />
(by over 18 million tonnes to 24.5 million<br />
tonnes on July/June basis) because of the<br />
drought-reduced production in 2012. The<br />
decline should be largely compensated<br />
by a near three-fold increase in sales by<br />
Brazil, to a record 23 million tonnes.<br />
World trade in rice in 2013 is forecast<br />
at 37 million tonnes, 2 percent below the<br />
record 37.8 million tonnes traded in 2011.<br />
The decline would mainly stem from lower<br />
shipments by India, which emerged as<br />
the world leading rice exporter in 2012,<br />
before Viet Nam and Thailand. In 2013,<br />
however, Thailand is foreseen to recover<br />
its primacy among exporters, provided<br />
that releasing supplies from government<br />
stocks could help restore the country’s<br />
international competitiveness.<br />
INTERNATIONAL PRICE<br />
ROUNDUP<br />
International cereal prices in<br />
recent months have followed<br />
mixed trends with rice prices<br />
firming and wheat declining,<br />
while maize remaining<br />
generally steady<br />
International prices of wheat weakened<br />
further in February, third month in a row,<br />
with the benchmark US wheat price (No.2<br />
Hard Red Winter, f.o.b.) averaging USD 329<br />
per tonne, a significant 6 percent decline<br />
from January although still 11 percent<br />
above its level in February 2012. Prices<br />
from other origins also moved down<br />
but only marginally or remained stable.<br />
The decrease in US wheat export prices<br />
reflects some improvements in prospects<br />
for the 2013 winter wheat crop, following<br />
significant precipitation last month in key<br />
growing areas affected by severe drought<br />
conditions. A stronger US dollar also<br />
put downward pressure on prices, while<br />
higher export demand prevented further<br />
declines.<br />
Export prices of maize levelled in<br />
February, after decreasing in December<br />
and January. The benchmark US maize<br />
price (US No2, Yellow) averaged USD 303<br />
per tonne, still some 8 percent higher<br />
than in February 2012. Slow exports<br />
during most of the month, coupled with<br />
indications of an increase in 2013 maize<br />
plantings compared to last year and a<br />
stronger US dollar, weighed on prices.
However, the downward pressure was<br />
offset by some recovery in demand in the<br />
last part of the month, particularly from<br />
the domestic industry in the United States.<br />
International rice prices rose slightly in<br />
February, as reflected in the FAO All Rice<br />
price index, which gained 3 points to 239.<br />
Prices of all rice varieties generally firmed<br />
up. Quotations increased in most origins,<br />
supported by policy measures (government<br />
purchases in Thailand and India) and<br />
by reports of new sales in Pakistan and<br />
the United States. By contrast, prices<br />
weakened in Viet Nam and in South<br />
America where harvesting of the main<br />
crops is gaining pace. The benchmark Thai<br />
White Rice 100%B price averaged USD<br />
616 per tonne, up from USD 611 per tonne<br />
in January, continuing the steady upward<br />
trend observed since October 2012.<br />
Table 3. Cereal export prices*<br />
(USD/tonne)<br />
United States<br />
<strong>Crop</strong> <strong>Prospects</strong> and <strong>Food</strong> <strong>Situation</strong><br />
2012 2013<br />
Feb. Sept. Oct. Nov. Dec. Jan. Feb.<br />
Wheat 1 297 371 373 373 360 348 329<br />
Maize 2 279 323 320 324 310 303 303<br />
Sorghum 2 268 286 290 289 288 287 288<br />
Argentina 3<br />
Wheat 263 336 332 345 360 362 358<br />
Maize 267 278 274 294 288 294 283<br />
Thailand 4<br />
Rice, white 5 563 602 594 598 599 611 616<br />
Rice, broken 6 530 540 544 545 546 558 562<br />
*Prices refer to the monthly average.<br />
1 No.2 Hard Red Winter (Ordinary Protein) f.o.b. Gulf.<br />
2 No.2 Yellow, Gulf.<br />
3 Up river, f.o.b.<br />
4 Indicative traded prices.<br />
5 100% second grade, f.o.b. Bangkok.<br />
6 A1 super, f.o.b. Bangkok.<br />
Low-Income <strong>Food</strong>-Deficit<br />
Countries food situation<br />
overview 1<br />
Mixed prospects for the 2013<br />
cereal crops in LIFDCs<br />
Early prospects for the 2013 cereal<br />
production are mixed in the group of<br />
62 LIFDCs. In the northern hemisphere,<br />
harvesting of the main winter cereal crops,<br />
primarily wheat and barley, generally<br />
1 The Low-Income <strong>Food</strong>-Deficit Countries<br />
(LIFDCs) group includes net food deficit countries<br />
with annual per caput income below the level<br />
used by World Bank to determine eligibility for IDA<br />
assistance (i.e. USD 1915 in 2010). The 2013 FAO list<br />
of LIFDCs includes 62 countries as opposed to 66 on<br />
the 2012 list. The countries that graduated from the<br />
list are Georgia, Syria Arab Republic and Timor-Leste<br />
due to income criteria, and Republic of Moldova, due<br />
to net food-exporter criteria. For full details see:<br />
http://www.fao.org/countryprofiles/lifdc.asp.<br />
begins in April with the bulk of the crop<br />
gathered in June. Early outlook for these<br />
crops is favourable in North Africa (in<br />
Egypt, the only LIFDC) and Near East, due<br />
to good weather so far. Similarly in the<br />
Far East, the outlook for the 2013 mostly<br />
irrigated main wheat crop and secondary<br />
rice crop is promising in Bangladesh,<br />
Cambodia, Indonesia and the Philippines.<br />
By contrast, in India the official estimates<br />
project a reduced wheat crop production<br />
due to scanty post-monsoon rainfall over<br />
important producing states and below-<br />
average 2012/13 Rabi paddy crop as<br />
result of planting delays and localized<br />
damage caused by Cyclone Nilam, which<br />
affected Andhra Pradesh the most. In Sri<br />
Lanka, floods during November-December<br />
2012 have partially affected the main<br />
season (Maha) paddy crop. <strong>Prospects</strong> are<br />
favourable in CIS in Asia, particularly in<br />
Kyrgyzstan and Tajikistan, where larger<br />
plantings have been reported. In the<br />
southern hemisphere, the main summer<br />
season crops, mainly maize, is approaching<br />
maturity and harvesting is expected<br />
to start in March-April. The current<br />
prospects for the 2013 main maize crop<br />
are generally satisfactory in Southern<br />
Africa, following a disappointing output<br />
in 2012. However, production is expected<br />
to be compromised in localized areas of<br />
Botswana, Mozambique, Madagascar,<br />
Malawi, Zambia and Zimbabwe, due to<br />
damage caused by floods in January and<br />
early February and pest infestations. In<br />
Eastern Africa, below-average harvest<br />
forecasts for the secondary crops are<br />
made in Kenya, where “short-rains’’<br />
No. 1 n March 2013 9
<strong>Crop</strong> <strong>Prospects</strong> and <strong>Food</strong> <strong>Situation</strong><br />
season performed poorly, while elsewhere<br />
in the subregion prospects for the harvest<br />
are uncertain due to erratic rainfall<br />
performance.<br />
Record 2012 aggregate cereal<br />
harvest of the LIFDCs, but<br />
lower production in Southern<br />
Africa and Central America<br />
With the 2012 cereal harvest almost<br />
complete, FAO’s latest estimate puts<br />
the annual cereal production for the<br />
62 LIFDCs as a group at a record level<br />
of 537.7 million tonnes (rice in milled<br />
terms), some 3.5 percent or 18.2 million<br />
tonnes above the bumper harvest<br />
in 2011. Excluding India, the largest<br />
country in this group, the aggregate<br />
cereal output of the remaining 61<br />
LIFDCs, is estimated to expand by 5.2<br />
percent. Most of the increase is due to<br />
the recovery from the 2011 drought-<br />
affected poor harvest of about 6 and<br />
2.8 million tonnes in Western and<br />
Eastern Africa, respectively. Similarly,<br />
in the Near East, an estimated bumper<br />
production in Afghanistan has more<br />
than offset the poor harvest in Iraq,<br />
resulting in an increase of 14 percent<br />
over the 2011 below-average aggregate<br />
cereal production. In the Far East, the<br />
total cereal production is estimated<br />
to increase to a record level of 381.6<br />
million tonnes, up 2.5 percent on the<br />
previous record output in 2011, with an<br />
increase in cereal harvests in Cambodia,<br />
India, Indonesia and the Philippines<br />
among others. Good harvests were<br />
obtained in the remaining countries<br />
of the subregion, mainly reflecting<br />
favourable weather, larger plantings<br />
and substantial government support<br />
with agricultural inputs. Furthermore,<br />
favourable outputs were recorded<br />
in CIS in Asia and in North Africa<br />
(Egypt), following favourable weather<br />
throughout the growing season as well<br />
as supportive measures undertaken<br />
by the respective governments. On<br />
the other hand, in Southern Africa,<br />
10<br />
No. 1 n March 2013<br />
Table 4. Basic facts of the Low-Income <strong>Food</strong>-Deficit Countries (LIFDCs)<br />
cereal situation (million tonnes, rice in milled basis)<br />
2011/12 2012/13 Change: 2012/13<br />
2010/11 estimate forecast over 2011/12 (%)<br />
Cereal production1 512.2 519.5 537.7 3.5<br />
excluding India 292.0 284.8 299.6 5.2<br />
Utilization 561.7 572.4 587.3 2.6<br />
<strong>Food</strong> use 446.6 455.9 466.7 2.4<br />
excluding India 260.5 266.8 273.3 2.4<br />
Per caput cereal food use (kg per year) 0.2 0.2 0.2 0.4<br />
excluding India 0.2 0.2 0.2 0.7<br />
Feed 49.6 51.1 52.6 3.1<br />
excluding India 42.7 44.2 45.8 3.8<br />
End of season stocks2 99.5 111.2 113.8 2.4<br />
excluding India 62.5 66.3 65.9 -0.6<br />
1 Data refer to calendar year of the first year shown.<br />
2 May not equal the difference between supply and utilization because of differences in individual country<br />
marketing years.<br />
Table 5. Cereal production 1 of LIFDCs<br />
(million tonnes)<br />
2010 2011<br />
2012<br />
estimate<br />
Change: 2012<br />
over 2011 (%)<br />
Africa (39 countries) 132.9 126.3 134.1 6.2<br />
North Africa 18.2 20.0 21.0 4.8<br />
Eastern Africa 40.4 37.5 40.3 7.4<br />
Southern Africa 14.8 15.4 13.5 -12.2<br />
Western Africa 55.9 49.8 55.8 12.0<br />
Central Africa 3.6 3.6 3.5 -0.9<br />
Asia (17 countries) 377.3 391.0 401.6 2.7<br />
CIS in Asia 9.8 9.4 9.6 2.2<br />
Far East 356.5 372.5 381.6 2.5<br />
- India 220.2 234.6 238.1 1.5<br />
Near East 11.0 9.1 10.4 14.3<br />
Central America (3 countries) 2.0 2.2 1.9 -12.0<br />
Oceania (3 countries) 0.0 0.0 0.0 0.0<br />
LIFDC (62 countries) 512.2 519.5 537.7 3.5<br />
Note: Totals and percentage change computed from unrounded data.<br />
1 Includes rice in milled terms.<br />
a considerable decrease of over 12<br />
percent in total cereal production,<br />
from an average level in 2011, was<br />
recorded in all LIFDCs due to generally<br />
lower planting in some countries and a<br />
persistent dry spell in parts of Lesotho,<br />
Malawi, Mozambique and Zimbabwe.<br />
Similarly, in Central America adverse<br />
weather conditions dampened coarse<br />
grain harvests in Nicaragua, Honduras<br />
and especially Haiti, where the<br />
aggregate coarse grain harvest declined<br />
by 46 percent compared to the previous<br />
year’s good output. Elsewhere, in<br />
Central Africa and Oceania, the cereal<br />
production remains at a comparable<br />
level to 2011 output.<br />
Cereal import requirements for<br />
2012/13 slightly above average<br />
but lower than 2011/12<br />
Following bumper domestic production<br />
in 2012 and anticipated favourable<br />
output in 2013 for LIFDCs as a group,<br />
the total cereal import requirements<br />
for 2012/13 marketing year are now
forecast to decrease by about 8 million<br />
tonnes to 78.7 million tonnes, some 9<br />
percent below the previous year’s level<br />
but slightly above the average level of<br />
the preceding five years. This reflects a<br />
forecast decrease of 2.3 million tonnes<br />
in the Far East, where large importing<br />
countries such as Indonesia and the<br />
Philippines require lower cereal imports,<br />
following significant gains in domestic<br />
production. Lower import requirements<br />
are expected in North Africa and Near<br />
East, mainly on account of increased<br />
2012 wheat production in Egypt and<br />
Afghanistan. Similarly, above average<br />
supplies from the 2012 cereal harvests<br />
are expected to decrease import<br />
requirements in all subregions of Africa<br />
except in Central Africa. Relatively good<br />
levels of carryover stocks limited higher<br />
imports in CIS in Asia and Southern<br />
Africa. In Central America and the<br />
Caribbean and Oceania, cereal imports<br />
are anticipated to remain similar to that<br />
of 2011/12. In view of the decrease in<br />
overall import volumes in 2012/13, the<br />
net cereal import bill of the LIFDC is<br />
anticipated to decrease slightly to USD<br />
36.1 billion, about 1 percent below the<br />
2011/12 estimated record level. The<br />
latest FAO forecast indicates a decrease<br />
in import bills by 11 percent for rice<br />
and 4 percent for coarse grains but an<br />
increase of 6 percent for wheat, due to<br />
high prices of the commodity during<br />
the year.<br />
Table 6. Cereal import position of LIFDCs<br />
(thousand tonnes)<br />
Table 7. Cereal import bill in LIFDCs by region and type<br />
(July/June, USD million)<br />
<strong>Crop</strong> <strong>Prospects</strong> and <strong>Food</strong> <strong>Situation</strong><br />
2011/12 2012/13 or 2013<br />
or 2012 Requirements 1 Import position 2<br />
Actual<br />
imports<br />
Total<br />
imports:<br />
of which<br />
food aid<br />
Total<br />
imports:<br />
of which<br />
food aid<br />
pledges<br />
Africa (39 countries) 46 341 42 958 1 961 6 378 266<br />
North Africa 18 871 16 371 0 4 954 0<br />
Eastern Africa 8 183 7 987 1 333 698 124<br />
Southern Africa 2 508 2 346 193 606 112<br />
Western Africa 14 718 14 145 287 113 23<br />
Central Africa 2 061 2 109 148 6 6<br />
Asia (17 countries) 37 982 33 592 694 9 355 111<br />
CIS in Asia 4 740 3 587 0 1 839 0<br />
Far East 22 222 19 893 528 6 520 75<br />
Near East 11 020 10 112 166 996 36<br />
Central America (3 countries) 1 761 1 735 179 266 5<br />
Oceania (3 countries) 442 442 0 0 0<br />
Total (62 countries) 86 526 78 727 2 833 15 998 382<br />
Note: Totals computed from unrounded data.<br />
1 The import requirement is the difference between utilization (food, feed, other uses, export plus closing<br />
stocks) and domestic availability (production plus opening stocks).<br />
2 Estimates based on information available as of early February 2013.<br />
2007/08 2008/09 2009/10 2010/11 2011/12 2012/13<br />
estimate f'cast<br />
LIFDC 32 561 24 657 24 325 34 230 36 330 36 075<br />
Africa 16 652 12 973 12 202 17 098 19 455 18 607<br />
Asia 15 001 11 128 11 537 16 312 15 944 16 315<br />
Latin America and<br />
Caribbean 614 400 429 595 685 681<br />
Oceania 170 120 131 191 202 204<br />
Europe 123 35 26 33 44 268<br />
Wheat 19 201 16 039 14 149 18 770 19 562 20 758<br />
Coarse grains 3 512 3 214 2 902 4 764 5 594 5 373<br />
Rice 9 848 5 404 7 275 10 696 11 174 9 944<br />
No. 1 n March 2013 11
<strong>Crop</strong> <strong>Prospects</strong> and <strong>Food</strong> <strong>Situation</strong><br />
Regional reviews<br />
Africa<br />
North Africa<br />
Good early prospects for the 2013 winter crops<br />
In North Africa, early prospects for the 2013 winter wheat and<br />
coarse grains, to be harvested from May, are favourable. Although<br />
above average rains last autumn hampered field work in some<br />
areas, improved soil moisture has significantly encouraged<br />
early planting. Subsequently, the favourably wet autumn was<br />
followed by sunny weather conditions which promoted winter<br />
grain development. Preliminary reports indicate a similar level of<br />
plantings to last year.<br />
The subregion’s 2012 aggregate output of wheat (the main<br />
crop) is estimated at 17.9 million tonnes, 5 percent down from<br />
the above average harvest in 2011. The 2012 wheat harvest<br />
was uneven across the region as Algeria and Egypt recorded<br />
above average levels of production while Morocco’s wheat<br />
harvest, due to unfavourable weather conditions, reached only<br />
65 percent of the near record amount harvested in 2011. The<br />
subregional production of coarse grains is estimated at about<br />
12 million tonnes, also a decrease of 5 percent over 2011. By<br />
contrast, rice (paddy) production, although small in comparison,<br />
increased by almost 15 percent to 6.6 million tonnes. Thus, the<br />
subregion’s 2012 aggregate cereal production (rice in paddy<br />
terms) is estimated at 36.4 million tonnes, 2 percent down on<br />
2011 but 4 percent up on the five-year average.<br />
Imports expected to remain high in 2012/13<br />
Cereal import requirements for the 2012/13 are expected to be<br />
about 5 percent lower than the previous year. Likley declines in<br />
imports by Egypt and Algeria are expected to more than offset<br />
the increased import in Morocco. However, the subregion will still<br />
import about 22.9 million tonnes of wheat in the 2012/13, about<br />
the average of the previous five years. North African countries<br />
Table 8. North Africa cereal production<br />
(million tonnes)<br />
12<br />
2010 2011<br />
No. 1 n March 2013<br />
Wheat Coarse grains Rice (paddy) Total cereals<br />
2012<br />
estim. 2010 2011<br />
2012<br />
estim. 2010 2011<br />
2012<br />
estim. 2010 2011<br />
2012<br />
estim.<br />
Change:<br />
2012/2011 (%)<br />
North Africa 16.1 18.8 17.9 12.9 12.6 11.9 4.4 5.7 6.6 33.3 37.2 36.4 -2.2<br />
Algeria 3.1 2.8 3.4 1.6 1.5 1.8 0.0 0.0 0.0 4.7 4.2 5.2 22.8<br />
Egypt 7.2 8.4 8.7 8.0 7.8 7.8 4.3 5.7 6.5 19.5 21.8 23.0 5.6<br />
Morocco 4.9 6.0 3.9 2.8 2.6 1.4 0.1 0.1 0.1 7.7 8.6 5.3 -38.4<br />
Tunisia 0.8 1.6 1.8 0.3 0.7 0.8 0.0 0.0 0.0 1.1 2.3 2.6 12.8<br />
Note: Totals and percentage change computed from unrounded data.<br />
Note: Comments refer to<br />
situation as of March.<br />
North Africa<br />
• winter grains: vegetative<br />
Western Africa<br />
coastal countries:<br />
• main season<br />
cereals: land<br />
preparation/planting<br />
South Sudan, Sudan:<br />
• secondary season<br />
wheat: maturing<br />
Uganda<br />
• main season<br />
cereals: planting<br />
Burundi, Rwanda<br />
• main season cereals:<br />
land preparation/<br />
planting<br />
Southern Africa:<br />
• main season (summer<br />
cereals): harvesting<br />
Eritrea, Ethiopia:<br />
• secondary season<br />
grains: land preparation/<br />
planting<br />
Kenya, Somalia:<br />
• main season cereals:<br />
land preparation/<br />
planting<br />
Tanzania, U.R.<br />
• main season<br />
cereals: plantings<br />
rely heavily on wheat imports from the international market to<br />
cover their consumption needs.<br />
In Egypt, one of the world’s largest wheat importers, the<br />
government has announced that the current wheat stocks stand<br />
at about 3 million tonnes and are sufficient to cover up to four<br />
months of consumption requirements. In a move to increase<br />
public stock levels, a 5 percent increase in procurement prices<br />
for wheat, to be harvested from April/May, to EGP 400/ardeb<br />
(150 kg) was also announced in February 2013. Increasingly<br />
more concerns are being raised on the state and stability of grain<br />
supply in the country, especially in light of slow pace in imports in<br />
the last six months.<br />
Across the subregion the generous food subsidies have in part<br />
resulted in a relatively low level of bread inflation. While these<br />
subsidies are likely to remain, there is a serious discussion on how<br />
best to address their costs and targeting together with the food<br />
waste related to under-priced staples.
Western Africa<br />
In Western Africa, seasonal dry conditions prevail in the Sahel,<br />
while in the coastal countries along the Gulf of Guinea land<br />
preparation for the first maize crop is underway. Planting will<br />
begin with the arrival of rains, usually from April.<br />
Above-average harvest gathered in 2012 in<br />
most Sahelian countries<br />
The subregion’s aggregate cereal output in 2012 has been<br />
estimated at about 60.6 million tonnes, 11.5 percent up on<br />
the previous year and 14.2 percent above the previous five-year<br />
average. In the Sahel, the 2012 cereal production increased<br />
by 32.8 percent compared to the 2011 drought-affected<br />
output. An above-average crop was gathered in most Sahelian<br />
countries, including Burkina Faso, Chad, Guinea-Bissau, Mali,<br />
Mauritania and Niger. Estimates also indicate good cereal and<br />
root and tuber crops production in the coastal countries along the<br />
Gulf of Guinea, although crop production estimates in Nigeria<br />
are likely to be revised downwards to reflect the full impact of<br />
last year’s flooding.<br />
Prices of coarse grains dropped considerably in<br />
recent months and are generally below their<br />
levels of last year<br />
Reflecting last year’s good harvests, markets are generally well<br />
supplied and coarse grains prices have declined significantly<br />
across the region. For example, millet prices in markets in<br />
Bamako (Mali) and Ouagadougou (Burkina Faso) continued<br />
their downward movement through January 2013. Although<br />
prices increased slightly in February, they were still well below<br />
their levels a year earlier in Bamako and slightly above in<br />
Ouagadougou. In Nouakchott (Mauritania), sorghum prices in<br />
December 2012 were 17 percent below their levels of a year<br />
earlier. Similarly, prices of maize, the staple cereal in the coastal<br />
countries along the Gulf of Guinea, declined significantly. In<br />
Nigeria, maize prices in Kano, the most important city in the<br />
northern part of the country,<br />
rebounded in the past two<br />
months after falling sharply<br />
with the 2012 harvest but<br />
were still 3 percent below<br />
their levels of a year earlier.<br />
In Benin and Ghana, prices<br />
of maize in December 2012<br />
remained generally stable after<br />
significant declines in previous<br />
months with the arrival of the<br />
new harvests. Overall, prices<br />
were well below those in<br />
December 2011.<br />
Table 9. Western Africa cereal production<br />
(million tonnes)<br />
<strong>Crop</strong> <strong>Prospects</strong> and <strong>Food</strong> <strong>Situation</strong><br />
Coarse grains Rice (paddy) Total cereals 1<br />
2010 2011<br />
2012<br />
estim. 2010 2011<br />
2012<br />
estim. 2010 2011<br />
2012<br />
estim.<br />
Change:<br />
2012/2011 (%)<br />
Western Africa 47.6 42.0 47.4 12.9 12.2 13.1 60.6 54.4 60.6 11.5<br />
Burkina Faso 4.3 3.4 4.0 0.3 0.2 0.3 4.6 3.7 4.2 15.3<br />
Chad 3.0 1.5 3.5 0.2 0.2 0.2 3.2 1.7 3.7 124.0<br />
Ghana 2.4 2.2 2.2 0.5 0.5 0.5 2.9 2.6 2.7 4.4<br />
Mali 4.1 4.0 3.9 2.3 1.7 2.4 6.4 5.8 6.3 8.8<br />
Niger 5.5 3.5 5.1 0.1 0.1 0.1 5.6 3.6 5.2 42.1<br />
Nigeria 22.4 22.1 22.6 4.5 4.6 4.2 27.0 26.7 26.9 0.5<br />
Note: Totals and percentage change computed from unrounded data.<br />
1 Total cereals includes wheat, coarse grains and rice (paddy).<br />
Seasonal declines in coarse grain prices were less notable<br />
in Chad. Millet prices in the main market of N’Djamena, that<br />
have been following an upward trend since early 2012, declined<br />
only slightly during the harvest period. In December 2012, millet<br />
prices were 46 percent up on their levels of a year earlier. Some<br />
inter-regional restrictions on commodity movement have reduced<br />
the flow between deficit and surplus areas of the country and<br />
contributed to higher prices in the capital city and deficit areas.<br />
Prices of imported rice, mainly consumed in urban centres,<br />
have remained relatively stable in recent months in most countries<br />
of the subregion, both in the Sahel and in coastal countries.<br />
In Senegal prices of imported rice, the main staple in the<br />
country, have stabilized since mid-2012 following Government<br />
interventions and trends in international markets. However,<br />
in December 2012 rice prices were still above their levels in<br />
December 2011. Rice prices in Senegal had increased sharply<br />
since December 2011. In Mauritania, prices of imported wheat<br />
fell markedly in December 2012 and were lower than their levels<br />
at the same time a year earlier. This decline reflects the trend in<br />
international prices in recent months.<br />
Lingering effects of drought and insecurity<br />
affect large number of people<br />
In spite of last year’s good harvests, the food outlook for 2013<br />
remains uncertain in parts, due to insecurity and the lingering<br />
effects of last year’s food crisis.<br />
The severe food crisis that struck the Sahel in 2011/12<br />
(similar to 2004/05 and 2009/10) has had an adverse long-<br />
term impact on household assets and savings, on levels of<br />
indebtedness, and on the health and nutritional status of<br />
the population. Despite the good crop gathered in 2012,<br />
several segments of the population still need food and non-<br />
food assistance to restore their livelihoods. Implementation<br />
of income generation and asset reconstitution activities for<br />
food insecure and vulnerable people is recommended in<br />
most countries.<br />
No. 1 n March 2013 13
<strong>Crop</strong> <strong>Prospects</strong> and <strong>Food</strong> <strong>Situation</strong><br />
Figure 3. Millet prices in selected Western African<br />
markets<br />
CFA Franc BCEAO (XOF)/100kg<br />
32000<br />
28000<br />
24000<br />
20000<br />
16000<br />
12000<br />
14<br />
Burkina Faso<br />
Ouagadougou<br />
Mali<br />
Bamako<br />
Niger<br />
Niamey<br />
J F M A M J J A S O N D J F M A M J J A S O N D J<br />
2011 2012<br />
2013<br />
Source: Afrique Verte.<br />
Moreover, in Mali, current military operations have aggravated<br />
the disruptions to food commodity flows to northern regions<br />
leading to increasingly tight market supplies. For example,<br />
according to a recent WFP assessment supplies coming from<br />
Algeria to Kidal and Gao have fallen by 50 percent following the<br />
closure of the border with Algeria. Most traders have reportedly<br />
left the Kidal area increasing the risk of serious food shortages in<br />
that region, according to another rapid evaluation. The conflict<br />
has also resulted in large population displacements in the region.<br />
As of late January 2013, 15 208 new Malian refugees had<br />
arrived in Burkina Faso (5 002), Mauritania (8 468) and Niger<br />
(1 738). Over 200 000 Malian refugees were already residing<br />
in these countries as of late December 2012. There was also<br />
massive displacement of herders and livestock to neighbouring<br />
countries.<br />
Central Africa<br />
Good cereal production in 2012<br />
In Cameroon and the Central African Republic, the main<br />
cereal producers in the subregion, the sowing of the 2013<br />
main maize crop, due for harvest from July, is about to<br />
begin mostly in southern areas. Average to above-average<br />
cereal outputs were gathered in 2012 including the main<br />
season crop harvested in July-September and second<br />
season crop harvested in January 2013 following abundant<br />
rainfall in all countries of the subregion. Cereal production<br />
is limited and the bulk of the national cereal utilization<br />
requirement is imported in Gabon and the Republic of<br />
the Congo.<br />
No. 1 n March 2013<br />
<strong>Food</strong> prices rise sharply in some countries of<br />
the subregion<br />
In the Central African Republic, due to market disruptions<br />
caused by the civil strife and conflict in December, food prices<br />
increased significantly in several areas, including in the capital<br />
Bangui, where the cost of a food basket was calculated to be<br />
29 percent higher in January compared to the month before.<br />
Already, the annual consumer price inflation had surged from<br />
1.5 percent in 2011 to 7 percent in 2012. Similarly, in the<br />
Republic of the Congo, the average inflation rate increased<br />
from 1.8 percent in 2011 to 5.1 percent in 2012, partly due<br />
to the increased Government spending for the reconstruction<br />
efforts in the capital after the explosion in March 2012.<br />
In Gabon, prices of imported wheat, the main staple in<br />
the country, started to increase in January 2012, and by<br />
August 2012 were 35 percent higher reaching record levels.<br />
Subsequently, prices declined and stabilized in October at<br />
about the same level as a year earlier. The relative stabilization<br />
follows the policy measures implemented by the Government<br />
to curb food price inflation. By contrast, in Cameroon the<br />
average inflation rate remained stable at about 3 percent,<br />
while in Equatorial Guinea it declined from 6.3 percent in<br />
2011 to 5.4 percent in 2012.<br />
Continued civil conflict and recent floods<br />
exacerbate food insecurity<br />
Persistent civil insecurity and recurrent natural disasters continue<br />
to impede agricultural recovery and restrict humanitarian<br />
efforts in the subregion, depriving households of their means<br />
of livelihood and creating additional difficulties to access food.<br />
The situation further deteriorated in December 2012 following<br />
the civil strife in the Central African Republic, when an alliance<br />
of rebel groups took control of most of the east of the country.<br />
Widespread violence and looting ensued, IDPs caseload has been<br />
estimated at 65 000 by a Rapid Response Mechanism survey;<br />
however, since most of the affected populations sought refuge in<br />
the bush, OCHA estimates the number of IDPs at about 173 000.<br />
Although the security situation improved following a cease fire<br />
and the formation of a new national unity government, poor<br />
food insecurity conditions persist especially in the rebel occupied<br />
areas.<br />
In the Republic of the Congo, heavy rains caused extensive<br />
flooding in November and December 2012 displacing some<br />
13 500 persons in the capital Brazzaville and in Pointe-Noire.<br />
These areas were also affected by floods in August and September<br />
2012. Stagnant water caused concern for waterborne diseases<br />
and some cholera cases were reported. In response, USD 490 000<br />
have been allocated from the International Federation of<br />
Red Cross and Red Crescent (IFRC) through its Disaster Relief<br />
Emergency Fund.
Table 10. Central Africa cereal production<br />
(million tonnes)<br />
Coarse grains Rice (paddy) Total cereals 1<br />
2010 2011<br />
2012<br />
estim. 2010 2011<br />
2012<br />
estim. 2010 2011<br />
2012<br />
estim.<br />
Change:<br />
2012/2011 (%)<br />
Central Africa 3.3 3.2 3.2 0.5 0.5 0.5 3.8 3.8 3.7 -1.3<br />
Cameroon 1.8 1.7 1.7 0.1 0.1 0.1 1.9 1.8 1.8 0.0<br />
Central Africa Rep. 0.2 0.2 0.2 0.0 0.0 0.0 0.2 0.2 0.2 0.0<br />
Note: Totals and percentage change computed from unrounded data.<br />
1 Total cereals includes wheat, coarse grains and rice (paddy).<br />
Eastern Africa<br />
Mixed prospects for 2012/13 secondary season<br />
crop production<br />
Harvesting of the 2012/13 secondary season crops is underway<br />
in most countries, except in Ethiopia where planting of belg<br />
season crops is about to start. Given the favourable seasonal<br />
rainfall from October to December, average to above average<br />
levels of cereal production is forecast for southern and central<br />
Somalia and in bi-modal rainfall areas of Uganda and the<br />
United Republic of Tanzania. By contrast, below average<br />
cereal production is expected in southeastern and coastal<br />
marginal agricultural areas of Kenya, northern coastal<br />
lowlands of the United Republic of Tanzania, parts of eastern<br />
Ethiopia and in sections of Lower and Middle Juba regions<br />
in Somalia. Harvest prospects are particularly critical in Kenya<br />
where the short-rains season had performed poorly, with a<br />
series of dry spells that caused poor germination, increased re-<br />
plantings and wilting of crops. In East and West Hararghe zone<br />
of Oromia region of Ethiopia yields of long-cycle meher crops<br />
have been affected by the exceptionally short rainy season,<br />
which started late, allowing planting in June/July, and stopped<br />
at the end of August one month earlier than usual. In riverine<br />
districts of southern Somalia, the off-season crop production<br />
(mainly sesame, maize and other cash crops), which is normally<br />
harvested by the end of March, is expected to be negligible as<br />
a result of inadequate river flooding that normally facilitates<br />
recessional cultivation.<br />
The aggregate 2012 cereal output (main and secondary<br />
seasons) for the subregion is estimated at a near record level of<br />
40.9 million tonnes, about 6.9 percent above the previous year<br />
and 12.4 percent above the last five-year average. This overall<br />
positive result is essentially due to the above average main season<br />
harvests in Ethiopia and the Sudan. In particular, sorghum and<br />
millet production in the Sudan, harvested at the end of last year,<br />
significantly recovered from the very poor 2011 output where dry<br />
weather and insecurity had severely limited access to land and<br />
inputs. Cereal production also increased in 2012 in South Sudan<br />
due to an increased planted area and favourable yields following<br />
abundant rains.<br />
<strong>Crop</strong> <strong>Prospects</strong> and <strong>Food</strong> <strong>Situation</strong><br />
Planting of the 2013<br />
main season crops<br />
underway<br />
Land preparation for the 2013<br />
main season cereal crops has<br />
started in major growing<br />
areas of Central, Rift Valley<br />
and Western provinces in<br />
Kenya (long-rains cropping<br />
season), in south and central<br />
Somalia (gu cropping season)<br />
and in bimodal rainfall areas of South Sudan and Uganda. In<br />
the United Republic of Tanzania, planting of the 2013 long rains<br />
msimu season crops, to be harvested next May/June, has just<br />
been completed in central and southern uni-modal rainfall areas.<br />
Meteorological forecasts for the 2013 March to May rainy season<br />
point to an average to above-average precipitation over Uganda,<br />
southern parts of South Sudan, southwestern and central<br />
Ethiopia, western and central Kenya as well as the western half<br />
of Tanzania, while average to below-average rains are expected<br />
in the rest of the subregion.<br />
In Kenya, some concern is being raised about the impact of<br />
potential disruptions due to the presidential elections, scheduled<br />
for March 2013, on long-rains maize production due to possible<br />
scaling down of planted area.<br />
Cereal prices generally decline but still remain<br />
at high levels<br />
Prices of coarse grains declined seasonally in major growing areas<br />
with the arrival of 2012 main season harvests, but still remain<br />
above last year’s level in most countries. Nevertheless, upward<br />
trends are reported in the United Republic of Tanzania, Uganda<br />
and parts of Kenya due to below average second season crops<br />
and/or strong local and export demand. In Ethiopia, wholesale<br />
cereal prices decreased significantly during the last few months<br />
following the 2012 meher season harvest, but still remain<br />
between 10 and 20 percent above their levels of 12 months ago.<br />
In Somalia, prices of locally produced cereals have also declined<br />
since the harvest of 2012 gu season crops last August/September<br />
and in major producing areas prices are currently between 20<br />
and 60 percent below their levels of January 2012. In the Sudan,<br />
sorghum and maize prices dropped by 10 to 25 percent between<br />
July 2012 and January 2013 as the newly harvested crops increased<br />
local supply. However, despite the 2012 good production, current<br />
sorghum and millet prices are still well above last year’s level,<br />
ranging between 15 and 30 percent up, with peaks of more than<br />
50 percent for sorghum in Port Sudan. The persistence of high<br />
nominal price levels are a result of the increased costs of inputs,<br />
such as labour and chemicals and the exceptionally high inflation<br />
rates during 2012. In South Sudan, prices of locally produced<br />
No. 1 n March 2013 15
<strong>Crop</strong> <strong>Prospects</strong> and <strong>Food</strong> <strong>Situation</strong><br />
Table 11. Eastern Africa cereal production<br />
(million tonnes)<br />
16<br />
2010 2011<br />
No. 1 n March 2013<br />
Wheat Coarse grains Total cereals 1<br />
2012<br />
estim. 2010 2011<br />
2012<br />
estim. 2010 2011<br />
2012<br />
estim.<br />
Change:<br />
2012/2011 (%)<br />
Eastern Africa 4.1 4.0 4.3 34.8 32.2 34.9 41.3 38.3 40.9 6.9<br />
Ethiopia 3.1 3.1 3.5 16.0 16.7 17.4 19.2 20.0 21.1 5.4<br />
Kenya 0.5 0.3 0.3 3.5 3.4 2.9 4.1 3.8 3.2 -14.8<br />
Sudan 2 0.3 0.3 0.3 5.3 2.5 5.4 5.6 2.9 5.7 98.8<br />
Tanzania U.R. 0.1 0.1 0.1 5.9 5.5 5.5 7.7 7.1 6.7 -5.3<br />
Uganda 0.0 0.0 0.0 2.7 2.6 2.6 2.9 2.8 2.9 1.5<br />
Note: Totals and percentage change computed from unrounded data.<br />
1 Total cereals includes wheat, coarse grains and rice (paddy).<br />
2 Including South Sudan.<br />
maize and sorghum have declined in most markets since August/<br />
September 2012 following increased supplies of newly harvested<br />
crops. The sharpest declines, up to 70 percent, were recorded in<br />
Rumbek and in Aweil markets, while they were less significant<br />
in the capital Juba. However, current cereal prices are still higher<br />
than one year earlier, especially in flood-affected areas. In Kenya,<br />
prices of maize began to decline in major producing areas of the<br />
Rift Valley as the 2012 long-rains harvest became available from<br />
August.<br />
By contrast, prices are stable or even increasing in some<br />
southeastern and coastal areas in Kenya that experienced a poor<br />
2012/13 short-rainy season. In the United Republic of Tanzania,<br />
prices of maize have increased by 36 percent in Dar es Salaam<br />
market between August 2012 and January 2013. This is primarily<br />
due to the deepening of the lean season, in both uni-modal and<br />
bi-modal rainfall areas, the sustained demand from neighbouring<br />
countries (Rwanda, Burundi and DRC) and the poor vuli<br />
production prospects in some bi-modal coastal areas. By January<br />
2013, maize prices were up to two times higher than twelve<br />
months earlier and at record levels in most monitored markets.<br />
Similarly, in Uganda, prices of maize continued to increase<br />
(+10 percent from December to January) due to strong local and<br />
export demand, in particular from Kenya, South Sudan, DRC and<br />
Rwanda. Compared to the same month last year, January maize<br />
prices were 27 percent higher in Kampala.<br />
Overall food security improves, although<br />
serious concerns in some areas<br />
Since the start of seasonal harvests last October, food security<br />
conditions in the subregion have significantly improved as<br />
new crops have replenished household stocks and supplied<br />
local markets thus improving food availability. Livestock body<br />
conditions have also improved in most pastoral areas of southern<br />
Somalia, the Sudan, South Sudan, Uganda, central and southern<br />
United Republic of Tanzania due to abundant seasonal rains that<br />
improved pasture conditions and water availability. Currently, in<br />
Figure 4. Maize prices in selected Eastern African<br />
markets<br />
USD/tonne<br />
600<br />
500<br />
400<br />
300<br />
200<br />
100<br />
J<br />
F M A<br />
Ethiopia<br />
Addis Ababa<br />
Kenya<br />
Nairobi<br />
Tanzania U.R.<br />
Dar-es-Salaam<br />
Uganda<br />
Kampala<br />
M J J A S O N D J F M A M J J A S O N D J<br />
2011 2012 2013<br />
Sources: Regional Agricultural Trade Intelligence Network;<br />
Ethiopian Grain Trade Enterprise.<br />
the subregion, the total number<br />
of food insecure people in need<br />
of humanitarian assistance is<br />
estimated at about 11.4 million<br />
people (including 3.7 million<br />
in Ethiopia, 3.5 million in the<br />
Sudan, 2.1 million in Kenya,<br />
1.05 million in Somalia,<br />
1 million in South Sudan and<br />
70 000 in Djibouti), about<br />
1 million less than the previous<br />
FAO estimate in December<br />
2012 and 6.6 million less than<br />
one year ago. In particular,<br />
during the last six months the number of people in need of<br />
emergency assistance was halved in Somalia due to continued<br />
humanitarian interventions, improved food supply at household<br />
and market levels from the ongoing 2012/13 deyr harvest and<br />
improved milk availability in most pastoral areas.<br />
Despite these improvements, however, severe food insecurity<br />
conditions remain in conflict-affected areas of the Sudan where<br />
massive displacements obstruct agricultural production, market<br />
access and delivery of humanitarian assistance. Similarly, parts of<br />
Jonglei state in South Sudan that were affected by floods and<br />
persistent civil insecurity (mostly inter-communal clashes related<br />
to cattle raiding that usually increase during the dry season).<br />
In Ethiopia, several areas are facing severe food insecurity due<br />
to consecutive poor rainy seasons, including East and West<br />
Hararghe Zones of Oromia, marginal meher cropping areas
of eastern Tigray and Amhara, and the pastoral areas of Afar<br />
in Ethiopia. As of mid-January 2013, according to UNHCR and<br />
OCHA, about 1.1 million refugees are hosted in camps in Kenya,<br />
Ethiopia and South Sudan, mainly from Somalia and the Sudan,<br />
and have precarious access to basic necessities of food, shelter,<br />
water and sanitation.<br />
Southern Africa<br />
Flooding in eastern parts of the subregion in<br />
January causes localized crop damage<br />
Harvesting of the 2012/13 cereal crops is expected to commence<br />
in April. Below normal precipitation was recorded during<br />
much of first three months of the cropping season (October-<br />
December) that necessitated replantings in some southeastern<br />
areas. However, a period of intense rainfall ensued in January<br />
and early February alleviating moisture deficits but also<br />
causing flooding. In the most affected country, Mozambique,<br />
an estimated 166 000 hectares of crops were lost to floods,<br />
mostly in the southern provinces, as well as some in the central<br />
Zambezi Province. Although the area represents a comparatively<br />
small size at the national level, localised production losses will<br />
negatively affect food supplies in 2013. Rains subsided from<br />
mid-February, bringing relief to the flooded areas, although<br />
heavy rains in central provinces of Mozambique have increased<br />
the risk of flooding in these parts. The abundant rains also<br />
caused some flood damage and water-logging in areas of<br />
Botswana, Malawi, Zambia and Zimbabwe, but the negative<br />
impact on crops was limited. In addition, the passing of Cyclone<br />
Felleng inflicted comparatively minor damage in eastern districts<br />
of Madagascar during January. A second Cyclone, Hurana,<br />
in February caused damage in southwestern areas, displacing<br />
population and flooding cropped fields. The potential for further<br />
flooding remains in eastern parts of the subregion until the end<br />
of the cyclone season in April 2013.<br />
In contrast to eastern regions, water deficits have developed<br />
across much of Namibia, negatively impacting on both pasture<br />
Table 12. Southern Africa cereal production<br />
(million tonnes)<br />
2010 2011<br />
<strong>Crop</strong> <strong>Prospects</strong> and <strong>Food</strong> <strong>Situation</strong><br />
Wheat Coarse grains Rice (paddy) Total cereals<br />
2012<br />
estim. 2010 2011<br />
2012<br />
estim. 2010 2011<br />
2012<br />
estim. 2010 2011<br />
2012<br />
estim.<br />
Change:<br />
2012/2011 (%)<br />
Southern Africa 1.7 2.3 2.3 26.4 25.0 24.3 5.2 4.8 4.5 33.3 32.1 31.0 -3.2<br />
- excl. South Africa 0.3 0.3 0.3 12.5 13.5 11.3 5.2 4.8 4.5 17.9 18.6 16.1 -13.2<br />
Madagascar 0.0 0.0 0.0 0.4 0.4 0.4 4.8 4.3 4.0 5.2 4.7 4.4 -7.0<br />
Malawi 0.0 0.0 0.0 3.5 4.0 3.7 0.1 0.1 0.1 3.6 4.1 3.8 -7.1<br />
Mozambique 0.0 0.0 0.0 2.5 2.6 2.0 0.3 0.3 0.3 2.8 2.9 2.4 -18.8<br />
South Africa 1.4 2.0 1.9 13.9 11.5 13.0 0.0 0.0 0.0 15.3 13.5 14.9 10.5<br />
Zambia 0.2 0.2 0.3 2.9 3.1 2.9 0.1 0.0 0.0 3.1 3.4 3.2 -5.0<br />
Zimbabwe 0.0 0.0 0.0 1.6 1.6 1.1 0.0 0.0 0.0 1.6 1.7 1.1 -32.0<br />
Note: Totals and percentage change computed from unrounded data.<br />
conditions and crop development. Furthermore, at the end of<br />
2012, an outbreak of army worms across the subregion caused<br />
some damage to cereal crops, affecting parts of Botswana,<br />
Namibia, Malawi, Mozambique, Zambia and Zimbabwe. Although<br />
the outbreak was widespread, interventions by governments and<br />
partner institutions, including pesticide spraying and distribution<br />
of early maturing seeds to affected households, have contained<br />
further infestations and limited the damage. In Madagascar,<br />
locusts are threatening crop prospects in southern and western<br />
parts. The Government declared a state of emergency in<br />
November 2012, as a result of the infestation, and measures have<br />
been taken to contain the outbreak.<br />
Overall yields expected to increase, except in<br />
areas affected by floods and dry spells<br />
In most countries of the subregion, official estimates of the area<br />
planted for the 2012/13 crop have not yet been released. By contrast,<br />
in South Africa, the main producer in the subregion, early official<br />
estimates point to a 3 percent expansion in maize plantings to about<br />
2.78 million hectares over last season’s level. The increase reflects<br />
farmers’ positive reaction to higher maize prices in 2012. If favourable<br />
weather conditions persist until harvesting, a crop of about 12.4<br />
million tonnes in the commercial sector is tentatively forecast; while<br />
about 600 000 tonnes is expected from the subsistence sector. In the<br />
remaining countries of Southern Africa, despite some losses from<br />
dry spells, floods and army worms, overall, current conditions point<br />
to satisfactory crop development, particularly in the large producing<br />
areas. Assuming continued favourable weather through to end of<br />
the cropping season in March-June, higher yields than the previous<br />
season are anticipated, and an improved output over last season’s<br />
reduced harvest is expected. However, following 2012’s bumper<br />
harvest, cereal production in Namibia is expected to decrease as<br />
a result of the poorly distributed rains in the 2012/13 cropping<br />
season. While the floods in southern and central areas of<br />
Mozambique, as well as in Madagascar, are expected to depress<br />
production in localised areas.<br />
No. 1 n March 2013 17
<strong>Crop</strong> <strong>Prospects</strong> and <strong>Food</strong> <strong>Situation</strong><br />
Lower exports from South Africa while exports<br />
from Zambia increase<br />
Current maize exports from South Africa in the 2012/13<br />
marketing year (May/April) are approximately 40 percent below<br />
the large quantities recorded in the previous year, estimated at<br />
1.28 million tonnes. Tighter domestic supplies contributed to<br />
the decrease, while increasing domestic prices in 2012 lowered<br />
South Africa’s competitiveness in the international market.<br />
Similar to last year, Mexico still remains the biggest importer<br />
of South African maize, with the neighbouring countries of<br />
Botswana, Lesotho, Mozambique, Namibia and Swaziland<br />
also importing significant quantities as in past years. Following<br />
consecutive bumper harvests in Zambia, the country has built-<br />
up significant maize stocks, far above their consumption<br />
requirements. As a result, Zambia has established itself as<br />
the second largest exporter in the subregion, with the main<br />
destination for their maize being Zimbabwe. As the end of the<br />
marketing year draws to a close, maize import requirements<br />
in the subregion (excluding South Africa), estimated at 1.13<br />
million tonnes, similar to 2011/12, are expected to be satisfied<br />
with supplies from both South Africa and Zambia.<br />
Maize prices reach record levels in some<br />
countries<br />
In South Africa, the subregion’s main exporting country, maize<br />
prices fell from their near record highs earlier in mid-2012, for<br />
the second consecutive month in January. The recent declines<br />
primarily reflect the positive outlook for the 2013 maize harvest,<br />
from May onwards, on the back of an increase in the area planted.<br />
The weakening international quotations also weighed on prices.<br />
In Malawi, maize prices climbed sharply in January, continuing<br />
the steep increase since the second half of 2012, reaching new<br />
record highs. At their current levels, prices exceed those of a year<br />
earlier. In northern markets, in particular where strong demand<br />
from deficit southern parts and Tanzania has put pressure on<br />
maize supplies, prices were more than double and in some markets<br />
three times the level of January 2012. The continued depreciation<br />
of the national currency (kwacha), following the devaluation in<br />
May 2012 has maintained high inflation rates and contributed to<br />
the increasing maize prices. Tight localized supplies, as a result of<br />
production deficits in the Southern Region, also underpinned the<br />
higher prices, while heavy rains and localized floods in southern<br />
areas during January disrupted market activities. Similarly,<br />
in Mozambique, heavy rains and localized floods in January<br />
disrupted trade routes, with reduced food supplies in some<br />
markets instigating sharp price rises, particularly in Gaza Province.<br />
Mozambican maize prices are generally higher in 2012/13,<br />
18<br />
No. 1 n March 2013<br />
reflecting tighter supplies following reduced 2012 production.<br />
National average roller maize meal prices in Zambia rose steeply<br />
from November 2012, exceeding historical seasonable trends;<br />
between November and January prices jumped by 25 percent.<br />
In addition to the national procurement programme by the <strong>Food</strong><br />
Reserve Agency (FRA) that has accumulated abundant stocks,<br />
strong demand from neighbouring countries together with<br />
the gradual depreciation of the Zambian kwacha, put upward<br />
pressure on prices. The staple food prices in Zimbabwe (maize)<br />
and Madagascar (rice) have remained comparatively stable,<br />
reflecting generally adequate supplies, despite lower harvests<br />
in 2012. Commercial imports have helped to stabilise supplies<br />
and contain prices at levels that are comparable to the previous<br />
year. However, in areas of Zimbabwe that experienced production<br />
short-falls in 2012 and where Cyclone Felleng disrupted trade<br />
flows in Madagascar, consequent market shortages have led to<br />
some price spikes.<br />
Higher food prices and floods worsen food<br />
security in some areas<br />
In 2012/13, the number of food insecure persons increased<br />
notably in the subregion, following production shocks in some<br />
areas. The sustained and rapid increase in maize prices in several<br />
countries of the subregion since mid-2012 negatively impacted<br />
on food access of vulnerable populations, as households become<br />
Figure 5. White maize prices in selected Southern<br />
African markets<br />
USD/kg<br />
0.4<br />
0.3<br />
0.2<br />
0.1<br />
0.0<br />
Zambia<br />
(national average)<br />
Mozambique<br />
Chokwe<br />
Malawi<br />
Mzuzu<br />
J F M A M J J A S O N D J F M A M J J A S O N D J<br />
2011 2012<br />
2013<br />
Sources: Central Statistical Office, Zambia; Sistema De Informação De Mercados<br />
Agrícolas De Moçambique, Mozambique; Ministry of Agriculture and <strong>Food</strong> Security,<br />
Malawi.
increasingly reliant on market supplies at the height of the lean<br />
season (January-March). The higher food prices in Malawi led<br />
to an upward revision of the number of food insecure people<br />
to just under 2 million from 1.6 million, in November 2012. In<br />
Zambia and Malawi, government parastatals have supplied<br />
subsidised maize to help alleviate market shortages and mitigate<br />
further price increases. Furthermore, in Zambia, a directive<br />
was issued in December 2012 by the government for maize<br />
millers to reduce prices of maize meal to ZMW 50/per 25 kg<br />
or below. Furthermore, the recent flooding in January led to<br />
the displacement of approximately 300 000 person across the<br />
subregion, as well as impeding crop development and disrupting<br />
proper market functions in localised areas. In Mozambique,<br />
where the majority of the displaced population reside, the loss<br />
of crops and food reserves are expected to severely reduce<br />
food availability of the affected population. However, ongoing<br />
humanitarian interventions have contributed to stabilizing food<br />
insecurity conditions, which are expected to improve with the<br />
supplies from the 2013 harvest in April.<br />
Great Lakes Region<br />
Below average production in Rwanda and<br />
Burundi<br />
Harvesting of the minor 2013 A season crops is almost complete<br />
in Burundi and Rwanda, while planting of the 2013 B (main)<br />
season’s crops is already underway. In both countries, the 2013<br />
A season harvest is estimated at below average levels due to<br />
unfavourable rains that were mostly erratic, with water-logging<br />
in some areas and an early end in December coupled with above-<br />
average prevalence of crop diseases (banana bacterial wilt,<br />
cassava viruses and maize caterpillar). In some areas of Rwanda,<br />
the 2013 A season cassava production is also expected at below<br />
average level due to shortage of cuttings at planting time. In<br />
the Democratic Republic of the Congo (DRC), harvesting of<br />
the main 2012 maize crop in southern and central provinces is<br />
ongoing. According to satellite based monitoring, the rainfall<br />
pattern has been favourable in most areas and yields are expected<br />
to be above average.<br />
<strong>Crop</strong> <strong>Prospects</strong> and <strong>Food</strong> <strong>Situation</strong><br />
Prices decline as supplies from new crops<br />
become available<br />
In Rwanda, prices of beans decreased in the capital Kigali by<br />
14 percent between December 2012 and January 2013 as the<br />
ongoing harvests increased supplies. By contrast, prices of maize,<br />
which had not yet been harvested in many areas, were stable<br />
over the same period. In Burundi, prices of beans in the capital<br />
Bujumbura peaked exceptionally at the end of January due to a<br />
fire at the city’s main market that destroyed large quantities of<br />
food stocks. By contrast, prices of maize declined by 6 percent<br />
between December and January and currently are 4 percent<br />
higher than in January 2012. In DRC, prices of maize followed<br />
mixed trends in recent months due to the different stages of local<br />
harvests. If compared to twelve months earlier, current maize<br />
prices are generally 15-20 percent higher, with peaks up to two<br />
times more in southern provinces as a result of the high prices<br />
in neighbouring Zambia, where a high share of maize imports<br />
is observed. In the capital Kinshasa, prices of imported rice and<br />
wheat remained stable in recent months and in January they were<br />
at about the same levels of a year earlier.<br />
Humanitarian situation continues to deteriorate<br />
in DRC<br />
In DRC, the armed conflict escalated at the end of November<br />
2012, increasing displacements in eastern and northeastern areas<br />
of the country. Currently, there are about 2.7 million displaced<br />
people in the country. According to the latest IPC analysis,<br />
the number of people in need of emergency assistance was<br />
estimated at about 6.4 million as of December 2012, with an<br />
increase of about 75 000 people compared to October 2012.<br />
They are mostly concentrated in the eastern provinces - North<br />
and South Kivu, Eastern , East and West Kasai, Katanga, Equateur<br />
and Bandudu. Two-thirds of them or about 4.2 million persons<br />
are considered severely food insecure. In most parts of Burundi<br />
and Rwanda, acute food security conditions are expected to be<br />
minimal. However, as the 2013 A season harvest is below average,<br />
food stocks are expected to be depleted earlier than normal and<br />
by mid-March the lean season may already start in some areas.<br />
No. 1 n March 2013 19
<strong>Crop</strong> <strong>Prospects</strong> and <strong>Food</strong> <strong>Situation</strong><br />
Asia<br />
Far East<br />
Overall favourable harvest<br />
prospects for the 2013 main<br />
wheat and secondary rice crops<br />
In the Far East subregion, the 2012/13 main<br />
winter wheat and secondary rice crops, sown<br />
from October 2012 onwards, are in critical<br />
growth stage in most countries. Weather<br />
conditions since the start of the season<br />
have been generally favourable in most<br />
countries with early rains benefiting planting<br />
and crop development. In China, early<br />
estimates from the National Grain and Oils<br />
Information Centre point to a record 2013<br />
aggregate national wheat output at 121.4<br />
million tonnes. Similarly, wheat production is<br />
officially forecast to reach record level at 24.7<br />
million tonnes in Pakistan, following an estimated increase<br />
in plantings and anticipated higher yields, reflecting relatively<br />
good prospects for irrigation water, provision of fertilizer and<br />
other inputs. In India, the “Second Advance Estimate” from<br />
the Ministry of Agriculture reports the winter wheat Rabi<br />
production at 92.3 million tonnes, almost 3 percent below the<br />
2012 record harvest. The estimated decrease in production<br />
is mainly attributed to scanty post-monsoon rainfall over<br />
important producing states, such as Uttar Pradesh, Punjab<br />
and Haryana in the northwest, Bihar and West Bengal in the<br />
northeast and Karnataka in the south.<br />
Table 13. Far East cereal production<br />
(million tonnes)<br />
20<br />
2010 2011<br />
No. 1 n March 2013<br />
Near East:<br />
• winter grains:<br />
dormant to vegetative<br />
Note: Comments refer to<br />
situation as of March.<br />
Asia (CIS):<br />
• winter grains: growing<br />
South Asia:<br />
• wheat and coarse grains:<br />
vegetative to reproductive<br />
India:<br />
• maize (Rabi): growing<br />
• wheat (Rabi): growing<br />
• barley (Rabi): growing<br />
• sorghum (Rabi): growing<br />
• rice (Rabi): growing<br />
China:<br />
• winter wheat: growing<br />
Southeastern Asia:<br />
• rice (second): growing/harvesting<br />
• maize: (second) growing<br />
Harvesting of the early planted 2012/13 rice and other<br />
crops began in December 2012, with the bulk of harvest to<br />
commence in March-April. <strong>Prospects</strong> for the irrigated secondary<br />
rice harvests in 2013 are good in Bangladesh, Cambodia,<br />
Indonesia, Myanmar, the Philippines, Thailand and Viet<br />
Nam. By contrast, in India a combination of planting delays<br />
and localized damage caused by Cyclone Nilam, particularly<br />
impacting southern producing states including Andhra Pradesh,<br />
are expected to reduce the 2012/13 Rabi paddy crop to 11.1<br />
million tonnes, 12 percent down from the previous year’s dry-<br />
spell reduced output and 20 percent below the previous five-year<br />
Wheat Coarse grains Rice (paddy) Total cereals<br />
2012<br />
estim. 2010 2011<br />
2012<br />
estim. 2010 2011<br />
2012<br />
estim. 2010 2011<br />
2012<br />
estim.<br />
Change:<br />
2012/2011 (%)<br />
Far East 223.0 232.8 244.0 277.9 292.9 310.4 630.3 653.1 659.5 1 131.3 1 178.7 1 213.9 3.0<br />
Bangladesh 1.0 1.0 1.0 1.3 1.7 2.1 50.3 50.7 50.7 52.6 53.4 53.9 0.8<br />
Cambodia 0.0 0.0 0.0 0.8 0.7 0.8 8.2 8.8 9.3 9.0 9.5 10.1 6.4<br />
China 115.2 117.4 120.6 186.6 201.4 217.0 197.2 202.5 205.7 499.0 521.3 543.3 4.2<br />
India 80.8 86.9 94.9 43.4 42.5 41.4 144.0 158.0 152.7 268.1 287.3 289.0 0.6<br />
Indonesia 0.0 0.0 0.0 18.3 17.6 19.0 66.5 65.8 69.0 84.8 83.4 87.9 5.4<br />
Japan 0.6 0.7 0.9 0.2 0.2 0.2 10.6 10.5 10.6 11.4 11.4 11.7 2.2<br />
Korea Rep. of 0.0 0.0 0.0 0.2 0.2 0.2 5.8 5.6 5.4 6.1 5.9 5.6 -4.0<br />
Myanmar 0.2 0.2 0.2 1.4 1.5 1.7 30.8 30.0 30.0 32.4 31.7 31.9 0.6<br />
Nepal 1.6 1.8 1.9 2.4 2.5 2.3 4.5 5.1 4.5 8.4 9.3 8.7 -7.0<br />
Pakistan 23.3 24.3 24.0 3.9 4.1 4.1 7.2 9.2 9.4 34.4 37.7 37.6 -0.2<br />
Philippines 0.0 0.0 0.0 6.4 7.0 7.4 16.7 17.0 18.0 23.1 24.0 25.5 6.2<br />
Thailand 0.0 0.0 0.0 5.0 4.9 5.0 36.0 35.3 37.8 41.0 40.3 42.8 6.3<br />
Viet Nam 0.0 0.0 0.0 4.6 4.8 4.8 40.0 42.3 43.7 44.6 47.2 48.5 2.8<br />
Note: Totals and percentage change computed from unrounded data.
Table 14. Far East cereal production and anticipated trade in 2012/13 1<br />
(thousand tonnes)<br />
Avg 5-yrs<br />
(2007/08 to<br />
2011/12) 2011/12 2012/13<br />
average. In Sri Lanka, floods during November-December in the<br />
North Western, Northern, Eastern and Uva provinces are forecast<br />
to reduce the main season (Maha) paddy crop to 2.6-2.8 million<br />
tonnes, compared to the 3 million tonnes harvested in 2012.<br />
The 2012 aggregate regional cereal harvest<br />
estimated at a record level<br />
Harvesting of the 2012 main season cereal crops, mostly paddy<br />
and coarse grains, was completed towards the end of the year<br />
in most countries. With most official estimates now available,<br />
FAO puts the subregion’s 2012 aggregate production of cereals<br />
at a record level of 1 214 million tonnes (rice in paddy terms) or<br />
some 3 percent up from the previous year’s record output, mainly<br />
reflecting larger crops in China (+22 million tonnes) and Indonesia<br />
2012/13 over<br />
2011/12<br />
(%)<br />
2012/13 over<br />
5-yr avg<br />
(%)<br />
Cereals - Exports 33 169 37 185 43 063 15.8 29.8<br />
Cereals - Imports 82 889 95 900 89 112 -7.1 7.5<br />
Cereals - Production 902 494 961 533 994 439 3.4 10.2<br />
Rice-millled - Exports 25 676 29 265 28 575 -2.4 11.3<br />
Rice-millled - Imports 9 206 11 763 10 049 -14.6 9.2<br />
Rice-millled - Production 414 972 435 885 440 005 0.9 6.0<br />
Wheat - Exports 2 646 2 427 9 610 296.0 263.2<br />
Wheat - Imports 31 425 36 679 35 333 -3.7 12.4<br />
Wheat - Production 221 414 232 758 244 027 4.8 10.2<br />
1 Marketing year July/June for most countries. Rice trade figures are for the second year shown.<br />
Figure 6. Rice retail prices in selected Far East<br />
countries<br />
USD/kg<br />
1.0<br />
0.9<br />
0.8<br />
0.7<br />
0.6<br />
0.5<br />
0.4<br />
0.3<br />
0.2<br />
Indonesia,(medium quality)<br />
national average<br />
Philippines, (RMR)<br />
national average<br />
India<br />
Delhi<br />
Viet Nam, (25% broken milled)<br />
Dong Thap<br />
J F M A M J J A S O N D J F M A M J J A S O N D J<br />
2011<br />
2012<br />
2013<br />
Sources: Ministry of Trade, Indonesia; Ministry of Consumer Affairs, India; Bureau of<br />
Agriculture Statistics, Philippines; Agroinfo, Viet Nam.<br />
<strong>Crop</strong> <strong>Prospects</strong> and <strong>Food</strong> <strong>Situation</strong><br />
(+4.5 million tonnes). Similarly, significant<br />
gains in national total cereal production<br />
are recorded in Bangladesh, Cambodia,<br />
Japan, the Philippines, Thailand and<br />
Viet Nam, as a result of larger plantings<br />
and higher yields prompted by strong<br />
prices, subsidized inputs and generally<br />
favourable weather. On the other hand<br />
poor harvests were gathered due to<br />
adverse weather conditions in Nepal and<br />
reduced plantings in Republic of Korea.<br />
In other countries, such as Myanmar and<br />
Pakistan, the total cereal production is<br />
estimated to remain more or less similar to<br />
that of the previous year. In India, record<br />
wheat harvest offset the dry spell affected paddy output and the<br />
total cereal production is estimated to remain close to the record<br />
level of 2011.<br />
Cereal exports expected to reach record<br />
level, while imports to decrease in 2012/13 in<br />
response to successive good harvests<br />
In general, the Far East subregion is a net exporter of rice and<br />
net importer of wheat. Early forecast for the 2012/13 marketing<br />
year indicate an increase in the subregional cereal exports by<br />
5.9 million tonnes or 16 percent from the previous year, while<br />
the aggregate cereal imports to decrease by 6.8 million tonnes or<br />
7 percent below the 2011/12 level. Much of the increase is in the<br />
form of wheat exports, largely on account of bumper harvests in<br />
Figure 7. Wheat and wheat flour retail prices in<br />
selected Far East countries<br />
USD/kg<br />
0.6<br />
0.5<br />
0.4<br />
0.3<br />
0.2<br />
China (wheat flour)<br />
Average of main 50 cities<br />
Bangladesh (wheat flour)<br />
Dhaka<br />
India (wheat)<br />
Delhi<br />
Pakistan (wheat)<br />
Lahore<br />
J F M A M J J A S O N D J F M A M J J A S O N D J<br />
2011<br />
2012 2013<br />
Sources: Pakistan Bureau of Statistics; Ministry of Consumer Affairs, India;<br />
Management Information System and Monitoring, Bangladesh; National Bureau of<br />
Statistics of China.<br />
No. 1 n March 2013 21
<strong>Crop</strong> <strong>Prospects</strong> and <strong>Food</strong> <strong>Situation</strong><br />
2012 and anticipated favourable output in 2013. In India, given<br />
the estimated record wheat harvest and larger carryover stocks,<br />
exports are anticipated to reach all-time high at 7.5 million<br />
tonnes in 2012/13. Similarly, total wheat imports of the subregion<br />
are expected to decline by 1.3 million tonnes, 4 percent from<br />
last year’s level, owing to the favourable 2012 domestic wheat<br />
production in several importing countries such as China and<br />
Japan and lower demand from the Philippines, Sri Lanka and<br />
Thailand. For rice, following good harvests in most countries<br />
combined with weak demand from some importing countries<br />
including China, Indonesia and the Philippines, the volume of<br />
2013 trade (both exports and imports) is forecast to decrease.<br />
Prices of rice follow mixed trends, while those<br />
of wheat up<br />
Rice prices in recent months have generally remained stable<br />
across the subregion, but decreased in some exporting countries,<br />
namely Cambodia, Myanmar and Viet Nam. In Bangladesh,<br />
India, Pakistan, the Philippines and Thailand, rice prices have<br />
remained virtually unchanged in the last several months, mainly<br />
reflecting trends in regional export prices and good supplies from<br />
the recently completed 2012 main season bumper harvests.<br />
However, prices have increased in Sri Lanka and China, as well<br />
as in Indonesia, where the national average price reached a new<br />
record level (in nominal terms) in January, averaging IDR 8 371<br />
(about USD 0.86) per kg, some 4 percent higher than a year<br />
earlier, following market disruptions caused by floods in early<br />
January in the main crop producing areas of Jakarta and Java.<br />
Nominal prices of wheat and wheat flour continued to move<br />
upwards in major wheat producing and consuming countries,<br />
such as Bangladesh, China and Sri Lanka. In Pakistan, prices<br />
of wheat and wheat flour have been steadily increasing since June<br />
2012 reaching record levels in most markets in February 2013<br />
underpinned by higher producer support prices. In India, wheat<br />
prices stabilized in most markets of the country although they<br />
continued to increase in Mumbai and in January, they reached<br />
record levels, 43 percent higher than a year earlier.<br />
Table 15. Near East cereal production<br />
(million tonnes)<br />
22<br />
2010 2011<br />
No. 1 n March 2013<br />
Near East<br />
Favourable outlook for the 2013 winter crops<br />
Wheat and barley crops, for harvest from June, are mostly in their<br />
final stages of dormancy in Turkey, Iraq, Islamic Republic of Iran<br />
and Afghanistan. Climatic conditions in the region were so far<br />
good and assuming normal weather conditions for the remainder<br />
of the season, production prospects are generally favourable.<br />
Dry weather conditions in October assisted planting of wheat<br />
and barley crops. Subsequently, abundant rainfall and snowfall in<br />
December and especially in January when some of the heaviest<br />
snow in the last 20 years occurred in some places, increased soil<br />
moisture and improved irrigation reserves.<br />
The subregion’s cereal production in 2012 is estimated<br />
at 71 million tonnes, slightly lower than last year, but about<br />
3.3 percent higher than the last five-year average. Large<br />
production increases in Afghanistan and the Islamic Republic<br />
of Iran partly offset declines in Iraq and Turkey. In the Syrian<br />
Arab Republic, civil insecurity prevented many farmers from<br />
accessing their farmland during important stages of crop<br />
development and harvest. Lack of fuel to operate irrigation<br />
pumps and other equipment, as well as shortage of harvesters<br />
have compounded the problem and resulted in large unharvested<br />
cropland.<br />
Increased food insecurity due to civil conflict<br />
and high food prices<br />
Civil unrest and conflict in several areas of the subregion have<br />
disrupted agricultural production, trade and humanitarian aid<br />
distribution, thus negatively affecting the food security situation<br />
of large number of people, especially of the most vulnerable.<br />
An increasingly complex humanitarian crisis has been under way<br />
in Yemen with conflict in the north, secessionist movements in<br />
the south and other religious movements in various parts of the<br />
country. Some 45 percent of the population is now estimated to<br />
be food insecure. According to the Joint <strong>Food</strong> Security Rapid Need<br />
Assessment conducted in December 2012 (full report to be released<br />
soon), in the Syrian Arab Republic, the number of people in need<br />
Wheat Coarse grains Rice (paddy) Total cereals<br />
2012<br />
estim. 2010 2011<br />
2012<br />
estim. 2010 2011<br />
2012<br />
estim. 2010 2011<br />
2012<br />
estim.<br />
Change:<br />
2012/2011 (%)<br />
Near East 46.8 46.4 45.0 21.8 21.2 21.4 4.0 4.1 4.3 72.6 71.7 70.7 -1.4<br />
Afghanistan 4.5 3.3 5.0 0.7 0.6 0.7 0.7 0.7 0.7 5.9 4.6 6.4 40.8<br />
Iran (Islamic Rep. of ) 15.0 13.5 13.8 5.2 4.7 5.0 2.3 2.3 2.4 22.5 20.5 21.2 3.4<br />
Iraq 2.7 2.4 2.1 1.4 1.4 1.1 0.2 0.2 0.2 4.3 4.0 3.4 -15.5<br />
Syrian Arab Republic 3.1 3.9 2.5 0.8 0.8 1.0 0.0 0.0 0.0 3.9 4.7 3.5 -25.2<br />
Turkey 19.7 21.8 20.1 12.2 12.5 12.4 0.9 0.9 0.9 32.8 35.2 33.4 -5.2<br />
Note: Totals and percentage change computed from unrounded data.
of urgent food and livelihood<br />
assistance is estimated at about 4<br />
million. As of mid-February 2013,<br />
the total number of registered<br />
refugees from the Syrian Arab<br />
Republic and individuals awaiting<br />
registration in Jordan, Lebanon,<br />
Turkey, Iraq and Egypt was<br />
close to 863 000. Although<br />
WFP continues providing food<br />
assistance to vulnerable Syrian<br />
populations in Jordan, Lebanon,<br />
Iraq, and Turkey, resources in host<br />
communities remain under strain.<br />
CIS in Asia 1<br />
Uncertain prospects for the 2013 winter cereal<br />
crops<br />
Planting of the 2013 winter crops has been completed<br />
satisfactorily. The total area under cereals is slightly above that<br />
of last year mainly reflecting larger plantings in Azerbaijan,<br />
Kyrgyzstan and Tajikistan. Official reports indicate that dormant<br />
winter wheat crops are in satisfactory condition; but more rains<br />
would be needed in coming weeks for further development<br />
of the crops. However, the subregion’s aggregate 2013 cereal<br />
production will depend on the outcome in Kazakhstan, the<br />
main producer, where the bulk of the crop will be sown only in<br />
spring. Assuming normal weather conditions, the potential cereal<br />
production of Kazakhstan is forecast around 20 million tonnes<br />
including 15 million tonnes of wheat.<br />
Significant decline in 2012 cereal production<br />
Table 16. CIS in Asia cereal production<br />
(million tonnes)<br />
2010 2011<br />
The results of the 2012 cereal harvest vary from country to<br />
country, though at subregional level it has dropped significantly<br />
by comparison with the previous years. The 2012 aggregate cereal<br />
output is estimated at 27.8 million tonnes, of which some 22<br />
million tonnes is wheat. This figure is 32 and 16 percent below the<br />
2011 record level and the previous five-year average, respectively.<br />
The decline is mainly attributed to a sharp contraction of<br />
production in Kazakhstan, due to a severe drought experienced<br />
during summer months. As a result, exports of wheat in the<br />
2012/13 marketing year (July/June) are expected to decline, but<br />
the reduction will be partially offset, by large carryover stocks. In<br />
Kyrgyzstan, 2012 wheat production was affected by adverse<br />
weather during the season and latest estimates indicate a decline<br />
of 14 percent in cereal production to 1.3 million tonnes, which<br />
is well below average. By contrast, normal cropping conditions<br />
1Georgia is no longer a member of CIS but its inclusion in this group is maintained for the time<br />
being.<br />
<strong>Crop</strong> <strong>Prospects</strong> and <strong>Food</strong> <strong>Situation</strong><br />
Wheat Coarse grains Total cereals 1<br />
2012<br />
estim. 2010 2011<br />
and government production support measures in Armenia,<br />
Azerbaijan, Georgia and, in particular, Uzbekistan, resulted<br />
in higher cereal productions in 2012. In Tajikistan and<br />
Turkmenistan, 2012 cereal outputs were virtually unchanged<br />
from the previous year and close to the last five-year average.<br />
Prices of wheat flour remain firm at near record<br />
levels<br />
In most wheat import dependent countries of the subregion,<br />
prices of wheat flour have increased for the last three months<br />
and remain at near record levels mirroring price patterns in the<br />
export markets of the subregion. In Kyrgyzstan prices of wheat<br />
flour remained at high levels in January, reflecting the country’s<br />
reduced wheat production and trends in the neighbouring<br />
Figure 8. Retail wheat flour prices in selected<br />
CIS in Asia countries<br />
USD/kg<br />
1.2<br />
1.1<br />
1.0<br />
0.9<br />
0.8<br />
0.7<br />
0.6<br />
0.5<br />
0.4<br />
0.3<br />
0.2<br />
J<br />
F M A<br />
2012<br />
estim. 2010 2011<br />
Armenia (national average)<br />
Azerbaijan (national average)<br />
Georgia (national average)<br />
2012<br />
estim.<br />
Change:<br />
2012/2011 (%)<br />
CIS in Asia 21.1 33.9 21.9 4.3 6.2 5.1 26.2 41.0 27.8 -32.1<br />
Armenia 0.2 0.2 0.2 0.1 0.2 0.2 0.3 0.4 0.4 3.8<br />
Azerbaijan 1.3 1.6 2.0 0.6 0.8 0.8 1.9 2.4 2.8 13.9<br />
Georgia 0.0 0.1 0.1 0.2 0.4 0.4 0.3 0.5 0.5 2.0<br />
Kazakhstan 9.9 22.7 10.3 2.0 3.5 2.2 12.3 26.6 12.9 -51.3<br />
Kyrgyzstan 0.8 0.9 0.6 0.7 0.7 0.7 1.5 1.6 1.3 -14.3<br />
Tajikistan 0.8 0.7 0.8 0.2 0.2 0.2 1.2 1.0 1.1 5.0<br />
Turkmenistan 1.3 1.3 1.2 0.1 0.1 0.1 1.5 1.5 1.4 -6.4<br />
Uzbekistan 6.7 6.3 6.7 0.3 0.4 0.4 7.2 7.0 7.3 5.6<br />
Note: Totals and percentage change computed from unrounded data.<br />
1 Total cereals includes wheat, coarse grains and rice (paddy).<br />
Kyrgyzstan (national average)<br />
Tajikistan (national average)<br />
M J J A S O N D J F M A M J J A S O N D J<br />
2011 2012<br />
2013<br />
Sources: National Statistical Service of Republic of Armenia; National Statistical Committee of the Kyrgyz<br />
Republic; State Committee on Statistics, Republic of Tajikistan; State Statistical Committee of the Republic of<br />
Azerbaijan; National Statistics Office of Georgia.<br />
No. 1 n March 2013 23
<strong>Crop</strong> <strong>Prospects</strong> and <strong>Food</strong> <strong>Situation</strong><br />
export markets. However, imports of wheat and wheat flour<br />
on concessional basis from Russia in late 2012 contributed to<br />
limiting upward price pressure and led to marginal declines in<br />
some markets. These imports are expected to continue during<br />
early-2013. In Tajikistan, a country which generally imports about<br />
half of its wheat consumption needs, prices of wheat flour remained<br />
stable or showed some declines at the end of 2012 reflecting large<br />
imports from Kazakhstan, the country’s main supplier.<br />
In Georgia, wheat flour prices remained virtually unchanged<br />
at record levels in January, after rising steeply in the last three<br />
Latin America and the Caribbean<br />
Central America and the Caribbean<br />
Lower plantings for the 2012/13 secondary<br />
maize season in Mexico<br />
In Mexico, the main producer of the subregion, planting of the<br />
2012/13 autumn-winter season maize crop, which represents<br />
about 30 percent of the aggregate annual production, is virtually<br />
complete. Early estimates indicate that the area planted is<br />
7 percent down from last year’s level and below the average of<br />
the past five years, mainly due to low water supplies in irrigation<br />
reservoirs. Early forecast put production at 4.8 million tonnes,<br />
13 percent lower than the relatively good level of the same<br />
season in 2012. Frosts in mid-January negatively affected crops in<br />
the main growing areas of Sinaloa, with a preliminary assessment<br />
indicating a loss of about 20 percent of the total area planted to<br />
maize. Sowing of the 2013 irrigated autumn-winter wheat crop,<br />
which accounts for 90 percent of the annual cereal production,<br />
is complete and the area planted is estimated to have recovered<br />
from last year’s reduced level. This season’s wheat output is<br />
preliminarily forecast to increase by 15 percent compared to last<br />
year’s corresponding season and close to the average of the past<br />
five years.<br />
Mixed start of the 2013 first season in the<br />
Caribbean<br />
In Haiti, sowing of the 2013 spring season cereal crops, mainly<br />
maize, which normally starts in February/March was delayed in<br />
the main valleys due to below average rains during January and<br />
first half of February. By contrast, in the Dominican Republic,<br />
favourable rains in the past months in key central growing areas<br />
benefited planting activities of the 2013 main season paddy<br />
crops, currently underway.<br />
Higher cereal production in 2012<br />
Harvesting of the 2012/13 second season maize crops is<br />
virtually complete in Nicaragua, Guatemala, Honduras and<br />
24<br />
No. 1 n March 2013<br />
months of 2012. Prices were supported by high quotations in<br />
neighbouring export markets, as the country imports some<br />
90 percent of wheat to satisfy its consumption needs.<br />
In Azerbaijan, despite normally importing about 40 percent<br />
of its wheat consumption requirements, price increases have<br />
been moderate compared to other countries of the subregion.<br />
This is due to the good 2012 domestic wheat output, high<br />
levels of state reserves and the Government’s decision in<br />
September to exempt imported wheat and wheat flour from<br />
value added tax.<br />
Mexico<br />
• coarse grains (winter crop): planting<br />
• wheat (winter crop): vegetative<br />
Note: Comments refer to<br />
situation as of March.<br />
Argentina<br />
• coarse grains: vegetative<br />
• paddy: vegetative<br />
Brazil<br />
• maize (main, north-east): planting<br />
maize (main, centre-south): vegetative<br />
• paddy (north & north-east): planting<br />
paddy (centre & south): harvesting<br />
Uruguay<br />
• coarse grains: vegetative<br />
• paddy: vegetative<br />
El Salvador, and outputs are estimated to be generally good,<br />
while harvesting of the third season (de apante) crops is about<br />
to start. The 2012 aggregate cereal production (including a<br />
forecast for the 2012/13 third season harvests) of the subregion<br />
is estimated by FAO at 41.5 million tonnes, some 15 percent<br />
above last year’s reduced level and above the average of the<br />
past five years. This mainly reflects a recovery in 2012 coarse<br />
grains production in Mexico, where the harvest of the main<br />
spring-summer season is nearly complete, coupled with a<br />
good cereal output anticipated elsewhere. However, in the<br />
Caribbean, in Haiti the 2012 cereal production was sharply<br />
reduced by adverse weather conditions throughout the 2012/13<br />
agricultural season.
Prices of white maize generally up in January<br />
Prices of the main staple, white maize, rose seasonally in most<br />
countries of the subregion in January, after declining substantially<br />
in the last months of 2012 with the good harvests. However,<br />
despite the recent increases, prices remained at relatively low<br />
levels. The sharpest increase in maize prices was recorded<br />
in Guatemala; however, prices there were lower than in<br />
January 2012. By contrast, in Nicaragua and Honduras prices<br />
were higher than their low levels of a year earlier, despite less<br />
pronounced increases in January. In El Salvador, maize prices in<br />
January continued to decline and were well below their levels a<br />
year earlier. This reflects steady import flows from neighbouring<br />
countries, Honduras and Nicaragua. In Mexico, prices of white<br />
Figure 9. Wholesale white maize prices in<br />
selected countries in Central America<br />
USD/tonne<br />
750<br />
700<br />
650<br />
600<br />
550<br />
500<br />
450<br />
400<br />
350<br />
300<br />
250<br />
Table 17. Latin America and Caribbean cereal production<br />
(million tonnes)<br />
2010 2011<br />
Honduras<br />
Tegucigalpa<br />
Guatemala<br />
Guatemala City<br />
Nicaragua<br />
Managua<br />
El Salvador<br />
San Salvador<br />
J F M A M J J A S O N D J F M A M J J A S O N D J<br />
2011<br />
2012 2013<br />
Sources: Secretaria de Agricultura y Ganaderia, Honduras; Ministerio de Agricultura,<br />
Ganadería y Alimentación, Guatemala; Ministerio agropecuario y forestal, Nicaragua,<br />
Dirección General de Economía Agropecuaria, El Salvador.<br />
<strong>Crop</strong> <strong>Prospects</strong> and <strong>Food</strong> <strong>Situation</strong><br />
Wheat Coarse grains Rice (paddy) Total cereals<br />
2012<br />
estim. 2010 2011<br />
2012<br />
estim. 2010 2011<br />
2012<br />
estim. 2010 2011<br />
2012<br />
estim.<br />
Change:<br />
2012/2011 (%)<br />
Central America &<br />
Caribbean 3.7 3.6 3.3 35.8 29.6 35.4 2.8 2.8 2.8 42.3 36.1 41.5 15.1<br />
El Salvador 0.0 0.0 0.0 0.9 0.9 1.1 0.0 0.0 0.0 0.9 0.9 1.1 19.6<br />
Guatemala 0.0 0.0 0.0 1.7 1.7 1.7 0.0 0.0 0.0 1.7 1.7 1.8 1.1<br />
Honduras 0.0 0.0 0.0 0.5 0.6 0.6 0.0 0.0 0.1 0.6 0.7 0.7 -2.5<br />
Mexico 3.7 3.6 3.3 31.1 24.7 30.6 0.2 0.2 0.2 35.0 28.5 34.1 19.6<br />
Nicaragua 0.0 0.0 0.0 0.6 0.7 0.6 0.4 0.4 0.4 1.0 1.1 1.1 -0.1<br />
South America 26.7 24.7 19.0 102.8 106.4 120.6 23.4 26.4 24.5 153.0 157.5 164.2 4.2<br />
Argentina 15.9 14.1 10.1 30.0 32.8 30.2 1.2 1.7 1.6 47.2 48.6 41.9 -13.8<br />
Brazil 6.0 5.7 4.4 58.3 59.0 74.3 11.7 13.6 11.6 76.0 78.3 90.3 15.3<br />
Note: Totals and percentage change computed from unrounded data.<br />
maize declined for the third consecutive month in January with<br />
progress of the 2012 main season harvest and were below their<br />
high levels at the same time last year. Prices of staple beans<br />
dropped in most countries of the subregion in January with<br />
the harvest of the second season, the most important for bean<br />
production, and were generally below their levels of January<br />
2012. In Haiti, prices of imported rice were virtually unchanged<br />
in January mirroring recent trends in rice export prices from<br />
the United States, the country’s main supplier. However, prices<br />
remained at high levels. Prices of domestically produced maize<br />
showed mixed trends in January, but were also generally high as<br />
a result of reduced 2012 harvests. In the Dominican Republic,<br />
prices of the domestically produced staple, rice, increased in<br />
December following seasonal trends ahead of the arrival of the<br />
new 2012 second season harvest.<br />
South America<br />
Favourable prospects for 2013 maize crops<br />
In the main producing countries of South America, prospects<br />
for the 2013 maize crops are generally favourable. In Brazil,<br />
harvesting of the 2013 first season is about to start, and official<br />
forecasts point to an output of 36 million tonnes, 9 percent higher<br />
than in the same season last year. This reflects a 7 percent increase<br />
in the area harvested and a slight recovery in yields from last year’s<br />
drought reduced level. Sowing of the 2013 second season maize<br />
crops is ongoing under generally favourable weather conditions.<br />
The area planted is anticipated to be larger than last year’s high<br />
level. Assuming good growing conditions in the coming months,<br />
the 2013 aggregate maize production is preliminarily forecast at a<br />
record high of 74 million tonnes. In Argentina, official estimates<br />
indicate that the area planted to maize is about 4.6 million hectares,<br />
some 8 percent lower than the record high of 2012. Severe<br />
dry and warm weather from early January to the first dekad of<br />
February, following abundant precipitation in December, is raising<br />
No. 1 n March 2013 25
<strong>Crop</strong> <strong>Prospects</strong> and <strong>Food</strong> <strong>Situation</strong><br />
concerns on yield potential of the late planted crops. More rains<br />
are urgently needed. However, assuming higher yields compared<br />
to last year’s drought reduced level, the 2013 maize production is<br />
tentatively forecast by FAO at a record high of 25.5 million tonnes.<br />
In Paraguay, planting of the 2013 main season maize crop is<br />
currently underway with some concerns about below average<br />
precipitation since mid-January that delayed field operations. By<br />
contrast, in Bolivia, favourable rains in the past few months have<br />
benefited planting and early development of the 2013 maize<br />
crops, to be harvested from April.<br />
Planting of the 2013 rice crops is complete or underway in most<br />
countries of the subregion and early estimates point to limited or<br />
no changes in the area planted compared to the reduced levels<br />
of last year, mainly on account of high production costs. In Brazil,<br />
the main producer of the subregion, early production forecasts<br />
point to an output of about 12 million tonnes, 5 percent higher<br />
than in 2011, mainly due to better yields.<br />
Larger cereal production in 2012<br />
The 2012 cereal production in the subregion is estimated at a<br />
record level of 164 million tonnes, 4 percent above the 2011 level.<br />
The increase was mainly driven by the record maize production<br />
in Brazil which more than offset general decline in wheat and<br />
paddy outputs.<br />
Prices of wheat flour increased in January and<br />
remain high<br />
In several wheat importing countries of the subregion, prices<br />
of wheat flour rose in January exceeding their levels of a<br />
year earlier. Domestic prices were supported by increasing<br />
wheat export quotations in Argentina, a main exporter in the<br />
subregion, where prices have strengthened in recent months –<br />
unlike the US benchmark prices. Maize prices followed mixed<br />
trends in January, while those of rice declined but remained at<br />
relatively high levels. In Brazil, prices of wheat flour recorded<br />
the sharpest increase in January underpinned by a reduced<br />
domestic output in 2012 and higher import prices. In an<br />
attempt to ease upward pressure on prices of wheat and wheat<br />
products, the Government announced in early February the<br />
exemption from the 10 percent import tariff of 1 million tonnes<br />
26<br />
No. 1 n March 2013<br />
Figure 10. Wholesale wheat flower prices in<br />
selected countries in South America<br />
USD/tonne<br />
1000<br />
900<br />
800<br />
700<br />
600<br />
500<br />
400<br />
J<br />
F M A<br />
M J J A S O N D J F M A M J J A S O N D J<br />
2011 2012<br />
2013<br />
Sources: Servicio Informativo de Mercados Agropecuarios, Bolivia; Instituto de Economía<br />
Agrícola, Brazil; Instituto Nacional de Estadística e Informática, Peru; Sistema de<br />
Información Nacional de Agricultura, Ganadería, Acuacultura y Pesca - SINAGAP, Ecuador.<br />
of wheat imports from outside the Mercosur area between April<br />
and July. This exemption may be extended to an additional 1<br />
million tonnes. In Bolivia, which imports about 70 percent of<br />
its wheat consumption requirements, mainly from Argentina,<br />
prices of wheat flour increased in January and were at record or<br />
near record levels. In Ecuador, prices were also at near record<br />
levels despite some easing in January. Prices of yellow maize,<br />
used as feed, showed mixed trends in January. In Brazil, prices<br />
declined slightly from the record highs reached in December (in<br />
local currency) after sharp increases in the second half of 2012.<br />
Prices also declined in Bolivia but were at low levels as a result<br />
of adequate domestic availability. By contrast, in Ecuador prices<br />
continued their steady rise in the past month on account of<br />
strong domestic demand from the feed industry, and reached<br />
new record levels. Prices of domestically produced rice showed<br />
declines in most countries of the subregion although remaining<br />
generally at high levels. In Brazil, where prices had reached<br />
record highs in late 2012, they declined in January following the<br />
government release of paddy from state reserves.<br />
Bolivia, Santa Cruz<br />
Brazil, São Paulo<br />
Peru, national average<br />
Ecuador, Quito
North America, Europe and Oceania<br />
North America<br />
Winter wheat area slightly up in the United<br />
States and good rains bring relief from drought<br />
The area sown to winter wheat in the United States, which<br />
normally accounts for about 70 percent of the total wheat<br />
plantings nationally, is officially estimated at about 17 million<br />
hectares, 1 percent up from the previous year’s level and the<br />
largest area since 2009 (17.5 million hectares). Farmers were<br />
encouraged to increase winter wheat plantings further, for the<br />
fourth year in succession, by the continuing high price prospects.<br />
Early indications also point to a larger area of spring wheat, but<br />
the extent of the increase will depend largely on the outlook for<br />
competing crops this spring. Regarding the winter crop, this year’s<br />
abandonment rate and yield prospects remain very uncertain.<br />
<strong>Crop</strong>s in the southern Plains suffered from severe dryness virtually<br />
from planting until late January but significant precipitation from<br />
winter storms in February has improved the outlook. However,<br />
given the extent of the previous dryness and the resulting poor<br />
condition of crops, it is likely that in the affected areas, the rate<br />
of abandonment will be above average and yield potential will<br />
not fully recover. Thus, at this early stage, bearing in mind the<br />
above but assuming a slight increase in spring plantings, the<br />
country’s aggregate wheat output in 2013 is tentatively forecast<br />
at 58 million tonnes. Plantings of the 2013 maize crop starts<br />
in the southern states this month. Early indications point to an<br />
increase in area compared to last year, driven by tight stocks<br />
and strong maize price prospects. However, the final outcome<br />
will depend crucially on the amount of spring precipitation in<br />
drought-affected areas in the northern Great Plains and the Corn<br />
Belt and on the expected level of returns for maize relative to<br />
competing crops such as spring wheat come planting time.<br />
Note: Comments refer to<br />
situation as of March.<br />
Canada<br />
• winter grains: dormant to<br />
vegetative<br />
United States<br />
• winter grains: vegetative<br />
Centre-Southern Europe<br />
• winter grains: vegetative<br />
• summer grains: planting<br />
<strong>Crop</strong> <strong>Prospects</strong> and <strong>Food</strong> <strong>Situation</strong><br />
In Canada, the bulk of the wheat is spring planted during<br />
March and April. Farmers are expected to be encouraged again<br />
this year by good price prospects, which would result in more<br />
land being shifted into wheat production from alternative crops<br />
such as oilseeds. At this early stage, the overall 2013 wheat area<br />
is forecast to increase by 10 percent, which assuming normal<br />
weather throughout the growing season, should result in a crop<br />
of about 28 million tonnes.<br />
Europe<br />
European Union<br />
Wheat area up and growing conditions mostly<br />
favourable<br />
In the EU, early estimations of winter wheat planting point to<br />
an increase of about 2.8 percent in the overall 2013 wheat<br />
area. Most of the increase is expected to be accounted for by<br />
France, Germany, Italy, Poland and Spain. Plantings in the United<br />
Kingdom were limited by excessively wet conditions. Overall, the<br />
condition of the winter crops is reported to be generally good.<br />
Winter weather conditions have posed little threat to dormant<br />
crops from winterkill and widespread precipitation has assured<br />
abundant moisture reserves for spring growth. Based on the<br />
current area estimate and assuming yields around the recent<br />
average, the EU’s total wheat output in 2013 is tentatively<br />
forecast at 138 million tonnes.<br />
CIS in Europe<br />
Early prospects for the 2013 winter cereal crops<br />
favourable<br />
In the Russian Federation and Ukraine, the two main exporters<br />
of the subregion, winter cereal crops are reported to be generally<br />
in satisfactory condition, after good rains in autumn provided<br />
adequate soil moisture, and sufficient snow coverage in winter<br />
Northern Europe<br />
• winter grains: dormant to vegetative<br />
CIS in Europe<br />
• winter grains: dormant to vegetative<br />
Australia<br />
• summer grains: filling<br />
No. 1 n March 2013 27
<strong>Crop</strong> <strong>Prospects</strong> and <strong>Food</strong> <strong>Situation</strong><br />
Table 18. North America, Europe and Oceania cereal production<br />
(million tonnes)<br />
protected crops from cold temperatures. In the Russian Federation,<br />
official estimates indicated winter cereal plantings of 15.7 million<br />
hectares, 0.5 million hectares less than in 2012, while plans for<br />
spring plantings put the area at 30.2 million hectares. Tentative<br />
forecasts point to a cereal production of 86-87 million tonnes,<br />
around the last five-year average. Early forecast for 2013 wheat<br />
production is around 53 million tonnes. In Ukraine, according to<br />
official information, winter grains for 2013 harvest were planted<br />
on 8.1 million hectares, which is close to the previous year results.<br />
It includes some 6.7 million hectares of winter wheat and 1.1<br />
million hectares of winter barley. Taking into account the current<br />
conditions of winter crops in the country as well as further<br />
favourable spring cropping season, early forecast of Ukrainian’s<br />
2013 cereal production points to about 46 million tonnes<br />
including 19.5 million tonnes of wheat. In Moldova, where the<br />
planting area for winter crops increased by 8 percent, as well as<br />
in Belarus, crops are also reported in generally good conditions.<br />
Sharp reduction in 2012 cereal output<br />
In the European CIS countries, the 2012 cereal outputs were<br />
reduced due to severe drought and extremely hot temperatures<br />
during the summer months. In aggregate, the subregion’s output<br />
is estimated at 126 million tonnes, 20 percent below last year’s<br />
level and 11 percent lower than the five-year average. In the<br />
Russian Federation, the 2012 cereal output is put at 69.7<br />
million tonnes or 24 percent down on 2011. Production of wheat,<br />
28<br />
2010 2011<br />
No. 1 n March 2013<br />
Wheat Coarse grains Rice (paddy) Total cereals<br />
2012<br />
estim. 2010 2011<br />
2012<br />
estim. 2010 2011<br />
2012<br />
estim. 2010 2011<br />
the most affected crop, is estimated 32 percent lower than the<br />
previous year. The Government has confirmed that in spite of<br />
the poor harvest there is no intention to introduce restrictions on<br />
grain exports. The total cereal exportable surplus of the country is<br />
foreseen to drop from some 28 million tonnes in marketing year<br />
2011/12 (July/June) to about 16 million tonnes in 2012/13. In<br />
Ukraine, cereal production is estimated at 18 percent below last<br />
year’s level, although it still remains close to the five-year average.<br />
However, due to ample carryover stocks, it is expected that cereal<br />
exports which will be around 22.5 million tonnes, slightly above<br />
the previous year’s volume. In the Republic of Moldova cold<br />
winter and severe drought conditions in summer resulted in a<br />
poor cereal production in 2012 and import requirements are<br />
expected to increase sharply. The country has been exporting<br />
maize in recent years but official statements indicate a suspension<br />
of exports in marketing year 2012/13 (July/June). By contrast, a<br />
bumper cereal harvest was gathered in Belarus, mainly reflecting<br />
a record coarse grains production.<br />
Wheat flour prices increasing<br />
2012<br />
estim.<br />
Change:<br />
2012/2011 (%)<br />
North America 83.4 79.7 89.0 353.3 347.0 310.7 11.0 8.4 9.0 447.7 435.1 408.7 -6.1<br />
Canada 23.3 25.3 27.2 22.7 23.0 24.4 0.0 0.0 0.0 46.0 48.2 51.6 6.9<br />
United States 60.1 54.4 61.8 330.6 324.0 286.3 11.0 8.4 9.0 401.7 386.9 357.1 -7.7<br />
Europe 200.9 223.6 192.7 203.3 236.1 218.9 4.4 4.4 4.3 408.6 464.1 415.9 -10.4<br />
Belarus 1.7 2.1 2.0 4.9 5.7 6.7 0.0 0.0 0.0 6.6 7.7 8.7 12.4<br />
EU 136.1 137.6 132.0 143.2 149.0 141.4 3.1 3.2 3.1 282.5 289.8 276.4 -4.6<br />
Russian Federation 41.5 56.2 38.0 19.9 34.2 30.6 1.1 1.1 1.1 62.4 91.5 69.7 -23.8<br />
Serbia 1.7 2.1 1.9 7.6 7.0 4.5 0.0 0.0 0.0 9.2 9.0 6.4 -29.6<br />
Ukraine 16.8 22.3 15.8 21.0 33.4 29.9 0.2 0.2 0.2 38.0 55.9 45.9 -17.9<br />
Oceania 27.7 30.2 22.4 11.9 13.1 11.8 0.2 0.7 1.0 39.9 44.1 35.2 -20.3<br />
Australia 27.4 29.9 22.1 11.4 12.6 11.3 0.2 0.7 0.9 39.0 43.2 34.3 -20.7<br />
Note: Totals and percentage change computed from unrounded data.<br />
Wheat export prices in the Russian Federation and Ukraine in<br />
January were 40 to 70 percent above their levels a year earlier,<br />
after the sharply reduced 2012 wheat outputs. In these countries,<br />
domestic prices of wheat strengthened further in January<br />
continuing the sustained upward trend started in mid-2012 and<br />
they were by 90 and 35 percent higher in Russia and Ukraine,
Figure 11. Retail wheat and wheat flour prices in<br />
Belarus, Russian Federation and Republic of Moldova<br />
USD/kg<br />
0.9<br />
0.8<br />
0.7<br />
0.6<br />
0.5<br />
0.4<br />
0.3<br />
0.2<br />
0.1<br />
J<br />
F M A<br />
Belarus (wheat flour, national average)<br />
Rep. of Moldova (wheat, Chisinau)<br />
Russian Federation (wheat flour, national average)<br />
M J J A S O N D J F M A M J J A S O N D J<br />
2011 2012<br />
2013<br />
Sources: National Statistical Committee of the Republic of Belarus; ACSA, Rep. of<br />
Moldova; Ministry of Agriculture of the Russian Federation.<br />
respectively. In the Russian Federation, where state reserves have<br />
been released in the previous months to limit domestic price<br />
increases, the Government is now considering the possibility<br />
to eliminate the current 5 percent duty on wheat imports. In<br />
January, in Belarus the retail prices on wheat flour and bread<br />
were 45 and 69 percent higher respectively than a year earlier<br />
reflecting liberalization of the country’s domestic price policy as<br />
well as international price trend. By contrast, due to state price<br />
regulation and interventions, wheat flour retail prices in Moldova<br />
have increased only slightly from a year earlier (by 7 percent in<br />
Chisinau and by 9 percent in Causeni).<br />
Oceania<br />
Australia 2012 winter grain crop sharply down<br />
from past two bumper years<br />
The recently completed 2012 wheat harvest in Australia, which<br />
accounts for the bulk of the annual grain production, is officially<br />
estimated at 22 million tonnes, about 26 percent down from<br />
the bumper 2011 crop, while barley production is estimated to<br />
have fallen by 15 percent to 7.1 million tonnes. Severe drought in<br />
Western Australia and some eastern and southeastern growing<br />
regions impacted negatively on yields. The outlook for the 2013<br />
summer cereals (mainly sorghum and maize) has deteriorated<br />
<strong>Crop</strong> <strong>Prospects</strong> and <strong>Food</strong> <strong>Situation</strong><br />
with the heat-wave conditions in January and generally belowaverage<br />
rainfall across the major summer cropping regions.<br />
Sorghum production is forecast to decrease by 23 percent to<br />
1.7 million tonnes. Early indications for the 2013 wheat crop,<br />
which will be planted from April to June, are uncertain: given the<br />
reduction in 2012 production and strong price prospects, farmers<br />
are expected to respond by increasing plantings. However,<br />
with the summer heat wave reducing soil moisture reserves in<br />
some major producing areas, much will depend on the level of<br />
precipitation before and during the planting period.<br />
No. 1 n March 2013 29
<strong>Crop</strong> <strong>Prospects</strong> and <strong>Food</strong> <strong>Situation</strong><br />
Statistical appendix<br />
Table. A1 - Global cereal supply and demand indicators ............................................................................................ .31<br />
Table. A2 - World cereal stocks.................................................................................................................................. .32<br />
Table. A3 - Selected international prices of wheat and coarse grains .......................................................................... .33<br />
Table. A4 - Estimated cereal import requirements of Low-Income <strong>Food</strong>-Deficit Countries 2011/12 or 2012 ............... .34<br />
30<br />
No. 1 n March 2013
Table A1. Global cereal supply and demand indicators<br />
1. Ratio of world stocks to utilization (%)<br />
<strong>Crop</strong> <strong>Prospects</strong> and <strong>Food</strong> <strong>Situation</strong><br />
Average<br />
2005/06 -<br />
2009/10 2008/09 2009/10 2010/11 2011/12 2012/13<br />
Wheat 25.2 24.1 28.2 25.8 26.0 23.4<br />
Coarse grains 16.4 17.6 16.7 14.5 15.0 13.4<br />
Rice 26.8 29.2 29.7 30.8 33.5 35.8<br />
Total cereals 21.1 21.8 22.7 21.2 22.0 20.7<br />
2. Ratio of major grain exporters' supplies<br />
to normal market requirements (%) 125.1 129.2 124.2 115.5 117.5 107.8<br />
3. Ratio of major exporters' stocks<br />
to their total disappearance (%)<br />
Wheat 17.3 17.9 21.6 20.1 17.8 13.7<br />
Coarse grains 14.4 15.6 15.1 10.3 10.2 7.7<br />
Rice 17.9 23.5 21.6 21.2 25.6 27.9<br />
Total cereals 16.5 19.0 19.5 17.2 17.9 16.4<br />
Annual trend<br />
growth rate Change from previous year<br />
2002-2011 2008 2009 2010 2011 2012<br />
4. Changes in world cereal production (%) 2.8 7.2 -1.1 -0.3 4.1 -1.9<br />
5. Changes in cereal production in the LIFDCs (%) 3.6 4.0 -0.5 7.3 1.6 3.1<br />
6. Changes in cereal production in the LIFDCs<br />
less India (%) 3.6 5.8 4.2 6.7 -2.1 4.4<br />
Average Change from previous year (%)<br />
2006-2010 2009 2010 2011 2012 2013*<br />
7. Selected cereal price indices:<br />
Wheat 171.5 -34.6 9.6 31.5 -5.5 13.6<br />
Maize 162.5 -25.5 12.0 57.6 2.2 9.4<br />
Rice 215.0 -14.0 -9.4 9.5 -5.2 2.5<br />
Notes:<br />
Utilization is defined as the sum of food use, feed and other uses.<br />
Cereals refer to wheat, coarse grains and rice; grains refer to wheat and coarse grains.<br />
Major Wheat Exporters are Argentina, Australia, Canada, the EU, Kazakhstan, Russian Fed., Ukraine and the United States; Major Coarse Grain Exporters are Argentina,<br />
Australia, Brazil, Canada, the EU, Russian Fed., Ukraine and the United States; Major Rice Exporters are India, Pakistan, Thailand, the United States, and Viet Nam.<br />
Normal market requirements for major grain exporters are defined as the average of domestic utilization plus exports in the three preceding seasons.<br />
Disappearance is defined as domestic utilization plus exports for any given season.<br />
Price indices: The wheat price index has been constructed based on the IGC wheat price index, rebased to 2002-2004=100; For maize, the U.S. maize No.2 Yellow<br />
(delivered U.S. Gulf ports) with base 2002-2004=100; For rice, the FAO Rice Price Index, 2002-2004=100, is based on 16 rice export quotations.<br />
*January-February average.<br />
No. 1 n March 2013 31
<strong>Crop</strong> <strong>Prospects</strong> and <strong>Food</strong> <strong>Situation</strong><br />
Table A2. World cereal stocks 1<br />
(million tonnes)<br />
32<br />
No. 1 n March 2013<br />
2008 2009 2010 2011<br />
2012<br />
estimate<br />
2013<br />
forecast<br />
TOTAL CEREALS 409.8 488.6 516.0 492.7 513.4 499.4<br />
Wheat 130.0 158.1 186.4 179.8 177.9 162.5<br />
held by:<br />
- main exporters 2 32.6 49.3 54.9 50.9 44.7 36.8<br />
- others 97.4 108.8 131.5 128.9 133.2 125.7<br />
Coarse grains 164.5 199.7 193.0 168.4 175.5 165.3<br />
held by:<br />
- main exporters 2 71.8 84.8 85.7 60.7 57.2 41.4<br />
- others 92.7 114.9 107.3 107.7 118.3 123.9<br />
Rice (milled basis) 115.3 130.8 136.7 144.5 160.0 171.6<br />
held by:<br />
- main exporters 2 28.6 36.1 33.4 34.0 41.8 46.3<br />
- others 86.7 94.7 103.3 110.5 118.2 125.3<br />
Developed countries 126.4 175.8 188.5 149.0 145.2 111.3<br />
Australia 5.5 6.2 6.8 8.8 8.4 5.1<br />
Canada 8.5 13.0 13.6 11.2 9.4 8.6<br />
European Union 30.3 46.9 44.0 31.1 31.1 24.4<br />
Japan 4.8 4.6 4.8 4.8 5.0 4.9<br />
Russian Federation 5.2 17.7 20.4 16.6 13.2 6.1<br />
South Africa 1.8 2.5 3.1 4.0 2.5 3.2<br />
Ukraine 4.9 8.0 6.7 4.5 8.4 5.6<br />
United States 54.3 65.9 75.9 57.3 49.3 38.7<br />
Developing countries 283.4 312.7 327.5 343.7 368.2 388.1<br />
Asia 235.3 256.2 270.8 280.6 304.6 330.9<br />
China 141.6 154.9 163.7 167.1 175.6 192.7<br />
India 31.7 37.5 33.7 37.0 44.9 47.9<br />
Indonesia 5.4 6.0 7.2 8.8 11.0 11.8<br />
Iran (Islamic Republic of ) 3.5 3.9 6.2 6.4 5.3 9.3<br />
Korea, Republic of 2.9 2.8 3.8 4.0 4.3 4.3<br />
Pakistan 3.2 3.6 4.2 2.2 3.0 2.6<br />
Philippines 3.2 4.2 4.9 4.1 3.6 3.3<br />
Syrian Arab Republic 4.0 2.9 3.6 2.4 1.7 1.1<br />
Turkey 5.2 4.1 4.2 4.2 5.2 4.2<br />
Africa 23.9 25.8 30.0 34.4 35.5 33.1<br />
Algeria 3.4 2.7 3.6 3.9 3.8 3.5<br />
Egypt 3.3 5.6 6.6 5.9 8.1 7.9<br />
Ethiopia 0.7 0.8 1.5 2.0 1.8 1.9<br />
Morocco 1.9 1.3 2.9 3.4 3.6 2.6<br />
Nigeria 1.2 1.3 1.2 1.4 1.3 1.0<br />
Tunisia 1.9 1.5 1.5 1.0 1.1 1.3<br />
Central America 5.9 5.9 4.3 5.6 3.8 4.4<br />
Mexico 3.7 4.1 2.5 3.7 2.0 2.6<br />
South America 17.9 24.5 22.1 22.8 23.9 19.3<br />
Argentina 7.3 3.7 2.2 5.4 5.5 2.9<br />
Brazil 3.5 12.5 11.6 8.1 8.1 7.2<br />
Note: Based on official and unofficial estimates. Totals computed from unrounded data,<br />
1 Stocks data are based on an aggregate of carryovers at the end of national crop years and do not represent world stock levels at any point in time.<br />
2 Major Wheat Exporters are Argentina, Australia, Canada, the EU, Kazakhstan, Russian Fed., Ukraine and the United States; Major Coarse Grain Exporters are<br />
Argentina, Australia, Brazil, Canada, the EU, Russian Fed., Ukraine and the United States; Major Rice Exporters are India, Pakistan, Thailand, the United States, and<br />
Viet Nam.
Table A3. Selected international prices of wheat and coarse grains<br />
(USD/tonne)<br />
Annual (July/June)<br />
US No.2 Hard<br />
Red Winter Ord.<br />
Prot. 1<br />
<strong>Crop</strong> <strong>Prospects</strong> and <strong>Food</strong> <strong>Situation</strong><br />
Wheat Maize Sorghum<br />
US Soft Red<br />
Winter No.2 2<br />
Argentina<br />
Trigo Pan 3<br />
US No.2<br />
Yellow 2 Argentina 3<br />
2003/04 161 149 154 115 109 118<br />
2004/05 154 138 123 97 90 99<br />
2005/06 175 138 138 104 101 108<br />
2006/07 212 176 188 150 145 155<br />
2007/08 361 311 318 200 192 206<br />
2008/09 270 201 234 188 180 170<br />
2009/10 209 185 224 160 168 165<br />
2010/11 316 289 311 254 260 248<br />
2011/12 300 256 264 281 269 264<br />
Monthly<br />
2011 - February 362 336 347 287 288 276<br />
2011 - March 334 302 348 291 288 279<br />
2011 - April 364 318 352 321 314 302<br />
2011 - May 362 309 351 309 303 277<br />
2011 - June 333 282 341 308 306 285<br />
2011 - July 307 264 310 304 300 279<br />
2011 - August 336 280 292 313 312 304<br />
2011 - September 329 270 300 300 294 285<br />
2011 - October 301 255 260 275 276 265<br />
2011 - November 299 256 239 275 271 275<br />
2011 - December 290 246 224 259 242 261<br />
2012 - January 298 258 249 275 258 271<br />
2012 - February 297 262 263 279 267 268<br />
2012 - March 294 259 260 280 270 266<br />
2012 - April 279 255 252 273 256 242<br />
2012 - May 279 252 251 269 246 219<br />
2012 - June 288 250 263 268 238 234<br />
2012 - July 352 318 314 330 285 293<br />
2012 - August 362 332 335 328 294 296<br />
2012 - September 371 341 336 323 278 286<br />
2012 - October 373 339 332 320 274 290<br />
2012 - November 373 346 345 324 294 289<br />
2012 - December 359 325 360 310 288 288<br />
2013 - January 348 311 362 303 294 287<br />
2013 - Febraury 329 297 358 303 283 288<br />
Sources: International Grains Council and USDA.<br />
1 Delivered United States f.o.b. Gulf.<br />
2 Delivered United States Gulf.<br />
3 Up River f.o.b.<br />
US No.2<br />
Yellow 2<br />
No. 1 n March 2013 33
<strong>Crop</strong> <strong>Prospects</strong> and <strong>Food</strong> <strong>Situation</strong><br />
Table A4a. Cereal import requirements of Low-Income <strong>Food</strong>-Deficit Countries 1 , 2012/13 or 2013 estimates<br />
(thousand tonnes)<br />
34<br />
Marketing<br />
year<br />
No. 1 n March 2013<br />
2011/12 or 2012 2012/13 or 2013<br />
Commercial<br />
purchases <strong>Food</strong> aid<br />
Actual imports Import position 2<br />
Total<br />
commercial<br />
and aid<br />
Total import<br />
requirements<br />
(excl. re-exports)<br />
Total<br />
commercial<br />
and aid<br />
<strong>Food</strong> aid<br />
allocated,<br />
committed or<br />
shipped<br />
Commercial<br />
purchases<br />
AFRICA 44 211.1 2 129.7 46 340.8 42 958.2 6 378.1 265.9 6 112.2<br />
North Africa 18 871.0 0.0 18 871.0 16 371.0 4 954.0 0.0 4 954.0<br />
Egypt July/June 18 871.0 0.0 18 871.0 16 371.0 4 954.0 0.0 4 954.0<br />
Eastern Africa 6 974.7 1 207.8 8 182.5 7 986.5 698.0 124.4 573.6<br />
Burundi Jan./Dec. 100.0 22.1 122.1 150.0 0.2 0.2 0.0<br />
Comoros Jan./Dec. 58.8 0.0 58.8 59.5 0.0 0.0 0.0<br />
Djibouti Jan./Dec. 90.5 2.0 92.5 96.0 2.1 2.1 0.0<br />
Eritrea Jan./Dec. 376.0 7.0 383.0 406.0 0.0 0.0 0.0<br />
Ethiopia Jan./Dec. 394.7 465.5 860.2 866.0 52.6 52.6 0.0<br />
Kenya Oct./Sept. 2 142.6 195.0 2 337.6 2 285.0 73.9 7.1 66.8<br />
Rwanda Jan./Dec. 64.0 13.0 77.0 121.0 0.0 0.0 0.0<br />
Somalia Aug./July 245.0 183.0 428.0 480.0 3.9 3.9 0.0<br />
Sudan 3 Nov./Oct. 2 300.1 296.5 2 596.6 2 170.0 240.3 54.7 185.6<br />
Uganda Jan./Dec. 445.1 6.1 451.2 450.0 0.0 0.0 0.0<br />
United Rep. of Tanzania June/May 757.9 17.6 775.5 903.0 325.0 3.8 321.2<br />
Southern Africa 2 274.0 233.8 2 507.8 2 346.4 606.3 112.0 494.3<br />
Lesotho April/March 244.0 5.0 249.0 263.0 171.8 0.0 171.8<br />
Madagascar April/March 315.0 25.0 340.0 443.0 35.4 20.4 15.0<br />
Malawi April/March 135.1 29.0 164.1 115.0 22.1 22.1 0.0<br />
Mozambique April/March 950.9 118.8 1 069.7 891.4 354.4 64.2 290.2<br />
Zambia May/April 46.0 1.0 47.0 29.0 2.9 0.0 2.9<br />
Zimbabwe April/March 583.0 55.0 638.0 605.0 19.7 5.3 14.4<br />
Western Africa 14 202.5 515.9 14 718.4 14 145.3 113.4 23.1 90.3<br />
Coastal Countries 10 906.1 120.0 11 026.1 10 707.5 2.6 2.6 0.0<br />
Benin Jan./Dec. 385.4 11.6 397.0 447.0 0.0 0.0 0.0<br />
Côte d'Ivoire Jan./Dec. 1 733.9 14.6 1 748.5 1 775.0 1.4 1.4 0.0<br />
Ghana Jan./Dec. 989.0 31.0 1 020.0 945.0 0.5 0.5 0.0<br />
Guinea Jan./Dec. 515.2 21.8 537.0 477.0 0.0 0.0 0.0<br />
Liberia Jan./Dec. 350.6 27.7 378.3 384.0 0.0 0.0 0.0<br />
Nigeria Jan./Dec. 6 587.0 0.0 6 587.0 6 320.0 0.0 0.0 0.0<br />
Sierra Leone Jan./Dec. 120.0 12.8 132.8 114.0 0.7 0.7 0.0<br />
Togo Jan./Dec. 225.0 0.5 225.5 245.5 0.0 0.0 0.0<br />
Sahelian Countries 3 296.4 395.9 3 692.3 3 437.8 110.8 20.5 90.3<br />
Burkina Faso Nov./Oct. 354.4 30.1 384.5 390.0 8.5 4.4 4.1<br />
Chad Nov./Oct. 108.9 75.0 183.9 177.8 21.3 5.9 15.4<br />
Gambia Nov./Oct. 169.5 25.5 195.0 190.5 0.4 0.4 0.0<br />
Guinea-Bissau Nov./Oct. 147.5 6.8 154.3 154.3 0.0 0.0 0.0<br />
Mali Nov./Oct. 337.7 38.8 376.5 221.2 14.8 2.5 12.3<br />
Mauritania Nov./Oct. 401.5 39.6 441.1 469.0 48.5 0.0 48.5<br />
Niger Nov./Oct. 353.4 127.3 480.7 460.0 17.2 7.3 9.9<br />
Senegal Nov./Oct. 1 423.5 52.8 1 476.3 1 375.0 0.1 0.0 0.1<br />
Central Africa 1 888.9 172.2 2 061.1 2 109.0 6.4 6.4 0.0<br />
Cameroon Jan./Dec. 920.6 3.5 924.1 932.0 1.7 1.7 0.0<br />
Cent.Afr.Rep. Jan./Dec. 53.0 10.0 63.0 63.0 3.5 3.5 0.0<br />
Congo Jan./Dec. 323.0 4.0 327.0 347.0 0.9 0.9 0.0<br />
Dem.Rep.of the Congo Jan./Dec. 575.3 154.7 730.0 750.0 0.3 0.3 0.0<br />
Sao Tome and Principe Jan./Dec. 17.0 0.0 17.0 17.0 0.0 0.0 0.0
<strong>Crop</strong> <strong>Prospects</strong> and <strong>Food</strong> <strong>Situation</strong><br />
Table A4b. Cereal import requirements of Low-Income <strong>Food</strong>-Deficit Countries 1 , 2012/13 or 2013 estimates<br />
(thousand tonnes)<br />
Marketing<br />
year<br />
2011/12 or 2012 2012/13 or 2013<br />
Commercial<br />
purchases <strong>Food</strong> aid<br />
Actual imports Import position 2<br />
Total<br />
commercial<br />
and aid<br />
Total import<br />
requirements<br />
(excl. re-exports)<br />
Total<br />
commercial<br />
and aid<br />
<strong>Food</strong> aid<br />
allocated,<br />
committed or<br />
shipped<br />
Commercial<br />
purchases<br />
ASIA 36 868.4 1 114.0 37 982.4 33 592.2 9 354.9 110.8 9 244.1<br />
Cis in Asia 4 740.3 0.0 4 740.3 3 587.3 1 838.9 0.0 1 838.9<br />
Kyrgyzstan July/June 648.3 0.0 648.3 515.3 264.7 0.0 264.7<br />
Tajikistan July/June 1 168.0 0.0 1 168.0 1 208.0 643.9 0.0 643.9<br />
Uzbekistan July/June 2 924.0 0.0 2 924.0 1 864.0 930.3 0.0 930.3<br />
Far East 21 385.6 836.1 22 221.7 19 892.9 6 520.0 75.2 6 444.8<br />
Bangladesh July/June 2 041.6 161.0 2 202.6 3 350.0 230.5 64.2 166.3<br />
Bhutan July/June 64.9 0.0 64.9 74.9 0.0 0.0 0.0<br />
Cambodia Jan./Dec. 37.2 4.2 41.4 37.0 0.0 0.0 0.0<br />
D.P.R. of Korea Nov./Oct. 357.4 602.3 959.7 657.0 6.8 6.8 0.0<br />
India April/March 106.2 0.1 106.3 108.3 6.3 0.0 6.3<br />
Indonesia April/March 11 758.1 3.1 11 761.2 9 504.1 4 730.6 0.0 4 730.6<br />
Lao, P.D.R. Jan./Dec. 40.7 4.2 44.9 44.9 0.0 0.0 0.0<br />
Mongolia Oct./Sept. 136.0 0.0 136.0 116.8 1.0 0.0 1.0<br />
Nepal July/June 227.3 24.5 251.8 386.8 0.0 0.0 0.0<br />
Philippines July/June 5 260.7 6.7 5 267.4 4 437.0 1 544.8 4.2 1 540.6<br />
Sri Lanka Jan./Dec. 1 355.5 30.0 1 385.5 1 176.1 0.0 0.0 0.0<br />
Near East 10 742.5 277.9 11 020.4 10 112.0 996.0 35.6 960.4<br />
Afghanistan July/June 2 037.5 212.9 2 250.4 1 252.0 187.6 35.6 152.0<br />
Iraq July/June 5 295.0 15.0 5 310.0 5 360.0 808.4 0.0 808.4<br />
Yemen Jan./Dec. 3 410.0 50.0 3 460.0 3 500.0 0.0 0.0 0.0<br />
CENTRAL AMERICA 1 615.5 145.0 1 760.5 1 735.1 265.5 5.3 260.2<br />
Haiti July/June 529.4 126.1 655.5 660.1 9.8 4.8 5.0<br />
Honduras July/June 759.1 15.9 775.0 755.0 180.3 0.3 180.0<br />
Nicaragua July/June 327.0 3.0 330.0 320.0 75.4 0.2 75.2<br />
OCEANIA 441.9 0.0 441.9 441.9 0.0 0.0 0.0<br />
Kiribati Jan./Dec. 8.7 0.0 8.7 8.7 0.0 0.0 0.0<br />
Papua New Guinea Jan./Dec. 390.2 0.0 390.2 390.2 0.0 0.0 0.0<br />
Solomon Islands Jan./Dec. 43.0 0.0 43.0 43.0 0.0 0.0 0.0<br />
TOTAL 83 136.9 3 388.7 86 525.6 78 727.4 15 998.5 382.0 15 616.5<br />
Source: FAO<br />
1 The Low-Income <strong>Food</strong>-Deficit (LIFDC) group of countries includes net food deficit countries with annual per caput income below the level used by the World Bank to<br />
determine eligibility for IDA assistance (i.e. USD 1 915 in 2010); for full details see http://www.fao.org/countryprofiles/lifdc.asp.<br />
2 Estimates based on information as of early Febraury 2013.<br />
3 Including South Sudan.<br />
No. 1 n March 2013 35
GIEWS<br />
The Global Information and Early Warning System on <strong>Food</strong> and Agriculture<br />
continuously monitors crop prospects and food security situation at global, regional, national and sub-national levels and warns of impending<br />
food difficulties and emergencies. Established in the wake of the world food crisis of the early 1970s, GIEWS maintains a unique database<br />
on all aspects of food supply and demand for every country of the world. The System regularly provides policy makers and the international<br />
community with up-to-date information so that timely interventions can be planned and suffering avoided.<br />
<strong>Crop</strong> <strong>Prospects</strong> and <strong>Food</strong> <strong>Situation</strong> is published by the Trade and Markets Division of FAO under the Global<br />
Information and Early Warning System (GIEWS). It is published four times a year and focuses on developments<br />
affecting the food situation of developing countries and the Low-Income <strong>Food</strong>-Deficit Countries (LIFDCs) in<br />
particular. The report provides a review of the food situation by geographic region, a section dedicated to the<br />
LIFDCs and a list of countries requiring external assistance for food. It also includes a global cereal supply and<br />
demand overview to complement the biannual analysis in the <strong>Food</strong> Outlook publication. <strong>Crop</strong> <strong>Prospects</strong> and<br />
<strong>Food</strong> <strong>Situation</strong> is available in English, French and Spanish in electronic format.<br />
<strong>Crop</strong> <strong>Prospects</strong> and <strong>Food</strong> <strong>Situation</strong> and other GIEWS reports are available on the internet as part of the FAO<br />
world wide web (http:/www.fao.org/) at the following URL address: http:/www.fao.org/giews/. In addition,<br />
GIEWS Special Reports and Special Alerts, when published, can be received by e-mail through automatic mailing<br />
lislts: subscription information is available at http:/www.fao.org/giews/english/listserv.htm.<br />
This report is based on information available as of mid-February 2013.<br />
Enquiries may be directed to:<br />
Global Information and Early Warning System on <strong>Food</strong> and Agriculture (GIEWS)<br />
Trade and Markets Division (EST)<br />
<strong>Food</strong> and Agriculture Organization of the United Nations<br />
Viale delle Terme di Caracalla<br />
00153 Rome - Italy<br />
Direct Facsimile: 0039-06-5705-4495,<br />
E-mail: GIEWS1@fao.org<br />
Disclaimer<br />
This report is prepared by the FAO’s Global nformation and Early<br />
Warning System, with information from official and unofficial sources.<br />
None of the information in this report should be regarded as statements<br />
of governmental views.<br />
Furthermore, the designations employed and the presentation of<br />
material in this report do not imply the expression of any opinion<br />
whatsoever on the part of the <strong>Food</strong> and Agriculture Organization of the<br />
United Nations concerning the legal status of any country, territory, city<br />
or area or of its authorities, or concerning the delimitation of its frontiers<br />
or boundaries.<br />
© FAO 2013<br />
FAO encourages the use, reproduction and dissemination of material<br />
in this information product. Except where otherwise indicated, material<br />
may be copied, downloaded and printed for private study, research and<br />
teaching purposes, or for use in non-commercial products or services,<br />
provided that appropriate acknowledgement of FAO as the source and<br />
copyright holder is given and that FAO’s endorsement of users’ views,<br />
products or services is not implied in any way.<br />
All requests for translation and adaptation rights, and for resale and<br />
other commercial use rights should be made via www.fao.org/contactus/licence-request<br />
or addressed to copyright@fao.org.